methotrexate cytotoxicity in cultured human leukemic...
TRANSCRIPT
[CANCER RESEARCH 41, 1549-1558, April1981]0008-5472/81/0041-1549S02.00
Methotrexate Cytotoxicity in Cultured Human Leukemic Cells Studied by
Flow Cytometry
Ian W. Taylor1 and Martin H. N. Tattersall
Ludwig Institute for Cancer Research, Blackburn Building, University of Sydney, New South Wales, 2006 Australia
ABSTRACT
Methotrexate (MIX) (2 x 1(T8 M) inhibited DMA synthesis in
CCRF-CEM cells, causing cells to accumulate in early S phasewhile cellular RNA content and cell size continued to increase.Two-parameter flow cytometric analysis of DMA and RNA
showed these cells to be unbalanced with excessive RNArelative to DNA content. Fifty % of cells remained viable aftera 96-hr exposure to 2 X 10~8 M MTX. In contrast, 10"4 M MIX
inhibited cell cycle progression of cells in both G, and S phasesand also prevented the development of unbalanced growth. Inthis instance, cell viability was reduced to 10% after 96 hr ofdrug exposure. The relative contribution of inhibition of thymi-
dylate and purine biosynthesis to MTX cytotoxicity was investigated by addition of exogenous thymidine (10~5 M) or hypo-xanthine (10"" M). Thymidine reduced the cytotoxicity and
inhibition of DNA synthesis caused by both doses of MTX andprevented classical unbalanced growth with 2 x 10~8 M MTX;treatment with 10~4 M MTX resulted in a form of unbalanced
growth where cells had a relative excess of DNA comparedwith RNA content. The addition of hypoxanthine enhanced theclassical unbalanced growth pattern seen with 2 x 10~8 M
MTX but was accompanied by a partial reduction of both theMTX-induced cytotoxicity and the inhibition of DNA synthesis
(to an extent similar to that seen with exogenous thymidine).Potentiation of cell killing was observed with the addition ofhypoxanthine to cells treated with 10~4 M MTX. Complete
rescue from MTX cytotoxicity at both concentrations was foundonly when both thymidine and hypoxanthine were present.
These findings suggest that MTX cytotoxicity is associatedwith inhibition of DNA synthesis resulting from the disturbanceof both thymidylate and purine biosynthesis.
INTRODUCTION
MTX2 is a potent inhibitor of mammalian dihydrofolate reduc-
tase (18, 19). The depletion of cellular pools of reduced folatecofactors following exposure to MTX disturbs thymidylate,purine, and amino acid metabolism. Reduction in cellular levelsof 5,10-methylenetetrahydrofolate inhibits the methylation of
dUMP by thymidylate synthetase, thus blocking de novo thymidylate synthesis (6). Exposure of cells to MTX expands thedUMP pool and lowers markedly the dTTP pool unless exogenous dThd is added to the culture medium (26, 27), and cellshave an active thymidine salvage pathway (2). Reduced folatecofactors are also utilized in the de novo synthesis of purines;although this pathway does not oxidize folate, disturbances ofpurine synthesis have been reported in cells exposed to MTX
' To whom requests for reprints should be addressed.2 The abbreviations used are: MTX. methotrexate; dThd, thymidine; HX, hy
poxanthine.Received August 12, 1980; accepted January 12, 1981.
(8). Cells exposed to MTX may thus be perturbed by inhibitionof de novo thymidylate biosynthesis, of de novo purine biosynthesis, or of both, depending upon the cell type and cultureconditions. In the first case, cells would be expected to becomeunbalanced due to selective inhibition of DNA synthesis withcontinuation of RNA and protein synthesis; in the latter case,inhibition of both DNA and RNA synthesis might occur.
While flow cytometry has been widely used as a means ofinvestigating the cell cycle perturbations caused by a variety ofchemotherapeutic agents (30, 31, 35), most of these studieshave been limited to single-parameter analysis of cellular DNA
content, and little attention has been given to drug effects onother cell cycle-related parameters such as changes in RNA
content and cell size. Because MTX may affect both DNA andRNA synthesis, we have studied cultured human leukemic cellsexposed to MTX using flow cytometric single-parameter analysis of DNA, RNA, and cell size and correlated 2-parameter
analysis of DNA and RNA. The effects of exogenous dThd andHX have also been studied to identify the relationship betweenMTX cytotoxicity and disturbance of thymidylate and purinebiosynthesis.
MATERIALS AND METHODS
A long-term culture of human leukemic T-cells (CCRF-CEM)
was used in this study (5). These cells grow as a suspensionculture in Roswell Park Memorial Institute Medium 1640 supplemented with L-glutamine and 10% fetal calf serum (completemedium) with a cell-doubling time of about 24 hr. In all experiments to be described, 75-sq cm tissue culture flasks (CorningGlass Co., Corning, N. Y.) were inoculated with 90 to 150 mlof cell suspension at 10s cells/ml. The cultures were then
allowed to grow undisturbed for 24 hr before addition of drugs.All treatments were carried out on exponentially growing cellcultures. Cell counts were made by phase-contrast microscopy. This technique was also used to discriminate betweenlive (phase-positive) and dead (phase-negative) cells.
Drug Treatment
dThd and HX were obtained from Calbiochem (Australia)Pty., Sydney, Australia. MTX was a gift from Dr A. Hellestrand,Cyanamid (Australia) Pty., Sydney, Australia. Razoxane was agift from I.C.I. (Australia) Pty., Sydney, Australia.
Stock solutions of dThd and MTX were prepared at 30 timesfinal concentration in Roswell Park Memorial Institute Medium1640 without fetal calf serum. HX stock solutions were madeby dissolving the drug in equimolar NaOH (10 rriM), heating at60°for 30 min, and then diluting the solution to 30 times the
required final concentration with medium. Razoxane was madeup at 50 times the final required concentration in 0.4 M HCI. Allstock solutions were sterilized by Millipore filtration and kept
APRIL 1981 1549
on May 27, 2018. © 1981 American Association for Cancer Research. cancerres.aacrjournals.org Downloaded from
/. W. Taylor and M. H. N. Tattersall
frozen at -20° until required.
In all experiments, the drugs were added as a small volumedirectly to cells in suspension 24 hr after culture initiation.Each drug was administered as a single dose and remained inthe culture for the duration of the experiment. When drugcombinations were tested, the drugs were added simultaneously. An appropriate volume of the drug vehicle was added tocontrol flasks.
Flow Cytometry
DMA Analysis. Cellular DNA content was measured using anICP22 flow cytometer (Ortho Instruments, Westwood, Mass.).The cell-staining procedure has been described previously(29). Briefly, 106 cells in complete medium were made perme
able to stain by the addition of 1.5 volumes of ice-cold 0.1%(v/v)Triton X-100 containing 0.1 M HCIandO.ISw NaCI. After1 min, the cells were centrifuged, and the cell pellet resus-pended in an ethidium bromide-mithramycin staining solution
containing ethidium bromide (5 /ig/ml), mithramycin (12.5 /ig/ml), and 7.5 rriM MgCI2 in 0.1 M Tris-HCI buffer, pH 7.4.
Samples of the stained cells were then excited at 360 to 460nm, and the resulting fluorescence was measured at wavelengths >550 nm. Approximately 30,000 cells were analyzedfor each DNA content histogram. Calculations of percentagesof cells in various phases of the cell cycle and of coefficient ofvariation of the G, DNA peak were made using a curve-fittingmethod of analysis (17, 29). Unfixed chicken RBC (105) were
added to each sample before staining as an internal standardwhich would account for variations in machine performanceand staining procedures (29).
Dual-Parameter Analysis of DNA and RNA. Simultaneousmeasurement of cellular DNA and RNA content was obtainedfrom cells stained with acridine orange by the 2-step proceduredescribed by Tráganos et al. (32). Cells (106/ml) were made
permeable by the addition of a Triton X-100 solution containing
acridine orange (10 ¿ig/ml), 5 mM EDTA, and 0.15 M NaCI in0.1 M citrate-phosphate buffer, pH 5.O. Acridine orange intercalates with double-stranded nucleic acids and dye stacks onsingle-stranded nucleic acids which when excited with bluelight will cause green and red fluorescence, respectively. Experiments with cells treated with RNase or DNase (both at 1mg/ml for 30 min) showed that approximately 75% of the redfluorescence and 85% of the green fluorescence could beattributed to RNA and DNA, respectively. The staining conditions used are therefore such that the green fluorescenceprovides a measure of cellular DNA content and the red fluorescence measures cellular RNA content.
The green and red fluorescences from acridine orange-
stained cells were measured simultaneously with the ICP 22flow cytometer in coincident mode using an excitation wavelength between 440 and 490 nm in conjunction with a 510-nm
dichroic mirror. Green fluorescence was measured between520 and 550 nm, and red fluorescence was measured atwavelengths greater than 620 nm. A 580-nm dichroic mirror
was used in the fluorescent light path to separate green andred fluorescence. The correlated data were then plotted as acontour plot.
Single-parameter analysis of RNA was obtained in a similarfashion. Mean values of the RNA histograms were obtained aspreviously described (17).
Light Scatter Analysis. Measurements of narrow-angle laserlight scatter (between 0.5° and 13°)were made using a fluo
rescence-activated cell sorter (FACS III; Becton Dickinson,Mountain View, Calif.). Narrow-angle light scatter of viable cellsis closely correlated with cross-sectional cell area, and, because mammalian cells in suspension usually adopt a sphericalshape, therefore reflects cell volume (33). In order to circumvent problems associated with cell debris and dead cells (whichhave low light-scattering properties), all cell samples were
stained before analysis with fluorescein diacetate [50 jul offluorescein diacetate (50 /tg/ml) to 106 cells]. Fluorescein
diacetate, itself nonfluorescent, is broken down by nonspecificesterase activity in cells to form fluorescein which when excitedat 488 nm emits fluorescent light between 520 and 540 nm.Because fluorescein is retained only in viable cells with anintact cell membrane (22), the light scattering of debris anddead cells which have little associated fluorescence can beelectronically gated out from the analysis. Values representingthe histogram mean were then calculated from histograms ofcellular light scattering as for the RNA histograms aboveProportions of live versus dead cells were on occasions estimated by this technique and found to be in good agreementwith the results obtained by phase-contrast microscopy. For
reasons of clarity, however, all estimates of viability referred toin the text were obtained by phase-contrast analysis.
RESULTS
In all experiments to be described, the addition of either 10"5M dThd or 10~" M HX as single agents to CCRF-CEM cells had
no discernible effect on any of the measured parameters. Forclarity, these results have been omitted from the data presented. Values shown for cell numbers, RNA content, and cellsize represent the mean of 4 individual experiments unless soindicated. DNA content histograms and 2-parameter contour
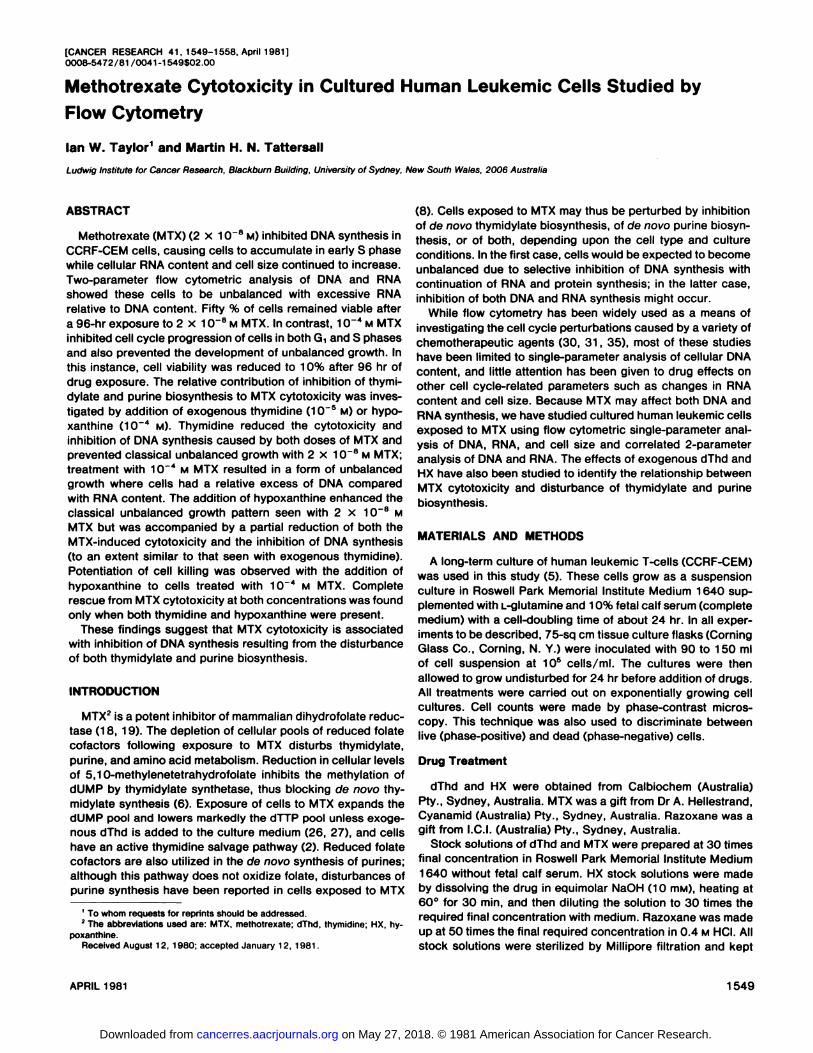
plots are from one experiment and were representative ofresults obtained in other experiments. An example of the DNAcontent analysis of control cell cultures is shown in Chart 1. Nosignificant change in the proportion of cells in G, (38%), S
% 61 -38.4X S -48.8XG2+M-I2.8C.V. -2.SX
CRBCî'
sa ta« isaCHANNEL NUMBER
288
Chart 1. DNA distribution of untreated CCRF-CEM cells. Channel number.relative fluorescence intensity which is directly proportional to DNA content. Thefirst peak corresponds to chicken RBC (COSO which acts as an internal biological standard. The largest population represents diploid CCRF-CEM cells (G,).Cells with double the fluorescence of diploid cells are in G. or mitosis (G, + M).Cells in S phase contain amounts of DNA intermediate between Gìand G2 -t- M.
No change in the relative proportions of cells in each phase of the cell cycle wasobserved for growth periods up to 96 hr (2 X 10⁵ to 2 X 10⁶ cells/ml). The
coefficient of variation (C.V.) of the G, DNA peak was generally between 2 and4% for all samples analyzed.
1550 CANCER RESEARCH VOL. 41
on May 27, 2018. © 1981 American Association for Cancer Research. cancerres.aacrjournals.org Downloaded from

MTX Cytotoxicity
(49%), or G2 + M (13%) was found during a 96-hr period ofcell growth. The ratio of the CCRF-CEM Gìpeak position
(Channel 50) to that of the chicken RBC (Channel 15) alsoremained constant with time.
Two dose levels of MTX were examined: 2 x 1CT8 M (low-
dose), which prevented any increase in viable cell numbersover a 96-hr period; and 10~" M (high-dose), which resulted in
a high level of cytotoxicity within 72 hr. The latter dose levelapproximates that which might be obtained clinically with high-dos MTX therapy.
Low-Dose MTX. 2 x 10~8 M MTX resulted in maintainence
of a constant level of viable cells for a period of 96 hr (Chart 2).However, during that time, the proportion of dead cells in theculture increased to almost 50% (Table 1), indicating that somecell division was taking place. Analysis of the DNA content(Chart 3) of these cultures showed an initial accumulation of
*>6
24 48 72DRUG EXPOSURE TIME Chr)
96
Chart 2. Modification of growth-inhibitory effects of 2 x 10~8 M MTX inCCRF-CEM cells by exogenous nucleosides. O, untreated control; •,2 x 10~8M MTX; A. MTX plus 10'4 M HX; »,MTX plus 10"5 dThd; •,MTX plus dThd plus
HX; A, dThd plus HX. Bars, ±1 S.D. from the mean obtained from 4 individualexperiments. Counts are of live cells only.
Table 1
Percentage of dead cells in treated cell populationsPhase-contrast microscopy was used to discriminate between live (phase-
positive) and dead (phase-negative) cells.
% of deadcellsTreatmentControl2
XHH
H10-H
HH10~8M
MTX•
10~4M HX- 10~5M dThd +10-4MHX4
M MTX- 10-5MdThd- 10-4wHX- 10~5MdThd +
10'4MHX24
hr2(0.5)a15(3.2)
7(1.4)5 (0.9)4(0.8)16(2.5)
16(2.9)35(8.2)
3 (0.5)48
hr3
(0.8)15(3.7)
15(0.5)6(1.5)
5(1.8)57
(2.9)36 (6.7)86(4.1)
8 (2.2)72
hr5
(0.5)33(2.5)
17 (1.6)12(1.3)7(2.1)90
(4.8)49(5.7)
10067 (9.5)
7 (0.8)"96
hr9
(0.5)46
(2.9)21 (3.3)20 (5.9)
10(1.5)100
63 (3.0)10091 (2.5)10(1.1)"
Numbers in parentheses, 1 S.D. from the mean obtained from 4 individualexperiments.
"Cells treated with MTX plus dThd plus HX, with additional 10~5 M dThd
added at 48 hr.
24HR .
X 61 -3.SX S -84 7XG2»M-II 8C.V. "3.SX
X Gl -22.3X S -63 6XG2*M-14 IC.V. -2 IX
48HR »
X Gl -3.3X S -91 2XG2»fl-54C.V. -3.2X
X Gl -27.7X S -63 2XG2»H-82c.v. »3.ax
72HR -i.
¿L¿
X Gl -ie.2X S -78.9XG2»M-4.9C.V. "2.9X
X Gì-31.aX S -SS 8XS2»M-I3.IC.V. -2.BX
96HR
X Gl -28 IX S -SS 6XG2»M-I6 3C V. -3.2X
X Gl -33 9X S -S3 2XG2»M=I2 9C.V. -2 6X
se teaChonn«I
MTX
seCha
MTX«-dThö»HX
Chart 3. Changes in the DNA distribution of CCRF-CEM cells with time ofexposure to 2 x 1CT8 M MTX or 2 x 1CT8 M MTX plus 10 5 M dThd plus 10~4
M HX. Channel number, relative fluorescence intensity (DNA content). Ordinate,number of cells. The peak between Channels 10 and 20 represents chickenRBC. Small numbers of tetraploid cells are present in cultures of CCRF-CEMcells as shown by those cells with greater than twice the GìDNA content. Thesebecame particularly apparent with drug treatments which inhibit normal cell cycleprogression, e.g., with MTX treatment between 24 and 72 hr. The DNA distribution of untreated CCRF-CEM cells is shown in Chart 1. e.V.. coefficient ofvariation.
cells in early S phase at 24 hr (as determined by the ratio ofthe internal standard peak position to that of the experimentalsample, 3.8 compared to 3.3 for controls), but later (between24 and 96 hr) a cohort of cells could be seen to progressthrough the cell cycle.
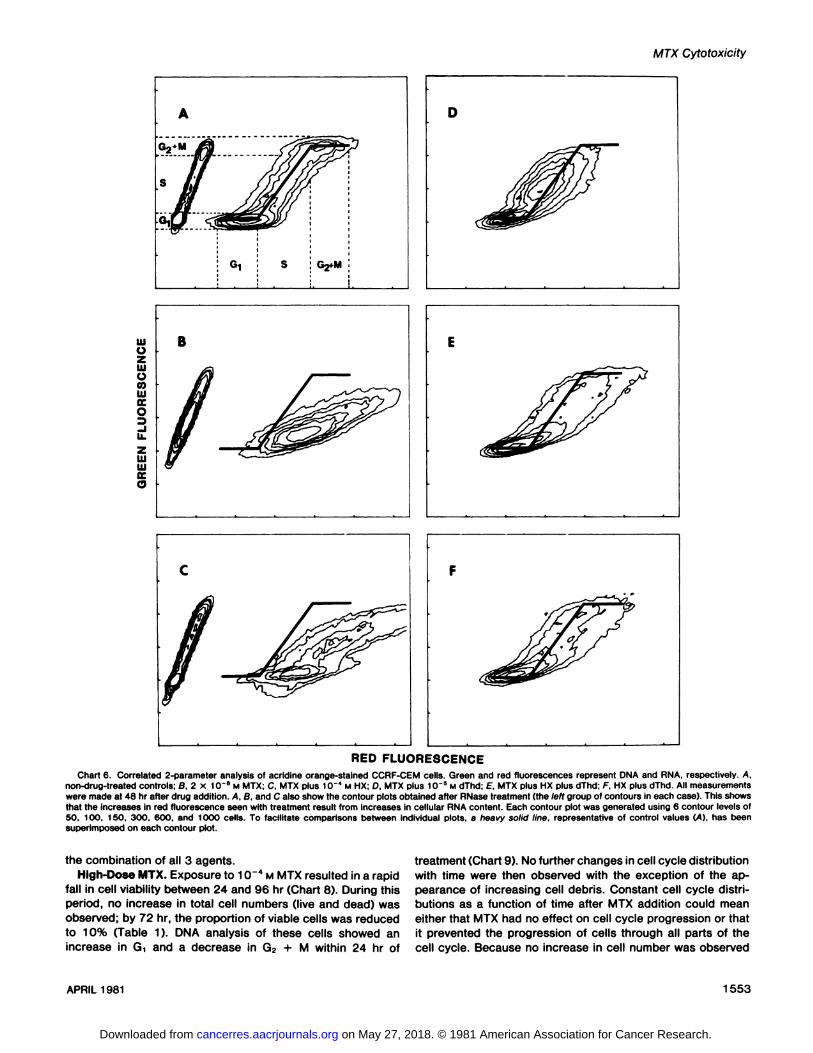
With MTX exposure times up to 48 hr, the cellular RNAcontent and cell size increased compared to control values(Chart 5), and these increases, in conjunction with impairedDNA synthesis, indicate unbalanced cell growth. Unbalancedcell growth is readily demonstrated by the 2-parameter analysisof DNA and RNA contents at 48 hr where the cells can be seento have an excess of RNA in relation to their DNA content whencompared with controls (Chart 6). Between 48 and 96 hr, RNAlevels return to normal, but cell size is still significantly increased even after 96 hr.
APRIL 1981 1551
on May 27, 2018. © 1981 American Association for Cancer Research. cancerres.aacrjournals.org Downloaded from
/. W. Taylor and M. H. N. Tattersall
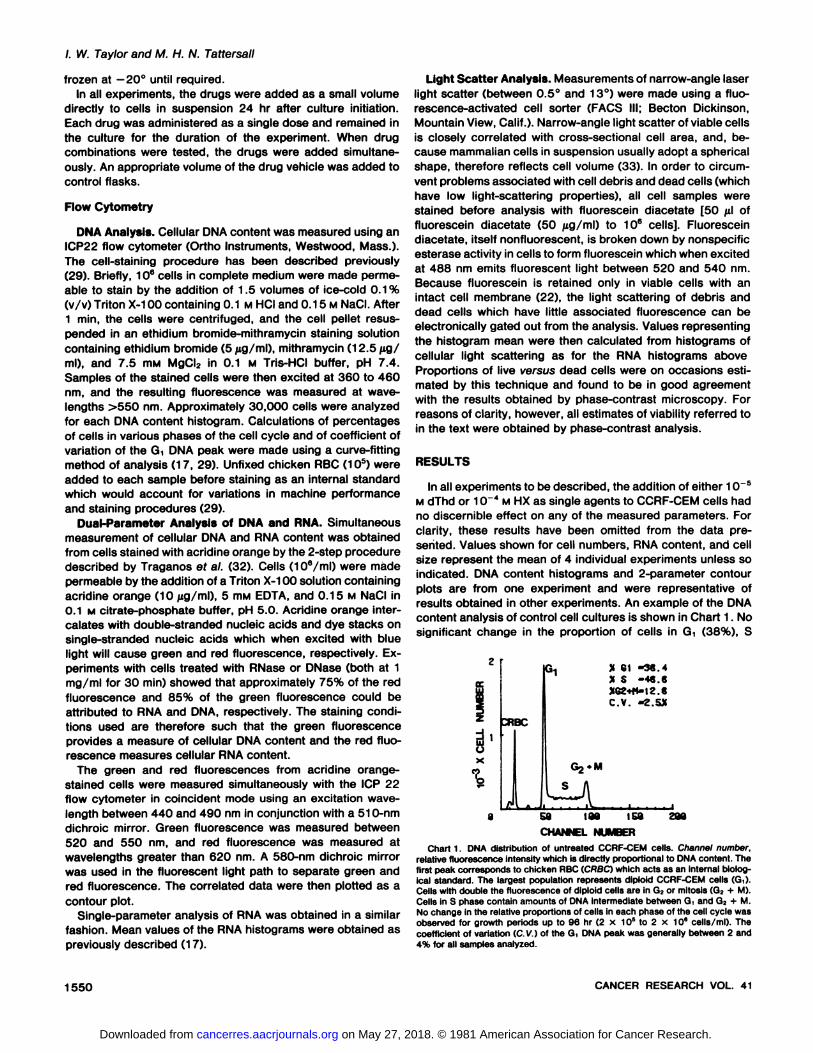
Addition of either dThd or HX to the low-dose-MTX-treated
cells had similar effects on subsequent cell growth. Both agentsallowed viable cell numbers to increase slowly in the presenceof MIX (Chart 2) and reduced the degree of cytotoxicity (Table1). Analysis of the DMA content of these cells suggests thatboth dThd and HX reduce the MTX-induced accumulation of
cells in early S phase, but not completely, as shown by theperturbed DNA histograms between 24 and 96 hr (Chart 4).When, however, the effects of dThd or HX were measured interms of RNA content or cell size, a marked difference betweentreatments was observed. While the addition of dThd largelyprevented the MTX-induced increases in RNA content and cell
size, the addition of HX exacerbated the effects previouslydescribed for MTX alone (Chart 5). Two-parameter analysis of
DNA and RNA show that, while HX increases the degree ofunbalanced cell growth over that for MTX alone, the addition
24HR •;
48HR 7,
a
2
72HR ìl,
> SI -14.ZX S -81 8XG2»K-4.8C.V. -3.8X
X Gl -21 .7us -78.7XG2»««7.SC.V. -2.8)1
96HR ï.
X Gì-17.5X S -78 3XG2»M«4.lC.V. -2.9Õ
se ieeChann«!
X SI-8.6xs -es 3
XG2»n-6aC.V.-1.8*Sa
188 158288ilX
G1 -28.4X S -73 3XG2»M-8.2C.V. -3SXY/VAsa
ige isa2aeLX
Gl -26.3X S -64 3XG2*fl-9 . 4C.V -2SXW58
lea isa2aaIJX
Gì-26.5X S -69 4X82»M=4 1C.V -33XL^i50
100 1S0Z9QChonn«
INumb«rMTX-tdThd
MTX+HX
Chart 4. Changes in théDNA distribution of CCRF-CEM cells with time ofexposure to 2 x 10 " M MTX plus 10" M HX or 2 x 10"8M MTX plus 10~5 M
dThd. Channel number, relative fluorescence intensity (DNA content). Ordinate,number of cells. The peak between Channels 10 and 20 represents chickenRBC. Small numbers of tetraploid cells are present in cultures of CCRF-CEMcells. These become particularly apparent with drug treatments which inhibitnormal cell cycle progression. The DNA distribution of untreated CCRF-CEMcells is shown in Chart 1. c.v., coefficient of variation.
UJ20
15
1-0
0 24 48 72 36DRUG EXPOSURETIME CM
Charts. Modification of the effects of 2 x 10~8 M MTX on cellular RNA
content and cell size in CCRF-CEM cells by exogenous nucleosides. Measurements of RNA content and cell size were obtained as described in the text andhave been expressed relative to these values obtained for non-drug-treatedcontrols. •,2 x 10~8 M MTX; A. MTX plus 10" M HX; *, MTX plus 10~5 M
dThd; ». MTX plus HX plus dThd; A, dThd plus HX. Bars, ±1 S.D. from themean obtained from 4 individual experiments.
of dThd completely prevents the appearance of this effect(Chart 6).
At first, it appeared that the addition of both dThd and HX toMTX treatment did not result in complete rescue of these cells.A delay in cell growth was observed between 24 and 48 hr(Chart 2) with minor perturbations in DNA content (Chart 3),RNA content, and cell size (Chart 5). The 2-parameter analysis
also suggested some unabalanced growth at this time (Chart6). However, it was found that these changes in the measuredparameters could be directly attributed to the effects of thecombination of dThd and HX, although no such effects wereobserved with either agent alone (Chart 6). The combination ofdThd and HX would therefore appear to completely reverse theeffects of low-dose MTX on CCRF-CEM cells.
In the absence of a suitable cloning assay for CCRF-CEMcells, long-term cell survival was assessed by the ability of cellsto regrow in drug-free medium. Cells which had been exposedto each treatment for 96 hr were washed three times andresuspended in drug-free medium at a concentration of 2 x10⁵ viable cells/ml. Subsequent growth curves (Chart 7)showed that cells which had been exposed previously to low-
dose MTX grew exponentially at a rate similar to that seen forcontrol cultures after an initial lag period of 24 hr. Because thislag period could be due either to further cell death or to a delayin the return to exponential growth, differential counts of liveversus dead cells were made 24 hr after drug-treated cells
were resuspended in fresh medium. No significant increase inthe number of dead cells over those present at culture initiationwas found. This suggests that there is a delay in the return ofMTX-treated cells to exponential growth and that most of the
cells surviving 96 hr of MTX treatment are capable of furthersustained growth. The lag period was reduced for cells previously exposed to MTX and HX or to MTX and dThd, and itdisappeared completely for those cells previously treated with
1552 CANCER RESEARCH VOL. 41
on May 27, 2018. © 1981 American Association for Cancer Research. cancerres.aacrjournals.org Downloaded from
MTX Cytotoxicity
uiUIIIomtuocO
uiuioco
B
RED FLUORESCENCEChart 6. Correlated 2-parameter analysis of acridine orange-stained CCRF-CEM cells. Green and red fluorescences represent DNA and RNA, respectively. A,
non-drug-treated controls; B, 2 X 10 ' M MTX; C, MTX plus 10"" M HX; D, MTX plus 10 5 M dThd; E. MTX plus HX plus dThd; F. HX plus dThd. All measurements
were made at 48 hr after drug addition. A, B, and C also show the contour plots obtained after RNase treatment (the left group of contours in each case). This showsthat the increases in red fluorescence seen with treatment result from increases in cellular RNA content. Each contour plot was generated using 6 contour levels of50. 100. 150, 300. 600, and 1000 cells. To facilitate comparisons between individual plots, a heavy solid line, representative of control values (A), has beensuperimposed on each contour plot.
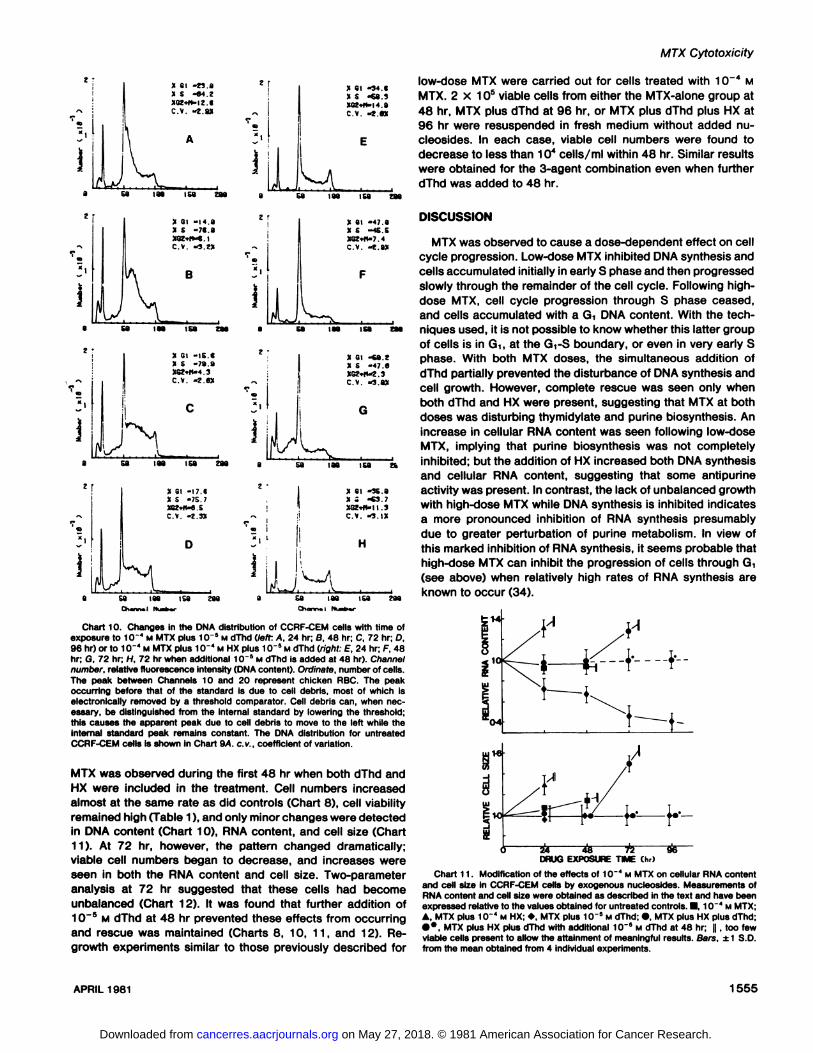
the combination of all 3 agents.High-Dose MTX. Exposure to 10~4 M MTX resulted in a rapid
fall in cell viability between 24 and 96 hr (Chart 8). During thisperiod, no increase in total cell numbers (live and dead) wasobserved; by 72 hr, the proportion of viable cells was reducedto 10% (Table 1). DNA analysis of these cells showed anincrease in Gìand a decrease in G2 + M within 24 hr of
treatment (Chart 9). No further changes in cell cycle distributionwith time were then observed with the exception of the appearance of increasing cell debris. Constant cell cycle distributions as a function of time after MTX addition could meaneither that MTX had no effect on cell cycle progression or thatit prevented the progression of cells through all parts of thecell cycle. Because no increase in cell number was observed
APRIL 1981 1553
on May 27, 2018. © 1981 American Association for Cancer Research. cancerres.aacrjournals.org Downloaded from
/. W. Taylor and M. H. N. Tattersall
10*
24 48TIME (h,)
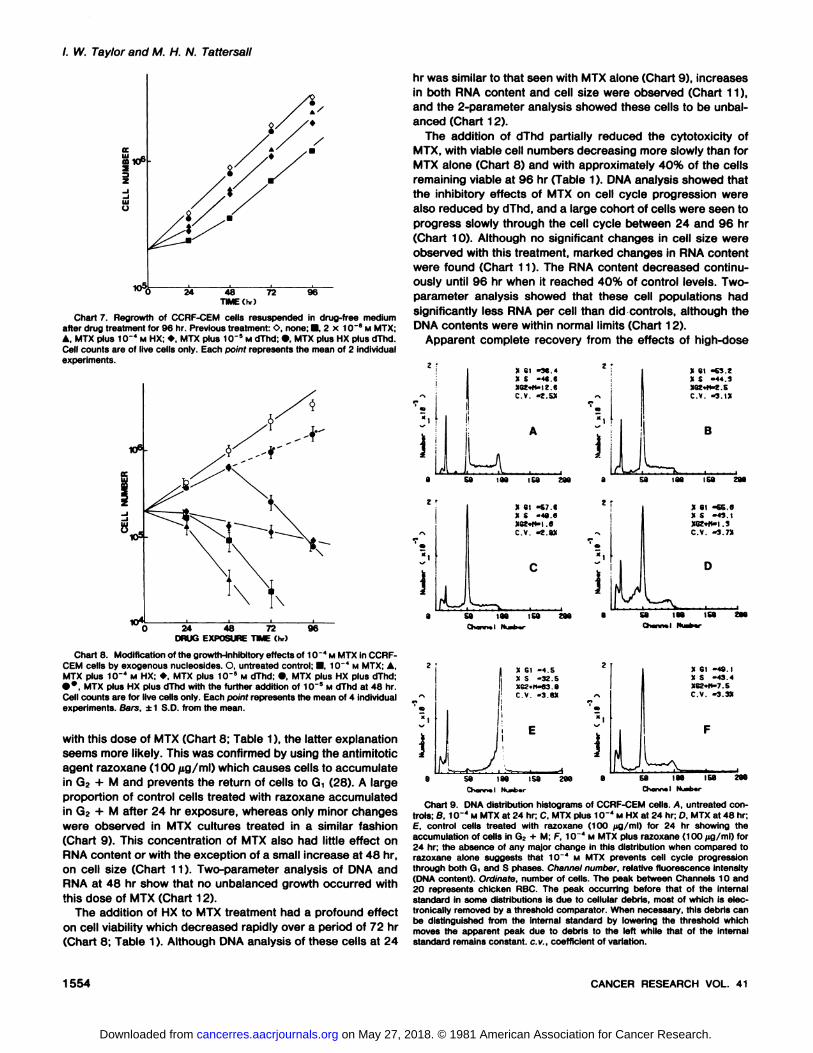
72 96
Chart 7. Regrowth of CCRF-CEM cells resuspended in drug-free mediumafter drug treatment for 96 hr. Previous treatment: O, none; •,2 x 1CT8 M MTX;A. MTX plus 10~" M HX; »,MTX plus 1CT5 M dThd; •,MTX plus HX plus dThd.
Cell counts are of live cells only. Each point represents the mean of 2 individualexperiments.
24 48 72DRUG EXPOSURE TIME (hr)
96
Chart 8. Modification of the growth-inhibitory effects of 10"* M MTX in CCRF-CEM cells by exogenous nucleosides. O, untreated control; •1CT4 M MTX; A,MTX plus 1CT4 M HX: », MTX plus 1fr5 M dThd; •,MTX plus HX plus dThd;••.MTX plus HX plus dThd with the further addition of 1CT5 M dThd at 48 hr.
Cell counts are for live cells only. Each point represents the mean of 4 individualexperiments. Bars, ±1 S.D. from the mean.
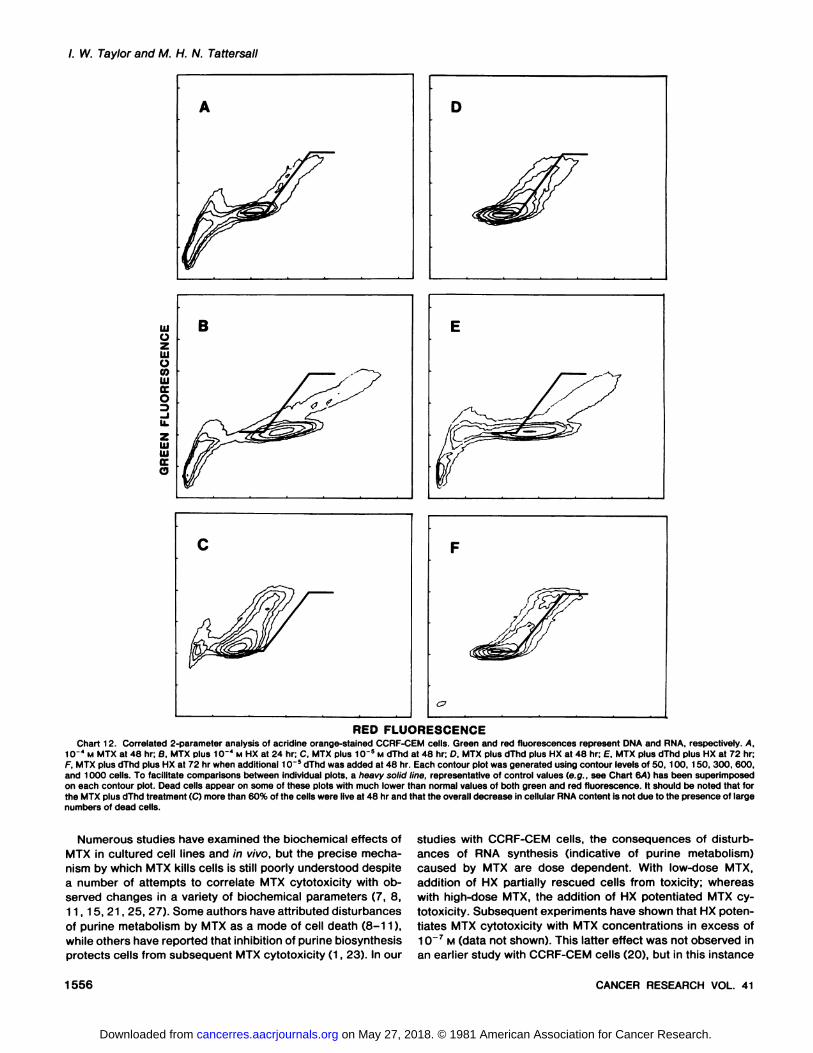
with this dose of MTX (Chart 8; Table 1), the latter explanationseems more likely. This was confirmed by using the antimitoticagent razoxane (100 /ig/ml) which causes cells to accumulatein G? + M and prevents the return of cells to Gt (28). A largeproportion of control cells treated with razoxane accumulatedin G2 + M after 24 hr exposure, whereas only minor changeswere observed in MTX cultures treated in a similar fashion(Chart 9). This concentration of MTX also had little effect onRNA content or with the exception of a small increase at 48 hr,on cell size (Chart 11 ). Two-parameter analysis of DMA and
RNA at 48 hr show that no unbalanced growth occurred withthis dose of MTX (Chart 12).
The addition of HX to MTX treatment had a profound effecton cell viability which decreased rapidly over a period of 72 hr(Chart 8; Table 1). Although DNA analysis of these cells at 24
hr was similar to that seen with MTX alone (Chart 9), increasesin both RNA content and cell size were observed (Chart 11),and the 2-parameter analysis showed these cells to be unbal
anced (Chart 12).The addition of dThd partially reduced the cytotoxicity of
MTX, with viable cell numbers decreasing more slowly than forMTX alone (Chart 8) and with approximately 40% of the cellsremaining viable at 96 hr (Table 1). DNA analysis showed thatthe inhibitory effects of MTX on cell cycle progression werealso reduced by dThd, and a large cohort of cells were seen toprogress slowly through the cell cycle between 24 and 96 hr(Chart 10). Although no significant changes in cell size wereobserved with this treatment, marked changes in RNA contentwere found (Chart 11 ). The RNA content decreased continuously until 96 hr when it reached 40% of control levels. Two-parameter analysis showed that these cell populations hadsignificantly less RNA per cell than did controls, although theDNA contents were within normal limits (Chart 12).
Apparent complete recovery from the effects of high-dose
X Gl -4.SX S -32.SXG2.M-63 Bc.v. -s.ex
"I
LX
SI -49. IX S -43.4XG2-»M-7.SC.V.-3.3XFse
IBB isa?8aChanr»!Nur.b.r
8 58 I88 li,0 288Chonn.l M.iirb.r
Chart 9. DNA distribution histograms of CCRF-CEM cells. A. untreated controls; 8, 1CT4 M MTX at 24 hr; C, MTX plus 1CT4 M HX at 24 hr; D, MTX at 48 hr;
£, control cells treated with razoxane (100 ¿ig/ml) for 24 hr showing theaccumulation of cells in G2 + M; F, 10~* M MTX plus razoxane (100 /ig/ml) for
24 hr; the absence of any major change in this distribution when compared torazoxane alone suggests that 10"* M MTX prevents cell cycle progression
through both G, and S phases. Channel number, relative fluorescence intensity(DNA content). Ordinate, number of cells. The peak between Channels 10 and20 represents chicken RBC. The peak occurring before that of the internalstandard in some distributions is due to cellular debris, most of which is electronically removed by a threshold comparator. When necessary, this debris canbe distinguished from the internal standard by lowering the threshold whichmoves the apparent peak due to debris to the left while that of the internalstandard remains constant, c.v., coefficient of variation.
1554 CANCER RESEARCH VOL. 41
on May 27, 2018. © 1981 American Association for Cancer Research. cancerres.aacrjournals.org Downloaded from
MTX Cytotoxicity
X CI -23.ax s -64.2
x et -34.1x s -sa.)XC2»»4.|4.aC.V. -2.«
low-dose MTX were carried out for cells treated with 10 4 MMTX. 2 x 10⁵ viable cells from either the MTX-alone group at
48 hr, MTX plus dThd at 96 hr, or MTX plus dThd plus HX at96 hr were resuspended in fresh medium without added nu-cleosides. In each case, viable cell numbers were found todecrease to less than 104 cells/ml within 48 hr. Similar results
were obtained for the 3-agent combination even when further
dThd was added to 48 hr.
tu
:<8i-M.ax s -7«.a
B
X 81 -47.aX S -45.5XGZ»rt-7.4c.v.-?.ax
X Gì-IS.«X S -79.9
c.v. -z.ex
C
laa isa zaa
x GÌ-sa.zx s -47.8
c.v. 03.ax
G
X Gì-17.«X S -75.7
X ai -15,¡aX ¿ -63 7XGZ»tt-n.3C.V.-3.IX
H
• sa laa isa zaa a saOivwt* I rtuobw Chano-
Chart 10. Changes in théDNA distribution of CCRF-CEM cells with time ofexposure to 10"" M MTX plus 10~5 M dThd (left: A, 24 hr; B. 48 hr; C, 72 hr; D,96 hr) or to 10~* M MTX plus 10~" M HX plus 10~5 M dThd (right: E, 24 hr; F, 48hr; G. 72 hr; H. 72 hr when additional 10 5 M dThd is added at 48 hr). Channel
number, relative fluorescence intensity (DNA content). Ordinate, number of cells.The peak between Channels 10 and 20 represent chicken RBC. The peakoccurring before that of the standard is due to cell debris, most of which iselectronically removed by a threshold comparator. Cell debris can, when necessary, be distinguished from the internal standard by lowering the threshold;this causes the apparent peak due to cell debris to move to the left while theinternal standard peak remains constant. The DNA distribution for untreatedCCRF-CEM cells is shown in Chart 9A. c.v., coefficient of variation.
MTX was observed during the first 48 hr when both dThd andHX were included in the treatment. Cell numbers increasedalmost at the same rate as did controls (Chart 8), cell viabilityremained high (Table 1), and only minor changes were detectedin DNA content (Chart 10), RNA content, and cell size (Chart11). At 72 hr, however, the pattern changed dramatically;viable cell numbers began to decrease, and increases wereseen in both the RNA content and cell size. Two-parameteranalysis at 72 hr suggested that these cells had becomeunbalanced (Chart 12). It was found that further addition of10~s M dThd at 48 hr prevented these effects from occurring
and rescue was maintained (Charts 8, 10, 11, and 12). Re-growth experiments similar to those previously described for
DISCUSSION
MTX was observed to cause a dose-dependent effect on cellcycle progression. Low-dose MTX inhibited DNA synthesis and
cells accumulated initially in early S phase and then progressedslowly through the remainder of the cell cycle. Following high-
dose MTX, cell cycle progression through S phase ceased,and cells accumulated with a GìDNA content. With the techniques used, it is not possible to know whether this latter groupof cells is in Gì,at the Gi-S boundary, or even in very early S
phase. With both MTX doses, the simultaneous addition ofdThd partially prevented the disturbance of DNA synthesis andcell growth. However, complete rescue was seen only whenboth dThd and HX were present, suggesting that MTX at bothdoses was disturbing thymidylate and purine biosynthesis. Anincrease in cellular RNA content was seen following low-dose
MTX, implying that purine biosynthesis was not completelyinhibited; but the addition of HX increased both DNA synthesisand cellular RNA content, suggesting that some antipurineactivity was present. In contrast, the lack of unbalanced growthwith high-dose MTX while DNA synthesis is inhibited indicates
a more pronounced inhibition of RNA synthesis presumablydue to greater perturbation of purine metabolism. In view ofthis marked inhibition of RNA synthesis, it seems probable thathigh-dose MTX can inhibit the progression of cells through Gì
(see above) when relatively high rates of RNA synthesis areknown to occur (34).
2i 48 72DRUG EXPOSURE TIME Chr)
Chart 11. Modification of the effects of 10 ' M MTX on cellular RNA content
and cell size in CCRF-CEM cells by exogenous nucleosides. Measurements ofRNA content and cell size were obtained as described in the text and have beenexpressed relative to the values obtained for untreated controls. •10 * M MTX;A, MTX plus 10"1 M HX; »,MTX plus 10'5 M dThd; •,MTX plus HX plus dThd;•*, MTX plus HX plus dThd with additional 10~5 M dThd at 48 hr; || , too few
viable cells present to allow the attainment of meaningful results. Bars, ±1 S.D.from the mean obtained from 4 individual experiments.
APRIL 1981 1555
on May 27, 2018. © 1981 American Association for Cancer Research. cancerres.aacrjournals.org Downloaded from
/. W. Taylor and M. H. N. Tattersall
uiOZIIIowUJoco
UJIUCEo
B
REO FLUORESCENCEChart 12. Correlated 2-parameter analysis of acridine orange-stained CCRF-CEM cells. Green and red fluorescences represent DNA and RNA, respectively. A,
1CT4 M MTX at 48 hr; 8, MTX plus 10"" M HX at 24 hr; C, MTX plus 1CT5 M dThd at 48 hr; D, MTX plus dThd plus HX at 48 hr; E, MTX plus dThd plus HX at 72 hr;F, MTX plus dThd plus HX at 72 hr when additional 1CT5 dThd was added at 48 hr. Each contour plot was generated using contour levels of 50. 100, 150, 300, 600,
and 1000 cells. To facilitate comparisons between individual plots, a heavy solid line, representative of control values (e.g., see Chart &A) has been superimposedon each contour plot. Dead cells appear on some of these plots with much lower than normal values of both green and red fluorescence. It should be noted that forthe MTX plusnumbers of dead cells.
Numerous studies have examined the biochemical effects ofMTX in cultured cell lines and in vivo, but the precise mechanism by which MTX kills cells is still poorly understood despitea number of attempts to correlate MTX cytotoxicity with observed changes in a variety of biochemical parameters (7, 8,11, 15, 21, 25, 27). Some authors have attributed disturbancesof purine metabolism by MTX as a mode of cell death (8-11),
while others have reported that inhibition of purine biosynthesisprotects cells from subsequent MTX cytotoxicity (1, 23). In our
studies with CCRF-CEM cells, the consequences of disturb
ances of RNA synthesis (indicative of purine metabolism)caused by MTX are dose dependent. With low-dose MTX,
addition of HX partially rescued cells from toxicity; whereaswith high-dose MTX, the addition of HX potentiated MTX cytotoxicity. Subsequent experiments have shown that HX potentiates MTX cytotoxicity with MTX concentrations in excess of10~7 M (data not shown). This latter effect was not observed in
an earlier study with CCRF-CEM cells (20), but in this instance
1556 CANCER RESEARCH VOL. 41
on May 27, 2018. © 1981 American Association for Cancer Research. cancerres.aacrjournals.org Downloaded from
MTX Cytotoxicity
no MTX concentrations greater than 10 7M were used.
Several authors have reported that MTX may cause unbalanced cell growth due to selective inhibition of thymidylatesynthesis (1, 3, 23). Unbalanced growth has also been reportedfollowing treatment with hydroxyurea (24), dThd (13), and 1-/S-D-arabinofuranosylcytosine (12, 14). It has been suggested
that the continuation of unbalanced cell growth for longer thanone cell cycle time results in cell death (4, 12, 24). Someobservations in this study appeared initially to be in agreementwith these reports since dThd plus HX failed to maintain rescuefrom high-dose MTX for longer than 48 hr and resulted in
unbalanced growth which was associated with a rapid increasein cell death unless further dThd was added at this time.Similarly, the addition of HX to cells treated with high-dose
MTX caused unbalanced cell growth and significantly increased cytotoxicity. In contrast with these results were thestudies with low-dose MTX which caused unbalanced cell
growth between 24 and 72 hr (cell cycle time is 24 hr); whencells surviving 96 hr of this treatment were resuspended infresh medium, the resulting growth curve suggested that themajority of the cell population was capable of normal growth.These results can be attributed neither to a population of cellswhich did not become unbalanced, since Chart 6 shows thatthe entire population is unbalanced at 48 hr, nor to MTXresistance, since these cells responded to further MTX treatment as before (data not shown). Furthermore, addition of HXto low-dose MTX resulted in a greater degree of unbalanced
growth than did MTX alone, but this was accompanied byreduced cytotoxicity, similar to that accompanying dThd treatment which, however, also prevented unbalanced growth. Ourresults suggest that unbalanced cell growth is not the primarymode of cell death caused by MTX. Recovery from prolongeddThd-induced unbalanced growth has also been observed
previously (16).Unbalanced cell growth is generally held to occur when DNA
synthesis is inhibited and cells continue to synthesize RNA andprotein. We have observed that the converse pattern may alsooccur in cells exposed to high-dose MTX and dThd. In thesecells, DNA synthesis continued while RNA synthesis was inhibited, resulting in unbalanced cell growth where cells contained excess DNA in relation to their RNA content. This effectwas not due to the presence of dead cells (which frequentlyappear with a lower than normal RNA content), inasmuch asbetween 24 and 48 hr, where the phenomenon was observedinitially, more than 60% of the cell population was viable. Weare unaware of any such effect having been previously reportedfor MTX.
From the results obtained in this study, there would appearto be some correlation between MTX cytotoxicity and inhibitionof DNA synthesis. The greatest degree of cytotoxicity wasobserved when DNA synthesis was almost completely inhibitedas caused by high-dose MTX with and without added HX.Furthermore, when rescue with HX and dThd from high-doseMTX failed at 72 hr, the DNA histogram was similar to that forhigh-dose MTX alone, indicating that DNA synthesis was in
hibited. This situation was prevented by the further addition ofdThd which restored cell cycle progression and cell growth.With the other drug treatments examined, the degree of cytotoxicity diminished as the inhibition of cell cycle progressionwas reduced (as judged from the sequential DNA analysis) inorder: high-dose MTX plus dThd; low-dose MTX; low-dose
MTX plus dThd; low-dose MTX plus HX. In all instances where
rescue from MTX cytotoxicity was effected, no substantialinhibition of cell cycle progression was observed.
In conclusion, this study suggests that the major effect ofMTX on cell viability is mediated through the inhibition of DNAsynthesis which results from interference with the de novobiosynthesis of both purines and thymidylate. The effects ofMTX on RNA synthesis appear to be unrelated to cytotoxicity.We are presently engaged in further investigations to delineatethe precise biochemical changes which correlate with MTX-induced cell death. The 2-parameter flow cytometric analysis
used in this study clearly provided much more informationpertaining to cell cycle-related drugs effects than did single-
parameter analysis of DNA content alone, and we are extendingthis type of analysis to studies of cells treated with otherantimetabolites including 5-fluorouracil and to deoxynucleo-
sides.
ACKNOWLEDGMENTS
The authors wish to thank Pauline Francis for her expert technical assistanceand preparation of charts.
REFERENCES
1. Borsa. J.. and Whitmore, G. F. Cell killing studies on the mode of action ofmethotrexate on L-cells in vitro. Cancer Res., 29. 737-744, 1969.
2. Bresnick, E.. and Thompson, U. B. Properties of deoxythymidine kinasepartially purified from animal tumors. J. Biol. Chem., 240. 3967-3974,
1965.3. Cohen. L. S.. and Studzinski. G. P. Correlation between cell enlargement
and nucleic acid and protein content of HeLa cells in unbalanced growthproduced by inhibitors of DNA synthesis. J. Cell. Physiol., 69. 331-340.
1968.4. Eidinoff, M. L., and Rich, M. A. Growth inhibition of a human tumour cell
strain by 5-fluoro-2'-deoxyuridine. Time parameters for subsequent reversalby thymidine. Cancer Res., 19: 521-524, 1959.
5. Foley. G.. Lazarus, H.. Farber, S., Uzman, B., Boone, B., and McCarthy, R.Continuous culture of human lymphoblasts from peripheral blood of a childwith acute leukaemia. Cancer (Phila.), 18: 522-529, 1965.
6. Friedkin, M., and Roberts, D. Conversion of uracil deoxyriboside to thymidineof deoxyribonucleic acids. J. Biol. Chem., 220. 653-660, 1956.
7. Goulian, M., Mirile. B., and Tseng, B. Y. Methotrexate-induced misincorpo-ration of uracil into DNA. Proc. Nati. Acad. Sei. U. S. A., 77 1956-1960,
1980.8. Hryniuk, W. M. Purineless death as a link between growth rate and cytotox
icity by methotrexate. Cancer Res.. 32 1506-1511. 1972.9. Hryniuk, W. M. The mechanisms of action of methotrexate in cultured
L5178Y leukemia cells Cancer Res., 35. 1085-1092. 1975.10. Hryniuk, W. M., Brox, L. W., Henderson, J. F., and Tainaoki, T. Conse
quences of methotrexate inhibition of purine biosynthesis in L5178Y cells.Cancer Res., 35. 1427-1432, 1975.
11. Hryniuk, W. M., Fischer, G. A., and Berlino. J. R. S-phase cells of rapidlygrowing and resting populations. Differences in response to methotrexate.Mol. Pharmacol., 5. 557-564, 1969.
12. Kim, J. H., Eidinoff, M. L., and Fox, J. J Action of 1-/3-o-arabinofuranosyl-5-fluorocytosine on the nucleic acid metabolism and viability of HeLa cells.Cancer Res., 26. 1661-1664, 1966.
13. Kim, J. H.. Kim, S. H., and Eidinoff. M. L. Cell viability and nucleic acidmetabolism after exposure of HeLa cells to excess thymidine and deoxy-adenosine. Biochem. Pharmacol., 14: 1821-1829, 1965.
14. Kim, J. H.. Perez, A. G., and Djordjevic, B. Studies on unbalanced growth insynchronized HeLa cells. Cancer Res.. 28 2443-2447. 1968.
15. Kinahan, J. J., Otten, M., and Grindey, G. B. Evaluation of ribonucleosideand deoxyribonucleoside triphosphate pools in cultured leukaemia cellsduring exposure to methotrexate or methotrexate plus thymidine. CancerRes., 39. 3531-3539, 1979.
16. Lambert. W. C.. and Studzinski. G. P. Recovery from prolonged unbalancedgrowth induced in HeLa cells by high concentrations of thymidine. CancerRes.. 27 2364-2369. 1967.
17. Milthorpe. B. K. FMFPAK1 : A program package for routine analysis of singleparameter flow microfluorimetric data on a low cost mini-computer. Comput.Biomed. Res., Õ3.417-429. 1980.
18. Nichol, C. A., and Welch, A. D. On the mechanism of action of aminopterin.Proc. Soc. Exp. Biol. Med.. 74: 403-411. 1950.
19. Osborn. M. J.. Freeman. M.. and Huennekens, F. M. Inhibition of dihydro-
APRIL 1981 1557
on May 27, 2018. © 1981 American Association for Cancer Research. cancerres.aacrjournals.org Downloaded from

/. W. Taylor and M. H. N. Tattersall
folate reducÃase by aminopterin and amethopterin. Proc. Soc. Exp. Biol.Med., 97. 429-431, 1958.
20. Roberts, D., and Warmath, E. V. Methotrexate inhibition of CCRF-CEMcultures of human lymphoblasts. Eur. J. Cancer, 11: 771-782, 1975.
21. Roberts, D., and Wodinsky, I. On the poor correlation between the inhibitionby methotrexate of dihydrofolate reductase and of deoxynucleoside incorporation into DNA. Cancer Res., 28. 1955-1962, 1968.
22. Rotman, B., and Papermaster, B. W. Membrane properties of living mammalian cells as studied by enzymatic hydrolysis of fluorogenic esters. Biochemistry, 55. 134-141, 1966.
23. Rueckert, R. R . and Mueller, G. C. Studies on unbalanced growth in tissueculture. I. Induction and consequences of thymidine deficiency. CancerRes., 20. 1584-1591. 1960.
24. Sinclair, W. K. Hydroxyurea: effects on Chinese hamster cells grown inculture. Cancer Res., 27. 297-308, 1967.
25. Tattersall, M. H. N., and Harrap, K. R. Changes in the deoxyribonucleosidetriphosphate pools of mouse 5178Y lymphoma cells following exposure tomethotrexate or 5-fluorouracil. Cancer Res., 33. 3086-3090, 1973.
26. Tattersall, M. H. N., Jackson, R. C., Connors, T. A., and Harrap, K. R.Combination chemotherapy: the interaction of methotrexate and 5-fluorouracil. Eur. J. Cancer, 9. 733-739, 1973.
27. Tattersall, M. H. N., Jackson, R. C., Jackson, S. T. M., and Harrap, K. R.Factors determining cell sensitivity to methotrexate: studies of folate anddeoxyribonucleoside triphosphate pools in five mammalian cell lines. Eur. J.
Cancer. 10: 819-826, 1974.28. Taylor, I. W., and Bleehen, N. M. Changes in sensitivity to radiation and ICRF
159 during the life of monolayer cultures of the EMT6 tumour line. Br. J.Cancer, 35. 587-594, 1977.
29. Taylor, I. W., and Milthorpe, B. K. An evaluation of DNA fluorochromes,staining techniques and analysis for flow cytometry. 1. Unperturbed cellpopulations. J. Histochem. Cytochem., 28. 1224-1232, 1980.
30. Tobey. R. A. Effects of cytosine arabinoside, daunomycin, mithramycin,azacytidine, Adriamycin, and camptothecin on mammalian cell cycle traverse. Cancer Res., 32. 2720-2725, 1972.
31. Tobey, R. A., and Crissman, H. A. Use of flow microfluorimetry in detailedanalysis of effects of chemical agents on cell cycle progression. CancerRes., 32. 2726-2732, 1972.
32. Tráganos, F., Darzynkiewicz, Z., Sharpless, T.. and Melamed, M. R. Simultaneous staining of ribonucleic and deoxyribonucleic acids in unfixed cellsusing acridine orange in a flow cytofluorometric system. J. Histochem.Cytochem., 25. 46-56, 1977.
33. Visser, J. W. M., van den Engh, G. J., and van Bekkum, D. W. Lightscattering properties of murine haemopoietic cells. Blood Cells, 6. 391-407, 1980.
34. Watson, J. V., and Chambers, S. H. Nucleic acid profile of the EMT6 cellcycle in vitro. Cell Tissue Kinet., 11: 415-422, 1978.
35. Yataganas, X., and Clarkson, B. D. Flow microfluorometric analysis of cellkilling with cytotoxic drugs. J. Histochem. Cytochem.. 22. 651-659, 1974.
1558 CANCER RESEARCH VOL. 41
on May 27, 2018. © 1981 American Association for Cancer Research. cancerres.aacrjournals.org Downloaded from

1981;41:1549-1558. Cancer Res Ian W. Taylor and Martin H. N. Tattersall Studied by Flow CytometryMethotrexate Cytotoxicity in Cultured Human Leukemic Cells
Updated version
http://cancerres.aacrjournals.org/content/41/4/1549
Access the most recent version of this article at:
E-mail alerts related to this article or journal.Sign up to receive free email-alerts
Subscriptions
Reprints and
To order reprints of this article or to subscribe to the journal, contact the AACR Publications
Permissions
Rightslink site. Click on "Request Permissions" which will take you to the Copyright Clearance Center's (CCC)
.http://cancerres.aacrjournals.org/content/41/4/1549To request permission to re-use all or part of this article, use this link
on May 27, 2018. © 1981 American Association for Cancer Research. cancerres.aacrjournals.org Downloaded from