methodology of reliability and power density analysis of
TRANSCRIPT
Methodology of Reliability and Power DensityAnalysis of SST Topologies
Kuan Wang, Qin Lei, Chunhui LiuSchool of Electrical, Computer and Energy Engineering
Arizona State UniversityTempe, U.S.
Email: [email protected]
Abstract—This paper proposes a reliability analysis modeland a power density analysis to evaluate the Solid-State Trans-former(SST) topologies for different applications. The solid-statedevice rating and the redundancy number are considered astwo major factors affecting the reliability. In each topology, theoptimized selections of these two factors will be determined toreach sufficient reliability. The power density is influenced bythe device volume, the transformer volume and the capacitorvolume. In terms of these three aspects, the topology which hasthe highest power density is selected for the certain application.The effectiveness of the model is validated by the comparisonbetween evaluation results and the actual industry products.
I. INTRODUCTION
Solid-State Transformer(SST) is widely discussed as thereplacement of the Conventional Transformer(CT) in someapplications. The purpose of using SST is to improve thecontrollability and increase the power density. However, the re-liability and the cost are bottlenecks. The comparison betweenthe SST and the CT in terms of costs, weights, volumes andlosses was discussed in [1]. The comparison among differentSST topologies considering the similar aspects was presentedin [2] and [3].
The reliability of SST is relatively low due to the use ofactive solid-state devices in comparison of the conventionaltransformer with passive components. Thus, if an SST topol-ogy is designed for an application, a reliability requirementmust be met. The comparison among different SSTs topologiesin terms of the reliability is proposed in this paper.
The SST topologies can be classified according to the typ-ical application: AC grid, DC grid, traction drive, substation,DC/AC charger. For these applications, there are topologiesdesigned and fully tested by many companies and institutions[4]-[9]. In section 2, more possible topologies for these appli-cations are proposed.
A detailed reliability analysis model is proposed in section3 to have a more precise reliability evaluation. Reliabilityis influenced by two factors: device rating and redundancy.For a non-redundant system, the system reliability is theproduct of the reliability of each component. In this case,the use of semiconductor devices with higher rating resultsin fewer components. Then the reliability will be higher. Forthe redundant system, one more redundancy applied to asystem will increase system reliability significantly. However,
TABLE ITHE SPECIFICATIONS OF THE APPLICATIONS
ABB GE UNIFLEX EPRI
Transfer type AC-DC AC-AC AC-AC AC-AC
Phase number Single Single Three Three
Power rating1.2MVA
1.8MVApeak1MVA 300kVA 45kVA
Input Voltage15KVrms
17kVrms-peak
16.7Hz
13.8KV60Hz
3.3kV50Hz
2.4KV50Hz
Output Voltage 1.5KV 265V AC3.3kV, 50Hz415V,50Hz
277V
Transformerfrequency
1.75kHz 20KHz 2kHz 10kHz
the reliability will not increase that much when the quantityof redundancy is beyond a certain number [10].
Based on the reliability analysis, an optimized combinationof the device ratings and the redundancy is selected for eachtopology. The next step is to select the topology with highestpower density for each application.
Power density is majorly associated with three factors:device rating, transformer size and capacitor size. As discussedbefore, higher device rating results in the fewer device count.Then the volume is smaller. The capacitor in half or fullbridge inverter/rectifier is also relatively large because of the2 current ripple. The high-frequency transformer takes a greatportion because of its high voltage and current rating and highinsulation level. However, the size of a transformer is relativelyproportional to its power rating. As a result, for the sameapplication, the sizes of transformers of those topologies aresimilar. Thus, the power density comparison among differenttopologies is presented in section 5 based on the comparisonof the size of capacitors and devices.
Finally, the comparison between the evaluation results andthe industrial selection shows the effectiveness of the method-ology based on the reliability analysis and the power densityanalysis.
II. TOPOLOGY SCREENING OF SST
Four applications are discussed in this paper. ABBs HVAC-LVDC Power Electronic Traction Transformer (PET) (see Fig.
978-1-5090-5366-7/17/$31.00 ©2017 IEEE 1851
(a) (b) (c) (d) (e)
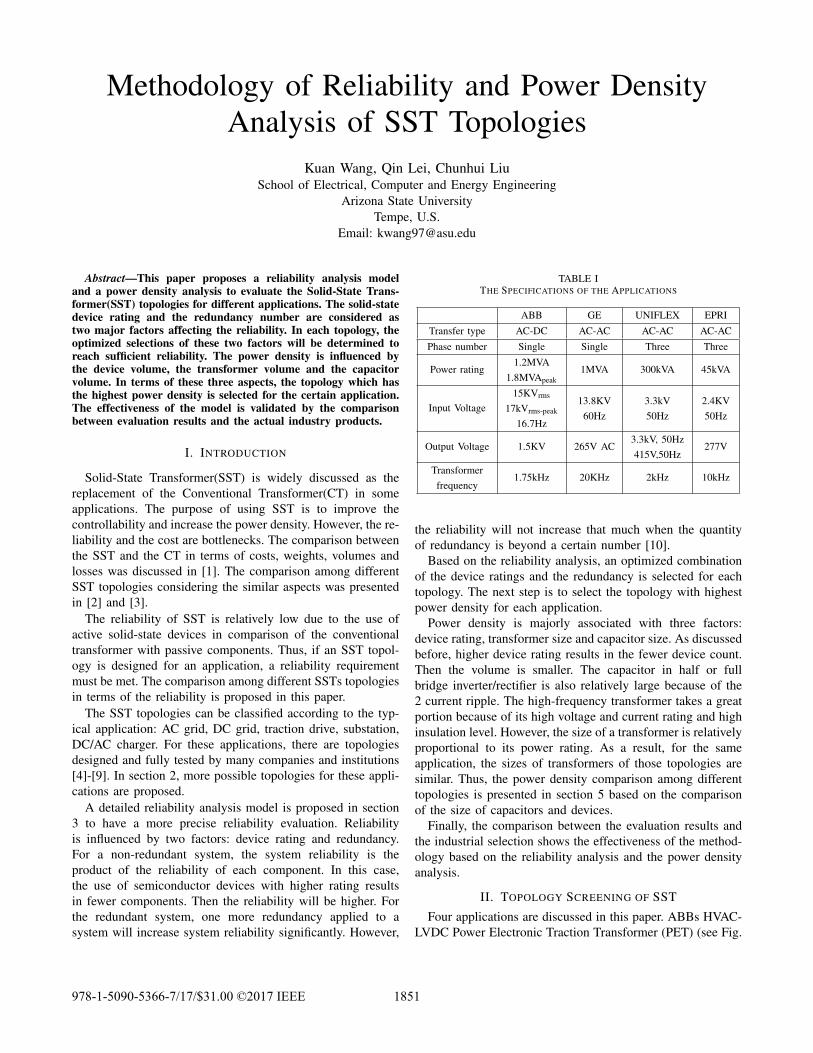
Fig. 1. Topologies for ABB Application (a)Half Bridge (b)Full Bridge (c)Half Bridge Multi-winding Transformer(d)MMC (e)Matrix
(a) (b) (c) (d) (e)
Fig. 2. Topologies for GE Application (a)Full Bridge (b)Half Bridge (c)Full Bridge Paralleled Output (d)Full Bridge Multi-winding Transformer (e)HalfBridge Multi-winding Transformer
(a) (b) (c)
Fig. 3. Topologies for UNIFLEX Application (a)Full Bridge (b)Three Level (c)Half Bridge
(a) (b) (c)
Fig. 4. Topologies for UNIFLEX Application (a)Three Level (b)Full Bridge (c)Half Bridge
1(a)) [4], GEs HVAC-MVAC substation (see Fig. 2(a)) [6],UNIFLEXs MVAC-MVAC/LVAC smart grid SST (see Fig.3(a)) [7] and EPRIs MVAC-LVAC smart grid SST (see Fig.4(a)) [8] are presented. The others are the possible topologies.The specifications for each application are shown in Table I.
III. RELIABILITY ANALYSIS
A. Reliability Model
The base of system reliability analysis is the failure ratewhich is also called Failure in Time (FIT) for each component.FIT of one device is equal to the number of failures withinone billion (109) hours. The FIT data used for this analysisis shown in Table II, in which all the values are from theindustrial database.
The reliability of a device is as presented in (1).
Ri(t) = e−λit (1)
The reliability of the non-redundancy system is the productof reliability of each component because all the componentsare regarded as series connected as shown in Fig. 5. If onecomponent breaks down, the whole system will fall in failure.Thus, the reliability of the system is presented in (2).
Rs = R1 ×R2 ×R3 · · · ×Rk (2)
The redundancy part of the system can be considered asa parallel-connected component. The system with redundancyis shown in Fig. 6. If the block with redundancy containsN necessary components and x redundant components, the
1852
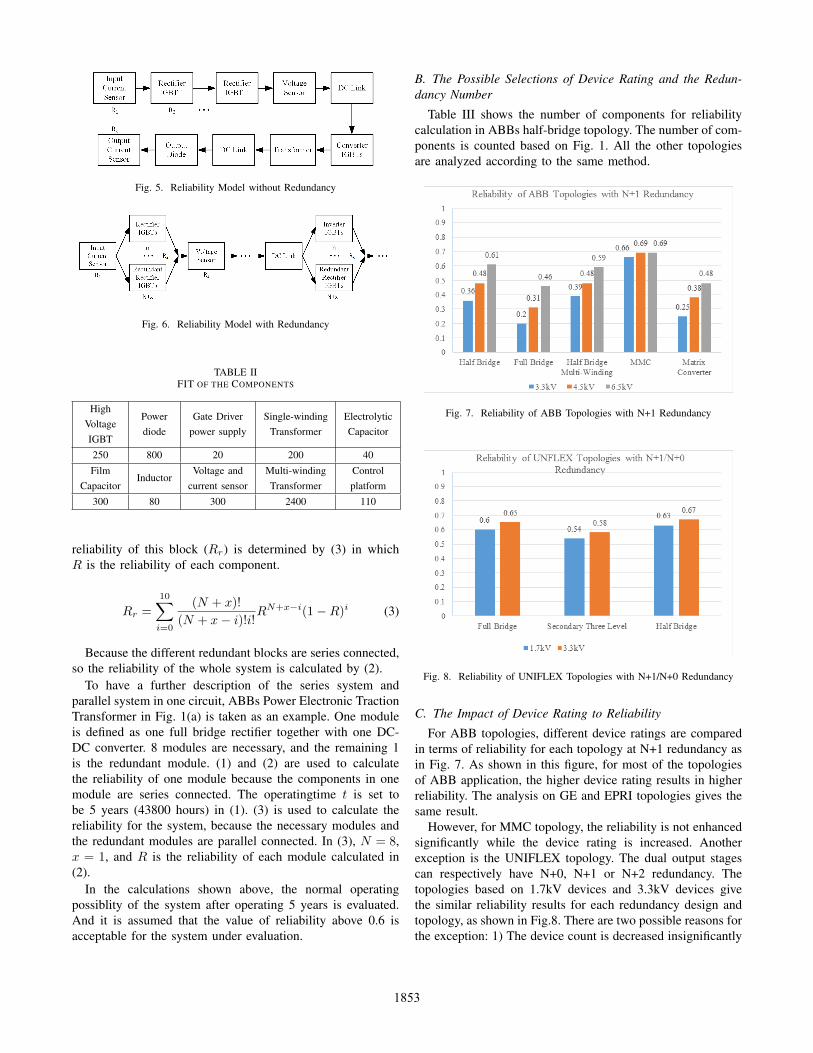
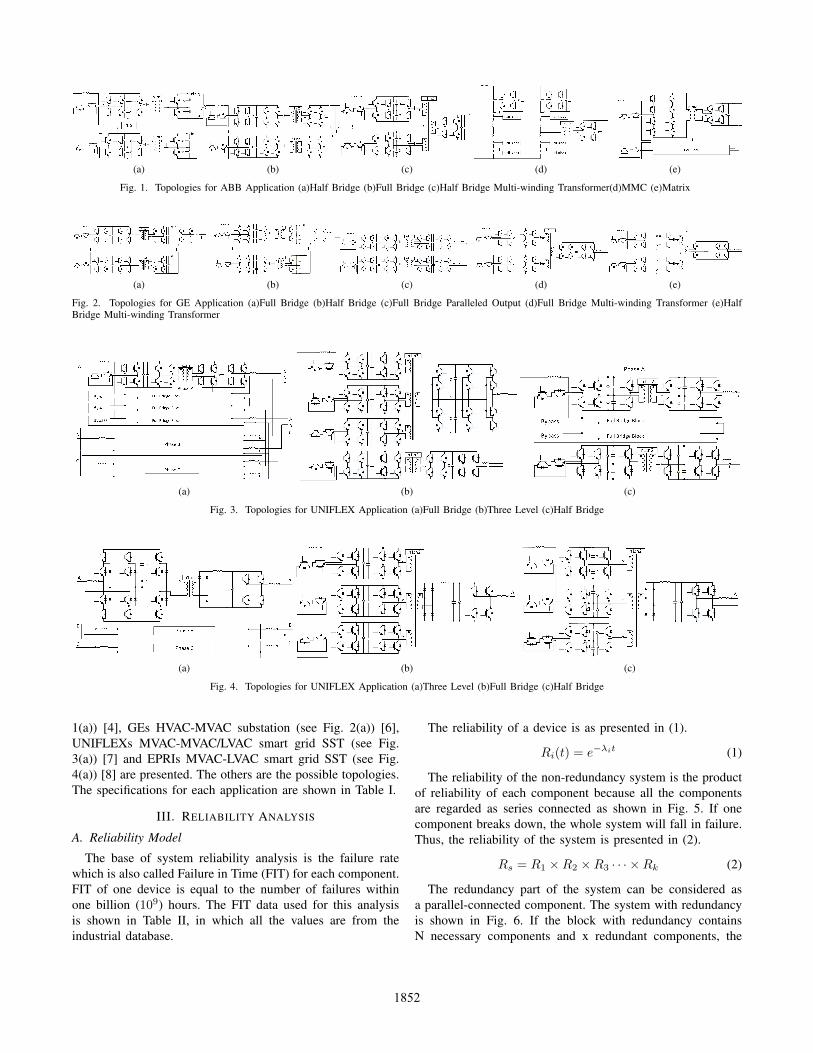
Fig. 5. Reliability Model without Redundancy
Fig. 6. Reliability Model with Redundancy
TABLE IIFIT OF THE COMPONENTS
HighVoltageIGBT
Powerdiode
Gate Driverpower supply
Single-windingTransformer
ElectrolyticCapacitor
250 800 20 200 40
FilmCapacitor
InductorVoltage and
current sensorMulti-windingTransformer
Controlplatform
300 80 300 2400 110
reliability of this block (Rr) is determined by (3) in whichR is the reliability of each component.
Rr =10∑i=0
(N + x)!
(N + x− i)!i!RN+x−i(1−R)i (3)
Because the different redundant blocks are series connected,so the reliability of the whole system is calculated by (2).
To have a further description of the series system andparallel system in one circuit, ABBs Power Electronic TractionTransformer in Fig. 1(a) is taken as an example. One moduleis defined as one full bridge rectifier together with one DC-DC converter. 8 modules are necessary, and the remaining 1is the redundant module. (1) and (2) are used to calculatethe reliability of one module because the components in onemodule are series connected. The operatingtime t is set tobe 5 years (43800 hours) in (1). (3) is used to calculate thereliability for the system, because the necessary modules andthe redundant modules are parallel connected. In (3), N = 8,x = 1, and R is the reliability of each module calculated in(2).
In the calculations shown above, the normal operatingpossiblity of the system after operating 5 years is evaluated.And it is assumed that the value of reliability above 0.6 isacceptable for the system under evaluation.
B. The Possible Selections of Device Rating and the Redun-dancy Number
Table III shows the number of components for reliabilitycalculation in ABBs half-bridge topology. The number of com-ponents is counted based on Fig. 1. All the other topologiesare analyzed according to the same method.
Fig. 7. Reliability of ABB Topologies with N+1 Redundancy
Fig. 8. Reliability of UNIFLEX Topologies with N+1/N+0 Redundancy
C. The Impact of Device Rating to Reliability
For ABB topologies, different device ratings are comparedin terms of reliability for each topology at N+1 redundancy asin Fig. 7. As shown in this figure, for most of the topologiesof ABB application, the higher device rating results in higherreliability. The analysis on GE and EPRI topologies gives thesame result.
However, for MMC topology, the reliability is not enhancedsignificantly while the device rating is increased. Anotherexception is the UNIFLEX topology. The dual output stagescan respectively have N+0, N+1 or N+2 redundancy. Thetopologies based on 1.7kV devices and 3.3kV devices givethe similar reliability results for each redundancy design andtopology, as shown in Fig.8. There are two possible reasons forthe exception: 1) The device count is decreased insignificantly
1853
(a)
(b)
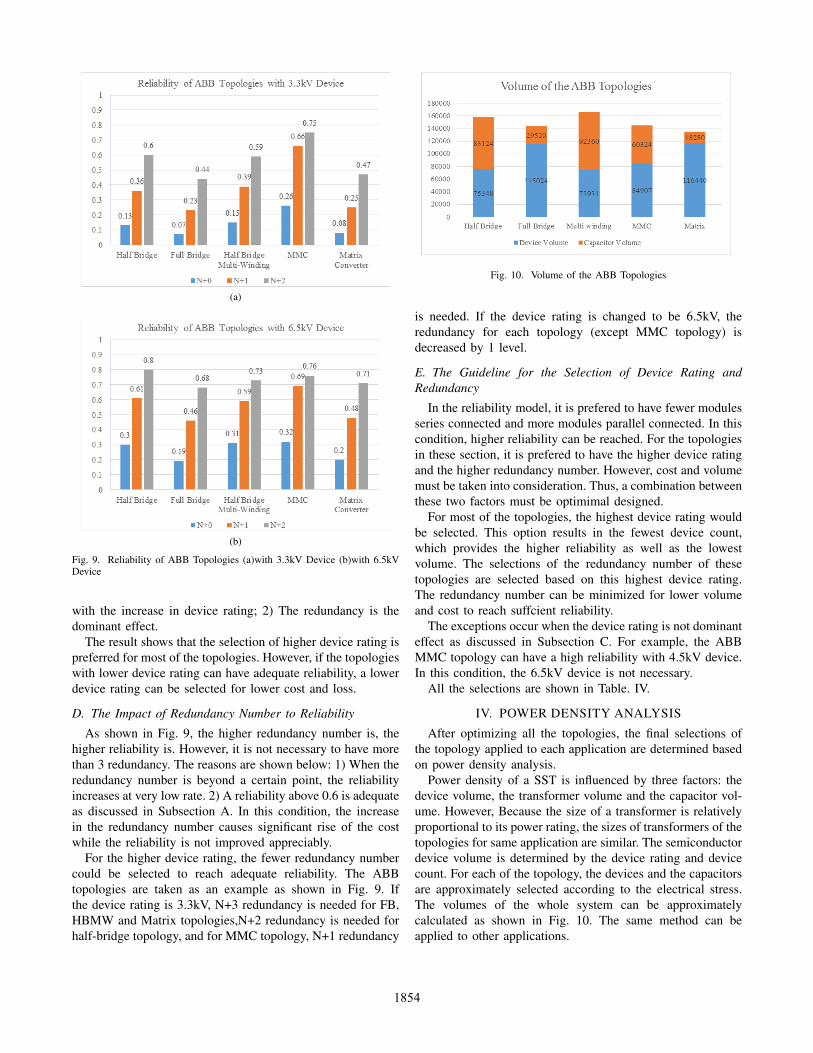
Fig. 9. Reliability of ABB Topologies (a)with 3.3kV Device (b)with 6.5kVDevice
with the increase in device rating; 2) The redundancy is thedominant effect.
The result shows that the selection of higher device rating ispreferred for most of the topologies. However, if the topologieswith lower device rating can have adequate reliability, a lowerdevice rating can be selected for lower cost and loss.
D. The Impact of Redundancy Number to Reliability
As shown in Fig. 9, the higher redundancy number is, thehigher reliability is. However, it is not necessary to have morethan 3 redundancy. The reasons are shown below: 1) When theredundancy number is beyond a certain point, the reliabilityincreases at very low rate. 2) A reliability above 0.6 is adequateas discussed in Subsection A. In this condition, the increasein the redundancy number causes significant rise of the costwhile the reliability is not improved appreciably.
For the higher device rating, the fewer redundancy numbercould be selected to reach adequate reliability. The ABBtopologies are taken as an example as shown in Fig. 9. Ifthe device rating is 3.3kV, N+3 redundancy is needed for FB,HBMW and Matrix topologies,N+2 redundancy is needed forhalf-bridge topology, and for MMC topology, N+1 redundancy
Fig. 10. Volume of the ABB Topologies
is needed. If the device rating is changed to be 6.5kV, theredundancy for each topology (except MMC topology) isdecreased by 1 level.
E. The Guideline for the Selection of Device Rating andRedundancy
In the reliability model, it is prefered to have fewer modulesseries connected and more modules parallel connected. In thiscondition, higher reliability can be reached. For the topologiesin these section, it is prefered to have the higher device ratingand the higher redundancy number. However, cost and volumemust be taken into consideration. Thus, a combination betweenthese two factors must be optimimal designed.
For most of the topologies, the highest device rating wouldbe selected. This option results in the fewest device count,which provides the higher reliability as well as the lowestvolume. The selections of the redundancy number of thesetopologies are selected based on this highest device rating.The redundancy number can be minimized for lower volumeand cost to reach suffcient reliability.
The exceptions occur when the device rating is not dominanteffect as discussed in Subsection C. For example, the ABBMMC topology can have a high reliability with 4.5kV device.In this condition, the 6.5kV device is not necessary.
All the selections are shown in Table. IV.
IV. POWER DENSITY ANALYSIS
After optimizing all the topologies, the final selections ofthe topology applied to each application are determined basedon power density analysis.
Power density of a SST is influenced by three factors: thedevice volume, the transformer volume and the capacitor vol-ume. However, Because the size of a transformer is relativelyproportional to its power rating, the sizes of transformers of thetopologies for same application are similar. The semiconductordevice volume is determined by the device rating and devicecount. For each of the topology, the devices and the capacitorsare approximately selected according to the electrical stress.The volumes of the whole system can be approximatelycalculated as shown in Fig. 10. The same method can beapplied to other applications.
1854
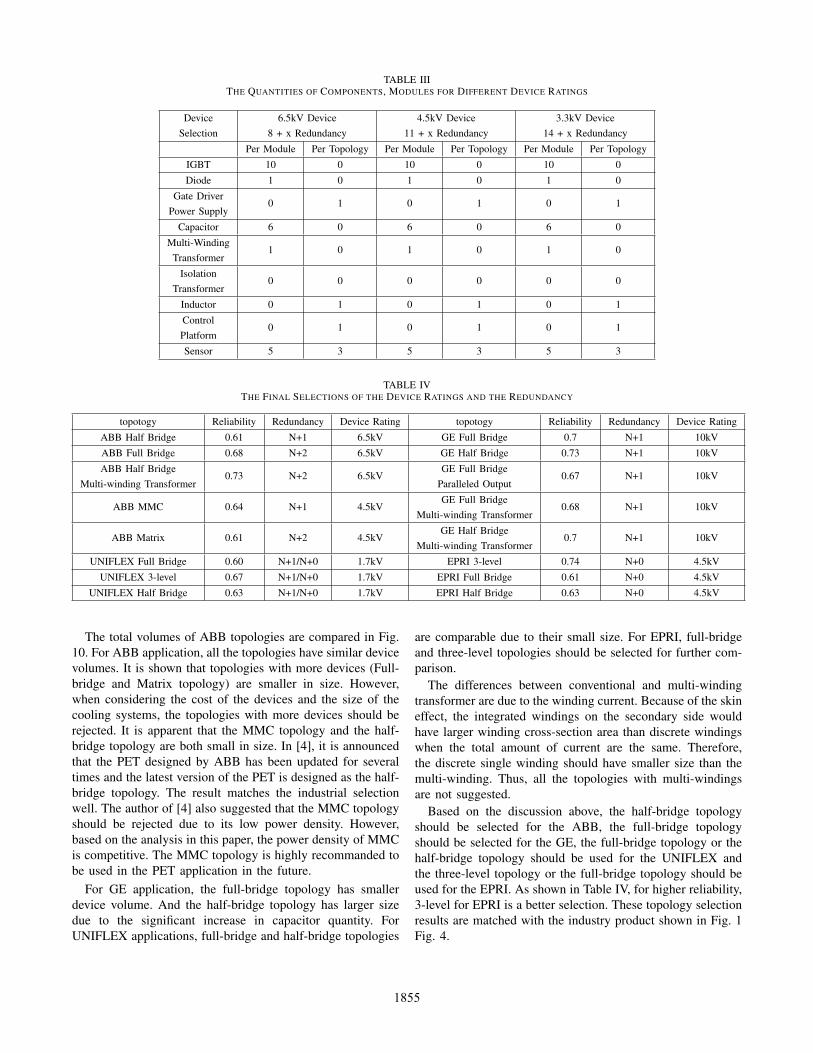
TABLE IIITHE QUANTITIES OF COMPONENTS, MODULES FOR DIFFERENT DEVICE RATINGS
DeviceSelection
6.5kV Device8 + x Redundancy
4.5kV Device11 + x Redundancy
3.3kV Device14 + x Redundancy
Per Module Per Topology Per Module Per Topology Per Module Per Topology
IGBT 10 0 10 0 10 0
Diode 1 0 1 0 1 0
Gate DriverPower Supply
0 1 0 1 0 1
Capacitor 6 0 6 0 6 0
Multi-WindingTransformer
1 0 1 0 1 0
IsolationTransformer
0 0 0 0 0 0
Inductor 0 1 0 1 0 1
ControlPlatform
0 1 0 1 0 1
Sensor 5 3 5 3 5 3
TABLE IVTHE FINAL SELECTIONS OF THE DEVICE RATINGS AND THE REDUNDANCY
topotogy Reliability Redundancy Device Rating topotogy Reliability Redundancy Device Rating
ABB Half Bridge 0.61 N+1 6.5kV GE Full Bridge 0.7 N+1 10kV
ABB Full Bridge 0.68 N+2 6.5kV GE Half Bridge 0.73 N+1 10kV
ABB Half BridgeMulti-winding Transformer
0.73 N+2 6.5kVGE Full Bridge
Paralleled Output0.67 N+1 10kV
ABB MMC 0.64 N+1 4.5kVGE Full Bridge
Multi-winding Transformer0.68 N+1 10kV
ABB Matrix 0.61 N+2 4.5kVGE Half Bridge
Multi-winding Transformer0.7 N+1 10kV
UNIFLEX Full Bridge 0.60 N+1/N+0 1.7kV EPRI 3-level 0.74 N+0 4.5kV
UNIFLEX 3-level 0.67 N+1/N+0 1.7kV EPRI Full Bridge 0.61 N+0 4.5kV
UNIFLEX Half Bridge 0.63 N+1/N+0 1.7kV EPRI Half Bridge 0.63 N+0 4.5kV
The total volumes of ABB topologies are compared in Fig.10. For ABB application, all the topologies have similar devicevolumes. It is shown that topologies with more devices (Full-bridge and Matrix topology) are smaller in size. However,when considering the cost of the devices and the size of thecooling systems, the topologies with more devices should berejected. It is apparent that the MMC topology and the half-bridge topology are both small in size. In [4], it is announcedthat the PET designed by ABB has been updated for severaltimes and the latest version of the PET is designed as the half-bridge topology. The result matches the industrial selectionwell. The author of [4] also suggested that the MMC topologyshould be rejected due to its low power density. However,based on the analysis in this paper, the power density of MMCis competitive. The MMC topology is highly recommanded tobe used in the PET application in the future.
For GE application, the full-bridge topology has smallerdevice volume. And the half-bridge topology has larger sizedue to the significant increase in capacitor quantity. ForUNIFLEX applications, full-bridge and half-bridge topologies
are comparable due to their small size. For EPRI, full-bridgeand three-level topologies should be selected for further com-parison.
The differences between conventional and multi-windingtransformer are due to the winding current. Because of the skineffect, the integrated windings on the secondary side wouldhave larger winding cross-section area than discrete windingswhen the total amount of current are the same. Therefore,the discrete single winding should have smaller size than themulti-winding. Thus, all the topologies with multi-windingsare not suggested.
Based on the discussion above, the half-bridge topologyshould be selected for the ABB, the full-bridge topologyshould be selected for the GE, the full-bridge topology or thehalf-bridge topology should be used for the UNIFLEX andthe three-level topology or the full-bridge topology should beused for the EPRI. As shown in Table IV, for higher reliability,3-level for EPRI is a better selection. These topology selectionresults are matched with the industry product shown in Fig. 1Fig. 4.
1855
V. CONCLUSION
In this paper, a reliability analysis model is proposed toevaluate the topologies for different applications. Device ratingand redundancy number are considered as two major factors toaffect the reliability. An approximate power density analysisis proposed to have a further selection of the topologies. Theprocedure to have a selection of the topology for an applicationis shown here. 1) Screening all the possible topologies for thisapplication. 2) Considering the semiconductor device rating.It is recommended to have a higher device rating to reachfewer modules and lower device count. 3) Considering theredundancy. Selecting a proper redundancy number to reachsufficient reliability. It is recommended to have redundancynumber as few as possibel to avoid unnecessary cost. 4) Thepower density gives the final selection among the topologies.The analysis based on loss, cost and weight is also neces-sary[2][3].
This methodology is proved to be applicable because theresults are similar to the topologies selected by industry. Fur-ther work can be focused on the research on FIT of differencedevices at different operating conditions. Detailed researcheson capacitors, transformers, cooling system and insulation willgive more accurate power density approximation.
REFERENCES
[1] H. Kopka and P. W. Daly, “Volume/Weight/Cost Comparison of a 1MVA10 kV/400V Solid-State against a Conventional Low-Frequency Distri-bution Transformer,” Proc. ECCE, 2014, pp. 4545-4552.
[2] D. Rothmund, G. Ortiz and J. W. Kolar, “ SiC-Based Unidirectional Solid-State Transformer Concepts for Directly Interfacing 400V DC to Medium-Voltage AC Distribution Systems,” Proc. INTELEC, 2014, pp. 1-9.
[3] H. Qin and J. W. Kimball, “A comparative efficiency study of silicon-based solid state transformers,” Proc. ECCE, 2010, pp. 1458-1463.
[4] D. Dujic, F. Kieferndorf, F. Canales, and U. Drofenik, “Power electronictraction transformer technology,” Proc. IPEMC, 2012, pp. 636 642.
[5] M. K. Das, C. Capell, D. E. Grider, S. Leslie, J. Ostop, R. Raju, M.Schutten, J. Nasadoski, and A. Hefner, “10 kV, 120 A SiC half H-bridgepower MOSFET modules suitable for high frequency, medium voltageapplications,” Proc. ECCE, 2011, pp. 2689-2692.
[6] M. C. Magro and S. Savio, “Reliability and availability performances ofa universal and flexible power management system,”Proc. ISIE, 2010, pp.2461-2468.
[7] S. Lai, A. Maitra, A. Mansoor, and F. Goodman, “Multilevel intelligentuniversal transformer for medium voltage applications, Fourtieth IASAnnual Meeting. Conference Record of the 2005 Industry ApplicationsConference,, 2005, pp. 18931899 Vol.3 .
[8] Y. Song and B. Wang, “Survey on reliability of power electronic systems,IEEE Trans. Power Electron., vol. 28, no. 1, pp. 591604, 2013.
[9] A. Q. Huang and R. Burgos, 11Review of Solid-State TransformerTechnologies and Their Application in Power Distribution Systems, IEEEJournal of Emerging and Selected Topics in Power Electronics, vol. 1,no. 3, pp. 186198, 2013.
1856