nreca reliability online study -...
TRANSCRIPT

NRECA Reliability Online Study
Survey Results
June, 2006

Methodology/Response Rate
262 respondents participated in the 2006 reliability study (compared to 231 in 2005 and 299 in 2004).
As in the past years, the study was conducted online. For reporting purposes, percentages are based on total responding to that question.
Notification was placed on Cooperative.com alerting CEOs and key staff that the study was being conducted.
Overall response rate was 38.9%. (28% in 2005 and 36% in 2004). A total of 743 distribution cooperatives’ key Engineering and Operations staff names were included in the initial sample (based on NRECA’s database).
-- 70 email messages were returned undeliverable, making 673 the total number of respondents receiving an email invitation to participate.
-- Three reminder notifications were emailed to respondents asking for their participation.

Outages --Tracking
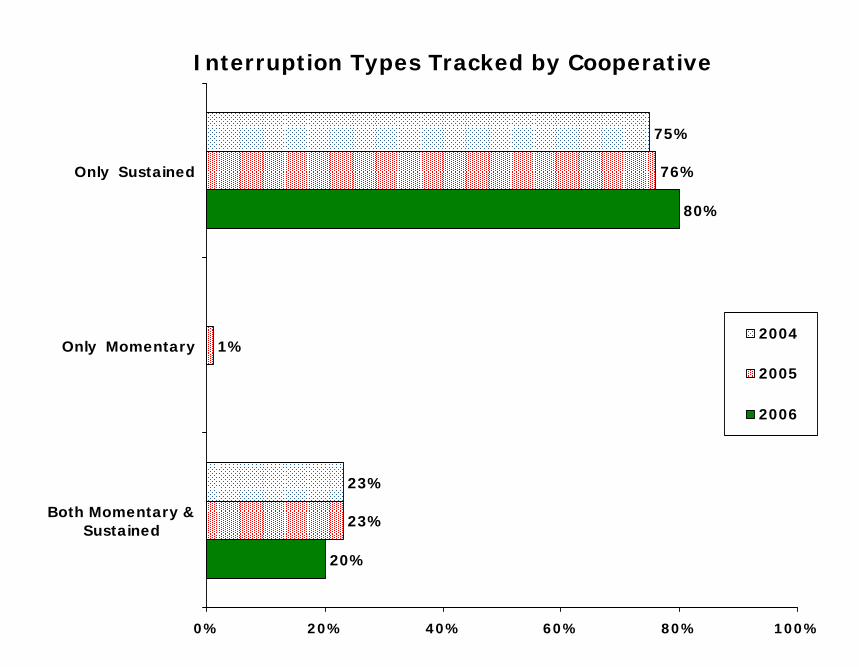
Interruption Types Tracked by Cooperative
20%
80%
23%
1%
76%
23%
75%
0% 20% 40% 60% 80% 100%
Both Momentary &Sustained
Only Momentary
Only Sustained
2004
2005
2006

Information Recorded When Tracking Outages (Multiple Responses Possible) Top 8 Graphed
69%
83%
90%
92%
93%
95%
96%
96%
68%
88%
94%
97%
97%
99%
98%
99%
67%
86%
88%
96%
97%
99%
98%
99%
0% 20% 40% 60% 80% 100%
Affected protectivedevice
Affected substation
Time of totalrestoration of power
# of customers affected
Time interruption began(from call from
member)
Date of interruption
Length of interruption
Cause of interruption
2004
2005
2006

Information Recorded When Tracking Outages(Multiple Responses Possible) Bottom 8 Graphed
25%
26%
32%
42%
46%
52%
54%
68%
26%
30%
29%
38%
54%
53%
58%
71%
34%
14%
28%
59%
54%
56%
0% 20% 40% 60% 80% 100%
Affected pole
Time interruption began(from SCADA)
Key accounts affected
# of Customer callsreceived
Resolved/needsadditional work
Weather conditions
Partial restoration ofpower
Phase identification
2004
2005
2006

If Use OMS: Method by Which Interruptions Are Entered Into
System(Multiple Responses Possible)
6%
9%
30%
33%
40%
47%
72%
8%
12%
44%
57%
73%
0% 20% 40% 60% 80% 100%
Down LineDistribution
Devices
SCADA
Manually - ThirdParty (during
outage)
Manually (afteroutage)
Call Center
Telephone orComputerBased IVR
Manually by Co-op (duringoutage)
2005
2006
Primary Method of Receiving Outage
Information
2%
18%
33%
44%
0% 10% 20% 30% 40% 50%
SCADAsystem
Telephonecall to AVR
system
Tel. call tolive person-
dataentered
Tel. call tolive person-
paperoutagereport

Interruption Tracking Method Used
3%
30%
67%
4%
30%
66%
8%
33%
59%
0% 10% 20% 30% 40% 50% 60% 70%
Other/Combination
System Wide
Feeder/Circuit
2004
2005
2006

Co-op Publicizes Its Reliability Reports
4%
73%
23%
7%
68%
25%
4%
74%
22%
0% 20% 40% 60% 80%
Don't Generate AReport
No
Yes
2004
2005
2006

Outages --Sustained
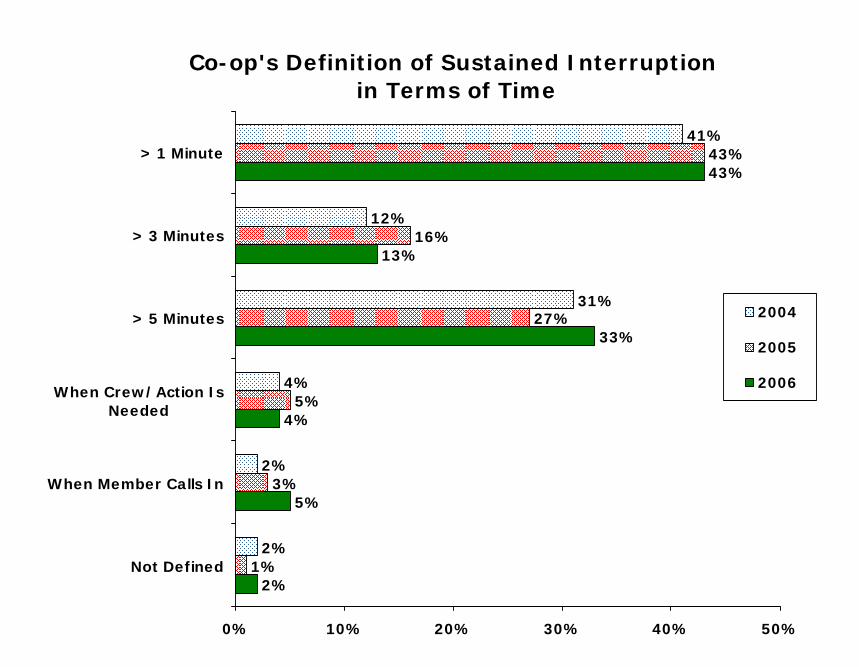
Co-op's Definition of Sustained Interruption in Terms of Time
2%
5%
4%
33%
13%
43%
1%
3%
5%
27%
16%
43%
2%
2%
4%
31%
12%
41%
0% 10% 20% 30% 40% 50%
Not Defined
When Member Calls In
When Crew/Action IsNeeded
> 5 Minutes
> 3 Minutes
> 1 Minute
2004
2005
2006

How Co-op Defines Major Storm or Major Event
14%
19%
5%
6%
8%
9%
12%
28%
15%
23%
5%
8%
2%
13%
9%
25%
16%
28%
1%
9%
12%
34%
0% 10% 20% 30% 40%
Co-op Does Not DefineMajor Storm/Event
Co-op Uses OtherMeans
IEEE 1366 Definition
# of Customers Out ofPower
Exceeds SystemDesign Limits**
% of Customers Out ofPower
Power Out for Over 24Hours**
RUS Definition
2004
2005
2006
Other Means:Management decision, declared storm, # of substations affected,
combination of methods
** Not a choice in 2004
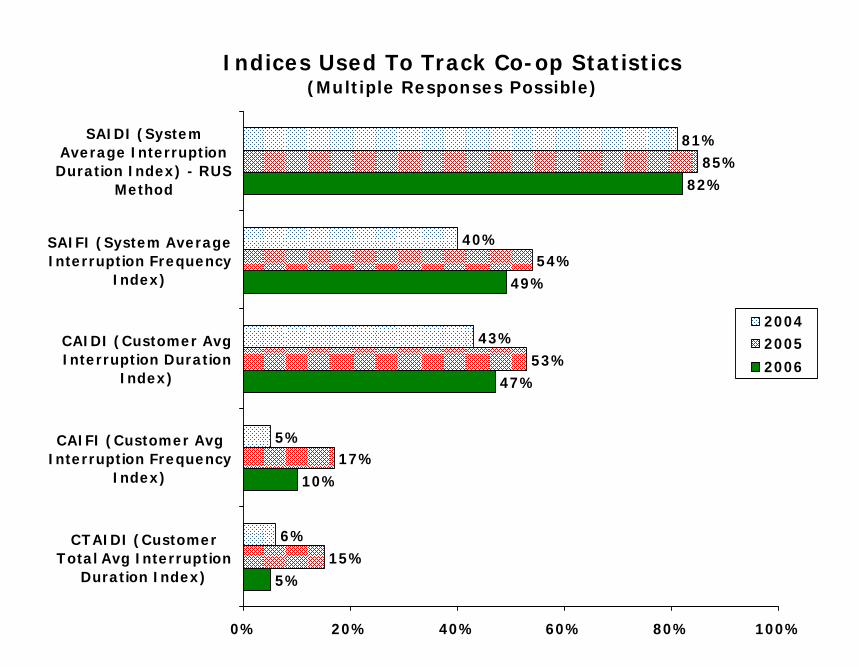
Indices Used To Track Co-op Statistics(Multiple Responses Possible)
5%
10%
47%
49%
82%
15%
17%
53%
54%
85%
6%
5%
43%
40%
81%
0% 20% 40% 60% 80% 100%
CTAIDI (CustomerTotal Avg Interruption
Duration Index)
CAIFI (Customer AvgInterruption Frequency
Index)
CAIDI (Customer AvgInterruption Duration
Index)
SAIFI (System AverageInterruption Frequency
Index)
SAIDI (SystemAverage InterruptionDuration Index) - RUS
Method
20042005
2006

Index Responses
SAIDI (System Average Interruption Duration Index – RUS Method)
2006 2005 2004
# Reporting An Amount 160 156 176
Average # Minutes Reported 106.9 125.3 130.8
Breakout of Responses:
50 minutes or less 45% 35% 15%
51 – 120 minutes 20% 30% 36%
121 – 180 minutes 16% 17% 22%
Over 180 minutes 19% 18% 15%
25th Percentile 2.7 minutes
Median 68.9 minutes
75th Percentile 158.1 minutes

Index Responses
CAIDI (Customer Average Interruption Duration Index)
2006 2005 2004
# Reporting An Amount 112 102 131
Average # Minutes Reported 116.1 184.3 119.1
Breakout of Responses:
30 minutes or less 34% 26% 12%
31 – 60 minutes 6% 15% 12%
61 – 90 minutes 21% 17% 31%
91 - 120 minutes 18% 19% 18%
Over 120 minutes 20% 24% 17%
25th Percentile 2.5 minutes
Median 72.5 minutes
75th Percentile 112.3 minutes

Index Responses
SAIFI (System Average Interruption Frequency Index)
2006 2005 2004
# Reporting An Amount 125 112 126
Avg # Interruptions/Customer 6.96 15.00 6.66
Breakout of Responses:
.10 interruptions or less 15% 15% 18%
.11 - 1.00 interruptions 25% 20% 26%
1.01 – 1.50 interruptions 18% 22% 22%
1.51 – 2.50 interruptions 26% 20% 17%
Over 2.50 interruptions 17% 23% 16%
25th Percentile 0.69 interruptions
Median 1.26 interruptions
75th Percentile 2.06 interruptions
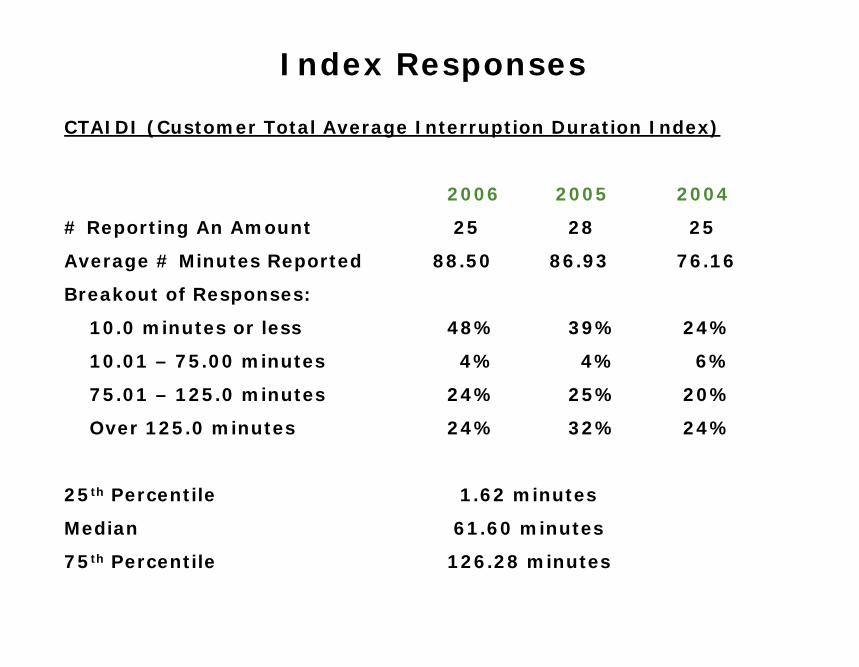
Index Responses
CTAIDI (Customer Total Average Interruption Duration Index)
2006 2005 2004
# Reporting An Amount 25 28 25
Average # Minutes Reported 88.50 86.93 76.16
Breakout of Responses:
10.0 minutes or less 48% 39% 24%
10.01 – 75.00 minutes 4% 4% 6%
75.01 – 125.0 minutes 24% 25% 20%
Over 125.0 minutes 24% 32% 24%
25th Percentile 1.62 minutes
Median 61.60 minutes
75th Percentile 126.28 minutes

Index Responses
CAIFI (Customer Average Interruption Frequency Index)
2006 2005 2004
# Reporting An Amount 29 33 20
Average # Interruptions 0.80 5.18 0.46
Breakout of Responses:
1.00 interruptions or less 61% 64% 80%
Over 1.00 interruptions 39% 36% 20%
25th Percentile 0.03 interruptions
Median 0.07 interruptions
75th Percentile 1.33 interruptions
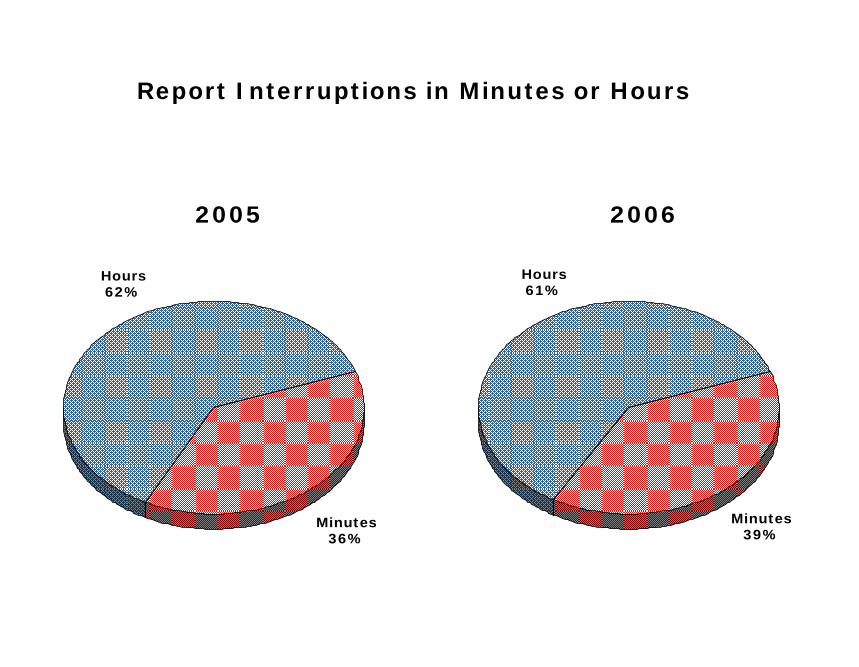
Report Interruptions in Minutes or Hours
2005
Minutes36%
Hours62%
2006
Minutes39%
Hours61%

Outages --Momentary

Co-op Track Momentary Interruptions
18%
24%
13%
0%
5%
10%
15%
20%
25%
30%
Yes2004 2005 2006

Co-op's Definition of Momentary Interruption in Terms of Time
14%
14%
7%
64%
10%
14%
2%
75%
18%
18%
4%
60%
0% 20% 40% 60% 80%
Other
< 5 Minutes
< 3 Minutes
< 1 Minute
2004(n=50)
2005(n=54)
2006(n=28)

Co-op's Method of Capturing Momentary Events(Multiple Responses Possible)
7%
32%
36%
46%
61%
9%
31%
41%
54%
46%
0% 10% 20% 30% 40% 50% 60% 70%
Other
AMR system
Customer call-In
Individual trip andreclose events
Trip and reclosesequence with no
lockout
2005(n=54)
2006(n=28)
Asked of those who track momentary events

Power Quality

Co-op Records Voltage Deviations At Substation Bus
46%
37%
43%
0%
10%
20%
30%
40%
50%
Yes2004 2005 2006

Indexing Methods Used(Multiple Responses Possible)
3%
6%
69%
2%
7%
78%
1%
8%
78%
0% 20% 40% 60% 80% 100%
SARFI (System AvgRMS Variation Freq
Index)
ITIC (Formerly CBEMA)
No Index Used
2004
2005
2006

IF YES: Where?(Multiple Responses Possible)
8%
13%
28%
34%
52%
3%
12%
36%
36%
51%
6%
20%
49%
69%
0% 20% 40% 60% 80%
Other
DistributionTransformer
Revenue Meter
Substation
Where ProblemSuspected
2004(n=35)
2005(n=69)
2006(n=64)
Regularly Record Total Harmonic Distortion (THD)
Levels Anywhere on System
70%
21%
9%
68%
23%
9%
87%
13%
0% 20% 40% 60% 80% 100%
No
Yes, OnlyWhereSuspect
Problems
Yes
2004
2005
2006
Not asked in 2004
Not an option in 2004

PowerRestoration
After an Interruption

Cooperative Has a Written Emergency Interruption Restoration Plan
86%81%
86%
0%
20%
40%
60%
80%
100%
Yes2004 2005 2006
Wording in 2004 – Co-op has major storm, event or catastrophe outage
restoration plan

Co-op Has Written Mutual Assistance Agreement(Multiple Responses Possible)
2%
18%
21%
58%
2%
16%
20%
62%
0% 10% 20% 30% 40% 50% 60% 70%
Contractors
Statewide Association
Neighboring Utilities
NeighboringCooperatives
2005
2006
In 2004, 81% of responding systems reported having a written mutual assistance
agreement
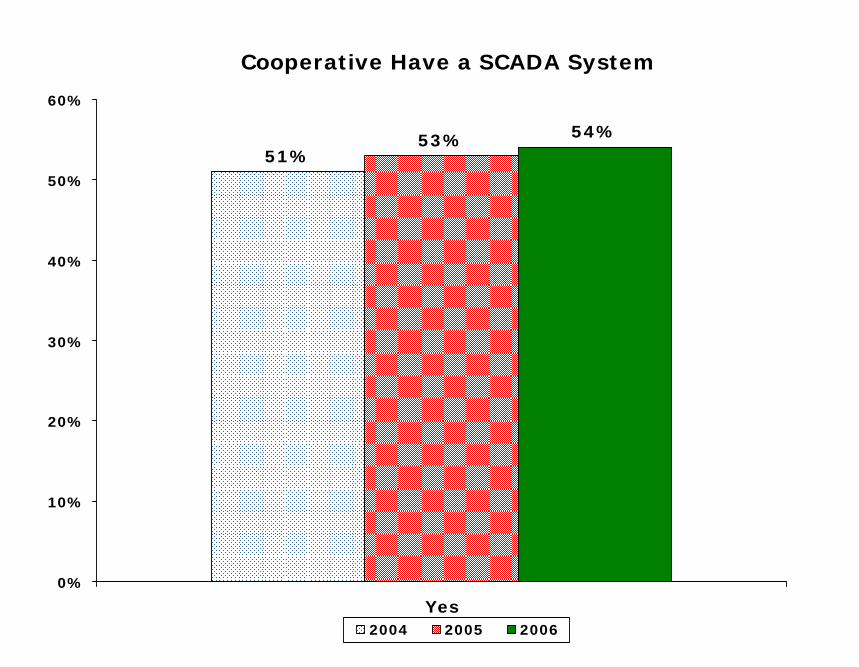
Cooperative Have a SCADA System
51%53% 54%
0%
10%
20%
30%
40%
50%
60%
Yes2004 2005 2006
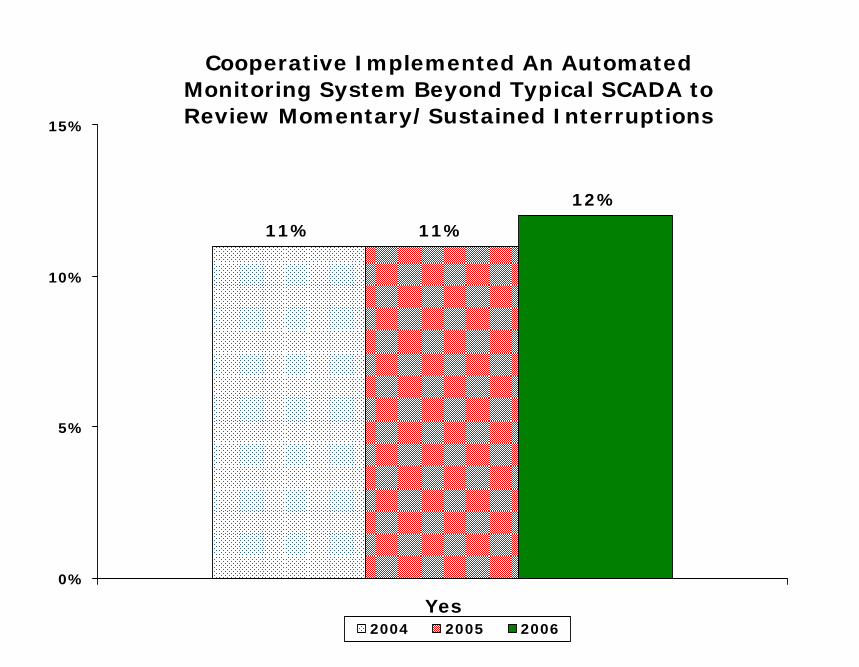
Cooperative Implemented An Automated Monitoring System Beyond Typical SCADA to Review Momentary/Sustained Interruptions
11% 11%
12%
0%
5%
10%
15%
Yes2004 2005 2006
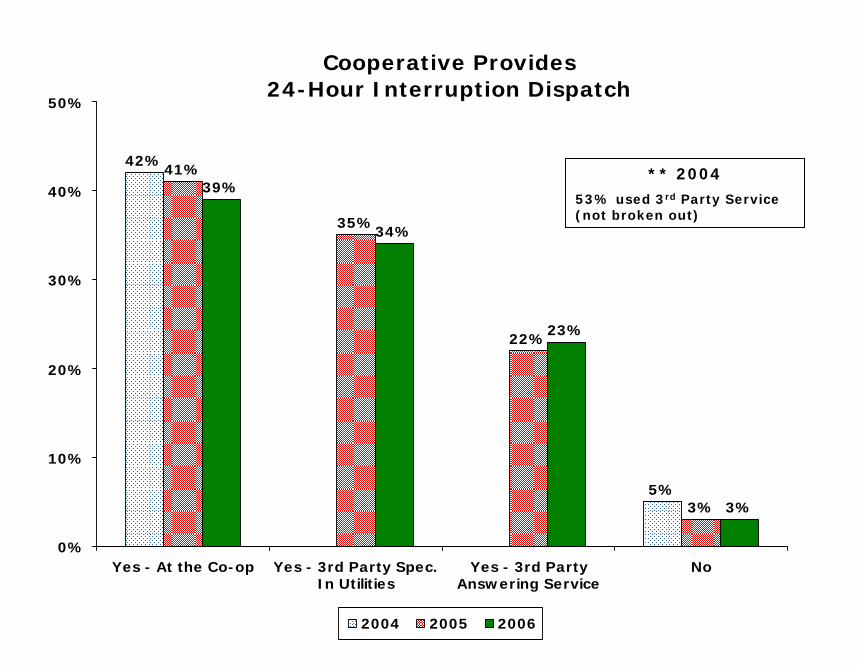
Cooperative Provides 24-Hour Interruption Dispatch
42%
5%
41%
35%
22%
3%
39%
34%
23%
3%
0%
10%
20%
30%
40%
50%
Yes - At the Co-op Yes - 3rd Party Spec.In Utilities
Yes - 3rd PartyAnswering Service
No
2004 2005 2006
** 2004
53% used 3rd Party Service (not broken out)

Prevention
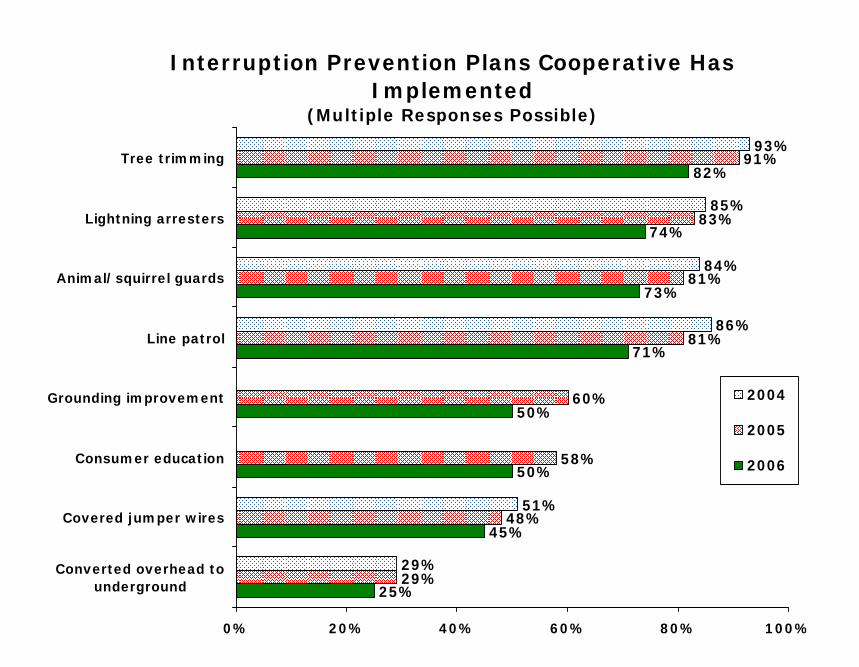
Interruption Prevention Plans Cooperative Has Implemented
(Multiple Responses Possible)
25%
45%
50%
50%
71%
73%
74%
82%
29%
48%
58%
60%
81%
81%
83%
91%
29%
51%
86%
84%
85%
93%
0% 20% 40% 60% 80% 100%
Converted overhead tounderground
Covered jumper wires
Consumer education
Grounding improvement
Line patrol
Animal/squirrel guards
Lightning arresters
Tree trimming
2004
2005
2006

Causes of Interruptions(Average Percentage Reported)
16%
7%
4%
4%
4%
7%
11%
13%
33%
0% 5% 10% 15% 20% 25% 30% 35%
Other
Unknown
Maintenance
Planned
Public
Animals
Equipment
Power Supply
Weather

What is Classified As A Power Supply Interruption For Majority of System
(Multiple Responses Possible)
7%
14%
51%
51%
7%
19%
51%
64%
0% 10% 20% 30% 40% 50% 60% 70%
None of These
Distribution/Low Sideof dist. substations
Transmission/High Sideportion of substations
Transmission Lines
2005
2006

Co-op's Primary Motivation for Improving Its Reliability System
1%
2%
3%
4%
91%
1%
1%
3%
2%
6%
86%
1%
1%
3%
3%
7%
85%
0% 20% 40% 60% 80% 100%
Other
Regulatory organization
Avoidance of negative PR
Department performancegoals
Board est. minimums forperformance index
Customer satisfaction
2004
2005
2006
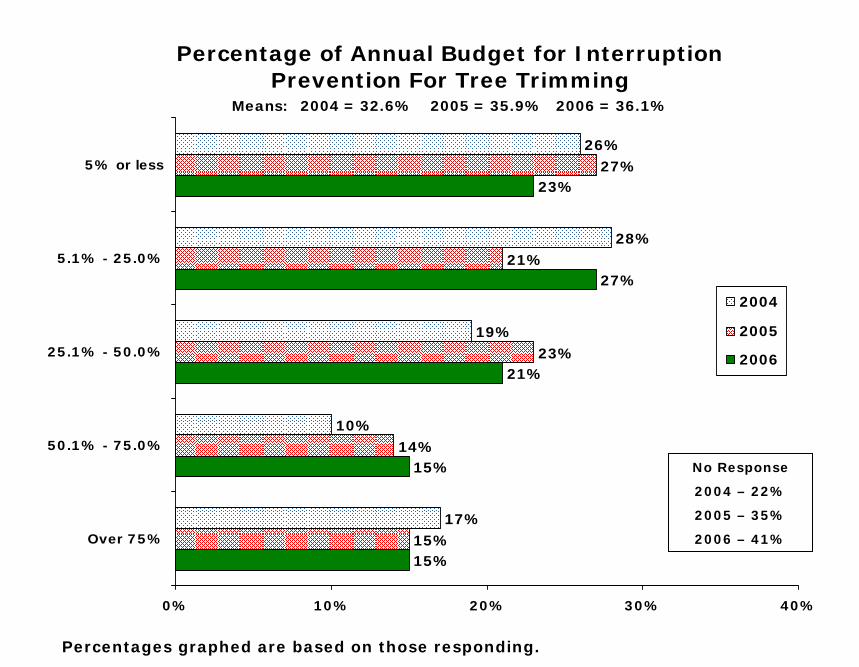
Percentage of Annual Budget for Interruption Prevention For Tree Trimming
Means: 2004 = 32.6% 2005 = 35.9% 2006 = 36.1%
15%
15%
21%
27%
23%
15%
14%
23%
21%
27%
17%
10%
19%
28%
26%
0% 10% 20% 30% 40%
Over 75%
50.1% - 75.0%
25.1% - 50.0%
5.1% - 25.0%
5% or less
2004
2005
2006
No Response
2004 – 22%
2005 – 35%
2006 – 41%
Percentages graphed are based on those responding.

Type(s) of Maintenance Program Cooperative Applies To Its System
(Multiple Responses Possible)
24%
36%
41%
78%
28%
38%
41%
87%
28%
40%
47%
90%
0% 20% 40% 60% 80% 100%
Proactive Maintenance
Predictive Maintenance
Reactive Maintenance
Preventive Maintenance
2004
2005
2006

System Operation
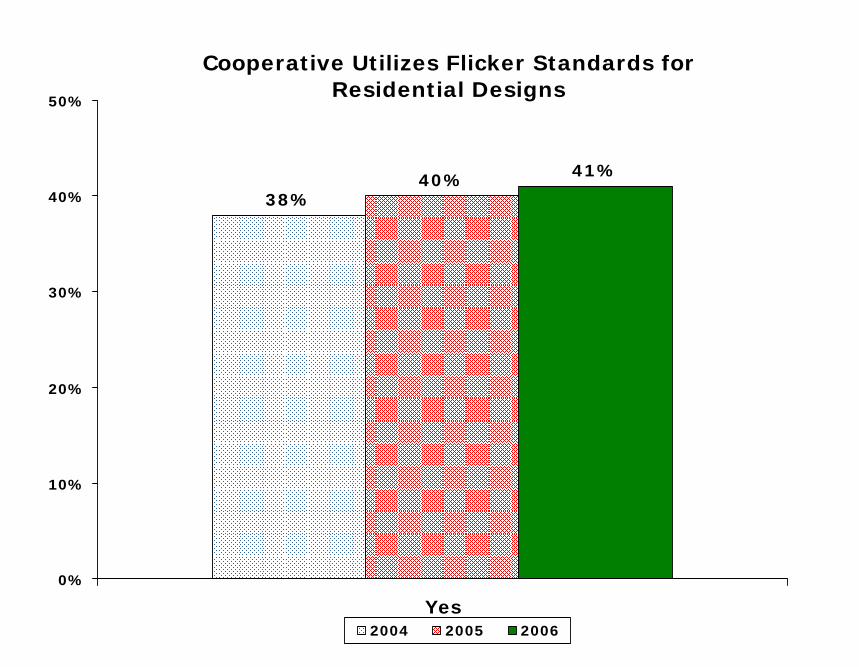
Cooperative Utilizes Flicker Standards for Residential Designs
38%40% 41%
0%
10%
20%
30%
40%
50%
Yes2004 2005 2006
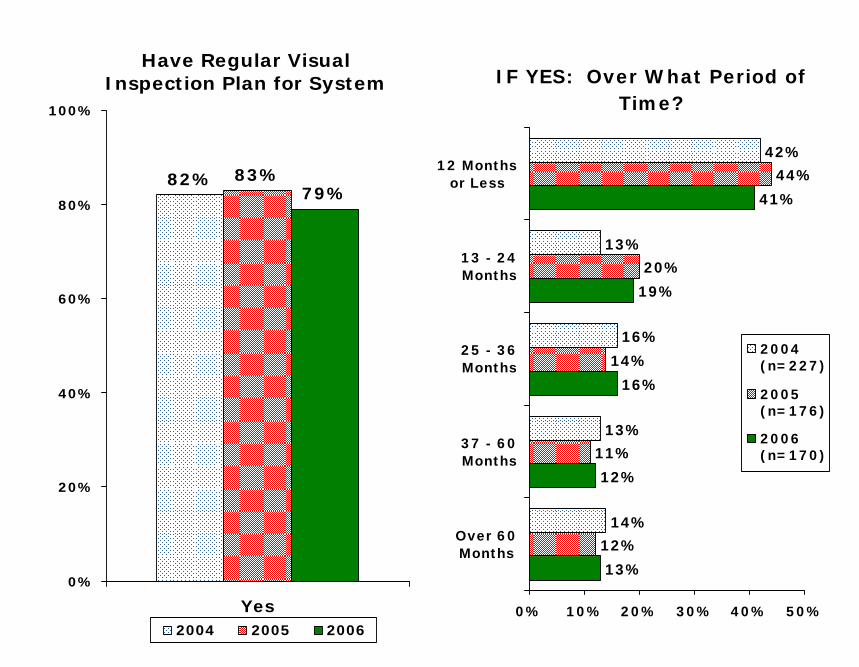
Have Regular Visual Inspection Plan for System
82% 83%79%
0%
20%
40%
60%
80%
100%
Yes2004 2005 2006
IF YES: Over What Period of Time?
13%
12%
16%
19%
41%
12%
11%
14%
20%
44%
14%
13%
16%
13%
42%
0% 10% 20% 30% 40% 50%
Over 60Months
37 - 60Months
25 - 36Months
13 - 24Months
12 Monthsor Less
2004(n=227)
2005(n=176)
2006(n=170)

Sample Profile

Subject to Regulation by State/Public Service Commission
28%30%
26%
0%
10%
20%
30%
40%
Yes
2004
2005
2006
Report Power Outages to State/Public Service
Commission
23%
26%
22%
0%
10%
20%
30%
40%
Yes

Co-op Subject To Regulation by State/PUC
26%
22%
0%
10%
20%
30%
40%
50%
I II III IV V VI VII VIII IX X TOTAL
Regulated by State/PUC Report Outages To State/PUC

Cooperative Coincident Peak LoadMean: 2004=15,176 MW 2005=13,225 MW 2006=17,653 MW
19%
17%
18%
46%
15%
17%
23%
45%
15%
19%
22%
44%
0% 10% 20% 30% 40% 50%
Over 500 MW
151 - 500 MW
76 - 150 MW
75 MW or Less
2004
2005
2006
No Response
2004 – 10%
2005 – 12%
2006 – 24%
Percentages graphed are based on those responding.

Number of Customers Per Mile of Distribution Line
18%
28%
28%
17%
26%
29%
25%
20%
25%
25%
30%
20%
0% 10% 20% 30% 40%
Over 9.0
6.1 - 9.0
3.0 - 6.0
Under 3.0 2004
2005
2006
No Response
2004 – 10%
2005 – 12%
2006 – 23%
Percentages graphed are based on those responding.

Load Breakout
79%
15%
6%
80%
13%
6%
80%
20%
0% 20% 40% 60% 80% 100%
Rural
Suburban
Urban
2004
2005
2006
In 2004, Suburban was not asked as a category
No Response:2004 – 10%2005 – 14% 2006 – 24%
Percentages graphed are based on those responding.

Percentage of Line that Is Overhead Means: 2004 - 83% 2005 - 81% 2006 - 82%
40%
30%
30%
39%
29%
32%
44%
30%
27%
0% 10% 20% 30% 40% 50%
Over 90%
76% - 90%
75% or Less
2004
2005
2006
No Response
2004 – 9%
2005 – 10%
2006 – 21%
Percentages graphed are based on those responding.

Survey Respondent Composition as Compared To National NRECA Region Breakout
0%
5%
10%
15%
I II III IV V VI VII VIII IX X
Reliability Study Nationwide Population

Survey Respondent Composition as Compared To National NRECA Breakout
-- Number of Consumers Served --
11%
18%
27%
23%
20%
16%
22%
22%
24%
16%
15%
23%
23%
22%
17%
11%
25%
23%
23%
18%
0% 5% 10% 15% 20% 25% 30%
Over 40,000
20,001 - 40,000
10,001 - 20,000
5,001 - 10,000
5,000 or Less
2004Study
2005Study
2006Study
NationalSample

Survey Respondent Composition as Compared To National NRECA Breakout
-- Three Year Growth Rate --
16%
17%
38%
29%
20%
21%
34%
26%
23%
19%
32%
26%
23%
26%
29%
22%
0% 10% 20% 30% 40%
Over 3.00%
2.01% - 3.00%
1.01% - 2.00%
1.00% Or Less
2004Study2005Study2006StudyNationalSample