metals (lead, cadmium and mercury) - helcom indicators/helcom-coreindicator-metals.pdf · mercury...
TRANSCRIPT
HELCOM Core Indicator of Hazardous Substances Metals (lead, cadmium and mercury)
© HELCOM 2013 www.helcom.fi
Page 1
Metals (lead, cadmium and mercury)
Authors
Elisabeth Nyberg, Martin M. Larsen, Anders Bignert, Elin Boalt, Sara Danielson and the CORESET expert group for
hazardous substances indicators.
Reference to this core indicator report: [Author’s name(s)], [Year]. [Title]. HELCOM Core Indicator Report. Online.
[Date Viewed], [Web link].
HELCOM Core Indicator of Hazardous Substances Metals (lead, cadmium and mercury)
© HELCOM 2013 www.helcom.fi
Page 2
Contents
Key messages ...................................................................................................................................................................... 4
Current status in the Baltic Sea ........................................................................................................................................... 5
Cadmium ......................................................................................................................................................................... 5
Mercury ........................................................................................................................................................................... 5
Lead ................................................................................................................................................................................. 5
General Information ........................................................................................................................................................... 6
General properties .......................................................................................................................................................... 6
Main impacts on the environment and human health ................................................................................................... 6
Policy relevance .................................................................................................................................................................. 6
Status of the indicator on international priority lists and other policy relevance .......................................................... 6
Status of restrictions, bans or use ................................................................................................................................... 6
Concentrations and time series of metals in the Baltic Sea ................................................................................................ 7
Concentrations of metals ................................................................................................................................................ 7
Cadmium ..................................................................................................................................................................... 7
Mercury ....................................................................................................................................................................... 9
Lead ........................................................................................................................................................................... 10
Temporal trends ............................................................................................................................................................ 13
Cadmium ................................................................................................................................................................... 13
Mercury ..................................................................................................................................................................... 13
Lead ........................................................................................................................................................................... 13
Metadata ........................................................................................................................................................................... 19
Data source ................................................................................................................................................................... 19
Description of data ........................................................................................................................................................ 19
Cadmium ................................................................................................................................................................... 19
Mercury ..................................................................................................................................................................... 20
Lead ........................................................................................................................................................................... 20
Geographic coverage .................................................................................................................................................... 21
Current monitoring network ..................................................................................................................................... 21
Geographical relevance in the monitoring of metals ................................................................................................ 22
Temporal aspects ...................................................................................................................................................... 22
Methodology and frequency of data collection ............................................................................................................ 22
Methodology of data analyses ...................................................................................................................................... 22
Preferred matrix ............................................................................................................................................................ 22
Shellfish or sediment for local surveys. ......................................................................................................................... 22
HELCOM Core Indicator of Hazardous Substances Metals (lead, cadmium and mercury)
© HELCOM 2013 www.helcom.fi
Page 3
Fish muscle (Hg) and liver (Cd, Pb) for regional surveys. .............................................................................................. 22
Determination of GES boundary ................................................................................................................................... 22
Thresholds in the time series .................................................................................................................................... 24
Strengths and weaknesses of data ................................................................................................................................ 24
Further work required ................................................................................................................................................... 24
References ........................................................................................................................................................................ 24
Annex 1. ............................................................................................................................................................................ 25
Annex 2 ............................................................................................................................................................................. 27
Metals in different parts of fish, ................................................................................................................................... 27
Conclusions ................................................................................................................................................................... 27
HELCOM Core Indicator of Hazardous Substances Metals (lead, cadmium and mercury)
© HELCOM 2013 www.helcom.fi
Page 4
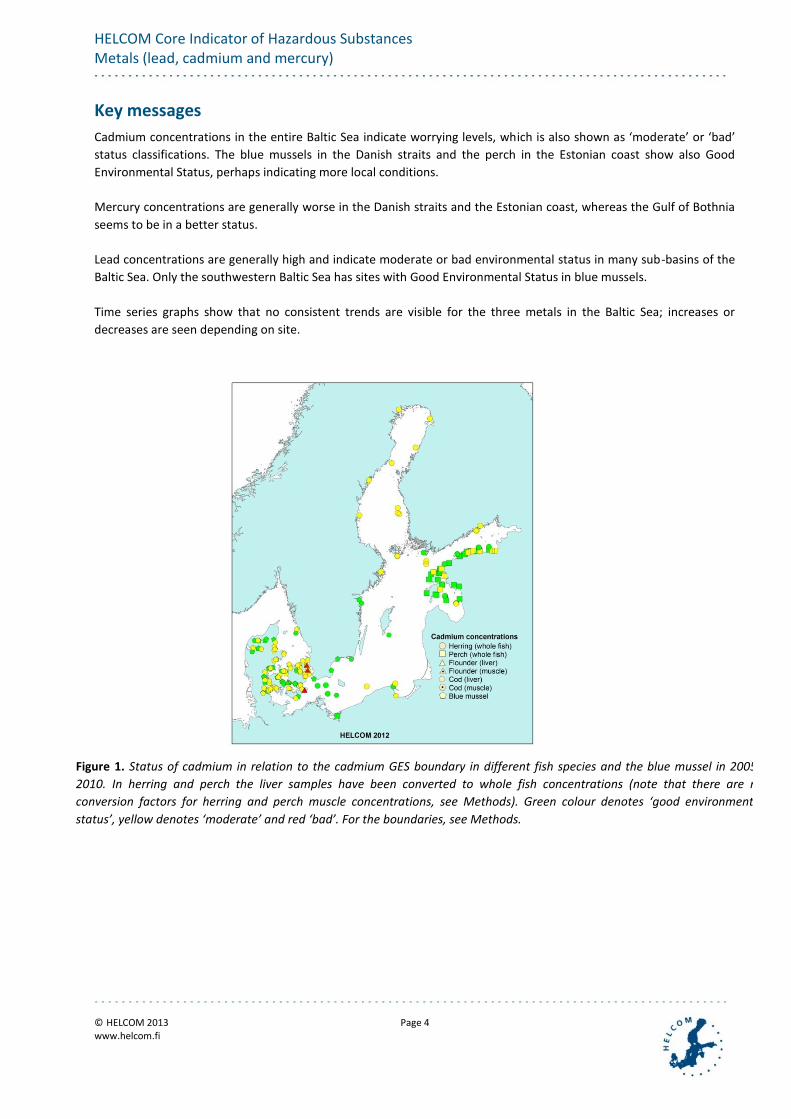
Key messages
Cadmium concentrations in the entire Baltic Sea indicate worrying levels, which is also shown as ‘moderate’ or ‘bad’
status classifications. The blue mussels in the Danish straits and the perch in the Estonian coast show also Good
Environmental Status, perhaps indicating more local conditions.
Mercury concentrations are generally worse in the Danish straits and the Estonian coast, whereas the Gulf of Bothnia
seems to be in a better status.
Lead concentrations are generally high and indicate moderate or bad environmental status in many sub-basins of the
Baltic Sea. Only the southwestern Baltic Sea has sites with Good Environmental Status in blue mussels.
Time series graphs show that no consistent trends are visible for the three metals in the Baltic Sea; increases or
decreases are seen depending on site.
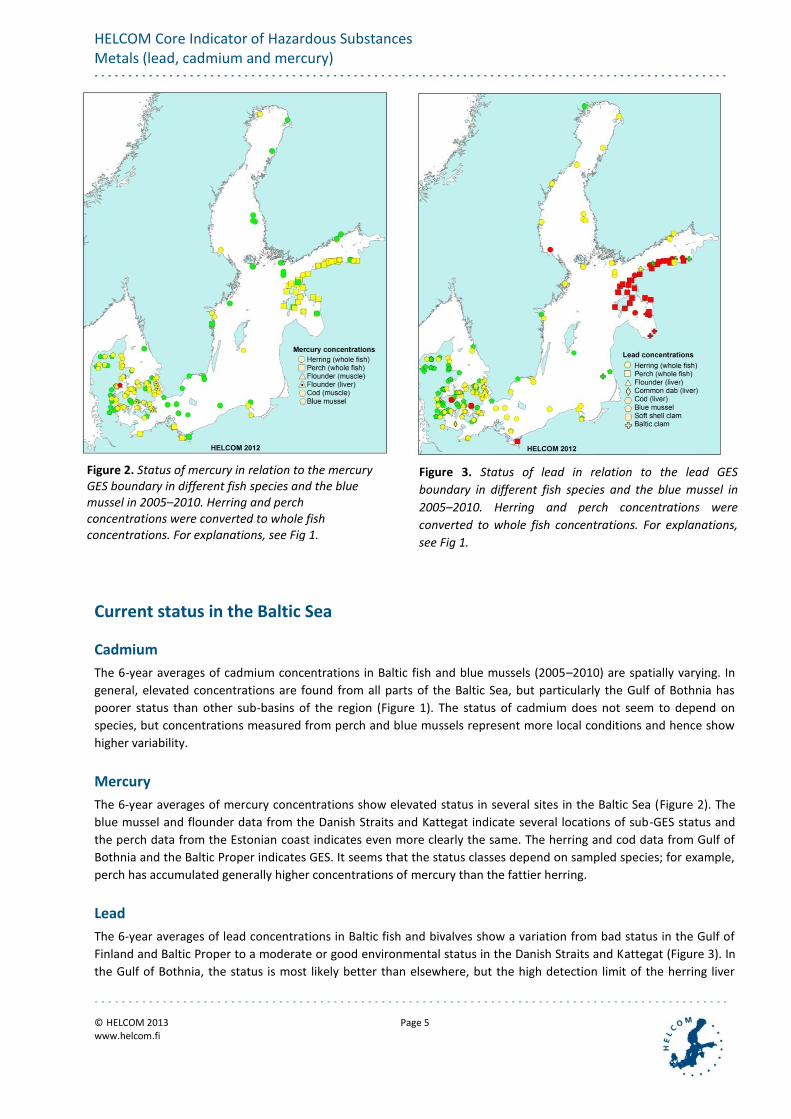
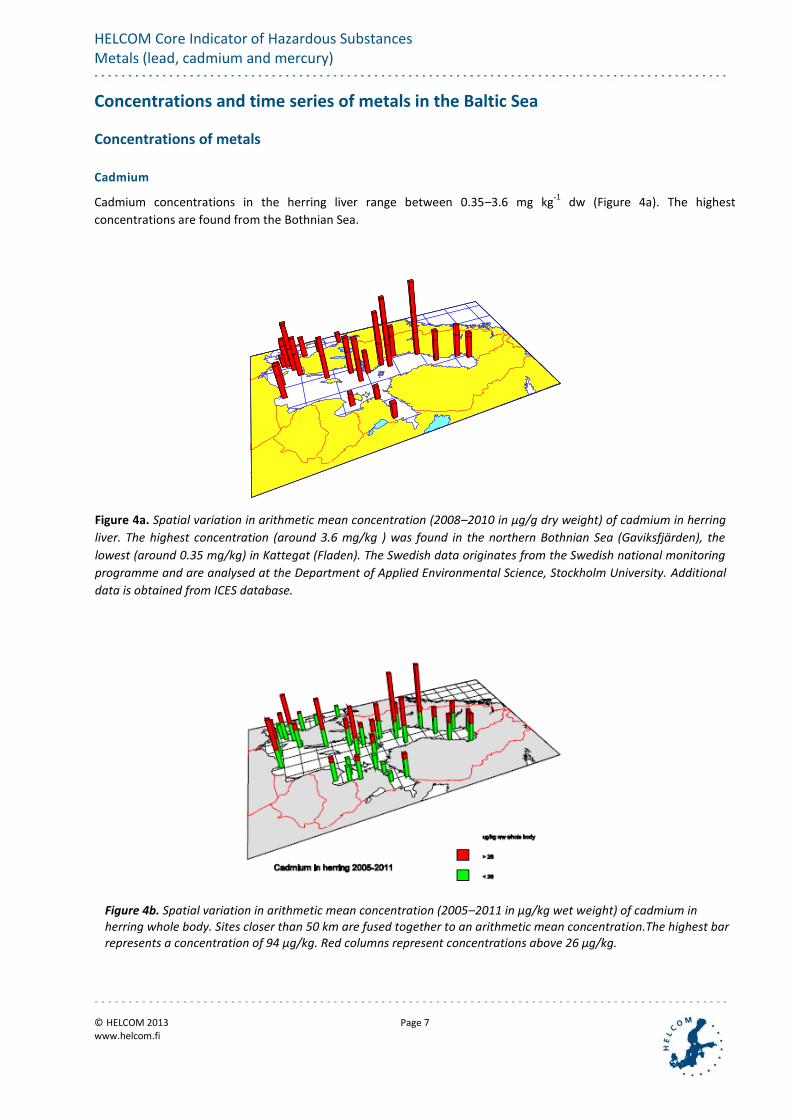
Figure 1. Status of cadmium in relation to the cadmium GES boundary in different fish species and the blue mussel in 2005–
2010. In herring and perch the liver samples have been converted to whole fish concentrations (note that there are no
conversion factors for herring and perch muscle concentrations, see Methods). Green colour denotes ‘good environmental
status’, yellow denotes ‘moderate’ and red ‘bad’. For the boundaries, see Methods.
HELCOM Core Indicator of Hazardous Substances Metals (lead, cadmium and mercury)
© HELCOM 2013 www.helcom.fi
Page 5
Current status in the Baltic Sea
Cadmium
The 6-year averages of cadmium concentrations in Baltic fish and blue mussels (2005–2010) are spatially varying. In
general, elevated concentrations are found from all parts of the Baltic Sea, but particularly the Gulf of Bothnia has
poorer status than other sub-basins of the region (Figure 1). The status of cadmium does not seem to depend on
species, but concentrations measured from perch and blue mussels represent more local conditions and hence show
higher variability.
Mercury
The 6-year averages of mercury concentrations show elevated status in several sites in the Baltic Sea (Figure 2). The
blue mussel and flounder data from the Danish Straits and Kattegat indicate several locations of sub-GES status and
the perch data from the Estonian coast indicates even more clearly the same. The herring and cod data from Gulf of
Bothnia and the Baltic Proper indicates GES. It seems that the status classes depend on sampled species; for example,
perch has accumulated generally higher concentrations of mercury than the fattier herring.
Lead
The 6-year averages of lead concentrations in Baltic fish and bivalves show a variation from bad status in the Gulf of
Finland and Baltic Proper to a moderate or good environmental status in the Danish Straits and Kattegat (Figure 3). In
the Gulf of Bothnia, the status is most likely better than elsewhere, but the high detection limit of the herring liver
Figure 2. Status of mercury in relation to the mercury GES boundary in different fish species and the blue mussel in 2005–2010. Herring and perch concentrations were converted to whole fish concentrations. For explanations, see Fig 1.
Figure 3. Status of lead in relation to the lead GES
boundary in different fish species and the blue mussel in
2005–2010. Herring and perch concentrations were
converted to whole fish concentrations. For explanations,
see Fig 1.

HELCOM Core Indicator of Hazardous Substances Metals (lead, cadmium and mercury)
© HELCOM 2013 www.helcom.fi
Page 6
samples leaves some uncertainty to the status classification in the Finnish side of the sub-basin; the status may be
better than shown in Figure 3.
General Information
General properties
Metals are naturally occurring substances that have been used by humans since the iron age. The metals Cd, Pb and
Hg are the most toxic and regulated metals today, and have no biological function. Mercury is bioaccumulated, mainly
in its organic form (Methyl-mercury) and due to high evaporation pressure can be transported from soil to the Baltic,
and concentrate in the arctic.
Main impacts on the environment and human health
Lead and mercury have been connected to impaired learning curves for children, even at small dosage. Lead can cause
increased blood preasure and cardio-vaskular problems in adults. Acute metal poisoning generally results in vomiting.
Long term exposures of high levels of lead and mercury can affect the neurological system. Mercury can lead to birth
defects as seen in Minimatta bay among fishermen in a mercury polluted area, and also after ingestion of
methylmercury treated corn in Iran. Cadmium is concentrated in the kidney, and can result in impaired kidney
function, and cadmium can exchange for calcium in bones and produce bone fractures (Itai-Itai disease).
The HELCOM thematic assessment of hazardous substances (HELCOM 2010) showed high concentrations of mercury
and cadmium in biota and sediment all over the Baltic Sea. Lead was not assessed.
Policy relevance
Status of the indicator on international priority lists and other policy relevance
Mercury and cadmium are included in the HELCOM Baltic Sea Action Plan. All the three metals are included in the EU
WFD (Pb and Cd in water, Hg in biota) and EU shellfish directive in shellfish. Part of EU food directives, limits set in a
range of fish species, shellfish and other seafood. In the OSPAR CEMP to be measured on a mandatory basis in fish,
shellfish and sediment (OSPAR 2010).
Status of restrictions, bans or use
All three metals have been used for centuries, but in the last decades have been banned for most uses. Today, the
main area of usage of cadmium and mercury is in rechargeable batteries, and for mercury additionally, low energy
light sources. Main source of all three metals are burning of fossil fuels. The air deposition is mainly long range
transport from outside the Baltic Sea catchment area (60–84 %). Sources of mercury used in amalgams for dentist
have been reduced by installing mercury traps in sinks and generally reducing amalgams in dental works, as electrodes
in paper bleaching, in thermometers and mercury switches and a range of other products that have been faced out.
Current legal use include batteries and low energy light sources. For lead, the main source was leaded fuels until their
ban in Europe in the 1990ies. Both cadmium and lead have hotspots in connection with metal processing facilities, and
cadmium is coexisting with all zinc ores, and typically present at levels of 0,5 –2 % in the final products. Weathering of
outdoor zinc-products thus leads to cadmium pollution. Current legal use of cadmium and lead includes rechargeable
Ni-Cd batteries and for lead car batteries.
HELCOM Core Indicator of Hazardous Substances Metals (lead, cadmium and mercury)
© HELCOM 2013 www.helcom.fi
Page 7
Concentrations and time series of metals in the Baltic Sea
Concentrations of metals
Cadmium
Cadmium concentrations in the herring liver range between 0.35–3.6 mg kg-1
dw (Figure 4a). The highest
concentrations are found from the Bothnian Sea.
TISS - 12.09.19 11:20, CDmedICES2012arit
Figure 4a. Spatial variation in arithmetic mean concentration (2008–2010 in µg/g dry weight) of cadmium in herring
liver. The highest concentration (around 3.6 mg/kg ) was found in the northern Bothnian Sea (Gaviksfjärden), the
lowest (around 0.35 mg/kg) in Kattegat (Fladen). The Swedish data originates from the Swedish national monitoring
programme and are analysed at the Department of Applied Environmental Science, Stockholm University. Additional
data is obtained from ICES database.
Figure 4b. Spatial variation in arithmetic mean concentration (2005–2011 in µg/kg wet weight) of cadmium in herring whole body. Sites closer than 50 km are fused together to an arithmetic mean concentration.The highest bar represents a concentration of 94 µg/kg. Red columns represent concentrations above 26 µg/kg.

HELCOM Core Indicator of Hazardous Substances Metals (lead, cadmium and mercury)
© HELCOM 2013 www.helcom.fi
Page 8
Figure 4c. Spatial variation in arithmetic mean concentration (2005–2011 in µg/kg wet weight) of cadmium in
perch whole body. Sites closer than 50 km are fused together to an arithmetic mean concentration.The highest
bar represents a concentration of 32 µg/kg. Red columns represent concentrations above 26 µg/kg.
Figure 4d. Spatial variation in arithmetic mean concentration (2005–2011 in µg/kg dry weight) of cadmium in blue mussel. The highest bar represents a value of 4 100 µg/kg dw. Red columns represent concentrations above 960 µg/kg.

HELCOM Core Indicator of Hazardous Substances Metals (lead, cadmium and mercury)
© HELCOM 2013 www.helcom.fi
Page 9
Mercury
The mercury concentrations in perch are clearly higher than in herring and somewhat higher than in blue mussels
(Figures 5–7). The concentrations are high almost everywhere in the Baltic Sea, but lower concentrations may exist in
the eastern Bothnian Sea and the Archipelago Sea. Similar result was also shown in the HELCOM Thematic Assessment
(HELCOM 2010) and by Bignert et al. (2011). The high mercury concentrations in the Bothnian Bay and eastern Gulf of
Finland are also seen in the sediment data (HELCOM 2010).
Figure 4e. Spatial variation in arithmetic mean concentration (2005–2011 in µg/kg dry weight) of cadmium in sediment. The highest bar represents a value of 2 480 µg/kg dw. Red columns represent concentrations above 960 µg/kg.
Figure 5. Concentrations of mercury (µg/kg ww) in herring muscle, converted to whole fish concentrations (see
Annex 1 of this indicator report). The green part of the bars represent a concentration of 35 µg/kg ww, which is
the EQS for fish. Sites closer than 50 km are fused together to an arithmetic mean concentration.

HELCOM Core Indicator of Hazardous Substances Metals (lead, cadmium and mercury)
© HELCOM 2013 www.helcom.fi
Page 10
Lead
Lead concentrations in herring liver are highest in the Estonian coastal waters in Gulf of Finland, Northern Baltic
Proper and Gulf of Riga (Figure 8). The lowest concentrations are from the Gulf of Bothnia.
Figure 6. Concentrations of mercury (µg/kg ww) in perch muscle, converted to whole fish concentrations (see
Annex 2 of this indicator report). The green part of the bars represent a concentration of 35 µg/kg ww, which is
the EQS for fish. Sites closer than 50 km are fused together to an arithmetic mean concentration.
Figure 7. Concentrations of mercury (µg/kg dw) in blue mussels. The green part of the bars represent a
concentration of 90 µg/kg dw, which is the EAC in blue mussels. Sites closer than 50 km are fused together to an
arithmetic mean concentration.

HELCOM Core Indicator of Hazardous Substances Metals (lead, cadmium and mercury)
© HELCOM 2013 www.helcom.fi
Page 11
TISS - 12.09.20 12:33, PBmedICES2012arit
Figure 8a. Spatial variation in arithmetic mean concentration (2008–2010 in ng/g dry weight) of lead in herring liver.
The highest concentration (around 423 ng/g ) was found in the Gulf of Riga, the lowest (around 20 ng/g) in the
Bothnian Bay (Harufjärden).The Swedish data originates from the Swedish national monitoring programme and are
analysed at the Department of Applied Environmental Science, Stockholm University. Additional data is obtained from
ICES database.
Figure 8b. Spatial variation in arithmetic mean concentration (2005–2011 in µg/gg wet weight) of lead in herring
whole body. The highest concentration of 1644 µg/kg was found in the Gulf of Riga. The green part of the bars
represent a concentration of 26 µg/kg ww.
HELCOM Core Indicator of Hazardous Substances Metals (lead, cadmium and mercury)
© HELCOM 2013 www.helcom.fi
Page 12
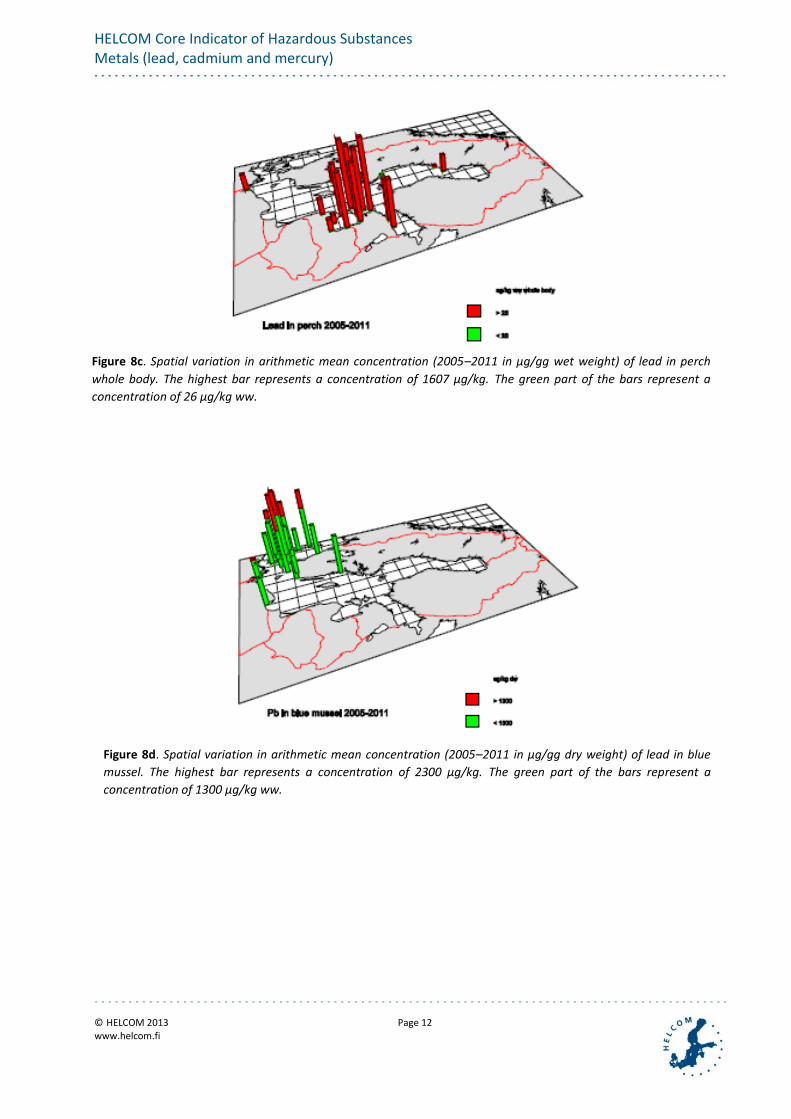
Figure 8c. Spatial variation in arithmetic mean concentration (2005–2011 in µg/gg wet weight) of lead in perch
whole body. The highest bar represents a concentration of 1607 µg/kg. The green part of the bars represent a
concentration of 26 µg/kg ww.
Figure 8d. Spatial variation in arithmetic mean concentration (2005–2011 in µg/gg dry weight) of lead in blue
mussel. The highest bar represents a concentration of 2300 µg/kg. The green part of the bars represent a
concentration of 1300 µg/kg ww.

HELCOM Core Indicator of Hazardous Substances Metals (lead, cadmium and mercury)
© HELCOM 2013 www.helcom.fi
Page 13
Temporal trends
The temporal trends for metals in biota are inconclusive, as there are both areas with increasing trends of mercury
and cadmium, and areas with decreasing trends (Figures 9–16; see also HELCOM 2010 and Jensen 2012).
Cadmium
Cadmium concentrations in herring are generally showing significant increasing trends followed by decreasing trends (Figure 9). Cadmium concentration in liver tissue from various species show coherent trends of similar magnitudes from various regions. Cadmium concentrations in cod liver samples (adjusted for varying fat content) from south east of Gotland and Fladen, however, show significant decreasing trends (Figure 10).
In general, the recent levels are not significantly lower compared to the concentrations measured at the beginning of the 80s, despite measures taken to reduce discharges of cadmium to the environment.
Mercury
There is no common general trend for mercury in herring muscle for the investigated time series. The concentration in
herring from the northern Baltic Proper seems to increase during the investigated time period until the mid-90s but
with a decreasing trend the last 15 years (Figure 11). The annual mean concentrations in herring muscle during the
investigated time period are all below 100 µg/kg except for a few years at Ängskärsklubb. The concentrations in the
eggs of Common Guillemot have decreased since 1970s (Figure 12).
The time series for autumn-caught herring from Ängskärsklubb in the Bothnian Sea shows a very large between-year
variation. Although the sampling site at Ängskärsklubb is located rather far off the coast, the mercury concentration in
the herring samples could be influenced by local discharges. Ängskärsklubb may thus not be representative of the
Bothnian Sea.
Mercury was monitored in spring-caught herring from Ängskärsklubb and Karlskrona for four years in the beginning of
the seventies, and these series were taken up again in 1996. The Ängskärsklubb time series shows significantly lower
concentrations during the recent time period compared to the concentrations in the early seventies and this decrease
is about 60%.
Lead
Lead is showing significant declining trends in almost all investigated biotic matrices of sufficient length, obviously as a
result of measures taken to reduce discharges of lead to the environment (Figures 13–16). The investigated time
Figure 8e. Spatial variation in arithmetic mean concentration (2005–2011 in µg/gg dry weight) of lead in
Macoma balthica. The highest bar represents a concentration of 1514 µg/kg. The green part of the bars
represent a concentration of 1300 µg/kg ww.

HELCOM Core Indicator of Hazardous Substances Metals (lead, cadmium and mercury)
© HELCOM 2013 www.helcom.fi
Page 14
series in herring liver show significant decreasing trends at Harufjärden (-5.9 %), Ängskärsklubb (autumn, -4.5 %),
Landsort (-5.7 %), and Utlängan (autumn, -2.8 %). Lead concentrations in cod liver (after adjusting for varying fat
content) showed decreasing trends from SE Gotland (-5.3 %) and Fladen (about –2.8 %). Perch liver from the coastal
sites Holmöarna (Bothnian Sea) and Kvädöfjärden (Baltic Proper) show decreasing concentrations of lead at an annual
rate of -8.9 % and -7.1 % respectively.
Figure 9. Temporal development of cadmium concentrations (µg kg-1
ww) in herring liver in Bothnian Bay (Harufjärden), Bothnian Sea (Ängskärsklubb), Northern Baltic Proper (Landsort) and Bornholm Basin (Utlängan). The green line denotes the GES boundary.

HELCOM Core Indicator of Hazardous Substances Metals (lead, cadmium and mercury)
© HELCOM 2013 www.helcom.fi
Page 15
Figure 10. Temporal trends of cadmium concentration (mg kg-1
dry weight) in cod liver (1981–2010) from the Eastern
Gotland Basin (SE Gotland) and from Kattegatt (Fladen). The red linear lines and dashed light blue linear line presented in
the figures are based on a log-linear regression analysis. The red lines shows decreasing trends of -4.8 and -3.0 % per year
respectively (p<0.05) and the light blue line shows an increasing trend for the last ten years (0.05<p<0.15). The red non-
linear line (p<0.05) and the dashed blue non-linear line (0.05<p<0.1) are simple 3-point running mean smoothers fitted to
the annual geometric mean values. The horizontal line is the mean concentration over the whole period. A red cross
represents a suspected outlier.
HELCOM Core Indicator of Hazardous Substances Metals (lead, cadmium and mercury)
© HELCOM 2013 www.helcom.fi
Page 16
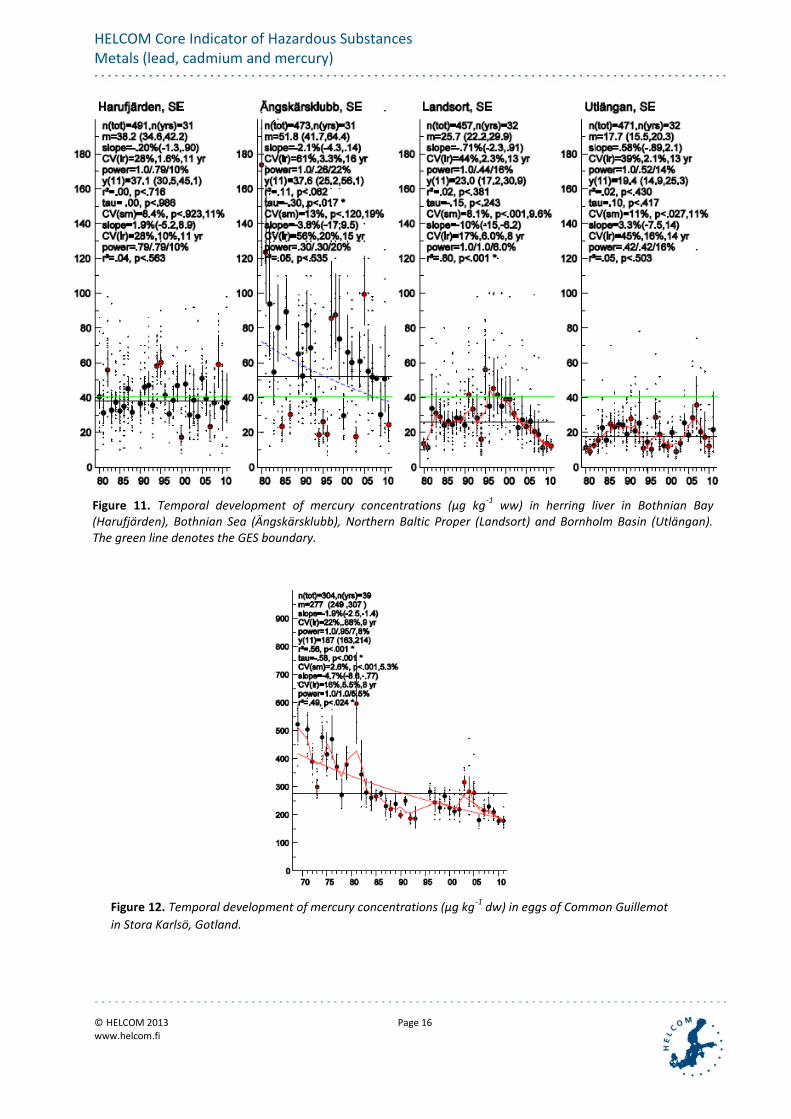
Figure 11. Temporal development of mercury concentrations (µg kg-1
ww) in herring liver in Bothnian Bay (Harufjärden), Bothnian Sea (Ängskärsklubb), Northern Baltic Proper (Landsort) and Bornholm Basin (Utlängan). The green line denotes the GES boundary.
Figure 12. Temporal development of mercury concentrations (µg kg-1
dw) in eggs of Common Guillemot
in Stora Karlsö, Gotland.

HELCOM Core Indicator of Hazardous Substances Metals (lead, cadmium and mercury)
© HELCOM 2013 www.helcom.fi
Page 17
Figure 13. Lead concentrations (µg/kg ww) in herring liver in Bothnian Bay (Harufjärden), Bothnian Sea
(Ängskärsklubb), Northern Baltic Proper (Landsort) and Bornholm Basin (Utlängan) between 1981–2010. The
linear red lines (p<0.05) and dashed light blue lines (0.05<p<0.15) presented in the figures are based on a log-
linear regression analyses and the red lines show decreasing trends of about 3–6 % per year for the whole time
period. Decreasing trends for the last ten years are indicated at a majority of the sites. The non-linear red line
(p<0.05) and the dashed blue line (0.05<p<0.1) are simple 3-point running mean smoothers fitted to the annual
geometric mean values. The horizontal line is the mean concentration of the analysed period. A red cross
represents a suspected outlier.The green line denotes the GES boundary.
HELCOM Core Indicator of Hazardous Substances Metals (lead, cadmium and mercury)
© HELCOM 2013 www.helcom.fi
Page 18
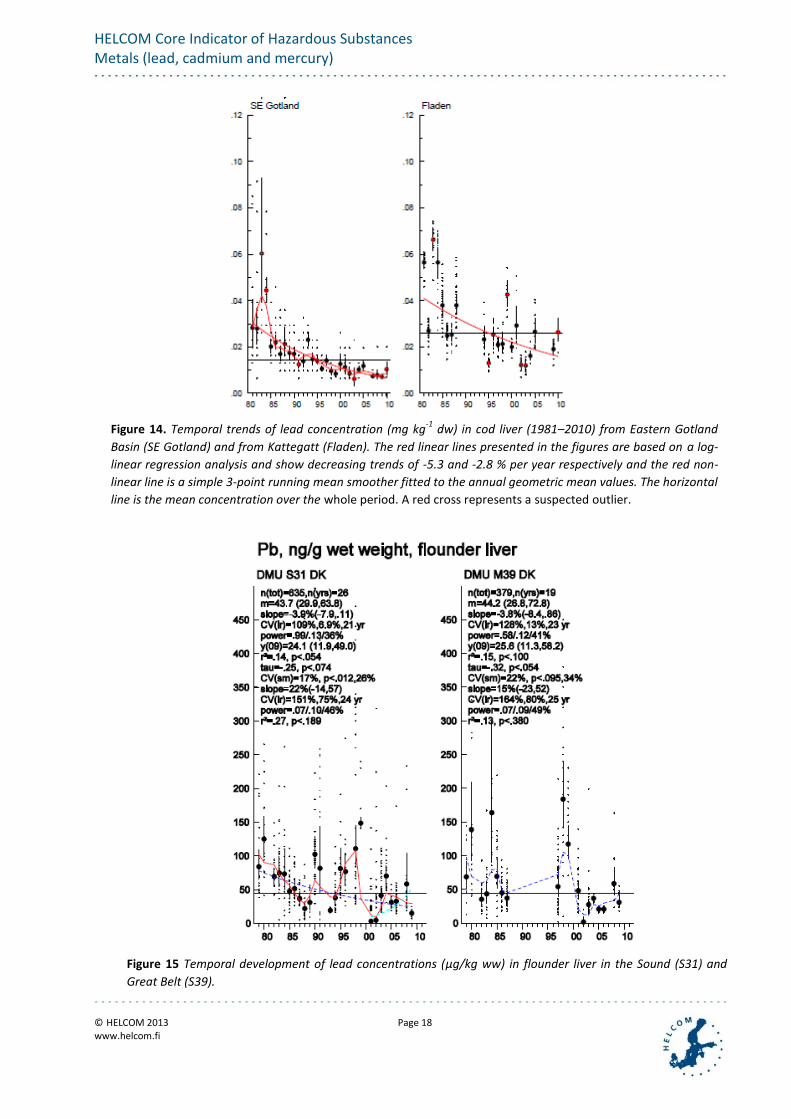
Figure 14. Temporal trends of lead concentration (mg kg-1
dw) in cod liver (1981–2010) from Eastern Gotland
Basin (SE Gotland) and from Kattegatt (Fladen). The red linear lines presented in the figures are based on a log-
linear regression analysis and show decreasing trends of -5.3 and -2.8 % per year respectively and the red non-
linear line is a simple 3-point running mean smoother fitted to the annual geometric mean values. The horizontal
line is the mean concentration over the whole period. A red cross represents a suspected outlier.
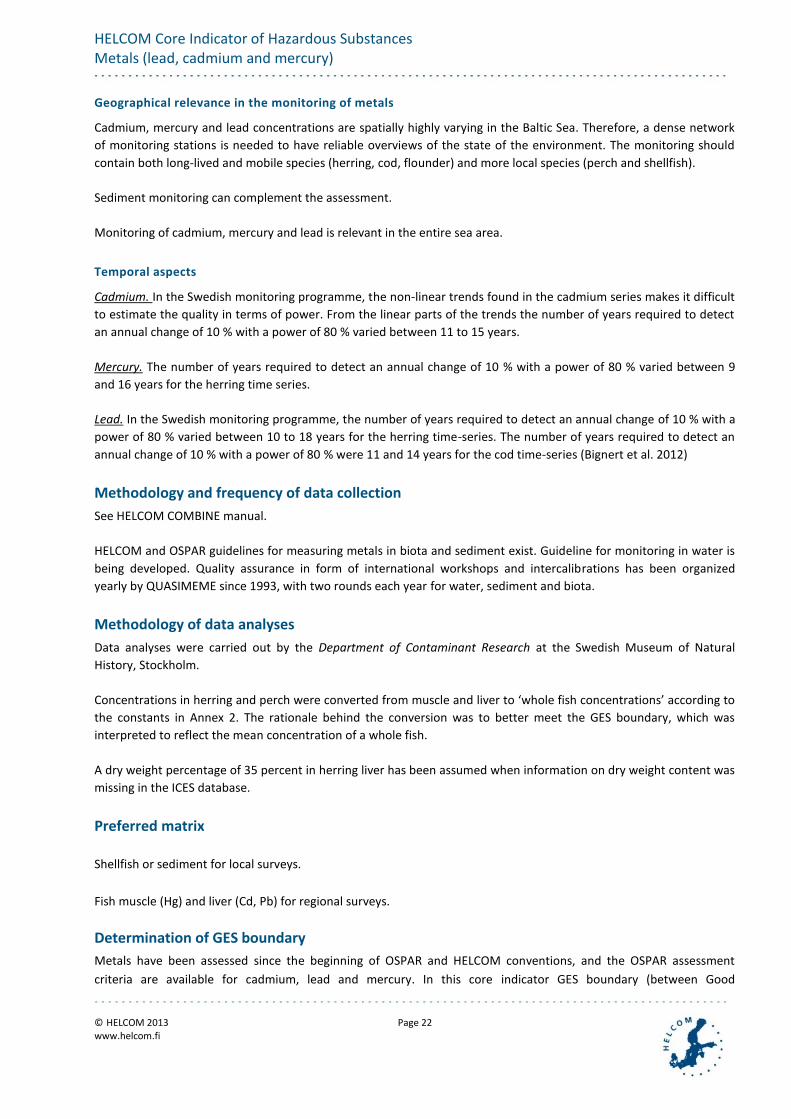
Figure 15 Temporal development of lead concentrations (µg/kg ww) in flounder liver in the Sound (S31) and
Great Belt (S39).

HELCOM Core Indicator of Hazardous Substances Metals (lead, cadmium and mercury)
© HELCOM 2013 www.helcom.fi
Page 19
Metadata
Data source
ICES database of the monitoring data of the HELCOM Contracting Parties, complemented by the EIONET database and
National Swedish Monitoring Programme of Contaminants in Biota Description of data
Description of data
The average of the time period 2005–2010 was used to produce the status maps. Conversions of data to wet-weight –
based or dry-weight -based concentrations were made by the lipid weight or dry weight percentage to have the same
unit as the GES boundary.
For time series graphs: stations with long time series were selected. If data was in similar format per station, no
conversion was made. As station names have changed in long time series and sampling per station name varies
spatially a bit, the values were aggregated per 0.1 degree square.
Cadmium
Trend (in %) assessed from the annual geometric mean of concentrations of cadmium (µg/g dry weight) in various
matrices and sites during the time period 1981–2010 and the estimated mean concentration for the last year (2010).
The trend is reported, if p<0.1. The age interval, the total number of analyses and the number of years are also
presented. The numbers presented in brackets are the 95 % confidence intervals.
Figure 16. Temporal development of lead concentrations (µg/kg dw) in eggs of Common Guillemot in Stora
Karlsö, Gotland

HELCOM Core Indicator of Hazardous Substances Metals (lead, cadmium and mercury)
© HELCOM 2013 www.helcom.fi
Page 20
Matrix age n analyses n yrs year trend (95 % ci) mean concentration of last year (95 % ci)
Herring liver
Harufjärden 3–5 459 29 81–10 1.2 (.90-1.6)
Ängskärsklubb 3–5 452 29 81–10 1.4 (.96-2.0)
Landsort 3–5 445 30 81–10 1.6 (1.3-2.1)
Utlängan 3–4 444 30 81–10 1.4 (.12, 2.7)* 1.8 (1.4-2.2)
Fladen 2–3 527 30 81–10 .39 (.32-.46
Cod liver
SE Gotland 3–4 393 23 81–10 -4.8 (-6.6,-3.0)* .015 (.011-.021)
Fladen 2–4 334 23 81–10 -3.0 (-5.5,.43) .058 (.037-.0898)
* significant trend, p < 0.05.
Mercury
Trend (in %) assessed from the annual geometric mean of concentrations of mercury (ng/g fresh weight) in various
matrices and sites during the time period 1971/80-2010 and the estimated mean concentration for the last year
(2010). The trend is reported, if p<0.1. The age interval, the total number of analyses and the number of years are also
presented. The numbers presented in brackets are the 95% confidence intervals.
Matrix age n analyses
n yrs year trend (95 % ci) mean concentration of last year (95 % ci)
Herring muscle
Harufjärden 3–5 479 30 80–10 37 (30–46)
Ängskärsklubb 3–5 461 30 80–10 41 (27–61)
Ängskärsklubb, spring
234 19 72–10 -2.5 (-3.4,-1.6)* 23 (19–26)
Landsort 3–5 451 31 80–10 25 (19–34)
Utlängan 2–4 466 31 80–10 19 (15–25)
Utlängan, spring 232 18 72–10 -.73 (-1.6,-.12) 19 (16–22)
significant trend, p < 0.05
Lead
Trend (in %) assessed from the annual geometric mean of concentrations of lead (µg/g dry weight) in various matrices
and sites during the time period 1981-2010 and the estimated mean concentration for the last year (2010). The trend
is reported, if p<0.1. The age interval, the total number of analyses and the number of years are also presented. The
numbers presented in brackets are the 95% confidence intervals.

HELCOM Core Indicator of Hazardous Substances Metals (lead, cadmium and mercury)
© HELCOM 2013 www.helcom.fi
Page 21
Matrix age n analyses
n yrs year trend (95 % ci) mean concentration of last year (95 % ci)
Herring liver
Harufjärden 3–5 439 28 81–10 -5.9 (-9.0, -2.8)* .029 (.017–.048)
Ängskärsklubb 3–5 441 28 81–10 -4.5 (-5.8, -3.2)* .050 (.040-.0622)
Landsort 3–5 445 30 81–10 -5.7 (-6.8,-4.6)* .045 (.038–.055)
Utlängan 2–4 432 29 81–10 -2.8 (-4.0, -1.6)* .085 (.069–.10)
Cod liver
SE Gotland 3–4 402 29 81–10 -5.3 (-6.6,-4.0)* .007 (.005–.008)
Fladen 2–4 470 31 81–10 -2.8 (-4.8,-.87)* .016 (.011–.022)
Perch liver
Holmöarna 3–7 150 15 95–10 -8.9(-15,-2.9)* .008 (.004–.013)
Kvädöfjärden 3–7 135 15 95–10 -7.1(-12,-2.1)* .010 (.007–.016)
* significant trend, p < 0.05
Geographic coverage
Current monitoring network
Cadmium, mercury and lead are being monitored in all the Baltic Sea countries. In addition to long-term monitoring
stations of herring, cod, perch, flounder and eelpout, there is a fairly dense grid of monitoring stations for mussels and
perch at the shoreline, but very few stations in the open Baltic Sea. The monitoring is, however, considered as
representative.
Annex 1 gives an overview of the current monitoring.
HELCOM Core Indicator of Hazardous Substances Metals (lead, cadmium and mercury)
© HELCOM 2013 www.helcom.fi
Page 22
Geographical relevance in the monitoring of metals
Cadmium, mercury and lead concentrations are spatially highly varying in the Baltic Sea. Therefore, a dense network
of monitoring stations is needed to have reliable overviews of the state of the environment. The monitoring should
contain both long-lived and mobile species (herring, cod, flounder) and more local species (perch and shellfish).
Sediment monitoring can complement the assessment.
Monitoring of cadmium, mercury and lead is relevant in the entire sea area.
Temporal aspects
Cadmium. In the Swedish monitoring programme, the non-linear trends found in the cadmium series makes it difficult
to estimate the quality in terms of power. From the linear parts of the trends the number of years required to detect
an annual change of 10 % with a power of 80 % varied between 11 to 15 years.
Mercury. The number of years required to detect an annual change of 10 % with a power of 80 % varied between 9
and 16 years for the herring time series.
Lead. In the Swedish monitoring programme, the number of years required to detect an annual change of 10 % with a
power of 80 % varied between 10 to 18 years for the herring time-series. The number of years required to detect an
annual change of 10 % with a power of 80 % were 11 and 14 years for the cod time-series (Bignert et al. 2012)
Methodology and frequency of data collection
See HELCOM COMBINE manual.
HELCOM and OSPAR guidelines for measuring metals in biota and sediment exist. Guideline for monitoring in water is
being developed. Quality assurance in form of international workshops and intercalibrations has been organized
yearly by QUASIMEME since 1993, with two rounds each year for water, sediment and biota.
Methodology of data analyses
Data analyses were carried out by the Department of Contaminant Research at the Swedish Museum of Natural
History, Stockholm.
Concentrations in herring and perch were converted from muscle and liver to ‘whole fish concentrations’ according to
the constants in Annex 2. The rationale behind the conversion was to better meet the GES boundary, which was
interpreted to reflect the mean concentration of a whole fish.
A dry weight percentage of 35 percent in herring liver has been assumed when information on dry weight content was
missing in the ICES database.
Preferred matrix
Shellfish or sediment for local surveys.
Fish muscle (Hg) and liver (Cd, Pb) for regional surveys.
Determination of GES boundary
Metals have been assessed since the beginning of OSPAR and HELCOM conventions, and the OSPAR assessment
criteria are available for cadmium, lead and mercury. In this core indicator GES boundary (between Good
HELCOM Core Indicator of Hazardous Substances Metals (lead, cadmium and mercury)
© HELCOM 2013 www.helcom.fi
Page 23
Environmental Status and a ‘moderate status’) is the Background Assessment Criterion (BAC) of OSPAR (2009). The
reason for the use of BACs instead of OSPAR Environmental Assessment Critaria (EAC), is that EACs – which ensure
that no chronic effects occur below that level – are (EACs for Cd and Pb in sediment, Hg in mussels and Hg and Cd in
fish) actually lower than BACs for metals in fish. Following the decision for the OSPAR Quality Status Report 2010 (see
Law et al. 2010 for discussion), also HELCOM core indicators will use BACs for all three metals as GES boundaries.
The threshold concentration to indicate a ‘bad status’ in mussels and fish is the Food Safety Limit of European Union
(EU/1881/2006) and in sediment the Effect-Range –low (ERL) value from US EPA (see OSPAR 2009). The EU food safety
limits are meant for fish meat (i.e. muscle samples) only and therefore the liver concentrations, which are higher than
muscle concentrations, follow the food safety limits of bivalves. This follows the OSPAR (2010) approach (see Law et
al. 2010 for discussion).
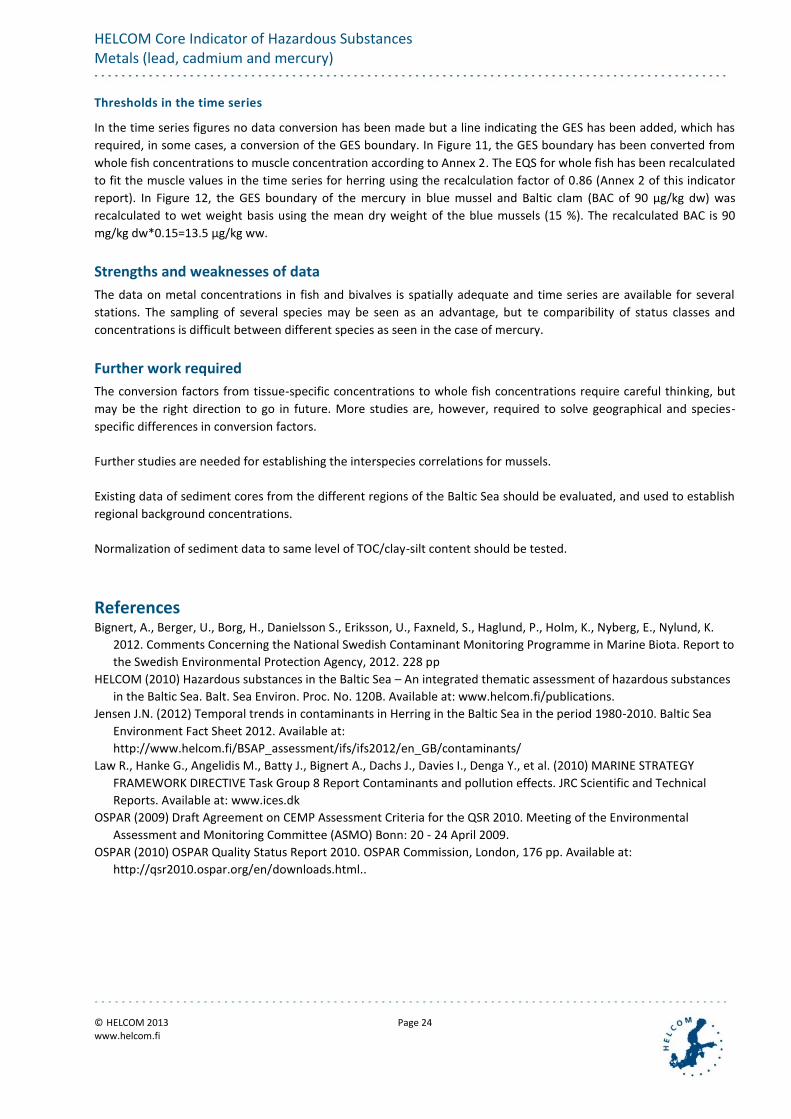
Table 1. Assessment criteria of this core indicator for cadmium, mercury and lead.
Sediment
(µg/kg dry weight)
Mussels
(µg/kg dry weight)
Fish
(µg/kg wet weight)
GES boundary
ERL GES boundary
EU food GES boundary
EU food
Cd 310 5 1200 960 5000 1 26 Muscle: 50 (100 3) Liver: 1000 2
Hg 70 5 150 90 2500 1 35 Muscle: 500 (1000 4)
Pb 38000 5 47000 1300 7500 1 26 Muscle: 300 Liver: 1500 2
1) converted from 1881/2006/EU by the factor 5 (see OSPAR 2009, Law et al. 2010),
2) bivalve value, see Law et al. 2010
for discussion, 3)
eel, 4)
pike and eel, 5)
BACs are normalized to 5% Aluminium.
Table 2. EU environmental quality standards for metals (EC proposal to the revised EQS Directive).
Water
(µg/l)
Biota
(µg/kg wet weight)
Sediment
(µg/kg dry weight)
AA-EQS Mac-EQS AA-EQS Mac-EQS AA-EQS Mac-EQS
Cd 0.08–0.25/ 0.2
0.45 – 1.5 n.a. n.a. n.a. n.a.
Hg 0.05 1 0.07 20 2 n.a. n.a. n.a.
Pb 1.3 14 n.a. n.a. n.a. n.a. 1)
If memberstates don’t use biota AA-EQS, the water AA-EQS should have the same protection power as the biota AA-
EQS. 2)
one can add the background concentration.
n.a.: Not applicable
Shellfish are available in the whole of the HELCOM area, but assessment criteria are based on Mytilus edulis, available
in the more saline parts. The GES boundary values for other species should be verified against Mytilus edulis, and it
should also be noted that different Mytilus species exists in the Baltic Sea (Mytilus trossulus), that is more adapted to
low salinity waters. Other species used for monitoring is Macoma baltica.
The EU directive on environmental quality standards (2008/105/EC), Article 3, states that also long-term temporal
trends should be assessed for substances that accumulate in sediment and/or biota.
HELCOM Core Indicator of Hazardous Substances Metals (lead, cadmium and mercury)
© HELCOM 2013 www.helcom.fi
Page 24
Thresholds in the time series
In the time series figures no data conversion has been made but a line indicating the GES has been added, which has
required, in some cases, a conversion of the GES boundary. In Figure 11, the GES boundary has been converted from
whole fish concentrations to muscle concentration according to Annex 2. The EQS for whole fish has been recalculated
to fit the muscle values in the time series for herring using the recalculation factor of 0.86 (Annex 2 of this indicator
report). In Figure 12, the GES boundary of the mercury in blue mussel and Baltic clam (BAC of 90 µg/kg dw) was
recalculated to wet weight basis using the mean dry weight of the blue mussels (15 %). The recalculated BAC is 90
mg/kg dw*0.15=13.5 µg/kg ww.
Strengths and weaknesses of data
The data on metal concentrations in fish and bivalves is spatially adequate and time series are available for several
stations. The sampling of several species may be seen as an advantage, but te comparibility of status classes and
concentrations is difficult between different species as seen in the case of mercury.
Further work required
The conversion factors from tissue-specific concentrations to whole fish concentrations require careful thinking, but
may be the right direction to go in future. More studies are, however, required to solve geographical and species-
specific differences in conversion factors.
Further studies are needed for establishing the interspecies correlations for mussels.
Existing data of sediment cores from the different regions of the Baltic Sea should be evaluated, and used to establish
regional background concentrations.
Normalization of sediment data to same level of TOC/clay-silt content should be tested.
References Bignert, A., Berger, U., Borg, H., Danielsson S., Eriksson, U., Faxneld, S., Haglund, P., Holm, K., Nyberg, E., Nylund, K.
2012. Comments Concerning the National Swedish Contaminant Monitoring Programme in Marine Biota. Report to
the Swedish Environmental Protection Agency, 2012. 228 pp
HELCOM (2010) Hazardous substances in the Baltic Sea – An integrated thematic assessment of hazardous substances
in the Baltic Sea. Balt. Sea Environ. Proc. No. 120B. Available at: www.helcom.fi/publications.
Jensen J.N. (2012) Temporal trends in contaminants in Herring in the Baltic Sea in the period 1980-2010. Baltic Sea
Environment Fact Sheet 2012. Available at:
http://www.helcom.fi/BSAP_assessment/ifs/ifs2012/en_GB/contaminants/
Law R., Hanke G., Angelidis M., Batty J., Bignert A., Dachs J., Davies I., Denga Y., et al. (2010) MARINE STRATEGY
FRAMEWORK DIRECTIVE Task Group 8 Report Contaminants and pollution effects. JRC Scientific and Technical
Reports. Available at: www.ices.dk
OSPAR (2009) Draft Agreement on CEMP Assessment Criteria for the QSR 2010. Meeting of the Environmental
Assessment and Monitoring Committee (ASMO) Bonn: 20 - 24 April 2009.
OSPAR (2010) OSPAR Quality Status Report 2010. OSPAR Commission, London, 176 pp. Available at:
http://qsr2010.ospar.org/en/downloads.html..
HELCOM Core Indicator of Hazardous Substances Metals (lead, cadmium and mercury)
© HELCOM 2013 www.helcom.fi
Page 25
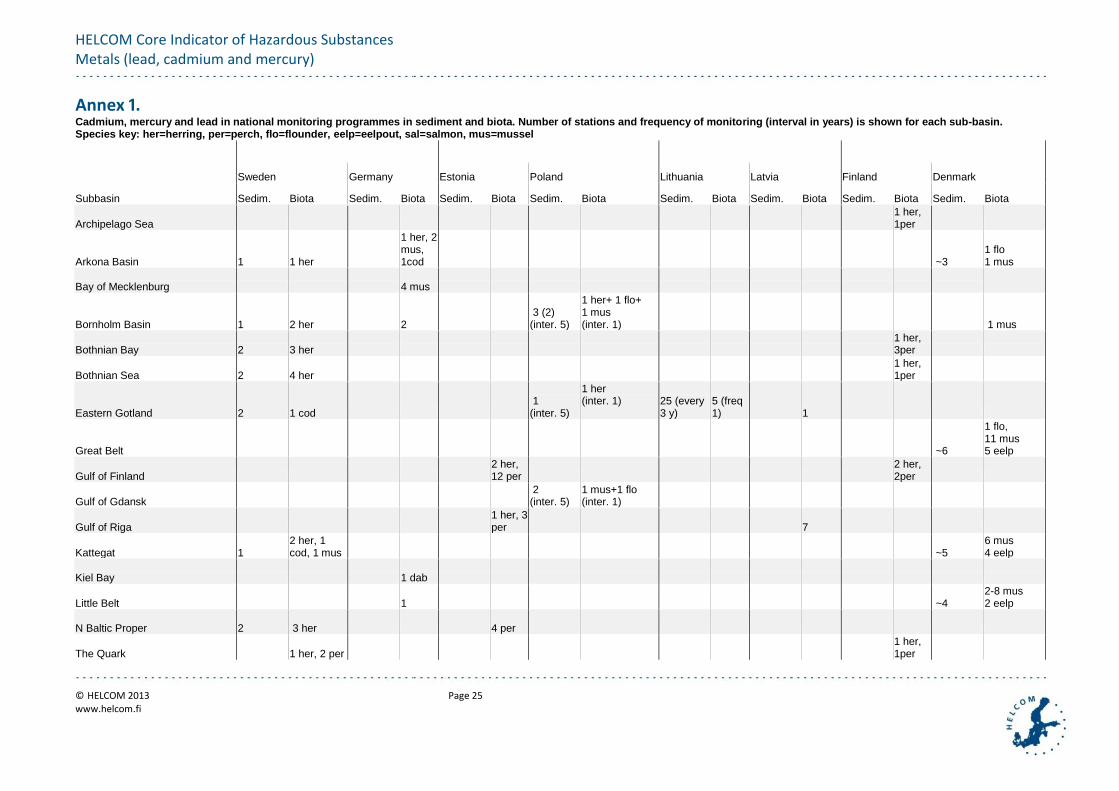
Annex 1. Cadmium, mercury and lead in national monitoring programmes in sediment and biota. Number of stations and frequency of monitoring (interval in years) is shown for each sub-basin. Species key: her=herring, per=perch, flo=flounder, eelp=eelpout, sal=salmon, mus=mussel
Sweden Germany Estonia Poland Lithuania Latvia Finland Denmark
Subbasin Sedim. Biota Sedim. Biota Sedim. Biota Sedim. Biota Sedim. Biota Sedim. Biota Sedim. Biota Sedim. Biota
Archipelago Sea 1 her, 1per
Arkona Basin 1 1 her
1 her, 2 mus, 1cod ~3
1 flo 1 mus
Bay of Mecklenburg 4 mus
Bornholm Basin 1 2 her 2 3 (2) (inter. 5)
1 her+ 1 flo+ 1 mus (inter. 1) 1 mus
Bothnian Bay 2 3 her 1 her, 3per
Bothnian Sea 2 4 her 1 her, 1per
Eastern Gotland 2 1 cod 1 (inter. 5)
1 her (inter. 1)
25 (every 3 y)
5 (freq 1) 1
Great Belt ~6
1 flo, 11 mus 5 eelp
Gulf of Finland 2 her, 12 per
2 her, 2per
Gulf of Gdansk 2 (inter. 5)
1 mus+1 flo (inter. 1)
Gulf of Riga 1 her, 3 per 7
Kattegat 1 2 her, 1 cod, 1 mus ~5
6 mus 4 eelp
Kiel Bay 1 dab
Little Belt 1 ~4 2-8 mus 2 eelp
N Baltic Proper 2 3 her 4 per
The Quark 1 her, 2 per 1 her, 1per

HELCOM Core Indicator of Hazardous Substances Metals (lead, cadmium and mercury)
© HELCOM 2013 www.helcom.fi
Page 26
The Sound ~2 1 flo, Xmus
Western Gotland 2
1 her, 1 mus, 1 eel, 1 per, 1 bird
Åland Sea 1

HELCOM Core Indicator of Hazardous Substances Metals (lead, cadmium and mercury)
© HELCOM 2013 www.helcom.fi
Page 27
Annex 2
Metals in different parts of fish,
In the report “Cadmium, lead, and mercury concentrations in whole-fish, liver, and muscle concentrations of herring
(Clupea harengus) and perch (Perca fluviatilis)”, many concentrations for lead and cadmium were reported below the
level of quantification. This lead to overestimations of concentrations in the liver and muscle and influenced the
conversion factors (Table 1). As chemical concentrations of cadmium in the muscle are expected to be low this may be
a more pronounced problem for the conversion factors for liver. The aim of this Annex is to use data material for liver
and muscle concentrations in herring and perch from previous studies conducted the Department of Contaminant
Research at NRM.
Estimates of whole-fish concentrations are based on carcass homogenate concentrations from herring and perch
collected from Gaviksfjärden in the autumn 2011, liver concentrations from herring and perch at Harufjärden (herring)
and Kvädöfjärden (perch) collected in the autumn 2009 and 2010. Muscle concentrations are from herring at
Harufjärden and perch at Kvädöfjärden collected in the autumn 2000-2006. As some of the data sets are based on
pooled samples, averages for all weights and concentrations were used. Concentrations below detection limit are
estimated as reported concentrations divided by two. All concentrations and calculations are based on concentrations
expressed as µg/g (mg/kg) dry weight (DW). DW% for perch muscles at Kvädöfjärden were not available, instead DW%
from the Gaviksfjärdens data was used. Whole-fish concentrations were estimated using the following formula:
Cwf = (Cc*Wc + Cl*Wl + Cm*Wm)/(Wc+Wl+Wm)
There were no significant correlations between carcass and liver concentrations and fish age, body weight or length.
No such biological data was available for the data set from which the muscle concentrations were collected. Results
are provided in table 2.
Conclusions
We recommend that metal conversion factors between different organs are based on a combination of results (Table
3). Conversion factors between whole fish / liver for cadmium and lead as well as between whole fish and muscle for
mercury are based on individual samples from one station and one year (Table 1). (These values differ slightly from
results presented in “Cadmium, lead, and mercury concentrations in whole-fish, liver, and muscle concentrations of
herring (Clupea harengus) and perch (Perca fluviatilis)”, as the values have been recalculated on a dry weight basis).
Conversion factors between whole fish / liver concentrations for cadmium and lead in herring and perch are based on
pooled sampled means from various geographic location and years (Table 2). The latter should be regarded as
temporary and can hopefully be improved.
Table A1. Conversion factors between whole fish to liver and muscle concentrations for cadmium, mercury, and lead in
herring and perch. Based on individual samples from one station and one year. Conversion factors for lead whole
fish/liver are probably biased due lots of levels below quantification.
Conversion factors from liver or muscle to whole-fish concentrations
Whole fish/liver Whole fish/muscle
Species Cadmium Mercury Lead Mercury
Herring 0.11 0.52 1.07 0.86
Perch 0.16 1.63 2.96 0.72

HELCOM Core Indicator of Hazardous Substances Metals (lead, cadmium and mercury)
© HELCOM 2013 www.helcom.fi
Page 28
Table A2. Conversion factors between whole fish to liver and muscle concentrations for cadmium and lead in herring
and perch. Based on pooled sampled means from various geographic location and years.
Conversion factors from liver to whole-fish concentrations
Species Whole fish/liver
Cadmium Lead
Herring 0.08 4.58
Perch 0.11 12.18
Table A3. Conversion factors between whole fish, liver, and muscle concentrations for cadmium and lead in herring
and perch. Factors for cadmium and mercury are based on individual samples from one station and one year. Factors
for lead are based on pooled sampled means from various geographic location and years and should be regarded as
temporary.
Conversion factors from liver or muscle to whole-fish concentrations
Whole fish/liver Whole fish/muscle
Species Cadmium Mercury Lead Mercury
Herring 0.11 0.52 4.58 0,86
Perch 0.16 1.63 12.18 0.72