the genetic architecture of cadmium and mercury
TRANSCRIPT
The genetic architecture of cadmium and mercury accumulation and tolerance in the model legume Medicago truncatula
Master Thesis in Plant Biology
Benjamin Heiniger
15. May 2020
Supervised by
Dr. Timothy Paape
University of Zürich

1
Contents
1 Cadmium and mercury accumulation and tolerance ..............................................................................3
1.1 Abstract ..........................................................................................................................................3
1.2 Introduction ....................................................................................................................................4
1.3 Material and Methods .....................................................................................................................7
1.3.1 Phenotype Data .......................................................................................................................7
1.3.2 SNP Data ................................................................................................................................7
1.3.3 Population Structure ...............................................................................................................8
1.3.4 Association mapping ..............................................................................................................9
1.3.5 Correlation between minor allele frequency and effect size ..................................................9
1.3.6 Genomic divergence based on phenotype differences ..........................................................10
1.4 Results ..........................................................................................................................................11
1.4.1 High genotypic variation and heritability .............................................................................11
1.4.2 Variant calling on additional high accumulation accessions lead to high coverage .............12
1.4.3 Population structure analysis identified five admixture components ...................................13
1.4.4 Genome-wide association mapping identified genomic regions and candidate genes .........14
1.4.5 Regions of genomic differentiation are enriched in metal ion binding and transport ..........23
1.4.6 Correlation between minor allele frequency and effect size significant for Cd leaf ............26
1.5 Discussion.....................................................................................................................................30
1.5.1 Standing genetic variation and heritability ...........................................................................30
1.5.2 Population structure analysis lead to new estimate of admixture components .....................31
1.5.3 Genome-wide association mapping identified candidate genes ...........................................32
1.5.4 Correlation between minor allele frequency and effect size implies selection .....................35
1.5.5 Regions of genomic differentiation complement genome-wide association mapping .........36
2 Introgression .........................................................................................................................................38
2.1 Introduction ..................................................................................................................................38

2
2.2 Material and Methods ...................................................................................................................39
2.3 Results and Discussion .................................................................................................................39
3 References ............................................................................................................................................41

3
1 Cadmium and mercury accumulation and tolerance
1.1 Abstract
Soil-borne heavy metals are an increasing problem due to contamination from human sources and can enter
the food chain by being taken up by plants. Understanding the genetic basis of accumulation and tolerance
in plants is therefore important for reducing the uptake of toxic metals in crops and crop relatives, as well
as for removing heavy metals from soils by means of phytoremediation. Legumes contain important crop
species and have developed symbiosis with nitrogen fixing bacteria. In this study, 220 accessions from the
HapMap collection of the model legume Medicago truncatula were analyzed for cadmium (Cd) and mercury
(Hg) tolerance and accumulation. Accumulation of Cd and Hg was measured using ionomics in the leaves,
and relative root growth was used as an indicator for tolerance. A large variation was found in all traits,
especially Hg leaf accumulation, with some individuals showing very high leaf cadmium levels. A positive
correlation between Cd and Hg relative root growth was observed, while no correlation was found for
accumulation in the leaves. To identify genes and genomic regions involved in Cd and Hg tolerance and
accumulation, a genome-wide association study (GWAS) was performed. These phenotypes were found to
be complex, polygenic traits, and among the genes detected by GWAS many were conserved in other species
and many new candidate genes were identified. An interesting region on chromosome 2 contained several
ankyrin repeat genes significantly associated with Cd tolerance and was near a genomic region shown to be
associated with salinity stress response in M. truncatula, demonstrating that this region is enriched in genes
involved in a ion stress response. By grouping plant genotypes with contrasting phenotypes, regions of
genomic divergence were identified containing several gene ontologies relevant for metal transport and
stress response. The tests of genomic divergence identified candidate genes which were not found by GWAS
and could therefore be a promising approach to complement GWAS. The significant variants identified by
GWAS showed a negative correlation between minor allele frequency and effect size for Cd tolerance and
accumulation, with large effect alleles being the most rare. This pattern is consistent with mutation-selection
balance. In conclusion, this study identified potential molecular mechanisms involved in Cd and Hg
tolerance and accumulation. These findings may help to understand the genetic interactions between host
plants and symbiotic rhizobia in the presence of toxic heavy metals.

4
1.2 Introduction
Heavy metals are a category of high-density metal ions associated with toxic effects in biological organisms
when exposed to excess quantities. Cadmium (Cd) and mercury (Hg) are two of the most toxic heavy metals,
with Cd poisoning manifesting in kidney damage and osteoporosis (Järup and Åkesson, 2009), while Hg
poisoning is associated with lung, kidney and muscle damage (Vallee and Ulmer, 1972). Heavy metals occur
naturally at low concentrations in soils, originating from volcanic eruptions and weathered rocks. However,
human activity has led to an increasing contamination of soils surrounding industrial, agricultural, and urban
regions, with soils in areas close to mines, foundries and smelters showing particularly high contaminations
(Alloway, 2013; Tchounwou et al., 2012). Plants grown on contaminated soils may accumulate heavy metals
in aerial parts, which can introduce them into to the food chain, leading to severe impacts on the health of
animals and humans (Peralta-Videa et al., 2009). The extent of heavy metal accumulation varies to a large
degree between species and understanding the genetic basis for this difference is essential for breeding or
engineering crops that do not accumulate toxic metals. Further, plants that accumulate large amounts of
heavy metals in their aerial tissues can be used for cleaning contaminated soils by means of
phytoremediation (Yang et al., 2005).
Plants take up essential micronutrients from the soil and transport them from the roots to aerial tissues.
During this process, plants may also take up non-essential heavy metals, either by passive mechanisms such
as diffusion, or actively due to similarities to essential metals. To be taken up from the soil, metals must be
bioavailable, which can be influenced by many variables such as pH, metal and water concentrations, and
the presence of symbiotic bacteria. Plants influence bioavailability by adjusting the pH in the surrounding
soil with the help of ATP-dependent proton pumps and by excreting substances such as organic acids and
phytosiderophores (Maestri et al., 2010). A bioavailable metal can enter the cytoplasm of root cells through
transporters involved in the uptake of essential micronutrients. In Arabidopsis thaliana, Cd enters the root
through zinc and iron transporters of the Zrt/IRT-like proteins (ZIP) family and through the calcium channel
LCT1 (Park et al., 2012), while in rice (Oryza sativa) a natural resistance-associated macrophage protein
(NRAMP), specifically the manganese (Mn) transporter NRAMP5, is the main importer of Cd. (Sasaki et
al., 2012). Once in the root, heavy metals can translocate into the shoot by being loaded into the vasculature.
Loading of Cd into the vasculature is performed by heavy metal ATPases (HMAs), specifically HMA2 and
HMA4 in Arabidopsis thaliana. The mechanisms of Hg accumulation are less well known since fewer
studies exist (Park et al., 2012).
Some plants avoid the toxic effects of heavy metals by preventing their uptake into the root. Several
strategies exist to achieve this, including sequestration into the cell wall and the production of root exudates
that immobilize the metal ions in the soil by chelation (Mehes-Smith et al., 2013). Tolerant plants that do

5
not use avoidance strategies rely on intracellular detoxification mechanisms for protection from the effects
of high heavy metal levels in the cytoplasm. High intracellular concentrations of metal ions are toxic in
multiple ways. Toxic ions can lead to the denaturation of proteins, the displacement of essential metals from
biomolecules, problems in membrane integrity and the formation of reactive oxygen species (ROS). Plants
combat this by preventing heavy metal ions from interacting with the cellular machinery, which is achieved
by producing chelators that bind the ions or by compartmentalizing them into the vacuole. The oxidative
stress induced by ROS is alleviated by antioxidant compounds. Glutathione (GSH) is a central molecule in
these processes, as it can sequester metal ions and is also involved in antioxidant defense (Hossain et al.,
2012). In leaves, the negative impact of heavy metals on the metabolism is especially harmful due to their
interference with photosynthesis, making detoxification even more crucial than in roots (Aggarwal et al.,
2011). In A. thaliana, Cd and Hg are chelated by metallothionins, and phytochelatins which are synthesized
from glutathione. These chelated metals are then sequestered into the vacuole by ATP-binding cassette
subfamily C (ABCC) transporters, specifically AtABCC1 and AtABCC2. Additionally, unchelated Cd ions
can directly be sequestered into the vacuole, which is mediated by the cation exchange (CAX) type
antiporters AtCAX2 and AtCAX4, as well as the heavy metal ATPase AtHMA3 (Park et al., 2012).
Legumes (Fabaceae) are an economically important plant family containing multiple crop species
such as soybean (Glycine max), peas (Pisum sativum), beans (Phaseolus vulgaris), peanuts (Arachis
hypogaea) and alfalfa (Medicago sativa). Additionally, legumes have developed symbiotic relationships
with nitrogen fixing bacteria (rhizobia) that reside in root nodules, making them a large contributor of
nitrogen to ecosystems (Zahran, 1999). Since nitrogen is essential for all organisms, this symbiosis has been
of great scientific interest and has been studied extensively in Medicago truncatula. M. truncatula is a
selfing plant native to the Mediterranean area and is used as a model legume due to its small diploid genome
(450–500 Mbp) and short generation time. A high quality reference genome (Tang et al., 2014; Young et
al., 2011) and a large HapMap collection of resequenced genotypes exists
(http://www.medicagohapmap2.org/) for conducting association studies using high density single nucleotide
polymorphism (SNP) data (Stanton-Geddes et al., 2013). Multiple species belonging to the Medicago genus
grow in regions with high Hg contamination surrounding the Almadén mining site in Spain, which is the
largest known Hg reservoir in the world. Due to the mining activities, this site is also contaminated with
other heavy toxic heavy metals such as Cd. In the nodules of many of these species, Hg tolerant rhizobia are
present which can contribute to the tolerance of the host plant (Nonnoi et al., 2012). Combined with fast
growth and high biomass production, these plants are good candidates for phytoremediation, while the close
relatedness to many crops, especially alfalfa, means that genetic discoveries can be applied to species
relevant for human food supply (García de la Torre et al., 2013).

6
If a phenotype varies between individuals within a species due to genetic variation, genes responsible
for the phenotype can be identified by genome wide association studies (GWAS). Genome wide association
studies can identify fine scale genetic associations between a phenotype and SNPs using mixed linear models
(e.g. (Kang et al., 2010). Several GWAS have been conducted in M. truncatula to identify the genetic
architecture of agronomic traits (Stanton-Geddes et al., 2013), drought resistance (Kang et al., 2015), and
ion stress tolerance (Kang et al., 2019). With regard to toxic heavy metals, very little is known about the
genetic architecture in M. truncatula. The genetic architecture of Cd accumulation or tolerance has been
studied by GWAS in multiple plants, including A. thaliana (Chao et al., 2012), barley (Wu et al., 2015),
rapeseed (Chen et al., 2018), rice (Zhao et al., 2018) and wheat (Hussain et al., 2020). Fewer studies exist
for Hg, with a GWAS in maize being one of the only examples (Zhao et al., 2017).
The presence of persistent genetic variation underlying a phenotype is called standing genetic
variation. Standing genetic variation may allow species to adapt faster to new environments since selection
can act on the alleles already present in the population without new mutations having to arise first (Barrett
and Schluter, 2008). Since GWAS depends on genetic variation, the identified candidates can be used to
analyze the forces that maintain this variation. One way genetic variation is thought to be preserved is by
mutation-selection balance, whereby new mutations occur at the same frequency as they are removed by
negative selection. New mutations are likely to be deleterious and therefore subject to negative selection,
which makes these alleles rare and ultimately drives them out of the population. Selection acts stronger on
alleles with a large effect on the phenotype, which is why the effect size should be negatively correlated
with the minor allele frequency (Josephs et al., 2017, 2015). In the unlikely case that the new mutation is
advantageous, it will spread due to positive selection and become the new major allele. Therefore, in variants
under mutation-selection balance minor alleles are expected to be present at low frequencies. Alternatively,
minor alleles may be kept at higher frequencies due to processes such as local adaptation, where the minor
allele is beneficial in some environment but detrimental in others. Local adaptation must not necessarily
manifest in high frequencies of the minor allele, but populations from different environments are likely to
show high between-population variance and low variance within the populations. A further sign of local
adaptation can be the presence of a selective sweep within a population, represented by reduced genetic
diversity surrounding the allele due to its fixation in the population.
The aims of this project were to determine the standing genetic variation of Cd and Hg accumulation
and tolerance in Medicago truncatula. and to identify the genes and genetic regions responsible for these
traits. Furthermore, the aim was to determine the selective forces acting on these genes in order to understand
how genetic variance is maintained.

7
1.3 Material and Methods
1.3.1 Phenotype Data
Two separate heavy metal treatments were applied in parallel to a subset of 220 Medicago truncatula
accessions from the Medicago HapMap project (http://www.medicagohapmap.org/) at the seedling stage.
One set of plants was treated with cadmium (Cd) using 10µM of CdCl2 added to the Hoagland solution. A
second set of plants was treated with mercury using 4µM of HgCl2 added to the Hoagland solution. A third
set was given no heavy metal treatment and was used as control. Each treatment contained fifteen replicates
of each M. truncatula genotype. Four traits were measured following the heavy metal treatments: Relative
root growth (RRG) in plants treated with Cd and Hg, as well as accumulation of Cd and Hg in leaf tissues.
Root lengths were measured after 24 h of growth in the untreated hydroponic medium, and again after further
growth for 48 h in medium treated with the metal. The measurements were performed by taking pictures of
the seedlings and determining the root length in ImageJ. To calculate the RRG of the seedlings, the increase
in length was normalized by the increase in the control seedlings (Equation 1):
(1) 𝑅𝑅𝐺 = (∆𝑙𝑒𝑛𝑔𝑡ℎ𝑡𝑟𝑒𝑎𝑡𝑚𝑒𝑛𝑡
∆𝑙𝑒𝑛𝑔𝑡ℎ𝑐𝑜𝑛𝑡𝑟𝑜𝑙) 𝑥 100
For the metal concentration measurements in the leaves, cotyledons were harvested after plants had been
exposed to Cd or Hg for 48 h. Three replicates were measured for each genotype. The tissues were washed
with 10 mM Na2EDTA to remove traces of metals on their surface. Washed and dried leaves were digested
using concentrated nitric and perchloric acids in heat. After the tissue digestion, distilled water was added
and the mixture was filtered. Cd and Hg concentrations were measured using inductively coupled plasma
atomic emission spectroscopy (ICP-AES). R version 3.3.3 was used to conduct statistical analysis on the
phenotypic distributions. The broad sense heritability (H2) of all four traits was estimated using the lmer4
package.
1.3.2 SNP Data
Genotype data of all 262 Medicago truncatula accessions from the Medicago HapMap project (based on the
Mt4.0 reference genome and containing 40,065,843 SNPs) was imputed using BEAGLE version 4.1
(Browning and Browning, 2016) with default parameters. While imputation is not necessarily required in
such a high-density data set, about a quarter (24.7%) of all nucleotides were missing, and it was therefore
decided that imputation could improve the results.

8
A second dataset was created additionally including four newly sequenced accessions that showed
high mercury tolerance. 100 b paired end Illumina reads of the four new accessions (w516950, w660389,
w660407, w660482) not contained in the HapMap dataset were trimmed with Trimmomatic 0.36 (Bolger
et al., 2014) using TruSeq3-PE adapter sequences with a maximum seed mismatch count of 2, a palindrome
clip threshold of 20 and simple clip threshold of 10. Further parameters were LEADING:5 TRAILING:5
MAXINFO:70:0.9 MINLEN:40. Reads were then mapped to the Mt4.0 reference genome using BWA
0.7.15 (Li and Durbin, 2009) with default settings and sorted with samtools 1.9 (Li et al., 2009). The
MarkDuplicates function of Picard version 2.18.0 (http://broadinstitute.github.io/picard/) was used to tag
duplicate reads. After indexing with samtools, HaplotypeCaller from GATK 3.8.1.0 (McKenna et al., 2010)
with the option -ERC GVCF was used to call SNPs consistent with the HapMap dataset. GATKs
GenotypeGVCFs was then used to joint-genotype the four accessions into one VCF-file. The combined VCF
file was filtered using the VariantFiltration option of GATK, after which SelectVariants was applied to
remove indels. Finally, the resulting VCF-file containing the four additional accessions was merged with
the HapMap dataset using the vcf-merge option of vcftools 0.1.15 (Danecek et al., 2011) and the combined
variants were imputed using BEAGLE. Correct integration into the HapMap dataset was checked by creating
a neighbour-joining tree of chromosome 6 using VCF-kit 0.1.6 (Cook and Andersen, 2017). Since the
integration showed irregularities, this second dataset was discarded and only the dataset without the four
additional accessions was used for further analysis.
1.3.3 Population Structure
To generate a co-variance matrix accounting for population structure, the unimputed version of the SNP
dataset was filtered to only contain accessions with phenotype data present, leading to a dataset containing
223 samples. Following the method of (Gentzbittel et al., 2019), the following criteria were used to select
SNPs for population structure analysis: SNPs were filtered by genotyping rate (removing SNPs where more
than 5% of individuals have missing data) and minor allele frequency (removing SNPs where the minor
allele is present in less than 1 percent of all individuals) and converted to bed format using plink 1.9beta6.5
(Purcell et al., 2007) with parameters --geno 0.05 --maf 0.01 --make-bed. Independent sites where then
selected and extracted using plink (parameters: -indep 300 60 1.22). Admixture 1.3.0 (Alexander et al.,
2009) was run on the extracted independent sites with values for k ranging from 1 to 10 and 10 iterations
per k with different seeds (--seed=1 to --seed=10). For each k, average cross validation errors were
calculated and the iteration with lowest cross validation error was plotted in R.
9
1.3.4 Association mapping
The imputed dataset was split by chromosome and converted to HapMap format using TASSEL 5 (Bradbury
et al., 2007). An outlier accession with very high Hg leaf accumulation (HM233) was excluded from the Hg
leaf phenotype data to prevent an overrepresentation of SNPs from this genotype. GWAS was performed
twice using GAPIT version 20160323 (Lipka et al., 2012; Tang et al., 2016), once without covariates and
once with the population structure with lowest cross validation error (k=5) as covariates. Other parameters
used were KI=NULL, PCA.total=3 SNP.MAF=0.02, SNP.fraction=0.6, Major.allele.zero=TRUE and
Geno.View.output=FALSE.
SNPs were annotated using a custom Python script: The 1000 most significant SNPs across all
chromosomes of each trait were annotated with genes in 1 kb range using the gene context files provided by
the HapMap project. Further information including distance between SNP and gene or the substitution type
were extracted from these files as well. The genes were then further annotated with information from
MedicMine (Krishnakumar et al., 2015), namely gene descriptions, GO-terms and tissue specific expression
counts based on RNASeq. Additionally, the blastn tool provided by NCBI (Camacho et al., 2009) was used
to perform BLAST of the genes against Arabidopsis thaliana.
Lists of potential candidate genes involved in heavy metal tolerance were compiled by filtering genes
for functional descriptions including association with heavy metals, ion transport, stress response and
ATPases with potential roles in heavy metal tolerance. Additionally, significant GO-term enrichment among
the 1000 most significant SNPs was tested with AgriGO (Du et al., 2010).
GWAS peaks were identified manually in IGV 2.6.3 (Robinson et al., 2011; Thorvaldsdóttir et al.,
2013). To calculate pairwise linkage disequilibrium between the 100 most significant SNPs in the peaks,
vcftools was used with the –geno-r2 flag and the resulting values were plotted using the R package
LDHeatmap (Shin et al., 2006). SNPs in peak regions were annotated using a similar Python script as
described for the top SNPs.
1.3.5 Correlation between minor allele frequency and effect size
The correlation between minor allele frequency and effect size of the 100 and 1000 most significant
GWAS SNPs was determined using Pearson’s correlation coefficient. To ensure that this correlation was
significant and did not occur due to biases introduced by GWAS, 100 GWAS iterations with permuted
phenotype data were performed. Since GAPIT proved to be very resource intensive, another program,
GEMMA (Zhou and Stephens, 2012), was used to perform the iterations instead. Additionally, the
unpermuted iteration was also performed again in GEMMA to ensure the results are similar to GAPIT. The
imputed dataset was filtered to only contain phenotyped individuals with bcftools 1.2 and subsequently

10
converted to bed format using plink 2.0alpha while the phenotype data was converted to fam format using
plinks --make-just-fam option. GEMMA 0.98.1 was then used to calculate relatedness matrices for each trait
and further to perform GWAS iterations using a multivariate linear mixed model and a minor allele
frequency cutoff of 2 percent (parameters: -lmm -maf 0.02). As with GAPIT, the outlier for Hg leaf
accumulation was removed and a population structure of k=5 was used as covariates. For each iteration,
Pearson’s correlation coefficient between minor allele frequency and effect size was calculated for the 100
and 1000 most significant SNPs and the resulting distribution of correlation coefficients was compared to
the correlation of the unpermuted results. The difference was concluded to be significant if less than five
percent of the permuted correlation were stronger than the correlation of the unpermuted data.
To test whether the most significant SNPs show stronger signs of selection than a neutral background,
Tajima’s D was calculated for the 1000 most significant SNPs of each trait by running variscan (Vilella et
al., 2005; Hutter et al., 2006) with a window size of 50 b. The same was done with the roughly 800,000
independent SNPs used for population structure analysis to obtain a neutral background. Student’s t-test was
used to determine whether the differences between Tajima’s D of GWAS SNPs and background were
significant.
1.3.6 Genomic divergence based on phenotype differences
For each trait, two populations were defined based on the phenotype data, one population consisting of 30
individuals with the lowest phenotype values and the other consisting of 30 individuals with the highest
phenotype values. Contrary to GWAS, the outlier for Hg leaf accumulation of accession HM233 was not
removed. To ensure that these groups of individuals were mainly separated by phenotype and not biased by
population structure, the admixture components of both groups were compared, making sure that no
components are specifically enriched in one of the two opposing groups. This was purely based on visual
inspection and no statistical analysis was performed.
vcftools was used to generate Fst statistics with the previously mentioned populations and a window
and step size of 100 kb. Similarly, xpclr 1.1 (https://github.com/hardingnj/xpclr/) was used to calculate XP-
CLR with identical window and step size. Genes in the top 2 percent of windows with highest values of Fst
or XP-CLR were annotated in the same way as the GWAS SNPs and were further tested for GO-term
enrichment using AgriGO. Additionally, overlaps between GWAS peaks and the two statistics were
determined.

11
1.4 Results
1.4.1 High genotypic variation and heritability
Seedlings from 220 M. truncatula accessions were analyzed for heavy metal tolerance and accumulation.
Root growth upon exposure to cadmium (Cd) and mercury (Hg), relative to the root growth of untreated
plants, was used as a measure of tolerance. Accumulation of both metals in the leaf was quantified by
inductively coupled plasma atomic emission spectroscopy (ICP-AES). Relative root growth (RRG) for Cd
showed a nearly 30-fold difference ranging from 3.08 to 90.00 and had a broad sense heritability (H2) of
0.61. Similarly, Hg RRG showed a 28-fold difference, with values ranging from 4.26 to 99.39, and H2 of
0.72. Leaf accumulation showed larger variability, with a 50-fold difference for Cd, ranging from 1.91 to
95.07 µg g-1 and a 520-fold difference for Hg, ranging from 1.77 to 924.48 µg g-1. H2 was 0.52 and 0.44
respectively. The large variability in Hg leaf accumulation was partly due to the plant with highest Hg leaf
accumulation having almost twice as much metal in the leaf tissues than the second highest accession and
was therefore considered an outlier in most subsequent analysis. Even when removing this accession, a 270-
fold difference remained however, with values ranging from 1.77 to 484.12 µg g-1.
No correlation between leaf accumulation and RRG was found for both metal treatments. The highest
correlation was between the two root growth traits, Cd and Hg RRG (Pearson’s r = 0.39). The second highest
correlation was between Cd RRG and Hg leaf accumulation (Pearson’s r = 0.32), which was somewhat
surprising as both tissues and metal treatments were different (Figure 1). All four traits showed unimodal
distributions, but Cd RRG and Hg leaf were left skewed, with the outlier contributing much to the
skewedness of Hg leaf. The heritability estimates and large amount of standing variation suggest that
genome wide association studies (GWAS) can detect alleles underlying these traits due to significant
differences between genotypes, and that both tolerance and susceptibility alleles are present in the M.
truncatula HapMap panel. Because the HapMap panel is a broad sampling of germplasm that spans the
native species distribution, this genetic variation reflects alleles still segregating in natural populations.

12
Figure 1: Correlation matrix of Cd leaf accumulation, Cd relative root growth (RRG), Hg leaf accumulation, and Hg relative root growth (RRG). Distributions of the four traits are shown in the diagonal. The upper off-diagonal panels contain pairwise Pearson’s correlation coeffiecients (r). Lower diagonals are the plotted values of each HapMap genotype measured in this experiment. The red line shows the slope of the correlation between any pair of traits. The x and y-axis represent the relative change of root length in the case of RRG and the number of accumulated metals relative to the leaf dry weight in the case of leaf accumulation.
1.4.2 Variant calling on additional high accumulation accessions lead to high coverage
Four additional accessions showing high heavy metal tolerance (specifically high root growth upon Hg
exposure) were sequenced. After trimming the adapter sequences about 80% of the reads remained. Mapping
the reads lead to an average coverage of 18x to 23x (Table 1), exceeding that of the 26 high coverage
accessions included in the HapMap dataset which were sequenced to 15x coverage. After Joint-genotyping
9,072,053 variants remained, or 7,547,999 when excluding indels. However, a phylogenetic analysis showed
that when adding the four new accessions to the HapMap dataset, they clustered together and were separated
by a long branch from all other genotypes. One of the main reasons for this is likely that the four new
genotypes could not be joint genotyped together with the HapMap dataset, as the required gVCF files were
not publicly available. Since the contribution of four new genotypes was concluded to be minor in a dataset
consisting of over 200 accessions, especially since no leaf accumulation phenotype data was available for
them, it was decided not to include these four accessions in further analysis due to concerns over the
correctness of the results.

13
Table 1: Read count map coverage and number of called variants of the four newly sequenced accessions. Map coverage was measured after deduplication. Variants includes all variants including indels before joint-genotyping.
Accession Raw Reads Trimmed Reads Map Coverage Variants
516950 41,692,933 41,610,839 18.535x 90,430,681
660389 42,691,325 42,594,726 18.528x 90,221,398
660407 52,648,008 52,528,008 22.463x 92,007,055
660482 39,039,102 38,951,296 17.129x 89,414,579
1.4.3 Population structure analysis identified five admixture components
The population structure used in subsequent analysis was determined using the software Admixture. Cross
validation errors were lowest for k=5, although the variance was higher than for k=4, which was second
lowest.
Figure 2: Results of admixture analysis. Average cross validation errors of 10 admixture runs for each k between 1 and 10. The y-axis represents the cross-validation error value, the x-axis the value of k (A). Distribution of ancestry components in all samples of the HapMap dataset for the best iteration (lowest cross validation error) of k=5. Colors represent the 5 components, the y-axis the proportion of each component in an individual and each bar on the x-axis represents an individual (B).
As expected, genotypes cluster according to geographic location. Most apparent is the east to west
separation into k1, k2 and k4. Specifically, k1 comprises of accessions from Spain, Morocco and Algeria,
therefore being the west-most cluster. K2 is located more to the east, containing accessions from Algeria
and Tunisia, followed by k4, which spans Northeast Africa and Southwest Asia. To a lesser degree a north
to south separation is also present, with k3 and k5 containing accessions from regions more to the north than
those in k1, k2 or k4. This is especially true for k5, which mostly contains accessions from Greece and
Cyprus, therefore being to the north of k4. The distribution of k3 is less clear, but it seems to be represented
mostly in Algerian and European accessions and therefore also more to the north.

14
1.4.4 Genome-wide association mapping identified genomic regions and candidate genes
To identify genes and genomic regions associated with heavy metal tolerance and accumulation, a genome
wide association study (GWAS) was performed using GAPIT. To determine the effect of population
structure on the results, the GWAS was run twice, once without providing a population structure and once
with the previously determined population structure of k=5. Overall, including population structure
improved the model fit slightly, which was most apparent in traits showing a rather big deviation from the
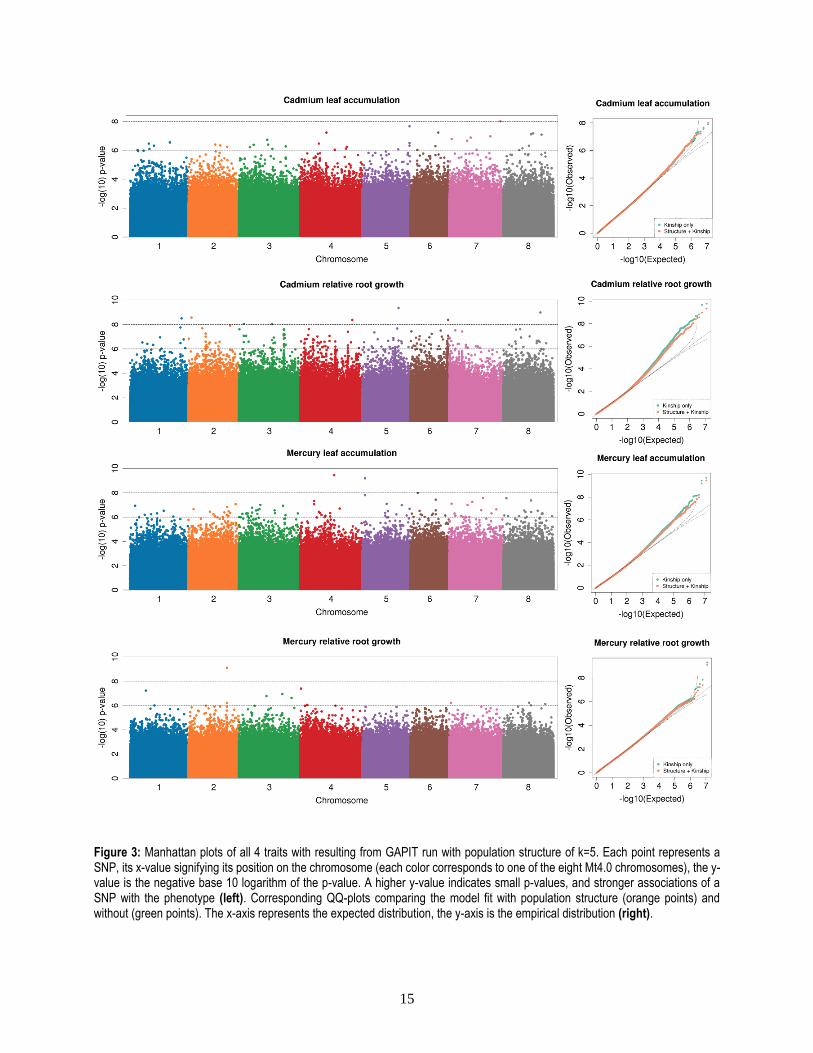
expected distribution. The model fit for Cd leaf accumulation and Hg relative root growth is noticeably
better than for Cd relative root growth and Hg leaf accumulation, as expected due to the skewed distribution
of the latter two traits (Figure 3).
As cut-off for significance, the 1000 SNPs with highest association were analyzed for each trait,
hereafter referred to as top SNPs for brevity. The average minor allele frequency was low among the top
SNPs, with the minor allele being present in 3.9 to 6.2 percent of all accessions on average. The effect size
was rather large on the other hand, with the average top SNP explaining 13 to 21 percent of the total
phenotypic variation depending on the trait. The average effect size was clearly positive, leading to the
conclusion that far fewer SNPs with negative rather than positive effect size existed among the top SNPs.
Since the effect size is in respect to the minor allele, this means that for almost all top SNPs the minor allele
conferred higher tolerance or higher accumulation. The top SNPs were annotated with genes in 1 kb
proximity, which lead to roughly half of the SNPs (44%) being associated with at least one gene. Only a
small subset of these SNPs was located in coding sequences, with 3 percent of the total SNPs being
synonymous substitutions and 5 percent being non-synonymous. About a fifth (21%) of all SNPs were
associated with transposable elements (Table 2).
Table 2: Locations of the 1000 most significant SNPs of each trait relevant to transposable elements and genes. SNPs were assigned to transposable elements and genes if they were not further apart than 1 kb, meaning that genes in the downstream and upstream category have a maximum distance of 1 kb from the annotated gene.
Trait Transposons Genes Intergenic Upstream Downstream 5' UTR 3' UTR Intron Splice Region Synonymous Missense
Cd leaf 242 386 679 119 119 9 7 112 3 29 42
Cd RRG 184 481 649 135 133 10 16 127 3 40 73
Hg leaf 206 426 695 130 125 5 9 140 3 28 36
Hg RRG 207 451 652 141 124 10 12 141 3 29 60
Mean 209.8 436.0 668.8 131.3 125.3 8.5 11.0 130.0 3.0 31.5 52.8
15
Figure 3: Manhattan plots of all 4 traits with resulting from GAPIT run with population structure of k=5. Each point represents a SNP, its x-value signifying its position on the chromosome (each color corresponds to one of the eight Mt4.0 chromosomes), the y-value is the negative base 10 logarithm of the p-value. A higher y-value indicates small p-values, and stronger associations of a SNP with the phenotype (left). Corresponding QQ-plots comparing the model fit with population structure (orange points) and without (green points). The x-axis represents the expected distribution, the y-axis is the empirical distribution (right).

16
Candidate gene lists were created by annotating the 1000 most significant SNPs of each trait with
genes in 1 kb proximity. To determine whether any biological processes or molecular functions were
common among the candidates, a test for gene ontology (GO) enrichment was performed for each trait
(Table 3). Response to stress was enriched in the genes associated with Cd RRG, while ATP-binding was
enriched in Hg RRG. Two traits, namely Cd RRG and Hg leaf, were enriched in defense response while no
significant enrichment was found for the genes associated with Cd leaf.
Table 3: Significantly enriched GO-terms among the 1000 most significant GWAS SNPs. A total of 158 genes for Cd RRG, 144 genes for Hg leaf and 129 genes for Hg RRG were queried, with 18,883 genes in the background. The GO-term types are denoted by F (molecular function) and P (biological process). Query items and BG items are the number of genes from the query and background that were associated with the GO-term, on which the calculation of the p-value and false discovery rate (FDR) is based.
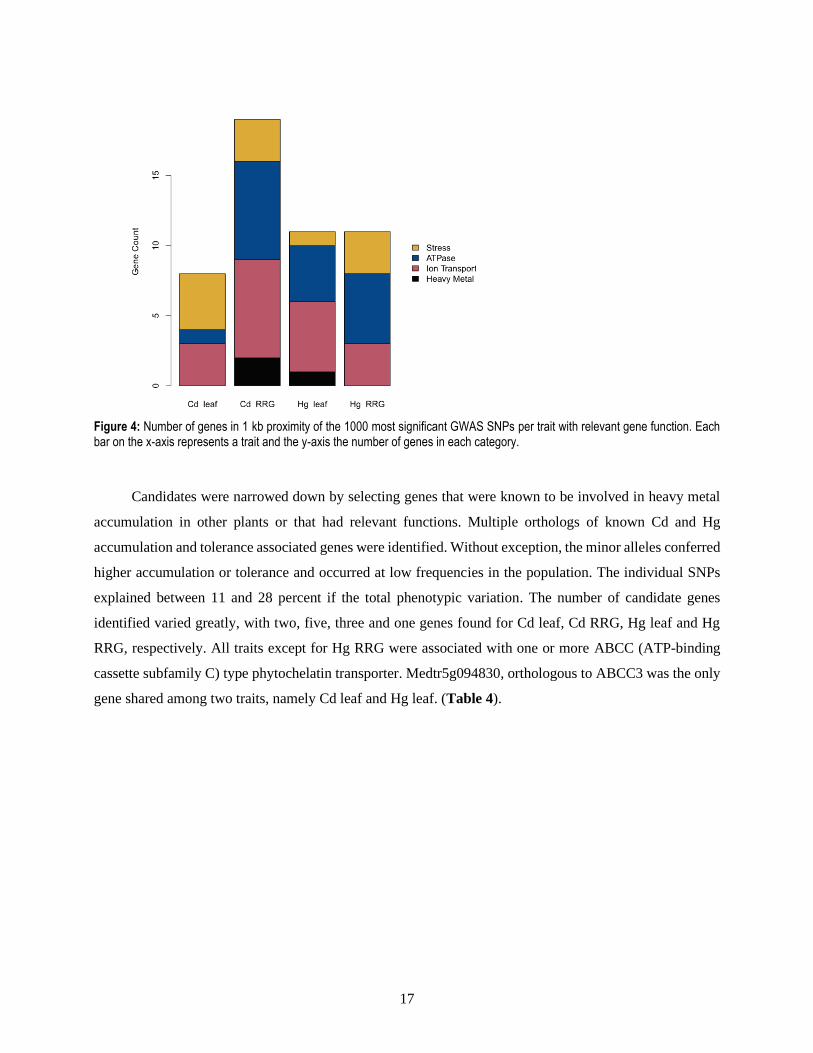
To quantify possible candidates, genes were selected based on four categories relevant to the traits.
The genes were categorized based on their annotation in M. truncatula, the annotation of the closest ortholog
in A. thaliana if present, and based on GO-terms. The four categories consisted of general stress response,
ATPases with relevant functions, transport of ions, and association with heavy metals. A total of 8 to 19
genes per trait could be assigned to one of the four categories, with Cd leaf having the lowest number of
categorized genes and Cd RRG having the highest.Ion transport and ATPase activity are the most frequent
categories, except for Cd leaf where stress response was the predominant category.
GO term Type Description Query Items BG Items p-value FDR
Cd RRG
GO:0050896 P response to stimulus 24 1164 5.00E-05 0.0049
GO:0006950 P response to stress 23 1087 5.00E-05 0.0049
GO:0006952 P defense response 19 799 5.00E-05 0.0049
Hg leaf
GO:0006952 P defense response 17 799 0.0002 0.038
Hg RRG
GO:0000166 F nucleotide binding 43 4045 0.0012 0.04
GO:0017076 F purine nucleotide binding 34 2994 0.0016 0.04
GO:0030554 F adenyl nucleotide binding 33 2740 0.0007 0.04
GO:0001883 F purine nucleoside binding 33 2740 0.0007 0.04
GO:0001882 F nucleoside binding 33 2740 0.0007 0.04
GO:0032559 F adenyl ribonucleotide binding 31 2626 0.0015 0.04
GO:0005524 F ATP binding 31 2625 0.0015 0.04
17
Figure 4: Number of genes in 1 kb proximity of the 1000 most significant GWAS SNPs per trait with relevant gene function. Each bar on the x-axis represents a trait and the y-axis the number of genes in each category.
Candidates were narrowed down by selecting genes that were known to be involved in heavy metal
accumulation in other plants or that had relevant functions. Multiple orthologs of known Cd and Hg
accumulation and tolerance associated genes were identified. Without exception, the minor alleles conferred
higher accumulation or tolerance and occurred at low frequencies in the population. The individual SNPs
explained between 11 and 28 percent if the total phenotypic variation. The number of candidate genes
identified varied greatly, with two, five, three and one genes found for Cd leaf, Cd RRG, Hg leaf and Hg
RRG, respectively. All traits except for Hg RRG were associated with one or more ABCC (ATP-binding
cassette subfamily C) type phytochelatin transporter. Medtr5g094830, orthologous to ABCC3 was the only
gene shared among two traits, namely Cd leaf and Hg leaf. (Table 4).

18
Table 4: Candidate genes in 1 kb proximity to GWAS top SNPs for each trait selected based on findings in other plants or with relevant function. Columns from left to right are SNP position, p-value in the GWAS results, minor allele frequency, the percentage of the phenotype variance explained by the SNP, gene ID in M. truncatula, gene ID in A. thaliana, and the gene name.
SNP P-value MAF Effect (%) Variant Type Medicago
Truncatula
Arabidopsis
Thaliana Gene Name
Cd leaf
chr5:41452150 3.34E-05 0.023 18.1 synonymous (aaA/aaG) Medtr5g094830 AT3G13080.1 ABCC3
chr5:41452129 3.34E-05 0.023 18.1 synonymous (gcG/gcA) Medtr5g094830 AT3G13080.1 ABCC3
chr5:41452138 3.34E-05 0.023 18.1 synonymous (gaT/gaC) Medtr5g094830 AT3G13080.1 ABCC3
chr7:36458974 1.58E-06 0.026 21.1 downstream (724b) Medtr7g092070 AT2G41900.1 DEG9 / OXS2
Cd RRG
chr8:5289470 1.04E-07 0.025 16.2 missense (tAt/tTt) Medtr8g015980 AT3G21250.2 ABCC8
chr8:5289479 4.56E-07 0.030 17.3 missense (gCt/gGt) Medtr8g015980 AT3G21250.2 ABCC8
chr2:40788857 9.99E-06 0.023 14.6 upstream (453b) Medtr2g095480 AT5G60800.2 HIPP3
chr2:28700237 1.01E-05 0.037 12.2 intronic Medtr2g069090 AT5G43440.1 similar to ACC oxidase
chr2:6102461 7.32E-06 0.068 11.7 synonymous (agC/agT) Medtr2g019020 AT2G34660.2 ABCC2
chr6:34292544 1.07E-06 0.023 17.2 intronic Medtr6g090280 AT4G29210.1 GGT3
Hg leaf
chr3:40127485 1.15E-07 0.020 28.3 intronic Medtr3g088460 AT1G15960.1 NRAMP6
chr2:15751342 8.27E-06 0.023 22.1 intronic splice donor Medtr2g036380 AT4G30110.1 HMA2
chr5:14374444 1.96E-05 0.020 23.7 intronic Medtr5g033320 AT3G13080.1 ABCC3
Hg RRG
chr2:35018740 8.10E-10 0.041 17.3 missense (Tta/Gta) Medtr2g083420 AT4G09500.2 UDP-
Glycosyltransferase
Two peaks were found for Cd RRG, one on chromosome 2 with the most highly associated SNP at
position chr2:29773843 (p-value = 2.55e-07), and one on chromosome 5 with the most significant SNP at
chr5:29773843 (p-value = 6.99e-07). The peak on chromosome 2 (Figure 5) contained multiple ankyrin
repeat genes in 1 kb proximity of top SNPs (Table 5), of which Medtr2g438720 was the most promising,
being close to 15 top SNPs for Cd RRG. 11 of those SNPs were located within the coding sequence, nine of
which caused missense mutations while the other two were synonymous. Two additional SNPs, one intronic,
the other 106 b upstream, were among the top SNPs for Hg leaf, therefore associating Medtr2g438720 with
both traits. Another ankyrin repeat gene in the peak, Medtr2g438740, was in proximity of nine top SNPs for

19
Cd RRG, of which three caused non-synonymous substitutions. Three additional ankyrin repeat genes and
2 hypothetical genes were associated with top SNPs in this peak.
Figure 5: Manhattan plot of Cd relative root growth for chromosome 2 with highlighted peak that contains multiple ankyrin repeat genes. Each point represents a SNP, its x-value signifying the position on the chromosome while the y-value is the negative base 10 logarithm of the p-value. A higher y-value indicates stronger association with the phenotype (A). Fst and XP-CLR statistics from sliding window analysis (100 kb windows) on chromosome 2 with GWAS peak marked in grey. The x-axis represents the chromosomal position, the y-axis the Fst or XP-CLR value of the window at the corresponding position. Higher Fst indicates population differentiation, higher XP-CLR the presence of a selective sweep (B, C). Pairwise linkage disequilibrium (LD) among the 100 most significant SNPs in the peak. The black lines mark the position of each SNP in the peak while the matching horizontal and vertical line in the triangle show the pairwise LD with all other SNPs. Blue signifies no LD, yellow maximal LD (D).
The peak on chromosome 5 (Figure 6) contained multiple candidate genes (Table 6).
Medtr5g070330, orthologous to CAX3 (cation exchanger 3), was close to four Cd RRG top SNPs, three
intronic and one located in the 3’-UTR. Medtr5g070320, orthologous to PDR3 (Pleiotropic drug resistance
3), was another gene within the peak, and contained three intronic SNPs which were significantly associated
with Cd RRG. Additionally, the peak contained Medtr5g070270, an ortholog of CPR7 (Cis-
prenyltransferase 7) in proximity of six Cd RRG top SNPs, with three of those causing non-synonymous
substitutions. Further, DDB2 (damaged DNA-binding protein 2) was close to 7 top SNPs (one missense).

20
Table 5: Genes in the chromosome 2 peak for Cd RRG with top SNPs in 1 kb proximity. All top SNPs associated with each gene are listed, detailing the GWAS p-value, the minor allele frequency (MAF) and the percentage of the phenotypic variation explained
SNP P-value MAF Effect (%) Variant Type
Medtr2g438720 (ankyrin repeat plant-like protein)
chr2:15656689 5.61E-08 0.048 15.8 missense (Ccg/Acg)
chr2:15654044 2.55E-07 0.023 18.6 downstream (69 b)
chr2:15658136 8.68E-07 0.039 13.5 synonymous (tcA/tcC)
chr2:15658160 3.09E-06 0.037 12.9 synonymous (gaA/gaG)
chr2:15658138 3.09E-06 0.037 12.9 missense (Tca/Gca)
chr2:15658132 3.09E-06 0.037 12.9 missense (Gaa/Aaa)
chr2:15658120 3.09E-06 0.037 12.9 missense (Gag/Cag)
chr2:15658162 3.09E-06 0.037 12.9 missense (Gaa/Aaa)
chr2:15658173 3.09E-06 0.037 12.9 missense (cCa/cAa)
chr2:15658165 3.09E-06 0.037 12.9 missense (Ctt/Ttt)
chr2:15658795 3.57E-06 0.027 15.8 intronic
chr2:15658426 3.57E-06 0.027 15.8 missense (Gga/Aga)
chr2:15658332 3.57E-06 0.027 15.8 missensea (Aa/aGa)
chr2:15660971 4.31E-06 0.021 17.6 upstream (458 b)
Medtr2g438740 (ankyrin repeat plant-like protein)
chr2:15658332 3.57E-06 0.027 15.8 downstream (891 b)
chr2:15660971 4.31E-06 0.021 17.6 downstream (432 b)
chr2:15664803 1.16E-06 0.023 17.0 intronic
chr2:15664798 3.57E-06 0.027 15.8 intronic
chr2:15663848 3.57E-06 0.027 15.8 missense (aaA/aaC)
chr2:15664794 3.57E-06 0.027 15.8 intronic
chr2:15662241 4.41E-06 0.030 15.4 synonymous (aaA/aaG)
chr2:15662266 4.41E-06 0.030 15.4 missense (Ccg/Tcg)
chr2:15663811 9.80E-06 0.032 14.4 missense (Ccg/Tcg)
Medtr2g438760 (ankyrin repeat plant-like protein)
chr2:15677776 2.70E-07 0.037 15.4 upstream (700 b)
chr2:15678674 9.13E-06 0.032 13.7 intronic
chr2:15678486 9.13E-06 0.032 13.7 5’ UTR (1681 b)
Medtr2g438700 (ankyrin repeat plant-like protein)
chr2:15649565 3.57E-06 0.027 15.8 upstream (350 b)
chr2:15648587 3.57E-06 0.027 15.8 intronic
chr2:15649533 3.57E-06 0.027 15.8 upstream (318 b)

21
Table 5 (continued)
SNP P-value MAF Effect (%) Effect
Medtr2g438560 (hypothetical protein)
chr2:15588915 9.75E-08 0.021 22.8 intronic
chr2:15590240 3.57E-06 0.027 15.8 upstream (910 b)
chr2:15588775 6.77E-06 0.032 14.8 intronic
Medtr2g438580 (ankyrin repeat protein)
chr2:15601386 8.80E-07 0.021 22.5 missense (Gag/Aag)
Medtr2g438670 (hypothetical protein)
chr2:15640003 3.57E-06 0.027 15.8 downstream (121 b)
Figure 6: Manhattan plot of Cd relative root growth for chromosome 5 with highlighted peak that contains multiple ankyrin repeat genes. Each point represents a SNP, its x-value signifying the position on the chromosome while the y-value is the negative base 10 logarithm of the p-value. A higher y-value indicates stronger association with the phenotype (A). Fst and XP-CLR statistics from sliding window analysis (100 kb windows) on chromosome 5 with GWAS peak marked in grey. The x-axis represents the chromosomal position, the y-axis the Fst or XP-CLR value of the window at the corresponding position. Higher Fst indicates population differentiation, higher XP-CLR the presence of a selective sweep (B, C). Pairwise linkage disequilibrium (LD) among the

22
100 most significant SNPs in the peak. The black lines mark the position of each SNP in the peak while the matching horizontal and vertical line in the triangle show the pairwise LD with all other SNPs. Blue signifies no LD, yellow maximal LD (D).
Table 6: Genes in the chromosome 5 peak for Cd RRG with top SNPs in 1 kb proximity. All top SNPs associated with each gene are listed, detailing the GWAS p-value, the minor allele frequency (MAF) and the percentage of the phenotypic variation explained
SNP P-value MAF Effect (%) Variant Type
Medtr5g070330 (CAX3: Vacuolar cation/proton exchanger 3)
chr5:29786947 1.89E-06 0.075 9.2 intronic
chr5:29783407 1.96E-06 0.071 10.7 intronic
chr5:29782526 3.26E-06 0.073 9.3 3 prime UTR (34b)
chr5:29785985 8.42E-06 0.025 13.3 intronic
Medtr5g070320 (PDR3: Pleiotropic drug resistance 3)
chr5:29773843 6.99E-07 0.059 11.8 intronic
chr5:29778161 6.99E-07 0.059 11.8 intronic
chr5:29779564 1.63E-06 0.062 11.3 intronic
chr5:29782526 3.26E-06 0.073 9.3 downstream (681b)
Medtr5g070270 (CPR7: Cis-prenyltransferase 7)
chr5:29747597 4.2E-06 0.096 8.6 synonymous (ggC/ggT)
chr5:29747567 4.6E-06 0.105 8.4 synonymous (acG/acC)
chr5:29747565 4.6E-06 0.105 8.4 missense (gCa/gGa)
chr5:29747559 6.4E-06 0.107 8.3 missense (gAg/gGg)
chr5:29747556 6.4E-06 0.107 8.3 missense (tAc/tGc)
chr5:29747594 7.7E-06 0.110 8.1 synonymous (acT/acC)
Medtr5g070310 (DDB2: damaged DNA-binding protein 2)
chr5:29763580 1.03E-06 0.066 9.9 intronic
chr5:29760539 2.87E-06 0.091 7.8 missense (Gga/Cga)
chr5:29762217 4.22E-06 0.096 7.5 intronic
chr5:29761553 4.22E-06 0.096 7.5 intronic
chr5:29762292 7.80E-06 0.098 7.3 intronic
chr5:29762313 7.80E-06 0.098 7.3 intronic
chr5:29760463 1.10E-05 0.112 6.9 synonymous (ccC/ccT)
Medtr5g070840 (cytochrome P450 family 71 protein)
chr5:29947090 1.08E-05 0.034 10.9 missense (tGt/tTt)

23
1.4.5 Regions of genomic differentiation are enriched in metal ion binding and transport
By comparing the genotypes of accessions with high and low tolerance or accumulation, regions with signs
of genomic differentiation or selective sweeps can be identified, which may contain genes that are relevant
for the trait. Groups of the 30 lowest and 30 highest accessions per trait were defined as populations and 2
statistics were calculated based on these populations: The Fixation Index (Fst), which identifies genomic
regions with high distinction between the populations and XP-CLR, a statistic to detect selective sweeps
among populations. Both statistics were calculated in sliding windows of 100 kb size and candidate genes
in windows with high population differentiation (top two percent) were selected and checked for GO-term
enrichment (Tables 7-9). Generally, the genes were enriched in more GO-terms than identified by GWAS,
which is likely because two to three times as many genes were used. Interestingly, Hg RRG did not show
any enriched GO-terms, consistent with GWAS. Despite using similar numbers of genes, more enriched
GO-terms were found for Fst than for XP-CLR.
Table 7: Cd RRG GO-term enrichment for the genes in the top two percent of Fst and XP-CLR windows. A total of 395 genes for Fst and 385 genes for XP-CLR were queried, with 18,883 genes in the background. The GO-term types are denoted by F (molecular function) and P (biological process). Query items and BG items are the number of genes from the query and background that were associated with the GO-term, on which the calculation of the p-value and false discovery rate (FDR) is based.
GO term Type Description Query Items BG Items p-value FDR
Fst
GO:0009056 P catabolic process 24 486 0.0002 0.046
GO:0044248 P cellular catabolic process 21 405 0.0002 0.046
GO:0016757 F transferase activity, transferring glycosyl groups 23 238 5.00E-09 1.00E-06
GO:0016758 F transferase activity, transferring hexosyl groups 22 209 3.00E-09 1.00E-06
GO:0006511 P ubiquitin-dependent protein catabolic process 11 143 0.0003 0.046
GO:0019941 P modification-dependent protein catabolic process 11 143 0.0003 0.046
GO:0043632 P modification-dependent macromolecule catabolic process 11 143 0.0003 0.046
XP-CLR
GO:0016892 F endoribonuclease activity, producing 3'-phosphomonoesters 6 40 0.0003 0.046
GO:0016894 F endonuclease activity, active with either ribo- or
deoxyribonucleic acids and producing 3'-phosphomonoesters 6 40 0.0003 0.046
GO:0033897 F ribonuclease T2 activity 6 38 0.0002 0.046
24
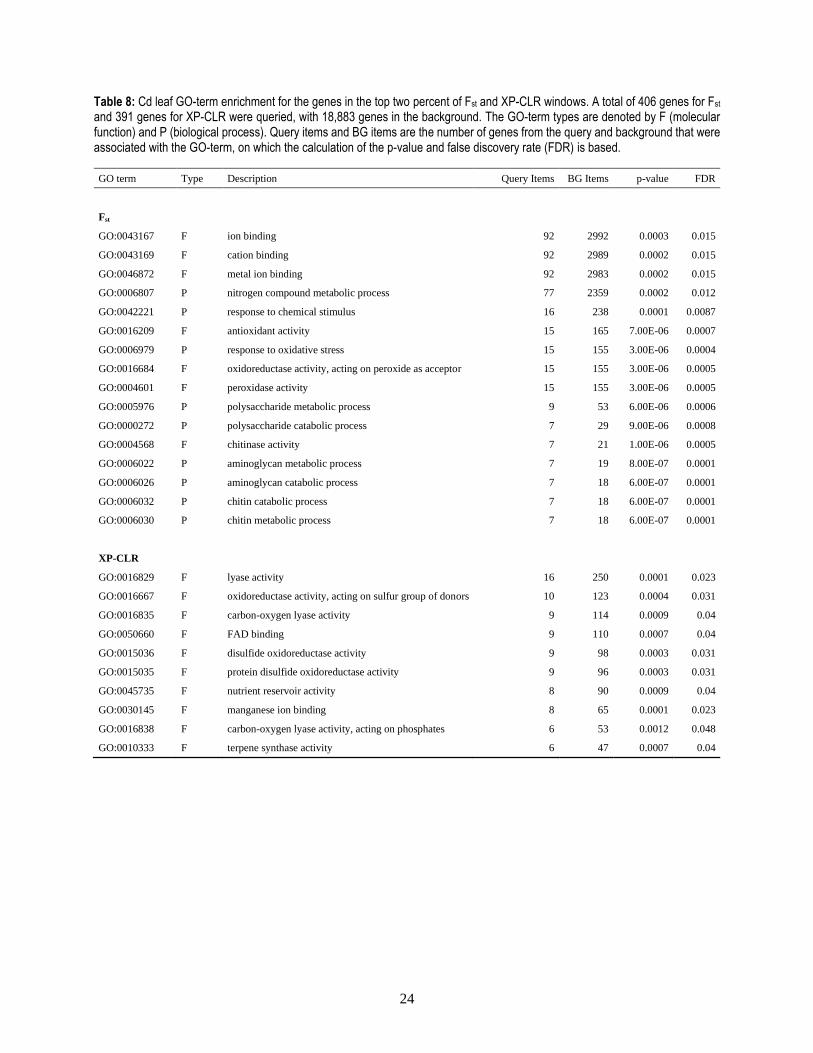
Table 8: Cd leaf GO-term enrichment for the genes in the top two percent of Fst and XP-CLR windows. A total of 406 genes for Fst and 391 genes for XP-CLR were queried, with 18,883 genes in the background. The GO-term types are denoted by F (molecular function) and P (biological process). Query items and BG items are the number of genes from the query and background that were associated with the GO-term, on which the calculation of the p-value and false discovery rate (FDR) is based.
GO term Type Description Query Items BG Items p-value FDR
Fst
GO:0043167 F ion binding 92 2992 0.0003 0.015
GO:0043169 F cation binding 92 2989 0.0002 0.015
GO:0046872 F metal ion binding 92 2983 0.0002 0.015
GO:0006807 P nitrogen compound metabolic process 77 2359 0.0002 0.012
GO:0042221 P response to chemical stimulus 16 238 0.0001 0.0087
GO:0016209 F antioxidant activity 15 165 7.00E-06 0.0007
GO:0006979 P response to oxidative stress 15 155 3.00E-06 0.0004
GO:0016684 F oxidoreductase activity, acting on peroxide as acceptor 15 155 3.00E-06 0.0005
GO:0004601 F peroxidase activity 15 155 3.00E-06 0.0005
GO:0005976 P polysaccharide metabolic process 9 53 6.00E-06 0.0006
GO:0000272 P polysaccharide catabolic process 7 29 9.00E-06 0.0008
GO:0004568 F chitinase activity 7 21 1.00E-06 0.0005
GO:0006022 P aminoglycan metabolic process 7 19 8.00E-07 0.0001
GO:0006026 P aminoglycan catabolic process 7 18 6.00E-07 0.0001
GO:0006032 P chitin catabolic process 7 18 6.00E-07 0.0001
GO:0006030 P chitin metabolic process 7 18 6.00E-07 0.0001
XP-CLR
GO:0016829 F lyase activity 16 250 0.0001 0.023
GO:0016667 F oxidoreductase activity, acting on sulfur group of donors 10 123 0.0004 0.031
GO:0016835 F carbon-oxygen lyase activity 9 114 0.0009 0.04
GO:0050660 F FAD binding 9 110 0.0007 0.04
GO:0015036 F disulfide oxidoreductase activity 9 98 0.0003 0.031
GO:0015035 F protein disulfide oxidoreductase activity 9 96 0.0003 0.031
GO:0045735 F nutrient reservoir activity 8 90 0.0009 0.04
GO:0030145 F manganese ion binding 8 65 0.0001 0.023
GO:0016838 F carbon-oxygen lyase activity, acting on phosphates 6 53 0.0012 0.048
GO:0010333 F terpene synthase activity 6 47 0.0007 0.04
25
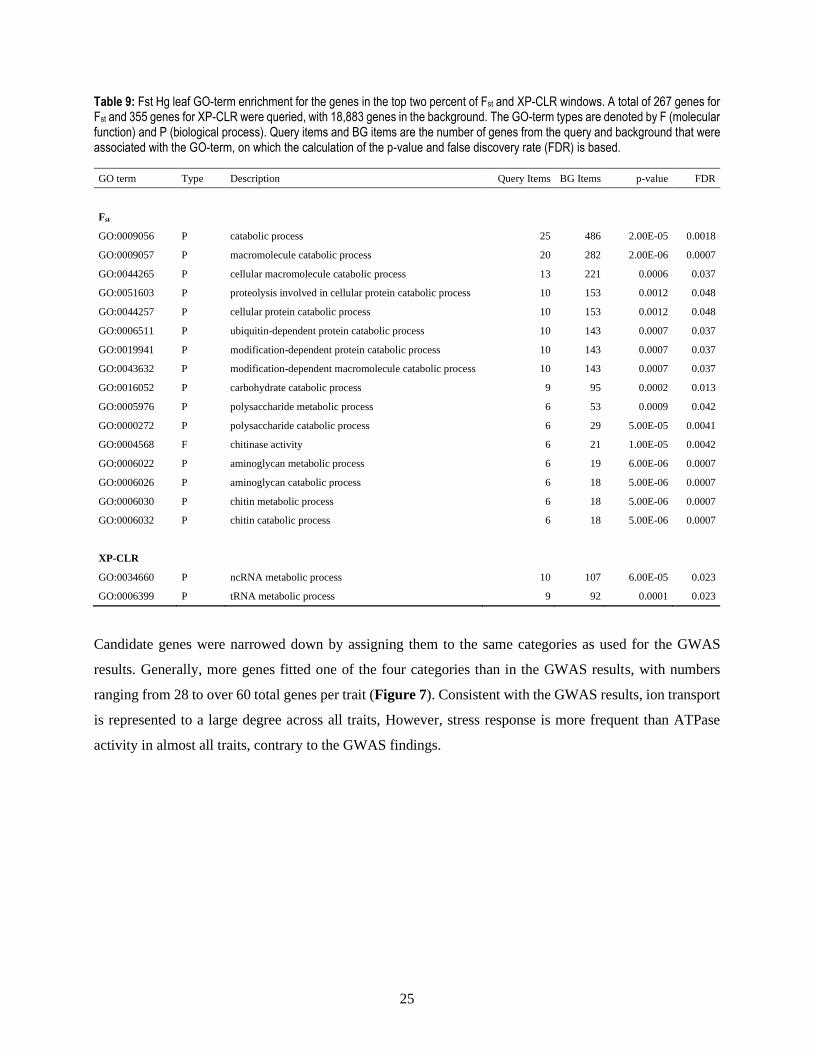
Table 9: Fst Hg leaf GO-term enrichment for the genes in the top two percent of Fst and XP-CLR windows. A total of 267 genes for Fst and 355 genes for XP-CLR were queried, with 18,883 genes in the background. The GO-term types are denoted by F (molecular function) and P (biological process). Query items and BG items are the number of genes from the query and background that were associated with the GO-term, on which the calculation of the p-value and false discovery rate (FDR) is based.
GO term Type Description Query Items BG Items p-value FDR
Fst
GO:0009056 P catabolic process 25 486 2.00E-05 0.0018
GO:0009057 P macromolecule catabolic process 20 282 2.00E-06 0.0007
GO:0044265 P cellular macromolecule catabolic process 13 221 0.0006 0.037
GO:0051603 P proteolysis involved in cellular protein catabolic process 10 153 0.0012 0.048
GO:0044257 P cellular protein catabolic process 10 153 0.0012 0.048
GO:0006511 P ubiquitin-dependent protein catabolic process 10 143 0.0007 0.037
GO:0019941 P modification-dependent protein catabolic process 10 143 0.0007 0.037
GO:0043632 P modification-dependent macromolecule catabolic process 10 143 0.0007 0.037
GO:0016052 P carbohydrate catabolic process 9 95 0.0002 0.013
GO:0005976 P polysaccharide metabolic process 6 53 0.0009 0.042
GO:0000272 P polysaccharide catabolic process 6 29 5.00E-05 0.0041
GO:0004568 F chitinase activity 6 21 1.00E-05 0.0042
GO:0006022 P aminoglycan metabolic process 6 19 6.00E-06 0.0007
GO:0006026 P aminoglycan catabolic process 6 18 5.00E-06 0.0007
GO:0006030 P chitin metabolic process 6 18 5.00E-06 0.0007
GO:0006032 P chitin catabolic process 6 18 5.00E-06 0.0007
XP-CLR
GO:0034660 P ncRNA metabolic process 10 107 6.00E-05 0.023
GO:0006399 P tRNA metabolic process 9 92 0.0001 0.023
Candidate genes were narrowed down by assigning them to the same categories as used for the GWAS
results. Generally, more genes fitted one of the four categories than in the GWAS results, with numbers
ranging from 28 to over 60 total genes per trait (Figure 7). Consistent with the GWAS results, ion transport
is represented to a large degree across all traits, However, stress response is more frequent than ATPase
activity in almost all traits, contrary to the GWAS findings.
26
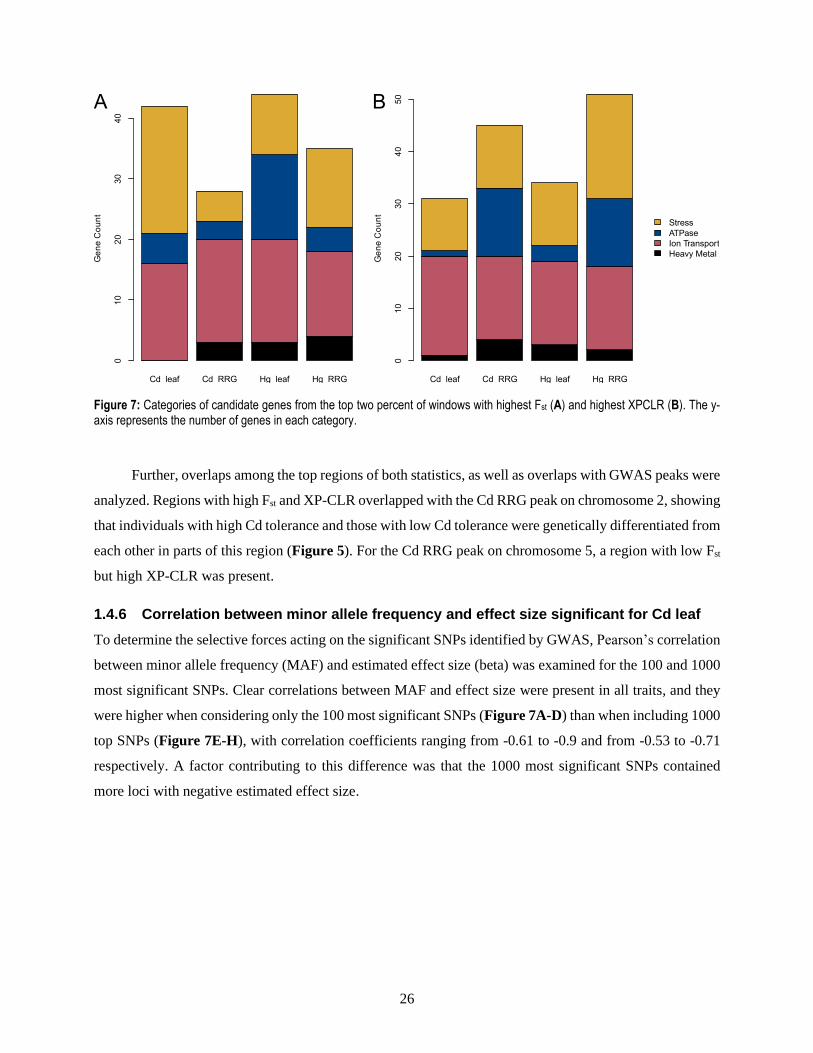
Figure 7: Categories of candidate genes from the top two percent of windows with highest Fst (A) and highest XPCLR (B). The y-axis represents the number of genes in each category.
Further, overlaps among the top regions of both statistics, as well as overlaps with GWAS peaks were
analyzed. Regions with high Fst and XP-CLR overlapped with the Cd RRG peak on chromosome 2, showing
that individuals with high Cd tolerance and those with low Cd tolerance were genetically differentiated from
each other in parts of this region (Figure 5). For the Cd RRG peak on chromosome 5, a region with low Fst
but high XP-CLR was present.
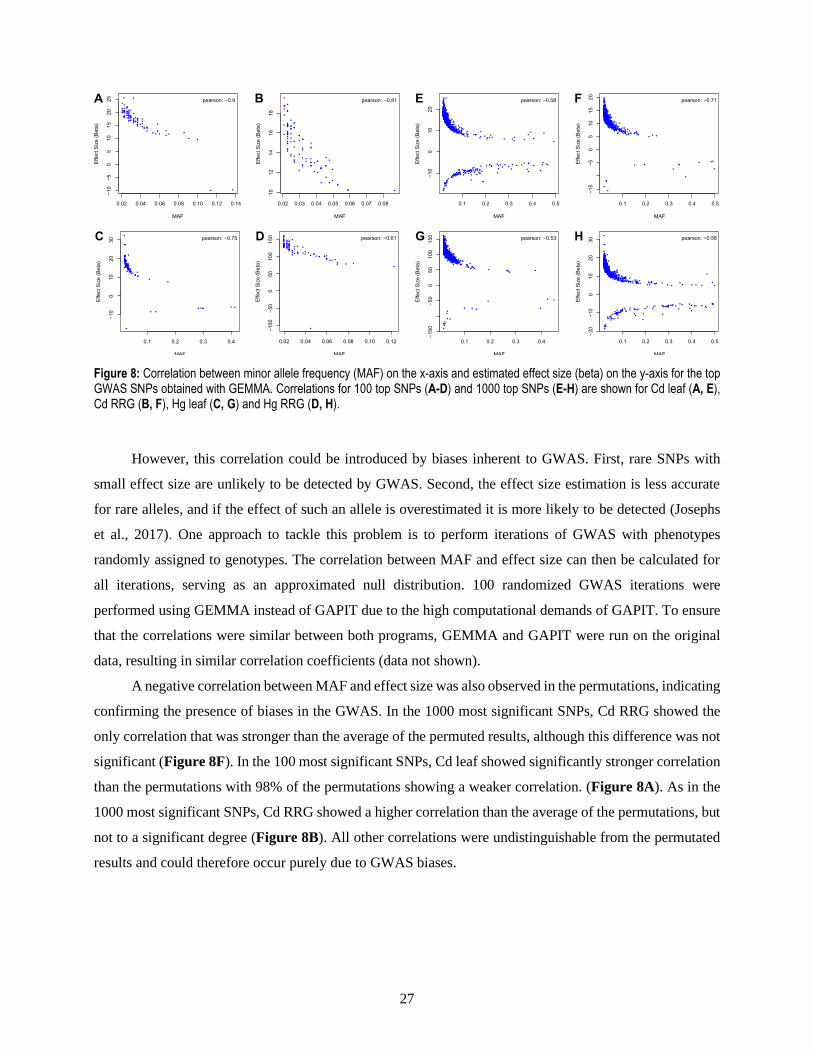
1.4.6 Correlation between minor allele frequency and effect size significant for Cd leaf
To determine the selective forces acting on the significant SNPs identified by GWAS, Pearson’s correlation
between minor allele frequency (MAF) and estimated effect size (beta) was examined for the 100 and 1000
most significant SNPs. Clear correlations between MAF and effect size were present in all traits, and they
were higher when considering only the 100 most significant SNPs (Figure 7A-D) than when including 1000
top SNPs (Figure 7E-H), with correlation coefficients ranging from -0.61 to -0.9 and from -0.53 to -0.71
respectively. A factor contributing to this difference was that the 1000 most significant SNPs contained
more loci with negative estimated effect size.
27
Figure 8: Correlation between minor allele frequency (MAF) on the x-axis and estimated effect size (beta) on the y-axis for the top GWAS SNPs obtained with GEMMA. Correlations for 100 top SNPs (A-D) and 1000 top SNPs (E-H) are shown for Cd leaf (A, E), Cd RRG (B, F), Hg leaf (C, G) and Hg RRG (D, H).
However, this correlation could be introduced by biases inherent to GWAS. First, rare SNPs with
small effect size are unlikely to be detected by GWAS. Second, the effect size estimation is less accurate
for rare alleles, and if the effect of such an allele is overestimated it is more likely to be detected (Josephs
et al., 2017). One approach to tackle this problem is to perform iterations of GWAS with phenotypes
randomly assigned to genotypes. The correlation between MAF and effect size can then be calculated for
all iterations, serving as an approximated null distribution. 100 randomized GWAS iterations were
performed using GEMMA instead of GAPIT due to the high computational demands of GAPIT. To ensure
that the correlations were similar between both programs, GEMMA and GAPIT were run on the original
data, resulting in similar correlation coefficients (data not shown).
A negative correlation between MAF and effect size was also observed in the permutations, indicating
confirming the presence of biases in the GWAS. In the 1000 most significant SNPs, Cd RRG showed the
only correlation that was stronger than the average of the permuted results, although this difference was not
significant (Figure 8F). In the 100 most significant SNPs, Cd leaf showed significantly stronger correlation
than the permutations with 98% of the permutations showing a weaker correlation. (Figure 8A). As in the
1000 most significant SNPs, Cd RRG showed a higher correlation than the average of the permutations, but
not to a significant degree (Figure 8B). All other correlations were undistinguishable from the permutated
results and could therefore occur purely due to GWAS biases.

28
Figure 9: Pearson’s correlation coefficients between minor allele frequency and effect size of top GWAS SNPs obtained with GEMMA. Correlation coefficients of unpermuted data (red line) and 100 permutations (grey bars) are shown for 100 top SNPs (A-D) and 1000 top SNPs (E-H). Correlations for 100 top SNPs (A-D) and 1000 top SNPs (E-H) are shown for Cd leaf (A, E), Cd RRG (B, F), Hg leaf (C, G) and Hg RRG (D, H). The real correlation is significantly stronger than in the permutations in 2A, all other cases do not deviate significantly.
As a second approach to detect selection, Tajima’s D was used to determine whether an enrichment
of rare alleles was present among the most significant GWAS SNPs. To this end, Tajima’s D was calculated
in a sliding window analysis with a window size of 50 b. The average Tajima’s D of windows containing
one or several of the 1000 most significant GWAS SNPs was then compared to the average Tajima’s D of
windows containing SNPs from a neutral background. Since the roughly 800,000 SNPs used for admixture
analysis were selected based on independence and high genotyping rate they were used for the neutral
background.
The average Tajima’s D of the background was negative, indicating that overall rare alleles were
more common than expected under neutrality. Nevertheless, Tajima’s D was found to be significantly lower
than the background in the most significant GWAS SNPs for three out of the four analyzed traits, with the
two leaf accumulation traits being the most significant. In contrast, Hg RRG did not show a significant
difference. It can be concluded that generally the 1000 most significant GWAS SNPs do seem to be enriched
in rare alleles (Table 10, Figure 10).
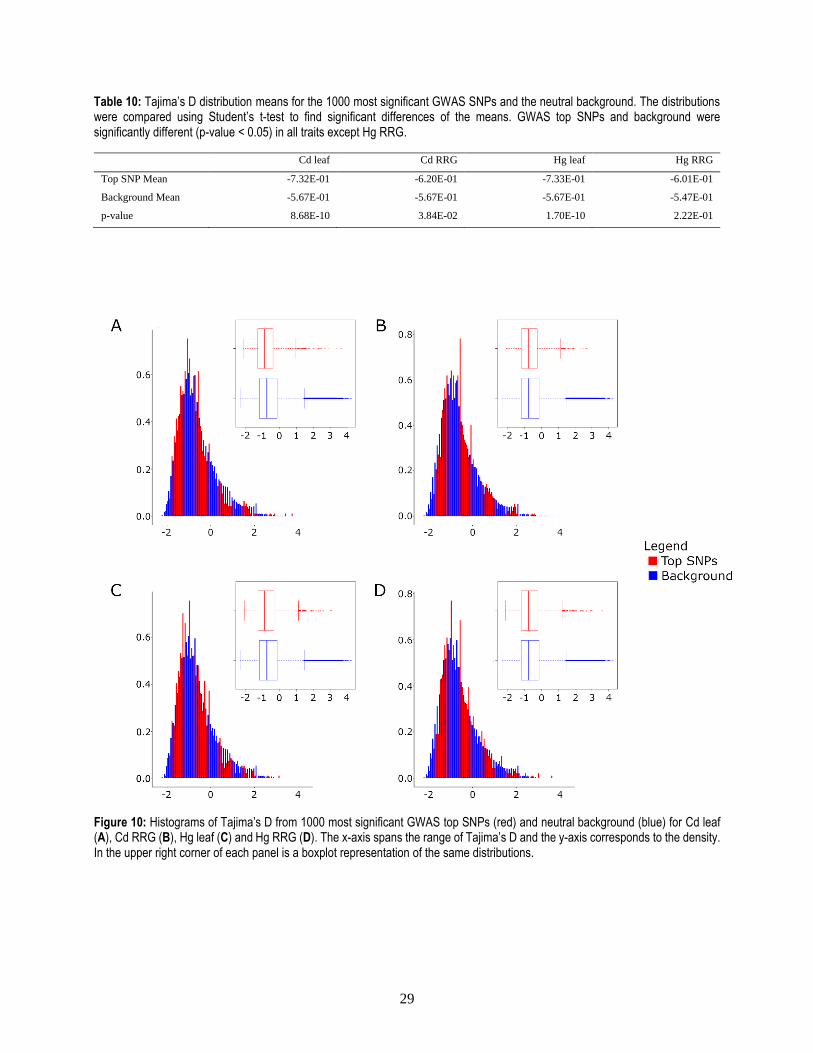
29
Table 10: Tajima’s D distribution means for the 1000 most significant GWAS SNPs and the neutral background. The distributions were compared using Student’s t-test to find significant differences of the means. GWAS top SNPs and background were significantly different (p-value < 0.05) in all traits except Hg RRG.
Cd leaf Cd RRG Hg leaf Hg RRG
Top SNP Mean -7.32E-01 -6.20E-01 -7.33E-01 -6.01E-01
Background Mean -5.67E-01 -5.67E-01 -5.67E-01 -5.47E-01
p-value 8.68E-10 3.84E-02 1.70E-10 2.22E-01
Figure 10: Histograms of Tajima’s D from 1000 most significant GWAS top SNPs (red) and neutral background (blue) for Cd leaf (A), Cd RRG (B), Hg leaf (C) and Hg RRG (D). The x-axis spans the range of Tajima’s D and the y-axis corresponds to the density. In the upper right corner of each panel is a boxplot representation of the same distributions.

30
1.5 Discussion
1.5.1 Standing genetic variation and heritability
A large variability of Cd leaf accumulation was found in M. truncatula, comparable to findings in other
plant species such as Arabidopsis thaliana (Chao et al., 2012), Hordeum vulgare (barley) (Wu et al., 2015)
and Brassica napus (rapeseed) (Chen et al., 2018). Interestingly, Hg leaf accumulation showed variability
that was about 5 to 10 times larger than that of Cd leaf accumulation, depending on whether the outlier was
included or not. A previous study on four low- and four high-tolerance M. truncatula accessions reported
that the four high-tolerance accessions showed accumulation levels close to the average found here.
However, the plants were subjected to five times higher Hg concentrations for a much longer time (12
instead of 2 days) (García de la Torre et al., 2013). Two sister taxa of M. truncatula, Medicago sativa and
Medicago vulgare were previously analyzed for Hg leaf accumulation. The average Hg accumulated in the
leaves of M. sativa, was lower than the values found in this study, and the variance was much lower.
Importantly, this difference is pronounced further by the fact that M. sativa was exposed to a Hg
concentration that was 8 times higher. The levels of a M. vulgare population growing naturally in a Hg
contaminated site was closer to the levels found here with an average of 183.4 ± 7.1 µg g-1. However, it
should be noted that since these samples were taken from naturally growing plant population a direct
comparison is not possible, and populations from two other sites showed much lower Hg levels (Carrasco-
Gil et al., 2013). Taken together with findings from other plant species where Hg accumulation was lower
despite higher Hg exposures (Heidenreich et al., 1999; Israr et al., 2006; Moreno et al., 2008; Wang and
Greger, 2004; Zhao et al., 2020), these findings suggest that M. truncatula could be a good candidate for
phytoremediation of Hg contaminated soils. Hg tolerance, as measured by relative root growth, showed a
similar distribution as found in a previous study on M. truncatula, with most accessions being sensible to
the applied Hg concentrations. However, no accessions showing better growth when exposed to Hg were
found here, although some individuals showed unchanged growth rates (García de la Torre et al., 2013).
The correlation between the relative root growth traits was the highest among all phenotypes and
implies the use of shared tolerance mechanisms to deal with Hg and Cd toxicity. Interestingly, no correlation
between Hg and Al tolerance was found in a previous study of M. truncatula, suggesting that these shared
tolerance mechanisms are not used for all metals (García de la Torre et al., 2013). No correlation in leaf
accumulation of Hg and Cd was found, and it is therefore likely that root-to-shoot transport is mediated by
proteins specific to each metal. Of further interest is the lack of correlation between RRG and leaf
accumulation, as it implies that not all tolerant accessions achieve tolerance by preventing uptake of heavy
metals into the shoot. Conversely, even many accessions that manage to prevent uptake and accumulation

31
of metal ions have problems growing on contaminated soils. This is consistent with findings in Arabidopsis
halleri (Bert et al., 2003) and Thlaspi caerulescens (Zha et al., 2004), where no correlation between Cd
tolerance and accumulation was found. This lack of correlation could in part be explained by some
individuals utilizing an avoidance strategy by adapting the mechanisms involved in metal uptake instead of
intracellular detoxification.
1.5.2 Population structure analysis lead to new estimate of admixture components
In previous studies, a population structure consisting of three admixture components was commonly used.
Recently, seven or more admixture components were proposed to better represent the population structure
of M. truncatula (Gentzbittel et al., 2019). Here, five admixture components were found to have the lowest
CV error, which was surprising as the same data and methods were used. The number of estimated admixture
components increased when more SNPs were included, likely due to more fine-grained genomic differences
being detectable with more SNPs. However, since the same data and methods were used, the number of
SNPs included in the final analysis was the same as well. A possible factor that could contribute to this
difference in results could be the choice of seed passed to admixture, since the cross-validation error depends
on the seed. This effect could be further enhanced by the fact that more replicates were used here.
Nevertheless, it is unlikely that these considerations can fully explain such a large difference in results, and
the cause remains unclear.
The geographical distribution of admixture components seemed reasonable and fit well into the
broader separation into the two major groups used by several previous studies (Bonhomme and Jacquet,
2019). The far west (FW) group, containing mostly accessions from Spain, Portugal, Morocco, and west
Algeria, was covered by k1 and parts of k3. The circum group (C), containing accessions from other
countries around the Mediterranean Sea, corresponded to k2, k4 and k5.
The main purpose of a more accurate population structure was the inclusion in the subsequent GWAS
to improve the model fit. However, improvements were only marginal, which has been reported in a previous
GWAS on M. truncatula (Stanton-Geddes et al., 2013). This is likely due to GAPIT already using kinship
matrices estimated from the provided SNPs which are partly redundant with population structure. The
number of admixture components used is therefore unlikely to influence the GWAS results to a large degree
Nevertheless, investigating the reasons for the difference in results could be of interest, especially when
considering that adding the four heavy metal tolerant accessions to the analysis would require recalculating
the population structure with these four accessions included as well.

32
1.5.3 Genome-wide association mapping identified candidate genes
Cd and Hg tolerance and accumulation in M. truncatula were revealed to be complex, polygenic traits and
SNPs with high association were found on almost all chromosomes. SNPs were assumed to be in LD with
genes closer than 1 kb, which lead to about half of all top SNPs being annotated with a gene. While the
choice of 1 kb was very strict, the HapMap panel contains a large number of SNPs and the resulting density
should result in all genes having multiple SNPs in 1 kb range. The fact that about 20 percent of all top SNPs
were annotated with transposable elements supports their involvement in heavy metal tolerance and
accumulation. Most notably, transposable elements were shown to be responsible for reduced Cd uptake in
rice by jumping into an exon of the transporter NRAMP5 (Ishikawa et al., 2012). Additionally, Cd and Hg
stress have been shown to upregulate some transposable elements in rice (Cong et al., 2019) and Cd stress
in Chlamydomonas acidophila (Puente-Sánchez et al., 2018) as well as As stress in A. thaliana (Castrillo
et al., 2013) resulted in strongly increased transposon expression.
Synonymous SNPs are expected to be more frequent than non-synonymous SNPs since missense
mutations are likely to disrupt protein function and therefore negatively impact fitness. However, non-
synonymous SNPs were more frequent in the top SNPs, indicating that a considerable number of high impact
SNPs were identified by GWAS. This is consistent with several of the selected candidate genes having
multiple missense mutations in their coding sequences.
Analysis of GO-term from genes close to the top SNPs showed an enrichment in defense response for
two traits, which could hint at the involvement of disease resistance genes in heavy metal tolerance and
accumulation. This is consistent with a previous study that showed differential regulation upon Hg exposure
of several genes belonging the TIR-NBS-LRR family by miRNAs in M. truncatula. (Zhou et al., 2012). The
enrichment of stress response in Cd RRG could be an indicator of a general, non-specific stress response
being active in the roots, in agreement with the correlations of the RRG traits. This could for example include
responses to reactive oxygen species (ROS). The enrichment for ATPases in Hg RRG might in part stem
from ATP dependent transporters involved in heavy metal transport.
A large category of the identified candidate genes were ATP-dependent transporters for all traits
except for Hg RRG (Table 4). ABCC transporters were especially well represented. Medtr5g094830, the
ortholog to AtABCC3 was the only candidate gene relevant to multiple traits, being associated to both leaf
accumulation traits. Three synonymous substitutions in Medtr5g094830 were significantly associated with
Cd leaf accumulation, while an intronic SNP was significantly associated with Hg leaf accumulation.
AtABCC3 was shown to sequester Cd ions into the vacuole in leaf tissues and was proposed to combat Cd
toxicity in coordination with AtABCC1 and AtABCC2 (Brunetti et al., 2015). If AtABCC3 also sequesters
Hg as is the case with AtABCC1 and AtABCC2 (Park et al., 2012), this would explain why ABCC3 is

33
required for both traits since accumulation requires an effective detoxification mechanism in the leaf tissues.
The second candidate gene identified for Cd leaf accumulation was Medtr7g092070, orthologous to
AtOXS2 (Oxidative Stress 2, also known as DEG9). This zinc-finger type transcription factor was shown
to be required for Cd and salt stress tolerance in A. thaliana as it enters the nucleus upon stress exposure,
where it triggers the expression of downstream stress response genes (He et al., 2016; Jing et al., 2019).
For Hg leaf accumulation, two associated transporters of different type were discovered in addition
to ABCC3. Medtr2g036380, orthologous to HMA2 (heavy metal ATPase 2) contained an intronic SNP in
the splice donor site, potentially prohibiting expression by interfering with correct splicing. HMA2 has been
shown to mediate root-to-shoot transport of Cd by loading Cd ions into the vasculature in rice (Satoh-
Nagasawa et al., 2012; Takahashi et al., 2012) and potentially barley (Wu et al., 2015). Interestingly, only
Hg and not Cd leaf accumulation (as found in other species) was associated with HMA2 in M. truncatula.
In rice, HMA2 was shown to deliver Zn to developing tissues where it is essential for normal development
(Yamaji et al., 2013), therefore implying a trade-off between reduced Cd uptake and growth inhibition. It is
possible, that a similar trade-off exists in M. truncatula, the only difference being that HMA2 transports Hg
instead of Cd. Further, Medtr3g088460, an ortholog of NRAMP6, also contained an intronic SNP for Hg
leaf accumulation. NRAMP6 was reported to be an intracellular transporter promoting Cd leaf accumulation
by increasing root-to-shoot transport in A. thaliana (Cailliatte et al., 2009; Wang et al., 2019) and was
associated with Cd tolerance in rapeseed (Chen et al., 2018). NRAMP5 was shown to mediate uptake of Mn
into the roots in rice, an essential metal which is required for proper growth, therefore implying another
tradeoff between tolerance and growth inhibition (Sasaki et al., 2012).
In the case of Cd RRG, Medtr8g015980, orthologous to AtABCC8 (also known as AtMRP6), was
found to contain 2 significant SNPs, both of which lead to missense mutations potentially disrupting protein
function. Note that this gene should not be confused with AtABCC6, which was previously called AtMRP6.
Consequently, the gene here is not the same that was implied to be involved in Cd tolerance (Gaillard et al.,
2008) and its function is not yet fully understood but likely similar to other ABCC transporters. Further, a
significant synonymous SNP for Cd RRG was found in the ortholog of AtABCC2. AtABCC2 was shown
to be involved in Cd and Hg tolerance by sequestering phytochelatin-ion complexes into the vacuole in root
cells, thereby reducing root-to-shoot transport and accumulation of both Cd and Hg in the leafs (Park et al.,
2012). Medtr6g090280, an ortholog of A. thaliana GGT3 (Gamma-Glutamyl Transpeptidase 3), contained
a significant intronic SNP for Cd RRG. GGT3 is involved in the breakdown of glutathione, which is the
basis for phytochelatin synthesis (Ha et al., 1999). Since the aforementioned ABCC transporters are
dependent on phytochelatins, it seems reasonable that genes involved in the biosynthetic pathway of
phytochelatins can also influence tolerance, and several genes involved in the glutathione metabolic process

34
were found to be associated with Cd accumulation in rapeseed (Chen et al., 2018). A metallochaperone,
HIPP3 (Heavy metal‐associated isoprenylated plant protein 3), was also identified as candidate. Proteins of
the HIPP family contain a metal binding domain (HMA) and were shown to be involved in heavy metal
homeostasis, especially in Cd tolerance (Abreu‐Neto et al., 2013). Finally, Medtr2g069090 is orthologous
to AT5G43440, a gene that is similar to ACC oxidase and was shown to be induced by ionizing radiation
(Culligan et al., 2006).
Two genomic regions where several candidate genes for Hg RRG were clustered together were found,
one on chromosome 2, the other on chromosome 5. The peak on chromosome 2 contained multiple ankyrin
repeat genes with a large number of top SNPs in 1 kb proximity, of which many were missense mutations
(Table 5). Most promising was Medtr2g438720 containing 9 non-synonymous SNPs Two additional SNPs,
one intronic, the other 106 b upstream, were among the top SNPs for Hg leaf, therefore associating
Medtr2g438720 with both traits. Medtr2g438720 was shown to be associated with salt tolerance in
Medicago sativa (Liu et al., 2019). Another ankyrin repeat gene in the peak, Medtr2g438740, was in
proximity of nine top SNPs for Cd RRG, of which three caused non-synonymous substitutions. This gene
was so far only proposed to be involved in innate immunity since it is upregulated in M. truncatula
accessions susceptible to Verticillium Wilt (Toueni et al., 2016). A GWAS on salinity tolerance in M.
truncatula found peaks associated with at least four traits in a similar region on chromosome 2, with the
closest peak being approximately 800 kb away from the peak identified here (Kang et al., 2019). This part
of chromosome 2 therefore contains genes involved in stress responses to multiple different ions.
The peak on chromosome 5 contained multiple candidate genes (Table 6). Medtr5g070330,
orthologous to CAX3 (cation exchanger 3), was close to four Cd RRG top SNPs, three intronic and one
located in the 3’-UTR. Upregulation of CAX3 was reported to increase Cd tolerance in A. thaliana, possibly
by sequestering Cd into the vacuole. Expression levels of CAX3 are upregulated by Hb1 (class 1
hemoglobin), which was shown to inhibit the expression of IRT1 (iron-regulated transporter 1) and PDR8
(pleiotropic drug resistance 8) (Bahmani et al., 2019). IRT1 was reported to be associated with Cd
accumulation in barley (Wu et al., 2015) and rapeseed (Chen et al., 2018) while PDR8 was shown to be a
Cd extrusion pump conferring heavy metal resistance in A. thaliana. While IRT1 and PDR8 were not found
to be associated with any of the four traits, PDR3 was directly next to CAX3 in the peak, and contained
three intronic SNPs which were significantly associated with Cd RRG. This suggests that the orthologs of
CAX3 and PDR3 in M. truncatula respond collectively to Hg exposure. Additionally, the peak contained
Medtr5g070270, which was close to six Cd RRG top SNPs, with three of those causing non-synonymous
substitutions. Medtr5g070270 is orthologous to AtCPT7 (also known as AtCPT4), which is involved in
dolichol synthesis and was shown to be upregulated after exposure to Cd in A. thaliana (Jozwiak et al.,

35
2017). Further, the peak contained an ortholog of a damaged DNA-binding protein, namely DDB2,
indicating that DNA Cd ion stress causes DNA damage. DDB2 mutants were shown to be susceptible to
oxidative stress in A. thaliana (Ly et al., 2013). Finally, the presence of a cytochrome P450 family protein
containing a significant missense mutation could hint at ROS detoxification, as reported in wheat (Wang et
al., 2020).
Interestingly, HMA3 was not found to be involved in Cd or Hg accumulation in M. truncatula, despite
being one of the most ubiquitous genes involved in Cd accumulation, with involvement in A. thaliana (Chao
et al., 2012), rice (Miyadate et al., 2011; Ueno et al., 2010), barley (Wu et al., 2015), T. caerulescens (Ueno
et al., 2011) and S. Plumbizincicola (Liu et al., 2017).
1.5.4 Correlation between minor allele frequency and effect size implies selection
A newly occurring mutation is likely to be deleterious and therefore selected against, leading to a low
frequency of the new allele in the population. Since alleles that have a stronger effect on the phenotype
impact the fitness to a higher degree, selection is expected to act stronger on large effect alleles. Combined,
this should lead to negative correlation between the effect size of an allele and its frequency in the
population. Cd leaf showed a significant negative correlation between minor allele frequency (MAF) and
estimated effect size and the same correlation is likely present in Cd RRG. This implies that the SNPs
associated with these traits are linked to genes that affect the phenotype and are therefore subject to purifying
selection. The standing genetic variation of Cd leaf accumulation, and possibly Cd tolerance, is therefore
likely maintained by mutation-selection balance. A correlation between MAF and effect size was found for
two out of three analyzed traits in a previous GWAS analysis in M. truncatula (Stanton-Geddes et al., 2013)
and for the gene expression levels in Capsella grandiflora (Josephs et al., 2015).
Most top SNPs had a positive effect size, meaning that the minor allele lead to increased tolerance or
accumulation compared to the major allele. This implies that most mutations causing increased tolerance or
accumulation are deleterious under normal conditions and therefore selected against. In the case of increased
tolerance, the production of compounds required for tolerance is linked to additional metabolic costs, which
would be wasted in plants growing on uncontaminated soils (Maestri et al., 2010). Therefore, these alleles
would only be favored in plants exposed to heavy metal contamination while being selected against in all
other plants, resulting in local adaptation. For accumulation, several of the identified candidate genes were
found to be transporters for both heavy metals as well as metals essential for plant growth, implying a trade-
off. Under normal conditions, increasing the uptake of essential metals can be deleterious, as they can be
toxic at too high concentrations (Maestri et al., 2010). On the other hand, in environments where essential
metals are scarce, increasing their uptake could be beneficial and therefore favored by selection, again

36
leading to local adaptation. However, these plants would then also accumulate more heavy metals due to the
shared mechanisms of accumulation.
When including more SNPs, the percentage of SNPs with negative effect size increased, explaining
the lower correlation between MAF and effect size when performing the analysis on top 1000 SNPs as
opposed to 100 top SNPs. For these negative effect size SNPs, the majority of individuals possesses the
allele increasing tolerance or accumulation. As it is easier in GWAS to identify SNPs with large effects on
the phenotype, the additionally included SNPs are likely to have lower effect sizes and the increase in
tolerance or accumulation they confer could be less detrimental in non-contaminated environments.
As a further indicator for selection, an enrichment for rare alleles among the top GWAS SNPs was
tested by calculating Tajima’s D. Interestingly, Tajima’s D was already negative for the neutral background,
signifying a genome-wide abundance of rare alleles. This has been shown to be the case in M. truncatula
before and was concluded to occur due to a strong population expansion (De Mita et al., 2011, 2007). The
mean Tajima’s D of the background was closer to neutrality (-0.56) than previously reported values (-0.79)
(De Mita et al., 2011), which could stem from the bigger number of individuals used here, or it could indicate
that the SNPs included in the background were biased towards regions of low selective pressure.
Nevertheless, Tajima’s D of the GWAS top SNPs was significantly lower than the background for three
traits, confirming that most of them seem to be subject to selection.
1.5.5 Regions of genomic differentiation complement genome-wide association mapping
If mechanisms of heavy metal tolerance are shared among tolerant individuals, the genomic regions involved
in these mechanisms are expected to be more similar among tolerant and intolerant accessions than between
them. The same is true for heavy metal accumulation. Fst and XP-CLR were used to find such regions by
analyzing the 30 highest and 30 lowest accessions of each trait. Generally, Fst and XP-CLR showed similar
patterns across all chromosomes, with XP-CLR peaks located in sub-regions of Fst peaks. This is expected,
as Fst identifies regions of genomic differentiation in general, whereas XP-CLR more specifically identifies
regions of genomic differentiation that were likely caused by a selective sweep (Chen et al., 2010).
Genes in the top two percent percent of windows with highest likelihoods were checked for enriched
GO-terms to examine their relevance. Overall, Fst for Cd and Hg leaf accumulation showed the largest
amount of enriched GO-terms. Several redox homeostasis related processes such as response to oxidative
stress, peroxidase activity and antioxidant activity were enriched for Cd leaf, consistent with ROS formation
due to Cd exposure. Further, metal ion binding was enriched, implying sequestration or transportation of Cd
ions. Cd RRG and Hg leaf were harder to interpret, both were enriched in ubiquitin-dependant protein
catabolism as well as transfer of sugar groups. The link to heavy metal tolerance or accumulation is unclear.

37
The GO terms in the top XP-CLR genes for Cd leaf were consistent with the findings from Fst, with
redox functions and ion binding being enriched, although only manganese ion binding specifically was
enriched here. This could hint at the involvement of genes that simultaneously transport Mn and Cd ions,
similar to OsNRAMP5. Cd RRG and Hg leaf only had three and two enriched terms respectively, and as
with the results from Fst, an obvious link with the phenotypes was not apparent.
It should be noted that Fst and XP-CLR were intended to be used on real populations, and not groups
defined by phenotype data as done here. Nevertheless, the identified regions contained genes relevant to the
traits, confirming that this approach is reasonable and can be used to complement GWAS analysis. On one
hand, finding overlaps with regions identified by GWAS can serve to narrow down the list of candidate
genes. On the other hand, this approach could also be used to find novel candidate genes that were not
identified by GWAS due to their small effects on the phenotype.

38
2 Introgression
2.1 Introduction
The role of adaptive introgression in plants has been studied extensively, and previous phylogenomics
analysis of the genus Medicago have shown chromosomal regions show phylogenetic incongruence (Yoder
et al., 2013). Within Medicago there is annual-perennial variation, mating system variation, floral variation
that corresponds with mating system, seed pod variation, polyploidy and chromosome loss, variable host
preferences for rhizobia species, and environmental heterogeneity. Most Medicago species are highly self-
fertilizing except three separate outcrossing lineages (one containing diploid and polyploid M. sativa).
Medicago has ca. 83 species, with the majority of them having largely overlapping ranges surrounding the
Mediterranean Basin. An adaptive radiation originated in this region, with putative sympatric speciation in
historical and recent time scales. A few species have greatly expanded their ranges beyond Mediterranean
regions as far north as Scandinavia, eastward into Russia, and Asia, and some have invaded into the Western
hemisphere. These broad dispersers provide powerful contrasts to the strictly Mediterranean species by
comparing adaptive (divergent) traits and genomic regions. Existing resources include a high2020-05-15
23:43:00 quality reference genome for M. truncatula (8 assembled chromosomes, and gene annotations),
262 resequenced M. truncatula lines (HapMap collection), and 29 resequenced Medicago sister species.
Rapid evolutionary change can produce reticulating or network-like patterns in phylogenies due to species-
tree and gene-tree conflict in some genomic regions. Phylogenetic analyses using only few loci or genome-
wide data have shown reticulating patterns in Medicago, particularly at early, deeper nodes in the phylogeny.
Incomplete lineage sorting, hybridization, and introgression have been proposed to cause these patterns in
the Medicago phylogeny.

39
2.2 Material and Methods
To test for gene flow between Medicago truncatula and closely related sister taxa, ABBA BABA analysis
(Martin et al., 2015) (https://github.com/simonhmartin/genomics_general) was performed. First, a geno file
was generated from the unimputed HapMap VCF file containing only the required accessions using the
provided parseVCF.py script. The taxa and corresponding samples chosen were Medicago truncatula
truncatula (HM005, HM013), Medicago truncatula tricycla (HM018, HM029), Medicago littoralis
(HM022, HM030) and Medicago sativa sativa as outgroup (HM102). The M. truncatula truncatula samples
were chosen such that they were in close geographic proximity to locations where the samples of the other
taxa were taken. One sample is therefore from Algeria (HM005), the other from France (HM013).
Genome wide allele frequencies were calculated from the geno file using the freq.py script and were
used to calculate Patterson’s D. To determine the standard deviation of Patterson’s D a block jackknifing
procedure was utilized relying on a slightly modified version of the provided jacknife.R script.
Chromosome-wise Patterson’s D values were calculated in the same way.
2.3 Results and Discussion
The chromosomes with the highest introgression were also those with the highest rates of recombination
that were estimated in previous studies (Branca, Paape et al. 2011; Paape et al. 2012). The correlation
between recombination rate and introgression has never been shown in wild plants and has only been
examined in butterflies (Martin et al., 2019). To determine whether introgression occurred between
Medicago truncatula and its closest sister taxa, ABBA BABA analysis was performed using Medicago
truncatula truncatula, Medicago truncatula tricycle and Medicago littoralis, with Medicago sativa sativa
being used as outgroup. All chromosomes showed positive values of Patterson’s D, indicating that some
introgression between Medicago truncatula truncatula and Medicago littoralis occured. Interestingly, two
chromosomes with high introgression (chromosomes 3 and 6) also showed the highest recombination rates.
This finding suggests that outcrossing lineages may have contributed to introgressed regions in modern day
selfing lineages such as M. truncatula.
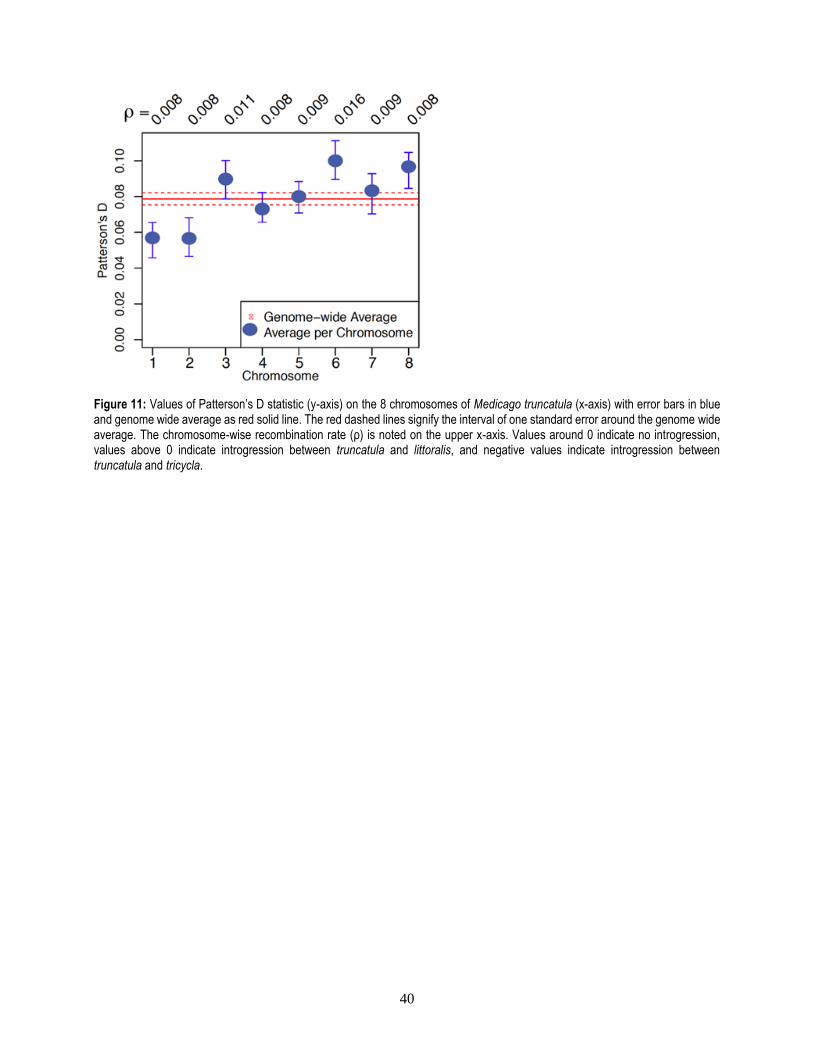
40
Figure 11: Values of Patterson’s D statistic (y-axis) on the 8 chromosomes of Medicago truncatula (x-axis) with error bars in blue and genome wide average as red solid line. The red dashed lines signify the interval of one standard error around the genome wide average. The chromosome-wise recombination rate (ρ) is noted on the upper x-axis. Values around 0 indicate no introgression, values above 0 indicate introgression between truncatula and littoralis, and negative values indicate introgression between truncatula and tricycla.

41
3 References
Abreu‐Neto, J.B. de, Turchetto‐Zolet, A.C., Oliveira, L.F.V. de, Zanettini, M.H.B., Margis‐Pinheiro, M.,
2013. Heavy metal-associated isoprenylated plant protein (HIPP): characterization of a family of
proteins exclusive to plants. The FEBS Journal 280, 1604–1616. https://doi.org/10.1111/febs.12159
Aggarwal, A., Sharma, I., Tripathi, B., Munjal, A., Baunthiyal, M., Sharma, V., 2011. Metal Toxicity and
Photosynthesis, in: Photosynthesis: Overviews on Recent Progress and Future Perspectives. pp. 16:
229-236.
Alexander, D.H., Novembre, J., Lange, K., 2009. Fast model-based estimation of ancestry in unrelated
individuals. Genome Res. 19, 1655–1664. https://doi.org/10.1101/gr.094052.109
Alloway, B.J., 2013. Sources of Heavy Metals and Metalloids in Soils, in: Alloway, B.J. (Ed.), Heavy
Metals in Soils: Trace Metals and Metalloids in Soils and Their Bioavailability, Environmental
Pollution. Springer Netherlands, Dordrecht, pp. 11–50. https://doi.org/10.1007/978-94-007-4470-
7_2
Bahmani, R., Kim, D., Na, J., Hwang, S., 2019. Expression of the Tobacco Non-symbiotic Class 1
Hemoglobin Gene Hb1 Reduces Cadmium Levels by Modulating Cd Transporter Expression
Through Decreasing Nitric Oxide and ROS Level in Arabidopsis. Front. Plant Sci. 10.
https://doi.org/10.3389/fpls.2019.00201
Barrett, R.D.H., Schluter, D., 2008. Adaptation from standing genetic variation. Trends in Ecology &
Evolution 23, 38–44. https://doi.org/10.1016/j.tree.2007.09.008
Bert, V., Meerts, P., Saumitou-Laprade, P., Salis, P., Gruber, W., Verbruggen, N., 2003. Genetic basis of
Cd tolerance and hyperaccumulation in Arabidopsis halleri. Plant and Soil 249, 9–18.
https://doi.org/10.1023/A:1022580325301
Bolger, A.M., Lohse, M., Usadel, B., 2014. Trimmomatic: a flexible trimmer for Illumina sequence data.
Bioinformatics 30, 2114–2120. https://doi.org/10.1093/bioinformatics/btu170
Bonhomme, M., Jacquet, C., 2019. Genome-wide association mapping and population genomic features in
Medicago truncatula, in: The Model Legume Medicago Truncatula. John Wiley & Sons, Ltd, pp.
870–881. https://doi.org/10.1002/9781119409144.ch109
Bradbury, P.J., Zhang, Z., Kroon, D.E., Casstevens, T.M., Ramdoss, Y., Buckler, E.S., 2007. TASSEL:
software for association mapping of complex traits in diverse samples. Bioinformatics 23, 2633–
2635. https://doi.org/10.1093/bioinformatics/btm308
Branca, A., Paape, T.D., Zhou, P., Briskine, R., Farmer, A.D., Mudge, J., Bharti, A.K., Woodward, J.E.,
May, G.D., Gentzbittel, L., Ben, C., Denny, R., Sadowsky, M.J., Ronfort, J., Bataillon, T., Young,
N.D., Tiffin, P., 2011. PNAS Plus: Whole-genome nucleotide diversity, recombination, and linkage
disequilibrium in the model legume Medicago truncatula. Proceedings of the National Academy of
Sciences. https://doi.org/10.1073/pnas.1104032108
Browning, B.L., Browning, S.R., 2016. Genotype Imputation with Millions of Reference Samples. The
American Journal of Human Genetics 98, 116–126. https://doi.org/10.1016/j.ajhg.2015.11.020
Camacho, C., Coulouris, G., Avagyan, V., Ma, N., Papadopoulos, J., Bealer, K., Madden, T.L., 2009.
BLAST+: architecture and applications. BMC Bioinformatics 10, 421. https://doi.org/10.1186/1471-
2105-10-421

42
Carrasco-Gil, S., Siebner, H., LeDuc, D.L., Webb, S.M., Millán, R., Andrews, J.C., Hernández, L.E.,
2013. Mercury Localization and Speciation in Plants Grown Hydroponically or in a Natural
Environment. Environ. Sci. Technol. 47, 3082–3090. https://doi.org/10.1021/es303310t
Castrillo, G., Sánchez-Bermejo, E., Lorenzo, L. de, Crevillén, P., Fraile-Escanciano, A., Tc, M., Mouriz,
A., Catarecha, P., Sobrino-Plata, J., Olsson, S., Puerto, Y.L. del, Mateos, I., Rojo, E., Hernández,
L.E., Jarillo, J.A., Piñeiro, M., Paz-Ares, J., Leyva, A., 2013. WRKY6 Transcription Factor
Restricts Arsenate Uptake and Transposon Activation in Arabidopsis. The Plant Cell 25, 2944–
2957. https://doi.org/10.1105/tpc.113.114009
Chao, D.-Y., Silva, A., Baxter, I., Huang, Y.S., Nordborg, M., Danku, J., Lahner, B., Yakubova, E., Salt,
D.E., 2012. Genome-Wide Association Studies Identify Heavy Metal ATPase3 as the Primary
Determinant of Natural Variation in Leaf Cadmium in Arabidopsis thaliana. PLOS Genetics 8,
e1002923. https://doi.org/10.1371/journal.pgen.1002923
Chen, H., Patterson, N., Reich, D., 2010. Population differentiation as a test for selective sweeps. Genome
Res. 20, 393–402. https://doi.org/10.1101/gr.100545.109
Chen, L., Wan, H., Qian, J., Guo, J., Sun, C., Wen, J., Yi, B., Ma, C., Tu, J., Song, L., Fu, T., Shen, J.,
2018. Genome-Wide Association Study of Cadmium Accumulation at the Seedling Stage in
Rapeseed (Brassica napus L.). Front. Plant Sci. 9. https://doi.org/10.3389/fpls.2018.00375
Cong, W., Miao, Y., Xu, L., Zhang, Y., Yuan, C., Wang, J., Zhuang, T., Lin, X., Jiang, L., Wang, N., Ma,
J., Sanguinet, K.A., Liu, B., Rustgi, S., Ou, X., 2019. Transgenerational memory of gene expression
changes induced by heavy metal stress in rice (Oryza sativa L.). BMC Plant Biol 19, 282.
https://doi.org/10.1186/s12870-019-1887-7
Cook, D.E., Andersen, E.C., 2017. VCF-kit: assorted utilities for the variant call format. Bioinformatics
33, 1581–1582. https://doi.org/10.1093/bioinformatics/btx011
Culligan, K.M., Robertson, C.E., Foreman, J., Doerner, P., Britt, A.B., 2006. ATR and ATM play both
distinct and additive roles in response to ionizing radiation. The Plant Journal 48, 947–961.
https://doi.org/10.1111/j.1365-313X.2006.02931.x
Danecek, P., Auton, A., Abecasis, G., Albers, C.A., Banks, E., DePristo, M.A., Handsaker, R.E., Lunter,
G., Marth, G.T., Sherry, S.T., McVean, G., Durbin, R., 2011. The variant call format and VCFtools.
Bioinformatics 27, 2156–2158. https://doi.org/10.1093/bioinformatics/btr330
De Mita, S., Chantret, N., Loridon, K., Ronfort, J., Bataillon, T., 2011. Molecular adaptation in flowering
and symbiotic recognition pathways: insights from patterns of polymorphism in the legume
Medicago truncatula. BMC Evolutionary Biology 11, 229. https://doi.org/10.1186/1471-2148-11-
229
De Mita, S., Ronfort, J., McKhann, H.I., Poncet, C., El Malki, R., Bataillon, T., 2007. Investigation of the
Demographic and Selective Forces Shaping the Nucleotide Diversity of Genes Involved in Nod
Factor Signaling in Medicago truncatula. Genetics 177, 2123–2133.
https://doi.org/10.1534/genetics.107.076943
Du, Z., Zhou, X., Ling, Y., Zhang, Z., Su, Z., 2010. agriGO: a GO analysis toolkit for the agricultural
community. Nucleic Acids Res 38, W64–W70. https://doi.org/10.1093/nar/gkq310
Gaillard, S., Jacquet, H., Vavasseur, A., Leonhardt, N., Forestier, C., 2008. AtMRP6/AtABCC6, an ATP-
Binding Cassette transporter gene expressed during early steps of seedling development and up-
43
regulated by cadmium in Arabidopsis thaliana. BMC Plant Biology 8, 22.
https://doi.org/10.1186/1471-2229-8-22
García de la Torre, V.S., Coba de la Peña, T., Lucas, M.M., Pueyo, J.J., 2013. Rapid screening of
Medicago truncatula germplasm for mercury tolerance at the seedling stage. Environmental and
Experimental Botany 91, 90–96. https://doi.org/10.1016/j.envexpbot.2013.03.004
Gentzbittel, L., Ben, C., Mazurier, M., Shin, M.-G., Lorenz, T., Rickauer, M., Marjoram, P., Nuzhdin,
S.V., Tatarinova, T.V., 2019. WhoGEM: an admixture-based prediction machine accurately predicts
quantitative functional traits in plants. Genome Biology 20, 106. https://doi.org/10.1186/s13059-
019-1697-0
Ha, S.B., Smith, A.P., Howden, R., Dietrich, W.M., Bugg, S., O’Connell, M.J., Goldsbrough, P.B.,
Cobbett, C.S., 1999. Phytochelatin synthase genes from Arabidopsis and the yeast
Schizosaccharomyces pombe. Plant Cell 11, 1153–1164.
He, L., Ma, X., Li, Z., Jiao, Z., Li, Y., Ow, D.W., 2016. Maize OXIDATIVE STRESS2 Homologs
Enhance Cadmium Tolerance in Arabidopsis through Activation of a Putative SAM-Dependent
Methyltransferase Gene. Plant Physiology 171, 1675–1685. https://doi.org/10.1104/pp.16.00220
Heidenreich, B., Seidlitz, H., Ernst, D., Jr, H.S., 1999. Mercuric-Ion-Induced Gene Expression in
Arabidopsis thaliana. International Journal of Phytoremediation 1, 153–167.
https://doi.org/10.1080/15226519908500013
Hossain, M.A., Piyatida, P., da Silva, J.A.T., Fujita, M., 2012. Molecular Mechanism of Heavy Metal
Toxicity and Tolerance in Plants: Central Role of Glutathione in Detoxification of Reactive Oxygen
Species and Methylglyoxal and in Heavy Metal Chelation [WWW Document]. Journal of Botany.
https://doi.org/10.1155/2012/872875
Hussain, W., Campbell, M.T., Jarquin, D., Walia, H., Morota, G., 2020. Variance heterogeneity genome-
wide mapping for cadmium in bread wheat reveals novel genomic loci and epistatic interactions.
The Plant Genome 13, e20011. https://doi.org/10.1002/tpg2.20011
Hutter, S., Vilella, A.J., Rozas, J., 2006. Genome-wide DNA polymorphism analyses using VariScan.
BMC Bioinformatics 7, 409. https://doi.org/10.1186/1471-2105-7-409
Ishikawa, S., Ishimaru, Y., Igura, M., Kuramata, M., Abe, T., Senoura, T., Hase, Y., Arao, T., Nishizawa,
N.K., Nakanishi, H., 2012. Ion-beam irradiation, gene identification, and marker-assisted breeding
in the development of low-cadmium rice. Proc Natl Acad Sci U S A 109, 19166–19171.
https://doi.org/10.1073/pnas.1211132109
Israr, M., Sahi, S., Datta, R., Sarkar, D., 2006. Bioaccumulation and physiological effects of mercury in
Sesbania drummondii. Chemosphere 65, 591–598.
https://doi.org/10.1016/j.chemosphere.2006.02.016
Järup, L., Åkesson, A., 2009. Current status of cadmium as an environmental health problem. Toxicology
and Applied Pharmacology, New Insights into the Mechanisms of Cadmium Toxicity 238, 201–208.
https://doi.org/10.1016/j.taap.2009.04.020
Jing, Y., Shi, L., Li, X., Zheng, H., Gao, J., Wang, M., He, L., Zhang, W., 2019. OXS2 is Required for
Salt Tolerance Mainly through Associating with Salt Inducible Genes, CA1 and Araport11 , in
Arabidopsis. Sci Rep 9, 1–11. https://doi.org/10.1038/s41598-019-56456-1
44
Josephs, E.B., Lee, Y.W., Stinchcombe, J.R., Wright, S.I., 2015. Association mapping reveals the role of
purifying selection in the maintenance of genomic variation in gene expression. PNAS 112, 15390–
15395. https://doi.org/10.1073/pnas.1503027112
Josephs, E.B., Stinchcombe, J.R., Wright, S.I., 2017. What can genome-wide association studies tell us
about the evolutionary forces maintaining genetic variation for quantitative traits? New Phytologist
214, 21–33. https://doi.org/10.1111/nph.14410
Jozwiak, A., Lipko, A., Kania, M., Danikiewicz, W., Surmacz, L., Witek, A., Wojcik, J., Zdanowski, K.,
Pączkowski, C., Chojnacki, T., Poznanski, J., Swiezewska, E., 2017. Modeling of Dolichol Mass
Spectra Isotopic Envelopes as a Tool to Monitor Isoprenoid Biosynthesis. Plant Physiology 174,
857–874. https://doi.org/10.1104/pp.17.00036
Kang, H.M., Sul, J.H., Service, S.K., Zaitlen, N.A., Kong, S., Freimer, N.B., Sabatti, C., Eskin, E., 2010.
Variance component model to account for sample structure in genome-wide association studies.
Nature Genetics 42, 348–354. https://doi.org/10.1038/ng.548
Kang, Y., Sakiroglu, M., Krom, N., Stanton-Geddes, J., Wang, M., Lee, Y.-C., Young, N.D., Udvardi, M.,
2015. Genome-wide association of drought-related and biomass traits with HapMap SNPs in
Medicago truncatula: GWAS of drought-related traits in Medicago truncatula. Plant, Cell &
Environment 38, 1997–2011. https://doi.org/10.1111/pce.12520
Kang, Y., Torres‐Jerez, I., An, Z., Greve, V., Huhman, D., Krom, N., Cui, Y., Udvardi, M., 2019.
Genome-wide association analysis of salinity responsive traits in Medicago truncatula. Plant, Cell &
Environment 42, 1513–1531. https://doi.org/10.1111/pce.13508
Krishnakumar, V., Kim, M., Rosen, B.D., Karamycheva, S., Bidwell, S.L., Tang, H., Town, C.D., 2015.
MTGD: The Medicago truncatula Genome Database. Plant Cell Physiol 56, e1–e1.
https://doi.org/10.1093/pcp/pcu179
Li, H., Durbin, R., 2009. Fast and accurate short read alignment with Burrows–Wheeler transform.
Bioinformatics 25, 1754–1760. https://doi.org/10.1093/bioinformatics/btp324
Li, H., Handsaker, B., Wysoker, A., Fennell, T., Ruan, J., Homer, N., Marth, G., Abecasis, G., Durbin, R.,
2009. The Sequence Alignment/Map format and SAMtools. Bioinformatics 25, 2078–2079.
https://doi.org/10.1093/bioinformatics/btp352
Lipka, A.E., Tian, F., Wang, Q., Peiffer, J., Li, M., Bradbury, P.J., Gore, M.A., Buckler, E.S., Zhang, Z.,
2012. GAPIT: genome association and prediction integrated tool. Bioinformatics 28, 2397–2399.
https://doi.org/10.1093/bioinformatics/bts444
Liu, H., Zhao, H., Wu, L., Liu, A., Zhao, F.-J., Xu, W., 2017. Heavy metal ATPase 3 (HMA3) confers
cadmium hypertolerance on the cadmium/zinc hyperaccumulator Sedum plumbizincicola. New
Phytologist 215, 687–698. https://doi.org/10.1111/nph.14622
Ly, V., Hatherell, A., Kim, E., Chan, A., Belmonte, M.F., Schroeder, D.F., 2013. Interactions between
Arabidopsis DNA repair genes UVH6, DDB1A, and DDB2 during abiotic stress tolerance and floral
development. Plant Science 213, 88–97. https://doi.org/10.1016/j.plantsci.2013.09.004
Maestri, E., Marmiroli, M., Visioli, G., Marmiroli, N., 2010. Metal tolerance and hyperaccumulation:
Costs and trade-offs between traits and environment. Environmental and Experimental Botany 68,
1–13. https://doi.org/10.1016/j.envexpbot.2009.10.011
45
Martin, S.H., Davey, J.W., Jiggins, C.D., 2015. Evaluating the Use of ABBA–BABA Statistics to Locate
Introgressed Loci. Mol Biol Evol 32, 244–257. https://doi.org/10.1093/molbev/msu269
Martin, S.H., Davey, J.W., Salazar, C., Jiggins, C.D., 2019. Recombination rate variation shapes barriers
to introgression across butterfly genomes. PLOS Biology 17, e2006288.
https://doi.org/10.1371/journal.pbio.2006288
McKenna, A., Hanna, M., Banks, E., Sivachenko, A., Cibulskis, K., Kernytsky, A., Garimella, K.,
Altshuler, D., Gabriel, S., Daly, M., DePristo, M.A., 2010. The Genome Analysis Toolkit: A
MapReduce framework for analyzing next-generation DNA sequencing data. Genome Res. 20,
1297–1303. https://doi.org/10.1101/gr.107524.110
Mehes-Smith, M., Nkongolo, K., Cholewa, E., 2013. Coping Mechanisms of Plants to Metal
Contaminated Soil. Environmental Change and Sustainability. https://doi.org/10.5772/55124
Miyadate, H., Adachi, S., Hiraizumi, A., Tezuka, K., Nakazawa, N., Kawamoto, T., Katou, K., Kodama,
I., Sakurai, K., Takahashi, H., Satoh-Nagasawa, N., Watanabe, A., Fujimura, T., Akagi, H., 2011.
OsHMA3, a P1B-type of ATPase affects root-to-shoot cadmium translocation in rice by mediating
efflux into vacuoles. New Phytol. 189, 190–199. https://doi.org/10.1111/j.1469-8137.2010.03459.x
Moreno, F.N., Anderson, C.W.N., Stewart, R.B., Robinson, B.H., 2008. Phytofiltration of mercury-
contaminated water: Volatilisation and plant-accumulation aspects. Environmental and
Experimental Botany 62, 78–85. https://doi.org/10.1016/j.envexpbot.2007.07.007
Nonnoi, F., Chinnaswamy, A., García de la Torre, V.S., Coba de la Peña, T., Lucas, M.M., Pueyo, J.J.,
2012. Metal tolerance of rhizobial strains isolated from nodules of herbaceous legumes (Medicago
spp. and Trifolium spp.) growing in mercury-contaminated soils. Applied Soil Ecology 61, 49–59.
https://doi.org/10.1016/j.apsoil.2012.06.004
Paape, T., Zhou, P., Branca, A., Briskine, R., Young, N., Tiffin, P., 2012. Fine-Scale Population
Recombination Rates, Hotspots, and Correlates of Recombination in the Medicago truncatula
Genome. Genome Biology and Evolution 4, 726–737. https://doi.org/10.1093/gbe/evs046
Park, J., Song, W.-Y., Ko, D., Eom, Y., Hansen, T.H., Schiller, M., Lee, T.G., Martinoia, E., Lee, Y.,
2012. The phytochelatin transporters AtABCC1 and AtABCC2 mediate tolerance to cadmium and
mercury. The Plant Journal 69, 278–288. https://doi.org/10.1111/j.1365-313X.2011.04789.x
Peralta-Videa, J.R., Lopez, M.L., Narayan, M., Saupe, G., Gardea-Torresdey, J., 2009. The biochemistry
of environmental heavy metal uptake by plants: Implications for the food chain. The International
Journal of Biochemistry & Cell Biology 41, 1665–1677.
https://doi.org/10.1016/j.biocel.2009.03.005
Puente-Sánchez, F., Díaz, S., Penacho, V., Aguilera, A., Olsson, S., 2018. Basis of genetic adaptation to
heavy metal stress in the acidophilic green alga Chlamydomonas acidophila. Aquatic Toxicology
200, 62–72. https://doi.org/10.1016/j.aquatox.2018.04.020
Purcell, S., Neale, B., Todd-Brown, K., Thomas, L., Ferreira, M.A.R., Bender, D., Maller, J., Sklar, P.,
Bakker, P.I.W. de, Daly, M.J., Sham, P.C., 2007. PLINK: A Tool Set for Whole-Genome
Association and Population-Based Linkage Analyses. The American Journal of Human Genetics 81,
559–575. https://doi.org/10.1086/519795
Robinson, J.T., Thorvaldsdóttir, H., Winckler, W., Guttman, M., Lander, E.S., Getz, G., Mesirov, J.P.,
2011. Integrative genomics viewer. Nat Biotechnol 29, 24–26. https://doi.org/10.1038/nbt.1754

46
Sasaki, A., Yamaji, N., Yokosho, K., Ma, J.F., 2012. Nramp5 Is a Major Transporter Responsible for
Manganese and Cadmium Uptake in Rice. The Plant Cell 24, 2155–2167.
https://doi.org/10.1105/tpc.112.096925
Shin, J.-H., Blay, S., McNeney, B., Graham, J., 2006. LDheatmap: An R Function for Graphical Display
of Pairwise Linkage Disequilibria Between Single Nucleotide Polymorphisms. Journal of Statistical
Software 16, 1–9. https://doi.org/10.18637/jss.v016.c03
Stanton-Geddes, J., Paape, T., Epstein, B., Briskine, R., Yoder, J., Mudge, J., Bharti, A.K., Farmer, A.D.,
Zhou, P., Denny, R., May, G.D., Erlandson, S., Yakub, M., Sugawara, M., Sadowsky, M.J., Young,
N.D., Tiffin, P., 2013. Candidate Genes and Genetic Architecture of Symbiotic and Agronomic
Traits Revealed by Whole-Genome, Sequence-Based Association Genetics in Medicago truncatula.
PLoS One 8. https://doi.org/10.1371/journal.pone.0065688
Tang, H., Krishnakumar, V., Bidwell, S., Rosen, B., Chan, A., Zhou, S., Gentzbittel, L., Childs, K.L.,
Yandell, M., Gundlach, H., Mayer, K.F., Schwartz, D.C., Town, C.D., 2014. An improved genome
release (version Mt4.0) for the model legume Medicago truncatula. BMC Genomics 15, 312.
https://doi.org/10.1186/1471-2164-15-312
Tang, Y., Liu, X., Wang, J., Li, M., Wang, Q., Tian, F., Su, Z., Pan, Y., Liu, D., Lipka, A.E., Buckler,
E.S., Zhang, Z., 2016. GAPIT Version 2: An Enhanced Integrated Tool for Genomic Association
and Prediction. The Plant Genome 9, plantgenome2015.11.0120.
https://doi.org/10.3835/plantgenome2015.11.0120
Tchounwou, P.B., Yedjou, C.G., Patlolla, A.K., Sutton, D.J., 2012. Heavy Metals Toxicity and the
Environment. EXS 101, 133–164. https://doi.org/10.1007/978-3-7643-8340-4_6
Thorvaldsdóttir, H., Robinson, J.T., Mesirov, J.P., 2013. Integrative Genomics Viewer (IGV): high-
performance genomics data visualization and exploration. Brief Bioinform 14, 178–192.
https://doi.org/10.1093/bib/bbs017
Toueni, M., Ben, C., Le Ru, A., Gentzbittel, L., Rickauer, M., 2016. Quantitative Resistance to
Verticillium Wilt in Medicago truncatula Involves Eradication of the Fungus from Roots and Is
Associated with Transcriptional Responses Related to Innate Immunity. Front. Plant Sci. 7.
https://doi.org/10.3389/fpls.2016.01431
Ueno, D., Milner, M.J., Yamaji, N., Yokosho, K., Koyama, E., Clemencia Zambrano, M., Kaskie, M.,
Ebbs, S., Kochian, L.V., Ma, J.F., 2011. Elevated expression of TcHMA3 plays a key role in the
extreme Cd tolerance in a Cd-hyperaccumulating ecotype of Thlaspi caerulescens. Plant J. 66, 852–
862. https://doi.org/10.1111/j.1365-313X.2011.04548.x
Ueno, D., Yamaji, N., Kono, I., Huang, C.F., Ando, T., Yano, M., Ma, J.F., 2010. Gene limiting cadmium
accumulation in rice. PNAS 107, 16500–16505. https://doi.org/10.1073/pnas.1005396107
Vallee, B.L., Ulmer, D.D., 1972. Biochemical Effects of Mercury, Cadmium, and Lead. Annual Review of
Biochemistry 41, 91–128. https://doi.org/10.1146/annurev.bi.41.070172.000515
Vilella, A.J., Blanco-Garcia, A., Hutter, S., Rozas, J., 2005. VariScan: Analysis of evolutionary patterns
from large-scale DNA sequence polymorphism data. Bioinformatics 21, 2791–2793.
https://doi.org/10.1093/bioinformatics/bti403

47
Wang, M., Yuan, J., Qin, L., Shi, W., Xia, G., Liu, S., 2020. TaCYP81D5, one member in a wheat
cytochrome P450 gene cluster, confers salinity tolerance via reactive oxygen species scavenging.
Plant Biotechnol J 18, 791–804. https://doi.org/10.1111/pbi.13247
Wang, Y., Greger, M., 2004. Clonal Differences in Mercury Tolerance, Accumulation, and Distribution in
Willow. Journal of Environmental Quality 33, 1779–1785. https://doi.org/10.2134/jeq2004.1779
Wu, D., Sato, K., Ma, J.F., 2015. Genome-wide association mapping of cadmium accumulation in
different organs of barley. New Phytologist 208, 817–829. https://doi.org/10.1111/nph.13512
Yang, X., Feng, Y., He, Z., Stoffella, P.J., 2005. Molecular mechanisms of heavy metal
hyperaccumulation and phytoremediation. Journal of Trace Elements in Medicine and Biology 18,
339–353. https://doi.org/10.1016/j.jtemb.2005.02.007
Yoder, J.B., Briskine, R., Mudge, J., Farmer, A., Paape, T., Steele, K., Weiblen, G.D., Bharti, A.K., Zhou,
P., May, G.D., Young, N.D., Tiffin, P., 2013. Phylogenetic Signal Variation in the Genomes of
Medicago (Fabaceae). Systematic Biology 62, 424–438. https://doi.org/10.1093/sysbio/syt009
Young, N.D., Debellé, F., Oldroyd, G.E.D., Geurts, R., Cannon, S.B., Udvardi, M.K., Benedito, V.A.,
Mayer, K.F.X., Gouzy, J., Schoof, H., Van de Peer, Y., Proost, S., Cook, D.R., Meyers, B.C.,
Spannagl, M., Cheung, F., De Mita, et al. 2011. The Medicago genome provides insight into the
evolution of rhizobial symbioses. Nature. https://doi.org/10.1038/nature10625
Zahran, H.H., 1999. Rhizobium-Legume Symbiosis and Nitrogen Fixation under Severe Conditions and in
an Arid Climate. Microbiol Mol Biol Rev 63, 968–989.
Zha, H.G., Jiang, R.F., Zhao, F.J., Vooijs, R., Schat, H., Barker, J.H.A., McGrath, S.P., 2004. Co-
segregation analysis of cadmium and zinc accumulation in Thlaspi caerulescens interecotypic
crosses. New Phytologist 163, 299–312. https://doi.org/10.1111/j.1469-8137.2004.01113.x
Zhao, J., Yang, W., Zhang, S., Yang, T., Liu, Q., Dong, J., Fu, H., Mao, X., Liu, B., 2018. Genome-wide
association study and candidate gene analysis of rice cadmium accumulation in grain in a diverse
rice collection. Rice 11, 61. https://doi.org/10.1186/s12284-018-0254-x
Zhao, L., Meng, B., Feng, X., 2020. Mercury methylation in rice paddy and accumulation in rice plant: A
review. Ecotoxicology and Environmental Safety 195, 110462.
https://doi.org/10.1016/j.ecoenv.2020.110462
Zhao, Z., Fu, Z., Lin, Y., Chen, H., Liu, K., Xing, X., Liu, Z., Li, W., Tang, J., 2017. Genome-wide
association analysis identifies loci governing mercury accumulation in maize. Sci Rep 7, 1–11.
https://doi.org/10.1038/s41598-017-00189-6
Zhou, X., Stephens, M., 2012. Genome-wide efficient mixed-model analysis for association studies. Nat
Genet 44, 821–824. https://doi.org/10.1038/ng.2310
Zhou, Z.S., Zeng, H.Q., Liu, Z.P., Yang, Z.M., 2012. Genome-wide identification of Medicago truncatula
microRNAs and their targets reveals their differential regulation by heavy metal. Plant, Cell &
Environment 35, 86–99. https://doi.org/10.1111/j.1365-3040.2011.02418.x