modelling of mercury, lead and cadmium at european scale
TRANSCRIPT

Modelling of mercury, lead andcadmium at european scale.
Yelva Roustan
Modelling of mercury, lead and cadmium at european scale. – p. 1/17
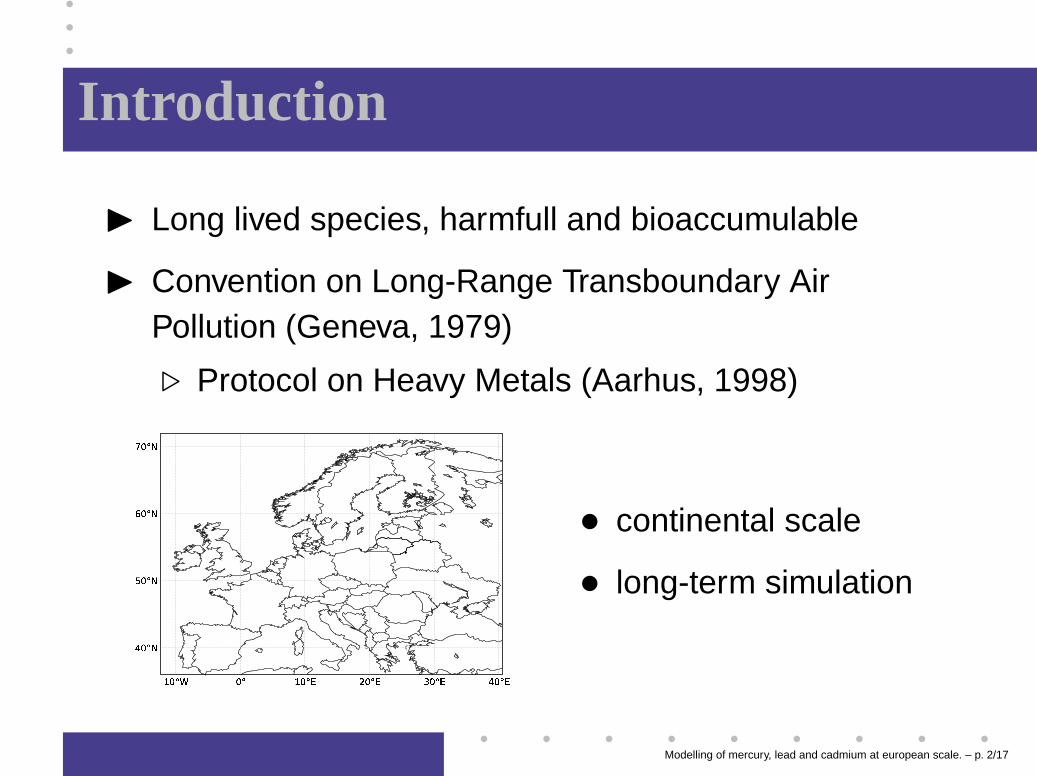
Introduction
I Long lived species, harmfull and bioaccumulable
I Convention on Long-Range Transboundary AirPollution (Geneva, 1979)
. Protocol on Heavy Metals (Aarhus, 1998)
• continental scale
• long-term simulation
Modelling of mercury, lead and cadmium at european scale. – p. 2/17

Models
Modelling of mercury, lead and cadmium at european scale. – p. 3/17

Models: lead and cadmium
concentration
Pb 1-10 ng.m−3
Cd 0.1-1 ng.m−3
life time
days to weeks
. size distribution
. deposition process0.001 0.01 0.1 1 10 100
µm
1e-08
1e-06
1e-04
0.01
1
1/s
P0 = 1 mm/hP0 = 10 mm/hP0 = 50 mm/h
0.001 0.01 0.1 1 10 100µm
0.01
0.1
1
10
100
cm/s
vent = 1 m/svent = 2 m/svent = 5 m/svent = 10 m/s
Modelling of mercury, lead and cadmium at european scale. – p. 4/17
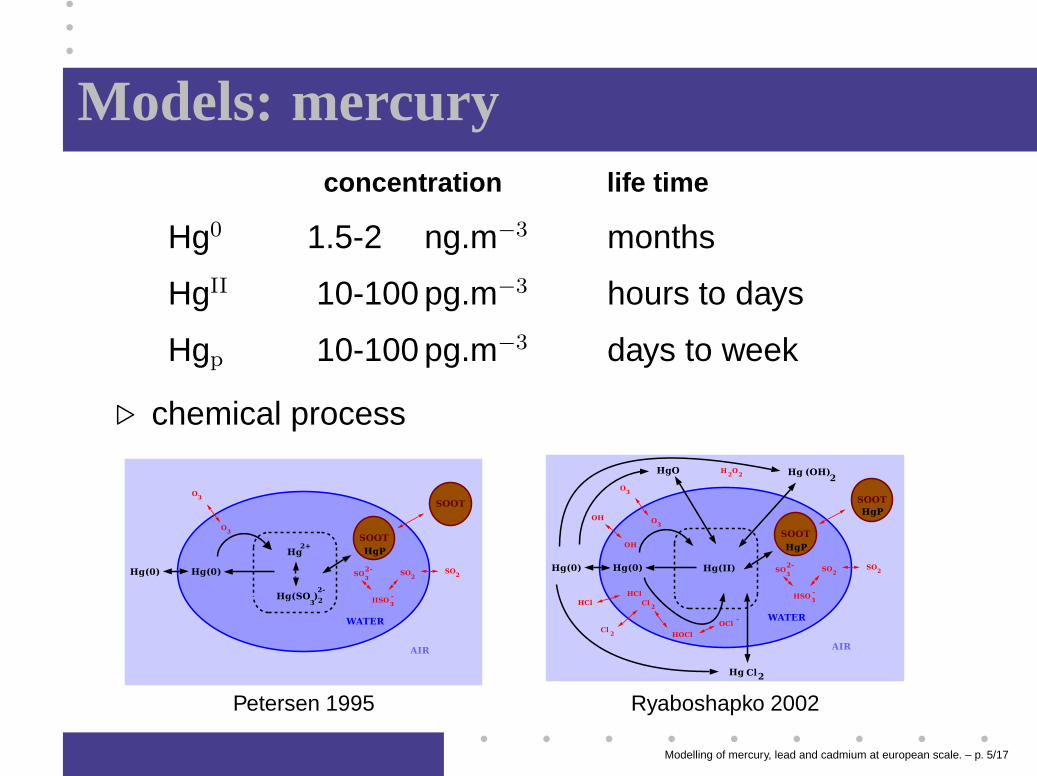
Models: mercuryconcentration life time
Hg0 1.5-2 ng.m−3 months
HgII 10-100 pg.m−3 hours to days
Hgp 10-100 pg.m−3 days to week
. chemical process
Petersen 1995 Ryaboshapko 2002
Modelling of mercury, lead and cadmium at european scale. – p. 5/17

Simulations
Modelling of mercury, lead and cadmium at european scale. – p. 6/17
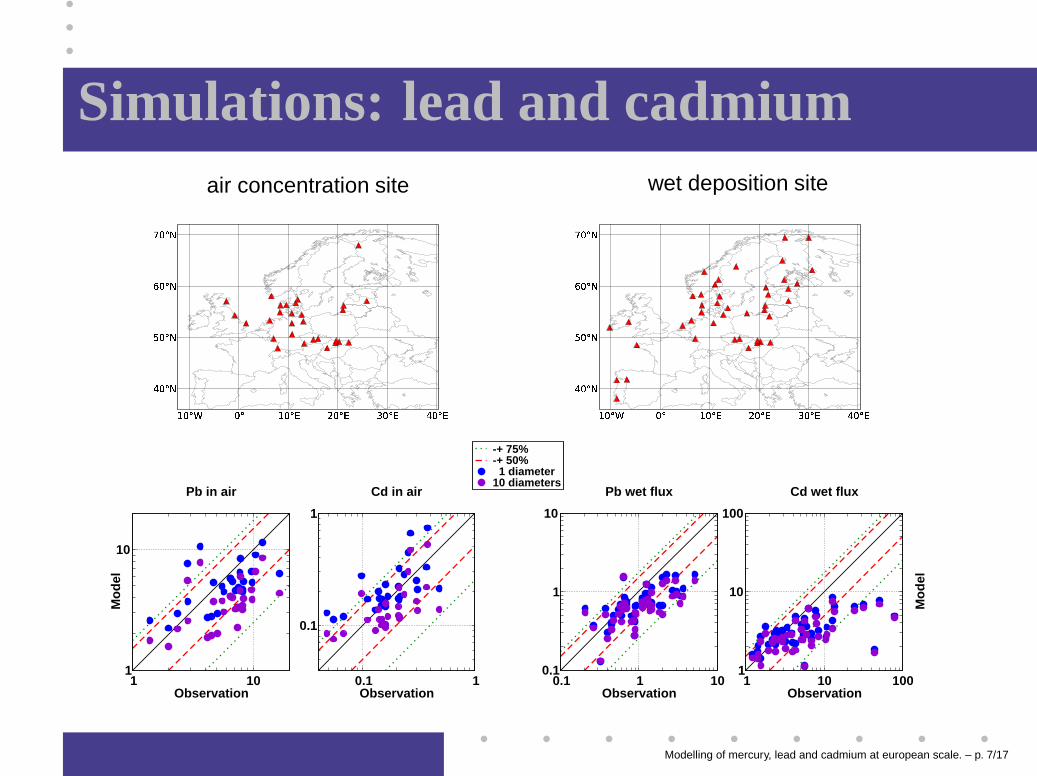
Simulations: lead and cadmiumair concentration site wet deposition site
1 10Observation
1
10
Mo
del
-+ 75%-+ 50% 1 diameter10 diameters
Pb in air
0.1 1 10Observation
0.1
1
10
Pb wet flux
0.1 1Observation
0.1
1
Cd in air
1 10 100Observation
1
10
100
Mo
del
Cd wet flux
Modelling of mercury, lead and cadmium at european scale. – p. 7/17

Simulations: cadmiumAir concentration (ng.m−3)
! " ! # ! !
$%$&
'(' $
')'%
'&) (
) $
*+, -. +, -
/ +, -0 +, -
1 +, 2 +, 1 +, 3 4 +, 3 5 +, 3 * +, 3
67 867 9
67 :67 ;
67 <67 =
67 >67 ?
67 @
1 diameter - (a)fractional bias
(a) - (b)10 diameters - (b)
ABC DE BC D
F BC DG BC D
H BC I B C H B C J K BC J L B C J AB C J
MNON
PNQN
RNSN
TNM MN
M QN
UVW XY VW X
Z VW X[ VW X
\ VW ] V W \ VW ^ _ VW ^ `V W ^ UVW ^
a bca dc
a eca f c
a g ca b
cb
g c
hij kl ij k
m ij kn ij k
o ij p ij o ij q r ij q s ij q h ij q
tuvu
wuxu
yuzu
ut tu
t xu
Total deposition flux (g.km−2.y−1)
Modelling of mercury, lead and cadmium at european scale. – p. 8/17
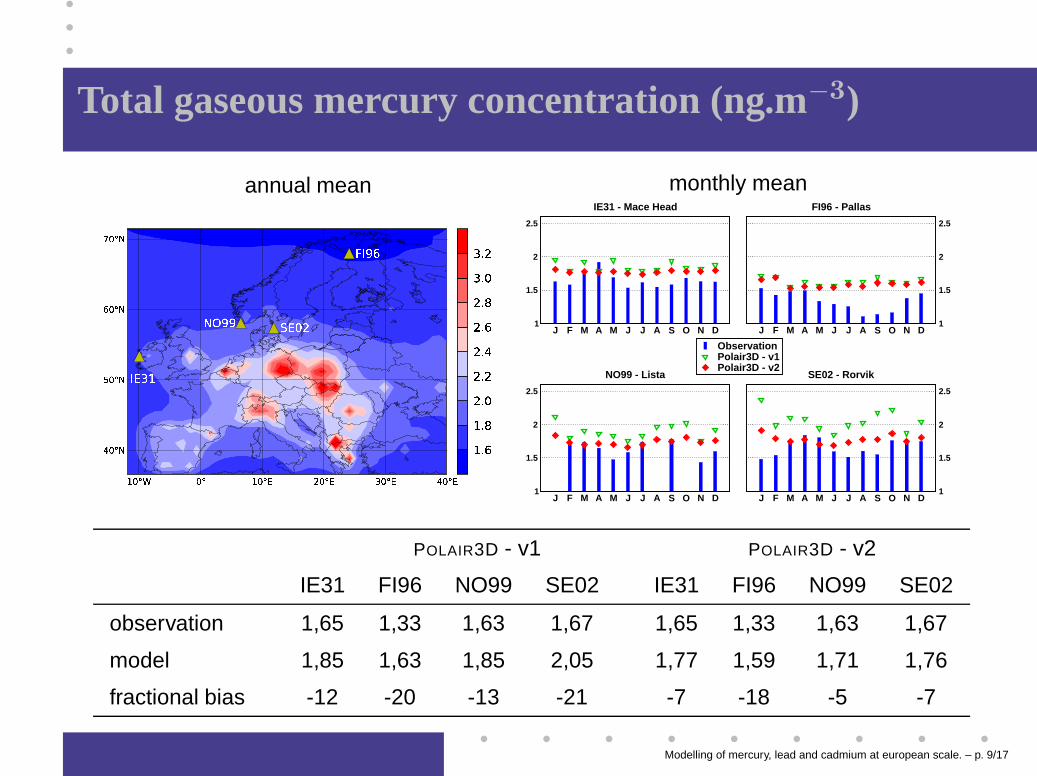
Total gaseous mercury concentration (ng.m−3)
annual mean monthly mean
J F M A M J J A S O N D1
1.5
2
2.5
ObservationPolair3D - v1Polair3D - v2
IE31 - Mace Head
J F M A M J J A S O N D1
1.5
2
2.5
FI96 - Pallas
J F M A M J J A S O N D1
1.5
2
2.5
NO99 - Lista
J F M A M J J A S O N D1
1.5
2
2.5
SE02 - Rorvik
POLAIR3D - v1 POLAIR3D - v2
IE31 FI96 NO99 SE02 IE31 FI96 NO99 SE02
observation 1,65 1,33 1,63 1,67 1,65 1,33 1,63 1,67
model 1,85 1,63 1,85 2,05 1,77 1,59 1,71 1,76
fractional bias -12 -20 -13 -21 -7 -18 -5 -7
Modelling of mercury, lead and cadmium at european scale. – p. 9/17

Mercury deposition flux (g.km−2.y−1)
total deposition - annual mean wet deposition - monthly mean
ObservationPolair3D "corrected"Polair3D
SE11SE05048
12162024
SE02
0
0.1
0.2
0.3
0
4
8
12
16
20
24
DE01
0
0.1
0.2
0.3
J F MA M J J A S OND
ObservationECMWF data
DE09
J FMAM J J A SOND
NL91
J FMAM J J A SOND
04812162024
NO99
0
0.1
0.2
0.3
J F MA M J J A S OND
Deposition flux( g/km²/year)
Precipitation( mm/h )
DE01 DE09 NL91 NO99 SE02 SE05 SE11
observation 4,4 6,2 9,1 8,9 5,4 3,6 4,7
POLAIR3D - v2 8,1 7,7 9,7 5,4 6,0 3,1 7,7
fractional bias -58 -22 -16 52 -7 20 -47
Modelling of mercury, lead and cadmium at european scale. – p. 10/17

Sensitivity analysis
Modelling of mercury, lead and cadmium at european scale. – p. 11/17

Sensitivity analysistransport equation: Ω = D × [0, τ ]
∂c
∂t+ div (uc) − div (K∇c) + Λ c + M c = σ
measurement equation:
µi =
∫
Ω
dtdx 〈πi(x, t), c(x, t)〉
adjoint equation:
−∂c
∗i
∂t−div (uc
∗i )−div (K∇c
∗i )+Λc
∗i +M
Tc∗i = πi
Modelling of mercury, lead and cadmium at european scale. – p. 12/17

Sensitivity analysistransport equation: Ω = D × [0, τ ]
∂c
∂t+ div (uc) − div (K∇c) + Λ c + M c = σ
measurement equation:
µi =
∫
Ω
dtdx 〈πi(x, t), c(x, t)〉
adjoint equation:
−∂c
∗i
∂t−div (uc
∗i )−div (K∇c
∗i )+Λc
∗i +M
Tc∗i = πi
Modelling of mercury, lead and cadmium at european scale. – p. 12/17

Sensitivity analysistransport equation: Ω = D × [0, τ ]
∂c
∂t+ div (uc) − div (K∇c) + Λ c + M c = σ
measurement equation:
µi =
∫
Ω
dtdx 〈πi(x, t), c(x, t)〉
adjoint equation:
−∂c
∗i
∂t−div (uc
∗i )−div (K∇c
∗i )+Λc
∗i +M
Tc∗i = πi
Modelling of mercury, lead and cadmium at european scale. – p. 12/17

Sensitivity analysis
Contributions to the modelled measurement:
µi =
∫
Ω
dtdx 〈c∗i ,σ〉
︸ ︷︷ ︸
volume emission
+
∫
∂Ω0
dx 〈c∗i , c〉
︸ ︷︷ ︸
initial condition
+
∫
∂Ωb
dtdS · 〈c∗i ,E〉
︸ ︷︷ ︸
surface emission
−
∫
∂Ω+
dtdS · (〈c∗i , c〉u)
︸ ︷︷ ︸
boundary conditions
Modelling of mercury, lead and cadmium at european scale. – p. 13/17

Sensitivity analysis: applications
sensitivity to boundary
and initial conditions
sensitivity to emissions
annual modelled measurement
monthly modelled measurement
log10( s / smax) s : average sensitivitysmax : maximum over the domain of s
Modelling of mercury, lead and cadmium at european scale. – p. 14/17

Sensitivity analysis: applicationsTransboundary Pollution
example: Germany 2001January
February
! "#$
! "! % #$
! %! & #$
! &! ' #$
! '! ( #$
March
)*+ ,
- *+ ,
. *+ ,
/ *+ ,0 *+ 1 *+ 0 *+ 2 3 *+ 2 4 *+ 2
5 678
5 65 9 78
5 95 : 78
5 :5 ; 78
5 ;5 < 78
log10( s / smax) s : average sensitivitysmax : maximum over the domain of s
Modelling of mercury, lead and cadmium at european scale. – p. 15/17

Model applicationImpact of EDF coal power plant
Mercury
Lead
Cadmium
! "# $% "# $
& "# $' "# $
( "# ) "# ( "#* + "#* , "#* ! "#*
-. - - -/
-. - -0-. - - /
-. -0-. -/
-. 0-. /
0/
Difference (in %) in the modeled deposition field due to theemission of the power plant (EMERAUDE).
Modelling of mercury, lead and cadmium at european scale. – p. 16/17

ConclusionI Heavy metal models
Roustan, PhD Thesis, 2005
I Sensitivity analysisRoustan and Bocquet, Journal of Geophysical Research 2006
I Inverse modellingRoustan and Bocquet, Atmospheric Chemistry and Physics 2006
. Extension to a hemispherical domain
. Applications of the adjoint method
. Multi-media impact studySolen Queguiner, PhD Thesis
. Source-Receptor matrices
Modelling of mercury, lead and cadmium at european scale. – p. 17/17