mercury product life-cycle model: uses and results alexis cain, us environmental protection agency,...
TRANSCRIPT
Mercury Product Life-Cycle Model: Uses and Results
Alexis Cain, US Environmental Protection Agency, Region 5NAHMMA Conference: Tacoma, WASeptember 21, 2005
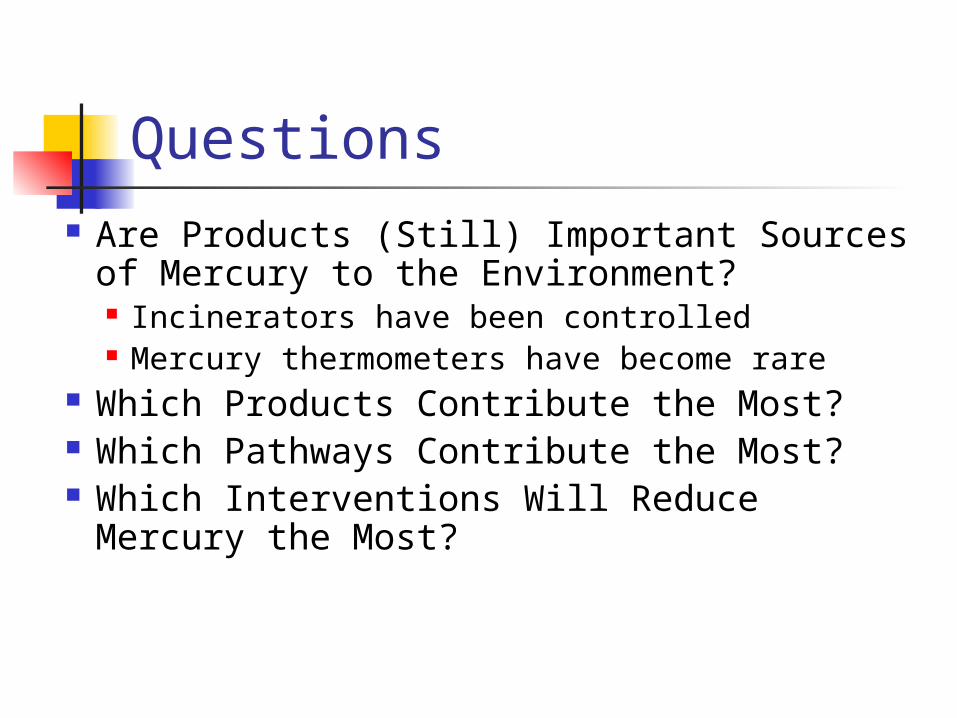
Questions Are Products (Still) Important Sources
of Mercury to the Environment? Incinerators have been controlled Mercury thermometers have become rare
Which Products Contribute the Most? Which Pathways Contribute the Most? Which Interventions Will Reduce
Mercury the Most?
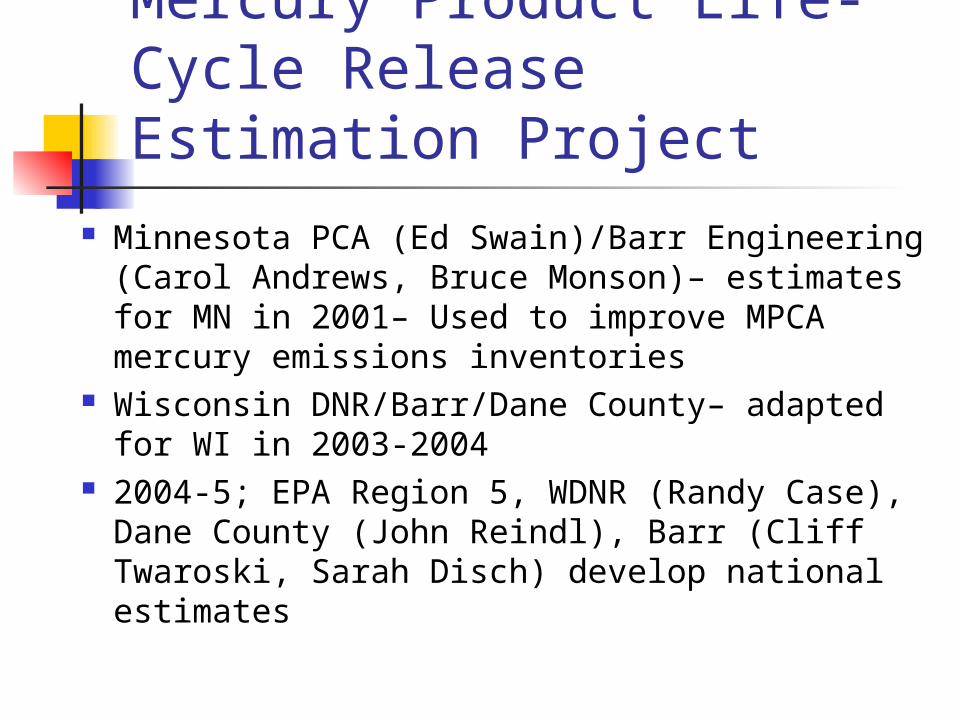
Mercury Product Life-Cycle Release Estimation Project
Minnesota PCA (Ed Swain)/Barr Engineering (Carol Andrews, Bruce Monson)– estimates for MN in 2001– Used to improve MPCA mercury emissions inventories
Wisconsin DNR/Barr/Dane County– adapted for WI in 2003-2004
2004-5; EPA Region 5, WDNR (Randy Case), Dane County (John Reindl), Barr (Cliff Twaroski, Sarah Disch) develop national estimates
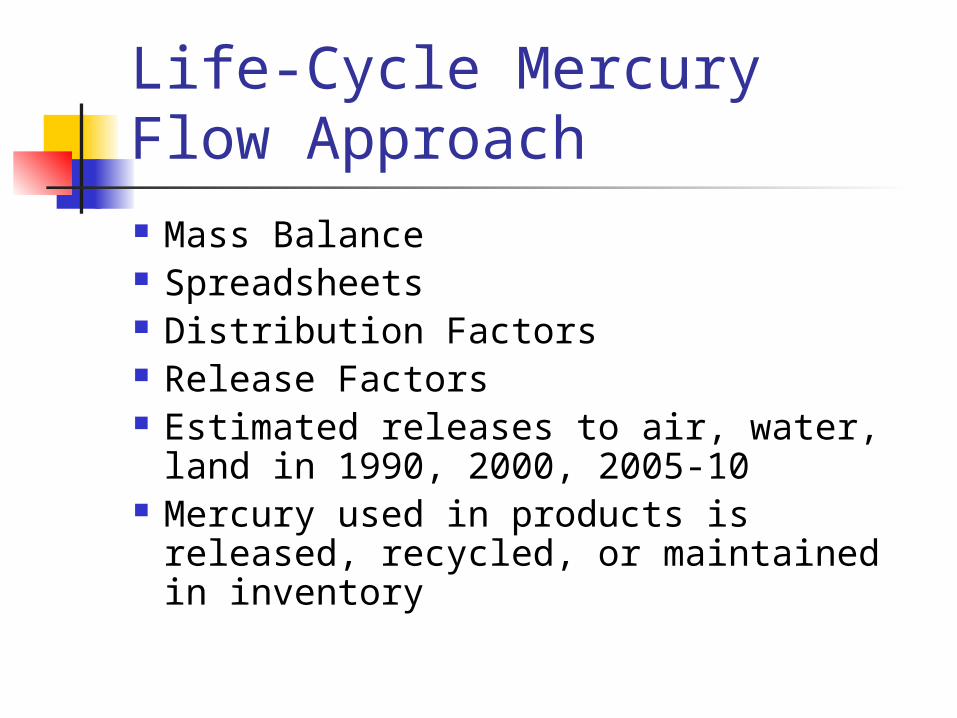
Life-Cycle Mercury Flow Approach Mass Balance Spreadsheets Distribution Factors Release Factors Estimated releases to air, water,
land in 1990, 2000, 2005-10 Mercury used in products is
released, recycled, or maintained in inventory
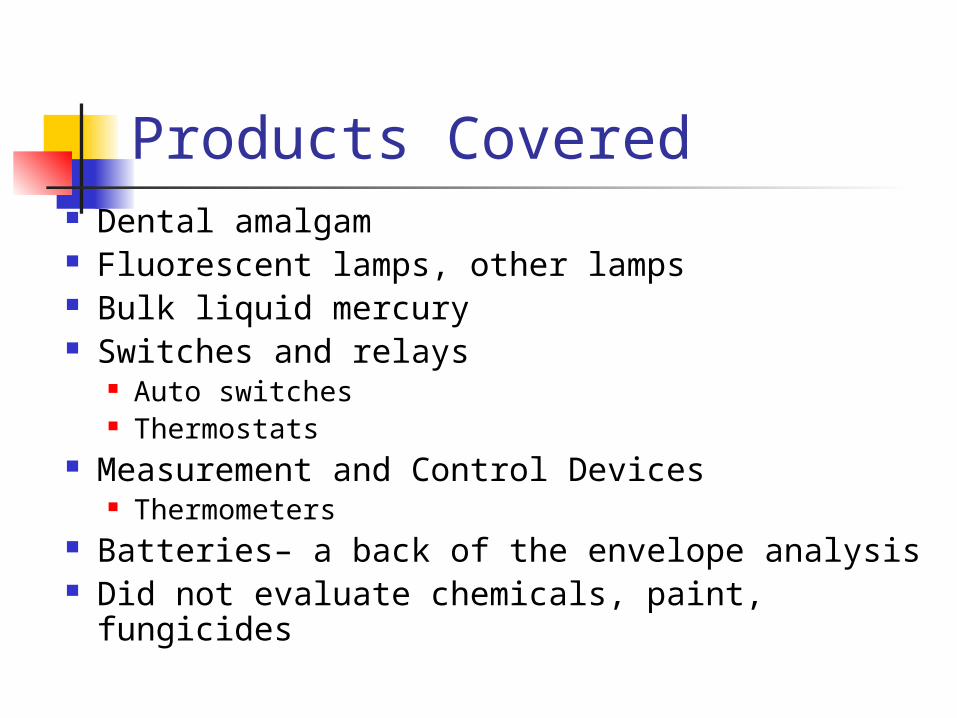
Products Covered Dental amalgam Fluorescent lamps, other lamps Bulk liquid mercury Switches and relays
Auto switches Thermostats
Measurement and Control Devices Thermometers
Batteries– a back of the envelope analysis Did not evaluate chemicals, paint, fungicides
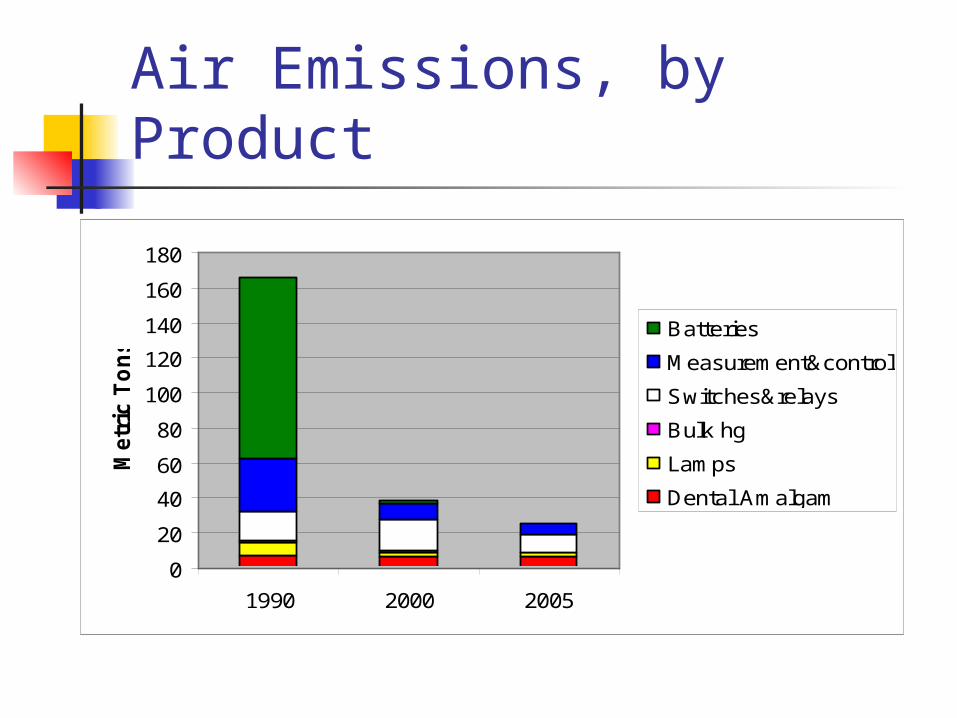
Air Emissions, by Product
0
20
40
60
80
100
120
140
160
180
1990 2000 2005
Metr
ic T
on
s
Batteries
Measurement&control
Switches&relays
Bulk hg
Lamps
Dental Amalgam
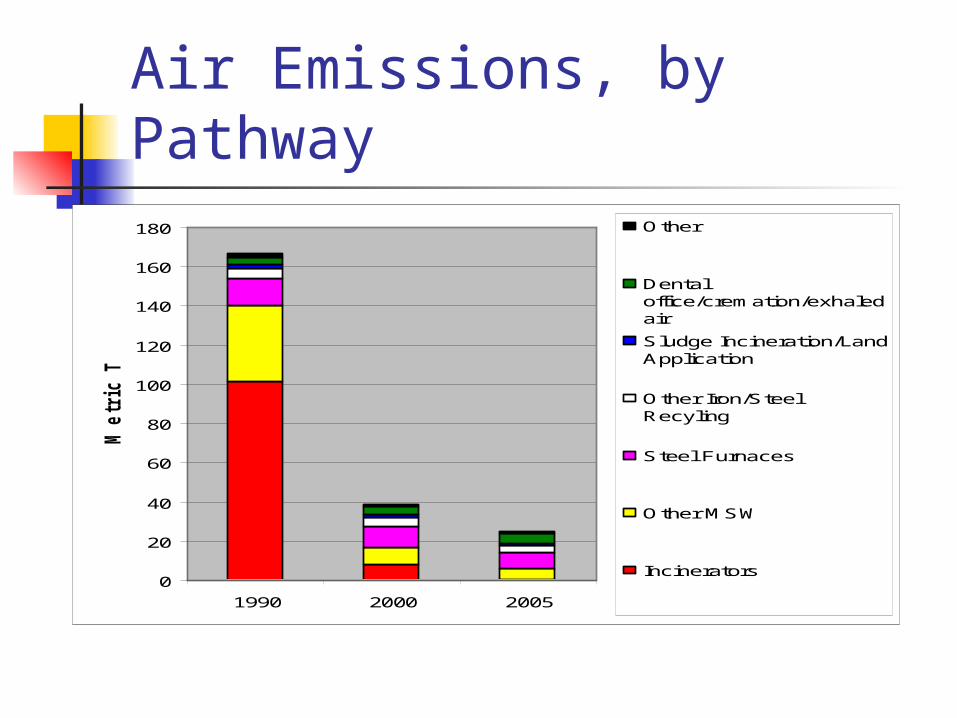
Air Emissions, by Pathway
0
20
40
60
80
100
120
140
160
180
1990 2000 2005
Metr
ic T
on
s
Other
Dentaloffice/cremation/exhaledair
Sludge Incineration/LandApplication
Other Iron/SteelRecyling
Steel Furnaces
Other MSW
Incinerators
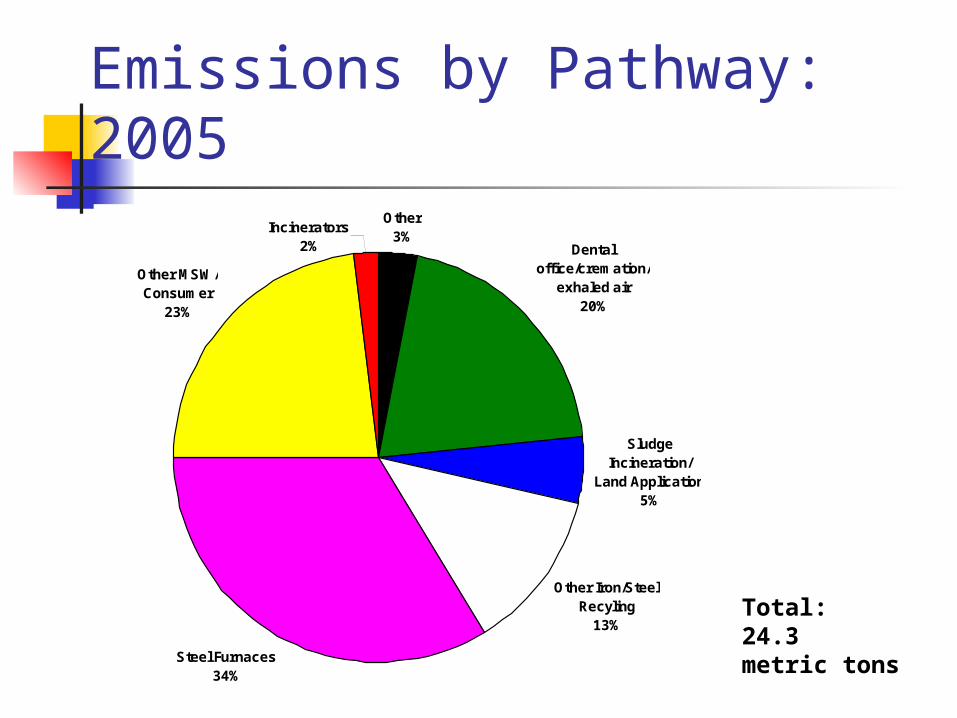
Emissions by Pathway: 2005Other
3%Dental
office/cremation/exhaled air
20%
Other Iron/Steel Recyling
13%
Steel Furnaces34%
Incinerators2%
Other MSW/ Consumer
23%
Sludge Incineration/
Land Application5%
Total: 24.3 metric tons

Selected 1999 NEI* Emissions Compared with Model (2000)
NEI Model
Medical/Municipal Incinerators 5.9 7.9
Burn Barrels ? 2.2
Lamp Breakage 1.4 1.6
All Product Breakage ? 4.6
Sewerage Systems 1.6 1.6
Mercury Recycling 0.2 0.6
Iron and Steel Furnaces* 12.4 10.2
Zinc Production ? 2.0
Metal Shredders ? 1.7
Auto Fluff ? 0.3
NEI: EPA’s National Emissions Inventory. * Steel furnace estimate from regulation development for foundries and electric arc furnaces.
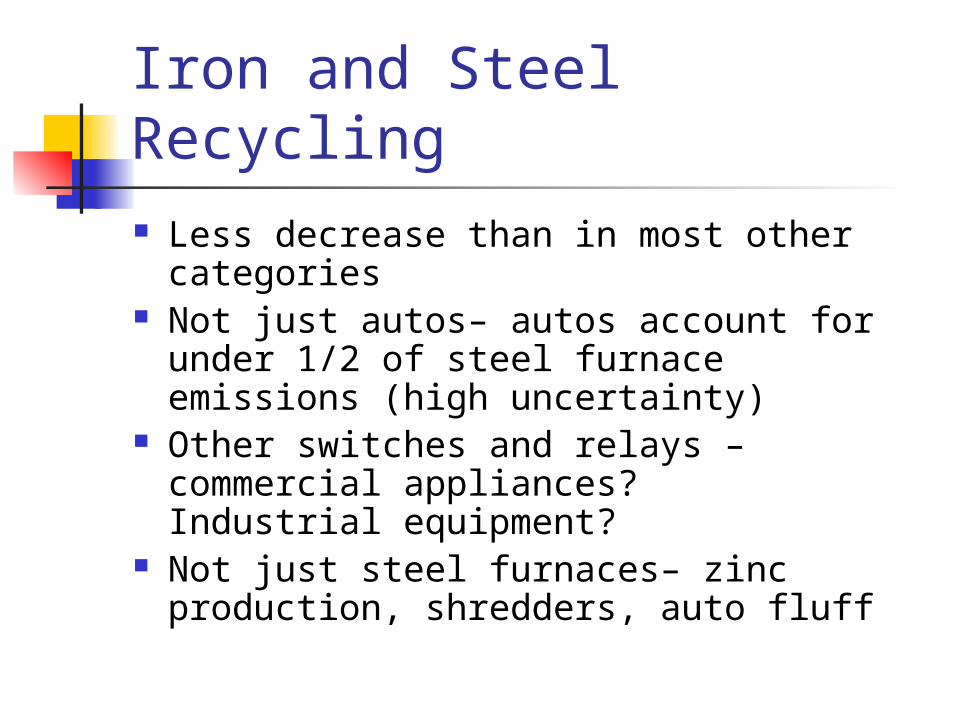
Iron and Steel Recycling Less decrease than in most other
categories Not just autos– autos account for
under 1/2 of steel furnace emissions (high uncertainty)
Other switches and relays – commercial appliances? Industrial equipment?
Not just steel furnaces– zinc production, shredders, auto fluff
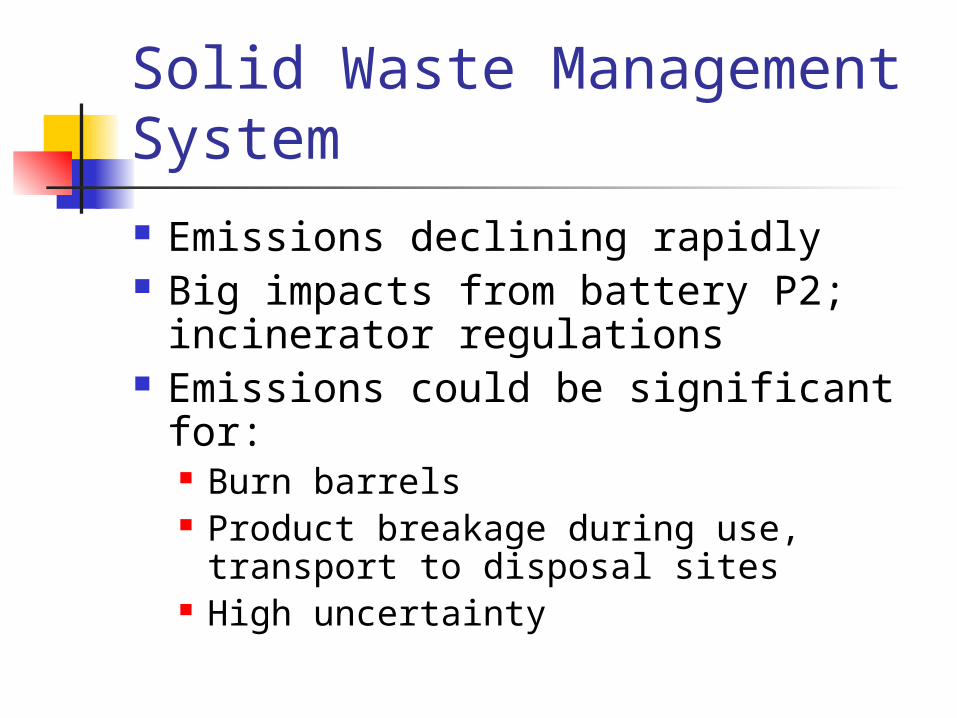
Solid Waste Management System Emissions declining rapidly Big impacts from battery P2;
incinerator regulations Emissions could be significant for:
Burn barrels Product breakage during use,
transport to disposal sites High uncertainty

Dental Amalgam
Significant water releases (495 kg in 2000) >50%
Air releases from sludge incineration and land application, dental office vacuum system, cremation, exhaled air (high uncertainty)
Potential BMP/Separator impact?
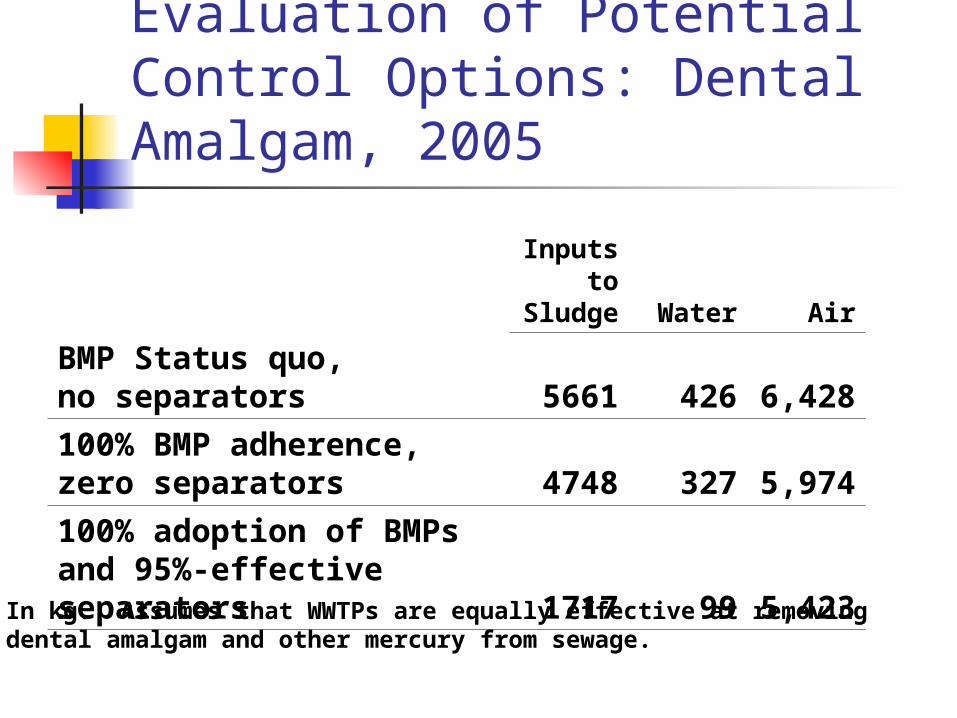
Evaluation of Potential Control Options: Dental Amalgam, 2005
Inputs to
Sludge Water Air
BMP Status quo, no separators 5661 426 6,428
100% BMP adherence, zero separators 4748 327 5,974
100% adoption of BMPs and 95%-effective separators 1717 99 5,423
In kg. Assumes that WWTPs are equally effective at removing dental amalgam and other mercury from sewage.
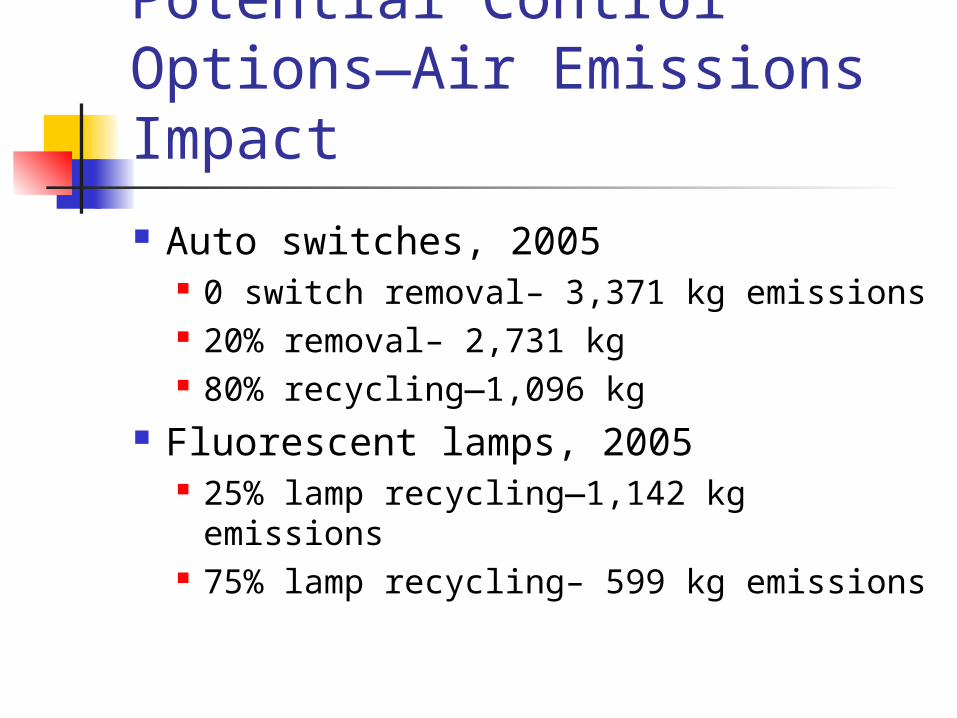
Evaluation of Potential Control Options—Air Emissions Impact
Auto switches, 2005 0 switch removal– 3,371 kg emissions 20% removal– 2,731 kg 80% recycling—1,096 kg
Fluorescent lamps, 2005 25% lamp recycling—1,142 kg
emissions 75% lamp recycling– 599 kg emissions

Conclusions Products Are Still Important Sources of
Mercury to the Environment Releases reduced significantly
Important reduction opportunities in iron and steel production/recycling; dental, lamps
Model provides opportunity to better understand release pathways and to test impact of potential control strategies
Quantification is rough—many uncertainties Model can be adapted for state/local use
More details: Tomorrow, 9:30 – 11:00 Ballroom D
Questions? Alexis Cain
USEPA-Region 5 (312) 886-7018 [email protected]