merck annual report 2009 - zonebourse.com publication contributors published on february 23, 2010 by...
TRANSCRIPT

CONTENTS
Publication contributorsPublished on February 23, 2010 by Merck KGaA,Corporate CommunicationsFrankfurter Strasse 250, 64293 Darmstadt, GermanyTel.: +49 (0) 6151-72 0, fax: +49 (0) 6151-72 5577E-mail: [email protected]: www.merck.de
Concept, design and typesetting: XEO GmbH, Düsseldorf, GermanyPhotographs: Pages 6, 10 and 11: Catrin Moritz, Essen;Pages 1, 2, 4, 35, 51, 57, and 63: Reinhard Koslowski, DüsseldorfPrinting: Franz Kuthal GmbH & Co. KG, Mainaschaff, GermanyPaper: FSC-certified “heaven 42” by Scheufelen
Annu
al R
epor
t 200
9
Annual Report 2009
Mer
ck
www.merck.deW 8
40 5
3935
0210
More information inside the cover:Business development 2000 – 2009
Total revenues by business sector*
€ million8,000
6,000
4,000
2,000
2005 2006 2007 2008 2009
* excluding Corporate and Other
Chemicals Pharmaceuticals
Operating result by business sector
€ million1,200
800
400
0
2005 2006 2007 2008 2009
Chemicals Pharmaceuticals Corporate and Other
Contents
MERCK AT A GLANCE
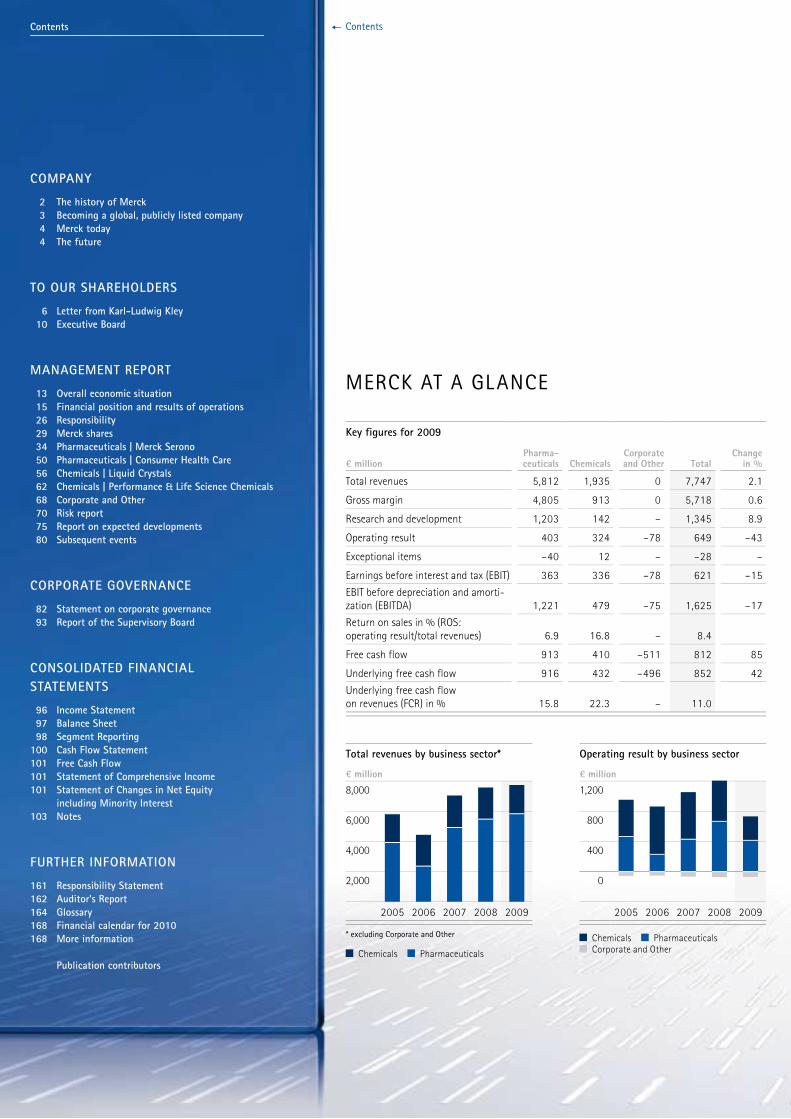
Key figures for 2009
€ millionPharma-ceuticals Chemicals
Corporate and Other Total
Change in %
Total revenues 5,812 1,935 0 7,747 2.1Gross margin 4,805 913 0 5,718 0.6Research and development 1,203 142 – 1,345 8.9Operating result 403 324 –78 649 –43Exceptional items –40 12 – –28 –Earnings before interest and tax (EBIT) 363 336 –78 621 –15EBIT before depreciation and amorti-zation (EBITDA) 1,221 479 –75 1,625 –17Return on sales in % (ROS:operating result/total revenues) 6.9 16.8 – 8.4Free cash flow 913 410 –511 812 85Underlying free cash flow 916 432 –496 852 42Underlying free cash flowon revenues (FCR) in % 15.8 22.3 – 11.0
BUSINESS DEVELOPMENT 2000 – 2009This overview may include historically adjusted values in order to ensure comparability with 2009.
Change vs. 2008 in %€ million 2000 2001 2002 2003 2004 2005 20061 20071 2008 2009
Total revenues 2 6,910 7,721 7,521 7,364 6,017 5,887 4,485 7,081 7,590 7,747 2.1Pharmaceuticals 3,047 3,484 3,265 3,458 3,601 3,905 2,338 4,900 5,456 5,812 6.5 Merck Serono 1,941 2,228 1,850 1,546 1,619 1,817 1,938 4,480 5,014 5,345 6.6 Generics 3 790 936 1,096 1,585 1,625 1,712 – – – – – Consumer Health Care 299 320 319 327 357 376 400 420 442 467 5.7 Imaging 3 17 – – – – – – – – – –Chemicals 1,679 1,729 1,791 1,707 1,696 1,906 2,113 2,152 2,127 1,935 –9.0 Liquid Crystals 313 297 383 443 589 741 895 916 878 733 –17 Performance & Life Science Chemicals 1,174 1,216 1,216 1,083 1,107 1,165 1,218 1,236 1,249 1,202 –3.8 Electronic Chemicals 3 192 216 192 181 – – – – – – –Laboratory Distribution 3 2,374 2,754 2,711 2,427 582 – – – – – –Intragroup sales, Laboratory –190 –246 –246 –228 –62 – – – – – –Corporate and Other – – – – 200 76 34 29 7 – –Generics 3 – – – – – – 1,825 1,398 – – –
Operating result 746 877 616 736 776 883 799 976 1,131 649 –43 Pharmaceuticals 455 581 272 389 391 454 217 417 655 403 –39 Chemicals 247 204 260 316 420 492 641 631 558 324 –42 Laboratory Distribution 3 44 92 84 79 21 – – – – – – Corporate and Other 0 0 0 –48 –56 –63 –60 –72 –81 –78 –3.5 Generics 3 – – – – – – 307 189 – – –
Earnings before interest and tax (EBIT) 747 1,286 559 538 1,044 956 1,031 200 731 621 –15EBIT before depreciation and amortization (EBITDA) 1,184 1,694 985 1,008 1,419 1,245 1,334 1,858 1,947 1,625 –17Profit before tax 524 1,078 412 423 961 893 982 –111 575 486 –15Profit after tax 262 655 215 218 672 673 1,0014 3,5204 379 377 –0.6
Free cash flow 324 664 441 442 1,889 657 –1,0734 –1,4734 438 812 85Capital expenditure on property, plant and equipment 427 470 377 281 234 268 2534 2834 395 467 18Research and development 546 577 608 605 599 713 615 1,028 1,234 1,345 8.9
Total assets 8,235 8,255 7,511 6,982 5,754 7,281 8,102 14,922 15,645 16,713 6.8Net equity 1,947 2,336 2,054 2,363 2,800 3,329 3,807 8,688 9,563 9,514 –0.5Employees (number as of December 31) 33,520 34,294 34,504 34,206 28,877 29,133 25,531 30,968 32,800 33,062 0.8
Return on sales in % (ROS: operating result/total revenues) 10.8 11.4 8.2 10.0 12.9 15.0 17.8 13.8 14.9 8.4
Earnings per share in € 1.44 3.66 1.18 1.15 3.47 3.40 5.074 16.214 1.69 1.68 –0.6Dividend per share in € 0.90 0.95 1.00 0.80 0.80 0.85 0.90 1.20 1.50 1.00 –33One-time bonus per share in € – – – – 0.20 – 0.15 2.00 – –1 Continuing Operations (without Generics)2 In 2009, commission income was reclassified from marketing and selling expenses to total revenues. All figures from the previous year were also adjusted.3 Business was divested4 Including Generics
COMPANY 2 The history of Merck 3 Becoming a global, publicly listed company 4 Merck today 4 The future
TO OUR SHAREHOLDERS 6 Letter from Karl-Ludwig Kley 10 Executive Board
MANAGEMENT REPORT 13 Overall economic situation 15 Financial position and results of operations 26 Responsibility 29 Merck shares 34 Pharmaceuticals | Merck Serono 50 Pharmaceuticals | Consumer Health Care 56 Chemicals | Liquid Crystals 62 Chemicals | Performance & Life Science Chemicals 68 Corporate and Other 70 Risk report 75 Report on expected developments 80 Subsequent events
CORPORATE GOVERNANCE 82 Statement on corporate governance 93 Report of the Supervisory Board
CONSOLIDATED FINANCIALSTATEMENTS 96 Income Statement 97 Balance Sheet 98 Segment Reporting 100 Cash Flow Statement101 Free Cash Flow101 Statement of Comprehensive Income101 Statement of Changes in Net Equity
including Minority Interest103 Notes
FURTHER INFORMATION161 Responsibility Statement162 Auditor’s Report164 Glossary168 Financial calendar for 2010168 More information
Publication contributors
Contents
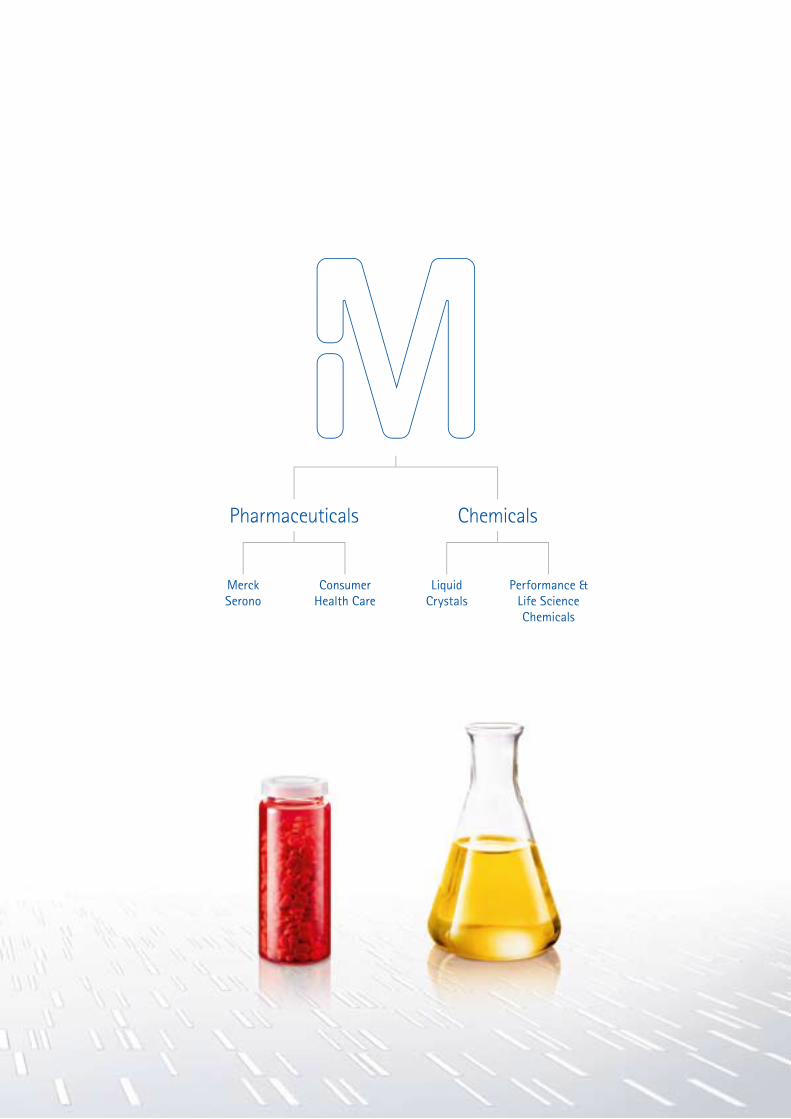
Pharmaceuticals Chemicals
Merck serono
consumer health care
liquid crystals
performance & life science chemicals
ABout MeRck At Merck, the pharmaceuticals and chemicals businesses are under one roof. we are convinced that in both sectors, the market will reward successful research and technological advances with attractive margins. we focus on specialty businesses within both chemicals and pharma-ceuticals. we are not interested in engaging in commodity markets or businesses where competition is dictated by price alone.
THE HISTORY OF MERCK
It all started with a pharmacy in 1668. The Angel Pharmacy, which is still owned by members of the Merck family today, is where Merck originated. Like his contemporaries, the pharmacist Friedrich Jacob Merck prepared all medicinal substances himself. At that time, the “art of pharmacy” was still a manual craft. In 1816 – several generations of pharmacists later – Emanuel Merck took over his father’s pharmacy and initiated the move from a manual craft to industrial production in 1827. In his laboratory, he succeeded in extracting alkaloids, a class of highly effective plant constituents whose medicinal effect attracted interest from the scientific community. By 1860, the company already offered more than 800 organic and inorganic substances for sale, including many still used in laboratories today. The roots of the Liquid Crystals business – one of the outstanding Merck success stories – date back to 1904. For decades, liquid crystals remained a laboratory oddity, and their sale was handled by the Laboratory business. Serono, which was acquired by Merck in 2007, also started out by extracting active substances. In 1906, Cesare Serono founded the “Istituto Farmacologico Serono” in Rome and developed a new method of extracting lecithin from egg yolk. In 1949, the company discovered a way to successfully isolate pure gonadotropin from urine. Gonadotropin plays an important role in reproduction. The production of recombinant gonadotropin transformed Serono into a biotechnology company.
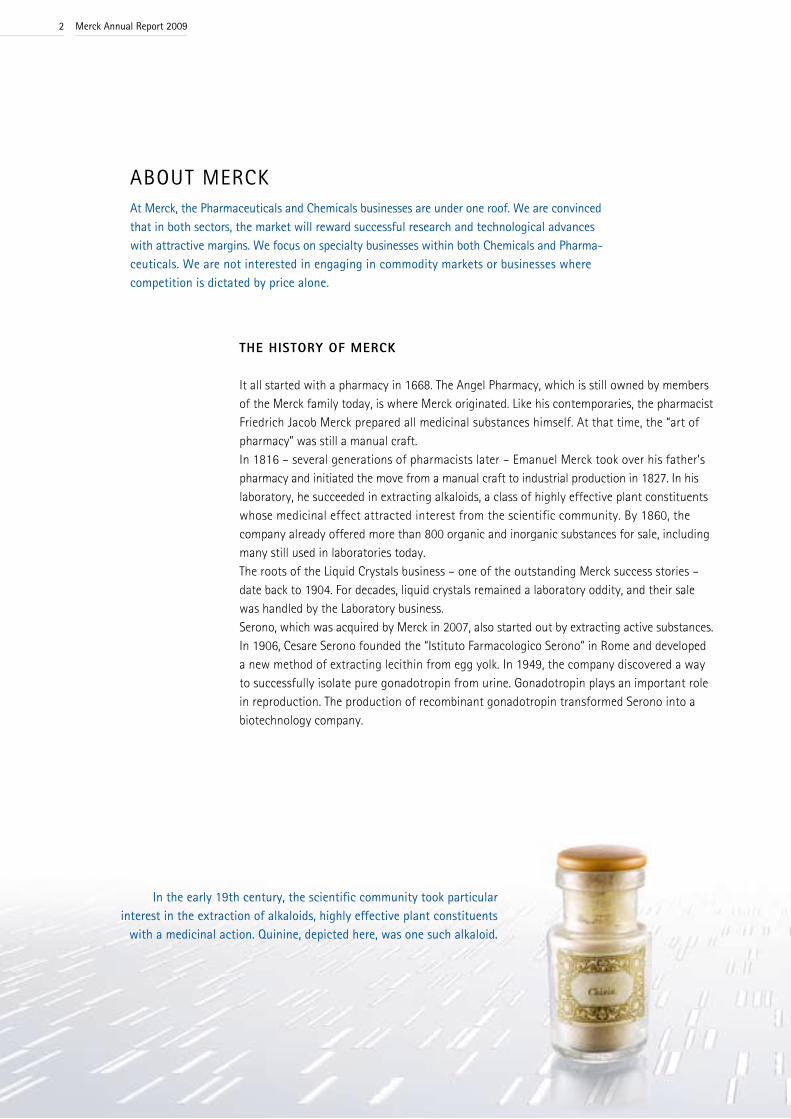
in the early 19th century, the scientific community took particular interest in the extraction of alkaloids, highly effective plant constituents
with a medicinal action. Quinine, depicted here, was one such alkaloid.
Merck Annual Report 20092

BECOMING A GLOBAL, PUBLICLY LISTED COMPANY
Initial business relationships with European neighbors were established in the 1820s. Since 1900, Merck has had business relationships on all continents.In the United States, Georg (later on “George“) Merck, a grandson of Emanuel Merck, founded a trading company called Merck & Co. in 1891. As a result of World War I, Merck in Darmstadt lost its entire stake in this company under the “Trading with the Enemy Act” of 1917. George Merck succeeded in reacquiring his interest and became president of the public company Merck & Co. Today, the two companies are no longer linked to one another. The U.S. company Merck & Co. owns the rights to the name within North America, while Merck in Darmstadt holds the rights in the rest of the world. In the United States and Canada, the company oper-ates under the name EMD, the abbreviation for Emanuel Merck, Darmstadt.Acquisitions and divestments have always played an important role at Merck. A decisive step in Merck’s expansion was the acquisition of a 50% interest in the Bracco Group of Italy in 1972. Aside from commercializing contrast agents and its own pharmaceutical specialties, Bracco served as Merck’s representative in Italy for the entire Merck product range, helping to significantly boost Merck’s earning power. In 1991, Merck acquired Société Lyonnaise Industrielle Pharmaceutique (Lipha), which employed around 2,700 people and generated sales of DM 723 million. In the mid-1990s, Merck expanded its consumer health care business by acquiring Seven Seas in the United Kingdom and Monot in France. At the same time, with the acquisition of Amerpharm of the United Kingdom, Merck achieved a critical mass in the generic drugs business. The takeover of a large number of laboratory distribution businesses was rounded off by the purchase of VWR Scientific Products, a U.S. laboratory distributor, in 1999. In order to secure the financing of these acquisitions, Merck went public in 1995. A 26% interest in Merck KGaA was sold to shareholders. Thereafter, the Merck family held the remaining 74% via the general partner E. Merck. Following a capital increase in 2007, ownership shifted slightly to its current 30:70 ratio.The first half of the decade just ended saw a significant number of disposals and divestments. In 2000, Merck divested its interests in Bracco and vitamin chemicals. In 2004, the company exited from the laboratory distribution and electronic chemicals businesses. In 2006, Merck was debt-free. In 2007, Merck succeeded with the transformational acquisition of Serono. Involving a purchase price of € 10.3 billion, this was by far the largest acquisition ever made by Merck. As the generics business was sold in the same year for € 4.9 billion, the company lowered its debt to less than € 1 billion by year-end.
3
MERCK TODAY
Merck runs its operating business in four divisions: Merck Serono, Consumer Health Care, Liquid Crystals, and Performance & Life Science Chemicals.
The Merck Serono division markets prescription medicines. It discovers, develops and manu-factures both chemical and biological molecules. Merck holds strong positions in neurode-generative diseases and oncology. In addition, the division markets fertility treatments, a field in which we are the market leader, growth hormones, as well as a broad portfolio of classic products, especially for cardiovascular diseases and metabolic disorders.
The Consumer Health Care division offers over-the-counter products for preventive health care and the self-treatment of minor ailments.
Merck is the global leader in the liquid crystals market. Besides the display materials business, the Liquid Crystals division focuses on the development of molecules for printable organic electronics, on the use of alternative energy, as well as on lighting materials for energy-saving LEDs (light-emitting diodes) and OLEDs (organic LEDs).
Performance & Life Science Chemicals, the second division within the Chemicals business sector, mainly supplies specialty chemicals to regulated markets, for example the pharma-ceutical, cosmetics and food industries. Analytical and scientific laboratories use our reagents and test kits. Moreover, the division is the market leader for pearl luster effect pigments – a highly specialized niche within the pigment market.
THE FUTURE
Merck will continue to operate in both Pharmaceuticals and Chemicals and to focus on specialty products. We will also continue to invest significantly in research and development. We want to grow both organically and through acquisitions. We will adhere to our conservative finance policy.
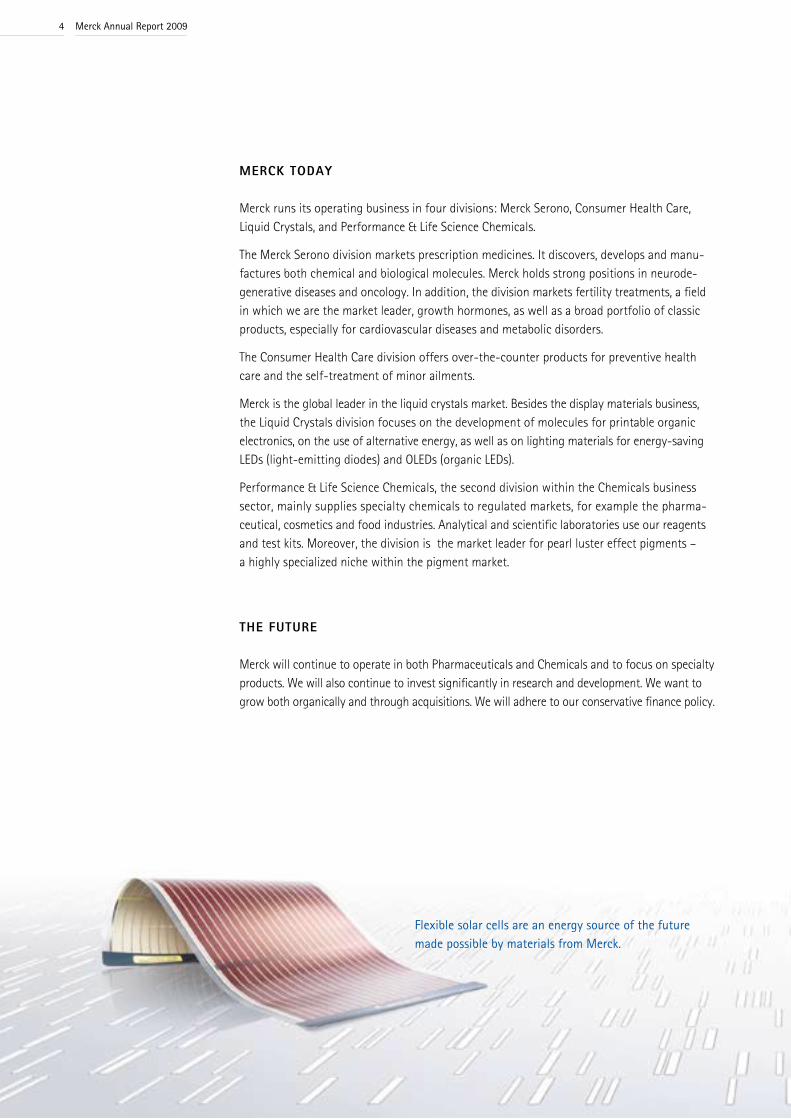
Flexible solar cells are an energy source of the future made possible by materials from Merck.
4 Merck Annual Report 2009
to ouR shAReholdeRs 6 Letter from Karl-Ludwig Kley10 Executive Board
5
let teR FRoM kARl-ludwiG kley
“our balanced business model proves its worth, especially in times of crisis.“ Dr. Karl-Ludwig Kley
Merck Annual Report 20096
When we look back 12 months ago and to the uncertainties at that time, we can now be glad that the impact of the financial and economic crisis on Merck was milder than originally feared. Of course, fiscal 2009 was also a year of highs and lows for us. Overall, however, we are presenting a satisfactory set of financial statements despite the environment in which we operated.
Total revenues increased by 2.1%. Return on sales was 8.4% and underlying free cash flow rose to € 852 million. As a result, underlying free cash flow on revenues (FCR), one of our key financial performance indicators besides return on sales, rose to 11.0%. Our profit after tax remained virtually constant. This ensures a high degree of liquidity and – against the background of low debt – solid balance sheet ratios.
Were there any special formulas for mastering the crisis?
None that were new for us. First, due to their strong focus on specialty businesses, our Pharmaceuticals and Chemicals business sectors are only moderately affected by fluctuations in economic activity. Second, our well-balanced business model proves its worth, especially in times of crisis. And lastly, our rapid response to the downturn helped. We adjusted our production levels quickly, introduced reduced working hours where necessary, limited hiring to a minimum, and applied the brake on spending. Our employees not only demonstrated their commitment and flexibility, they also behaved in a very cost-conscious manner. For this they deserve my special thanks.
As expected, the Pharmaceuticals business proved to be resilient to economic conditions, generating growth of 6.5%.
While 2009 was a very successful year for the Merck Serono division, we once again realized that the discovery and development of new medicines always involve risk. At the beginning of the year, we had to withdraw Raptiva ® from the market. Then we were confronted with a very surprising negative opinion from the European Medicines Agency regarding the use of Erbitux ® in the treatment of lung cancer. Lastly, we received a refuse to file letter in response to our regulatory submission of cladribine tablets in the United States. Yet these setbacks are counter-balanced by just as many successes. We further consolidated our position as a leading manufacturer of biopharmaceuticals.
Three products are prominent examples of our range of biotech medicines, which accounted for 60% of sales by the Merck Serono division:
– Erbitux ® is now a standard first-line therapy for colorectal cancer; it achieved the breakthrough in head and neck cancer, and successfully entered the Japan ese market. All three factors contributed to a 23% increase in sales.
– The success story of Rebif ® for the treatment of multiple sclerosis continued, with sales totaling € 1,537 million. The launch of Rebismart ®, the first electronic injection device, contributed considerably to growth of 15%.
– We launched Kuvan ® in the EU, which could help around 50,000 patients who suffer from hyperphenylalaninemia – a very rare and previously untreatable metabolic disorder.
Our Consumer Health Care business posted sales growth of 5.7%, which significantly exceeded market growth. The focus on four health themes and key regional markets is paying off.
Our Chemicals business sector fared better in the crisis than some competitors and delivered a brilliant finish at year-end.
Above all, the Liquid Crystals division caught up in the fourth quarter, generating a 23% increase in sales, with a return on sales that is still exceptional for a chemicals business. That was despite the substantial drop in demand and intense price competition. Our innovative PS-VA liquid crystal mixtures are increasingly becoming the preferred technology for high-quality displays, primarily in tele-visions. This enabled us to further secure our market and technology leadership.
For the Performance & Life Science Chemicals division, 2009 was to some extent a highly problematic year. While developments in the Laboratory and Life Science Solutions businesses were for the most part stable, we sustained a 10% decline in sales in our Pigments business – despite a good fourth quarter. We quickly adapted our output at all sites to the order situation, temporarily shut down production units and introduced reduced working hours for the first time. Nevertheless, our faith in the Pigments business did not diminish, also demonstrated by our acqui-sition of Taizhu, a leading manufacturer of effect pigments in China.
8
What do we expect in the near future?
The global economic crisis is not over yet. Therefore, we assume that 2010 will also be a difficult year. And unfortunately, at Merck we don’t live on an island of the blessed, around which the rushing waters of the crisis flow. It’s certain that we will focus on innovations, perhaps even to a greater extent than before. They are our elixir of life. It’s also clear that we want to balance the inherent risks of research through the diversity of our business areas. Both these intents are con-sistent with the corporate strategy entitled “Sustain – Change – Grow”, which we continue to actively pursue.
Despite setbacks, our current pharmaceutical pipeline is the best in the history of Merck and one of our key growth drivers. With ten projects in the final phase of clinical development alone, we do not fear the future. Technological innovations are also tremendously important in the Chemicals business. Here we want to find answers to urgent issues such as the shortage of energy supplies and resource conservation. That’s why we spend far more than € 1 billion on research and development annually.
Achieving growth also involves the regional expansion of our businesses. In 2009, this was primarily the case in Japan, where we grew significantly. The year 2009 was also very successful in China, where we are establishing our Asian pharma-ceutical research and development center and plan to create 200 new positions. We see unexploited market potential for Merck in both the United States and India, and we are working on ways to tap this potential.
We can only grow if everyone pulls together. On behalf of the Executive Board, I would therefore like to thank our employees, the Merck family and, last but not least, you – our shareholders – for your support. We appreciate your loyalty and will work further to justify your trust.
9

Elmar Schnee Head of the Pharmaceuticals business sector
born in 1959, business graduate
joined Merck in 2003, Member of the Executive Board since November 2005
Responsibility for Group-wide functions: Pharmaceuticals business sector
Regional responsibilities: Europe; United States (Pharmaceuticals); Canada; Latin and Central America; Africa; Middle East
eXecutiVe BoARd
elmar schnee
Merck Annual Report 200910
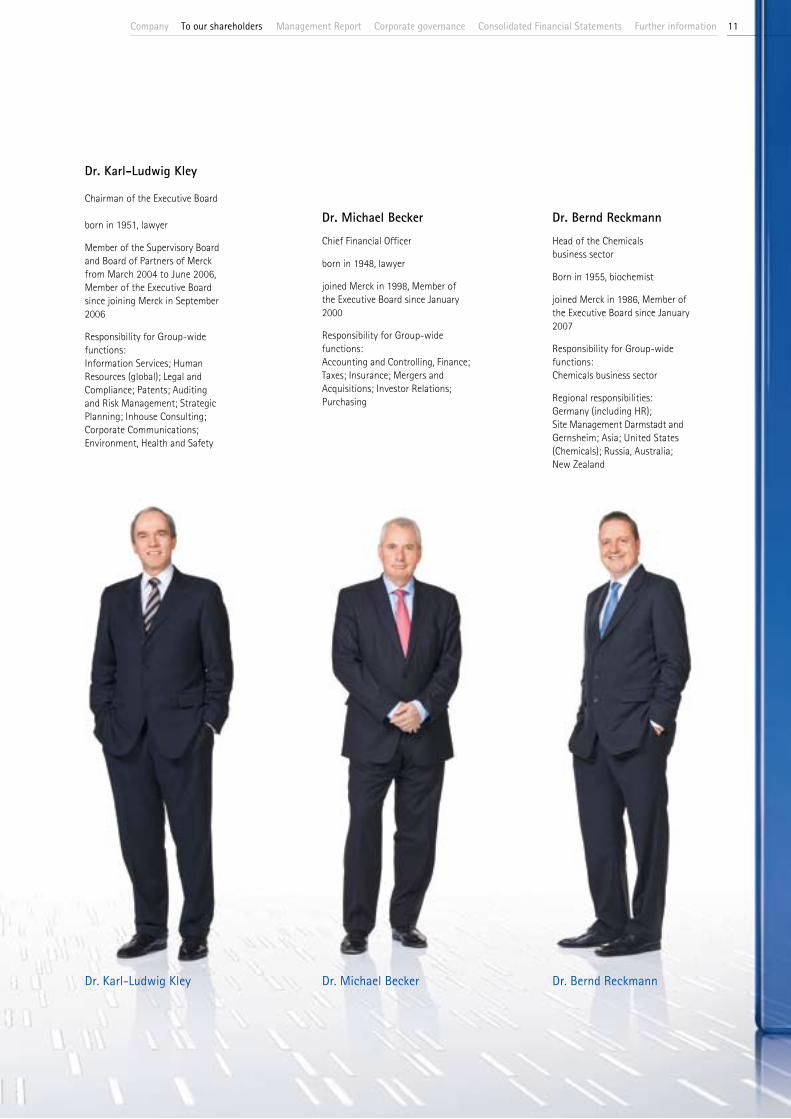
Dr. Karl-Ludwig Kley
Chairman of the Executive Board
born in 1951, lawyer
Member of the Supervisory Board and Board of Partners of Merck from March 2004 to June 2006, Member of the Executive Board since joining Merck in September 2006
Responsibility for Group-wide functions: Information Services; Human Resources (global); Legal and Compliance; Patents; Auditing and Risk Management; Strategic Planning; Inhouse Consulting; Corporate Communications; Environment, Health and Safety
Dr. Michael BeckerChief Financial Officer
born in 1948, lawyer
joined Merck in 1998, Member of the Executive Board since January 2000
Responsibility for Group-wide functions: Accounting and Controlling, Finance; Taxes; Insurance; Mergers and Acquisitions; Investor Relations; Purchasing
dr. karl-ludwig kley dr. Michael Becker dr. Bernd Reckmann
Dr. Bernd ReckmannHead of the Chemicals business sector
Born in 1955, biochemist
joined Merck in 1986, Member of the Executive Board since January 2007
Responsibility for Group-wide functions:Chemicals business sector
Regional responsibilities: Germany (including HR); Site Management Darmstadt and Gernsheim; Asia; United States (Chemicals); Russia, Australia; New Zealand
company 11corporate governance Further informationconsolidated Financial statementsManagement Reportto our shareholders

MAnAGeMent RepoRt13 Overall economic situation15 Financial position and results of operations26 Responsibility29 Merck shares34 Pharmaceuticals | Merck Serono50 Pharmaceuticals | Consumer Health Care56 Chemicals | Liquid Crystals62 Chemicals | Performance & Life Science Chemicals68 Corporate and Other70 Risk report75 Report on expected developments80 Subsequent events
12 Merck Annual Report 2009
oVeRAll econoMic situAtionFollowing a steep decline, global economic activity stabilized in the course of 2009. the pharmaceutical market still grew slightly yet the chemical industry sustained sharp losses. india and china remained growth markets.
Global economy in crisis At the end of 2008 and the beginning of 2009, the global economy and global trade experi-enced the strongest collapses since World War II – perhaps even since the Great Depression. Globally, central banks lowered their interest rates and supplied banks with liquidity to a virtually unlimited extent in order to replace the interbank markets, which had dried up. In parallel, governments propped up the distressed banks by issuing guarantees and making capital injections, and they raised the level of guarantees for private bank account balances. In addition, governments around the world set up programs in order to support and boost their economies. Many countries increased their debt levels substantially for this purpose, which in the opinion of many economists represents a greater threat to the global economic system than the financial crisis.
Global economy shrinks – Growth in India and China For 2009, experts assume a decline in average global economic output. Whereas growth resumed in many countries in the second quarter, and no later than the third, this did not compensate for the steep drop at the beginning of the year.In January 2010, the International Monetary Fund (IMF) reported that the global economy declined by 0.8% in 2009. Gross domestic product (GDP) decreased by 2.5% in the United States and by 3.9% in the euro zone. However, according to IMF estimates, India achieved an increase of 5.6% and China even grew by 8.7%.The Organization for Economic Cooperation and Development (OECD) assumes that GDP decreased by 3.5% for all of its 30 member countries. In terms of GDP, the U.S. economy contracted by 2.5%, the Japanese economy declined by 5.3% and the GDP of the EU OECD member countries decreased by 4%.
Pharmaceutical market hardly affected by the crisisThe market research firm IMS Health assumed that in 2009, the global pharmaceutical market achieved a volume of between US$ 775 billion and US$ 785 billion with growth ranging between 5.5% and 6.5%. This volume exceeded the expectations of April 2009 amounting to US$ 750 billion, but fell short of the optimistic forecasts made in October 2008 of more than US$ 820 billion. According to IMS calculations, the U.S. pharmaceutical market also grew more strongly than expected and achieved an increase of between 4.5% and 5.5%. In April 2009, IMS had assumed this market would decline by 1% to 2%. In 2009, growth in countries in which medicines are reimbursed by government health care systems was less affected by the financial and economic crisis. This applied for instance to Germany, Japan and Spain. By contrast, in countries where patients largely finance their health care themselves, such as Russia, Mexico and South Korea, the pharmaceutical market grew at a slower pace.
company 13corporate governanceto our shareholders Further informationManagement Report consolidated Financial statements
overall economic situation
In the consumer health care business with over-the-counter (OTC) pharmaceutical and health products, both China and Russia moved into the ranks of the top ten countries worldwide. In 2008, sales growth of the OTC market for the first time exceeded that of the prescription drugs market. Consequently, the consumer health care business could become attractive to big pharmaceutical companies again, especially since according to the market research firm Nicholas Hall, the consumer health care market grew by 3%.
Chemical sector suffers owing to economic downturnAccording to calculations by the VCI (German Chemical Industry Association) global chemical output, including pharmaceutical substances, decreased by 3.1% in 2009. Japan and Germany were at the bottom of the ranking, sustaining declines of 9% and 10%, respectively. The EU recorded a decline of 4.9% and the United States a decline of 4.2%. India and China stood out positively with chemical output rising by 6.7% and 7.2%, respectively. The VCI reported that sales by the German chemical industry fell by 15%. The CEFIC (European Chemical Industry Council) noted a 12% drop in European chemical out-put in 2009 as compared with a decline of 4.5% in 2008. These figures exclude the production of pharmaceutical substances. According to CEFIC data, manufacturers of inorganic products suffered especially from the 20% collapse in output, followed by polymer producers, who experienced a drop of just under 20%. Manufacturers of consumer chemicals fared best, whose output declined by 6.5%, fol-lowed by that of specialty chemicals producers. The latter two are more or less the segments in which Merck is positioned with the Chemicals business sector.
Merck Annual Report 200914

FinAnciAl position And Results oF opeRAtionsthanks to its diversified portfolio of innovative pharmaceuticals and chemicals, Merck coped more successfully with the crisis than some other companies. total revenues increased 2.1% and profit after tax remained virtually constant.
Stable business developmentTotal revenues increased by 2.1% to € 7,747 million in 2009. While both Pharmaceuticals divisions grew continually, the Chemicals divisions recovered from the economic crisis in the course of the year. Detailed information on the revenue and profit figures of the divisions, as well as developments by region and product, can be found in the chapters on the individual divisions starting on page 34.Royalty and commission income declined by 4.8% to € 369 million. In 2009, we reclassified commission income from marketing and selling costs to total revenues (€ 24 million in 2009, € 32 million in 2008), since these now represent regular business revenues for Merck. The previous year’s figures and key indicators have been adjusted accordingly.
Total revenues by business sector*
€ million8,000
6,000
4,000
2,000
2005 2006 2007 2008 2009
* excluding corporate and other
Chemicals Pharmaceuticals
At € 5,718 million, gross margin rose only slightly, by 0.6%, over 2008 because the 6.5% increase in cost of sales exceeded the increase in sales. This was primarily the result of a high level of inventory write-downs and capacity underutilization in the Chemicals business sector. Marketing and selling expenses increased by 6.8% because the Merck Serono division launched new medicines and introduced existing products in new indications. The ratio of these expenses to total revenues increased slightly from 28% to 29%. Marketing and selling expenses also include royalty and commission expenses. These are incurred for sales of products which we either co-market with partners or for which we pay royalty fees in order to market. The sum of both items increased significantly over 2008 since sales of the relevant products developed well, consequently increasing marketing and selling expenses.
company 15corporate governanceto our shareholders Further informationManagement Report consolidated Financial statements
overall economic situationFinancial position and results of operations

Royalty and commission income and expenses include the royalty and commission income reported in total revenues. They also include the expenses for marketing licenses, which are disclosed in marketing and selling expenses, as well as to a lesser extent expenses for production licenses, which are reported in cost of sales.
Royalty and commission income and expenses by division in 2009
€ million TotalMerck Serono
Consumer Health
CareLiquid
Crystals
Performance & Life
Science Chemicals
Corporate and Other
Royalty expenses –172 –151 –1 –16 –4 0Royalty income 345 328 2 7 8 0Total 173 177 1 –9 4 0
Commission expenses –257 –253 0 0 –4 −Commission income 24 23 0 0 1 −Total –233 –230 0 0 –3 −
Royalty and commission income and expenses by division in 2008
€ million TotalMerck Serono
Consumer Health
CareLiquid
Crystals
Performance & Life
Science Chemicals
Corporate and Other
Royalty expenses –199 –180 –2 –13 –4 0Royalty income 356 337 2 12 5 0Total 157 157 0 –1 1 0
Commission expenses –165 –157 0 0 –7 –1Commission income 32 27 0 1 4 −Total –133 –130 0 1 –3 –1
Administration expenses decreased by 4.8% to € 425 million in 2009. The line item “other operating income and expenses” increased sharply from € -170 million to € -373 million. This mainly reflects additions of € 167 million to provisions for litigation relating primarily to the Merck Serono division. Furthermore, we recorded € 38 million in impairments of mainly intangible assets since research projects had to be discontinued. We also recorded write-downs of € 28 million for trade accounts receivable. Expenses amounting to € 68 million were recorded for currency risks in Venezuela. Of this amount, € 59 million was attributable to the Merck Serono division, € 7 million to Consumer HealthCare, and € 2 million to Performance & Life Science Chemicals. This is in contrast to the exchange-rate gains from currency hedging transactions for the Merck Serono and Liquid Crystals divisions. We increased our research and development (R & D) spending because, for the first time in its history, Merck is conducting studies on ten projects in the final phase of clinical testing prior to a potential market launch. At € 1,345 million, we spent 8.9% more on R & D than in 2008. Thus, the ratio of R & D expenses to total revenues was 17%.
R & D spending increased sharply – especially owing to
late-stage clinical trials.
Merck Annual Report 200916
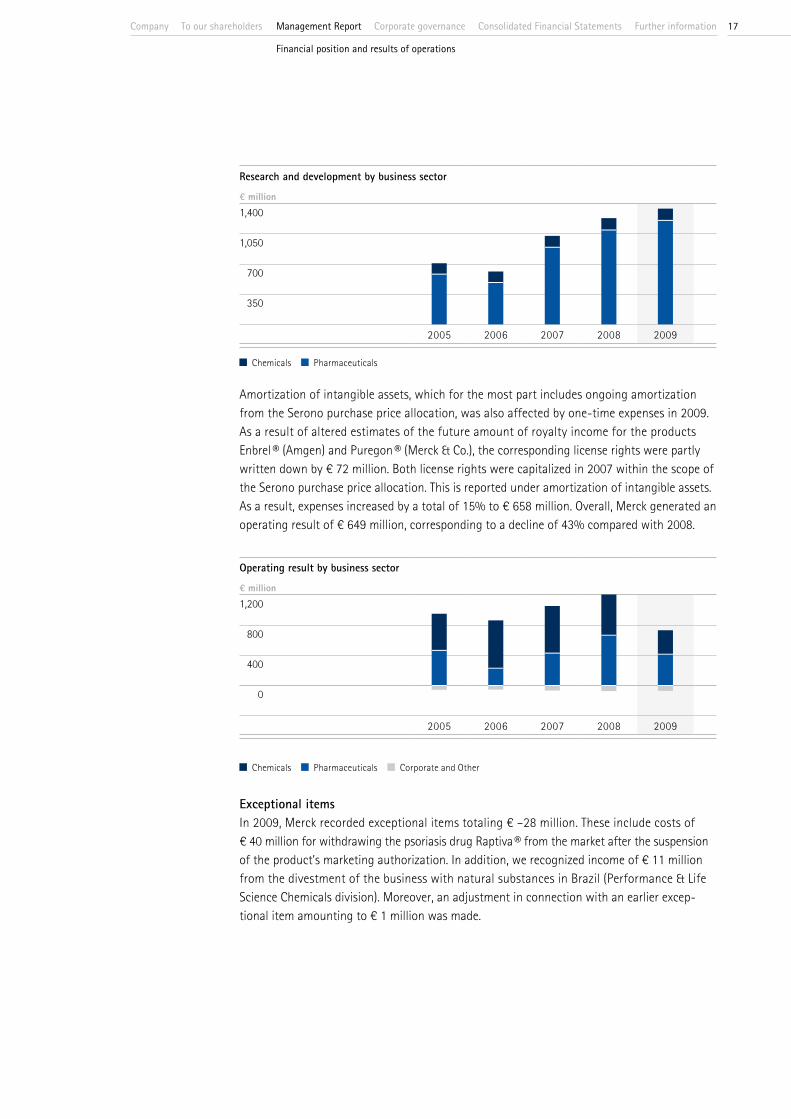
Research and development by business sector
€ million1,400
1,050
700
350
2005 2006 2007 2008 2009
Chemicals Pharmaceuticals
Amortization of intangible assets, which for the most part includes ongoing amortization from the Serono purchase price allocation, was also affected by one-time expenses in 2009. As a result of altered estimates of the future amount of royalty income for the products Enbrel ® (Amgen) and Puregon ® (Merck & Co.), the corresponding license rights were partly written down by € 72 million. Both license rights were capitalized in 2007 within the scope of the Serono purchase price allocation. This is reported under amortization of intangible assets. As a result, expenses increased by a total of 15% to € 658 million. Overall, Merck generated an operating result of € 649 million, corresponding to a decline of 43% compared with 2008.
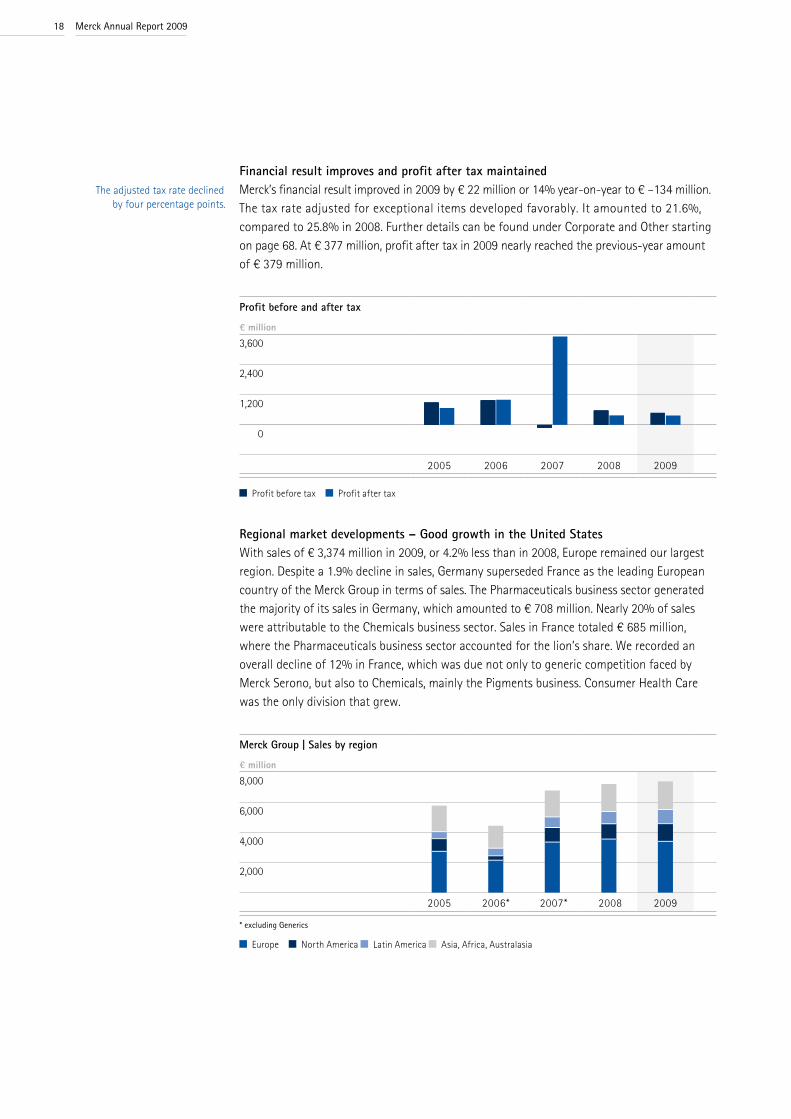
Operating result by business sector
€ million1,200
800
400
0
2005 2006 2007 2008 2009
Chemicals Pharmaceuticals Corporate and Other
Exceptional items In 2009, Merck recorded exceptional items totaling € –28 million. These include costs of € 40 million for withdrawing the psoriasis drug Raptiva ® from the market after the suspension of the product’s marketing authorization. In addition, we recognized income of € 11 million from the divestment of the business with natural substances in Brazil (Performance & Life Science Chemicals division). Moreover, an adjustment in connection with an earlier excep-tional item amounting to € 1 million was made.
company 17corporate governanceto our shareholders Further informationManagement Report consolidated Financial statements
Financial position and results of operations
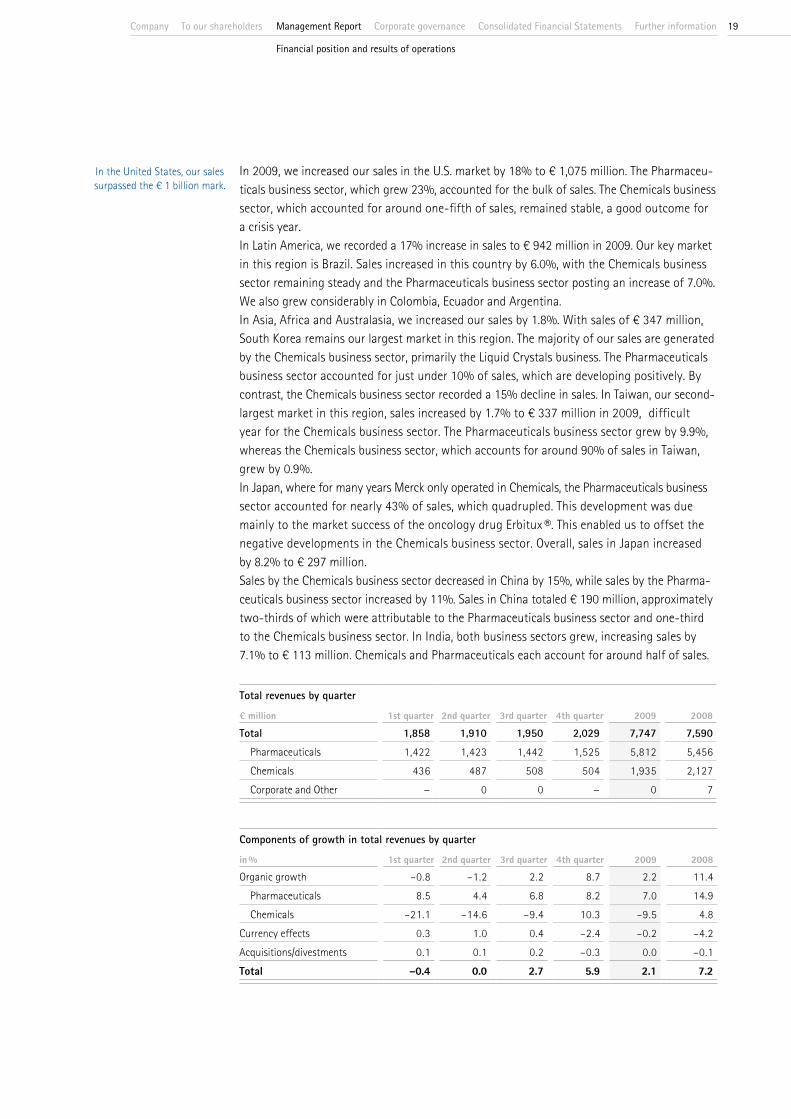
Financial result improves and profit after tax maintainedMerck’s financial result improved in 2009 by € 22 million or 14% year-on-year to € –134 million. The tax rate adjusted for exceptional items developed favorably. It amounted to 21.6%, compared to 25.8% in 2008. Further details can be found under Corporate and Other starting on page 68. At € 377 million, profit after tax in 2009 nearly reached the previous-year amount of € 379 million.
Profit before and after tax
€ million3,600
2,400
1,200
0
2005 2006 2007 2008 2009
Profit before tax Profit after tax
Regional market developments – Good growth in the United StatesWith sales of € 3,374 million in 2009, or 4.2% less than in 2008, Europe remained our largest region. Despite a 1.9% decline in sales, Germany superseded France as the leading European country of the Merck Group in terms of sales. The Pharmaceuticals business sector generated the majority of its sales in Germany, which amounted to € 708 million. Nearly 20% of sales were attributable to the Chemicals business sector. Sales in France totaled € 685 million, where the Pharmaceuticals business sector accounted for the lion’s share. We recorded an overall decline of 12% in France, which was due not only to generic competition faced by Merck Serono, but also to Chemicals, mainly the Pigments business. Consumer Health Care was the only division that grew.
Merck Group | Sales by region
€ million8,000
6,000
4,000
2,000
2005 2006* 2007* 2008 2009
* excluding Generics
Europe North America Latin America Asia, Africa, Australasia
The adjusted tax rate declined by four percentage points.
Merck Annual Report 200918
In 2009, we increased our sales in the U.S. market by 18% to € 1,075 million. The Pharmaceu-ticals business sector, which grew 23%, accounted for the bulk of sales. The Chemicals business sector, which accounted for around one-fifth of sales, remained stable, a good outcome for a crisis year.In Latin America, we recorded a 17% increase in sales to € 942 million in 2009. Our key market in this region is Brazil. Sales increased in this country by 6.0%, with the Chemicals business sector remaining steady and the Pharmaceuticals business sector posting an increase of 7.0%. We also grew considerably in Colombia, Ecuador and Argentina.In Asia, Africa and Australasia, we increased our sales by 1.8%. With sales of € 347 million, South Korea remains our largest market in this region. The majority of our sales are generated by the Chemicals business sector, primarily the Liquid Crystals business. The Pharmaceuticals business sector accounted for just under 10% of sales, which are developing positively. By contrast, the Chemicals business sector recorded a 15% decline in sales. In Taiwan, our second-largest market in this region, sales increased by 1.7% to € 337 million in 2009, difficult year for the Chemicals business sector. The Pharmaceuticals business sector grew by 9.9%, whereas the Chemicals business sector, which accounts for around 90% of sales in Taiwan, grew by 0.9%.In Japan, where for many years Merck only operated in Chemicals, the Pharmaceuticals business sector accounted for nearly 43% of sales, which quadrupled. This development was due mainly to the market success of the oncology drug Erbitux ®. This enabled us to offset the negative developments in the Chemicals business sector. Overall, sales in Japan increased by 8.2% to € 297 million. Sales by the Chemicals business sector decreased in China by 15%, while sales by the Pharma-ceuticals business sector increased by 11%. Sales in China totaled € 190 million, approximately two-thirds of which were attributable to the Pharmaceuticals business sector and one-third to the Chemicals business sector. In India, both business sectors grew, increasing sales by 7.1% to € 113 million. Chemicals and Pharmaceuticals each account for around half of sales.
Total revenues by quarter
€ million 1st quarter 2nd quarter 3rd quarter 4th quarter 2009 2008
Total 1,858 1,910 1,950 2,029 7,747 7,590 Pharmaceuticals 1,422 1,423 1,442 1,525 5,812 5,456 Chemicals 436 487 508 504 1,935 2,127 Corporate and Other − 0 0 − 0 7
Components of growth in total revenues by quarter
in % 1st quarter 2nd quarter 3rd quarter 4th quarter 2009 2008
Organic growth –0.8 –1.2 2.2 8.7 2.2 11.4 Pharmaceuticals 8.5 4.4 6.8 8.2 7.0 14.9 Chemicals –21.1 –14.6 –9.4 10.3 –9.5 4.8Currency effects 0.3 1.0 0.4 –2.4 –0.2 –4.2Acquisitions/divestments 0.1 0.1 0.2 –0.3 0.0 –0.1Total –0.4 0.0 2.7 5.9 2.1 7.2
In the United States, our sales surpassed the € 1 billion mark.
company 19corporate governanceto our shareholders Further informationManagement Report consolidated Financial statements
Financial position and results of operations

Pharmaceuticals business sector shows solid growthThe Pharmaceuticals business sector, comprising the two divisions Merck Serono and Consumer Health Care, increased total revenues by 6.5% to € 5,812 million in 2009. Royalty and commission income declined by 3.5% to € 353 million.
Pharmaceuticals | Total revenues by division
€ million
467 5,3458 % 92 %
Merck Serono Consumer Health Care
The operating result fell by 39% to € 403 million. Apart from high marketing and selling expenses as well as R & D costs, high one-time expenses had an impact here. These were recorded primarily in connection with additions to provisions for litigation and write-downs of intangible assets. The Pharmaceuticals business sector generated 55% of the Group operating result (excluding Corporate and Other). Return on sales declined to 6.9% compared to 12.0% in 2008.
Pharmaceuticals | Operating result by division
€ million
48 35512 % 88 %
Merck Serono Consumer Health Care
Chemicals business sector suffers owing to the economic downturnThe Chemicals business sector, which consists of the Performance & Life Sciences Chemicals as well as Liquid Crystals divisions, was hit hard by the economic crisis. Our Performance & Life Science Chemicals division supplies high-quality pigments to customers in a wide variety of sectors, including for instance the automotive and cosmetics industries. The global weakness in the automotive sector forced us to temporarily introduce reduced working hours in Pigments production. The Liquid Crystals division also experienced bitter blows to sales, especially at the beginning of the year. However, in the course of the year, it increasingly recovered and returned to a path of healthy growth.
High R & D costs, marketing and selling expenses and one-time expenses lower
theoperating result.
Merck Annual Report 200920

Total revenues of the Chemicals business sector fell by 9.0% to € 1,935 million. Both divisions suffered owing to the underutilization of their capacities, with inventory reductions taking precedence over new production. Apart from write-downs of inventories, the Liquid Crystals division also was adversely affected by increased pressure on prices.
Chemicals | Total revenues by division
€ million
1,202 73362 % 38 %
Liquid Crystals Performance & Life Science Chemicals
The operating result of the Chemicals business sector declined by 42% to € 324 million, thus accounting for 45% of the total Group operating result (excluding Corporate and Other). At 16.8%, return on sales for the Chemicals business was considerably below the 2008 level of 26.2%.
Chemicals | Operating result by division
€ million
97 22730 % 70 %
Liquid Crystals Performance & Life Science Chemicals
Acquisitions strengthen business in Asia and eastern EuropeIn the third quarter of 2009, Merck acquired Suzhou Taizhu Technology Development, a leading supplier of effect pigments headquartered in Taicang, near Shanghai, in China. The total value of the transaction was € 26 million. In October, Merck acquired Bangalore Genei of≈India for € 4.6 million to become a leading supplier of bioscience products in India. In Bulgaria, we strengthened our business by acquiring the sales company Aquacomp for € 2.8 million in the third quarter. The company, which posts annual sales of around € 10 mil-lion, has been our marketing partner for the past 17 years.
Dividend proposalThe objective of our dividend policy is to distribute, on a long-term average, a total dividend equivalent to 30%−40% of Group profit after tax. We will propose to the Annual Meeting on April 9, 2010 the payment of a dividend of € 1.00 per share.
Merck is strengthening its presence in the growth
markets of China and India.
company 21corporate governanceto our shareholders Further informationManagement Report consolidated Financial statements
Financial position and results of operations
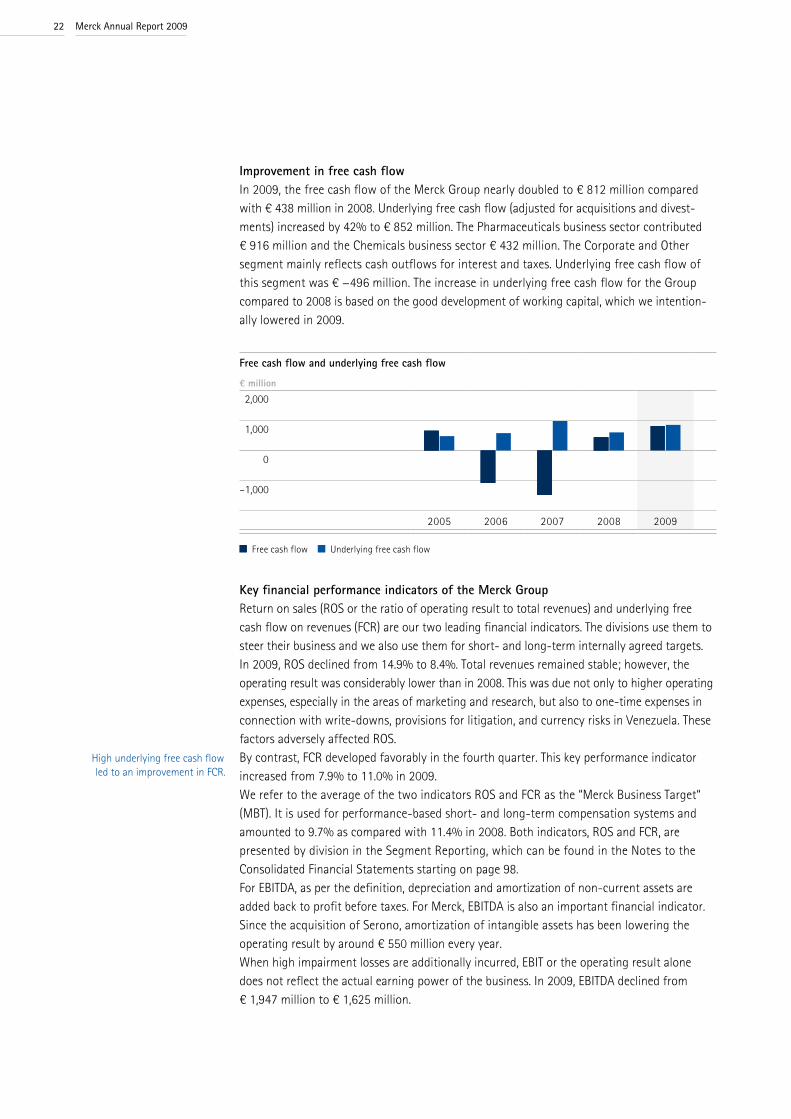
Improvement in free cash flow In 2009, the free cash flow of the Merck Group nearly doubled to € 812 million compared with € 438 million in 2008. Underlying free cash flow (adjusted for acquisitions and divest-ments) increased by 42% to € 852 million. The Pharmaceuticals business sector contributed € 916 million and the Chemicals business sector € 432 million. The Corporate and Other segment mainly reflects cash outflows for interest and taxes. Underlying free cash flow of this segment was € −496 million. The increase in underlying free cash flow for the Group compared to 2008 is based on the good development of working capital, which we intention-ally lowered in 2009.
Free cash flow and underlying free cash flow
€ million 2,000
1,000
0
–1,000
2005 2006 2007 2008 2009
Free cash flow Underlying free cash flow
Key financial performance indicators of the Merck GroupReturn on sales (ROS or the ratio of operating result to total revenues) and underlying free cash flow on revenues (FCR) are our two leading financial indicators. The divisions use them to steer their business and we also use them for short- and long-term internally agreed targets. In 2009, ROS declined from 14.9% to 8.4%. Total revenues remained stable; however, the operating result was considerably lower than in 2008. This was due not only to higher operating expenses, especially in the areas of marketing and research, but also to one-time expenses in connection with write-downs, provisions for litigation, and currency risks in Venezuela. These factors adversely affected ROS.By contrast, FCR developed favorably in the fourth quarter. This key performance indicator increased from 7.9% to 11.0% in 2009. We refer to the average of the two indicators ROS and FCR as the “Merck Business Target“ (MBT). It is used for performance-based short- and long-term compensation systems and amounted to 9.7% as compared with 11.4% in 2008. Both indicators, ROS and FCR, are presented by division in the Segment Reporting, which can be found in the Notes to the Consolidated Financial Statements starting on page 98.For EBITDA, as per the definition, depreciation and amortization of non-current assets are added back to profit before taxes. For Merck, EBITDA is also an important financial indicator. Since the acquisition of Serono, amortization of intangible assets has been lowering the operating result by around € 550 million every year. When high impairment losses are additionally incurred, EBIT or the operating result alone does not reflect the actual earning power of the business. In 2009, EBITDA declined from € 1,947 million to € 1,625 million.
High underlying free cash flow led to an improvement in FCR.
Merck Annual Report 200922
Key figures of the Merck Group
EBITDA € million
Underlying free cash flow
€ millionFCR
%ROS
%
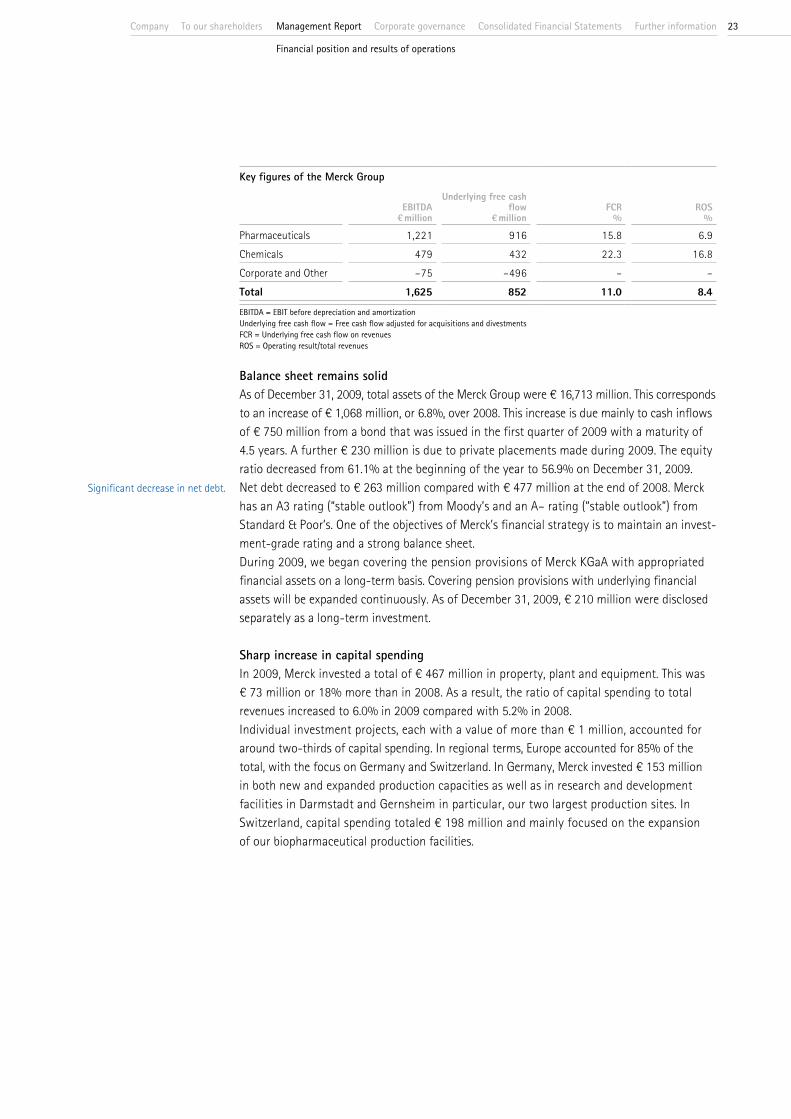
Pharmaceuticals 1,221 916 15.8 6.9Chemicals 479 432 22.3 16.8Corporate and Other –75 –496 – –Total 1,625 852 11.0 8.4
eBitdA = eBit before depreciation and amortization underlying free cash flow = Free cash flow adjusted for acquisitions and divestmentsFcR = underlying free cash flow on revenuesRos = operating result/total revenues
Balance sheet remains solidAs of December 31, 2009, total assets of the Merck Group were € 16,713 million. This corresponds to an increase of € 1,068 million, or 6.8%, over 2008. This increase is due mainly to cash inflows of € 750 million from a bond that was issued in the first quarter of 2009 with a maturity of 4.5 years. A further € 230 million is due to private placements made during 2009. The equity ratio decreased from 61.1% at the beginning of the year to 56.9% on December 31, 2009. Net debt decreased to € 263 million compared with € 477 million at the end of 2008. Merck has an A3 rating (“stable outlook”) from Moody’s and an A– rating (“stable outlook”) from Standard & Poor’s. One of the objectives of Merck’s financial strategy is to maintain an invest-ment-grade rating and a strong balance sheet.During 2009, we began covering the pension provisions of Merck KGaA with appropriated financial assets on a long-term basis. Covering pension provisions with underlying financial assets will be expanded continuously. As of December 31, 2009, € 210 million were disclosed separately as a long-term investment.
Sharp increase in capital spending In 2009, Merck invested a total of € 467 million in property, plant and equipment. This was € 73 million or 18% more than in 2008. As a result, the ratio of capital spending to total revenues increased to 6.0% in 2009 compared with 5.2% in 2008.Individual investment projects, each with a value of more than € 1 million, accounted for around two-thirds of capital spending. In regional terms, Europe accounted for 85% of the total, with the focus on Germany and Switzerland. In Germany, Merck invested € 153 million in both new and expanded production capacities as well as in research and development facilities in Darmstadt and Gernsheim in particular, our two largest production sites. In Switzerland, capital spending totaled € 198 million and mainly focused on the expansion of our biopharmaceutical production facilities.
Significant decrease in net debt.
company 23corporate governanceto our shareholders Further informationManagement Report consolidated Financial statements
Financial position and results of operations

In North America, we invested € 32 million – the majority of which went toward the expansion of pharmaceutical research in Boston. Capital spending in Latin America totaled € 15 milion. Our subsidiaries in Asia accounted for a total capital spending volume of € 23 million, with the focus on South Korea, Japan and China, particularly for the Chemicals business sector. Capital spending by the Pharmaceuticals business sector totaled € 327 million, with the Merck Serono division accounting for the majority of this amount. The main focus of the investments was on the expansion of our biotech production capacities in Corsier-sur-Vevey, Switzerland, which again in 2009 represented the single largest investment project of the Merck Group. Around 15% of capital spending in this business sector related to headquarters in Darmstadt.
Capital spending on property, plant and equipment
€ million500
375
250
125
2005 2006 2007 2008 2009
Chemicals Pharmaceuticals
Capital spending on property, plant and equipment in the Chemicals business sector amounted to € 140 million, with the Liquid Crystals division accounting for € 64 million and the Perfor-mance & Life Science Chemicals division for € 75 million. Both divisions invested chiefly at the Darmstadt and Gernsheim sites, our main locations, in order to expand and modernize existing production facilities, to improve infrastructure and to construct new research buildings.
Value added Value added is a measure of the economic strength of a company and indicates how the corporate result is achieved and for what it is used.Our corporate result, meaning the sum of total revenues, other income and financial income, amounted to € 7,918 million. After deducting the costs of materials as well as other purchased services and expenses, gross value added amounted to € 3,791 million. Following the deduction of depreciation and amortization, net value added was € 2,787 million.With a share of 76%, the majority amounting to € 2,129 million benefited employees in the form of personnel expenses. Financial expenses declined to € 171 million in comparison with 2008. Taxes on income decreased markedly to € 110 million, not only as a result of the lower level of profit before tax. At € 377 million, profit after tax remained at the level of 2008.
Capital spending strengthens R & D and production.
Merck Annual Report 200924

Net value added statement
€ million 2009 2008
Total revenues 7,747 7,590Other income 135 142Financial income 36 37Corporate result 7,918 7,769Cost of materials –1,182 –1,089Other purchased services/expenses –2,945 –2,681Gross value added 3,791 3,999Depreciation and amortization –1,004 –1,215Net value added 2,787 2,784
Distribution of net value added
€ million 2009 2008
Personnel expenses 2,129 2,015Financial expenses 171 194Taxes on income 110 196Profit after tax 377 379Net value added 2,787 2,784
Summary assessmentIn summary, Merck’s overall business development in 2009 was again satisfactory following the unexpected steep decline at the end of 2008 and the beginning of 2009. The Pharma-ceuticals business sector continued to develop well; however, one-time expenses adversely affected the fourth quarter in particular. The Chemicals business sector recovered in the course of the year. The balance sheet ratios and key performance indicators of Merck remain very solid and an expression of our financial strategy of ensuring Merck’s liquidity at all times. Merck’s bank debts are low. In addition, we have issued bonds for refinancing purposes and have secure investment deposits as well as open credit lines.
Balance sheet ratios and key performance
indicators remain solid.
company 25corporate governanceto our shareholders Further informationManagement Report consolidated Financial statements
Financial position and results of operations

ResponsiBilityMerck lives up to its responsibility to employees, customers and the environment. in 2009, we reached important milestones in implementing eu regulations and exceeded our objectives for climate protection and safety.
Number of employees nearly unchangedAs of December 31, 2009, our company had 33,062 employees. The number of employees in 2009 hardly changed in comparison with 2008. Merck was represented in 61 countries by 176 companies and had 54 production sites located in 26 countries. In several countries, there were significant changes in the number of employees. In China, the workforce increased by 455 employees owing to the expansion of the pharmaceutical business and the acquisition of the pigment producer Suzhou Taizhu Technology Development. In India, the number of employees rose by 388, mainly owing to the expansion of the Merck Serono business and the acquisition of the bioscience firm Bangalore Genei. In France, the number of employees declined by 306. This is attributable to both the transfer of the primary care field force to the Japanese pharmaceutical company Daiichi Sankyo in January, and to the closure of the Chilly-Mazarin site in March. In Italy, the number of employees fell by 108 since employees here were also transferred to Daiichi Sankyo and research activities were relocated. In the United States, the site in Madison, Wisconsin was closed, reducing the headcount by 243. In Brazil, the headcount declined by 117 owing to the disposal of two locations, São Luís and Barra do Corda.
Number of employees as of December 31, 2009
8,163 18,57625 % 56 %
4,27213 %
2,0516 %
Europe North America Latin America Asia, Africa, Australasia
Because of a drop in demand in several businesses, employees in Pigments and Patinal pro-duction at the Gernsheim site in Germany began working reduced hours in May. In September, similar measures were also introduced at the organic synthesis plant located at that site. We terminated reduced working hours as of December 31, 2009. Similar measures to scale back production were taken at the Pigments production sites in Japan and the United States. Likewise, in response to the economic crisis, in December 2008 Merck adopted a very restrictive hiring policy which applies Group-wide and remains in place until further notice. In 2009, 22% of our employees worked in production, 33% in marketing and sales, 11% in research and development, and 5% in logistics. The remaining employees worked in areas such as Engineering, Environment, IT, Finance, and Human Resources. In 2009, more than
www.merck.de/ responsibility
Merck Annual Report 200926
519 young people were enrolled in vocational training programs in 19 different occupations at the Darmstadt site, the largest of the Merck Group. We are thus keeping the number of apprentices at a consistently high level. Measures releating to personnel marketing and devel-opment are presented in the Risk Report starting on page 73.
ISO 14001 environmental management system: Group certificate obtained Our spending on environmental protection, health and safety totaled € 131 million in 2009. That amount includes depreciation charges on capital investments and ongoing costs. Merck decided to seek certification of all production sites in accordance with the ISO 14001 international environmental management system. According to this standard, activities in environmental protection are continuously recorded and optimized as part of an improvement process. Here, an internationally valid group certificate applicable to all sites will supersede the previous individual certificates. This requires particularly responsible collaboration among the sites since the certificate will only be granted if all sites in an audit sampling fulfill the certification criteria. A total of 40 production sites worldwide were certified by the end of 2009. We thus successfully introduced the group certificate for the production sites and will in future incorporate additional sites in accordance with developments of the Merck Group.
Ambitious climate targetsClimate protection is an issue that received even more global attention in 2009, not least due to the climate summit in Copenhagen. Merck is also concerned with this topic and is dedicating itself to resource conservation. Our goal is to reduce our entire CO2 emissions – direct and indirect – by 20% by 2020, compared to the 2006 levels. In order to accomplish this, we are focusing on 15 sites, which together account for more than 80% of our total global emissions. We reached our previous goal, which was to lower direct emissions by 10% by 2010, compared to 2002 levels, ahead of schedule.
European chemicals law: REACH implementation underway In implementing the EU regulation REACH (Registration, Evaluation, Authorisation and Restriction of Chemical substances), which comes with great challenges, Merck is playing a pioneering role in important areas. In 2009, we already submitted a large number of registration dossiers to the new European Chemicals Agency in Helsinki. In addition, various sites underwent inspections by authorities, in which we demonstrated exemplary REACH implementation. Furthermore, Merck is engaged in projects of the German Chemical Industry Association (VCI) for a more workable implementation of REACH. Competitive edge: Expertise in regulatory mattersThe Globally Harmonised System of Classification and Labelling of Chemicals (GHS), an EU regulation based on a UN agreement, took effect on January 20, 2009. The new elements of the GHS hazard communication, such as hazard pictograms and signal words, are replacing the previous hazard symbols and phrases. Our labels and safety data sheets are being updated step by step. By the middle of February 2009, Merck had already shipped out the first goods labeled according to GHS. Another important activity was the global training program to acquaint our customers with GHS. In addition to training sessions with regulatory specialists, advanced e-learning courses were also held and customers were given detailed information material.
CO2 emissions are to be reduced by a further
20% by 2020.
company 27corporate governanceto our shareholders Further informationManagement Report consolidated Financial statements
Responsibility

We want to go beyond fulfilling the requirements of REACH and GHS; here we also see a competitive advantage. We can use our expertise in regulatory affairs and in product docu-mentation to provide our customers with support. In addition, we have checked with our suppliers as to whether their chemicals also meet the requirements of REACH, thus establish-ing legal certainty for both Merck and its customers.
Further improvements in occupational health and safetyIn terms of accident prevention and occupational safety, we once more managed to lower the most important indicator, the lost time injury rate (LTR). This rate consists of the number of workplace accidents with one or more missed days of work relative to the number of hours worked. At Merck, the global value is less than four, which means that we exceeded our own targets. To continue to improve, we have set ourselves a new goal: an LTIR of 2.5 by 2015.
Social standards in the supply chain In 2009, Merck was one of the first companies to join the internationally valid Compliance Initiative of the German Federal Association for Materials Management, Purchasing and Logistics (Bundesverband Materialwirtschaft, Einkauf und Logistik – BME). Its goal is to promote legally compliant behavior and social standards along the supply chain. We collaborated extensively on a supplier code of conduct. This code has created an international minimum standard that applies across different industries. It covers rules to fight corruption and child labor as well as minimum requirements regarding antitrust rulings and environmental protec-tion by suppliers.
Fight against counterfeit medicines We are continuing our work worldwide with the Global Pharma Health Fund (GPHF) in the fight against counterfeit medicines. The GPHF-Minilab ®, a non-profit initiative supported by Merck, is a unique mobile compact laboratory used to reliably and rapidly test over 40 active pharmaceutical ingredients. Through this initiative, pharmaceuticals such as antimalaria medicines or antibiotics can be tested quickly, thus closing gaps in monitoring. To date, over 330 Minilabs are being used in 70 countries around the world to check the quality of medicines thanks to GPHF and its collaboration with international partners.
Children’s aid program to fight a serious tropical diseaseThe fight against the tropical disease schistosomiasis, an insidious life-threatening worm disease, is showing results. Together with the World Health Organization WHO, we have established in Africa the preconditions for the widespread treatment of infected school children. We have expanded our aid program to Nigeria, Malawi, Mauritania, Tanzania, Mozambique, Zambia, the Central African Republic, Angola, Senegal, Benin, and Cameroon. In 2009, 25 million tablets of Cesol ® 600 were shipped to these countries, thus nearly doubling the amount shipped in 2008. More than 3.3 million children were treated for schistosomiasis. Worldwide, around 200 million people suffer from schistosomiasis, 200,000 of whom die each year. In total, Merck donated 200 million tablets of Cesol ® 600, which contains the active ingredient praziquantel. This will enable around 27 million children to receive treatment by 2017.
www.gphf.org
Merck donated 200 million tablets containing the active
ingredient praziquantel.
Merck Annual Report 200928
MeRck shAResMerck shares finished 2009 nearly at the previous year’s level but underperformed the dAX ®. this was due primarily to the negative news on drug regulatory submissions.
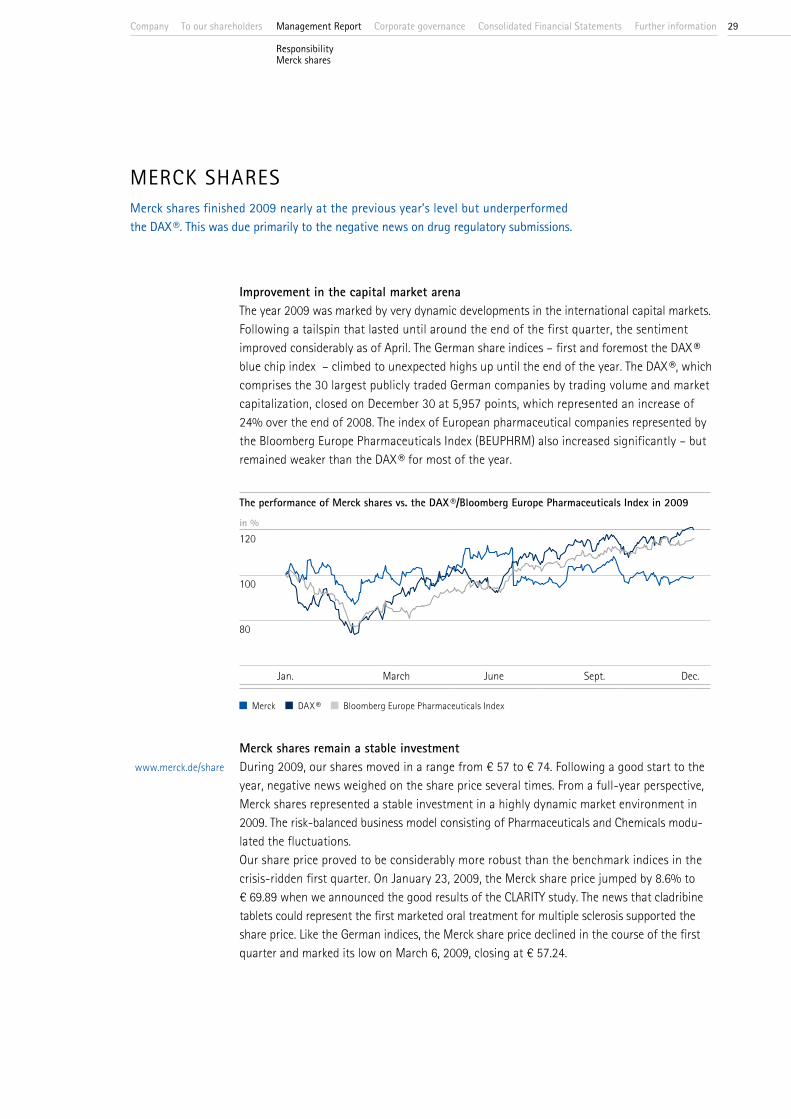
Improvement in the capital market arena The year 2009 was marked by very dynamic developments in the international capital markets. Following a tailspin that lasted until around the end of the first quarter, the sentiment improved considerably as of April. The German share indices – first and foremost the DAX ® blue chip index – climbed to unexpected highs up until the end of the year. The DAX ®, which comprises the 30 largest publicly traded German companies by trading volume and market capitalization, closed on December 30 at 5,957 points, which represented an increase of 24% over the end of 2008. The index of European pharmaceutical companies represented by the Bloomberg Europe Pharmaceuticals Index (BEUPHRM) also increased significantly – but remained weaker than the DAX ® for most of the year.
The performance of Merck shares vs. the DAX ®/Bloomberg Europe Pharmaceuticals Index in 2009
in %120
100
80
Jan. March June Sept. Dec.
Merck DAX ® Bloomberg Europe Pharmaceuticals Index
Merck shares remain a stable investmentDuring 2009, our shares moved in a range from € 57 to € 74. Following a good start to the year, negative news weighed on the share price several times. From a full-year perspective, Merck shares represented a stable investment in a highly dynamic market environment in 2009. The risk-balanced business model consisting of Pharmaceuticals and Chemicals modu-lated the fluctuations.Our share price proved to be considerably more robust than the benchmark indices in the crisis-ridden first quarter. On January 23, 2009, the Merck share price jumped by 8.6% to € 69.89 when we announced the good results of the CLARITY study. The news that cladribine tablets could represent the first marketed oral treatment for multiple sclerosis supported the share price. Like the German indices, the Merck share price declined in the course of the first quarter and marked its low on March 6, 2009, closing at € 57.24.
www.merck.de/share
company 29corporate governanceto our shareholders Further informationManagement Report consolidated Financial statements
ResponsibilityMerck shares
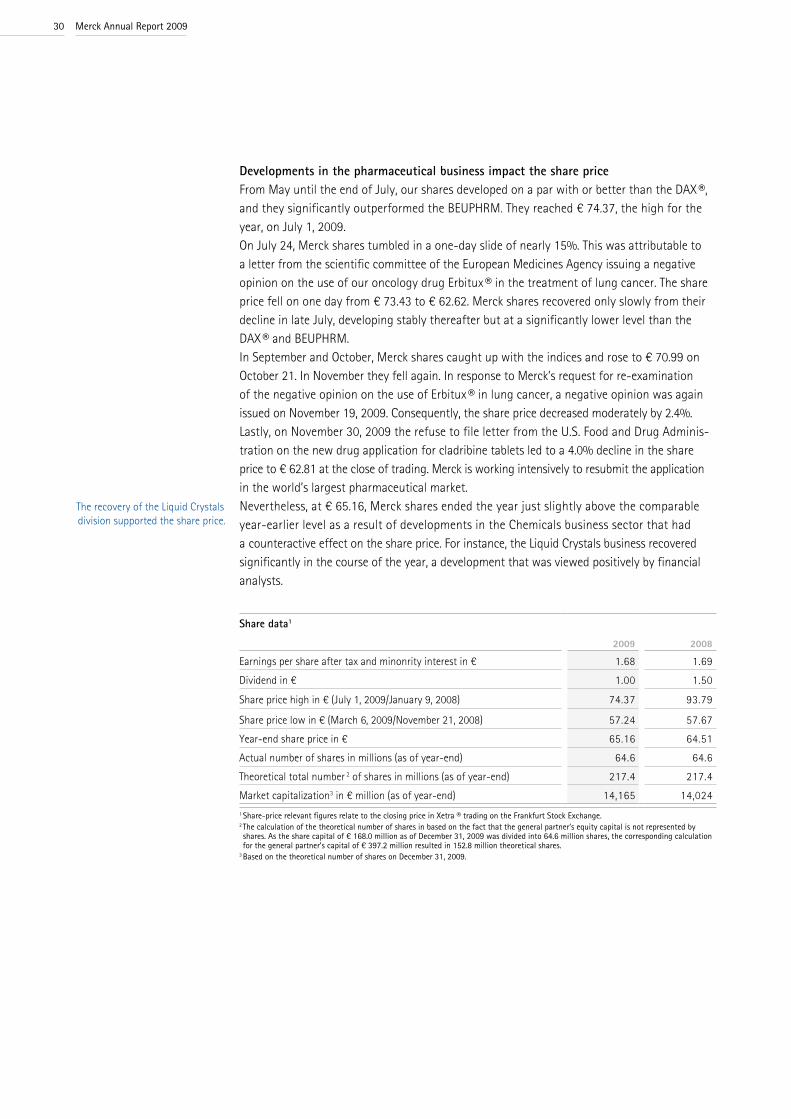
Developments in the pharmaceutical business impact the share priceFrom May until the end of July, our shares developed on a par with or better than the DAX ®, and they significantly outperformed the BEUPHRM. They reached € 74.37, the high for the year, on July 1, 2009. On July 24, Merck shares tumbled in a one-day slide of nearly 15%. This was attributable to a letter from the scientific committee of the European Medicines Agency issuing a negative opinion on the use of our oncology drug Erbitux ® in the treatment of lung cancer. The share price fell on one day from € 73.43 to € 62.62. Merck shares recovered only slowly from their decline in late July, developing stably thereafter but at a significantly lower level than the DAX ® and BEUPHRM. In September and October, Merck shares caught up with the indices and rose to € 70.99 on October 21. In November they fell again. In response to Merck’s request for re-examination of the negative opinion on the use of Erbitux ® in lung cancer, a negative opinion was again issued on November 19, 2009. Consequently, the share price decreased moderately by 2.4%. Lastly, on November 30, 2009 the refuse to file letter from the U.S. Food and Drug Adminis-tration on the new drug application for cladribine tablets led to a 4.0% decline in the share price to € 62.81 at the close of trading. Merck is working intensively to resubmit the application in the world’s largest pharmaceutical market.Nevertheless, at € 65.16, Merck shares ended the year just slightly above the comparable year-earlier level as a result of developments in the Chemicals business sector that had a counteractive effect on the share price. For instance, the Liquid Crystals business recovered significantly in the course of the year, a development that was viewed positively by financial analysts.
Share data1
2009 2008
Earnings per share after tax and minonrity interest in € 1.68 1.69Dividend in € 1.00 1.50Share price high in € (July 1, 2009/January 9, 2008) 74.37 93.79
Share price low in € (March 6, 2009/November 21, 2008) 57.24 57.67Year-end share price in € 65.16 64.51Actual number of shares in millions (as of year-end) 64.6 64.6Theoretical total number 2 of shares in millions (as of year-end) 217.4 217.4Market capitalization3 in € million (as of year-end) 14,165 14,0241 share-price relevant figures relate to the closing price in Xetra ® trading on the Frankfurt stock exchange.2 the calculation of the theoretical number of shares in based on the fact that the general partner’s equity capital is not represented by shares. As the share capital of € 168.0 million as of december 31, 2009 was divided into 64.6 million shares, the corresponding calculation for the general partner’s capital of € 397.2 million resulted in 152.8 million theoretical shares.
3 Based on the theoretical number of shares on december 31, 2009.
The recovery of the Liquid Crystals division supported the share price.
Merck Annual Report 200930

Focus on liquidityOn average, around 500,000 shares were traded daily in 2009, which compares with a daily trading volume of around 750,000 shares in 2008. On July 24, the first trading day after the negative opinion on Erbitux ® in the lung cancer indication in Europe, nearly 4.5 million Merck shares changed hands. High liquidity is very important to us. We want to ensure at all times that our shares are freely tradable on the stock exchanges. With a market capitalization of € 14,165 million, Merck held 29th place in the DAX ® ranking as compared with 24th place in 2008. In terms of average daily trading volumes, we moved up from 30th to 27th place.
Analysts’ estimates A total of 31 banks and equity analysts reported regularly on and assessed Merck shares in 2009. As of the end of 2009, Merck shares were given buy recommendations by more than half of the 31 analysts who cover us. Details of the individual analysts and their estimates can be found on our website at www.merck.de/investors.
Transparency and proximity to shareholdersMaintaining a timely and continuous dialog with shareholders is very important to Merck. We therefore reported not only on our quarterly and annual financial results, but also on the latest developments in the company. In 2009, the Executive Board and the Investor Relations team held road shows for existing and potential institutional investors at the major financial centers in Europe, North America and Asia, and reported on the latest company developments. In addition, Merck held presentations at ten investor conferences in Frankfurt, London, Luxembourg, Munich, New York, and Paris.At our Investor Relations stand at the 2009 Annual General Meeting, we addressed questions, most of which were posed by private investors. At 59%, the share capital represented at this Annual General Meeting was the highest recorded to date.
Identified investors by region
in %
68
539
13
11
source: thomson Reuters (status as of september 2009)
United States United Kingdom Rest of Europe Germany France Rest of the world
www.merck.de/investors
company 31corporate governanceto our shareholders Further informationManagement Report consolidated Financial statements
Merck shares

Increase in the number of investors based in the United StatesWithin the scope of the shareholder identification survey conducted in September 2009, we identified around 87% of the bearer shares in free float held by institutional investors. The survey provides information about the regional distribution of the institutional inves-tors as well as the classification of the respective institutional investor types. As in 2008, U.S. institutional investors hold the majority of Merck shares in free float. The share of U.S. investors increased from 45% in 2008 to 53% in 2009. Thus, the United States still ranks well ahead of the United Kingdom and Germany, where 11% and 9% of our shares are held, respectively. In the breakdown by investor type, the share of value investors grew from 23% in 2008 to 30%.
Identified investors by type
in %
712
35
16
30
source: thomson Reuters (status as of september 2009)
Growth Value GARP (Growth at reasonable price) Index Other
As of December 31, 2009, the following shareholders reported their holdings in Merck shares to the company in accordance with the German Securities Trading Act:
10 –15% Sun Life Financial Inc., Toronto (Canada) 5 –10% Capital Group Companies Inc., Los Angeles (United States) 5 –10% Barclays PLC, London (United Kingdom) 5 –10% BlackRock Inc., New York (United States) 3 – 5% Capital World Growth and Income Fund Inc., Los Angeles (United States) 3 – 5% Fidelity International Ltd., Hamilton (Bermuda) 3 – 5% Templeton Global Advisors Ltd., Nassau (Bahamas)
A sustainable investmentWe understand sustainability as ethical actions taken in line with the economic, ecological and social interests of all Merck stakeholders, such as our customers, suppliers, employees, and owners. Our efforts in these areas are continually analyzed and assessed by independent capital market institutes. Since 2008, Merck shares have been in the FTSE4Good Index, which comprises companies with highly sustainable business practices. Additionally, Merck shares are included in the DAX Global Sarasin Sustainability Germany Index.
Merck Annual Report 200932
Information on capital and shares As of the balance sheet date, the company’s subscribed capital is divided into 64,621,125 no par value bearer shares plus one registered share. The holder of the registered share is E. Merck Beteiligungen KG and is entitled and obliged to appoint one-third of the members of the Supervisory Board representing the limited liability shareholders. If the holder of the registered share is a general partner, he or she has no such right of appointment. The transfer of the registered share requires the company’s approval. The approval is granted at the sole discretion of the personally liable general partner with an equity interest, namely E. Merck KG. As of December 31, 2009, one holding in the company’s share capital (Sun Life Financial Inc., Toronto, Canada) exceeded 10% of the voting rights.According to the Articles of Association of the company, the general partners not holding an equity interest, who form the Executive Board, are admitted by E. Merck KG with the consent of a simply majority of the other general partners. A person may only be a general partner not holding an equity interest if he or she is also a general partner of E. Merck KG. In addition, at the proposal of E. Merck KG and with the approval of all general partners not holding an equity interest, further persons may be appointed to the Executive Board who are not general partners not holding an equity interest.The Articles of Association of the company can be amended by a resolution by the General Meeting that requires the approval of the general partners. The resolutions of the General Meeting are, notwithstanding any statutory provisions to the contrary, adopted by a simple majority of the votes cast. Where the law requires a capital majority in addition to the voting majority, resolutions are adopted by a simple majority of the share capital represented in the vote.The Articles of Association of the company specify the share capital. The Executive Board is authorized, with the approval of the Supervisory Board and of E. Merck KG, to increase the share capital on one or several occasions until April 3, 2014 by up to a total of € 56,521,124.19 by issuing new shares against cash or contributions in kind. The company is not authorized to acquire its own shares.The company has not entered into any material agreements subject to a change of control pursuant to a takeover offer nor has it concluded any compensation agreements with the members of the Executive Board or employees in the event of a takeover offer.
company 33corporate governanceto our shareholders Further informationManagement Report consolidated Financial statements
Merck shares

phARMAceuticAls | MeRck seRono
Merck Serono is the largest division of Merck. It markets innovative prescription drugs of chemical and biotechnological origin, including monoclonal antibodies and other therapeutic proteins, and offers its leading brands in around 150 countries. With annual R & D spending of more than € 1 billion, Merck Serono focuses on highly specialized therapeutic areas such as Neurodegenerative Diseases, Oncology, Fertility, Endocrinology as well as Autoimmune and Inflammatory Diseases.
34 Merck Annual Report 2009

KEY PRODUCTS BY THERAPEUTIC AREA
– Oncology: Erbitux ® (solid tumors)
– Neurodegenerative Diseases: Rebif ® (multiple sclerosis)
– Fertility: Gonal-f ®, Pergoveris™, Luveris ®, Ovitrelle ®, Crinone ®, Cetrotide ® (infertility treatment)
– Endocrinology: Saizen ® (growth hormone disorders), Serostim ® (HIV-associated wasting), Kuvan ® (metabolic disorder hyperphenylalaninemia)
– CardioMetabolic Care: Glucophage ® family (type 2 diabetes), Concor ® family (cardiovascular diseases), Euthyrox ® (thyroid diseases)
KEY DEvELOPMENTS IN 2009
– Sales of Erbitux increase by 23% to € 697 million; Rebif ® sales rise 15% to € 1,537 million
– NICE of the United Kingdom recommends Erbitux ® as a first-line treatment for patients with metastatic colorectal cancer (KRAS wild-type tumors) and metastases only in the liver
– The Committee for Medicinal Products for Human Use (CHMP) of the European Medicines Agency issues a negative opinion on Erbitux ® for the treatment of patients with non-small-cell lung cancer (NSCLC)
– Market launch of Rebismart™, the first electronic injection device for the administration of Rebif ®, a medicine for the treatment of multiple sclerosis (MS)
– Marketing authorization application for cladribine tablets, an oral treatment option for multiple sclerosis, successfully filed in the EU. In the United States, the FDA issued a refuse to file letter. We are working on a resubmission.
– Market launch of Kuvan ® in the EU for the treatment of hyperphenylalaninemia
Erbitux ® the targeted cancer therapy
is also marketed in china.
Rebismart ®the first electronic injection device
for Ms facilitates treatment.
Kuvan ®A rare metabolic disorder
can now be better treated.
company 35corporate governanceto our shareholders Further informationManagement Report consolidated Financial statements
pharmaceuticals | Merck serono

GRowth thRouGh Biotech Medicinestotal revenues of the Merck serono division grew in line with the forecasted average for the pharmaceutical industry. this growth was mainly driven by our two top-selling medicines, the biopharmaceuticals Rebif ® and erbitux ®.
In 2009, the Merck Serono division increased total revenues by 6.6% to € 5,345 million. This growth was mainly attributable to the good performance of biopharmaceuticals such as Rebif ® and Erbitux ® as well as classic products such as the medicines of the Glucophage ® family. We generated 60% of our sales, or € 2,980 million, with our five top-selling biopharma ceuticals. Rebif ®, a treatment for relapsing-remitting multiple sclerosis, was once again the top-selling product. Global sales of this product increased in 2009 to € 1,537 million, representing growth of 15%. The targeted cancer therapy Erbitux ® again saw double-digit growth in 2009, with sales increasing by 23% to € 697 million. Our recombinant hormone Gonal-f ® was approved for the treatment of infertile women in the key Japanese market in July.
Top five medicines by sales in 2009
€ million
395 2918 % 6 %
486 1,58810 % 31 %
697 1,53714 % 31 %
Other products Rebif ® Erbitux ® Gonal-f ® Concor ® family Glucophage ® family
Royalty and commission income declined by 3.5% to € 351 million. Gross margin rose to € 4,485 million, 6.3% more than in 2008. Marketing and selling expenses increased by 7.5% owing to product launches and significantly higher commission expenses. Research and development spending rose by 10% to € 1,184 million owing to the high costs of many trials in the final stage of clinical development. The operating result was also affected by high one-time expenses. We increased provisions for litigation by € 163 million. Moreover, impairment losses of € 28 million relating mainly to intangible assets were recorded for the termination of research projects. As a result of altered estimates of the future amount of royalty income for certain partner products, we partly wrote down the corresponding rights by € 72 million. Owing to the growing and clearly emerging currency risk in Venezuela, we recorded currency losses of € 59 million in the operating result of the Merck Serono division. These were partly offset by exchange rate gains from currency hedging transactions. Overall, the operating result declined by 40% to € 355 million. Return on sales (ROS) decreased in 2009 to 6.6%. At € 867 million, underlying free cash flow was 55% higher than in 2008.
www.merckserono.com
Merck Annual Report 200936

Merck Serono | Key figures
€ million 2009 2008 ∆ in %
Total revenues 5,345 5,014 6.6Gross margin 4,485 4,218 6.3R & D 1,184 1,074 10Operating result 355 594 –40Exceptional items –40 –354 –Free cash flow 864 554 56Underlying free cash flow 867 559 55ROS in % 6.6 11.8
Strong growth outside of EuropeIn 2009, Europe was again the division’s strongest region in terms of sales, which declined by 3.6% to € 2,557 million, mainly as a result of the market withdrawal of the psoriasis drug Raptiva ®. With sales of € 533 million, France was our biggest market in Europe. Sales there fell by 15%, due in part to generic competition faced by our CardioMetabolic Care products. Despite a restrictive health care policy, sales in Germany grew by 2.7% to € 497 million. In Italy and Spain, sales declined by 3.1% and 2.4%, respectively, to € 287 million and € 288 million, putting them nearly on par with each other. With growth rates of 15% and 9.9%, respectively, Poland and Russia were two examples of smaller markets that experienced strong growth.
Merck Serono | Sales by region
€ million
779 2,55716 % 51 %
71114 %
94719 %
Europe North America Latin America Asia, Africa, Australasia
In North America, we expanded our market position, with a 21% increase in sales to € 947 million, primarily attributable to the strong growth of Rebif ®. Sales in Latin America rose by 21% to € 711 million. Our largest market in this region, Brazil, posted sales growth of 7.1% to € 210 million. Argentina and Colombia performed well, with sales growth of 21% and 36%, respectively, while sales in Mexico declined by 2.9% because of strong currency effects. In Asia, Africa and Australasia, sales increased sharply by 24%, rising to € 779 million. Thanks to the success of Erbitux ®, we more than quadrupled our sales in Japan to € 127 million. At € 56 million, India achieved growth of 7.1%, while China increased sales by 7.8% to € 123 million. We intend to strengthen our presence in this important market. Over the next four years, we plan to invest € 150 million in the establishment of a global center for research and develop-ment in Beijing.
Focusing on the markets of Asia: We achieved good growth rates in
Japan, China and India.
company 37corporate governanceto our shareholders Further informationManagement Report consolidated Financial statements
pharmaceuticals | Merck serono

Therapeutic areas
Research Development Marketing
OncologyNeurodegenerative DiseasesAutoimmune and Inflammatory DiseasesFertilityEndocrinology
CardioMetabolic Care and other products
ONCOLOGY
Our targeted oncology drug Erbitux ® (cetuximab) is approved in combination with chemotherapy for all lines of therapy or as a monotherapy for pretreated patients in epidermal growth factor receptor (EGFR)-expressing, KRAS wild-type metastatic colorectal cancer (mCRC). In addition, the monoclonal antibody is used to treat recurrent and/or metastatic squamous cell carcinoma of the head and neck (SCCHN) in combination with platinum-based chemotherapy, as well as in combination with radiotherapy for locally advanced head and neck cancer. Erbitux ® is currently approved for use in colorectal cancer in 78 countries and in head and neck cancer in 73 countries. We are exploring further indications in additional studies.In 2009, sales of Erbitux ® continued on a growth course, increasing by 23% to € 697 million. This reflects a considerable improvement over the last two quarters of 2008. Over the past two years, the testing of the KRAS status of mCRC tumors has been successfully established as a standard diagnostic tool and is now widely available. This development underscores our strong position in the field of personalized medicine.In the United Kingdom, the National Institute for Health and Clinical Excellence (NICE) recommended in June the use of Erbitux ® in combination with chemotherapy as a first-line treatment for patients with metastatic colorectal cancer who have met specific additional criteria – improving the possibility of potentially curative surgery. Erbitux ® is the only targeted therapy endorsed by NICE for the first-line treatment of the disease. A recommendation of this kind is a prerequisite in the United Kingdom for funding of a medical treatment by the National Health Service.
Breakthrough in head and neck cancerSubsequent to receiving approval in November 2008, we launched Erbitux ® in January 2009 in the EU for the first-line treatment of recurrent or metastatic squamous cell carcinoma of the head and neck in combination with platinum-based standard chemotherapy. Approval of this new indication was based on the results of the EXTREME study, which was the first trial in 30 years to demonstrate a significant overall survival benefit in the first-line setting. The 2009 guidelines of the European Society for Medical Oncology (ESMO), which recommend Erbitux ® as the most suitable treatment in recurrent and/or metastatic and locally advanced head and neck cancer, represent a further milestone.
Market launch in the EU: Erbitux ® available in a new
indication.
Merck Annual Report 200938

Negative opinion on Erbitux ® in non-small-cell lung cancerIn November, the Committee for Medicinal Products for Human Use (CHMP) adopted a negative opinion for the use of Erbitux ® in combination with platinum-based chemotherapy for the treatment of patients with epidermal growth factor receptor (EGFR)-expressing, advanced or metastatic non-small-cell lung cancer (NSCLC). This followed an initial negative opinion issued by this scientific committee of the European Medicines Agency EMA (previously: EMEA) in July. Merck requested reexamination of this opinion because the Phase III FLEX study had shown that in first-line treatment, Erbitux ® significantly increased overall survival in patients with non-small-cell lung cancer across all histologies. We respect the decision of the CHMP; nevertheless, we remain committed to our clinical development program designed to tap the potential of Erbitux ® in the treatment of various cancer types, including gastric cancers.
NEURODEGENERATIvE DISEASES
Sales in the Neurodegenerative Diseases therapeutic area are attributable almost exclusively to Rebif ® (interferon beta-1a), a drug to treat relapsing-remitting forms of multiple sclerosis (MS). According to estimates, around 1.6 million people suffer from MS worldwide. Owing to its proven efficacy and favorable risk-benefit profile, Rebif ® is a basic treatment for MS and is approved in more than 80 countries. In 2009, Rebif ® recorded double-digit growth of 15%, with sales increasing to € 1,537 million. The recombinant protein was thus once again the top-selling product of the Merck Serono division and remained the leading MS treatment outside of the United States. With solid growth of 6.8%, Europe accounted for € 708 million, or nearly half of Rebif ® sales. The new formulation, which offers improved injection tolerability, has meanwhile been introduced in all countries of the European Union and in Switzerland. Germany and the United Kingdom, two important markets, registered strong above-average growth of 7.9% and 13%, respectively. With sales of € 676 million, North America is our second-largest market for Rebif ®. Sales grew sharply by 28% thanks to a strong increase in the United States. Discussions with the U.S. Food and Drug Administration concerning the approval of the new formulation of Rebif ® continue. While sales in Latin America increased by 13%, mainly because of strong growth in Argentina, we recorded an increase of 5.8% in the region Asia, Africa, Australasia.
Electronic injection device Rebismart™ to improve patient compliance In June, we launched Rebismart™, an electronic injection device for the self-administration of Rebif ®. It is the first injection device of its kind for MS and has been specifically designed to improve ease of handling and usage. It is intended to increase compliance so that patients can fully benefit from their treatment. A Rebismart™ user trial showed broad patient accep-tance. The majority of patients found the injection device “suitable” or “very suitable” for self-injection and rated the device function as “easy” or “very easy” to use. So far, Rebismart™ is available in Canada and seven EU countries.
Rebismart™ for the self-administration of Rebif ® is
easy and convenient to use.
company 39corporate governanceto our shareholders Further informationManagement Report consolidated Financial statements
pharmaceuticals | Merck serono
AUTOIMMUNE AND INFLAMMATORY DISEASES
From October 2008 to February 2009, Merck Serono reported to the European Medicines Agency (EMA) three virologically confirmed fatal cases of progressive multifocal leukoenceph-alopathy (PML). They were observed as adverse events in patients treated with Raptiva ®, our drug for the treatment of moderate-to-severe psoriasis. In February, the EMA recommended the suspension of the marketing authorization for Raptiva ®. Subsequent to the EMA recom-mendation, we worked closely with the drug regulatory agencies not only in Europe, but also in all our other markets to terminate the supply of Raptiva ® and withdraw the product from the market around the world.As a result of the sales termination and product recalls, sales of Raptiva ® dropped from € 93 million in 2008 to € 4.7 million. We recorded an exceptional item of € 40 million for all costs associated with the suspension of the marketing authorization. Merck Serono intends to continue to focus on Autoimmune and Inflammatory Diseases, a commitment that is underscored by the development projects in our pipeline in conditions as diverse as systemic lupus erythematosus and osteoarthritis.
FERTILITY
The Merck Serono division is a global leader with its portfolio of drugs to treat infertility. We are the only company that offers physicians and patients recombinant versions of the three main reproductive hormones that are important for the treatment of infertility. In 2009, sales by the Fertility therapeutic area increased by 9.0% to € 616 million, whereas the volume of all gonadotropins sold worldwide grew by only around 3%. Europe remained our most important market. In 2009, we generated half of our sales, which were slightly higher than in 2008, in this region. In our three other regions, sales developed well, particularly in Asia, Africa, Australasia, which posted an increase of 27%.
Stable growth of Gonal-f ®Gonal-f ® (follitropin alfa for injection) is a recombinant form of natural follicle-stimulating hormone. It is approved in 100 countries and is the world’s leading female fertility drug. The improved version of the Gonal-f ® pen, our injection device which we introduced in 2007, has meanwhile been approved in more than 70 countries. Sales of Gonal-f ® grew by 5.8% to € 486 million, primarily as a result of strong growth in Asia, Africa, Australasia, North America, and Latin America. In Japan, sales increased by more than 50%. Previously, Gonal-f ® had been approved in this market only to treat male infertility. In July, we additionally received approval for the treatment of infertile women with irregular or absent ovulation. In the United States, sales of Gonal-f ® grew 8.9% in an otherwise stagnating market. In Europe, where we generated nearly one-half of Gonal-f ® sales, we sustained a 5.1% decline in sales. Business in Spain was adversely affected by the economic crisis since private payers dominate the market, which is strongly influenced by economic fluctuations. Gonal-f ® sales in Turkey also suffered considerably owing to a change in the reimbursement policy of health care payers. By contrast, sales in the United Kingdom rose significantly thanks to increased cost coverage by medical insurance companies and an adaptation of the market strategy. Our recombinant combination treatment Pergoveris™ is used to stimulate follicular develop-ment in infertile women with severe follicle-stimulating hormone and luteinizing hormone
Gonal-f ® is approved in 100 countries and is the world’s
leading female fertility drug.
Merck Annual Report 200940
deficiency. Available in Europe since 2007, it is the first drug to allow the simultaneous administration of the two key hormones for ovarian stimulation in a single subcutaneous injection. Compared with 2008, sales more than doubled, increasing to € 29 million.Ovidrel ®/Ovitrelle ® is a recombinant version of the naturally occurring hormone hCG and is used for triggering follicle maturation and ovulation. Sales of this product increased by 9.5% to € 37 million, mainly as a result of good growth in Europe and North America.
Advanced training and education for fertility treatment specialistsIn July, Merck Serono launched the “Global Fertility Academy” to enhance clinical standards and maximize treatment success. This educational program was developed specifically for physicians specializing in infertility treatment and consists of a web-based learning platform and a practical training module. With the “Grant for Fertility Innovation”, which we launched in June, we want to promote initiatives in translational research aimed at increased pregnancy rates in assisted reproductive techniques.
ENDOCRINOLOGY
By offering specialized therapies and user-friendly injection devices, the Merck Serono division aims to improve the lives of patients with endocrine and metabolic disorders. Sales by the Endocrinology therapeutic area increased by 14% over the previous year to € 262 million thanks to double-digit growth in all regions. Our largest product is Saizen ®, a recombinant human growth hormone. It is approved in 78 countries for indications including the treatment of pediatric and adult growth hormone deficiency, Turner Syndrome, growth failure associated with chronic renal failure, as well as to treat children born small for gestational age (SGA). According to estimates, growth hormone deficiency affects 100,000 children globally and 50,000 adults in Europe. Sales of Saizen ® totaled € 191 million, an increase of 11%. Europe was our top-selling market for the growth hormone. Latin America showed the strongest growth with sales rising by 30%. As in the previous year, the continued success of Saizen ® was favorably impacted by the high acceptance of our electronic injection device Easypod ®, which has meanwhile been approved in 39 countries. As the first automatic delivery device for growth hormone, it makes once-daily administration easier for patients and medical professionals and its simple operation supports compliance. Easypod ® was launched in the United States in early 2009. In September, we received marketing authorization in Japan and launched the product there as well.Our drug Serostim ® is used in the United States to treat patients suffering from HIV-associated wasting, which is estimated to affect up to 8% of HIV-infected individuals. Sales of Serostim ® rose 17% to € 65 million.
www.GlobalFertilityAcademy.org
The continued success of Saizen ® was favorably impacted by the
high acceptance of our electronic injection device Easypod ®.
company 41corporate governanceto our shareholders Further informationManagement Report consolidated Financial statements
pharmaceuticals | Merck serono

Successful market launch of Kuvan ® in Europe With Kuvan ® for the treatment of hyperphenylalaninemia, caused by either phenylketonuria (PKU), a congenital metabolic disorder, or a lack of the important co-enzyme tetrahydrobiop-terin, we offer the first drug for this orphan disease in Europe. According to estimates, around 50,000 people are affected in Europe; 20% to 50% of PKU patients could benefit from treatment with Kuvan ®. Subsequent to receiving marketing approval at the end of 2008, we began launching Kuvan ® in April 2009. It is already available in ten EU countries and generated sales of € 5.6 million, exceeding our expectations.In order to collect additional information on the benefits and safety of long-term therapy with Kuvan ®, Merck Serono set up the KAMPER patient registry in December. This observational study aims to follow more than 600 patients in 11 European countries over a period of 15 years. To support PKU patients and their families, we collaborated with physicians and dieticians to develop a new website which offers detailed information on PKU and possibilities for treatment.
CARDIOMETABOLIC CARE AND OTHER PRODUCTS
The CardioMetabolic Care therapeutic area comprises our drugs for treating diabetes, cardio-vascular diseases and thyroid disorders. The interrelationships that exist between these chronic cardiovascular and metabolic diseases are the causes of many complex clinical pictures that call for integrated therapeutic approaches. We are continually working to improve well-established products, for example by developing new dosage forms and strengths. In this way, we want to help improve patient compliance, which is often crucial to treatment success. At € 916 million, sales by the CardioMetabolic Care therapeutic area remained at the previous year’s level owing to adverse currency effects. Organically, however, we posted a slight increase. A decline in sales of beta-blockers was offset by higher sales of diabetes and thyroid medicines. Our other products, some of which are only sold in certain regions, generated sales of € 927 million.
Difficult environment for Concor ® in Europe – strong sales internationally Sales of branded Concor ® products containing the active ingredient bisoprolol amounted to € 395 million, making this the top-selling franchise within CardioMetabolic Care. In com-parison with 2008, sales decreased by 5.4%, primarily as a result of a 12% decline in Europe, our largest market, where bisoprolol remains the leading beta-blocker in products such as Lodoz ® and Concor ®COR. The introduction of generic versions of Lodoz ® in late 2008 and Concor ®COR in mid-2009 in France, our largest market within Europe, the transfer of several products to Daiichi Sankyo in Italy, as well as negative currency effects, especially in Poland and the United Kingdom, were responsible for lower sales in Europe. In Asia, Africa, Australasia and especially in Latin America, however, the Concor ® family recorded an increase in sales.
www.pku.com/en
We are continually working to improve well-established products,
for example by developing new dosage forms and strengths.
Merck Annual Report 200942

Successful development of the Glucophage ® franchiseAccording to estimates, around 220 million people have type 2 diabetes and the number is rising. The active ingredient metformin, which is contained in our product Glucophage ®, is the drug of choice for first-line treatment of this condition and is recommended by inter-national diabetes associations. More than six million patients around the world benefit from our oral metformin antidiabetic agents.The branded products from the Glucophage ® family generated sales of € 291 million, despite generic competition and currency effects. The 8.5% increase in sales was due mainly to successes in Latin America and many Asian countries as well as the good development of more recent product line extensions. In particular, sales of Glucophage XR ® – a once-daily formulation that we launched in a 1000 mg dosage strength in 2009 – increased sharply. With Glucophage ® Powder, which we introduced in May 2009 in Europe, we now offer a dosage form that is immediately soluble and represents an alternative to tablets. It is especially convenient for patients who need to take numerous medications.
Stable business with thyroid products Merck Serono is the world’s second largest supplier of drugs to treat thyroid disorders as well as to prevent iodine deficiency diseases. In Europe, Latin America and China, we are the market leader. Thyroid disorders are one of the most prevalent diseases. More than 300 million people around the world suffer from hypothyroidism; not even 20% of them are treated. We want to educate patients about these disorders and promote optimum treatment. In May, we launched an awareness campaign together with the International Thyroid Federation. In China, we are working with the Chinese Ministry of Health in order to inform the public about thyroid disorders.Sales of our products to treat thyroid disorders grew by 5.3% over the previous year to € 158 million. We achieved far more than half of sales in Europe. Sales of the thyroid hormone Euthyrox ® increased by 6.5% to € 137 million. Approximately 14 million patients in about 90 countries around the world are treated with Euthyrox ®.
RESEARCH & DEvELOPMENT
Research and development spending increased by 10% to € 1,184 million in 2009. This is equivalent to 22% of the total revenues of the Merck Serono division. Our research and development activities have three main areas of focus: Oncology, where we are seeking new therapeutic options for tumors such as colorectal cancer, lung cancer, head and neck cancer, breast cancer and gastric cancer; Neurodegenerative Diseases, where we are working on new therapies for multiple sclerosis and Parkinson’s disease; Autoimmune and Inflammatory Diseases, where we are focusing on rheumatological indications. We also continue to conduct research and development work in the field of Fertility. As of December 31, 2009, the division had around 2,800 employees working in research and development.Our research pipeline comprises ten projects in Phase III, eight in Phase II and five in Phase I. The large share of projects in the later and more costly stages of clinical development is the reason for the marked increase in our R & D spending.
With Glucophage ® Powder, which dissolves immediately, in Europe we introduced an alternative to
tablets in May 2009.
company 43corporate governanceto our shareholders Further informationManagement Report consolidated Financial statements
pharmaceuticals | Merck serono
We continue to position ourselves as a company with research and development expertise relevant to both small molecules as well as biopharmaceuticals. This strategy gives us the flexibility to select the most suitable approach for each medically relevant molecular target. Since our pipeline includes many promising candidates, we will continue to prioritize our projects in order to maximize opportunities and to manage risks. We also assign priority to partnerships with other companies. Our key hubs are our three R & D centers in Darmstadt, Geneva as well as Boston. In addition, we plan to establish an R & D center in Beijing in order to better address the Asian region and to facilitate local clinical trials. From 2010 to 2013, we will invest € 150 million and create 200 highly qualified positions there. The expansion work is proceeding as scheduled at our site in Boston, where we are investing a total of US$ 65 million. The new research center is expected to be completed by the end of 2010 and will accommodate around 200 scientists. A strong network and alliance partnerCooperating with partners and forming strategic alliances are essential elements of our strategy. We again set up promising new partnerships in 2009. In the United States, our subsidiary EMD Serono entered into an alliance with the University of Texas M. D. Anderson Cancer Center. The aim is to provide early insight into potential cancer treatments and to accelerate early clinical research.In the field of Neurodegenerative Diseases, we formed an exclusive partnership with Fast Forward – a subsidiary of the American National Multiple Sclerosis Society. Within the scope of this partnership, we will evaluate and fund multiple sclerosis research projects. Merck will provide up to US$ 19 million in order to support early-stage clinical development projects with biotech companies and projects with individual researchers or academic institutions. In addition, Merck Serono set up a strategic collaboration with Brigham and Women’s Hospital in Boston. The aim is to advance basic and clinical research in multiple sclerosis.Merck Serono Ventures is the name of the strategic corporate venture capital fund that we launched in March. It will invest in biotech start-up companies that have the potential to provide innovative products in Merck Serono’s core therapeutic areas. The focus is on Neuro-degenerative Diseases, Oncology as well as Autoimmune and Inflammatory Diseases. The fund will invest up to € 40 million over the first five years.
Erbitux ®: Expanding the prospects for personalized cancer treatmentMerck is a leader in personalizing cancer care and remains committed to offering patients therapies tailored to their cancer. We are not only developing new, targeted therapies, but are also making an important contribution to the increasingly important field of biomarker research. Findings in this area will help to further personalize therapies and predict the clinical response of patients to treatments – as is possible, for example, with our targeted oncology drug Erbitux ® and the KRAS wild-type status of tumors in patients with metastatic colorectal cancer (mCRC). In this way, we want to enhance efficacy, patient benefit and health economic performance.
Merck is active in biomarker research in order to personalize
therapies and predict clinical outcomes.
Merck Annual Report 200944

Status of our innovative compounds
Therapeutic area Compound Indications StatusOncology Erbitux ® (cetuximab, monoclonal anti-
EGFR antibody)1Adjuvant colorectal cancer Phase IIIGastric cancer Phase III
Cilengitide (integrin inhibitor) Glioblastoma (brain tumor) Phase IIIStimuvax ® (therapeutic cancer vaccine)2 Non-small-cell lung cancer (NSCLC) Phase III
Breast cancer Phase IIIErbitux ®1 Breast cancer Phase IITucotuzumab celmoleukin (immunocytokine)
Small-cell lung cancer (SCLC) Phase II
Cilengitide Head and neck cancer (SCCHN) Phase IINon-small-cell lung cancer (NSCLC) Phase II
Adecatumumab (monoclonal anti-EpCAM antibody)3
Colorectal cancer Phase II
Monoclonal anti-integrin antibody (DI17E6)
Colorectal cancer Phase II
TLR9 immunomodulator (IMO-2055)4 Head and neck cancer (SCCHN) Phase II
Aurorakinase inhibitor (AS703569)5 Solid tumors and hematological diseases Phase IMEK inhibitor (AS703026)6 Solid tumors and hematological diseases Phase ISonepcizumab (monoclonal anti-S1P antibody)7
Solid tumors Phase I
c-Met kinase inhibitor (EMD1214063)8
Solid tumors Phase I
Neurodegenerative Diseases
New formulation of Rebif ® Relapsing-remitting forms of multiple sclerosis (MS); EMA: approved, FDA: filed
Approved/ Filed
Clinically isolated syndrome Phase IIICladribine tablets Relapsing-remitting forms of MS;
EMA: filed, FDA: resubmission in preparationFiled
Clinically isolated syndrome Phase IIISafinamide9 Early-stage Parkinson’s disease Phase III
Mid- to late-stage Parkinson’s disease Phase IIIAutoimmune & Inflammatory Diseases
Atacicept (anti-BLyS/anti-APRIL fusion protein)10
Systemic lupus erythematosus Phase III
Fibroblast growth factor 1810 Osteoarthritis Phase IEndocrinology Tesamorelin11 Lipodystrophy in HIV patients
(only U.S.)Filed
ARX 201 (long-acting growth hormone)12
Growth hormone deficiency Phase II
1 Developed in cooperation with ImClone: Erbitux ® is a trademark of ImClone Systems, a wholly owned subsidiary of Eli Lilly & Co.
2 Exclusive worldwide licensing rights acquired from Oncothyreon Inc.
3 Collaboration with Micromet AG4 Inlicensed from Idera Pharmaceuticals Inc.5 Collaboration with Rigel Pharmaceuticals Inc.
6 All rights acquired from Santhera Pharmaceuticals AG 7 Collaboration with LPath, Inc. 8 Collaboration with M. D. Anderson Cancer Center 9 Collaboration with Newron Pharmaceuticals S.p.A.10 Inlicensed from ZymoGenetics Inc.11 Collaboration with Theratechnologies12 Collaboration with Ambrx, Inc.
SCCHN: Squamous cell carcinoma of the head and neckNSCLC: Non-small-cell lung cancer SCLC: Small-cell lung cancer
company 45corporate governanceto our shareholders Further informationManagement Report consolidated Financial statements
pharmaceuticals | Merck serono

In September, the latest results of the CRYSTAL study showed how successful this approach is. They demonstrate that the addition of Erbitux ® to the standard first-line chemotherapy regimen FOLFIRI significantly improved overall survival in metastatic colorectal cancer patients with KRAS wild-type tumors. In patients with KRAS wild-type tumors who received Erbitux ® in addition to FOLFIRI, median overall survival was extended by 3.5 months compared to patients receiving chemotherapy alone. This was the first time an overall survival benefit had been demonstrated with a targeted therapy in combination with FOLFIRI in this disease setting. The risk of disease progression was reduced by 30% while the likelihood of achieving a tumor response doubled overall to 57%.
Focusing on new indications for Erbitux ®Merck is supporting PETACC-8, an independent colorectal cancer trial that is being coordinated by the Fédération Francophone de Cancérologie Digestive (FFCD). This Phase III clinical trial is investigating the efficacy of Erbitux ® plus standard chemotherapy in the adjuvant setting, meaning after complete surgical removal of the primary tumor, in patients with stage III colorectal cancer whose tumors were KRAS wild-type. The aim of the study is to determine whether the addition of Erbitux ® to a standard chemotherapy regimen can lower the recurrence rate and prolong disease-free survival. The recruitment of 2,566 patients for the PETACC-8 study was completed in 2009.In addition, Merck is investigating the efficacy of Erbitux ® in gastric cancer in the pivotal Phase III EXPAND trial. This trial is investigating the benefit of Erbitux ® in combination with standard chemotherapy in first-line treatment of patients with advanced and metastatic gastric cancer.
Cancer vaccine Stimuvax ® being studied in breast and lung cancerThe therapeutic cancer vaccine Stimuvax ® (liposomal vaccine BLP25) is currently being studied in two indications in three Phase III clinical trials. It is designed to induce an immune response to cancer cells that express MUC1 protein, an antigen that is over-expressed on the surface of tumor cells for example in advanced breast cancer and non-small-cell lung cancer (NSCLC) – the indications we are investigating.We are currently conducting START, a Phase III trial to evaluate the efficacy and safety of treatment with Stimuvax ® in patients with inoperable stage III non-small-cell lung cancer. The primary endpoint of the START trial, which began in 2007, is overall survival. The decision to initiate this trial was based on the results of a randomized Phase IIb study, in which Stimuvax ® showed an increase in the survival time of a subset of patients with locoregional stage IIIb NSCLC from 13.3 months in the control group to 30.6 months in the treatment group. In December we initiated INSPIRE, a Phase III trial in NSCLC, in five Asian regions.In addition, we started STRIDE, our first global Phase III clinical study of Stimuvax ® in patients with advanced, inoperable breast cancer, in June 2009. The study will determine if Stimuvax ® can extend progression-free survival in patients treated with hormonal therapy who have hormone receptor-positive, locally advanced, recurrent or metastatic breast cancer. Overall survival, quality of life, tumor response and safety will also be assessed in this study. STRIDE will enroll more than 900 patients with advanced breast cancer at an estimated 180 centers in over 30 countries – within North America, Europe, Asia and Australia.
Our therapeutic cancer vaccine Stimuvax ® is being studied in
breast and lung cancer in Phase III clinical trials.
Merck Annual Report 200946
Further oncology projects in the development pipeline With the development of cilengitide, Merck is focusing on a new class of experimental cancer drugs. Cilengitide is the first integrin inihibitor to have entered Phase III clinical development (CENTRIC) in glioblastoma multiforme (GMB) – the most aggressive form of brain tumor. Integrin inhibitors are thought to work by targeting tumor cells and the vascular network required to nourish the tumor and promote cancer cell growth. Data from an independent and randomized Phase II study published in May show that in combination with chemoradio-therapy, cilengitide can extend survival in patients with newly diagnosed glioblastoma. Apart from the GMB indication, we are investigating the efficacy of cilengitide in lung cancer as well as in head and neck tumors in two separate Phase II clinical trials. In addition, we began studying the efficacy of the monoclonal anti-integrin antibody DI17E6 in colorectal cancer in a Phase II clinical trial in 2009. In December the immunomodulator IMO-2055 for the treatment of head and neck cancer entered Phase II clinical development.
Rebif ® being studied in a new indicationMultiple sclerosis (MS) and Parkinson’s disease involve serious unmet medical needs. Within our Neurodegenerative Diseases therapeutic area, we are conducting research to discover new therapeutic options.REFLEX is the name of the most important ongoing clinical trial focused on the further development of Rebif ®, our successful MS treatment. The two-year pivotal Phase III study is evaluating the efficacy of the new formulation of Rebif ® in more than 500 patients with clinically isolated syndrome. Study participants with this clinical picture have so far experi-enced a single MS-like symptom, such as optical or sensory disturbances, and are at risk of developing MS but have not yet been given a clinically definite diagnosis of MS. The trial is designed to evaluate whether treatment with Rebif ® in the early stages of the disease can delay the progression to clinically definite MS. The results of the completed 40-week Phase IIIb IMPROVE study confirm the therapeutic effect of the new formulation of Rebif ® in patients with relapsing-remitting MS. After 16 weeks of treatment, the number of combined unique brain MRI lesions in patients treated with Rebif ® was significantly lower compared to placebo. This positive effect could be detected as early as four weeks after treatment initiation and was sustained over the 40-week trial period. The results after 16 weeks also showed a significant reduction in the relapse rate versus placebo and an improvement in injection site reactions.
Cladribine tablets for the oral treatment of MS submitted for regulatory approvalWith cladribine tablets, the Merck Serono division is developing a drug for the oral treatment of relapsing-remitting forms of MS. Treatment would become considerably more convenient for patients and compliance could improve since a single daily tablet would only need to be taken a few times a year for four to five days. We submitted marketing authorization applica-tions for cladribine tablets with the EMA in Europe in July and with the FDA in the United States in September. The submissions are largely supported by results of the CLARITY study, a two-year randomized, double-blind, placebo-controlled Phase III trial of cladribine tablets as a monotherapy in 1,300 patients with relapsing-remitting MS. A significant relative reduction in annualized relapse rates was seen in patients treated with cladribine tablets compared to placebo. Data from a post-hoc analysis of the CLARITY study show that short-course treatment with cladribine tablets significantly increased the proportion of patients with absence of disease activity compared to placebo. At the end of November, the FDA issued a refuse to file letter.
In the IMPROVE trial, the positive effect of treatment with Rebif ® was detected in just four weeks
after treatment began.
company 47corporate governanceto our shareholders Further informationManagement Report consolidated Financial statements
pharmaceuticals | Merck serono
Merck Serono will work closely with the FDA to successfully resubmit the application at the earliest possible point in time.The two-year Phase III ORACLE-MS study is investigating cladribine tablets as a treatment for patients with an increased risk of developing MS. In the Phase II ONWARD study, we are evaluating the safety and tolerability of adding cladribine tablets to established treatment with interferon beta. Patient recruitment has been completed.We discontinued the development of atacicept in multiple sclerosis after observing in one of three Phase II clinical trials increased MS disease activity in patients taking atacicept compared to placebo.
New study started with safinamide in late-stage Parkinson’s disease Together with our partner Newron, we are developing safinamide as an oral add-on therapy for patients with Parkinson’s disease, which affects an estimated three million people in industrialized countries. We successfully completed the first Phase III clinical trial of safin-amide administered as an adjunctive therapy to levodopa standard treatment in patients with advanced Parkinson’s disease after a six-month treatment period. Motor functions and the ability to perform daily activities improved significantly in patients treated with safinamide compared to placebo. In May, we started SETTLE, our second Phase III clinical trial in this indi-cation, which will involve more than 450 patients. We are evaluating safinamide as an add-on therapy to a dopamine agonist in early Parkinson’s disease in a Phase III clinical trial.
Fertility research and development activities realignedThe objective of Merck Serono’s research and development work in the therapeutic area of Fertility is to help infertile couples at every stage of the reproductive cycle – from follicular development to early pregnancy – to realize their dream of having a child. We want our inno-vative treatments and application devices to offer maximum convenience of use and increase the chances of pregnancy. Our well-established products for the treatment of infertility are already known for their safety and efficacy. Further improvements in the number of successful pregnancies are only possible by realigning our R & D activities in Fertility. By focusing on drugs, technologies and support services, we want to improve the success of in vitro fertiliza-tion treatments and thus increase the take-home baby rate. In the course of this new strategy, we terminated the Phase II program for a long-acting recombinant follicle-stimulating hormone (hyperglycosylated FSH) for assisted reproduction therapy and to induce ovulation. The expected benefit for patients would have been too low. This would not have warranted the significant time and investment required for late-stage development and the subsequent submission of an application for marketing authorization.
The first Phase III clinical trial with safinamide for the treatment of
late-stage Parkinson’s disease was successfully completed.
Merck Annual Report 200948
Therapeutic target in systemic lupus erythematosus validated for atacicept Our research and development work in Autoimmune and Inflammatory Diseases focuses on proteins that modulate key pathogenic mechanisms in these diseases. We are developing the recombinant protein atacicept for autoimmune diseases such as systemic lupus erythema-tosus (SLE). This innovative compound blocks the two immunomodulatory factors APRIL and BLyS. They are important for the survival and the proliferation of lymphocytes that trigger an abnormal immune reaction against the patient’s own normal tissues. SLE is a chronic, autoimmune disease that mainly affects women and is an area of great unmet medical need. We are currently enrolling patients into a Phase II/III clinical trial with atacicept in SLE. In the second half of 2009, a competitor published positive data from two Phase III trials in SLE involving a BLyS-targeted compound administered intravenously. These results are encouraging for us since atacicept targets not only BLyS but also APRIL, and is administered by subcutaneous injection, which is more convenient for patients than an infusion. In 2008, we discontinued a Phase II/III study in lupus nephritis (LN), a particularly severe form of kidney failure, owing to infections that were probably the result of significant disease activity coupled with the concomitant use of several immunosuppressive medications. Having evaluated the trial data, we are now adjusting the clinical development plan for atacicept in lupus nephritis.We analyzed the results of our Phase II trials with atacicept in rheumatoid arthritis (RA). Although we noted strong biological effects and indications of clinical benefit, the efficacy data did not correspond to our criteria for a move to Phase III. Thanks to its novel mechanism of action, fibroblast growth factor 18 (FGF 18) could be the first disease-modifying treatment for osteoarthritis and the repair of cartilage damaged following injury. In the laboratory it has been shown to stimulate the regeneration of articular cartilage defects. FGF 18 may thus support the healing of degenerative joint disease instead of simply treating its symptoms. Patient enrollment was completed early for two Phase I clinical trials that are currently underway.
Development projects on growth disorders and metabolic diseases Our development projects in the therapeutic area of Endocrinology derive from research work on growth disorders and metabolic diseases – two areas where the Merck Serono division can build on its long-standing experience. Tesamorelin is a growth hormone-releasing factor analog to which our U.S. subsidiary EMD Serono acquired the U.S. commercialization rights. This compound has therapeutic potential in a variety of indications. Following the successful conclusion of Phase III clinical trials, our development partner Theratechnologies submitted an application in the second quarter to the U.S. Food and Drug Administration for use in reducing excess abdominal fat in HIV patients with lipodystrophy. It is estimated that 30% to 50% of HIV patients suffer from this condition, for which there is currently no approved treatment available.
Fibroblast growth factor 18 could be the first disease-modifying
treatment for osteoarthritis.
company 49corporate governanceto our shareholders Further informationManagement Report consolidated Financial statements
pharmaceuticals | Merck serono

phARMAceuticAls | consuMeR heAlth cARe
Our Consumer Health Care division offers high-quality over-the-counter products for preventive health care and self-treatment of minor ailments. Its product range includes global, scientifically based branded products that customers trust. The Consumer Health Care division is represented in many countries of Europe, Latin America, Asia and Africa.
50 Merck Annual Report 2009

KEY PRODUCTS
– Mobility: Products to strengthen the joints and relieve pain, including the brands Seven Seas ®, Seven Seas ® JointCare, Flexagil ® and Kytta ®
– Everyday health protection: Probiotic multivitamin products Bion ® and Multibionta ®; vitamins and minerals sold under brand names such Cebion ® and Diabion ®
– Women’s and children’s health: Femibion ®, products with folic acid and Metafolin ® for pregnant and nursing women; Kidabion ® (Haliborange ®), a vitamin product for children
– Cough and cold: Cold remedy Nasivin ® (Iliadin ®); flu remedy Sedalmerck ®
KEY DEvELOPMENTS IN 2009
– Growth course continues, with most countries clearly outperforming the market
– Strong recovery takes hold in the last two quarters following a weak start to 2009
– Power brands reinforced as the right strategy for the crisis
– Integration of the Belgian company Bio-Fyt
– Cooperation with the Chinese Medical Doctors Association (CMDA) to improve nutritional counseling in hospitals
– Cooperation strengthened with Bracco, a supplier of OTC pharmaceutical products in Italy
– Entry into the Canadian market with Multibionta ®
Bion ® the probiotic vitamin is
the second-leading otc brand in France.
Kytta ®the plant-based range proves its strength in the German market.
Femibion ®the brand specifically designed
for women boosts business in the united kingdom.
company 51corporate governanceto our shareholders Further informationManagement Report consolidated Financial statements
pharmaceuticals | consumer health care

continuinG on A GRowth couRse the consumer health care division continued on a growth course in 2009. we consolidated our market position, underpinned by the success of our strategic brands and numerous new product launches.
Focus on four health themesConsumer Health Care specializes in over-the-counter pharmaceutical products, focusing on four health themes: Mobility, Everyday Health Protection, Women’s and Children’s Health, and Cough and Cold. The main distribution channels for our products are pharmacies, as well as retail chains, drug stores and mail order in some countries and certain markets. We are building on the strength of our well-known brands and the long-standing trust consumers place in them with respect to their quality and efficacy.
Consumer Health Care | Key figures
€ million 2009 2008 ∆ in %
Total revenues 467 442 5.7Gross margin 319 294 8.7R & D 19 17 16Operating result 48 61 –21Exceptional items – – –Free cash flow 49 5.6 –Underlying free cash flow 49 38 28ROS in % 10.3 13.9
Strong brands and regional expansion Total revenues of the Consumer Health Care division rose by 5.7% to € 467 million in 2009. We thus met our objective of continuing on our growth course. Organic growth was 8.6%. Sales by wholesalers to end customers even saw double-digit growth due to increased destocking, as for instance mandated by law. Following a difficult first half, attributable also to destocking, business recovered markedly in the last two quarters, with sales significantly exceeding market growth in many countries. The cornerstones of our strategy are strong brands and regional expansion. With a few exceptions, our key markets developed well. However, in some markets, negative currency effects diminished organic growth and the successes achieved. This was primarily noticeable in the United Kingdom as well as in Poland and Mexico. The operating result of the Consumer Health Care division declined by 21% to € 48 million; ROS was 10.3% versus 13.9% in 2008. In comparison with the previous year, it should be noted that exceptional items had a strong impact in 2008, primarily the sale of the biManán ® brand in Spain for € 11 million. Additionally, the operating result was adversely affected by exchange rate losses, mainly with respect to Venezuela. Research and development spending rose by 16% to € 19 million. Underlying free cash flow increased by 28% to € 49 million in 2009.
www.merck.de/ consumerhealthcare
Total revenues grew organically by 8.6%.
Merck Annual Report 200952
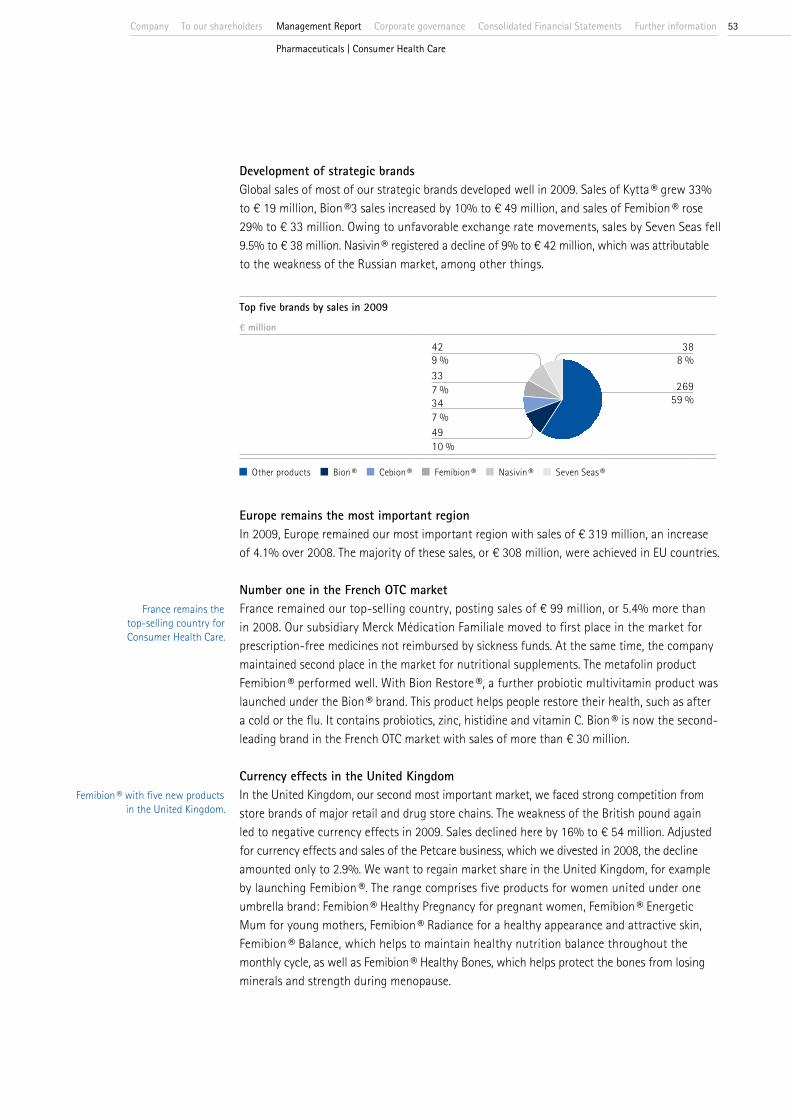
Development of strategic brandsGlobal sales of most of our strategic brands developed well in 2009. Sales of Kytta ® grew 33% to € 19 million, Bion ®3 sales increased by 10% to € 49 million, and sales of Femibion ® rose 29% to € 33 million. Owing to unfavorable exchange rate movements, sales by Seven Seas fell 9.5% to € 38 million. Nasivin ® registered a decline of 9% to € 42 million, which was attributable to the weakness of the Russian market, among other things.
Top five brands by sales in 2009
€ million
42 389 % 8 %337 % 269
59 %347 %4910 %
Other products Bion ® Cebion ® Femibion ® Nasivin ® Seven Seas ®
Europe remains the most important regionIn 2009, Europe remained our most important region with sales of € 319 million, an increase of 4.1% over 2008. The majority of these sales, or € 308 million, were achieved in EU countries.
Number one in the French OTC market France remained our top-selling country, posting sales of € 99 million, or 5.4% more than in 2008. Our subsidiary Merck Médication Familiale moved to first place in the market for prescription-free medicines not reimbursed by sickness funds. At the same time, the company maintained second place in the market for nutritional supplements. The metafolin product Femibion ® performed well. With Bion Restore ®, a further probiotic multivitamin product was launched under the Bion ® brand. This product helps people restore their health, such as after a cold or the flu. It contains probiotics, zinc, histidine and vitamin C. Bion ® is now the second-leading brand in the French OTC market with sales of more than € 30 million.
Currency effects in the United KingdomIn the United Kingdom, our second most important market, we faced strong competition from store brands of major retail and drug store chains. The weakness of the British pound again led to negative currency effects in 2009. Sales declined here by 16% to € 54 million. Adjusted for currency effects and sales of the Petcare business, which we divested in 2008, the decline amounted only to 2.9%. We want to regain market share in the United Kingdom, for example by launching Femibion ®. The range comprises five products for women united under one umbrella brand: Femibion ® Healthy Pregnancy for pregnant women, Femibion ® Energetic Mum for young mothers, Femibion ® Radiance for a healthy appearance and attractive skin, Femibion ® Balance, which helps to maintain healthy nutrition balance throughout the monthly cycle, as well as Femibion ® Healthy Bones, which helps protect the bones from losing minerals and strength during menopause.
France remains the top-selling country for Consumer Health Care.
Femibion ® with five new products in the United Kingdom.
company 53corporate governanceto our shareholders Further informationManagement Report consolidated Financial statements
pharmaceuticals | consumer health care

Consumer Health Care | Sales by region€ million
5612 %89
19 %
31969 %
Europe Latin America Asia, Africa, Australasia
Kytta – a flagship product in Germany Germany is our third largest market. Sales increased by 22% to € 56 million in 2009. The Kytta ® products performed superbly. Above all, the plant-based Kytta ® ointment for the relief of pain caused by contusions, strains and sprains delivered excellent results again and captured second place in this market segment. This was supported by an advertising campaign that included a television commercial that won numerous awards. With Femibion ® we are the market leader in Germany. Particularly strong sales growth was achieved via online pharmacies, a distribution channel that appeals especially to the target group of young mothers.
Integration of Bio-Fyt in Belgium strengthens our position In Belgium, the integration of Bio-Fyt, which we acquired at the end of 2008, was completed. The company focuses on products for mobility, women’s health and everyday health protection. Bio-Fyt was officially renamed Merck Consumer Health Care Belgium in September. The integration proceeded rapidly. Logistics systems were aligned and activities were fully merged. The Consumer Health Care division now has a strong presence in the four key health themes, has a larger sales force, and is one of the leading players in the Belgian OTC market. Conse-quently, sales in Belgium increased by 53% to € 27 million.In Spain, the business was restructured following the sale of the biManán ® brand of diet products. For example, Femibion ® was launched, supported by a major marketing campaign. Femibion ® is the official sponsor of “Plenufar”, a program that was initiated by the Spanish Federation of Pharmacists. This program promotes optimal nutrition for pregnant and nursing women and has a reach of 5,000 pharmacies.
Merck Annual Report 200954
Partnering with Bracco in Italy Establishing our global strategic brands in Italy is the aim of an enhanced partnership with the Italian pharmaceutical company Bracco, which ranks among the top ten in the OTC market of Italy. Bracco has been a reliable partner to Merck for decades and enjoys a superb reputation among pharmacists, physicians and consumers. Cooperation is initially planned until 2014. Flexagil ® was the first CH brand to be launched by Bracco. Two products from this range to treat joint problems were launched in April. Flexagil ® Re-Generate2 helps to keep joints flexible and supple. Flexagil ® Stop Friction supports mobility in people with osteoarthritis and other joint problems. Within Europe, our businesses showed good growth in Austria, Portugal and Slovakia, among other countries.
A triple market launch in Mexico In Latin America, we increased sales by 16% to € 89 million. Sales rose by 3.1% to € 6.9 million in Brazil. In Mexico, where sales totaled € 32 million, we launched three new products. These include Flexagil ® Re-Generate3, a treatment for joint problems, and Sedalmerck ® MAX, an analgesic containing the maximum concentration of paracetamol and caffeine permitted in an over-the-counter product sold in Mexico. We added a special cream to the Diabion ® range of multivitamin products, which are specially formulated for people with diabetes, who often suffer from dry skin and other dermatological problems. Customers in Mexico have welcomed this new development. We entered the Canadian market with our first product, the probiotic multivitamin Multibionta ®, also known as Bion ®3 in other countries.
Cooperating with hospitals in China In China, an important growth market, we established an independent legal entity within one year and achieved sales of € 6.1 million in 2009. The division is capturing market share slowly but steadily, as for example with the launch of Diabion ® for people with diabetes. At the same time, we are living up to our social responsibility. A good example of this is the cooperation agreement with the Chinese Medical Doctors Association (CMDA) to improve nutritional counseling in hospitals in China. Sales in Indonesia, the division’s most important market in Asia, remained stable at € 11 million. In South Africa, our most important market in Africa, sales increased sharply by 28% to € 7.1 million.
Further improving the innovation rateIn order to satisfy consumer needs even better and meet trends even faster in the future, the division realigned its research and development organization. The aim is to achieve even better quality and strengthen our strategic brands. Although our innovation rate, meaning the share of the total portfolio accounted for by new products, is among the highest in an international comparison, the objective is to achieve further improvements.
Nutritional counseling is to sensitize the population.
company 55corporate governanceto our shareholders Further informationManagement Report consolidated Financial statements
pharmaceuticals | consumer health care

cheMicAls | liQuid cRystAls
Liquid crystal mixtures from Merck are used all over the world – for example, in most LCD (liquid crystal display) televisions, computer monitors, notebooks, digital cameras and mobile phones, as well as in many other high-quality displays. Merck is the global market leader in this field and, thanks to continuous investments in research and production, also the technology leader. We are also working on new lighting and display technologies such as OLEDs. In view of climate change and consistently high energy prices, in addition to our core business with display materials we are also active in growth markets. These include the use of solar energy and the development of innovative technologies for energy-saving LEDs.
56 Merck Annual Report 2009

KEY PRODUCT
– licristal ® – Liquid crystal mixtures for displays
OTHER PRODUCT GROUPS
– livilux ® – Materials for OLEDs (organic light-emitting diodes) in displays and for innovative lighting
– isishape ® – Efficient and environmentally friendly materials for producing solar cells and touch screens
KEY DEvELOPMENTS IN 2009
– Market and technology leadership maintained
– Total revenues fall short of 2008, but resume steady growth after reaching their lowest point in the first quarter
– Fourth quarter sees year-on-year growth in total revenues of 20% to € 201 million
– Operating result impacted by the effects of the economic crisis and capacity underutilization
– Technological leadership with innovative liquid crystal mixtures for PS-VA (polymer-stabilized vertical alignment) applications
Smartphone Blackberry ® Storm TM 9500 with touch screen
A high-quality display – for mobile communication too.
Ultrathin TVour new ps-VA technology
provides better picture quality for rapidly moving images.
company 57corporate governanceto our shareholders Further informationManagement Report consolidated Financial statements
chemicals | liquid crystals
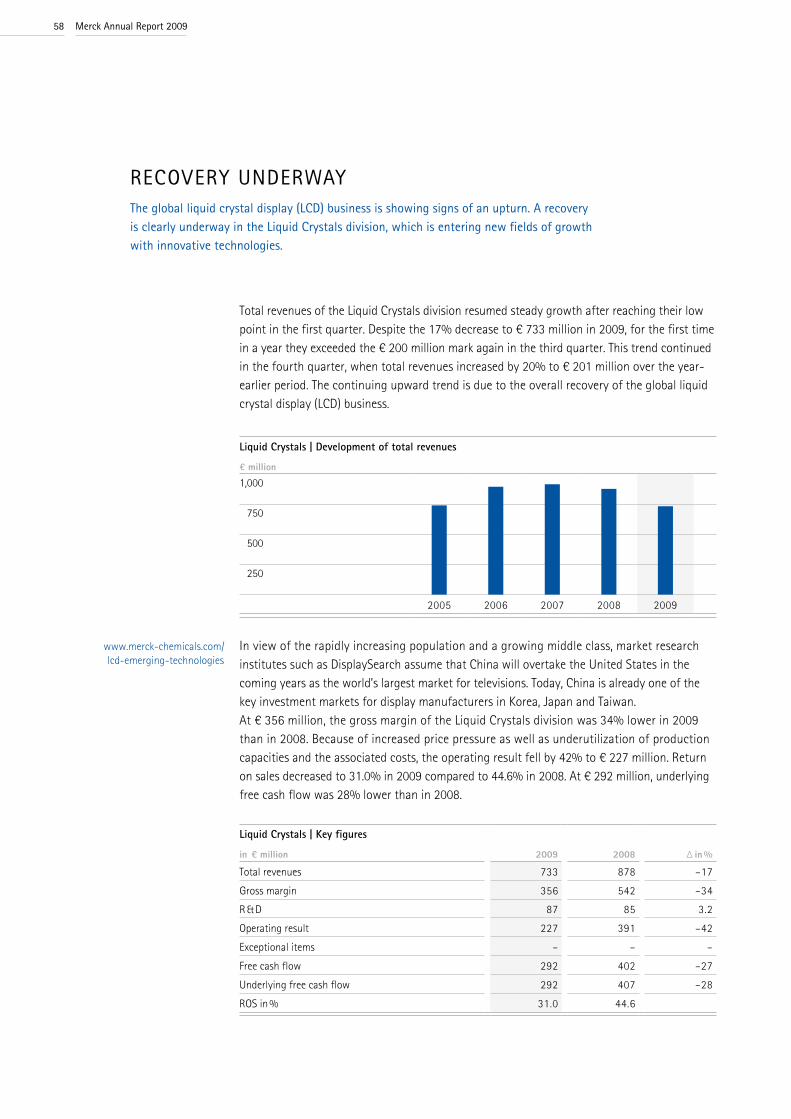
RecoVeRy undeRwAythe global liquid crystal display (lcd) business is showing signs of an upturn. A recovery is clearly underway in the liquid crystals division, which is entering new fields of growth with innovative technologies.
Total revenues of the Liquid Crystals division resumed steady growth after reaching their low point in the first quarter. Despite the 17% decrease to € 733 million in 2009, for the first time in a year they exceeded the € 200 million mark again in the third quarter. This trend continued in the fourth quarter, when total revenues increased by 20% to € 201 million over the year-earlier period. The continuing upward trend is due to the overall recovery of the global liquid crystal display (LCD) business.
Liquid Crystals | Development of total revenues
€ million1,000
750
500
250
2005 2006 2007 2008 2009
In view of the rapidly increasing population and a growing middle class, market research institutes such as DisplaySearch assume that China will overtake the United States in the coming years as the world’s largest market for televisions. Today, China is already one of the key investment markets for display manufacturers in Korea, Japan and Taiwan. At € 356 million, the gross margin of the Liquid Crystals division was 34% lower in 2009 than in 2008. Because of increased price pressure as well as underutilization of production capacities and the associated costs, the operating result fell by 42% to € 227 million. Return on sales decreased to 31.0% in 2009 compared to 44.6% in 2008. At € 292 million, underlying free cash flow was 28% lower than in 2008.
Liquid Crystals | Key figures
in € million 2009 2008 ∆ in %
Total revenues 733 878 –17Gross margin 356 542 –34R & D 87 85 3.2Operating result 227 391 –42Exceptional items – – –Free cash flow 292 402 –27Underlying free cash flow 292 407 –28ROS in % 31.0 44.6
www.merck-chemicals.com/ lcd-emerging-technologies
Merck Annual Report 200958
Market conditions recoverThe major display manufacturers recovered well from the crisis of the first quarter. The high degree of underutilization seen at the beginning of 2009 was overcome in the course of the year. The Taiwanese display market presents a particularly positive picture. Manufacturers here are primarily suppliers to the electronics industry and were the first to be affected by the consequences of the economic downturn. However, this market quickly recovered in 2009. The major brand manufacturers in Japan and South Korea, who also manufacture displays themselves and mainly cover the higher-price market segment, also overcame the crisis in the second half of the year. The revival of demand from display manufacturers had a correspond-ingly positive effect on our quarterly results in the course of the year. After cutting back liquid crystal production as a result of the global drop in demand, our plant capacity utilization has meanwhile returned to the levels before the economic crisis.
New display technologies continue to advanceWith our innovative liquid crystal mixtures for Polymer-Stabilized Vertical Alignment (PS-VA) applications, we further expanded our technology leadership. PS-VA is increasingly becoming the preferred technology for high-quality displays. It is successively replacing conventional Vertical Alignment (VA) technology, the dominant LCD-TV technology developed by Merck a number of years ago now facing unabated, strong competitive pressure. With VA technology, slits in the electrodes or microscopic three-dimensional protrusions, allow the liquid crystals to align in the correct direction when they are switched. With PS-VA, a polymer layer within the display allows the molecules to be pre-oriented in a certain direction. In the black state, the liquid crystals are not vertical, but slightly tilted: The tilt locally predefines the liquid crystal switching direction. This results in extremely rapid switching times, which are enormously important for displaying lifelike moving images. Besides improved moving picture quality, the technical advantages of PS-VA are faster switching times, higher contrast and better light transmittance. These features reduce the required backlight power, which is both one of the most expensive display components to produce and the biggest power consumer during operation.PS-VA technology opens up new possibilities for LCD producers to achieve previously unattained screen properties. In an LCD television incorporating PS-VA materials from Merck, the colors appear fuller, warmer, and more natural. In addition, the spatial depth of the display is greater, and movements are livelier. In Taiwan, Korea and Japan, this technology is already being used in mass production. The term LED TVs is used to describe televisions in which only the backlight consists of LEDs (light-emitting diodes), thus achieving better picture contrast and brightness, and producing more lifelike images. Individual areas of the illuminated surface for displaying a deep black can be separately dimmed or switched off completely, thus enhancing the contrast. The advantages of LED and LCD are combined in this way. Further significant advantages include the low energy consumption and slim design of flat screens.
www.merck-chemicals.com/ display-materials
PS-VA technology makes previously unattainable screen
properties possible.
company 59corporate governanceto our shareholders Further informationManagement Report consolidated Financial statements
chemicals | liquid crystals

Higher spending on research and developmentWe continue to invest in research and development in order to maintain our leadership position in display materials. At € 87 million, R & D spending was 3.2% higher in 2009 than in 2008. A new chemical research center is currently being constructed at the Darmstadt site. Certain aspects of LC and OLED research will be conducted here. It is scheduled for commissioning in the third quarter of 2010. We expanded our site in South Korea in order to strengthen our research and development activities and further intensify our cooperation with customers. In addition, we are working on reactive mesogens, which are polymerizable liquid crystals that can be used, for example, as material for optical films. They help to enhance the display image quality. Aside from liquid crystal technology, our researchers are working on materials for innovative displays. Here the special focus of development is on OLED materials. They are already being used in mobile phones, MP3 players and digital picture frames.
OLED research in science and industry networksIn our efforts to advance OLED technology, we are increasingly participating in research networks. The development of “new materials for OLEDs from solution” (NEMO) is the focus of a project that Merck has launched as the consortium leader together with partners from industry and science. The aim of this collaboration, which is funded by the German Federal Ministry of Education and Research, is to develop innovative, soluble materials for use in large-area OLED components for devices such as flat screens, electronic traffic signs or lighting systems. An OLED is a solid-state device composed of thin films of organic semiconductor molecules that create light when electrical current is applied. The main difference to inorganic light-emitting diodes (LEDs) is their lower current density and laminar light density and the fact that no crystalline materials are required. OLEDs are already being used in small-area displays, for instance in mobile phones and MP3 players. They consume little energy and offer sharp images from nearly every viewing angle. By using ultra-thin luminescent layers, OLED tech-nology makes it possible to produce unique, large-area homogeneous lighting surfaces with a total layer thickness of just a few millimeters. Compared to the vacuum evaporation process used today, these new materials should significantly improve scalability and coating efficiency in particular. To this end, the NEMO project partners are focusing on soluble, phosphorescent materials for red, green and blue applications. In order to develop marketable solutions quickly, different injection, transport and electrode materials as well as adhesives are being researched, evaluated and tested in parallel for their performance. In addition, as the leading producer of high-performance OLED materials Merck is collaborating with Braunschweig Technical University and the U.S.-based company Applied Materials on a project called “Light InLine” to develop processes to reduce the production costs of OLED lighting. Produced on glass plates or flexible substrates, OLED tiles can emit white light that is more homogeneous and more energy-efficient than the light from conventional fluorescent lamps.
www.merck-chemicals.com/oled
OLEDs consume little energy and offer sharp images from nearly
every viewing angle.
Merck Annual Report 200960
Alternatives to incandescent light bulbsIncandescent lights bulbs will be phased out in Europe by 2012. Possible alternatives are the subject of intense discussion. For some time now, our researchers have been working on innovative lighting materials – activities grouped together as “Solid State Lighting”. These are aimed at developing lighting materials for white LEDs, which constitute an alternative to conventional light bulbs and energy-saving lamps. Our OLED materials can be used not only for this kind of spot lighting, but also for innovative area lighting, making it possible to generate large-area, energy-saving light. Here, prototypes have already been developed in cooperation with leading lighting manufacturers.
Photovoltaics – a key technologyFollowing the strong growth achieved in 2008, the photovoltaics market stagnated in 2009. The cutback in government subsidies was especially noticed by manufacturers in Asia and Europe. Nevertheless, photovoltaics is one of the key technologies of the future with respect to renewable energy sources. Therefore, the division is focusing on developing materials for the production of organic solar cells and for printing technologies. With the isishape ® range, we already offer solar cell manufacturers printable etching pastes, which enable them to use the required production material in a more cost-efficient and eco-friendly way.Within the scope of a development project sponsored by the German Ministry of Research, Merck is collaborating in the field of organic photovoltaics with other leading industrial companies on innovative materials for alternative energy sources. This project aims to increase the efficiency of organic solar cells and to use cost-effective printing processes to produce these highly efficient cells. Our Technical Centre in Chilworth, near Southampton, United Kingdom, which was expanded in 2009, is conducting work in this area.
Dye-sensitized solar cellsIn parallel, we are working on new technologies, for example dye-sensitized solar cells (DSSCs), which are used as a renewable energy source in photovoltaics. They imitate nature with the aid of artificial photosynthesis, an application of nanotechnology for energy generation. The electrolytes in the dye-sensitized solar cells are based on ionic liquids. Merck has a worldwide leading role in the development and manufacture of these. In order to advance this technology, we started cooperating closely in 2009 with Dyesol of Australia, the leading specialist for materials and components for the production of dye-sensitized solar cells. In the Ionic Liquids business, we have a broad knowledge base and hold numerous patents for new formulations. The cooperation with Dyesol enables us to optimize the development of opportunities worldwide in the attractive market for dye-sensitized solar cells. The use of ionic liquids as a main component of electrolytes creates the possibility to produce both rigid and flexible solar cells. This special feature will enable us to develop many new fields of application in the future.
www.merck-chemicals.com/solid-state-lighting
www.merck-chemicals.com/photovoltaic-materials
Dye-sensitized solar cells imitate nature with the aid of artificial
photosynthesis.
company 61corporate governanceto our shareholders Further informationManagement Report consolidated Financial statements
chemicals | liquid crystals

cheMicAls | peRFoRMAnce & liFe science cheMicAls
Specialty chemicals from Merck are important components of the process chain from drug development to industrial production. They ensure reliable analysis in research and dependable production processes. People encounter our products in many technologically complex applications and day-to-day products such as automotive coatings, medicines or cosmetics. Expertise in chemistry and customer-centric innovations have made us a successful supplier to the pharma-ceutical, cosmetics, food, plastics, coatings and printing industries. Our goal is to further expand our know-how in regulated markets. The division operates in three business areas: Laboratory Business, Life Science Solutions and Pigments.
62 Merck Annual Report 2009
KEY PRODUCT GROUPS
– Laboratory chemicals available in various specifications including the relevant certificates of analysis and safety data sheets, thus ensuring reliable and comparable results.
– Products and solutions using the latest technological expertise in chemical and biotech-nological processes, and geared to customer needs in a variety of sectors, particularly the pharmaceutical industry.
– Innovative effect pigments for use in coatings, packaging and product design, which impart not only decorative but also security-relevant features, such as brand and anti-counterfeit protection.
KEY DEvELOPMENTS IN 2009
– Steep decline in sales of effect pigments impacts the division’s performance
– Free cash flow doubled by reduction of inventories
– Life Science Solutions and Laboratory Business largely stable
– Leading role assumed in the Indian biosciences market through the acquisition of Bangalore Genei
– Acquisition of Taizhu, a leading Chinese supplier of effects pigments, offers new growth opportunities
Singlepath ® dangerous coli bacteria can be
detected within seconds.
Ectointhis natural active ingredient helps
regenerate damaged skin.
Ronaflair ®pearl-luster pigments
give lips ultimate gloss.
company 63corporate governanceto our shareholders Further informationManagement Report consolidated Financial statements
chemicals | performance & life science chemicals

GloBAl econoMic tuRMoil iMpActs peRFoRMAncethe division clearly felt the drop in demand, particularly in the automotive industry, which is a cyclical business. sales of effect pigments fell sharply and resulted in underutilization of pigment production capacities in the course of the year.
The development of total revenues and operating result in the Performance & Life Science Chemicals division reflects the effects of the global economic crisis. In 2009, total revenues declined by 3.8% to € 1,202 million. While the Life Science Solutions and Laboratory busi-nesses largely remained stable, the decline in effect pigments particularly impacted business performance. The division was especially affected by the global drop in demand in, for example, the automotive industry, which is a cyclical business. Performance was strongly influenced by, among other things, the underutilization of production capacities in the Pigments business. Gross margin decreased by 12% to € 556 million. The operating result fell to € 97 million, which corresponded to a decrease of 42% compared with 2008. At 8.0%, return on sales was significantly lower than in 2008. By contrast, underlying free cash flow rose significantly as a result of massive reduction of inventories, doubling to € 140 million.
Performance & Life Science Chemicals | Key figures
€ million 2009 2008 ∆ in %
Total revenues 1,202 1,249 –3.8Gross margin 556 633 –12R & D 54 58 –7.8Operating result 97 167 –42Exceptional items 12 –46 –Free cash flow 119 58 106Underlying free cash flow 140 67 109ROS in % 8.0 13.3
The division bolstered its business by resolutely managing costs and optimizing cash flow. Cutting pigment production in response to the downturn in demand proved to be an effective measure. Consequently, reduced working hours or similar measures were introduced at all pigment production sites. By consolidating our sites in the United States, a process which began in January 2009, we laid the foundation for the long-term profitable growth of our U.S. subsidiary EMD Chemicals. In parallel, we significantly increased the range of innovations we offer customers, optimized our delivery and supply chain, and expanded our web presence. We now have 50 country-specific websites in 20 different languages. The division also continued to invest above average in research and development, although more moderately than in 2008. R & D spending amounted to € 54 million in 2009, which corresponds to a decrease of 7.8%. A main focus of spending was on centers of application technology that support the sales departments. In addition, we have sustainably strengthened our businesses through acquisitions and cooperation agreements.
www.merck-chemicals.com
Merck Annual Report 200964
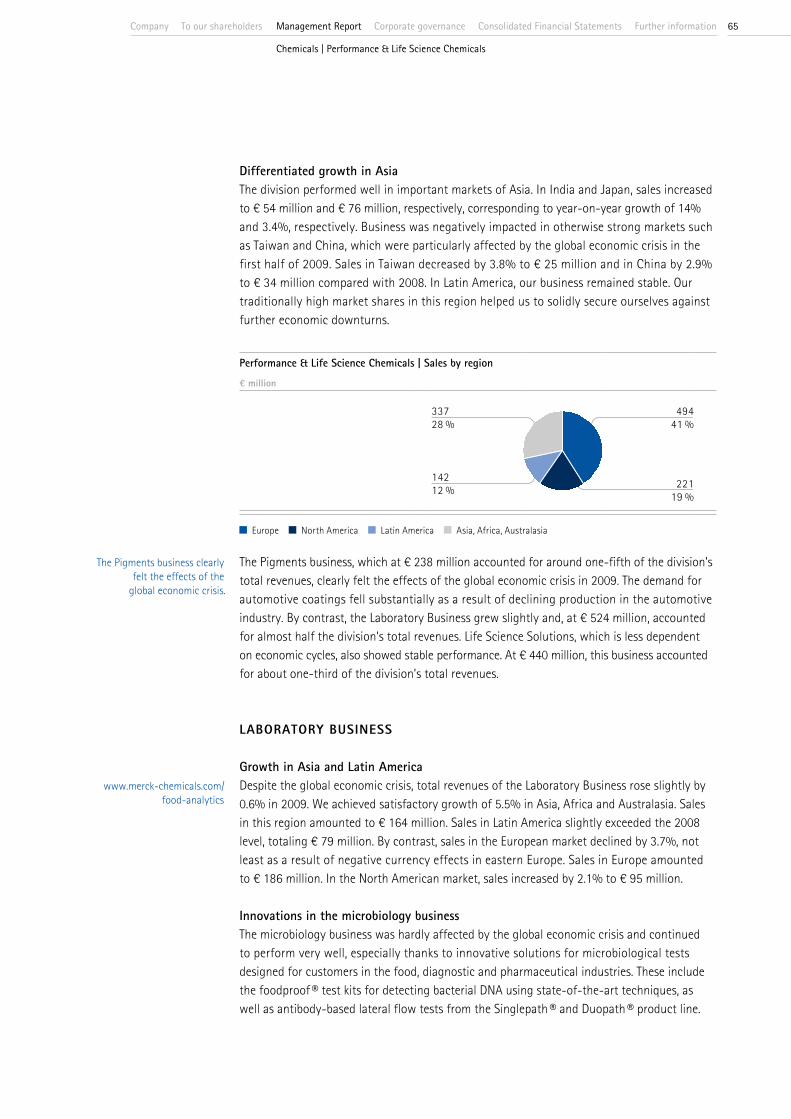
Differentiated growth in AsiaThe division performed well in important markets of Asia. In India and Japan, sales increased to € 54 million and € 76 million, respectively, corresponding to year-on-year growth of 14% and 3.4%, respectively. Business was negatively impacted in otherwise strong markets such as Taiwan and China, which were particularly affected by the global economic crisis in the first half of 2009. Sales in Taiwan decreased by 3.8% to € 25 million and in China by 2.9% to € 34 million compared with 2008. In Latin America, our business remained stable. Our traditionally high market shares in this region helped us to solidly secure ourselves against further economic downturns.
Performance & Life Science Chemicals | Sales by region
€ million
337 49428 % 41 %
142 22112 % 19 %
Europe North America Latin America Asia, Africa, Australasia
The Pigments business, which at € 238 million accounted for around one-fifth of the division’s total revenues, clearly felt the effects of the global economic crisis in 2009. The demand for automotive coatings fell substantially as a result of declining production in the automotive industry. By contrast, the Laboratory Business grew slightly and, at € 524 million, accounted for almost half the division’s total revenues. Life Science Solutions, which is less dependent on economic cycles, also showed stable performance. At € 440 million, this business accounted for about one-third of the division’s total revenues.
LABORATORY BUSINESS
Growth in Asia and Latin AmericaDespite the global economic crisis, total revenues of the Laboratory Business rose slightly by 0.6% in 2009. We achieved satisfactory growth of 5.5% in Asia, Africa and Australasia. Sales in this region amounted to € 164 million. Sales in Latin America slightly exceeded the 2008 level, totaling € 79 million. By contrast, sales in the European market declined by 3.7%, not least as a result of negative currency effects in eastern Europe. Sales in Europe amounted to € 186 million. In the North American market, sales increased by 2.1% to € 95 million.
Innovations in the microbiology businessThe microbiology business was hardly affected by the global economic crisis and continued to perform very well, especially thanks to innovative solutions for microbiological tests designed for customers in the food, diagnostic and pharmaceutical industries. These include the foodproof ® test kits for detecting bacterial DNA using state-of-the-art techniques, as well as antibody-based lateral flow tests from the Singlepath ® and Duopath ® product line.
The Pigments business clearly felt the effects of the
global economic crisis.
www.merck-chemicals.com/ food-analytics
company 65corporate governanceto our shareholders Further informationManagement Report consolidated Financial statements
chemicals | performance & life science chemicals
Deliveries of acetonitrile maintained despite the crisisIn 2009, the greatest obstacle faced by the global Laboratory business was the serious shortage of acetonitrile on the global market. This raw material, also used as a solvent in high-performance liquid chromatography (HPLC), is a by-product of acrylonitrile production. The demand for this substance dropped drastically as a result of the economic downturn, which led to the standstill of many acrylonitrile production plants. We were able to maintain deliveries of acetonitrile to our customers despite the shortage.
Stronger presence in the Indian marketIn October, we acquired Bangalore Genei, an Indian company specializing in the development, production and sale of products for proteomic and genomic research. Combining the activities of Bangalore Genei with our existing biosciences business has made us the leading supplier of bioscience products in the growth market of India.
LIFE SCIENCE SOLUTIONS
Stable in a difficult market environmentAgainst a backdrop of difficult economic conditions, total revenues of Life Science Solutions decreased in 2009 by 1.2% to € 440 million. In the important market of North America, sales declined by 4.2% to € 81 million and in Latin America by 1.1% to € 48 million. The proceeds from the divestment of our business with natural substances in Brazil amounted to € 11 million. Furthermore, we optimized our business with measures to improve cash flow and systematically reduce inventories. We achieved very strong growth with natural crop enhancement technologies developed by our Crop BioScience business, particularly in North and Latin America.
New products for biopharmaceuticalsIn 2009, we further intensified our research and development of materials for biopharmaceutical production. In the pharmaceutical sector, the share of the market accounted for by new biological entities has grown significantly compared to that of new chemical entities. We are taking this development into account by supplying the materials and services needed for biotech production along the value chain.
Innovative cosmetic active ingredientsIn 2009, our cosmetic active ingredients business with some of our key global customers declined. However, we set new accents in the market with further developments of, for example, the self-tanning agent DHA Plus ® and the successful brand Ronaflair ®, functional fillers that feature special optical and sensory properties.
The shortage of acetonitrile was the greatest obstacle faced by the global Laboratory business.
Growth in the Crop BioScience business.
www.merck-chemicals.com/ cosmetic-ingredients
Merck Annual Report 200966
PIGMENTS
Slight recovery in demand at year-end In 2009, the Pigments business was marked by weak global demand particularly in the automotive industry. With effect pigments for automotive coatings, Merck is an important supplier to the industry. Total revenues of effect pigments for the cosmetics industry also declined substantially. However, signs of recovery in the Pigments business and a return to higher production levels began to emerge in the third quarter – a development that continued in the fourth quarter. Owing to the decline in demand, Merck introduced reduced working hours in May for around 300 employees at the pigment production site in Gernsheim and transferred them internally to other production areas. We also significantly cut back pigment production at the plants in Savannah, Georgia in the United States, Onahama in Japan and Songjiang in China. As the order situation improved, we considerably scaled back the use of reduced working hours in the course of the year and completely discontinued it at year-end. Although total revenues declined overall by 10% to € 238 million and sales, particularly in Europe, fell by 20% to € 92 million in 2009, an increasing recovery in demand was noticeable as of the third quarter. Weak demand for consumer goods and continuing consumer uncertainty also affected the business with pigments for plastics, print products and cosmetic products. Against this background, we continue to focus our innovation efforts on profitable pigments such as Candurin ® pigments for coating foods and pharmaceuticals, and on the Pyrisma™ line of products, which covers a wide color range and offers intense effects.
Acquisition of one of the leading suppliers of effect pigments in ChinaWe captured new growth opportunities by acquiring Suzhou Taizhu Technology Development, a leading supplier of effect pigments in China, with a growing, profitable business. As a result, we have further expanded our position in the fast-growing Chinese market. The extended range of products now enables us to more actively target the mid-range value-for-money price segment. This is a fast-growing segment between the premium-price segment, which we had already been addressing, and the low-price segment of the respective countries.
New cosmetic applicationsIn 2009, Merck significantly expanded its portfolio in both cosmetic functional fillers and in the core business of pearl luster pigments. We entered into a licensing agreement with the Australian company Antaria for the exclusive worldwide rights to the plate-like alumina technology. The technology is used by Antaria in Alusion ®, a functional filler that gives cosmetics soft focus properties, among others.
Expansion of the functional pigments businessIn order to expand our activities, we acquired the Micabs ® laser pigments business from the Dutch chemical company DSM. This move gives us access to new technologies for the manufacture of laser marking products and complements our Lazerflair ® pigments with the Micabs ® brand.
www.merck-chemicals.com/pigments
Position in the fast-growing Chinese market further expanded.
New impetus from acquiring the laser pigments business of DSM.
company 67corporate governanceto our shareholders Further informationManagement Report consolidated Financial statements
chemicals | performance & life science chemicals

coRpoRAte And otheRthe segment corporate and other comprises Group administrative costs, the financial result, taxes as well as certain exceptional items not allocated to the individual divisions.
Group administrative costs relate primarily to Merck KGaA and consist of typical holding company functions. These include, for example, the corporate finance and accounting, tax, procurement, communications and human resources departments to the extent that their services cannot be allocated to the divisions. Corporate costs also include expenses for central, non-allocated IT functions and corporate IT projects in connection with the expansion and harmonization of IT systems within the Merck Group. The operating result of the segment Corporate and Other totaled € –78 million in 2009 as compared with € –81 million in 2008. No exceptional items were allocated to the segment in 2009 since we recorded these in the operating divisions.The financial result for 2009 improved to € –134 million from € –156 million in 2008. The change amounting to € 22 million results mainly from the lower interest component of currency hedging transactions. On the one hand, the varying currency-interest rate levels converged to a greater extent in 2009, while on the other hand the volume of currency hedging transactions was lower overall.
Decline in adjusted tax rate Tax expenses consist of corporation and trade income taxes for the companies domiciled in Germany as well as comparable income taxes for companies domiciled abroad. This item contains not only effective taxes but also deferred taxes, which take into consideration the difference in the carrying values between the tax accounts of the Group companies and the consolidated balance sheet. The latter results primarily from amortization of intangible assets in the course of the purchase price allocation for Serono as well as from deferred taxes for additions to provisions in the Group. Moreover, in 2009 deferred tax assets were recognized for tax loss carryforwards. The tax rate adjusted for exceptional items decreased from 25.8% to 21.6%. On the one hand, this was affected by the utilization of tax loss carryforwards without deferred tax assets and on the other hand by the write-up of deferred tax assets for unrecognized tax loss carryforwards, which will be utilized in future periods.
Merck Annual Report 200968
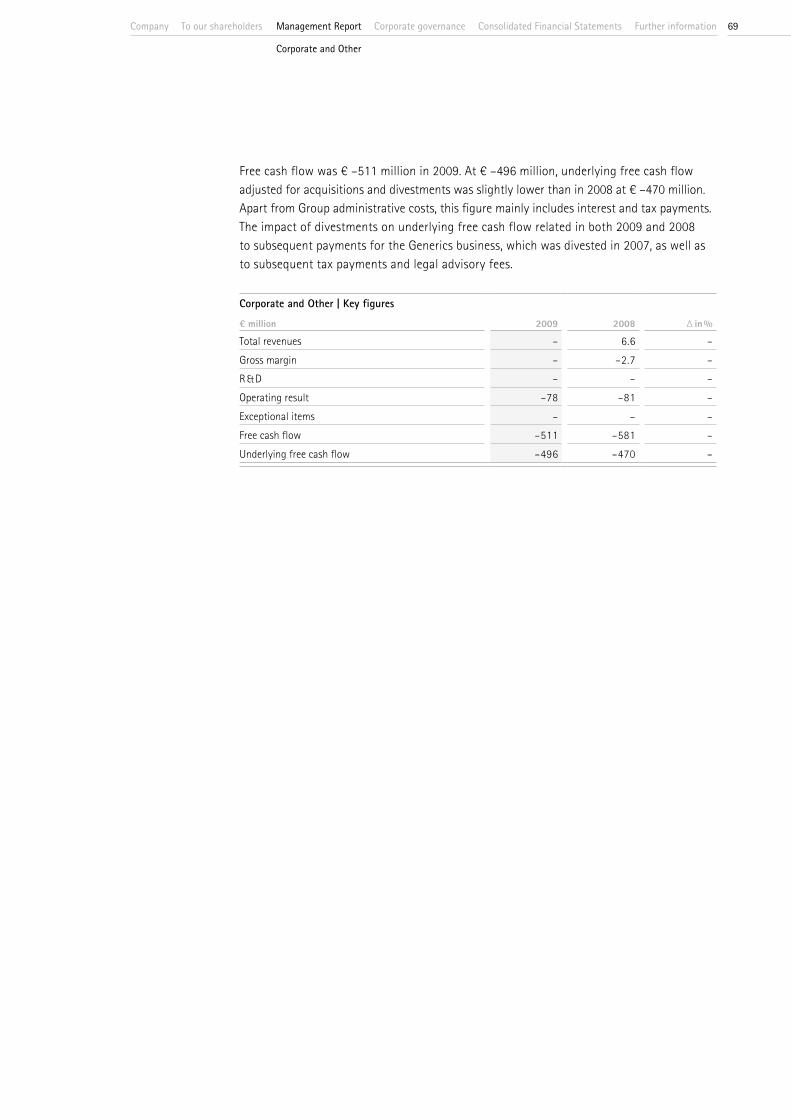
Free cash flow was € –511 million in 2009. At € –496 million, underlying free cash flow adjusted for acquisitions and divestments was slightly lower than in 2008 at € –470 million. Apart from Group administrative costs, this figure mainly includes interest and tax payments. The impact of divestments on underlying free cash flow related in both 2009 and 2008 to subsequent payments for the Generics business, which was divested in 2007, as well as to subsequent tax payments and legal advisory fees.
Corporate and Other | Key figures
€ million 2009 2008 ∆ in %
Total revenues – 6.6 –Gross margin – –2.7 –R & D – – –Operating result –78 –81 –Exceptional items – – –Free cash flow –511 –581 –Underlying free cash flow –496 –470 –
company 69corporate governanceto our shareholders Further informationManagement Report consolidated Financial statements
corporate and other
Risk RepoRtA targeted approach to handling opportunities and potentially negative developments is an integral component of value-based company management.
Risk and opportunity managementEvery conscious business decision is based on weighing the associated risks and opportunities. Risk management in the Merck Group is supported by a uniform, corporate-wide system. Risk management activities are aimed at identifying risks at an early stage, and evaluating, controlling and managing them. In order to fulfill this task, we have defined and outlined corresponding roles and responsibilities throughout the Group in the form of binding guidelines.Within the scope of a standardized risk process, the current risk situation is reported to the Executive Board in six-month intervals or, in special cases, on an ad-hoc basis. The risk management system and compliance with the corresponding guidelines are reviewed regularly by the Internal Auditing department.Division-specific opportunities are identified, analyzed and managed in the respective divisions by means of suitable processes. Information on these opportunities, and particularly with respect to R & D activities, is given in more detail starting on page 34. In agreement with the Executive Board, it is ensured that opportunities are seized actively and in line with the corporate strategy. We discuss risks and opportunities further in the Report on Expected Developments starting on page 75.
Internal control system for the consolidated accounting processsThe objective of the internal control system for accounting is to implement controls that will provide assurance that financial statements are prepared in compliance with the relevant accounting laws and standards.As the parent company, Merck KGaA prepares the consolidated financial statements of the Merck Group. This process is preceded by financial reporting by the companies consolidated in the Group financial statements. Both processes are monitored via a stringent internal control system that ensures the accuracy of financial reporting as well as compliance with the relevant legal regulations.
The main features are as follows:− Accounting guidelines at both Group level as well as in the individual Group companies − Clearly defined segregation of duties and assignment of responsibilities to the units involved
in the financial reporting process− Involvement of external experts as needed, for example for the valuation of pension obligations− Use of suitable and largely uniform finance systems and the application of detailed authori-
zation concepts to limit user rights on a need-to-have basis, taking into account principles concerning the principle of segregation of duties
Merck Annual Report 200970

− System-based controls and further process controls for financial reporting in the companies, consolidation of the Group financial statements, and other relevant processes at Group and company level
– Consideration of risks recorded and assessed by the risk management system in the annual financial statements to the extent required by existing accounting rules
The respective heads of Finance of the Group companies are responsible for the implementation of these rules and utilization of the tools. The Group financial statements are the responsibility of the Chief Financial Officer and Member of the Executive Board of Merck KGaA. This responsi-bility is laid down in the rules of procedure of the Executive Board. All of the structures and processes described are subject to constant review by Internal Audit-ing. The Executive Board determines the structures and processes that are to be audited in an annual audit plan. The results of these audits are dealt with regularly in meetings of the Executive Board, the Supervisory Board and the Finance Committee.
Business-related risks Merck has integrated its risk management system into the ongoing business planning processes. Potential negative developments, for example changes in customer demand or new political framework conditions, are described and evaluated in the risk reports. We can, therefore, take countermeasures in good time, if any events should lead to deviations from the business plan. Risks in connection with investment decisions are minimized by the use of detailed guidelines.As of December 31, 2009, the Merck Group operated 54 production sites in 26 different coun-tries and took appropriate measures to minimize the risk of supply disruptions for important products. Total revenues and the operating result of the Merck Group depend on a large number of pharmaceutical and chemical products for various industry sectors. This diver-sification helps lower risk since the markets differ in terms of their structure and economic cycles. This is also an expression of the Merck strategy to remain an integrated pharmaceutical and chemical company.By continually monitoring market developments in the divisions and acting with appropriate foresight, we try to prepare for the potential risks of a changing market environment, such as from the global economic crisis continuing, from further health care cost containment measures or from new products from competitors. Merck is addressing changes in demand due to the economic situation, particularly with respect to the Chemicals business sector, by temporarily adjusting production capacities. The special risks of pharmaceutical development are constantly monitored by a portfolio and project management system introduced in the Merck Group. In the course of portfolio management, we regularly evaluate and, if necessary, refocus research areas and all R & D pipeline projects. As a research-based pharmaceutical company, Merck bears the risk of develop-ment projects having to be discontinued – in some cases after substantial investment – at a late phase of clinical development. Decisions – such as those relating to the transition to the next clinical phase – are made responsibly in order to minimize risk. Nevertheless, the danger still exists that undesirable side effects of a pharmaceutical product go undetected until after approval or registration, which could result in a restriction of approval or with-drawal from the market.
Merck is adhering to its strategy of being an integrated pharma-ceutical and chemical company.
company 71corporate governanceto our shareholders Further informationManagement Report consolidated Financial statements
Risk report
In many pharmaceutical markets, medications are subject to changing, increasingly restrictive requirements in terms of pricing, reimbursement and approval. These can negatively impact the profitability of our products and jeopardize the success of market launches and new approvals.
Financial risksMerck uses derivative financial instruments to minimize currency risks and financing costs caused by exchange rate or interest rate fluctuations. Finance transactions in foreign curren-cies are generally hedged. In certain cases, the company also hedges anticipated sales and future costs for a period of up to three years. More details are available in the consolidated financial statements starting on page 149.Material financial transactions involving credit risk are only entered into with banks that have a good credit rating and a minimum rating of A- from Standard & Poor’s. The rating of the commercial banks is constantly observed in order to quickly respond to deterioration. We have access to a € 2 billion syndicated multicurrency credit facility with 17 banks, which expires in 2014. The banks all have good credit ratings; however, a default risk of individual banks cannot be excluded. We have not arranged any financial covenants in our loan contracts, so the loans would still be available even if Merck’s credit rating were to deteriorate. Our long-term liquidity is ensured by our positive operating cash flow, centralized liquidity management within the Group and the available credit facility. In addition, Merck set up a debt issuance program in 2009 with a volume of € 5 billion. It forms the contractual basis for the issue of bonds. Due to its broad customer base, Merck is only exposed to a comparably low credit risk in its sales markets.The carrying values of individual items in the balance sheet are exposed to the risk of changing market and business circumstances and thus also to changes in fair values. The need for write-downs could significantly impact profit and lead to changes in balance sheet ratios. This applies in particular to the high level of intangible assets including goodwill, which have taken on increasing significance in the consolidated financial statements due to the acquisition of Serono in 2007 and the related purchase price allocation. For more information, see page 128. Merck has obligations in connection with pension plans. The majority of these obligations is covered by the provisions disclosed in the balance sheet, while the smaller remainder is externally funded or covered by long-term monetary investments for this purpose and disclosed in the balance sheet. The latter, which began in 2009, amounted to € 210 million. The obligations are regularly evaluated by preparing annual actuarial valuations. Changes in the valuation parameters, for example in the interest rate, salary increase rate or death probabilities, can influence the value of pension obligations. As far as pension obligations are covered by plan assets consisting of interest-bearing securities, shares, real estate and other financial assets, decreasing or negative returns on these assets can adversely impact the value of the plan assets and thus result in further funding requirements.
Merck’s long-term liquidity is ensured.
Merck Annual Report 200972

Assessments by independent rating agenciesThe capital market makes use the assessments published by rating agencies in order to assist lenders in evaluating the risks of a financial instrument. Merck is currently rated by the agencies Standard & Poor’s and Moody’s. In December 2009, Standard & Poor’s gave Merck a long-term rating of A-, with a stable outlook. In December 2009, Moody’s gave Merck a long-term rating of A3, with a stable outlook. Thus, both agencies confirm a stable investment grade rating for us.
Legal risksMerck is involved in legal proceedings and government investigations, the outcome of which cannot currently be predicted. We also continue to bear the risks from certain proceedings against companies of the Generics group that we sold to Mylan in 2007. Thus Merck continues to be responsible for risks arising from cases concerning drug pricing in the United States. In addition, the Merck Serono division is involved in a licensing dispute in Israel as well as a dispute with a former sales partner in Italy. In the United States, our subsidiary EMD Serono is discussing a settlement of a civil claim by the U.S. Department of Justice in relation to sales of a product. In Germany, Merck is involved in antitrust proceedings concerning the exclusive distribution agreement with the laboratory wholesale distributor VWR International. Due to a preliminary decision by the Higher Regional Court of Düsseldorf, Merck is obliged to supply several of the products in its Laboratory Business to other laboratory wholesalers in Germany as well. The company has taken all possible measures to protect its own legal position. Should individual products of the Merck Group prove to be defective and/or display undesirable side effects, this could lead to possible claims for damages and legal proceedings owing to product liability.As a research-based company, Merck has a valuable portfolio of industrial property rights, such as patents and brands. These can become the target of attacks and infringements. We have taken the necessary precautions to identify threats and defend our rights where necessary. Generally, Merck endeavors to prevent legal risks from arising.A compliance program applies to our employees worldwide, which enjoins them to comply with laws and guidelines, and provides them with the relevant training and support. The core of the program is the Merck Code of Conduct, which defines ethical behavior guidelines. This is complemented by a training and testing program, a SpeakUp Line for reporting compliance violations, as well as a global network of compliance officers.Insofar as possible and practical, the company limits liability and damage risks through insur-ance coverage, the type and scope of which is continually adjusted to current requirements.
Human resource risks Merck’s success is significantly influenced by the competence and commitment of its employees. Due to intensive competition, it is increasingly difficult to recruit and retain qualified specialists, particularly in the pharmaceutical sector.
As a research-based company, we actively protect our
patents and brands.
company 73corporate governanceto our shareholders Further informationManagement Report consolidated Financial statements
Risk report

We are meeting this challenge by continuously enhancing our wide range of international personnel marketing and development measures. Merck addresses specialists and executives by means of a Group-wide Talent & Succession Management, thereby minimizing turnover. This process helps to identify internal talent for management positions and facilitates the objective assessment and development of talent, thus enabling positions to be quickly filled with suitable employees as a result of targeted selection via a Merck-internal talent pool. We manage short-term vacancies by means of clearly defined, appropriate deputy regulations.Key factors for employee retention and satisfaction are identified and evaluated by means of regular, corporate-wide employee surveys. We derive measures from the results of these surveys and monitor their efficacy in follow-up surveys.A performance management system applicable to the whole Merck Group was introduced to better measure employee contributions to the company’s success. This is to facilitate a consistent assessment of the degree to which personal goals are achieved and the Merck Values are lived. On this basis, individual HR development measures are identified and implemented. This ensures that employees are prepared for new business challenges and are motivated to solve these challenges to the benefit of the company. The recently introduced Rewards Policy system complements this process by ensuring that performance-related payment components are handled consistently throughout the Group. The “Merck Long Term Incentive Plan” offers eligible executives and experts a long-term, profit-related compensation component. More information is available on page 138.
Information technology risksMerck ensures the necessary availability of business-critical application systems and access to business-relevant data – even in the event that individual components fail – by means of redundant structures of technical components, networks and sites, as well as suitable, tested contingency measures.Security guidelines are in place for the entire Merck Group. They include appropriate orga-nizational, technical and software-related precautions for access control, access rights, virus protection and data protection. The adherence to and efficacy of these measures are continu-ously monitored. A dedicated IT risk management process ensures that IT risks are evaluated and appropriate measures taken. This has been confirmed by successful ISO 9001, ISO 20000 and ISO 27001 certifications.
Environmental and safety risksGlobal adherence to high technical standards and rules of conduct prevents potential damage, minimizes the potential effects of such damage, and thus ensures the continuity of plant and equipment. Merck updates these preventive measures regularly. We systematically conduct health and environmental safety audits both in-house and at suppliers. Through inspections and consultation we minimize the risks to people and the environment.
Management’s assessment of the overall risk situationCurrently no risks can be identified that could jeopardize the continued existence of the Merck Group. This is the finding of this risk report, which was prepared in accordance with German Accounting Standard 5.
Talented specialists and executives are identified
early and developed.
Merck Annual Report 200974

In the Annual Report for 2008, Merck stated that the overall economic environment could not be assessed and refrained from providing an outlook, explaining the reasons for this decision in last year’s Report on Expected Developments. The German Financial Reporting Enforcement Panel (Deutsche Prüfstelle für Rechnungslegung – DPR) expressed the opinion that our financial reporting was flawed since the Report on Expected Developments allegedly did not correspond to the requirements of the German Commercial Code. The German Federal Financial Supervisory Authority (Bundesanstalt für Finanzdienstleistungsaufsicht – BaFin) concurred with the opinion of the Enforcement Panel. We are convinced, also in hindsight, that the paucity of attempts to provide an outlook at the beginning of 2009 justifies our decision. Merck has therefore appealed the decision of BaFin. The case has not yet been completed.The situation has changed in the meantime. Yet the financial and economic crisis is far from over and many developments still lack continuity.At the present time, it is exceptionally difficult but no longer impossible to make forecasts, as doing so involves a high degree of uncertainty.
Forecast on the development of the global economy Different sources have issued varying forecasts of the economic environment in which Merck operates. Common to all forecasts is that they assume growth in 2010, yet the stability of the recovery, which is often referred to as fragile, is unclear. In order to provide an overview and to document the differences between the forecasts, we are presenting the GNP growth forecasts by various institutes in the form of a table. In its predictions, Merck orients toward the forecasts of the Organization for Economic Cooperation and Development (OECD).
Forecasts by leading international organizations for 2010 and 2011 in comparison
Development of GDP (in %) Source 2010 2011
World IMF 3.9 4.3OECD 1.9 2.5
World Bank 2.7 3.2United States IMF 2.7 2.4
OECD 2.5 2.8World Bank 2.5 2.7
Japan IMF 1.7 2.2OECD 1.8 2.0
World Bank 1.3 1.8EU IMF 1.0 1.6
OECD 0.9 1.7World Bank 1.0 1.7
RepoRt on eXpected deVelopMentsFor 2010, Merck assumes that total revenues will grow between 3% and 7%.the operating result is expected to increase by 20% to 30%. For 2011, we expect further increases – in both total revenues and operating result.
company 75corporate governanceto our shareholders Further informationManagement Report consolidated Financial statements
Risk reportReport on expected developments

Forecasts by leading international organizations for 2010 and 2011 in comparison
Development of GDP (in %) Source 2010 2011
Germany IMF 1.5 1.9OECD 1.6 1.9
Eurostat 1.2 1.7China IMF 10.0 9.7
OECD 10.2 9.3World Bank 9.0 9.0
India IMF 7.7 7.8OECD 7.3 7.6
World Bank 7.5 8.0Brazil IMF 4.7 3.7
OECD 4.5 4.5World Bank 3.6 3.9
For the OECD’s 30 member countries, the OECD expects a global increase in gross domestic product (GDP) of 1.9% in 2010 and 2.5% in 2011. The U.S. economy is expected to grow by 2.5% in 2010 and by 2.8% in 2011. According to the forecasts, the economy of the euro zone is expected to grow slightly by 0.9% in 2010 and somewhat more strongly by 1.7% in 2011. In Germany, the OECD expects GDP to increase by 1.6% in 2010 and by 1.9% in 2011. For Japan, economists forecast GDP growth of 1.8% in 2010 and 2.0% in 2011. China remains the engine of the global upturn, owing to the fact that this country was affected by the financial crisis only to a limited extent and the government introduced a massive economic stimulus program. Uncertainty also dominates the forecasts regarding the expected unemployment figures. The EU Commission assumes a strong increase in unemployment mainly in Germany, where the unemployment rate is predicted to rise to 9.2% in 2010. The OECD expects unemployment to reach its highest level in the United States in mid-2010, however not until early 2011 in the euro zone, and not even until mid-2011 in Germany.
Assumptions made by the Merck forecastsOur forecasts for Merck take into account the company’s weighing up of risks and opportunities in accordance with our medium-term outlook and operational plans. These assume a moderate development of energy and raw material prices, as well as increasing personnel costs. Since we produce specialty chemicals, we are largely independent of oil price developments. Overall, we expect our businesses to see stable prices or market-oriented price increases. We only see ourselves exposed to significant price pressure in the Liquid Crystals division. The following forecast is based on the assumption of constant exchange rates. Possible acquisitions, divest-ments and exceptional items are not included in the calculation.
Growth in 2010 weakest in the euro zone in
international comparison.
Merck Annual Report 200976

Forecast for the Merck GroupAgainst the background of forecasts by leading economic research institutes and based on total revenues of € 7,747 million in 2009, Merck expects total revenues to increase in a range of 3% to 7%. We assume that the Group operating result of € 649 million in 2009 will increase by between 20% and 30%. We also expect profit after tax (excluding exceptional items) to increase. For 2011, we expect total revenues and the operating result to increase further. Profit after tax excluding potential exceptional items will likewise improve in this period. Merck had an equity ratio of 56.9% as well as low net debt of € 263 million in 2009. We expect to achieve similar capital ratios in the future. Following the very high level of € 852 million in 2009, underlying free cash flow is likely to be weaker in 2010, but will then return to a higher level. After a one-time high level in 2009, investments in property, plant and equipment will return to a more normal level for our company of between € 200 million and € 300 million during the period covered by this forecast. Merck will continue to increase research and development spending in 2010 and 2011, based on a level of € 1,345 million in 2009.
Merck forecast for 2010
in % Growth in total revenues Growth in operating result
Merck Group 3 to 7% 20 to 30% Merck Serono 2 to 5% 30 to 40% Consumer Health Care 5 to 10% –10 to 0% Liquid Crystals 5 to 10% 15 to 25% Performance & Life Science Chemicals 3 to 8% 15 to 20%
Merck has an extensive risk and opportunity management system, which is described in the Risk Report. Relative to the forecast period of two years published in the Report on Expected Developments, we mainly see business-related opportunities and risks – also against the background of the economic crisis that has not yet ended. Owing to the diversification and Merck’s broad product portfolio, a very different spectrum of important risks and opportunities result for each individual division.
Forecast for the pharmaceutical sector in generalThe market research institute IMS Health expects global sales of pharmaceuticals to increase in 2010 by 4% to 6% to between US$ 820 billion and US$ 830 billion.The U.S. market is expected to grow by the same rate in 2010 to a volume ranging between US$ 310 billion and US$ 320 billion. According to IMS Health, the five largest markets of Europe will grow in the range of 1% to 3% in 2010 and will achieve sales of between US$ 145 billion and US$ 155 billion. Market researchers expect developments in Japan to range from stagnation to a 2% decline, meaning that this market is likely to then have a volume of between US$ 86 billion and US$ 90 billion in 2010.According to the forecasts, up to 2013, the global pharmaceutical market will grow at an annual average rate of between 4% and 7% to a volume of up to US$ 1,005 billion. Up to 2013, the U.S. market alone is expected to expand by an average of 2% to 5% per year, while the five largest markets of Europe and Japan are expected to grow by between 1% and 4% annually. IMS Health sees the highest growth rates in emerging countries, which are expected to show average market growth of 13% to 16% per year to between US$ 160 billion and
The operating result is expected to increase by
20% to 30% in 2010.
company 77corporate governanceto our shareholders Further informationManagement Report consolidated Financial statements
Report on expected developments
US$ 190 billion. These include the four BRIC countries (Brazil, Russia, India and China) as well as Turkey, South Korea and Mexico. These seven countries will account for a 12% to14% share of the global pharmaceutical market in 2010. China’s pharmaceutical market is expected to grow more than 20% annually, accounting for a 21% share of global market volume by 2013. IMS Health expects China to supersede Germany as the world’s third-largest pharmaceutical market in 2011. In 2013, the United States will rank first, followed by Japan, China, Germany and France.
Forecast for the Merck Serono divisionFor the Merck Serono division, we expect an increase in total revenues in a range of between 2% and 5% in 2010, based on € 5,345 million in 2009. Regarding the operating result, following the low level of € 355 million in 2009, we want to achieve an increase ranging between 30% and 40%. Likewise, we expect both total revenues and the operating result to increase in 2011.The multiple sclerosis and cancer therapy markets are very important to Merck. IMS Health expects the global market for oncology medicines to grow by 13% in 2010 and by 10% in 2011. The importance of the markets of Europe and Japan will rise as the dominance of the U.S. market declines. Evaluate Pharma, another market research institute, expects that the market for oncology medicines will grow by an annual average rate of 6% to a volume of US$ 70 billion by 2014. Consequently, oncology is and will remain the largest prescription drug market. Evaluate Pharma estimates that the multiple sclerosis therapy market will increase by 5% annually up to 2014. With respect to research and development, as in 2009, for the Merck Serono division we will post a research ratio exceeding the target of 20%. This is attributable to the high number of clinical trials in Phase III, the final, most expensive stage of clinical testing prior to the submission of a marketing authorization application. Merck Serono currently has 23 projects in its development portfolio covering the therapeutic areas of Oncology, Neurodegenerative Diseases, Autoimmune and Inflammatory Diseases, and certain areas of Endocrinology.We see important opportunities and risks for the Merck Serono division closely linked to the successful launch of new products. The focus in 2010 and 2011 will be on the market launch of cladribine. As an oral therapy for the treatment of relapsing-remitting multiple sclerosis, cladribine tablets have high market potential and therefore represent significant opportunities for the division and for Merck as a whole. Yet cladribine is exposed to risks that are not to be underestimated up until its successful launch in individual markets. This generally applies also to all other compounds in this very advanced stage of pharmaceutical development. However, at this point in time, a conclusive statement may not yet be derived from the refuse to file letter issued by the U.S. Food and Drug Administration (FDA) for cladribine in the fourth quarter. Importantly, the refuse to file cannot be equated with a final rejection of marketing approval since we are closely coordinating with the FDA on a successful resubmission of the application. Aside from commercializing products we have developed in-house, opportunities and risks also exist with respect to product rights that are in- and out-licensed, as is customary in the pharmaceutical industry.Moreover, the existing business offers growth opportunities, particularly in markets such as Asia – especially China – Russia and Latin America, as well as in the further development of existing products (life cycle management), for example with new dosage forms.
Further growth in Merck Serono – also thanks to good market
development of cancer therapies.
Merck Annual Report 200978
Forecast for the Consumer Health Care divisionFor the Consumer Health Care division, we assume that total revenues will increase by between 5% and 10% in 2010. Our expectations for the division thus clearly exceed standard estimates by external market researchers. They expect that consumer purchasing restraint will continue in 2010 since consumers first start to cut voluntary spending and do not save on purchases of prescription medicines. Nicholas Hall, a market researcher specializing in the over the counter (OTC) drug market, assumes that global sales of OTC medicines will increase by 3.2% in 2010, while sales in Europe is expected grow by 1.9%. At 6.1%, Asia is expected to show comparatively strong growth, followed by Latin America at 4.2%. According to these forecasts, the Japanese OTC market is stagnating. Merck assumes that the operating result of the Consumer Health Care division will either remain unchanged or will decline by up to 10% in 2010. We are planning, in particular, to increase spending on research and marketing activities. Merck is optimistic that the division will increase total revenues and the operating result in 2011. Besides the development outlined, opportunities will arise for the division if economic recovery proceeds more quickly and consumer purchasing restraint recedes. Opportunities will also offer themselves if the division succeeds in accelerating the market launch of new products or in penetrating new regional markets. Risks for the business relate to the fact that against the backdrop of the ongoing economic crisis, consumers will continue to save on OTC products. Moreover, a changed health care policy framework could have a negative impact on the business.
Forecast for the chemical industry in generalThe German Chemical Industry Association (VCI) forecasts global chemical output will grow by 3.9% in 2010. This comprises growth of 4.3% in the European Union, 2.5% in the United States, and 3.9% in Japan. As in 2009, India and China will rank in the upper third, however with lower growth rates of 4.7% and 5.9%, respectively. For Brazil, the VCI forecasts growth in chemical output of 5.8%. The American Chemistry Council (ACC) estimates that output of the global chemical industry will increase by 4.6% in 2010 and by 5% in 2011. In the next two years, growth will primarily be driven by the emerging markets of Asia, Africa, the Middle East, eastern Europe and Latin America.
Forecast for the Liquid Crystals divisionMerck’s Liquid Crystals division operates in the display technology market. 2008 marked the year in which more new televisions with LCD technology were sold than cathode-ray devices. According to the market research institute DisplaySearch, the dominance of LCD TVs is increasing further. They are expected to account for 79% of all televisions sold in 2010 and 84% in 2011. For 2010, DisplaySearch forecasts a growth rate of 18% for the LCD TV module market in terms of display area. An increase of 15% is estimated for all LC applications in 2010. On this basis, for the Liquid Crystals division we expect a rise in total revenues of between 5% and 10%. We anticipate, in particular, improved market penetration of our new technologies.The operating result is expected to increase by between 15% and 25%. Also in 2011, we expect growth in total revenues. For the division’s operating result, Merck expects a stable development in 2011.
Consumer purchasing restraint will continue to impact OTC product sales.
company 79corporate governanceto our shareholders Further informationManagement Report consolidated Financial statements
Report on expected developments

suBseQuent eVentsThere were no material events at Merck after the balance sheet date.
Opportunities for the division beyond the outlined developments lie primarily in improved business of the display markets. As Merck is strongly positioned with its liquid crystals, a further upturn in business among display manufacturers will also quickly boost the division’s business performance. Being able to penetrate the market with our innovative PS-VA materials ahead of plan gives rise to additional business opportunities for the Liquid Crystals division. The most important risks regarding the developments outlined in the Report on Expected Develop-ments lie in growing price pressure in these market segments.
Forecast for the Performance & Life Science Chemicals divisionMerck expects total revenues of the Performance & Life Science Chemicals division to grow by between 3% and 8%. The operating result is expected to increase by between 15% and 20%. For 2011, Merck also expects growth in both total revenues and operating result. In the course of 2009, the performance of the Performance & Life Science Chemicals division was impacted by the economic crisis. In this division, the opportunities and risks regarding future developments continue to depend significantly on the extent of economic recovery in the chemical industry as a whole. We see opportunities for most of the product portfolio when the pharmaceutical and chemical industries further strengthen their research activities. Consequently, scaling up from research to production would additionally increase the demand for our products. By contrast, the opportunities and risks in the Pigments business are more strongly related to general consumer patterns. Therefore, developments in this business will be significantly influenced by demand from the automotive industry and its recovery from the economic crisis. However, other pigment applications in demand by, for example, the cosmetics industry are also highly dependent on consumer patterns.
Dividend developmentBased on our earnings expectations, the family of owners and Merck shareholders can expect to receive an earnings-oriented dividend. There are no plans to change the long-term dividend policy.
SummaryFor the Merck Group, we expect continuous growth in total revenues and operating result for the next two years – with continuing solid balance sheet ratios.
Growing market for LCD TVs improves the situation for
total revenues and the operating result in Liquid Crystals.
Merck Annual Report 200980

coRpoRAte GoVeRnAnce82 Statement on corporate governance82 Joint Report of the Executive Board and the Supervisory
Board (according to section 3.10 of the German Corporate Governance Code including Statement of Compliance)
85 Information on corporate governance practices86 Procedures of the Executive Board, Supervisory Board,
Board of Partners and its Committees93 Report of the Supervisory Board
81

stAteMent on coRpoRAte GoVeRnAncethe statement on corporate governance, which is now mandatory, contains the statement of compliance, relevant information on practices within the company as well as a description of the procedures of the most important corporate bodies.
JOINT REPORT OF THE ExECUTIvE BOARD AND THE SUPERvISORY BOARD (ACCORDING TO SECTION 3.10 OF THE GERMAN CORPORATE GOvERNANCE CODE INCLUDING STATEMENT OF COMPLIANCE)
The German Corporate Governance Code is geared exclusively toward the conditions at a German stock corporation (Aktiengesellschaft). Merck KGaA has resolved to apply the Code correspondingly to a corporation with general partners (Kommanditgesellschaft auf Aktien) to serve the interests of shareholders. In order to enable shareholders to compare the situation at other companies more easily, we base corporate governance on the conduct recommendations made by the Code Commission relating to management and supervision (governance) and forego having our own, equally permissible, code. With a few exceptions, the recommendations of the Code, the intent and meaning of which are applied, were complied with in the past and will continue to be complied with in the future.For a clearer understanding, the following gives a general explanation of the Kommanditgesellschaft auf Aktien (KGaA) company form followed by the specific situation at Merck.
Corporation with general partners (Kommanditgesellschaft auf Aktien)The corporation with general partners is a company which constitutes a separate legal entity, in which at least one partner has unlimited liability with regard to the creditors of the company (general partner) and the other shareholders are not personally liable for the obliga-tions of the company (limited shareholders) (section 278 (1) of the German Stock Corporation Act – AktG). It is therefore a hybrid of an Aktiengesellschaft (German stock corporation) and a Kommanditgesellschaft with a focus on German stock corporation law. Distinctive differences to the Aktiengesellschaft include the presence of general partners, who essentially also manage the company’s business activities, the absence of a management board, and the restriction of rights and obligations of the supervisory board (see pages 86 to 89 for a description of the supervisory board procedures). This legal form also involves special features with regard to the Annual General Meeting. For example, many of the resolutions made require the consent of the general partners (section 285 (2) AktG), including the adoption of the annual financial statements (section 286 (1) AktG). A large number of the conduct recommendations contained in the Code, which is geared toward Aktiengesellschaften, can therefore only be applied to a KGaA as appropriate.
The KGaA is a hybrid of an Aktiengesellschaft and a Kommanditgesellschaft.
Merck Annual Report 200982

Merck KGaAThe general partner E. Merck KG holds around 70% of the total capital of Merck KGaA (equity interest); the shareholders hold the remainder, which is divided into shares (share capital). E. Merck KG is excluded from the management of business activities. The general partners with no equity interest (Executive Board), on the other hand, manage business activities. Nevertheless, due to its substantial capital investment and unlimited personal liability, E. Merck KG has a strong interest in the businesses of Merck KGaA operating efficiently and in compliance with procedures, and exercises its influence accordingly. Merck KGaA’s participa-tion in the profit/loss of E. Merck KG in accordance with articles 26 et seq. of the Articles of Association further harmonizes the interests of the shareholders and of E. Merck KG.E. Merck KG appoints and dismisses the Executive Board. In addition, E. Merck KG has created bodies – complementing the expertise and activities of the Supervisory Board – to monitor and advise the Executive Board. This task applies primarily to the Board of Partners of E. Merck KG. Based on the provisions of the German Stock Corporation Act, the Articles of Association of Merck KGaA and the rules of procedure of the various committees, Merck KGaA has a set of rules for the Executive Board and its supervision that meet the requirements of the Code. The investors, who bear the entrepreneurial risk, are protected as provided for by the Code.
This is illustrated by the following chart:
Total capital Merck KGaA€ 565,211,241.95
Share capital€ 168,014,927.60
Equity interest € 397,196,314.35
Limited liability shareholders General partner E. Merck KG (with equity interest)
Annual General Meeting
Supervisory Board16 members (Sections 1, 7 MitbestG*)
Board of Partners E. Merck KG; 9 membersPersonnel Committee, Finance Committee,
R & D Committee
General partners with no equity interest(with power of management and representation)
= Executive Board Merck KGaA*German co-determination Act
company 83to our shareholders Further informationconsolidated Financial statementscorporate governanceManagement Report
statement on corporate governance

Deviations from the Corporate Governance Code:1. Contrary to section 3.8 (2), the Directors & Officers (“D&O”) liability insurance policy, which Merck
KGaA maintains for its Supervisory Board members, currently does not include a deductible. The company dispensed with a deductible in the past because D&O insurance policies with the required deductible were not actively offered by the insurance sector and the individual agreement on a deductible is not countered by a substantial reduction in the premium. On July 1, 2010, Merck KGaA will introduce a deductible in accordance with section 3.8 (2) of the Code.
2. Contrary to section 5.4.1 sentence 2, no age limit is taken into account when proposing candidates for election to the Supervisory Board. The age of Supervisory Board members is not a criterion for their qualifications and competence. Moreover, the many years of experience of Supervisory Board members should not be dispensed with.
3. Contrary to section 5.4.6 (3), the compensation of the Supervisory Board members is not reported individually. The amount of compensation received by the Supervisory Board members can be calculated in accordance with the Articles of Association of Merck KGaA, making a separate disclosure of the individual compensation unnecessary.
Main features of the Executive Board compensation system(Section 4.2.5 of the German Corporate Governance Code) The compensation paid to the general partners, who make up the Executive Board of Merck KGaA, is composed of salary payments (fixed portion), profit sharing and additions to pension provisions. Profit sharing is based on the rolling three-year average of profit after tax of the E. Merck Group. Payments in fiscal 2009 were as follows: fixed salary € 3.5 million, profit sharing € 4.0 million.
Compensation of Supervisory Board members(Section 5.4.6 of the German Corporate Governance Code)Subject to the approval of the Annual General Meeting on the proposed distribution of a dividend of € 1.00 per share, the compensation of the Supervisory Board in 2009 amounting to € 435 thousand consists of a fixed portion of € 123 thousand and a variable portion of € 312 thousand.
Ownership, purchase or sale of shares in the company by members of the Executive Board and the Supervisory Board(Section 6.6 of the German Corporate Governance Code)As of December 31, 2009, the members of the Executive Board and the Supervisory Board held 20,106 shares. Their total ownership represents less than 1% of the issued shares of Merck KGaA.In fiscal 2009, Merck KGaA reported the following transactions by members of the Executive Board and the Supervisory Board according to section 15a of the German Securities Trading Act:
Merck Annual Report 200984
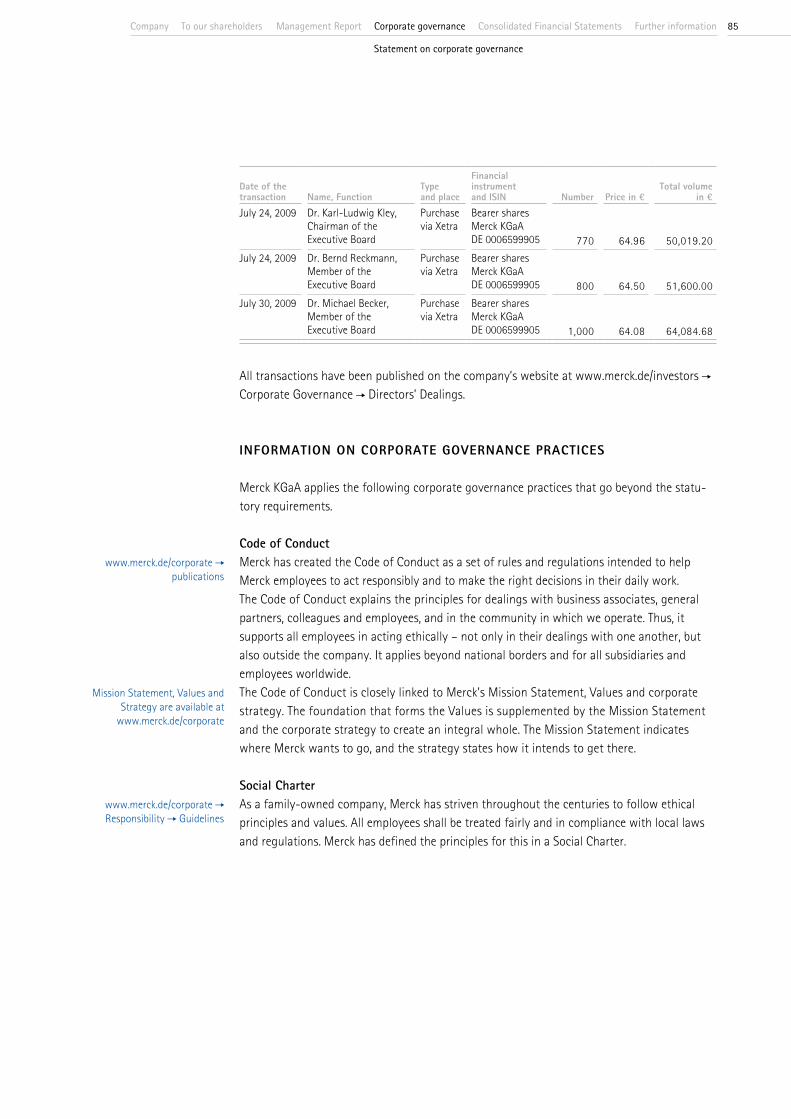
Date of the transaction Name, Function
Type and place
Financial instrument and ISIN Number Price in €
Total volume in €
July 24, 2009 Dr. Karl-Ludwig Kley, Chairman of the Executive Board
Purchase via Xetra
Bearer shares Merck KGaA DE 0006599905 770 64.96 50,019.20
July 24, 2009 Dr. Bernd Reckmann, Member of the Executive Board
Purchase via Xetra
Bearer shares Merck KGaA DE 0006599905 800 64.50 51,600.00
July 30, 2009 Dr. Michael Becker, Member of the Executive Board
Purchase via Xetra
Bearer shares Merck KGaA DE 0006599905 1,000 64.08 64,084.68
All transactions have been published on the company’s website at www.merck.de/investors Corporate Governance Directors’ Dealings.
INFORMATION ON CORPORATE GOvERNANCE PRACTICES
Merck KGaA applies the following corporate governance practices that go beyond the statu-tory requirements.
Code of Conduct Merck has created the Code of Conduct as a set of rules and regulations intended to help Merck employees to act responsibly and to make the right decisions in their daily work. The Code of Conduct explains the principles for dealings with business associates, general partners, colleagues and employees, and in the community in which we operate. Thus, it supports all employees in acting ethically – not only in their dealings with one another, but also outside the company. It applies beyond national borders and for all subsidiaries and employees worldwide. The Code of Conduct is closely linked to Merck’s Mission Statement, Values and corporate strategy. The foundation that forms the Values is supplemented by the Mission Statement and the corporate strategy to create an integral whole. The Mission Statement indicates where Merck wants to go, and the strategy states how it intends to get there.
Social CharterAs a family-owned company, Merck has striven throughout the centuries to follow ethical principles and values. All employees shall be treated fairly and in compliance with local laws and regulations. Merck has defined the principles for this in a Social Charter.
www.merck.de/corporate publications
Mission Statement, Values and Strategy are available at
www.merck.de/corporate
www.merck.de/corporate Responsibility Guidelines
company 85to our shareholders Further informationconsolidated Financial statementsManagement Report corporate governance
statement on corporate governance
PROCEDURES OF THE ExECUTIvE BOARD, SUPERvISORY BOARD, BOARD OF PARTNERS AND ITS COMMITTEES
Executive Board
Member
Memberships in (a) other statutory supervisory boards and (b) comparable German and foreign supervisory bodies of corporations
Dr. Karl-Ludwig Kley Darmstadt Chairman
(a) – Bertelsmann AG, Gütersloh – BMW AG, Munich – 1. FC Köln GmbH & Co KGaA, Cologne (Chairman)
Dr. Michael Becker Darmstadt
no board positions
Dr. Bernd Reckmann Seeheim-Jugenheim
no board positions
Elmar Schnee Darmstadt
(b) Member of the Board of Directors: – ChemGenex Pharmaceuticals Ltd., Geelong, Australia – Arpida Ltd., Reinach, Switzerland (until Dec. 10, 2009) – Merck Serono S.A., Coinsins, Switzerland
The general partners with no equity interest (Executive Board) manage the business activities in accordance with the laws, the Articles of Association and their rules of procedure. They are appointed by E. Merck KG with the consent of a simple majority of the other general partners. The members of the Executive Board are jointly responsible for the entire management of the company. The Executive Board is responsible for preparing the annual financial statements of Merck KGaA, the quarterly and half-year and annual financial statements of the Merck Group. In addition, the Executive Board ensures that all statutory provisions, official regulations and the company’s internal policies are abided by, and works to achieve their compliance by all the companies of the Merck Group.The Executive Board provides the Supervisory Board with regular, up-to-date and comprehensive reports about all company-relevant issues concerning planning, business developments, the risk situation and risk management. A Supervisory Board resolution regulates further details of the information and reporting duties of the Executive Board vis-à-vis the Supervisory Board. The Executive Board informs the Board of Partners and the Supervisory Board at least quarterly of the progress of business and the situation of the company. In addition, the Executive Board informs the stated boards at least annually of the company’s annual plans and strategic considerations.The Executive Board passes its resolutions in meetings that are normally held twice a month.
Details on responsibilities and CVs are online at
www.merck.de/Executive Board
Merck Annual Report 200986

Supervisory Board
Member
Memberships in (a) other statutory supervisory boards and (b) comparable German and foreign supervisory bodies of corporations
Prof. Dr. Dr. h. c. Rolf KrebsMainz Retired physician Chairman(as of July 23, 2009)
(a) – Epigenomics AG, Berlin (Chairman) – Ganymed Pharmaceuticals AG, Mainz (Chairman) – Merz GmbH & Co. KGaA, Frankfurt – Senator GmbH & Co KGaA, Frankfurt – Merz Pharmaceuticals GmbH, Frankfurt
(b) – Board of Partners E. Merck KG, Darmstadt – Air Liquide S.A., Paris, France
Prof. Dr. rer. nat. Wilhelm SimsonMunich Graduate chemist, Chairman(until June 30, 2009)
(a) – E.ON AG, Düsseldorf – Hochtief AG, Essen – Frankfurter Allgemeine Zeitung GmbH, Frankfurt
(b) – Board of Partners E. Merck KG, Darmstadt (until June 30, 2009) – Partners’ Committee Freudenberg & Co., Weinheim – Board of Directors Jungbunzlauer Holding AG, Chur, Switzerland
Heiner WilhelmReinheimChairman of the Works Council of the Darmstadt site of Merck KGaA, Vice Chairman
no board positions
Crocifissa AttardoDarmstadt Full-time member of the Works Council of the Darmstadt site of Merck KGaA(as of Oct. 1, 2009)
no board positions
Dr. Mechthild AugeWehrheim Project manager for planning and information western Europe (as of March 25, 2009)
no board positions
Johannes BaillouVienna, Austria Entrepreneur
(b) – Board of Partners E. Merck KG, Darmstadt (as of June 27, 2009; Vice Chairman as of July 22, 2009)
Frank BinderZurich, Switzerland Entrepreneur
(a) – Landbell AG für Rückhol-Systeme, Mainz (Chairman)(b) – Board of Partners E. Merck KG, Darmstadt (as of June 27, 2009)
– Board of Directors BMR-Yachting AG, Zurich (Chairman) – Board of Directors Athena AG, Zurich
Dr. Daniele Bruns Darmstadt Head of Safety and Environment(until March 25, 2009)
no board positions
Dr. Wolfgang BücheleMannheim Chief Executive Officer of BorsodChem Zrt, Hungary(as of July 1, 2009)
(b) – Board of Partners E. Merck KG, Darmstadt (as of July 1, 2009) – BorsodChem Zrt, Kazincbarcika, Hungary (Chairman of the Board) – Kemira Oij, Helsinki, Finland
Judith DelpFischbachtal Chairperson of the Works Council of Merck Pharma GmbH(until March 25, 2009)
no board positions
company 87to our shareholders Further informationconsolidated Financial statementscorporate governanceManagement Report
statement on corporate governance

Member
Memberships in (a) other statutory supervisory boards and (b) comparable German and foreign supervisory bodies of corporations
Claudia FlauausAlsbach-HähnleinVice Chairperson of the Works Council of the Darmstadt site of Merck KGaA(until Sept. 30, 2009)
no board positions
Michael FletterichGernsheim Chairman of the Works Council of the Gernsheim site of Merck KGaA
no board positions
Edeltraud GlänzerWiesbaden Member of the Managing Board of Industriegewerkschaft Bergbau, Chemie, Energie (IG BCE)
(a) – Abbott Management GmbH/Abbott Holding GmbH, Ludwigshafen (until Jan. 31, 2009) – B. Braun Melsungen AG, Melsungen – Solvay Deutschland GmbH, Hannover
(Vice Chairman)Michaela Freifrau von GlenckZurich, SwitzerlandEducator
no board positions
Frieder KaufmannRoßdorf Full-time member of the Works Council of the Darmstadt site of Merck KGaA
no board positions
Dr. Hans-Jürgen Leuchs Cobham, United Kingdom Retired graduate chemist(as of July 1, 2009)
(a) – Zeton B.V., Enschede, The Netherlands (as of Oct. 15, 2009)(b) – Board of Partners E. Merck KG (as of July 1, 2009)
Albrecht Merck SchriesheimBusinessman
(b) – Board of Partners E. Merck KG, Darmstadt
Dr. Arend OetkerBerlin Managing Partner of Dr. Arend Oet-ker Holding GmbH & Co. KG, Berlin (until June 30, 2009)
(a) – Schwartauer Werke GmbH & Co. KGaA, Bad Schwartau (Chairman) – Cognos AG, Hamburg (Chairman) – KWS Saat AG, Einbeck (Vice Chairman)
(b) – Board of Partners E. Merck KG, Darmstadt (until June 30, 2009) – Supervisory Board Leipziger Messe GmbH, Leipzig – Supervisory Board Berliner Philharmonie GmbH, Berlin (Chairman) – Board of Directors Hero AG, Lenzburg, Switzerland (President) – Board of Directors Bâloise Holding AG, Basel, Switzerland
(until April 30, 2009)Dr. Karl-Heinz ScheiderGross-Zimmern Chemist (as of March 25, 2009)
no board positions
Prof. Dr. Theo SiegertDüsseldorf Managing Partner of de Haen Carstanjen & Söhne, Düsseldorf
(a) – Deutsche Bank AG, Frankfurt – ERGO AG, Düsseldorf – E.ON AG, Düsseldorf – Henkel AG & Co KGaA, Düsseldorf (as of April 2009)
(b) – Board of Partners E. Merck KG, Darmstadt – Board of Directors DKSH Holding Ltd., Zurich, Switzerland
Osman Ulusoy WiesbadenRegional Director of Indus-triegewerkschaft Bergbau, Chemie, Energie (IG BCE)
(a) – Evonik Röhm GmbH, Darmstadt (Vice Chairman)
Merck Annual Report 200988
The Supervisory Board performs a monitoring function. It supervises the management of the company by the Executive Board. In comparison with the supervisory board of a German stock corporation, the role of the supervisory board of a corporation with general partners (KGaA) is limited. This is due to the fact that the members of the Executive Board are personally liable partners and therefore are responsible for the management of the company themselves. In particular, the Supervisory Board is not responsible for appointing and dismissing general partners or for regulating the terms and conditions of their contracts. The authority for this belongs to E. Merck KG.Nor does the Supervisory Board have the authority to issue rules of procedure for the Executive Board or a catalog of business transactions requiring approval. This authority likewise belongs to E. Merck KG (Art. 13 (3) sentence 1 and (4) sentence 1 of the Articles of Association).However, the fact that the Supervisory Board has no possibilities to directly influence the Executive Board restricts neither its information rights nor audit duties. The Supervisory Board must oversee the Executive Board in terms of legality, regularity, usefulness and economic efficiency. In particular, the Supervisory Board has the duty to examine the reports provided at least quarterly by the Executive Board about the progress of business – in particular sales and the position of the company. In addition, by means of consultation with the Executive Board, it creates the basis for the Supervisory Board to monitor the management of the company according to section 111 (1) AktG.The Supervisory Board deals with the quarterly and half-year consolidated financial statements and examines the annual financial statements of the Merck Group as well as of Merck KGaA, taking into account the auditor’s reports. The adoption of the annual financial statements is not the responsibility of the Supervisory Board, but of the Annual General Meeting. The Supervisory Board normally meets four times a year. Further meetings may be convened if demanded by a member of either the Supervisory Board or the Executive Board. As a rule, resolutions of the Supervisory Board are passed at meetings. At the instruction of the chairman, in exceptional cases a resolution may be passed by other means, details of which are given in the rules of procedure.The members of the Board of Partners of E. Merck KG and of the Supervisory Board may be convened to a joint meeting if so agreed by the chairmen of the two boards.The rules of procedure prescribe that the Supervisory Board may form committees as and when necessary. The Supervisory Board currently has no committees. Because of the limited authority of the Supervisory Board, it does not appear appropriate to subdivide it further.
company 89to our shareholders Further informationconsolidated Financial statementsManagement Report corporate governance
statement on corporate governance

Board of Partners of E. Merck KGSome of the responsibilities that lie with the supervisory board of a German stock corporation are fulfilled at Merck by E. Merck KG. This applies primarily to the Board of Partners of E. Merck KG. Therefore, the Board of Partners and the composition and procedures of its committees are described in the following.The Board of Partners has nine members: Dr. Frank Stangenberg-Haverkamp (Chairman), Johannes Baillou (Vice Chairman), Jon Baumhauer, Frank Binder, Dr. Wolfgang Büchele, Prof. Dr. Dr. h.c. Rolf Krebs, Dr. Hans-Jürgen Leuchs, Albrecht Merck and Prof. Dr. Theo Siegert.The Board of Partners supervises the Executive Board in its management of the company. It informs itself about the business matters of Merck KGaA, and may inspect and examine the company’s accounts, other business documents, and assets for this purpose. The Board of Partners convenes as and when necessary, however it meets at least four times a year. The members of the Executive Board of Merck KGaA are invited to all meetings of the Board of Partners, unless the Board of Partners resolves otherwise in individual cases. The members of the Board of Partners may convene a joint meeting with the Supervisory Board of Merck KGaA if so agreed by the chairmen of the two boards.The Board of Partners may confer the responsibility for individual duties to committees. Currently the Board of Partners has three committees in place: the Personnel Committee, the Finance Committee, and the Research and Development Committee.
The Personnel Committee has four members:
Member
Memberships in (a) other statutory supervisory boards and (b) comparable German and foreign supervisory bodies of corporations
Jon BaumhauerMunichChairman of the Executive Board and General Partner of E. Merck KG
no board positions
Prof. Dr. Dr. h.c. Rolf KrebsMainzRetired physician
(a) – Supervisory Board of Merck KGaA, Darmstadt (Chairman as of July 23, 2009) – Epigenomics AG, Berlin (Chairman) – Ganymed Pharmaceuticals AG, Mainz (Chairman) – Merz GmbH & Co. KGaA, Frankfurt – Senator GmbH & Co KGaA, Frankfurt – Merz Pharmaceuticals GmbH, Frankfurt
(b) – Air Liquide S.A., Paris, FranceProf. Dr. Theo SiegertDüsseldorfManaging Partner of de Haen Carstanjen & Söhne
(a) – Supervisory Board of Merck KGaA, Darmstadt – Deutsche Bank AG, Frankfurt – ERGO AG, Düsseldorf – E.ON AG, Düsseldorf – Henkel AG & Co KGaA, Düsseldorf (as of April 2009)
(b) – Board of Directors of DKSH Holding Ltd., Zurich, Switzerland
Dr. Frank Stangenberg-HaverkampDarmstadt Vice Chairman of the Executive Board and General Partner of E. Merck KG
(a) – Fortas AG, Rösrath(b) – Travel Asset Group Ltd., Feltham, United Kingdom
Merck Annual Report 200990
The Personnel Committee is convened as and when necessary. Meetings of the Personnel Committee are attended by members of the Executive Board of Merck KGaA upon request of the Committee. They attend only in an advisory capacity.The Personnel Committee is responsible, among other things, for the following decisions concerning members and former members of the Executive Board: Contents of contracts of employment and of pension contracts, granting of loans and advance payments, approval to take on honorary offices, board positions and other sideline activities, as well as division of responsibilities within the Executive Board of Merck KGaA. The Personnel Committee passes its resolutions by a simple majority – in matters concerning the Chairman of the Executive Board unanimity is required. The Personnel Committee regularly informs the Board of Partners of its activities.
The Finance Committee has four members:
Member
Memberships in (a) other statutory supervisory boards and (b) comparable German and foreign
supervisory bodies of corporationsJohannes BaillouVienna, AustriaEntrepreneur
(a) – Supervisory Board of Merck KGaA, Darmstadt
Dr. Wolfgang BücheleMannheimCEO BorsodChem Zrt., Hungary
(a) – Supervisory Board of Merck KGaA, Darmstadt (as of July 1, 2009)
(b) – BorsodChem Zrt., Kazincbarcika, Hungary (Chairman of the Board)
– Kemira Oij, Helsinki, FinlandProf. Dr. Theo SiegertDüsseldorfManaging Partner of de Haen-Carstanjen & Söhne
(a) –Supervisory Board of Merck KGaA, Darmstadt – Deutsche Bank AG, Frankfurt – ERGO AG, Düsseldorf – E.ON AG, Düsseldorf – Henkel AG & Co KGaA, Düsseldorf (as of April 2009)
(b) – Board of Directors of DKSH Holding Ltd., Zurich, Switzerland
Dr. Frank Stangenberg-HaverkampDarmstadtVice Chairman of the Executive Board and General Partner of E. Merck KG
(a) – Fortas AG, Rösrath(b) – Travel Asset Group Ltd., Feltham, United Kingdom
The Finance Committee holds at least four meetings a year, two of which are joint meetings with the auditor. Further meetings are convened as and when necessary. Meetings of the Finance Committee are attended by members of the Executive Board of Merck KGaA upon request of the Committee. The Chairman of the Executive Board and the Chief Financial Officer regularly attend these meetings. The members of the Executive Board attend only in an advisory capacity. The Finance Committee is responsible, among other things, for analyzing and discussing the annual financial statements and the respective auditor’s report as well as the quarterly and half-year financial reports. In addition, it deals with the financial position, results of operations and liquidity of Merck as well as accounting issues. It examines and gives recommendations on investments requiring the approval of the Board of Partners.
company 91to our shareholders Further informationconsolidated Financial statementsManagement Report corporate governance
statement on corporate governance
The Research and Development Committee has three members:
Member
Memberships in (a) other statutory supervisory boards and (b) comparable German and foreign
supervisory bodies of corporationsProf. Dr. Dr. h.c. Rolf KrebsMainzRetired physician
(a) – Supervisory Board of Merck KGaA, Darmstadt (Chairman as of July 23, 2009) – Epigenomics AG, Berlin (Chairman) – Ganymed Pharmaceuticals AG, Mainz (Chairman) – Merz GmbH & Co. KGaA, Frankfurt – Senator GmbH & Co KGaA, Frankfurt – Merz Pharmaceuticals GmbH, Frankfurt
(b) – Air Liquide S.A., Paris, FranceDr. Hans-Jürgen LeuchsCobham, United KingdomRetired graduate chemist
(a) – Supervisory Board of Merck KGaA, Darmstadt (as of July 1, 2009)(b) – Zeton B.V., Enschede, The Netherlands (as of Oct. 15, 2009)
Dr. Frank Stangenberg-HaverkampDarmstadt,Vice Chairman of the Executive Board and General Partner of E. Merck KG
(a) – Fortas AG, Rösrath(b) – Travel Asset Group Ltd., Feltham, United Kingdom
The Research and Development Committee is convened as and when necessary, but holds full-day meetings at least twice a year. Meetings of the Research and Development Committee are attended by members of the Executive Board of Merck KGaA upon request of the Committee. These meetings regularly include the Chairman of the Executive Board for the members of the Executive Board responsible for Pharmaceuticals and Chemicals. The members of the Executive Board attend only in an advisory capacity. The Research and Development Committee is responsible, among other things, for analyzing and discussing the research activities of Pharmaceuticals and Chemicals. The Pharmaceuticals and Chemicals business sectors present the status of their respective research to the Research and Develop-ment Committee in special meetings. The Committee deals thoroughly with the pharmaceutical research progress report and with developments of new medicines in Phases II and III of clinical research. The Research and Development Committee reports to the Board of Partners twice a year on the insights gained from the meetings held.
Merck Annual Report 200992

RepoRt oF the supeRVisoRy BoARd
During fiscal 2009, the Executive Board provided the Supervisory Board with regular written and verbal reports on the business development of Merck KGaA and the Merck Group. In particular, the Supervisory Board was informed about the market and sales situation of the company against the background of macroeconomic developments, the financial position of the company and its subsidiaries, as well as their earnings development and corporate planning. The major business policy transactions were also discussed in four joint meetings with the Executive Board, specifically the company’s reaction to the economic crisis. Permanent Supervisory Board committees do not exist. The annual financial statements of Merck KGaA, the consolidated financial statements of the Merck Group, and the management reports for Merck KGaA and the Merck Group, including the accounts, were audited by KPMG AG Wirtschaftsprüfungsgesellschaft. The auditors issued an unqualified audit opinion on the annual financial statements and management report for Merck KGaA in accordance with German Auditing Standards. For the consolidated financial statements prepared in accordance with International Financial Reporting Standards, the auditors issued the auditor’s report, reproduced in the Annual Report of the Merck Group. In addition, the auditors audited the calculation of Merck KGaA’s participation in the profits of E. Merck KG in accordance with Art. 27 (2) of the Articles of Association. The annual financial statements of Merck KGaA, the consolidated financial statements of the Merck Group, the management reports for Merck KGaA and the Merck Group, and the proposal by the Executive Board for the appropriation of the net retained profit were presented and distributed to the Supervisory Board, together with the auditor’s reports. In accordance with Art. 14 (2) of the Articles of Association, the Supervisory Board also examined the annual financial statements of Merck KGaA and the management report for Merck KGaA, the proposal for the appropriation of the net retained profit and the auditor’s report presented in accordance with Art. 27 (2) of the Articles of Association. It also examined the consolidated financial statements of the Merck Group, the management report for the Merck Group, and took note of the auditor’s report by KPMG AG Wirtschaftsprüfungsgesellschaft. The discussion of the relevant agenda item at the Supervisory Board’s meeting on February 18, 2010 to approve the financial statements was also attended by the auditors who sign the audit opinion on the annual financial statements of Merck KGaA and the consolidated financial statements of the Merck Group, who reported on their audit. The Supervisory Board took note of and approved the results of the audit. On completion of its examination, the Supervisory Board raised no objections and thus approved the annual financial statements and management report for Merck KGaA, the consolidated financial statements of the Merck Group and the management report for the Merck Group prepared by the Executive Board, as well as the report presented by the auditors in accordance with Art. 27 (2) of the Articles of Association. The Supervisory Board gives its consent to the proposal for the appropriation of net retained profit.
company 93to our shareholders Further informationconsolidated Financial statementsManagement Report corporate governance
statement on corporate governanceReport of the supervisory Board

In 2009, the following changes were made to the Supervisory Board. New elections of employee representatives to the Supervisory Board took place. On March 25, 2009, Mr. Heiner Wilhelm, Dr. Mechthild Auge, Ms. Claudia Flauaus, Mr. Michael Fletterich and Mr. Frieder Kaufmann as employee representatives, Dr. Karl-Heinz Scheider as senior executive representative, and Ms. Edeltraud Glänzer and Mr. Osman Ulusoy as union representatives were elected to the Supervisory Board. At the Supervisory Board’s meeting on April 27, 2009, Mr. Heiner Wilhelm was elected Vice Chairman of the Supervisory Board. In a letter dated December 9, 2008, Professor Dr. Wilhelm Simson and Dr. Arend Oetker resigned from their positions as Members of the Supervisory Board effective June 30, 2009. At the Annual General Meeting of Merck KGaA on April 3, 2009, Dr. Wolfgang Büchele and Dr. Hans-Jürgen Leuchs were elected as successors to Professor Simson and Dr. Oetker. Professor Simson was Chairman of the Supervisory Board. In the meeting on July 23, 2009, Professor Dr. Rolf Krebs was elected to become the new Chairman of the Supervisory Board. Ms. Flauaus resigned from her position as Member of the Supervisory Board effective September 30, 2009. She was succeeded as an employee representative by Ms. Crocifissa Attardo. The General Partner E. Merck KG, the Supervisory Board and the Executive Board thanked Professor Simson, Dr. Oetker and Ms. Flauaus, who each served as Members of the Supervisory Board for many years, for their critical and constructive as well as objective work in advising and supervising the Executive Board of Merck KGaA.
Darmstadt, February 18, 2010 The Supervisory Board of Merck KGaA
Professor Dr. Dr. h.c. Rolf KrebsChairman
Merck Annual Report 200994
ConSolidAted FinAnCiAl StAtementS 96 income Statement 97 Balance Sheet 98 Segment Reporting 100 Cash flow Statement101 free Cash flow101 Statement of Comprehensive income102 Statement of Changes in Net equity
including minority interest103 Notes104 Scope of consolidation107 Accounting policies116 Notes to the income statement123 Notes to the balance sheet 144 Notes to the segment reporting145 Notes to the cash flow statement147 Other disclosures
95
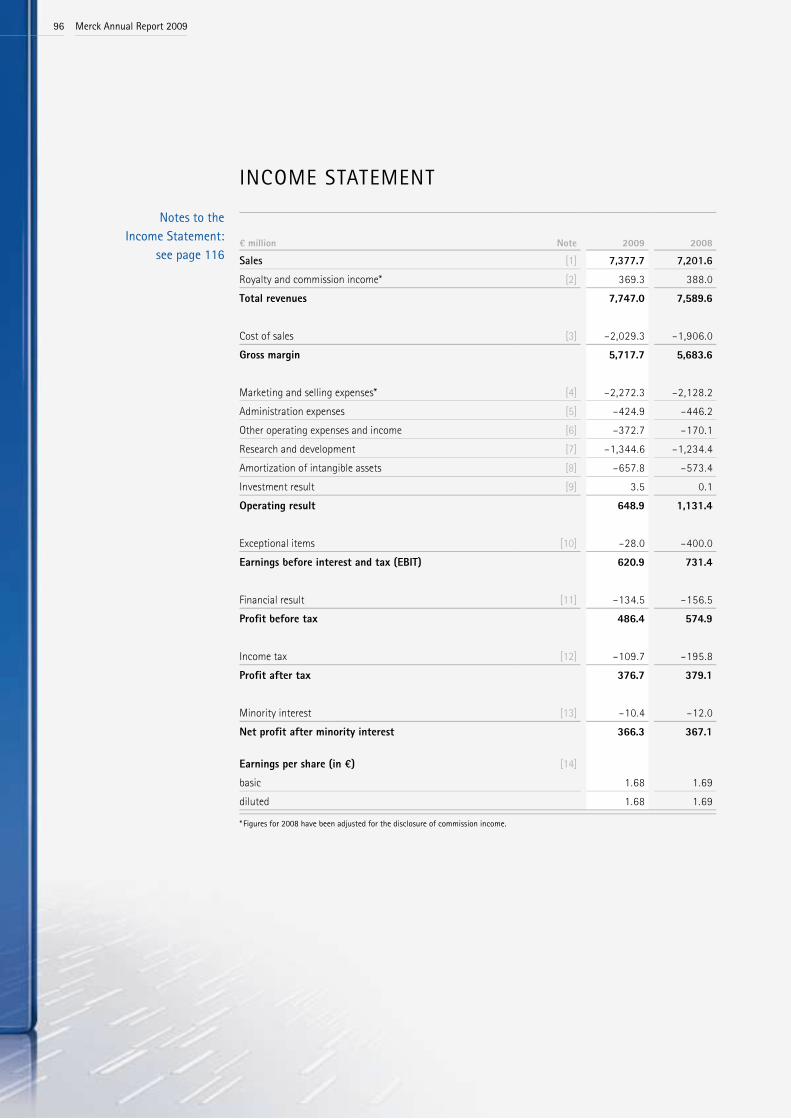
inCome StAtement
€ million Note 2009 2008
Sales [1] 7,377.7 7,201.6Royalty and commission income* [2] 369.3 388.0Total revenues 7,747.0 7,589.6
Cost of sales [3] –2,029.3 –1,906.0Gross margin 5,717.7 5,683.6
Marketing and selling expenses* [4] –2,272.3 –2,128.2Administration expenses [5] –424.9 –446.2Other operating expenses and income [6] –372.7 –170.1Research and development [7] –1,344.6 –1,234.4Amortization of intangible assets [8] –657.8 –573.4Investment result [9] 3.5 0.1Operating result 648.9 1,131.4
Exceptional items [10] –28.0 –400.0Earnings before interest and tax (EBIT) 620.9 731.4
Financial result [11] –134.5 –156.5Profit before tax 486.4 574.9
Income tax [12] –109.7 –195.8Profit after tax 376.7 379.1
Minority interest [13] –10.4 –12.0Net profit after minority interest 366.3 367.1
Earnings per share (in €) [14]basic 1.68 1.69diluted 1.68 1.69
* Figures for 2008 have been adjusted for the disclosure of commission income.
notes to theincome Statement:
see page 116
merck Annual Report 200996
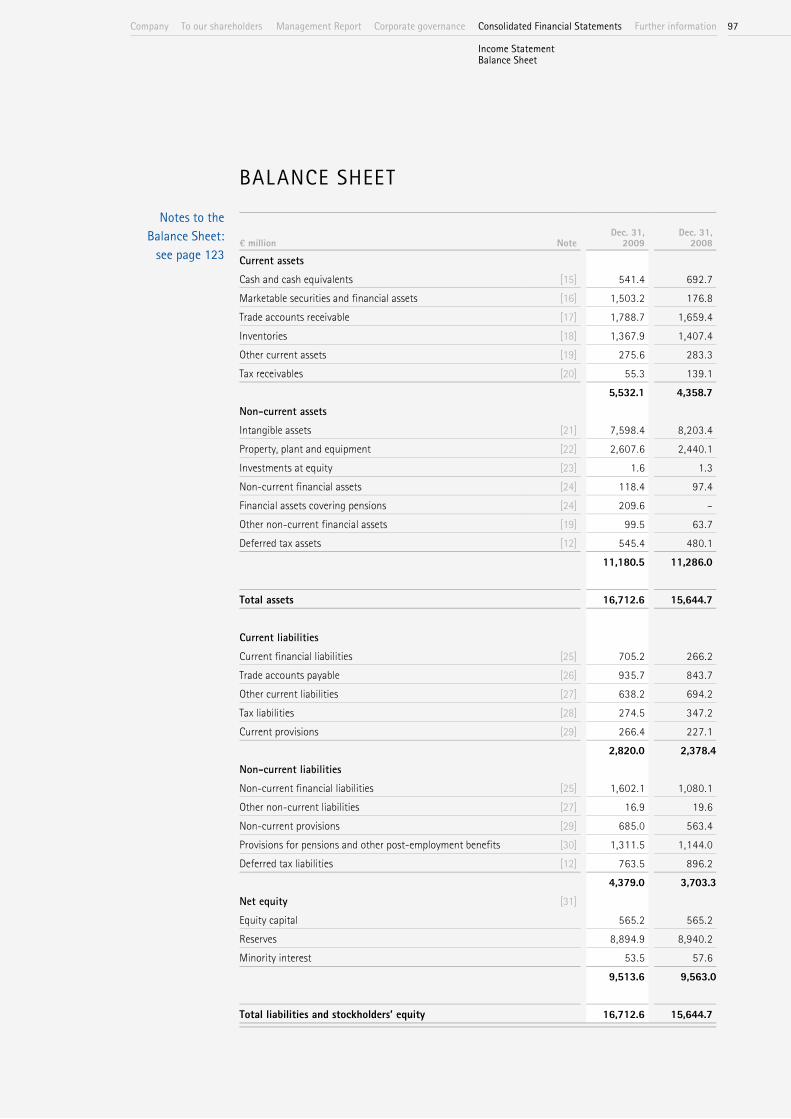
BAlAnCe Sheet
€ million NoteDec. 31,
2009Dec. 31,
2008
Current assetsCash and cash equivalents [15] 541.4 692.7Marketable securities and financial assets [16] 1,503.2 176.8Trade accounts receivable [17] 1,788.7 1,659.4Inventories [18] 1,367.9 1,407.4Other current assets [19] 275.6 283.3Tax receivables [20] 55.3 139.1
5,532.1 4,358.7Non-current assetsIntangible assets [21] 7,598.4 8,203.4Property, plant and equipment [22] 2,607.6 2,440.1Investments at equity [23] 1.6 1.3Non-current financial assets [24] 118.4 97.4Financial assets covering pensions [24] 209.6 –Other non-current financial assets [19] 99.5 63.7Deferred tax assets [12] 545.4 480.1
11,180.5 11,286.0
Total assets 16,712.6 15,644.7
Current liabilitiesCurrent financial liabilities [25] 705.2 266.2Trade accounts payable [26] 935.7 843.7Other current liabilities [27] 638.2 694.2Tax liabilities [28] 274.5 347.2Current provisions [29] 266.4 227.1
2,820.0 2,378.4Non-current liabilitiesNon-current financial liabilities [25] 1,602.1 1,080.1Other non-current liabilities [27] 16.9 19.6Non-current provisions [29] 685.0 563.4Provisions for pensions and other post-employment benefits [30] 1,311.5 1,144.0Deferred tax liabilities [12] 763.5 896.2
4,379.0 3,703.3Net equity [31]Equity capital 565.2 565.2Reserves 8,894.9 8,940.2Minority interest 53.5 57.6
9,513.6 9,563.0
Total liabilities and stockholders’ equity 16,712.6 15,644.7
notes to theBalance Sheet:
see page 123
97Company management Report Corporate governanceto our shareholders Consolidated Financial Statements Further information
income StatementBalance Sheet
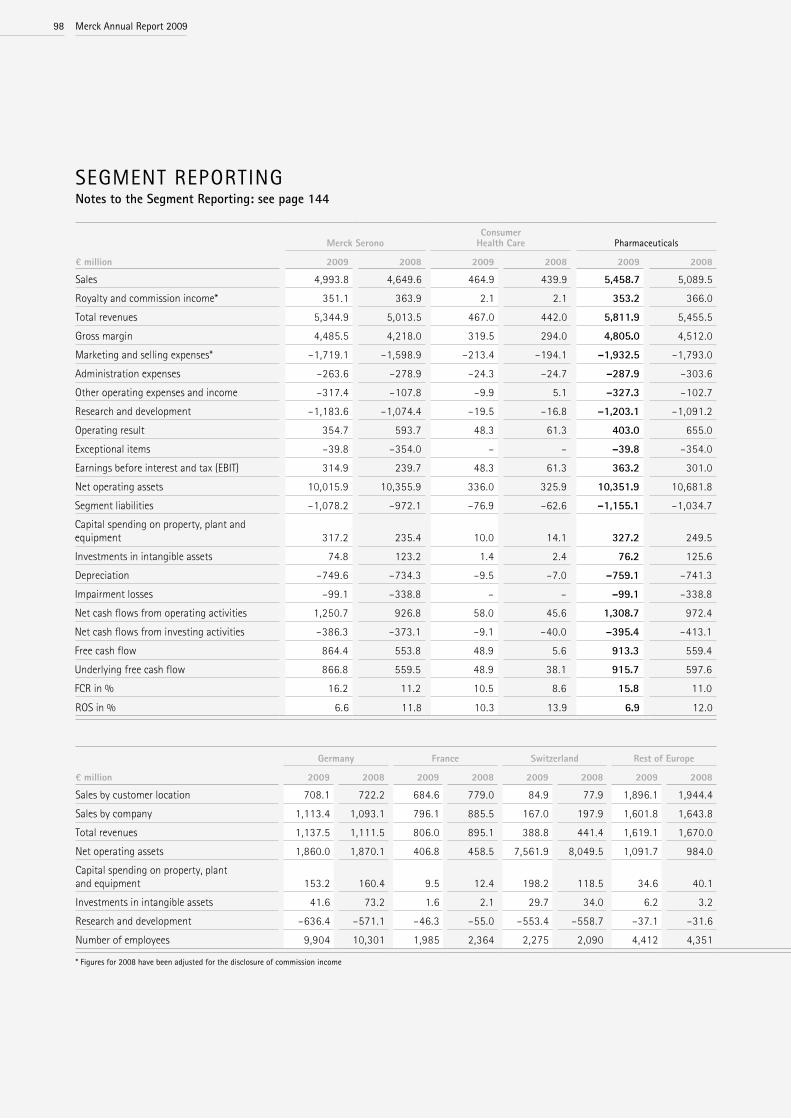
€ million
Merck SeronoConsumer
Health Care Pharmaceuticals Liquid CrystalsPerformance &
Life Science Chemicals ChemicalsCorporate and Other Group
2009 2008 2009 2008 2009 2008 2009 2008 2009 2008 2009 2008 2009 2008 2009 2008
Sales 4,993.8 4,649.6 464.9 439.9 5,458.7 5,089.5 725.0 864.6 1,194.0 1,240.9 1,919.0 2,105.5 – 6.6 7,377.7 7,201.6Royalty and commission income* 351.1 363.9 2.1 2.1 353.2 366.0 7.6 13.4 8.5 8.6 16.1 22.0 – – 369.3 388.0Total revenues 5,344.9 5,013.5 467.0 442.0 5,811.9 5,455.5 732.6 878.0 1,202.5 1,249.5 1,935.1 2,127.5 – 6.6 7,747.0 7,589.6Gross margin 4,485.5 4,218.0 319.5 294.0 4,805.0 4,512.0 356.5 541.7 556.2 632.6 912.7 1,174.3 – –2.7 5,717.7 5,683.6Marketing and selling expenses* –1,719.1 –1,598.9 –213.4 –194.1 –1,932.5 –1,793.0 –27.6 –26.4 –311.9 –306.5 –339.5 –332.9 –0.3 –2.3 –2,272.3 –2,128.2Administration expenses –263.6 –278.9 –24.3 –24.7 –287.9 –303.6 –17.6 –17.6 –61.3 –69.9 –78.9 –87.5 –58.1 –55.1 –424.9 –446.2Other operating expenses and income –317.4 –107.8 –9.9 5.1 –327.3 –102.7 7.4 –18.5 –29.5 –28.5 –22.1 –47.0 –23.3 –20.4 –372.7 –170.1Research and development –1,183.6 –1,074.4 –19.5 –16.8 –1,203.1 –1,091.2 –87.5 –84.8 –54.0 –58.4 –141.5 –143.2 – – –1,344.6 –1,234.4Operating result 354.7 593.7 48.3 61.3 403.0 655.0 227.5 391.2 96.8 166.5 324.3 557.7 –78.4 –81.3 648.9 1,131.4Exceptional items –39.8 –354.0 – – –39.8 –354.0 – – 11.8 –46.0 11.8 –46.0 – – –28.0 –400.0Earnings before interest and tax (EBIT) 314.9 239.7 48.3 61.3 363.2 301.0 227.5 391.2 108.6 120.5 336.1 511.7 –78.4 –81.3 620.9 731.4Net operating assets 10,015.9 10,355.9 336.0 325.9 10,351.9 10,681.8 837.4 944.3 1,120.0 1,127.7 1,957.4 2,072.0 37.4 14.4 12,346.7 12,768.2Segment liabilities –1,078.2 –972.1 –76.9 –62.6 –1,155.1 –1,034.7 –78.6 –98.2 –151.6 –173.6 –230.2 –271.8 –15.7 –10.2 –1,401.0 –1,316.7Capital spending on property, plant and equipment 317.2 235.4 10.0 14.1 327.2 249.5 64.2 64.5 75.5 78.9 139.7 143.4 0.4 1.8 467.3 394.7Investments in intangible assets 74.8 123.2 1.4 2.4 76.2 125.6 3.9 2.0 8.5 3.4 12.4 5.4 8.0 9.9 96.6 140.9Depreciation –749.6 –734.3 –9.5 –7.0 –759.1 –741.3 –62.0 –56.6 –71.6 –70.1 –133.6 –126.7 –1.9 –1.7 –894.6 –869.7Impairment losses –99.1 –338.8 – – –99.1 –338.8 –7.8 –0.6 –1.7 –6.1 –9.5 –6.7 –0.8 –0.1 –109.4 –345.6Net cash flows from operating activities 1,250.7 926.8 58.0 45.6 1,308.7 972.4 359.7 472.7 207.9 146.5 567.6 619.2 –505.0 –567.6 1,371.3 1,024.0Net cash flows from investing activities –386.3 –373.1 –9.1 –40.0 –395.4 –413.1 –67.8 –70.6 –89.3 –88.8 –157.1 –159.4 –1,608.2 490.8 –2,160.7 –81.7Free cash flow 864.4 553.8 48.9 5.6 913.3 559.4 291.9 402.1 118.6 57.7 410.5 459.8 –511.4 –580.8 812.4 438.4Underlying free cash flow 866.8 559.5 48.9 38.1 915.7 597.6 291.9 406.7 139.8 66.9 431.7 473.6 –495.8 –469.9 851.6 601.3FCR in % 16.2 11.2 10.5 8.6 15.8 11.0 39.8 46.3 11.6 5.4 22.3 22.3 – – 11.0 7.9ROS in % 6.6 11.8 10.3 13.9 6.9 12.0 31.0 44.6 8.0 13.3 16.8 26.2 – – 8.4 14.9
€ million
Germany France Switzerland Rest of Europe North America Latin America Asia Africa, Australasia Group
2009 2008 2009 2008 2009 2008 2009 2008 2009 2008 2009 2008 2009 2008 2009 2008 2009 2008
Sales by customer location 708.1 722.2 684.6 779.0 84.9 77.9 1,896.1 1,944.4 1,171.3 1,015.1 941.8 806.2 1,685.6 1,663.4 205.3 193.4 7,377.7 7,201.6Sales by company 1,113.4 1,093.1 796.1 885.5 167.0 197.9 1,601.8 1,643.8 1,146.0 978.0 923.2 791.1 1,520.8 1,511.6 109.4 100.6 7,377.7 7,201.6Total revenues 1,137.5 1,111.5 806.0 895.1 388.8 441.4 1,619.1 1,670.0 1,147.3 979.1 926.7 791.2 1,612.2 1,600.7 109.4 100.6 7,747.0 7,589.6Net operating assets 1,860.0 1,870.1 406.8 458.5 7,561.9 8,049.5 1,091.7 984.0 184.1 224.7 379.3 321.4 831.4 833.5 31.5 26.5 12,346.7 12,768.2Capital spending on property, plant and equipment 153.2 160.4 9.5 12.4 198.2 118.5 34.6 40.1 32.2 18.4 15.5 19.5 23.0 24.1 1.1 1.3 467.3 394.7Investments in intangible assets 41.6 73.2 1.6 2.1 29.7 34.0 6.2 3.2 12.6 18.5 2.1 6.4 2.7 3.5 0.1 – 96.6 140.9Research and development –636.4 –571.1 –46.3 –55.0 –553.4 –558.7 –37.1 –31.6 –32.9 4.7 –7.3 –6.1 –28.1 –13.7 –3.1 –2.9 –1,344.6 –1,234.4Number of employees 9,904 10,301 1,985 2,364 2,275 2,090 4,412 4,351 2,051 2,157 4,272 4,370 7,462 6,504 701 663 33,062 32,800
* Figures for 2008 have been adjusted for the disclosure of commission income
SeGment RePoRtinG Notes to the Segment Reporting: see page 144
merck Annual Report 200998
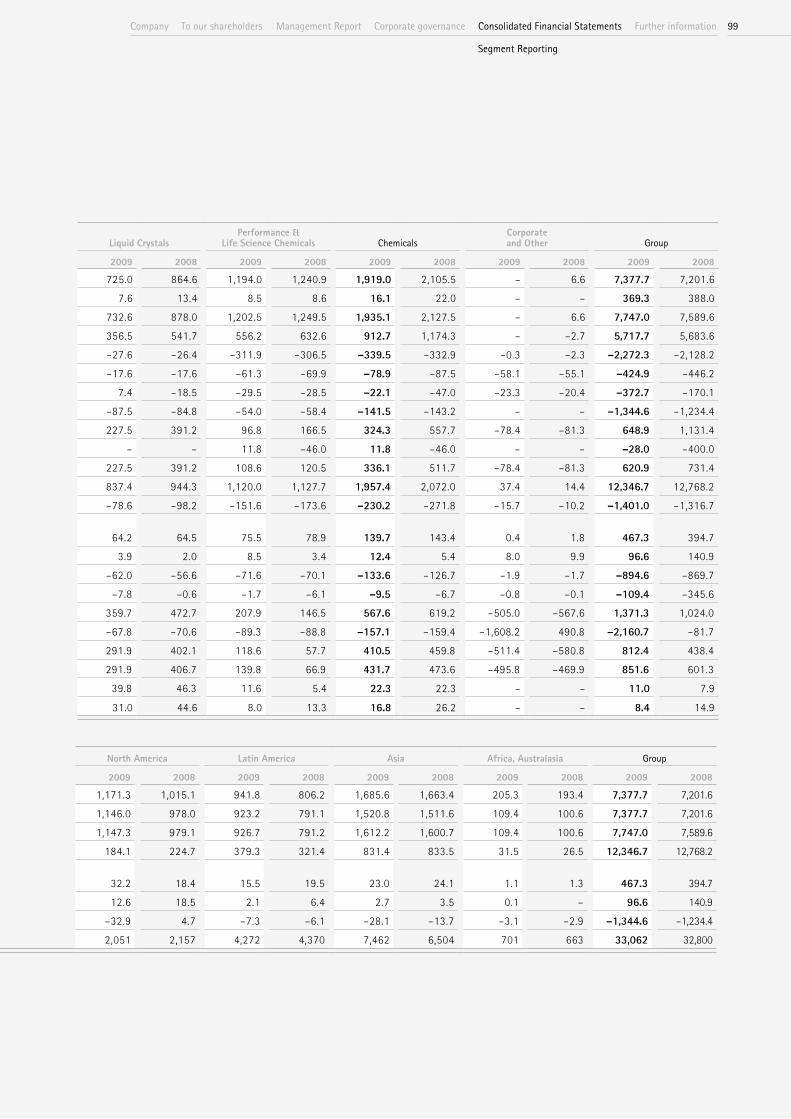
€ million
Merck SeronoConsumer
Health Care Pharmaceuticals Liquid CrystalsPerformance &
Life Science Chemicals ChemicalsCorporate and Other Group
2009 2008 2009 2008 2009 2008 2009 2008 2009 2008 2009 2008 2009 2008 2009 2008
Sales 4,993.8 4,649.6 464.9 439.9 5,458.7 5,089.5 725.0 864.6 1,194.0 1,240.9 1,919.0 2,105.5 – 6.6 7,377.7 7,201.6Royalty and commission income* 351.1 363.9 2.1 2.1 353.2 366.0 7.6 13.4 8.5 8.6 16.1 22.0 – – 369.3 388.0Total revenues 5,344.9 5,013.5 467.0 442.0 5,811.9 5,455.5 732.6 878.0 1,202.5 1,249.5 1,935.1 2,127.5 – 6.6 7,747.0 7,589.6Gross margin 4,485.5 4,218.0 319.5 294.0 4,805.0 4,512.0 356.5 541.7 556.2 632.6 912.7 1,174.3 – –2.7 5,717.7 5,683.6Marketing and selling expenses* –1,719.1 –1,598.9 –213.4 –194.1 –1,932.5 –1,793.0 –27.6 –26.4 –311.9 –306.5 –339.5 –332.9 –0.3 –2.3 –2,272.3 –2,128.2Administration expenses –263.6 –278.9 –24.3 –24.7 –287.9 –303.6 –17.6 –17.6 –61.3 –69.9 –78.9 –87.5 –58.1 –55.1 –424.9 –446.2Other operating expenses and income –317.4 –107.8 –9.9 5.1 –327.3 –102.7 7.4 –18.5 –29.5 –28.5 –22.1 –47.0 –23.3 –20.4 –372.7 –170.1Research and development –1,183.6 –1,074.4 –19.5 –16.8 –1,203.1 –1,091.2 –87.5 –84.8 –54.0 –58.4 –141.5 –143.2 – – –1,344.6 –1,234.4Operating result 354.7 593.7 48.3 61.3 403.0 655.0 227.5 391.2 96.8 166.5 324.3 557.7 –78.4 –81.3 648.9 1,131.4Exceptional items –39.8 –354.0 – – –39.8 –354.0 – – 11.8 –46.0 11.8 –46.0 – – –28.0 –400.0Earnings before interest and tax (EBIT) 314.9 239.7 48.3 61.3 363.2 301.0 227.5 391.2 108.6 120.5 336.1 511.7 –78.4 –81.3 620.9 731.4Net operating assets 10,015.9 10,355.9 336.0 325.9 10,351.9 10,681.8 837.4 944.3 1,120.0 1,127.7 1,957.4 2,072.0 37.4 14.4 12,346.7 12,768.2Segment liabilities –1,078.2 –972.1 –76.9 –62.6 –1,155.1 –1,034.7 –78.6 –98.2 –151.6 –173.6 –230.2 –271.8 –15.7 –10.2 –1,401.0 –1,316.7Capital spending on property, plant and equipment 317.2 235.4 10.0 14.1 327.2 249.5 64.2 64.5 75.5 78.9 139.7 143.4 0.4 1.8 467.3 394.7Investments in intangible assets 74.8 123.2 1.4 2.4 76.2 125.6 3.9 2.0 8.5 3.4 12.4 5.4 8.0 9.9 96.6 140.9Depreciation –749.6 –734.3 –9.5 –7.0 –759.1 –741.3 –62.0 –56.6 –71.6 –70.1 –133.6 –126.7 –1.9 –1.7 –894.6 –869.7Impairment losses –99.1 –338.8 – – –99.1 –338.8 –7.8 –0.6 –1.7 –6.1 –9.5 –6.7 –0.8 –0.1 –109.4 –345.6Net cash flows from operating activities 1,250.7 926.8 58.0 45.6 1,308.7 972.4 359.7 472.7 207.9 146.5 567.6 619.2 –505.0 –567.6 1,371.3 1,024.0Net cash flows from investing activities –386.3 –373.1 –9.1 –40.0 –395.4 –413.1 –67.8 –70.6 –89.3 –88.8 –157.1 –159.4 –1,608.2 490.8 –2,160.7 –81.7Free cash flow 864.4 553.8 48.9 5.6 913.3 559.4 291.9 402.1 118.6 57.7 410.5 459.8 –511.4 –580.8 812.4 438.4Underlying free cash flow 866.8 559.5 48.9 38.1 915.7 597.6 291.9 406.7 139.8 66.9 431.7 473.6 –495.8 –469.9 851.6 601.3FCR in % 16.2 11.2 10.5 8.6 15.8 11.0 39.8 46.3 11.6 5.4 22.3 22.3 – – 11.0 7.9ROS in % 6.6 11.8 10.3 13.9 6.9 12.0 31.0 44.6 8.0 13.3 16.8 26.2 – – 8.4 14.9
€ million
Germany France Switzerland Rest of Europe North America Latin America Asia Africa, Australasia Group
2009 2008 2009 2008 2009 2008 2009 2008 2009 2008 2009 2008 2009 2008 2009 2008 2009 2008
Sales by customer location 708.1 722.2 684.6 779.0 84.9 77.9 1,896.1 1,944.4 1,171.3 1,015.1 941.8 806.2 1,685.6 1,663.4 205.3 193.4 7,377.7 7,201.6Sales by company 1,113.4 1,093.1 796.1 885.5 167.0 197.9 1,601.8 1,643.8 1,146.0 978.0 923.2 791.1 1,520.8 1,511.6 109.4 100.6 7,377.7 7,201.6Total revenues 1,137.5 1,111.5 806.0 895.1 388.8 441.4 1,619.1 1,670.0 1,147.3 979.1 926.7 791.2 1,612.2 1,600.7 109.4 100.6 7,747.0 7,589.6Net operating assets 1,860.0 1,870.1 406.8 458.5 7,561.9 8,049.5 1,091.7 984.0 184.1 224.7 379.3 321.4 831.4 833.5 31.5 26.5 12,346.7 12,768.2Capital spending on property, plant and equipment 153.2 160.4 9.5 12.4 198.2 118.5 34.6 40.1 32.2 18.4 15.5 19.5 23.0 24.1 1.1 1.3 467.3 394.7Investments in intangible assets 41.6 73.2 1.6 2.1 29.7 34.0 6.2 3.2 12.6 18.5 2.1 6.4 2.7 3.5 0.1 – 96.6 140.9Research and development –636.4 –571.1 –46.3 –55.0 –553.4 –558.7 –37.1 –31.6 –32.9 4.7 –7.3 –6.1 –28.1 –13.7 –3.1 –2.9 –1,344.6 –1,234.4Number of employees 9,904 10,301 1,985 2,364 2,275 2,090 4,412 4,351 2,051 2,157 4,272 4,370 7,462 6,504 701 663 33,062 32,800
* Figures for 2008 have been adjusted for the disclosure of commission income
99Company management Report Corporate governanceto our shareholders Consolidated Financial Statements Further information
Segment Reporting

CASh Flow StAtement
€ million Note 2009 2008
Profit after tax 376.7 379.1Depreciation/amortization and impairment losses (non-current assets) 1,003.8 1,215.3Changes in inventories 51.7 –225.5Changes in trade accounts receivable –118.7 –268.1Changes in trade accounts payable 92.7 189.3Changes in provisions 156.9 –71.0Changes in other assets and liabilities –179.6 –187.3Neutralization of gain/loss on disposals of assets –15.8 –4.0Other non-cash income and expenses 3.6 –3.8Net cash flows from operating activities [32] 1,371.3 1,024.0
Purchase of intangible assets –96.6 –140.9Purchase of property, plant and equipment –467.3 –394.7Acquisitions and investments of non-current financial assets –40.0 –78.2Disposal of non-current assets 45.4 35.7Purchase/sale of marketable securities –0.4 –7.5Changes in financial assets covering pensions –201.3 –Changes in other financial assets –1,400.5 503.9Net cash flows from investing activities [33] –2,160.7 –81.7
Dividend payments –104.8 –212.5Capital increase including amounts due to stock option plans – 0.2Profit transfers to E. Merck KG and changes in reserves –177.8 –239.9Changes in liabilities to E. Merck KG –32.6 –291.0Bonds issued 976.1 –Changes in current and non-current financial liabilities –23.7 76.5Net cash flows from financing activities [34] 637.2 –666.7
Changes in cash and cash equivalents –152.2 275.6Changes in cash and cash equivalents due to currency translation 0.9 –9.5Cash and cash equivalents as of January 1 692.7 426.6Cash and cash equivalents as of December 31 [35] 541.4 692.7
notes to the Cash Flow Statement:
see page 145
merck Annual Report 2009100

FRee CASh Flow
€ million Note 2009 2008
Net cash flows from operating activities 1,371.3 1,024.0Purchase of intangible assets –96.6 –140.9Purchase of property, plant and equipment –467.3 –394.7Acquisitions and investments of non-current financial assets –40.0 –78.2Disposal of non-current assets 45.4 35.7Purchase/sale of marketable securities –0.4 –7.5Free cash flow [36] 812.4 438.4
Acquisitions 23.5 51.9Payments related to divestments 15.7 111.0Underlying free cash flow 851.6 601.3
StAtement oF ComPRehenSive inCome
2009 2008
€ million
Before tax
amount
Tax expense/
benefit
Net- of-tax
amount
Before tax
amount
Tax expense/
benefit
Net- of-tax
amount
Profit 486.4 –109.7 376.7 574.9 –195.8 379.1 Gains/losses arising on remeasuring available-for-sale financial assets 35.9 –2.1 33.8 –15.8 –0.1 –15.9 Effective portion of gains/losses on hedging instruments in a cash flow hedge –17.3 0.7 –16.6 74.5 –10.5 64.0 Actuarial gains and losses from defined benefit pension commitments and similar obligations –178.1 40.3 –137.8 31.7 -7.3 24.4 Exchange differences on translating foreign operations –20.1 – –20.1 878.0 – 878.0Gains/losses recognized immediately in equity –179.6 38.9 –140.7 968.4 –17.9 950.5Comprehensive income 306.8 –70.8 236.0 1,543.3 –213.7 1,329.6 of which attributable to shareholders of the Group 230.2 1,325.9 of which attributable to minority interest 5.8 3.7
101Company management Report Corporate governanceto our shareholders Consolidated Financial Statements Further information
Cash Flow StatementFree Cash FlowStatement of Comprehensive income

StAtement oF ChAnGeS in net equity inCludinG minoRity inteReSt
€ million
Equity capital Reserves
Minority interest Total
General partner’s
equity Merck KGaA
Subscribed capital
Merck KGaA
Capital reserves
(share premium)
Merck KGaA
Retained earnings/
Net retained profit
Gains/losses recognized
immediately in equity
Balance as of January 1, 2008 397.2 168.0 3,813.5 4,897.5 –650.5 61.9 8,687.6Profit after tax – – – 367.1 – 12.0 379.1Dividend payments – – – –206.8 – –5.7 –212.5Profit transfers to/from E. Merck KG including transfers to reserves – – – –239.9 – – –239.9Capital increase due to the exercise of stock options – – 0.2 – – – 0.2Other changes in equity – – – – 958.8 –8.3 950.5Changes in scope of consolidation/Other – – – 0.3 – –2.3 –2.0Balance as of December 31, 2008 397.2 168.0 3,813.7 4,818.2 308.3 57.6 9,563.0
Balance as of January 1, 2009 397.2 168.0 3,813.7 4,818.2 308.3 57.6 9,563.0Profit after tax – – – 366.3 – 10.4 376.7Dividend payments – – – –96.9 – –7.9 –104.8Profit transfers to/from E. Merck KG including transfers to reserves – – – –177.8 – – –177.8Other changes in equity – – – – –136.1 –4.6 –140.7Changes in scope of consolidation/Other – – – –0.2 –0.6 –2.0 –2.8Balance as of December 31, 2009 397.2 168.0 3,813.7 4,909.6 171.6 53.5 9,513.6
merck Annual Report 2009102

noteS
The accompanying consolidated financial statements have been prepared with Merck KGaA, Darmstadt, which manages the operations of the Merck Group, as parent company. In accor-dance with the provisions of the German financial reporting disclosure law (Publi zitäts ge setz), consolidated financial statements are also prepared for E. Merck KG, the general partner of Merck KGaA with an equity interest of 70.27% as of December 31, 2009. These include Merck KGaA and its subsidiaries. The authoritative German versions of these financial state-ments are filed with the electronic German Federal Gazette (elektronischer Bundesanzeiger) and can then be accessed at www.ebundesanzeiger.de.
The consolidated financial statements of the Merck Group have been prepared in accordance with consistent accounting policies. Pursuant to Section 315a of the German Commercial Code (HGB), the International Financial Reporting Standards (IFRS) in force on the reporting date and adopted by the European Union as issued by the International Accounting Standards Board (IASB) and the International Financial Reporting Interpretations Committee (IFRIC) have been applied.
The following standard and amendments to standards as well as the following interpretations and amendment to an interpretation take effect as of fiscal 2009: – IFRS 8 “Operating Segments“ – Revised IAS 1 “Presentation of Financial Statements” – Revised IAS 23 “Borrowing Costs” – Amendment to IAS 32 and IAS 1: “Puttable Financial Instruments and Obligations Arising
on Liquidation”– Amendment to IAS 39 and IFRS 7: “Reclassification of Financial Assets – Effective Date and
Transition”– Amendment to IFRS 1 and IAS 27: “Cost of an Investment in a Subsidiary, Jointly Controlled
Entity or Associate”– Amendment to IFRS 2 “Share-based Payment: Vesting Conditions and Cancellations”– Amendment to IFRS 4 “Insurance Contracts” and IFRS 7 “Financial Instruments: Disclosures”– “Improvements to International Financial Reporting Standards”– Amendment to IFRIC 9 “Reassessment of Embedded Derivatives” and IAS 39 “Financial
Instruments: Recognition and Measurement”– IFRIC 13 “Customer Loyalty Programmes”– IFRIC 14 “IAS 19 – The Limit on a Defined Benefit Asset, Minimum Funding Requirements
and their Interaction”The new rules do not have any material effects on the consolidated financial statements.
The following amendments to standards and the following interpretations will take effect as of fiscal 2010:– Amendment to IAS 27 “Consolidated and Separate Financial Statements”– Amendment to IAS 32 “Financial Instruments: Presentation – Classification of Rights Issues”– Amendment to IAS 39 “Financial Instruments: Recognition and Measurement: Eligible
Hedged Items”– Amendment to IFRS 1 “First-time Adoption of International Financial Reporting Standards”
Preliminary remarks
Application of international Financial Reporting
Standards (iFRS)
103Company management Report Corporate governanceto our shareholders Consolidated Financial Statements Further information
Statement of Changes in net equitynotes

– Revised IFRS 3 “Business Combinations”– IFRIC 12 “Service Concession Arrangements”– IFRIC 15 “Agreements for the Construction of Real Estate”– IFRIC 16 “Hedges of a Net Investment in a Foreign Operation”– IFRIC 17 “Distributions of Non-cash Assets to Owners” – IFRIC 18 “Transfers of Assets from Customers”We currently do not expect the new rules to have any material effects on the consolidated financial statements.
In addition, the following standard and amendments to standards were published by the International Accounting Standards Board (IASB) and the following interpretations and amendment to an interpretation were published by the International Financial Reporting Interpretations Committee (IFRIC), but not yet adopted by the EU:– IFRS 9 “Financial Instruments”– Revised IAS 24 “Related Party Disclosures”– Amendment to IFRS 2 “Group Cash-settled Share-based Payment Transactions” – “Improvements to International Financial Reporting Standards”– Revised IFRS 1 “First-time Adoption of International Financial Reporting Standards”– IFRIC 19 “Extinguishing Financial Liabilities with Equity Instruments”– Amendment to IFRIC 14 “IAS 19 – The Limit on a Defined Benefit Asset, Minimum Funding Requirements and their Interaction”The effects that IFRS 9, which is expected to be adopted as of 2013, will have on the consoli-dated financial statements are currently being examined. At the current time we do not expect the other new rules to have any material effects on the consolidated financial statements.
SCoPe of CoNSolidatioN
Including the parent company Merck KGaA, Darmstadt, 176 (2008: 178) German and foreign companies are fully consolidated in the annual financial statements of the Merck Group. Of these companies, 154 (2008: 157) are located abroad. One associate abroad is included using the equity method. In fiscal 2009, four companies were acquired and included in the consolidated financial statements. Nine companies were consolidated for the first time due to their formation or increased importance to the Merck Group, and 15 companies were deconsolidated, three of which were the result of a company merger. Nine companies were liquidated; three companies were deconsolidated due to secondary importance.Due to secondary importance 32 (2008: 40) investments are not consolidated and are presented under non-current financial assets.
At the beginning of September 2009, the acquisition of a 100% shareholding in Suzhou Taizhu China Group (“Taizhu”), a leading supplier of effect pigments located in Taicang near Shanghai, China, was completed. The agreed purchase price was € 26.3 million (including transaction costs of € 0.7 million). Taizhu is one of the largest companies in the Chinese market for effect pigments. The acquisition is of high importance to our Pigments business. Within the scope of the transaction, Merck has acquired Taizhu’s sales organization for the Chinese and international market, as well as the production site in Taicang.
Acquisitions
merck Annual Report 2009104

In October 2009, Merck Specialities Private Ltd. acquired a 100% shareholding in Bangalore Genei (Bangalore, India) Private Ltd. The acquisition costs amounted to € 4.6 million, including transaction costs of less than € 0.1 million. By combining the activities of Bangalore Genei with its existing bioscience business, Merck will become a leading supplier of bioscience products in India. On November 2, 2009, Aquacomp EAD, Sofia, Bulgaria, was acquired in full. The purchase price was € 2.8 million (including transaction costs of € 0.4 million). The company holds the marketing rights to Merck products in Bulgaria. It has since been renamed Merck EAD, Sofia, Bulgaria.
Overall, the changes in the scope of consolidation due to acquisitions had the following effects on the consolidated balance sheet:
€ million
Acquisitions
Pre-acquisi- tion book value Adjustment Fair value
Goodwill 0.0 17.0 17.0Other intangible assets 0.0 4.7 4.7Property, plant and equipment 6.3 0.7 7.0Other non-current assets 0.0 0.0 0.0Cash and cash equivalents 3.3 0.0 3.3Other current assets 11.8 1.7 13.5Current and non-current liabilities 10.2 1.6 11.8
The acquisition of Taizhu is responsible for € 13.1 million of the effect of adjusting goodwill totaling € 17.0 million. € 3.9 million resulted from the additional acquisitions mentioned. The adjustments of other intangible assets mainly include the purchase price allocation for trademarks, product rights as well as customer relationships and technical know-how.
Taking into account the acquisitions made in 2009, sales and operating result were impacted as follows in the reporting period:
€ millionAcquisitions/
First-time consolidations
Sales 5.1Cost of sales -4.5Other income/expenses -1.9Operating result -1.3
Assuming the hypothetical consolidation since the beginning of the year, the impact of acquisitions on sales is € 14.0 million.
105Company management Report Corporate governanceto our shareholders Consolidated Financial Statements Further information
notes
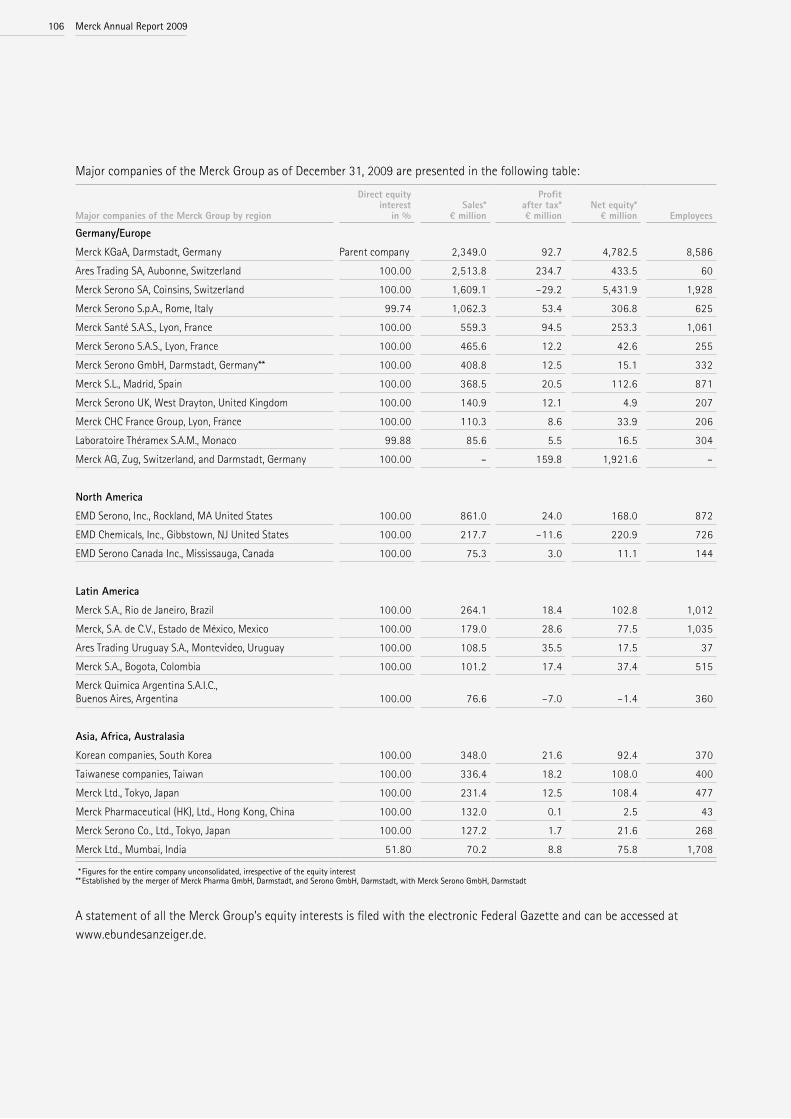
Major companies of the Merck Group as of December 31, 2009 are presented in the following table:
Major companies of the Merck Group by region
Direct equity interest
in %Sales*
€ million
Profit after tax* € million
Net equity* € million Employees
Germany/europeMerck KGaA, Darmstadt, Germany Parent company 2,349.0 92.7 4,782.5 8,586Ares Trading SA, Aubonne, Switzerland 100.00 2,513.8 234.7 433.5 60Merck Serono SA, Coinsins, Switzerland 100.00 1,609.1 –29.2 5,431.9 1,928Merck Serono S.p.A., Rome, Italy 99.74 1,062.3 53.4 306.8 625Merck Santé S.A.S., Lyon, France 100.00 559.3 94.5 253.3 1,061Merck Serono S.A.S., Lyon, France 100.00 465.6 12.2 42.6 255Merck Serono GmbH, Darmstadt, Germany** 100.00 408.8 12.5 15.1 332Merck S.L., Madrid, Spain 100.00 368.5 20.5 112.6 871Merck Serono UK, West Drayton, United Kingdom 100.00 140.9 12.1 4.9 207Merck CHC France Group, Lyon, France 100.00 110.3 8.6 33.9 206Laboratoire Théramex S.A.M., Monaco 99.88 85.6 5.5 16.5 304Merck AG, Zug, Switzerland, and Darmstadt, Germany 100.00 – 159.8 1,921.6 –
North americaEMD Serono, Inc., Rockland, MA United States 100.00 861.0 24.0 168.0 872EMD Chemicals, Inc., Gibbstown, NJ United States 100.00 217.7 –11.6 220.9 726EMD Serono Canada Inc., Mississauga, Canada 100.00 75.3 3.0 11.1 144
latin americaMerck S.A., Rio de Janeiro, Brazil 100.00 264.1 18.4 102.8 1,012Merck, S.A. de C.V., Estado de México, Mexico 100.00 179.0 28.6 77.5 1,035Ares Trading Uruguay S.A., Montevideo, Uruguay 100.00 108.5 35.5 17.5 37Merck S.A., Bogota, Colombia 100.00 101.2 17.4 37.4 515Merck Quimica Argentina S.A.I.C., Buenos Aires, Argentina 100.00 76.6 –7.0 –1.4 360
asia, africa, australasiaKorean companies, South Korea 100.00 348.0 21.6 92.4 370Taiwanese companies, Taiwan 100.00 336.4 18.2 108.0 400Merck Ltd., Tokyo, Japan 100.00 231.4 12.5 108.4 477Merck Pharmaceutical (HK), Ltd., Hong Kong, China 100.00 132.0 0.1 2.5 43Merck Serono Co., Ltd., Tokyo, Japan 100.00 127.2 1.7 21.6 268Merck Ltd., Mumbai, India 51.80 70.2 8.8 75.8 1,708
* Figures for the entire company unconsolidated, irrespective of the equity interest ** established by the merger of merck Pharma Gmbh, darmstadt, and Serono Gmbh, darmstadt, with merck Serono Gmbh, darmstadt
A statement of all the Merck Group’s equity interests is filed with the electronic Federal Gazette and can be accessed at www.ebundesanzeiger.de.
merck Annual Report 2009106
aCCouNtiNG PoliCieS
With the exception of the presentation changes described below, the accounting policies have remained unchanged in comparison with the previous year. In 2009, Merck started to report commission income as a part of total revenues, as this income now constitutes a fixed component of revenues from ordinary activities. Under commission income, we record income from activities performed by Merck for third parties on a commission basis, or income received by Merck from activities performed with partners on a cooperation basis. This income was so far reported together with commission expenses under marketing and selling expenses. This led to income of € 24.4 million (2008: € 31.6 million) in 2009. The previous year’s presentation and key figures have been adjusted accordingly. Since 2009, write-downs of license rights recognized within the scope of the purchase price allocation for acquisitions have been reported under Amortization of intangible assets because these expenses are directly connected to ongoing business activities. Previously, these were reported under Exceptional items. In 2009, € 71.5 million (2008: € 42.9 million) was written down in this context. During fiscal 2009, Merck began to cover the pension obligations of Merck KGaA on a long-term basis. These assets are reported under a separate item in the balance sheet. For further explanations concerning financial assets to cover pension obliga-tions, please see Note [24]. The preparation of the consolidated financial statements requires that assumptions and estimates be made to a certain extent. This affects in particular the amount and the presenta-tion of assets and liabilities, information on contingent liabilities, as well as reported income and expenses. Corresponding scope for discretion results, for example, when performing impairment tests of intangible assets and of property, plant and equipment, as well as when recognizing and measuring provisions. In each case, the assumptions and estimates are based on the state of knowledge and data currently available, however the actual results may deviate from the expected values and lead to corresponding adjustments of book values for the relevant assets and liabilities. The assumptions and estimates relevant to the preparation of the consolidated financial statements are reviewed on an ongoing basis. The material assumptions and parameters for the estimates made are presented in the Notes.
The consolidated financial statements are based on the single-entity financial statements of the consolidated companies as of December 31, 2009, which were prepared applying consis-tent accounting polices in accordance with IFRS.Acquisitions are accounted for using the purchase method in accordance with IFRS 3. Subsid-iaries consolidated for the first time in the reporting period are measured at the carrying values at the time of acquisition on the basis of corresponding financial statements. Resulting differ-ences are recognized as assets and liabilities to the extent that their fair values differ from the values actually carried in the financial statements. Any remaining difference is recognized as goodwill within intangible assets, and is subjected to a regular impairment test.
Consolidation methods
107Company management Report Corporate governanceto our shareholders Consolidated Financial Statements Further information
notes
Interests in associates over which Merck has significant influence are – as far as they are material – included in accordance with IAS 28 using the equity method of accounting. Intragroup sales, expenses and income, as well as all receivables and payables between the consolidated companies, were eliminated. The effects of intragroup deliveries reported under non-current assets and inventories were adjusted by eliminating any intragroup profits.In accordance with IAS 12, deferred taxes are applied to consolidation measures.
The functional currency concept applies to the translation of financial statements of consoli-dated companies prepared in foreign currencies. The companies of the Merck Group conduct their operations independently. The functional currency of these companies is generally the respective local currency. In accordance with IAS 21 “The Effects of Changes in Foreign Exchange Rates”, assets and liabilities are translated at the closing rate, and income and expenses are translated at weighted average annual rates to euros, the reporting currency. If Group companies are deconsolidated, existing currency differences are reversed and recognized in income. Business transactions that are conducted in currencies other than the functional currency are recorded using the current exchange rate on the date of the transac-tion. Foreign currency monetary items (cash and cash equivalents, receivables and payables) in the single-entity financial statements of the consolidated companies prepared in the functional currency are translated at the respective closing rates. Exchange differences from the translation of monetary items are recognized in the income statement with the exception of net investments in a foreign operation. Hedged items are like wise carried at the closing rate in accordance with IAS 21. The resulting gains or losses are eliminated in the income statement against offsetting amounts from the fair value measurement of derivatives. Non-monetary items denominated in foreign currencies are carried at historical cost. In 2009, the reporting currency of our subsidiary Merck Advanced Technologies Ltd., Seoul, South Korea, was changed from Korean won to U.S. dollars. This move reflects the fact that the transactions of this subsidiary are now primarily conducted in U.S. dollars.
Sales are recognized net of related taxes as well as rebates, discounts and returns. They are deemed realized once the goods are delivered or the services have been rendered and the material opportunities and risks of ownership have been transferred to the purchaser. The amount of revenue can be reliably determined and payment is sufficiently probable. In addition to revenue from the sale of goods, sales also include revenue from services, but the volume involved is insignificant. Depending on the substance of the relevant agreements, commission income and license royalties are recognized either immediately or on an accrued basis if further contractual obligations exist. Dividend income is recognized when the shareholders’ right to receive the dividend is established. This is normally the date of the dividend resolution. Interest income is recognized on a time-proportionate basis using the effective rate method.
Currency translation
Recognition of sales and other revenue
merck Annual Report 2009108

The breakdown of research and development costs by divisions and regions is presented under Segment Reporting. In addition to the costs of research departments and process development, this item also includes the cost of purchased services and the cost of clinical trials. The costs of research and development are expensed in full in the period in which they are incurred. Development expenses in the Pharmaceuticals business sector cannot be capitalized since the high level of risk up to the time that pharmaceutical products are marketed means that the requirements of IAS 38 are not satisfied in full. Costs incurred after regulatory approval are insignificant. In the same way, the risks involved until products are marketed means that development expenses in the Chemicals business sector cannot be capitalized. In addition to our own research and development, Merck is also a partner in collaborations aimed at develop-ing marketable products. These collaborations typically involve payments for the achievements of certain milestones.With respect to this situation, an assessment is required as to whether these upfront or mile-stone payments represent compensation for services performed (research and development expense) or whether the payments represent the acquisition of a right which has to be capital-ized. Reimbursements for R & D are offset against research and development costs.
A financial instrument is any contract that gives rise to both a financial asset of one entity and a financial liability or equity instrument of another entity. A distinction is made between nonderivative and derivative financial instruments. Derivatives can be embedded in other financial instruments or in nonfinancial instruments. Under IFRS, an embedded derivative must be separated from the host contract and accounted for separately at fair value if the economic characteristics of the embedded derivative are not closely related to the economic characteristics of the host contract. Merck did not have any separable embedded derivatives during the fiscal year. Issued compound financial instruments with both an equity and a liability component must be recognized separately depending on their characteristics. Merck was not a party to hybrid or compound financial instruments during the fiscal year. As a rule, Merck accounts for regular way purchases or sales of financial instruments at the settlement date and derivatives at the trade date. Financial assets and financial liabilities are generally measured at fair value on initial recogni-tion, if necessary including transaction costs. The fair value of a financial instrument is the amount which would be agreed by two willing parties in an arm’s length transaction for that financial instrument. If quoted prices in an active market are available, they are used to measure the financial instrument. In other cases, generally accepted financial techniques using observable prices on the market or third-party valuations are used.Financial assets are derecognized in part or in full if the contractual rights to the cash flows from the financial asset have expired or if control and substantially all the risks and rewards of ownership of the financial asset have been transferred to a third party. Financial liabilities are derecognized if the contractual obligations have been discharged, cancelled, or expire.
Research and development
Financial instruments: Principles
109Company management Report Corporate governanceto our shareholders Consolidated Financial Statements Further information
notes

Financial assets and liabilities are classified into the following IAS 39 measurement categories and IFRS 7 classes. “Financial assets and financial liabilities at fair value through profit or loss” can be both nonderivative and derivative financial instruments. Financial instruments in this category are subsequently measured at fair value. Gains and losses on financial instruments in this measurement category are recognized directly in the income statement. This measurement category includes an option to designate nonderivative financial instruments as at “fair value through profit or loss” on initial recognition (fair value option) or as financial instruments held for trading. We did not apply the fair value option during the fiscal year.Merck only assigns derivatives to the “held for trading” measurement category. Special accounting rules apply to derivatives that are designated as hedging instruments in a hedging relationship (hedge accounting).“Held-to-maturity investments” are nonderivative financial assets with fixed or determinable payments and fixed maturity that are quoted in an active market. To be able to assign a financial asset to this measurement category, the entity must have the positive intention and ability to hold it to maturity. These investments are subsequently measured at amortized cost. If there is objective evidence that such an asset is impaired, an impairment loss is recognized in profit or loss. Subsequent reversals of impairment losses are also recognized in profit or loss up to the amount of the original cost of the asset. At Merck, this measurement category is used for short-term securities and other current financial assets, as well as long-term investments.“Loans and receivables” are nonderivative financial assets with fixed or determinable payments that are not quoted in an active market. They are subsequently measured at amortized cost. If there is objective evidence that such assets are impaired, an impairment loss is recognized in the income statement. Subsequent reversals of impairment losses are also recognized in the income statement up to the amount of the original cost of the asset. Long-term noninterest-bearing and low-interest receivables are measured at their present value. Merck primarily assigns trade receivables, loans, and miscellaneous other current and noncurrent receivables to this measurement category. Merck uses a separate allowance account for impairment losses on trade and other receivables.“Available-for-sale financial assets” are those nonderivative financial assets that are not assigned to the measurement categories “financial assets and financial liabilities at fair value through profit or loss”, “loans and receivables” or “held-to-maturity investments”. Financial assets in this category are subsequently measured at fair value. Changes in fair value are recognized directly in equity and are only transferred to the income statement when the financial asset is derecognized. If there is objective evidence that such an asset is impaired, an impairment loss is recognized directly in the income statement, including any amounts already recognized in comprehensive income. Reversals of impairment losses on previously impaired equity instruments are recognized directly in equity.
Financial instruments: Categories and classes of
financial instruments
merck Annual Report 2009110
Reversals of impairment losses on previously impaired debt instruments are recognized in profit or loss up to the amount of the impairment loss. Any amount in excess of this is recognized directly in equity. At Merck, this measurement category is used in particular for short-term securities and other current financial assets, as well as long-term financial investments and securities.Financial assets in this category for which no fair value is available or fair value cannot be reliably measured are measured at cost less any cumulative impairment losses. Impairment losses on financial assets carried at cost may not be reversed.“Other financial liabilities” are nonderivative financial liabilities that are subsequently measured at amortized cost. Differences between the amount received and the amount to be repaid are amortized to profit or loss over the maturity of the instrument. Merck primarily assigns financial liabilities, trade payables, and miscellaneous other nonderivative current and noncurrent liabilities to this category.There were no reclassifications between the aforementioned measurement categories during the fiscal year.The classes required to be disclosed in accordance with IFRS 7 consist of the measurement categories set out above. Additionally, cash and cash equivalents with an original maturity of up to 90 days, finance lease liabilities, and hedging derivatives used in hedge accounting are also classes in accordance with IFRS 7. See note [39] for a detailed overview.
Merck uses derivatives solely to hedge recognized assets or liabilities and forecast transactions. Hedge accounting in accordance with IFRSs is applied to part of these hedges. A distinction is made between fair value hedge accounting and cash flow hedge accounting. As a rule, desig-nation of a hedging relationship requires a hedged item (underlying) and a hedging instrument specifically assigned to that hedged item. At Merck, all hedges relate to existing or highly prob-able hedged items. Merck only uses derivatives as hedging instruments.Changes in the fair value or cash flows of the hedged item and the hedging instrument must be effective at all times. In both cash flow and fair value hedges, the ineffective portion of the gain or loss on a hedging instrument is recognized in profit or loss. Merck uses the dollar offset method to measure hedge effectiveness. There are strict documentation requirements for hedge accounting. Derivatives that do not or no longer meet the documentation or effective-ness requirements for hedge accounting, or whose hedged item no longer exists, are reported as “financial assets and liabilities at fair value through profit or loss.” Changes in fair value are then recognized in profit or loss.
Financial instruments: derivative and hedge
accounting
111Company management Report Corporate governanceto our shareholders Consolidated Financial Statements Further information
notes
As a rule, the purpose of a fair value hedge is to offset the exposure to changes in the fair value of recognized hedged items (financial assets or financial liabilities) through offset-ting changes in the fair value of a hedging instrument. Offsetting gains and losses on the hedging instrument resulting from changes in fair value are recognized in profit or loss, net of deferred taxes. Offsetting gains and losses on the hedged item that are attributable to the hedged risk are also recognized in profit or loss, irrespective of the item’s allocation to a measurement category. At Merck, cash flow hedges are normally a hedge of the exposure to variability in cash flows resulting from highly probable forecast transactions in foreign currencies. In cash flow hedges, the effective portion of the gains and losses on the hedging instrument is recognized in other comprehensive income until the hedged item occurs. This is also the case if the hedging instrument expires, is sold, or is terminated before the hedged transaction occurs. The ineffective portion of a cash flow hedge is always recognized in profit or loss. See note [37] for a detailed overview.
Other non-financial assets are carried at amortized cost. Impairment losses are recognized for any credit risks. Long-term non-interest-bearing and low-interest receivables are carried at their present value. Other non-financial liabilities are carried at the amount to be repaid.
Inventories are carried at cost using the weighted average method. In accordance with IAS 2, in addition to directly attributable unit costs, manufacturing costs also include overheads attributable to the production process, including an appropriate share of depre ciation charges on production facilities, which are determined on the basis of normal capacity utilization of the production facilities. Inventories are written down if the net realizable value is lower than the acquisition or manu-facturing cost carried in the balance sheet.
Acquired intangible assets are recognized at cost and are classified as assets with finite and indefinite useful lives. Self-developed intangible assets are not capitalized. Intangible assets with indefinite useful lives acquired in the course of business combinations are recognized at fair value on the date of acquisition. This includes purchased goodwill and intangible assets used in products that have not yet reached market maturity. Intangible assets with indefinite useful lives are not amortized, however they are tested for impairment when a triggering event arises or at least once a year in accordance with IAS 36. Goodwill is tested for impairment either annually or if there are indications of impairment, and is allocated to cash-generating units. A cash-generating unit is normally a segment as presented under Segment Reporting.
other non-financial assets and liabilities
inventories
intangible assets
merck Annual Report 2009112
In a few cases, the cash-generating unit is a company or a business field (reporting level within a segment). The carrying amounts of the cash-generating units are compared with their recoverable amounts and impairment losses are recognized where recoverable amount is lower than the carrying amount. The recoverable amount of a cash- genera ting unit is determined as the higher of fair value less costs to sell and value in use estimated using the discounted cash flow method. When measuring goodwill, Merck determines the recoverable amount by discounting expected cash flows and therefore uses the value in use method. Reference is made to existing forecasts that usually cover a period of four years. Cash flows for periods in excess of this are included using a long-term growth rate of 1.0% that is applied uniformly to all cash-generating units. The expected future cash flows are discounted using a weighted average cost of capital (WACC) of 7.5% after taxes (2008: 9.5%). A 10% reduction in future cash flows was assumed when calculating sensitivity. We regard greater volatility as unlikely based on our experience. If the actual future cash flows were 10% lower than the expected cash flows, this would lower the goodwill of the Consumer Health Care division by € 6 million. In this case, the cash-generating unit is a Group company.Any impairment losses on other intangible assets with indefinite useful lives are calculated in the same way as for goodwill. Fair value less costs to sell was used to determine the recoverable amount of income from licensing agreements capitalized during the purchase price allocation for Serono. Future product cash flows that were calculated using external market data are discounted to their present value. The discount rate amounts to 8.25% (2008: 9.68%) and is determined on the basis of market data for a peer group of companies. Impairment losses recognized on indefinite-lived intangible assets other than goodwill are reversed if the original reasons for impairment no longer apply. Intangible assets with a finite useful life are depreciated using the straight- line method. The useful lives of acquired conces-sions, property rights, licenses, patents, brand names, trademarks and software are between 3 and 15 years. Amortization of intangible assets other than software is reported separately. This item primarily comprises amortization in connection with the allocation of the Serono purchase price, but also to a lesser extent amortization of other intangible assets. Amortization of software is allocated to the functional areas in the income statement. An impairment test is performed if there are indications of impairment. Impairment losses are determined using the same methodology as for indefinite-lived intangible assets. Impairment losses recognized on finite-lived intangible assets are reversed if the original reasons for impairment no longer apply.
113Company management Report Corporate governanceto our shareholders Consolidated Financial Statements Further information
notes

Property, plant and equipment is carried at the cost of acquisi tion or manufacture less depreciation. The component approach is applied here in accordance with IAS 16. Sub sequent acquisition and manufacturing costs are only capitalized if it is probable that future economic benefits will arise for the Group and the cost of the asset can be measured reliably. The cost of manufacture of self-constructed property, plant and equipment is calculated on the basis of the directly attributable unit costs and an appropriate share of overheads, including depreciation and write-downs. Financing costs are capitalized if material. In accordance with IAS 20, costs of acquisition or manufacture are reduced by the amount of government grants in those cases where government grants or subsidies have been paid for the acquisition or manufacture of assets (investment grants). Grants related to expenses which no longer offset future expenses are recognized in income. Property, plant and equipment is depreciated by the straight-line method over the useful life of the asset concerned. The useful life applied to pro-duction buildings is a maximum of 33 years. Administration buildings are depreciated over a maximum of 40 years. The useful lives of machinery and technical equipment is between 6 and 20 years, and between 3 and 10 years for other facilities, factory and office equipment. The useful lives are reviewed regularly and adjusted if necessary. If indications of a decline in value exist, an impairment test is performed. The determination of the possible need to recognize impairments proceeds in the same as for intangible assets. If the reasons for an impairment loss no longer exist, a write-up is recorded.
Assets of this category are of minor importance to the Merck Group and are carried at cost.
Where assets are leased and economic ownership lies with the Group company (finance lease), the asset is recognized at the present value of the lease payments or the lower fair value in accordance with IAS 17 and depreciated over its useful life. The corresponding payment obliga-tions from future lease payments are recorded as liabilities.
Deferred tax assets and liabilities result from temporary differences of consolidated companies between the carrying amount of an asset or liability in the balance sheet and its tax base as well as from consolidation activities, as far as the carrying amount of the asset or liability is recovered or settled in future periods. In addition, deferred tax assets are recorded in particular for tax loss carryforwards if and insofar as their utilization is probable in the foreseeable future. In accordance with the liability method, the tax rates applicable or enacted as of balance sheet date are used.
Property, plant and equipment
investment property
leasing
deferred taxes
merck Annual Report 2009114

Provisions are recognized in the balance sheet if Merck has a present obligation (legal or constructive) as a result of a past event, it is probable that an outflow of resources will be required to settle the obligation and the amount of the obligation can be measured reliably. The carrying value of provisions takes into account the amounts required to cover future payment obligations, recognizable risks and uncertain obligations of the Merck Group to third parties. Measurement is based on the settlement amount with the highest probability or if the probabilities are equivalent, it is based on the expected value of the settlement amounts. Long-term provisions are discounted and carried at their present value as of the end of the reporting period. To the extent that reimbursement claims exist as defined in IAS 37, they are recognized separately as an asset if their realization is virtually certain.
Provisions for pensions and other post-employment benefits are recorded in the balance sheet in accordance with IAS 19. Depending on the legal, economic and fiscal circumstances prevailing in each country, different retirement benefit systems are provided for the employees of the Merck Group. As a rule, these systems are based on length of service and salary of the employees. Pension obligations of the Merck Group include both defined benefit and defined contribution plans and comprise both obligations from current pensions and accrued benefits for pensions payable in the future. In the Merck Group, defined benefit plans are funded and unfunded. The bulk of obligations from current pensions and accrued benefits for pensions payable in the future is covered by the provisions disclosed here. The smaller portion is covered by funded pension commitments. These provisions also contain other post-employment benefits, such as accrued future healthcare costs for pensioners in the United States. The obligations of our companies under defined benefit plans are measured using the projected unit credit method. Under the projected unit credit method, dynamic parameters are taken into account in calculating the expected benefit payments after an insured event occurs; these pay-ments are spread over the entire period of service of the participating employees. Annual actu-arial opinions are prepared for this purpose. In accordance with the option under IAS 19.93A, actuarial gains and losses resulting from changes in actuarial assumptions and/or experience adjustments (the effects of differences between the previous actuarial assumptions and what has actually occurred) are recognized immediately in equity as soon as they are incurred taking deferred taxes into account. The gains and losses recognized in equity are disclosed separately in the Statement of Comprehensive Income.
Provisions
Provisions for pensions and other post-
employment benefits
115Company management Report Corporate governanceto our shareholders Consolidated Financial Statements Further information
notes
NoteS to the iNCome StatemeNt
Sales are generated primarily from the sale of goods and to a limited degree include revenues from services rendered. Merck Group sales totaled € 7,377.7 million in 2009, which represents an increase of 2.4% over the previous year. Adjusted for the impact of currency and acquisitions, organic growth amounted to 2.7%.Sales are presented by business sector, division and region under Segment Reporting.
In 2009, royalty income totaled € 344.9 million (2008: € 356.4 million) and mainly included royalty income from the products Avonex ® (Biogen Idec), Humira ® (Abbott), Enbrel ® (Amgen) and Puregon ® (Merck & Co.), as well as income from the active pharmaceutical ingredients bisoprolol and metformin.In 2009, commission income totaled € 24.4 million (2008: € 31.6 million). This primarily consisted of cooperation and distribution agreements, such as for Ikorel ® (Sanofi-Aventis), Euthyrox ® (Bracco) and Allergan products.
The cost of sales includes the cost of manufactured products as well as goods purchased for resale. In accordance with IAS 2, the cost comprises overheads directly attributable to the production process, including depreciation charges on production facilities, in addition to directly attributable costs, such as the cost of mate rials, personnel and energy. We also disclose write-downs of inventories as part of cost of sales.
In addition to the cost of sales and marketing departments and of the sales force, marketing and selling expenses include advertising, logistics as well as license and commission expenses. License expenses amounted to € 156.2 million (2008: € 186.2 million) and commission expenses totaled € 256.8 million (2008: € 165.2 million).
Personnel costs and material expenses of management and administra tive functions are recorded under this item unless they have been charged to other cost centers as internal services.
[1] Sales
[2] Royalty and
commission income
[3] Cost of sales
[4] marketing and
selling expenses
[5] Administration expenses
merck Annual Report 2009116
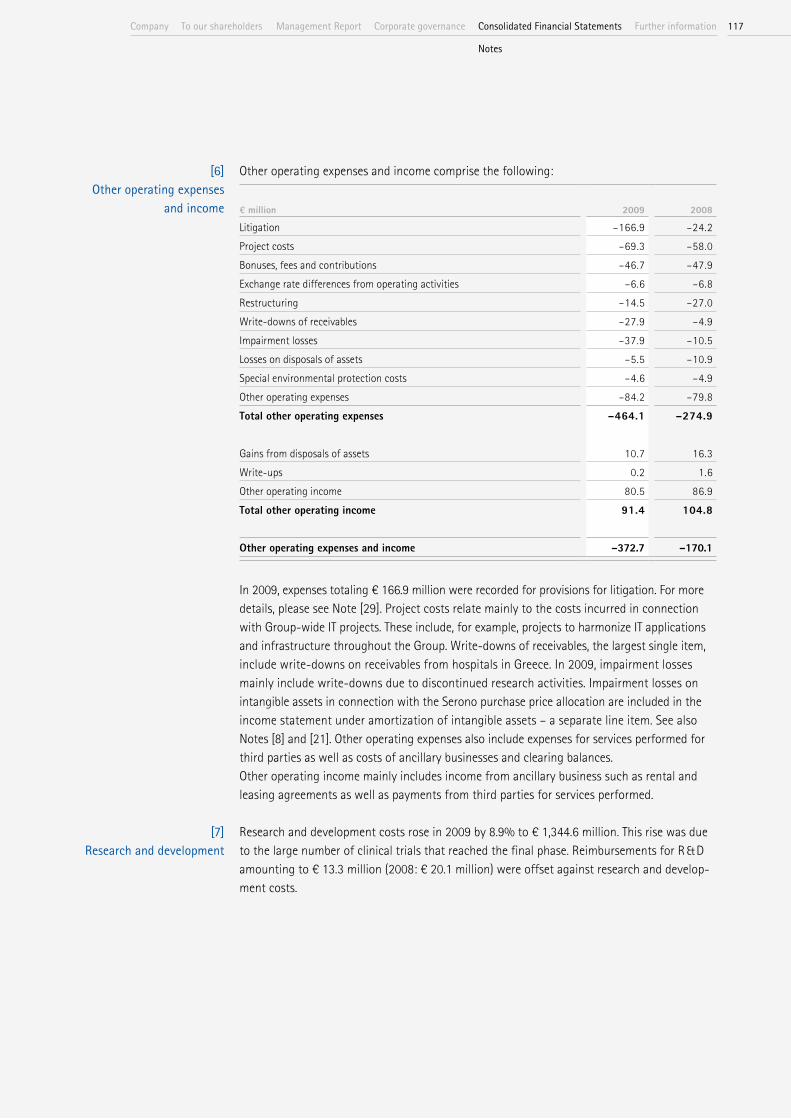
Other operating expenses and income comprise the following:
€ million 2009 2008
Litigation –166.9 –24.2Project costs –69.3 –58.0Bonuses, fees and contributions –46.7 –47.9Exchange rate differences from operating activities –6.6 –6.8Restructuring –14.5 –27.0Write-downs of receivables –27.9 –4.9Impairment losses –37.9 –10.5Losses on disposals of assets –5.5 –10.9Special environmental protection costs –4.6 –4.9Other operating expenses –84.2 –79.8Total other operating expenses –464.1 –274.9
Gains from disposals of assets 10.7 16.3Write-ups 0.2 1.6Other operating income 80.5 86.9Total other operating income 91.4 104.8
Other operating expenses and income –372.7 –170.1
In 2009, expenses totaling € 166.9 million were recorded for provisions for litigation. For more details, please see Note [29]. Project costs relate mainly to the costs incurred in connection with Group-wide IT projects. These include, for example, projects to harmonize IT applications and infrastructure throughout the Group. Write-downs of receivables, the largest single item, include write-downs on receivables from hospitals in Greece. In 2009, impairment losses mainly include write-downs due to discontinued research activities. Impairment losses on intangible assets in connection with the Serono purchase price allocation are included in the income statement under amortization of intangible assets – a separate line item. See also Notes [8] and [21]. Other operating expenses also include expenses for services performed for third parties as well as costs of ancillary businesses and clearing balances. Other operating income mainly includes income from ancillary business such as rental and leasing agreements as well as payments from third parties for services performed.
Research and development costs rose in 2009 by 8.9% to € 1,344.6 million. This rise was due to the large number of clinical trials that reached the final phase. Reimbursements for R & D amounting to € 13.3 million (2008: € 20.1 million) were offset against research and develop-ment costs.
[6] other operating expenses
and income
[7] Research and development
117Company management Report Corporate governanceto our shareholders Consolidated Financial Statements Further information
notes
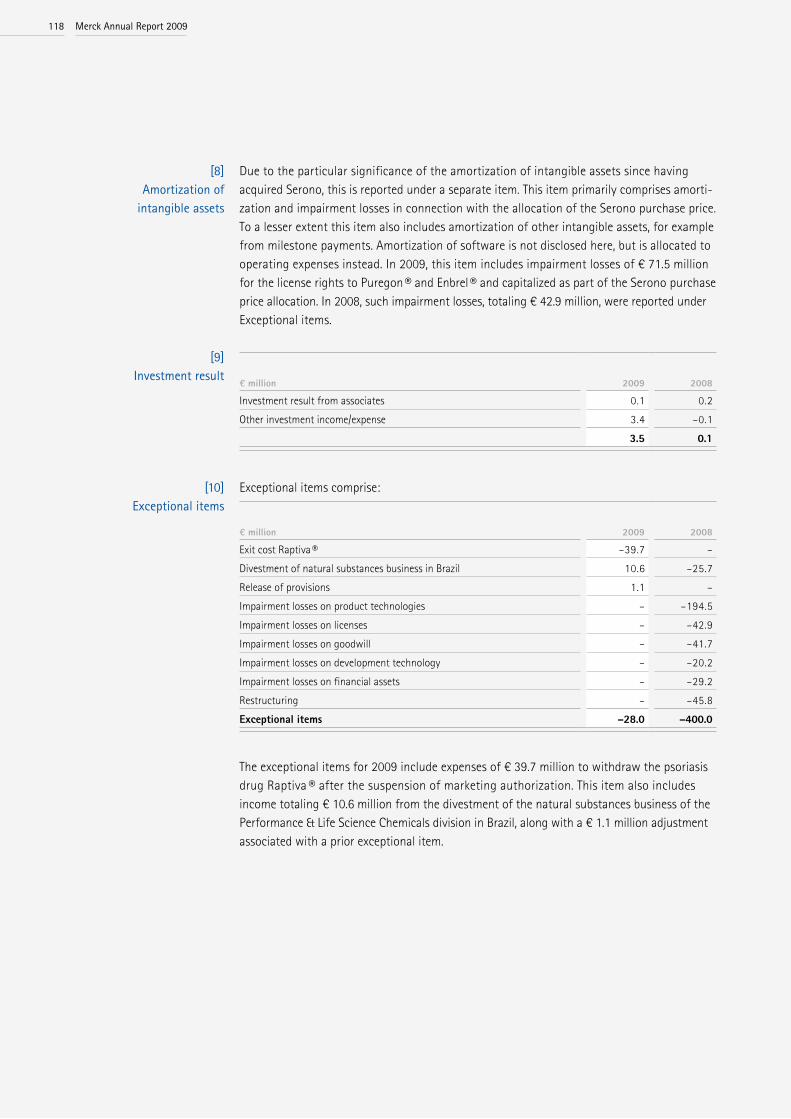
Due to the particular significance of the amortization of intangible assets since having acquired Serono, this is reported under a separate item. This item primarily comprises amorti-zation and impairment losses in connection with the allocation of the Serono purchase price. To a lesser extent this item also includes amortization of other intangible assets, for example from milestone payments. Amortization of software is not disclosed here, but is allocated to operating expenses instead. In 2009, this item includes impairment losses of € 71.5 million for the license rights to Puregon ® and Enbrel ® and capitalized as part of the Serono purchase price allocation. In 2008, such impairment losses, totaling € 42.9 million, were reported under Exceptional items.
€ million 2009 2008
Investment result from associates 0.1 0.2Other investment income/expense 3.4 –0.1
3.5 0.1
Exceptional items comprise:
€ million 2009 2008
Exit cost Raptiva ® –39.7 –Divestment of natural substances business in Brazil 10.6 –25.7Release of provisions 1.1 –Impairment losses on product technologies – –194.5Impairment losses on licenses – –42.9Impairment losses on goodwill – –41.7Impairment losses on development technology – –20.2Impairment losses on financial assets – –29.2Restructuring – –45.8Exceptional items –28.0 –400.0
The exceptional items for 2009 include expenses of € 39.7 million to withdraw the psoriasis drug Raptiva ® after the suspension of marketing authorization. This item also includes income totaling € 10.6 million from the divestment of the natural substances business of the Performance & Life Science Chemicals division in Brazil, along with a € 1.1 million adjustment associated with a prior exceptional item.
[8] Amortization of
intangible assets
[9] investment result
[10] exceptional items
merck Annual Report 2009118

€ million 2009 2008
Interest income and similar income 33.6 36.6Interest expenses and similar expenses –88.7 –84.9Interest component from currency hedging transactions –3.3 –23.5
–58.4 –71.8
Interest component of the addition to pension provisions and other provisions for personnel expenses –74.4 –66.4Exchange rate differences from financing activities –3.8 –18.4Income from financial interests 2.1 0.1
–134.5 –156.5
€ million 2009 2008
Current taxes in the period –270.8 –242.4Current taxes in the period on exceptional items 6.1 2.6Taxes for previous periods –6.3 2.9Deferred taxes in the period 166.2 –11.7Deferred taxes in the period on exceptional items –4.9 52.8
–109.7 –195.8
Tax rate 22.6% 34.1%Tax rate before exceptional items 21.6% 25.8%
The tax expense consists of corporation and trade taxes for the companies domiciled in Germany as well as comparable income taxes for foreign companies. As a result of changes in tax rates at individual companies, total deferred tax income of € 2.6 million was recorded (2008: € 1.7 million tax expense).
The reconciliation between deferred tax assets and liabilities shown in the balance sheet and deferred taxes in the income statement is presented below:
€ million 2009 2008
Change in deferred tax assets (balance sheet) 65.3 15.9Change in deferred tax liabilities (balance sheet) 132.7 –73.8Deferred taxes credited/debited to equity –38.9 17.9Changes in scope of consolidation/currency translation/ Other changes 2.2 81.1Deferred taxes (income statement) 161.3 41.1
[11] Financial result
[12] income tax
119Company management Report Corporate governanceto our shareholders Consolidated Financial Statements Further information
notes

Tax loss carryforwards are structured as follows:
€ million
Dec. 31, 2009 Dec. 31, 2008
Germany Abroad Total Germany Abroad Total
Tax loss carry-forwards 164.3 121.9 286.2 121.6 288.1 409.7thereof:Including de-ferred tax asset 98.2 32.4 130.6 – 29.2 29.2Deferred tax asset 14.5 8.3 22.8 – 7.4 7.4thereof:Excluding de-ferred tax asset 66.1 89.5 155.6 121.6 258.9 380.5Theoretical de-ferred tax asset 10.5 17.1 27.6 18.5 34.2 52.7
The decrease in tax loss carryforwards compared with the previous year was mainly the result of the positive business development of the relevant Group companies. Deferred tax assets are recognized for tax loss and interest carryforwards only if realiza tion of the related tax benefit is probable in the foreseeable future. Based on the tax planning data for subsequent fiscal years, deferred tax assets totaling € 16.1 million were recognized for tax loss carryforwards for individual companies of the Merck Group. The vast majority of the loss carryforwards either has no expiry date or can be carried forward for up to 20 years. The interest carryforward results from the German earnings stripping rule and has no expiry date. Deferred tax assets on interest carryforwards were recognized, amounting to € 7.5 million. In 2009, the income tax burden was reduced by € 15.6 million (2008: € 7.5 million) due to the utilization of tax loss carryforwards and interest carryforwards from prior years for which no deferred tax asset had been recognized in prior periods. The tax loss carryforwards accumulated in Germany for corporation tax amounted to € 73.8 mil-lion (2008: € 57.6 million) and to € 90.5 million (2008: € 64.0 million) for trade tax. The decline in additional theoretically possible deferred tax assets to € 27.6 million (2008: € 52.7 million) results mainly from the utilization of loss carryforwards without deferred tax assets and from the capitalization of deferred tax assets on tax loss carryforwards that were not recognized in previous periods.
merck Annual Report 2009120

Deferred tax assets and liabilities correspond to the following balance sheet items:
€ million
Dec. 31, 2009 Dec. 31, 2008
Assets Liabilities Assets Liabilities
Intangible assets 31.8 704.2 37.5 758.3Property, plant and equipment 7.3 68.2 4.5 84.1Current and non-current financial assets 2.6 15.7 2.3 28.1Inventories 242.0 5.0 261.1 47.1Current and non-current receivables/Other assets 22.4 11.9 28.7 9.1Provisions for pensions and other post-em-ployment benefits 87.2 11.9 58.6 10.3Current and non-current other provisions 172.0 9.4 131.6 7.7Current and non-current liabilities 17.6 6.1 22.3 9.1Tax loss carryforwards 22.8 – 7.4 –Tax refund claims/Other 20.0 11.4 0.3 16.6Offset deferred tax assets and liabilities –80.3 –80.3 –74.2 –74.2Total deferred taxes 545.4 763.5 480.1 896.2
Deferred tax liabilities of € 11.4 million (2008: € 23.0 million) were set up for temporary differ-ences for interests in subsidiaries. These relate to planned dividend payments. No deferred tax liabilities were recognized for other temporary differences since the reversal of these differences is not foreseeable. In addition to deferred tax assets on tax loss carryforwards, deferred tax assets of € 522.6 million (2008: € 472.7 million) were recognized for other temporary differences.The following table presents the tax reconciliation from theoretical tax expense to tax expense before exceptional items and tax expense according to income statement. The theoretical tax rate is determined by applying the statutory tax rates of the German and foreign companies in proportion to their contribution to consolidated profit. The change in comparison with 2008 resulted from the change in the consolidated contributions in relation to local tax rates.
121Company management Report Corporate governanceto our shareholders Consolidated Financial Statements Further information
notes

€ million 2009 2008
Consolidated profit before tax 486.4 574.9Exceptional items –28.0 –400.0Consolidated profit before tax and exceptional items 514.4 974.9
Theoretical tax rate 26.5% 29.6%Theoretical tax expense before exceptional items –136.3 –288.6Tax effect of companies with a negative contribution to consolidated profit –26.3 –41.1Taxes for other periods –6.3 2.9Tax credits 28.1 66.6Effect of non-deductible expenses/ tax-free income/tax allowances 29.9 9.0Tax expense before exceptional items –110.9 –251.2
Tax rate before exceptional items 21.6% 25.8%
Taxes on exceptional items 1.2 55.4Tax expense according to income statement –109.7 –195.8
Tax rate according to income statement 22.6% 34.1%
Minority interest in net profit is primarily composed of the minority interests in the listed companies Merck Ltd., India, and PT Merck Tbk., Indonesia, as well as in Merck Ltd., Thailand, and Allergopharma J. Ganzer KG, Germany.
Basic earnings per share are calculated by dividing the net profit after minority interest by the weighted average number of theoretical shares outstanding. The use of a theo retical number of shares takes into account the fact that the general partner’s capital is not represented by shares. The share capital of € 168.0 million is divided into 64,621,126 shares. Accordingly, the general partner’s capital of € 397.2 million is divided into 152,767,813 theoretical shares. Overall, the total capital thus amounts to € 565.2 million or 217,388,939 theoretical shares.
As of December 31, 2009 there were no potentially dilutive shares.
2009 2008
Net profit after minority interest (€ million) 366.3 367.1Weighted average number of theoretical shares outstanding (in millions) 217.4 217.4Basic earnings per share (€) 1.68 1.69
[13] minority interest
[14] earnings per share
merck Annual Report 2009122
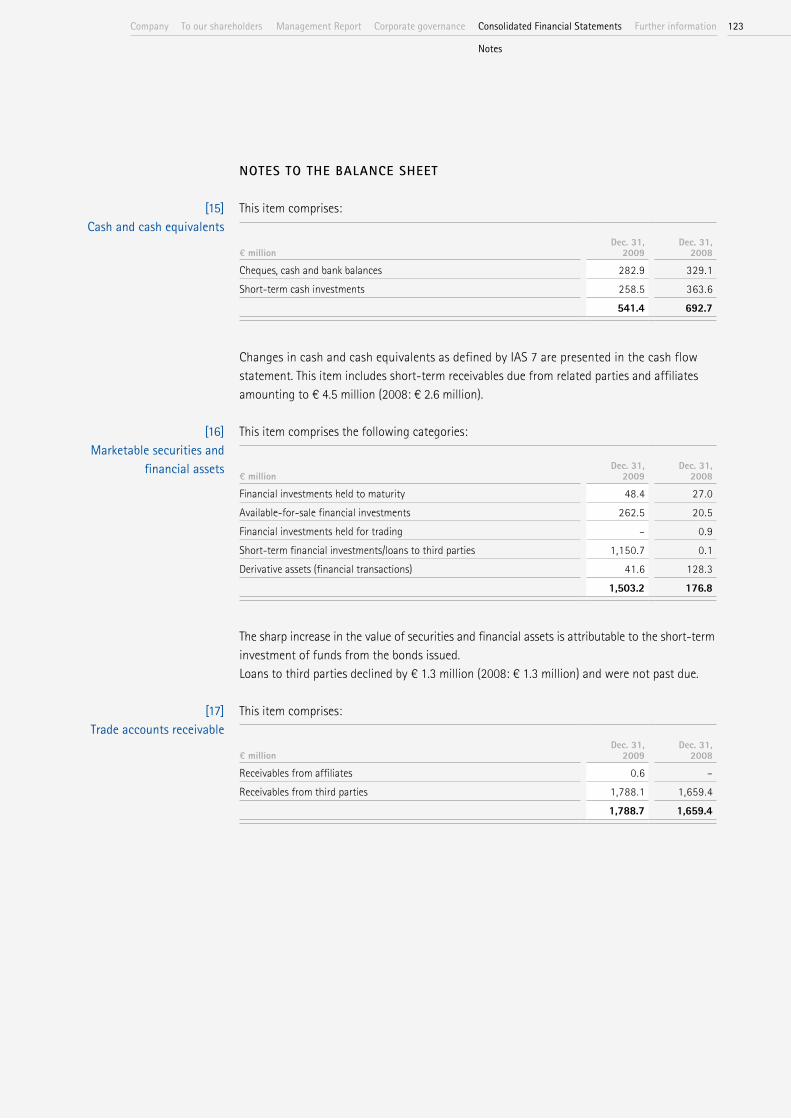
NoteS to the BalaNCe Sheet
This item comprises:
€ millionDec. 31,
2009Dec. 31,
2008
Cheques, cash and bank balances 282.9 329.1Short-term cash investments 258.5 363.6
541.4 692.7
Changes in cash and cash equivalents as defined by IAS 7 are presented in the cash flow statement. This item includes short-term receivables due from related parties and affiliates amounting to € 4.5 million (2008: € 2.6 million).
This item comprises the following categories:
€ millionDec. 31,
2009Dec. 31,
2008
Financial investments held to maturity 48.4 27.0Available-for-sale financial investments 262.5 20.5Financial investments held for trading – 0.9Short-term financial investments/loans to third parties 1,150.7 0.1Derivative assets (financial transactions) 41.6 128.3
1,503.2 176.8
The sharp increase in the value of securities and financial assets is attributable to the short-term investment of funds from the bonds issued. Loans to third parties declined by € 1.3 million (2008: € 1.3 million) and were not past due.
This item comprises:
€ millionDec. 31,
2009Dec. 31,
2008
Receivables from affiliates 0.6 –Receivables from third parties 1,788.1 1,659.4 1,788.7 1,659.4
[15] Cash and cash equivalents
[16] marketable securities and
financial assets
[17] trade accounts receivable
123Company management Report Corporate governanceto our shareholders Consolidated Financial Statements Further information
notes

Trade accounts receivable past due are as follows:
€ millionDec. 31,
2009Dec. 31,
2008
Neither impaired nor past due 1,327.8 1,209.5Past due, but not impaired up to 3 months 214.8 236.9 up to 6 months 89.6 92.8 up to 12 months 68.7 73.8 over 1 year 87.6 46.0Impaired 0.2 0.4Book value 1,788.7 1,659.4
The corresponding write-downs developed as follows:
€ million 2009 2008
January 1 -16.6 -46.7Additions (net) -27.9 -4.9Utilizations 1.9 36.3Currency translation and other changes -3.4 -1.3December 31 -46.0 -16.6
Because of the increased risk of default, especially in Greece, Germany and Switzerland, write-downs were recorded for receivables. In Greece, receivables from state hospitals were written down by € 12.5 million. With regard to trade accounts receivable that are neither impaired nor delayed, as of the report-ing date, there are no indications that the debtors will not meet their payment obligations.
merck Annual Report 2009124

This item comprises:
€ millionDec. 31,
2009Dec. 31,
2008
Raw materials and production supplies 174.1 253.6Work in progress, finished goods and goods purchased for resale 1,193.8 1,152.3Advance payments – 1.5
1,367.9 1,407.4
Write-downs of inventories amounted to € 141.7 million as of the balance sheet date (2008: € 93.5 million). The fair value of inventories that were written down amounts to € 526.3 mil-lion (2008: € 377.6 million). As of the balance sheet date, no inventories were used to secure liabilities.
Other receivables and other assets include refund claims in connection with non-income-related taxes (mainly value added tax), prepayments and interest deferrals.
Other assets comprise the following:
[18] inventories
[19] other assets
€ million current non-currentDec. 31,
2009 current non-currentDec. 31,
2008
Receivables from third parties 159.8 56.6 216.4 138.4 50.6 189.0 Receivables from related parties 14.9 – 14.9 22.5 – 22.5 Receivables from affiliates 0.0 – 0.0 2.8 – 2.8 Receivables from associates – – – – – –other receivables 174.7 56.6 231.3 163.7 50.6 214.3Derivative assets (operational) 29.5 28.6 58.1 47.0 – 47.0Prepaid expenses 48.9 3.7 52.6 40.7 1.6 42.3Refund claims on plan assets 15.2 – 15.2 19.9 – 19.9Other assets 7.3 10.6 17.9 12.0 11.5 23.5
275.6 99.5 375.1 283.3 63.7 347.0
125Company management Report Corporate governanceto our shareholders Consolidated Financial Statements Further information
notes

Other receivables from third parties past due are as follows:
€ millionDec. 31,
2009Dec. 31,
2008
Neither impaired nor past due 206.5 172.3Past due, but not impaired up to 3 months 7.8 12.6 up to 6 months 1.3 1.2 up to 12 months 0.2 0.7 over 1 year 0.6 2.2Impaired – –Book value 216.4 189.0
Write-downs or write-ups of other receivables from third parties were not necessary in either 2009 or 2008. With regard to other receivables that are neither impaired nor delayed, as of the reporting date there are no indications that the debtors will not meet their payment obligations.
Tax receivables amounted to € 55.3 million (2008: € 139.1 million) and resulted from tax prepayments that exceed the actual amount of tax pay able for 2009 and prior fiscal years, and from refund claims for prior years as well as withholding tax credits.
[20] tax receivables
merck Annual Report 2009126
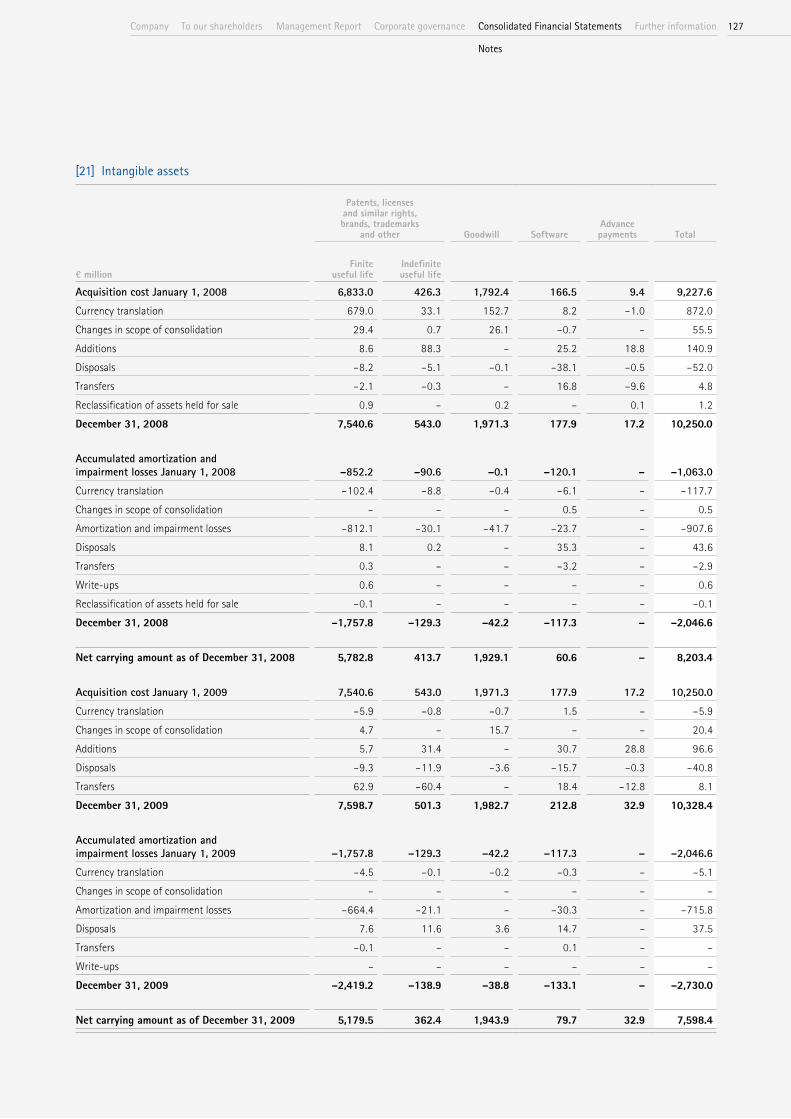
[21] intangible assets
€ million
Patents, licenses and similar rights, brands, trademarks
and other Goodwill SoftwareAdvance payments Total
Finite useful life
Indefinite useful life
acquisition cost January 1, 2008 6,833.0 426.3 1,792.4 166.5 9.4 9,227.6Currency translation 679.0 33.1 152.7 8.2 –1.0 872.0Changes in scope of consolidation 29.4 0.7 26.1 –0.7 – 55.5Additions 8.6 88.3 – 25.2 18.8 140.9Disposals –8.2 –5.1 –0.1 –38.1 –0.5 –52.0Transfers –2.1 –0.3 – 16.8 –9.6 4.8Reclassification of assets held for sale 0.9 – 0.2 – 0.1 1.2December 31, 2008 7,540.6 543.0 1,971.3 177.9 17.2 10,250.0
accumulated amortization and impairment losses January 1, 2008 –852.2 –90.6 –0.1 –120.1 – –1,063.0Currency translation –102.4 –8.8 –0.4 –6.1 – –117.7Changes in scope of consolidation – – – 0.5 – 0.5Amortization and impairment losses –812.1 –30.1 –41.7 –23.7 – –907.6Disposals 8.1 0.2 – 35.3 – 43.6Transfers 0.3 – – –3.2 – –2.9Write-ups 0.6 – – – – 0.6Reclassification of assets held for sale –0.1 – – – – –0.1December 31, 2008 –1,757.8 –129.3 –42.2 –117.3 – –2,046.6
Net carrying amount as of December 31, 2008 5,782.8 413.7 1,929.1 60.6 – 8,203.4
acquisition cost January 1, 2009 7,540.6 543.0 1,971.3 177.9 17.2 10,250.0Currency translation –5.9 –0.8 –0.7 1.5 – –5.9Changes in scope of consolidation 4.7 – 15.7 – – 20.4Additions 5.7 31.4 – 30.7 28.8 96.6Disposals –9.3 –11.9 –3.6 –15.7 –0.3 –40.8Transfers 62.9 –60.4 – 18.4 –12.8 8.1December 31, 2009 7,598.7 501.3 1,982.7 212.8 32.9 10,328.4
accumulated amortization and impairment losses January 1, 2009 –1,757.8 –129.3 –42.2 –117.3 – –2,046.6Currency translation –4.5 –0.1 –0.2 –0.3 – –5.1Changes in scope of consolidation – – – – – –Amortization and impairment losses –664.4 –21.1 – –30.3 – –715.8Disposals 7.6 11.6 3.6 14.7 – 37.5Transfers –0.1 – – 0.1 – –Write-ups – – – – – –December 31, 2009 –2,419.2 –138.9 –38.8 –133.1 – –2,730.0
Net carrying amount as of December 31, 2009 5,179.5 362.4 1,943.9 79.7 32.9 7,598.4
127Company management Report Corporate governanceto our shareholders Consolidated Financial Statements Further information
notes

The change in currency translation differences relative to 2008 is due mainly to the translation of intangible assets reported in Swiss francs into euros – the Group reporting currency.The net carrying amount of patents, licenses, similar rights with finite useful lives amounting to € 5,179.5 million mainly include the recognized assets from the Serono purchase price allo-cation in 2007. The vast majority is attributable to technologies and know-how. The remaining useful lives range between 9 and 12 years. This item also includes licenses with remaining useful lives of between 3 and 8 years.In fiscal 2009, impairment losses on intangible assets with finite useful lives totaled € 78.9 mil-lion. Of this total, € 71.5 million was attributable to the licensing rights to Enbrel ® (Amgen) and Puregon ® (Merck & Co.) capitalized as part of the Serono purchase price allocation, which were written down to the lower value in use due to new estimates on the amount and timing of royalty income. These issues are disclosed in a separate line item in the income statement under amortization of intangible assets.Owing to amended market estimates and the subsequently sharply lower sales expectations, we recorded a write-off of € 6.9 million on patents and brands from the Liquid Crystals divi-sion. The remaining impairments totaling € 0.5 million were attributable to the Performance & Life Science Chemicals division. These impairment losses are recorded under other operat-ing expenses.The changes in goodwill caused by currency effects result almost exclusively from translating the goodwill for Serono from Swiss francs into euros, the reporting currency of the Merck Group.Since goodwill and intangible assets with indefinite useful lives are not amortized, these are subjected to an annual impairment test. Here, book values were compared with values in use. Consequently, impairment losses of € 21.1 million result in fiscal 2009. These were primarily due to the write-off of the capitalized assets related to the termination of various research projects from the Merck Serono division and are recorded under other operating expenses.
merck Annual Report 2009128

The book values of patents, licenses and similar rights, brands, trademarks and other as well as goodwill can be attributed to the divisions as follows:
€ million Merck SeronoConsumer
Health CareLiquid
Crystals
Performance & Life Science
Chemicals Total
Patents, licenses, similar rights, brands, trademarks and otherFinite useful life 5,120.6 24.5 14.4 20.0 5,179.5 Rebif ® 3,221.5 – – – 3,221.5 Gonal-f ® 765.2 – – – 765.2 Saizen ® 275.3 – – – 275.3 Avonex ® 152.7 – – – 152.7 Humira ® 267.9 – – – 267.9 Enbrel ® 109.1 – – – 109.1 Puregon ® 51.3 – – – 51.3 Other 277.6 24.5 14.4 20.0 336.5
Indefinite useful life 338.7 – 17.6 6.1 362.4 Safinamide 176.8 – – – 176.8 Cladribine 48.2 – – – 48.2 Other 113.7 – 17.6 6.1 137.4
Goodwill 1,670.5 164.4 4.1 104.9 1,943.9
Intangible assets with an indefinite useful life primarily relate to rights that Merck has acquired for products or technologies that are still in the research and development stage. Amortization will only begin once the products start to be marketed.
129Company management Report Corporate governanceto our shareholders Consolidated Financial Statements Further information
notes

[22] Property, plant and equipment
€ million
Land, land- rights and build-
ings, including buildings on third-
party landPlant and
machinery
Other facilities, operating and
office equipment
Construction in progress and
advance payments to vendors and
contractors Total
acquisition cost January 1, 2008 1,754.9 2,325.3 760.2 187.4 5,027.8Currency translation 72.5 37.5 4.7 4.8 119.5Changes in scope of consolidation – –2.4 1.4 0.2 –0.8Additions 25.2 44.6 46.4 278.5 394.7Disposals –16.4 –80.8 –71.1 –4.1 –172.4Transfers 48.3 65.6 32.5 –151.2 –4.8Reclassification of assets held for sale 1.3 1.8 0.6 0.1 3.8December 31, 2008 1,885.8 2,391.6 774.7 315.7 5,367.8
accumulated depreciation and impairment losses January 1, 2008 –646.5 –1,544.4 –548.6 –13.8 –2,753.3Currency translation –19.2 –32.3 –4.4 –0.4 –56.3Changes in scope of consolidation –0.5 1.7 –1.6 –0.1 –0.5Depreciation and impairment losses –68.4 –146.0 –62.5 –1.1 –278.0Disposals 13.9 76.7 67.9 0.1 158.6Transfers 0.4 0.4 2.1 – 2.9Write-ups 0.4 0.5 0.1 – 1.0Reclassification of assets held for sale –0.5 –1.2 –0.4 – –2.1December 31, 2008 –720.4 –1,644.6 –547.4 –15.3 –2,927.7
Net carrying amount as of December 31, 2008 1,165.4 747.0 227.3 300.4 2,440.1
acquisition cost January 1, 2009 1,885.8 2,391.6 774.7 315.7 5,367.8Currency translation 0.8 3.0 1.5 2.6 7.9Changes in scope of consolidation 3.5 2.9 2.2 – 8.6Additions 26.9 48.3 45.2 346.9 467.3Disposals –60.5 –61.3 –52.3 –5.6 –179.7Transfers 37.7 71.0 33.6 –150.4 –8.1December 31, 2009 1,894.2 2,455.5 804.9 509.2 5,663.8
accumulated depreciation and impairment losses January 1, 2009 –720.4 –1,644.6 –547.4 –15.3 –2,927.7Currency translation –1.2 –1.8 –1.3 – –4.3Changes in scope of consolidation –0.4 –0.6 –0.3 – –1.3Depreciation and impairment losses –73.7 –145.6 –66.3 – –285.6Disposals 54.1 57.1 46.5 4.8 162.5Transfers 0.2 –0.4 0.2 – –Write-ups 0.1 – 0.1 – 0.2December 31, 2009 –741.3 –1,735.9 –568.5 –10.5 –3,056.2
Net carrying amount as of December 31, 2009 1,152.9 719.6 236.4 498.7 2,607.6
merck Annual Report 2009130

Impairment losses totaled € 6.7 million in fiscal 2009. These were particularly attributable to impairment losses on production units in the Merck Serono and Performance & Life Science Chemicals divisions and are recorded under other operating expenses. Property, plant and equipment amounting to € 8.1 million served as collateral (2008: € 9.1 mil-lion). Total government grants and subsidies during the fiscal year amounted to € 5.4 million (2008: € 7.1 million).Property, plant and equipment also includes assets that are leased. The total value of capital-ized leased assets amounted to € 13.0 million (2008: € 12.7 million) and the corresponding obligations amounted to € 10.4 million (2008: € 9.5 million) (see Note [25]).
The book values of capitalized leased assets were as follows:
€ millionDec. 31,
2009Dec. 31,
2008
Capitalized leased buildings 11.7 11.7Capitalized leased vehicles 1.1 0.8Capitalized leased other property, plant and equipment 0.2 0.2
13.0 12.7
€ million 2009 2008
Book value January 1 1.3 1.4Additions – –Share of profit 0.1 0.2Disposals – –Currency translation 0.2 -0.3Book value December 31 1.6 1.3
[23] investments at equity
131Company management Report Corporate governanceto our shareholders Consolidated Financial Statements Further information
notes

[24] non-current financial assets and financial assets covering pension obligations
€ million
Investments in SecuritiesFinancial assets covering
pensions
Total
available- for-sale
affiliates
available- for-sale
companies
available- for-sale
financial investments
financial investments
held to maturity
available- for-sale
financial assets
financial assets
held to maturity
Loans and other
non-current financial
assets
acquisition cost January 1, 2008 94.7 27.4 5.6 11.7 – – 16.2 155.6Currency translation 0.3 – – –1.6 – – –0.1 –1.4Changes in scope of consolidation – –58.5 – – – – – –58.5Additions 19.0 57.2 0.1 – – – 6.2 82.5Disposals –3.4 –0.4 –0.5 – – – –6.7 –11.0Transfers – – – – – – – –December 31, 2008 110.6 25.7 5.2 10.1 – – 15.6 167.2
accumulated depreciation and impairment lossesJanuary 1, 2008 –20.3 –0.1 –4.5 – – – –0.4 –25.3Currency translation – – – – – – – –Changes in scope of consolidation – –0.1 – – – – – –0.1Depreciation and impairment losses –29.7 – – – – – – –29.7Disposals – – 0.2 – – – 0.1 0.3Fair value adjustments of long- term investments taken directly to equity –15.0 – – – – – – –15.0December 31, 2008 –65.0 –0.2 –4.3 – – – –0.3 –69.8
Net carrying amount as of December 31, 2008 45.6 25.5 0.9 10.1 – – 15.3 97.4
acquisition cost January 1, 2009 110.6 25.7 5.2 10.1 – – 15.6 167.2Currency translation – – –0.1 – – – – –0.1Changes in scope of consolidation – –34.3 – – – – – –34.3Additions 9.6 35.6 1.1 – 187.2 61.1 4.3 298.9Disposals –0.4 –4.2 –0.2 –10.1 –47.0 – –3.9 –65.8Transfers 0.6 –0.6 – – – – – –December 31, 2009 120.4 22.2 6.0 – 140.2 61.1 16.0 365.9
accumulated depreciation and impairment lossesJanuary 1, 2009 –65.0 –0.2 –4.3 – – – –0.3 –69.8Currency translation – – – – – – 0.1 0.1Changes in scope of consolidation – – – – – – – –Depreciation and impairment losses –1.9 – –0.7 – – – – –2.6Disposals 0.4 – – – – – 0.2 0.6Fair value adjustments of long- term investments taken directly to equity 25.5 – – – 8.3 – – 33.8December 31, 2009 –41.0 –0.2 –5.0 – 8.3 – – –37.9
Net carrying amount as of December 31, 2009 79.4 22.0 1.0 – 148.5 61.1 16.0 328.0
merck Annual Report 2009132
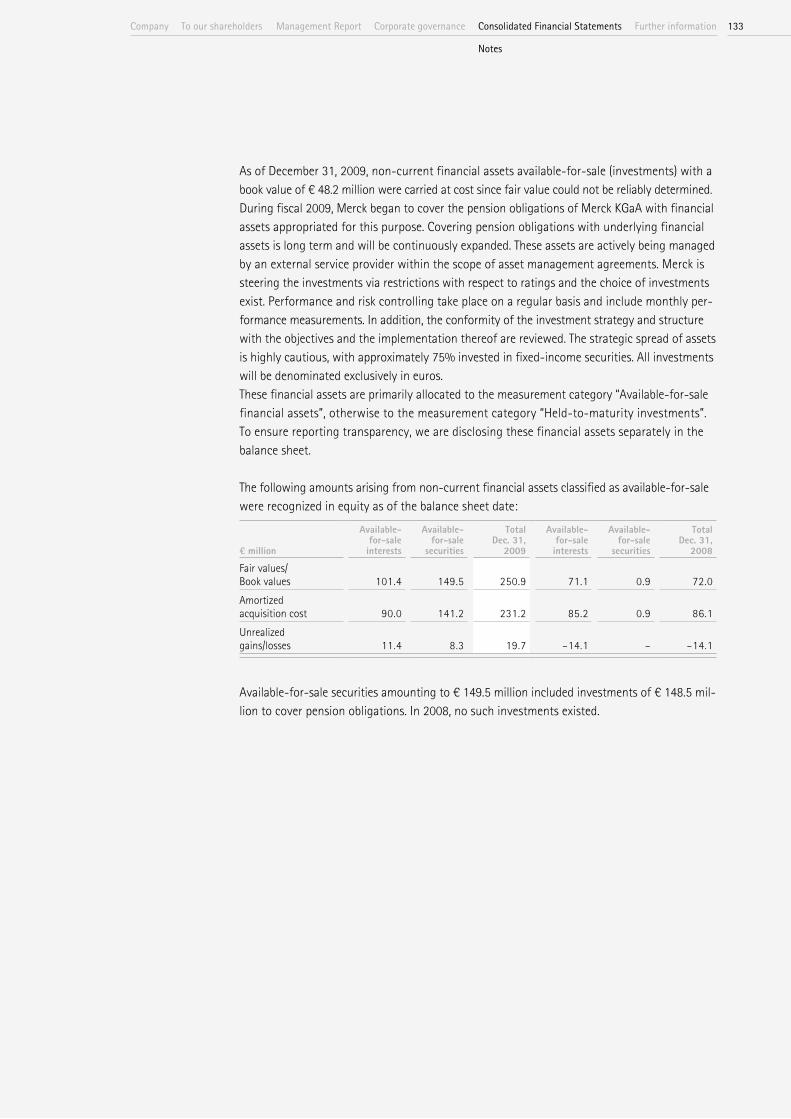
As of December 31, 2009, non-current financial assets available-for-sale (investments) with a book value of € 48.2 million were carried at cost since fair value could not be reliably determined.During fiscal 2009, Merck began to cover the pension obligations of Merck KGaA with finan cial assets appropriated for this purpose. Covering pension obligations with underlying financial assets is long term and will be continuously expanded. These assets are actively being managed by an external service provider within the scope of asset management agreements. Merck is steering the investments via restrictions with respect to ratings and the choice of investments exist. Performance and risk controlling take place on a regular basis and include monthly per-formance measurements. In addition, the conformity of the investment strategy and structure with the objectives and the implementation thereof are reviewed. The strategic spread of assets is highly cautious, with approximately 75% invested in fixed-income securities. All investments will be denominated exclusively in euros. These financial assets are primarily allocated to the measurement category “Available-for-sale financial assets”, otherwise to the measurement category “Held-to-maturity investments”. To ensure reporting transparency, we are disclosing these financial assets separately in the balance sheet.
The following amounts arising from non-current financial assets classified as available-for-sale were recognized in equity as of the balance sheet date:
€ million
Available- for-sale interests
Available- for-sale
securities
Total Dec. 31,
2009
Available- for-sale interests
Available- for-sale
securities
Total Dec. 31,
2008
Fair values/ Book values 101.4 149.5 250.9 71.1 0.9 72.0Amortized acquisition cost 90.0 141.2 231.2 85.2 0.9 86.1Unrealized gains/losses 11.4 8.3 19.7 –14.1 – –14.1
Available-for-sale securities amounting to € 149.5 million included investments of € 148.5 mil-lion to cover pension obligations. In 2008, no such investments existed.
133Company management Report Corporate governanceto our shareholders Consolidated Financial Statements Further information
notes
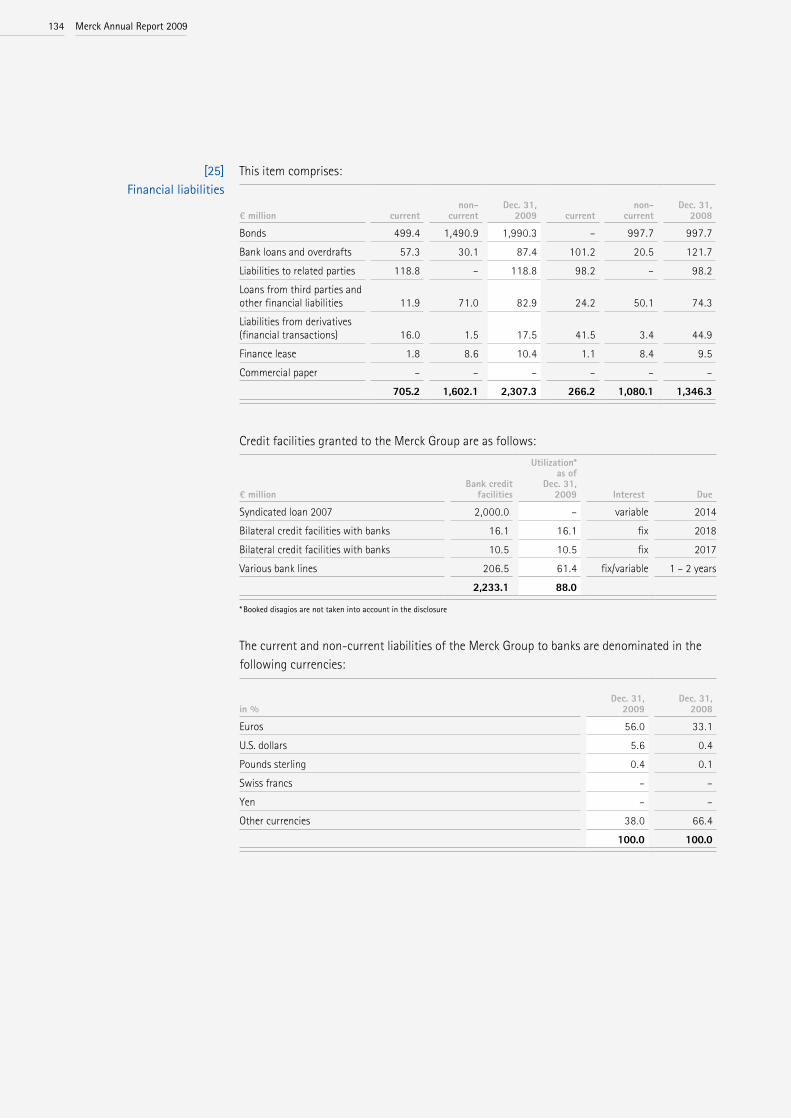
This item comprises:
€ million currentnon-
currentDec. 31,
2009 currentnon-
currentDec. 31,
2008
Bonds 499.4 1,490.9 1,990.3 – 997.7 997.7Bank loans and overdrafts 57.3 30.1 87.4 101.2 20.5 121.7Liabilities to related parties 118.8 – 118.8 98.2 – 98.2Loans from third parties and other financial liabilities 11.9 71.0 82.9 24.2 50.1 74.3Liabilities from derivatives (financial transactions) 16.0 1.5 17.5 41.5 3.4 44.9Finance lease 1.8 8.6 10.4 1.1 8.4 9.5Commercial paper – – – – – –
705.2 1,602.1 2,307.3 266.2 1,080.1 1,346.3
Credit facilities granted to the Merck Group are as follows:
€ millionBank credit
facilities
Utilization* as of
Dec. 31, 2009 Interest Due
Syndicated loan 2007 2,000.0 – variable 2014Bilateral credit facilities with banks 16.1 16.1 fix 2018Bilateral credit facilities with banks 10.5 10.5 fix 2017Various bank lines 206.5 61.4 fix/variable 1 – 2 years
2,233.1 88.0
* Booked disagios are not taken into account in the disclosure
The current and non-current liabilities of the Merck Group to banks are denominated in the following currencies:
in %Dec. 31,
2009Dec. 31,
2008
Euros 56.0 33.1U.S. dollars 5.6 0.4Pounds sterling 0.4 0.1Swiss francs – –Yen – –Other currencies 38.0 66.4
100.0 100.0
[25] Financial liabilities
merck Annual Report 2009134

In fiscal 2007, a € 2 billion multi-currency term loan and revolving credit facility was agreed. The loan has a term of seven years and was agreed with an international banking syndicate.In 2009, Merck set up a debt issuance program that forms the contractual basis for the issue of bonds with a nominal volume of up to € 5 billion. Within the scope of this program, in 2009 Merck Financial Services GmbH, launched a euro benchmark bond in the European debt capital market. The issue volume of the bond, which has a maturity of 4.5 years and pays a coupon of 4.875% , was € 750 million. It was issued at a price of 99.697%. In addition, under the debt issuance program, we made three private placements via Merck Financial Services GmbH. With a transaction volume of € 60 million and a maturity of seven years, the issue price of the first transaction was 100%. It pays a coupon of 4.000%. The transaction volume of the second bond was € 70 million. It has a maturity of ten years and pays a coupon of 4.250%. The third bond has a volume of € 100 million, a maturity of six years and an issue price of 100%. For this transaction, a variable coupon equivalent to the three-month Euribor +0.77% was agreed. The variable interest expense of the bond has been fixed via an interest rate swap. The bond is carried at amortized cost taking into account the transaction costs.In 2007, Merck KGaA launched a euro Benchmark Bond for € 500 million in the European debt capital market. It has a maturity of three years. The bond pays a coupon of 4.75% and was issued at a price of 99.7%. It is carried at amortized cost.In 2005, Merck KGaA launched its first euro Benchmark Bond in the European debt capital market via Merck Finanz AG, Luxembourg. The size of the issue was € 500 million with a matu-rity of seven years. The bond pays a coupon of 3.75% and was issued at a price of 99.716%. The interest expense of the bond has been variabilized to the six-month Euribor through interest rate swaps. Since the hedging instruments are based on the same fundamentals that determine the value of the underlying transaction, changes in the market interest rates lead to opposite changes in the value of the bond. The bond is carried at fair value taking into account disagios and transaction costs. The costs of issuing the bond are reflected in the book value and are distributed evenly over the term of the bond.In order to meet short-term capital requirements, Merck KGaA issued a commercial paper program with a volume of € 2 billion, which had not been utilized as of the reporting date.Liabilities from financial leasing represent the discounted amount of future payments arising from finance leases. This item primarily relates to liabilities from finance leases for buildings. Information on liabilities due to related parties can be found in Note [47] Related-party disclosures.
135Company management Report Corporate governanceto our shareholders Consolidated Financial Statements Further information
notes
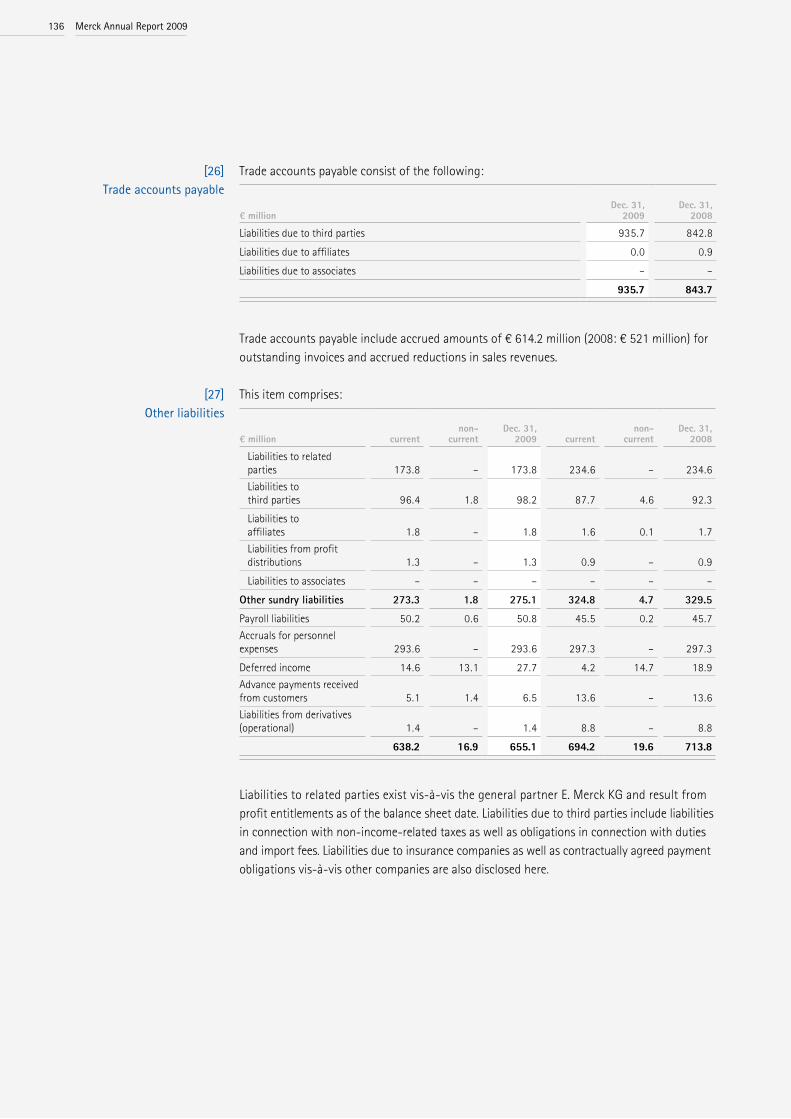
Trade accounts payable consist of the following:
€ millionDec. 31,
2009Dec. 31,
2008
Liabilities due to third parties 935.7 842.8Liabilities due to affiliates 0.0 0.9Liabilities due to associates – –
935.7 843.7
Trade accounts payable include accrued amounts of € 614.2 million (2008: € 521 million) for outstanding invoices and accrued reductions in sales revenues.
This item comprises:
€ million currentnon-
currentDec. 31,
2009 currentnon-
currentDec. 31,
2008
Liabilities to related parties 173.8 – 173.8 234.6 – 234.6 Liabilities to third parties 96.4 1.8 98.2 87.7 4.6 92.3 Liabilities to affiliates 1.8 – 1.8 1.6 0.1 1.7 Liabilities from profit distributions 1.3 – 1.3 0.9 – 0.9 Liabilities to associates – – – – – –other sundry liabilities 273.3 1.8 275.1 324.8 4.7 329.5Payroll liabilities 50.2 0.6 50.8 45.5 0.2 45.7Accruals for personnel expenses 293.6 – 293.6 297.3 – 297.3Deferred income 14.6 13.1 27.7 4.2 14.7 18.9Advance payments received from customers 5.1 1.4 6.5 13.6 – 13.6Liabilities from derivatives (operational) 1.4 – 1.4 8.8 – 8.8
638.2 16.9 655.1 694.2 19.6 713.8
Liabilities to related parties exist vis-à-vis the general partner E. Merck KG and result from profit entitlements as of the balance sheet date. Liabilities due to third parties include liabilities in connection with non-income-related taxes as well as obligations in connection with duties and import fees. Liabilities due to insurance companies as well as contractually agreed payment obligations vis-à-vis other companies are also disclosed here.
[26] trade accounts payable
[27] other liabilities
merck Annual Report 2009136
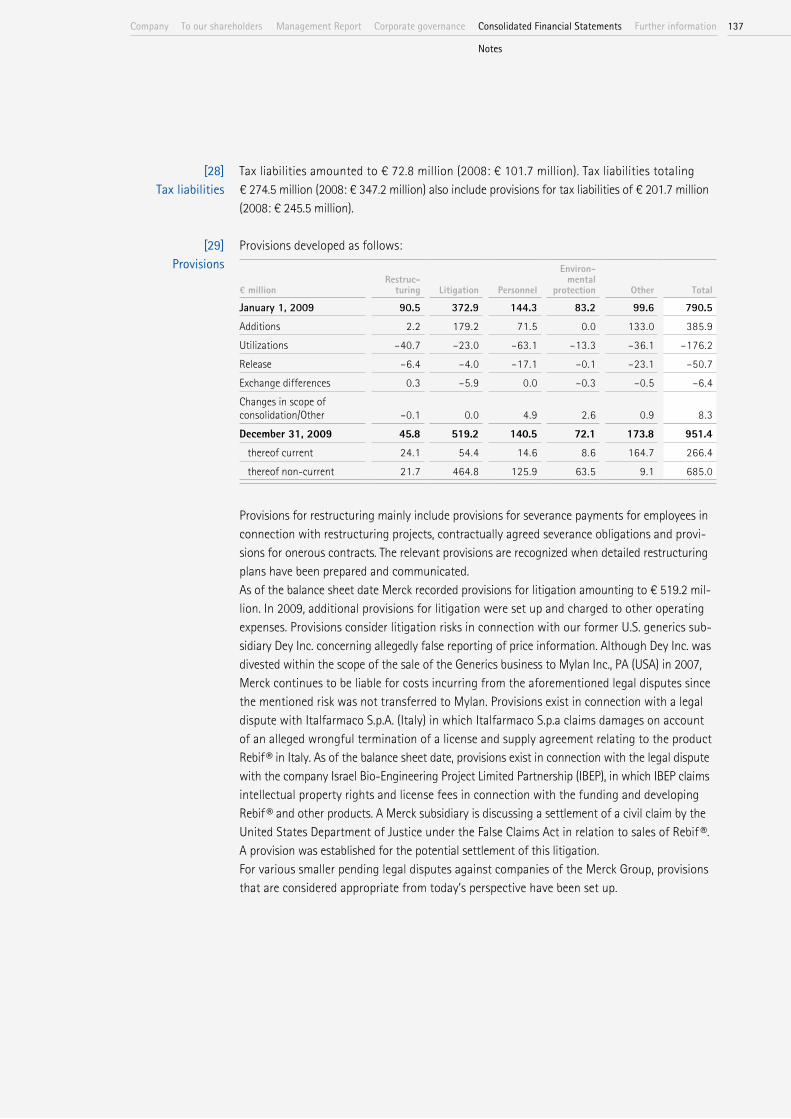
Tax liabilities amounted to € 72.8 million (2008: € 101.7 million). Tax liabilities totaling € 274.5 million (2008: € 347.2 million) also include provisions for tax liabilities of € 201.7 million (2008: € 245.5 million).
Provisions developed as follows:
€ millionRestruc-
turing Litigation Personnel
Environ-mental
protection Other Total
January 1, 2009 90.5 372.9 144.3 83.2 99.6 790.5Additions 2.2 179.2 71.5 0.0 133.0 385.9Utilizations –40.7 –23.0 –63.1 –13.3 –36.1 –176.2Release –6.4 –4.0 –17.1 –0.1 –23.1 –50.7Exchange differences 0.3 –5.9 0.0 –0.3 –0.5 –6.4Changes in scope of consolidation/Other –0.1 0.0 4.9 2.6 0.9 8.3December 31, 2009 45.8 519.2 140.5 72.1 173.8 951.4 thereof current 24.1 54.4 14.6 8.6 164.7 266.4 thereof non-current 21.7 464.8 125.9 63.5 9.1 685.0
Provisions for restructuring mainly include provisions for severance payments for employees in connection with restructuring projects, contractually agreed severance obligations and provi-sions for onerous contracts. The relevant provisions are recognized when detailed restructuring plans have been prepared and communicated. As of the balance sheet date Merck recorded provisions for litigation amounting to € 519.2 mil-lion. In 2009, additional provisions for litigation were set up and charged to other operating expenses. Provisions consider litigation risks in connection with our former U.S. generics sub-sidiary Dey Inc. concerning allegedly false reporting of price information. Although Dey Inc. was divested within the scope of the sale of the Generics business to Mylan Inc., PA (USA) in 2007, Merck continues to be liable for costs incurring from the aforementioned legal disputes since the mentioned risk was not transferred to Mylan. Provisions exist in connection with a legal dispute with Italfarmaco S.p.A. (Italy) in which Italfarmaco S.p.a claims damages on account of an alleged wrongful termination of a license and supply agreement relating to the product Rebif ® in Italy. As of the balance sheet date, provisions exist in connection with the legal dispute with the company Israel Bio-Engineering Project Limited Partnership (IBEP), in which IBEP claims intellectual property rights and license fees in connection with the funding and developing Rebif ® and other products. A Merck subsidiary is discussing a settlement of a civil claim by the United States Department of Justice under the False Claims Act in relation to sales of Rebif ®. A provision was established for the potential settlement of this litigation.For various smaller pending legal disputes against companies of the Merck Group, provisions that are considered appropriate from today’s perspective have been set up.
[28] tax liabilities
[29] Provisions
137Company management Report Corporate governanceto our shareholders Consolidated Financial Statements Further information
notes
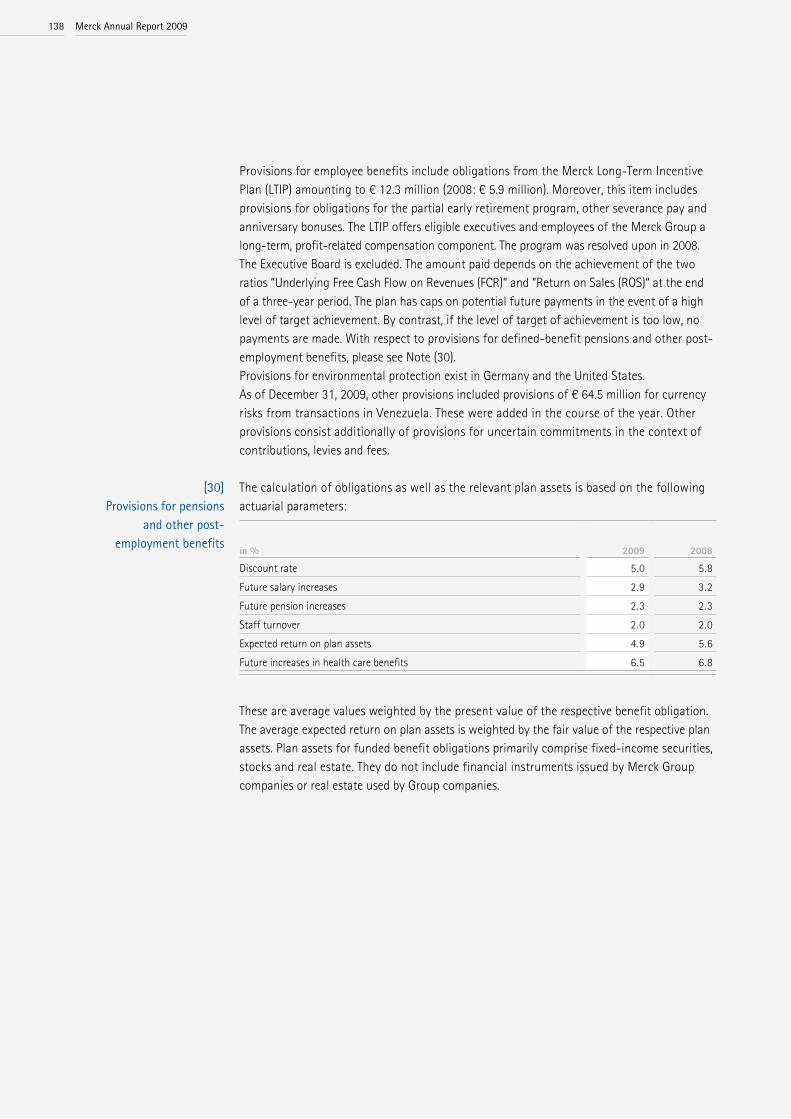
Provisions for employee benefits include obligations from the Merck Long-Term Incentive Plan (LTIP) amounting to € 12.3 million (2008: € 5.9 million). Moreover, this item includes provisions for obligations for the partial early retirement program, other severance pay and anniversary bonuses. The LTIP offers eligible executives and employees of the Merck Group a long-term, profit-related compensation component. The program was resolved upon in 2008. The Executive Board is excluded. The amount paid depends on the achievement of the two ratios “Underlying Free Cash Flow on Revenues (FCR)“ and ”Return on Sales (ROS)“ at the end of a three-year period. The plan has caps on potential future payments in the event of a high level of target achievement. By contrast, if the level of target of achievement is too low, no payments are made. With respect to provisions for defined-benefit pensions and other post-employment benefits, please see Note (30). Provisions for environmental protection exist in Germany and the United States.As of December 31, 2009, other provisions included provisions of € 64.5 million for currency risks from transactions in Venezuela. These were added in the course of the year. Other provisions consist additionally of provisions for uncertain commitments in the context of contributions, levies and fees.
The calculation of obligations as well as the relevant plan assets is based on the following actuarial parameters:
in % 2009 2008
Discount rate 5.0 5.8Future salary increases 2.9 3.2Future pension increases 2.3 2.3Staff turnover 2.0 2.0Expected return on plan assets 4.9 5.6Future increases in health care benefits 6.5 6.8
These are average values weighted by the present value of the respective benefit obligation. The average expected return on plan assets is weighted by the fair value of the respective plan assets. Plan assets for funded benefit obligations primarily comprise fixed-income securities, stocks and real estate. They do not include financial instruments issued by Merck Group companies or real estate used by Group companies.
[30] Provisions for pensions
and other post- employment benefits
merck Annual Report 2009138

The balance sheet item “Provisions for pensions and other post-employment benefits” can be broken down as follows:
€ millionDec. 31,
2009Dec. 31,
2008
Present value of benefit obligations funded by provisions 1,260.2 1,051.5Present value of funded benefit obligations 617.5 534.4Present value of all benefit obligations 1,877.7 1,585.9
Fair value of plan assets of all funds –582.6 –462.6Funded status 1,295.1 1,123.3
Other changes 1.2 0.8Net liability recognized in the balance sheet 1,296.3 1,124.1
Refund claims on plan assets 15.2 19.9Provisions for pensions and other post-employment benefits 1,311.5 1,144.0
In 2009, the following items were recognized in income:
€ million 2009 2008
Current service cost 58.1 58.4Past service cost – 1.2Interest cost on pension obligations 93.1 82.8Expected return on plan assets -25.6 –27.1Other effects -10.8 –3.3Total amount recognized in income 114.8 112.0
The present value of commitments for future health care expenses of retirees in the United States is based on an expected future increase in health care costs of 6.5%. If the rate of increase is one percentage point higher or lower, the measurement of the present value of the commitment would be either € 0.7 million higher or € 0.6 million lower. The expenses recognized in 2009 would have been € 0.1 million higher or lower. The actual gain on plan assets amounted to € 63.8 million (2008: loss of € 70.6 million). Apart from the interest component stemming from interest expense on the pension obligations and the expected return on the plan assets, which are disclosed in the financial result, the relevant expense of defined benefit and defined contribution plans is distributed across the individual functional areas.
139Company management Report Corporate governanceto our shareholders Consolidated Financial Statements Further information
notes

During the reporting period the present value of the benefit obligations changed as follows:
The fair value of the plan asset of all funds changed as follows in the reporting period:
€ million 2009 2008
Fair value of the plan assets on January 1 462.6 520.5Currency translation differences 10.4 –25.5Expected return on plan assets 25.6 27.1Other effects recognized in income – –4.6Actuarial losses/gains 38.2 –97.6Employer contributions 64.1 44.4Employee contributions 10.8 9.8Pension payments in the reporting period –27.8 –24.8Transfers/Changes in scope of consolidation/Other changes –1.3 13.3Fair value of the plan assets on December 31 582.6 462.6
In the reporting period, actuarial gains (+) and losses (–) as well as the effects of limiting defined benefit assets in accordance with IAS 19.58 amounting to € –178.1 million (2008: € 31.7 million) were taken to equity, together with other effects totaling € 14.5 million (2008: € 0.0 million). Moreover, € –0.5 million was transferred to retained earnings. As of December 31, 2009, for the aforementioned reasons, a cumulative total of € –297.2 million (2008: € –133.1 million) was taken to equity for the benefit obligations presented here.
€ million
benefit obligations funded by provisions
funded benefit
obligations 2009
benefit obligations funded by provisions
funded benefit
obligations 2008
Present value of all defined benefit obligations on January 1 1,051.5 534.4 1,585.9 1,129.2 536.7 1,665.9Currency translation differences 2.6 11.4 14.0 –2.7 –32.0 –34.7Current service cost 27.3 30.8 58.1 31.3 27.1 58.4Interest cost on pension obligations 64.6 28.5 93.1 58.4 24.4 82.8Other effects recognized in income 0.7 –11.5 –10.8 -2.0 –5.9 –7.9Actuarial gains/losses 172.2 44.2 216.4 –108.5 –15.0 –123.5Pension payments in the reporting period –57.1 –29.7 –86.8 –57.2 –24.8 –82.0Transfers/Changes in scope of consolidation/ Other changes –1.6 9.4 7.8 3.0 23.9 26.9Present value of all defined benefit obligations on December 31 1,260.2 617.5 1,877.7 1,051.5 534.4 1,585.9
merck Annual Report 2009140

The fair value of the plan assets can be allocated to the individual asset categories as follows. Weighted average values are used here.
in %Dec. 31,
2009Dec. 31,
2008
Debt instruments 43.3 38.4Equity instruments 34.1 34.4Real estate 12.0 11.7Other assets 10.6 15.5
On average, the expected rate of return on debt instruments is 3.8%, on equity instruments 7.4% and on real estate 5.3%. The respective rates of return take into account country- specific conditions and are based, among other things, on interest and dividend income expected over the long term as well increases in the value of the investment portfolio after the deduction of directly allocable taxes and expenses.
Over the past five years, the funded status, composed of the present value of the defined benefit obligations and the fair value of the plan assets, has changed as follows:
€ million as of Dec. 31 2009 2008 2007 2006 2005
Present value of the defined benefit obligations 1,877.7 1,585.9 1,665.9 1,607.2 1,491.4Fair value of the plan assets –582,6 –462.6 –520.5 –346.2 –276.5Funded status 1,295.1 1,123.3 1,145.4 1,261.0 1,214.9
We expect that the payments to beneficiaries from pension plans funded by provisions will amount to around € 72 million in 2010 (2009: € 62 million). Contributions to plan assets will probably amount to around € 24 million (2009: € 24 million).The cost of ongoing contributions in 2009 for defined contribution plans that are financed exclusively by external funds and for which the companies of the Merck Group are only obliged to pay the contributions, amounted to € 8.6 million in 2009 (2008: € 8.6 million). In addition, employer contributions of € 48.3 million (2008: € 46.2 million) were transferred to the German statutory pension insurance system and € 8.2 million (2008: € 5.5 million) to statutory pension insurance systems abroad.
141Company management Report Corporate governanceto our shareholders Consolidated Financial Statements Further information
notes

A strong equity position is important for Merck to ensure the continued existence of the company. Based on our financial strategy, the Executive Board regularly reviews various key figures that reflect the capitalization of the company. Gearing (ratio of net debt and pension provisions to net equity) and the equity ratio are important indicators here. As of the balance sheet date, the number of shares issued totaled 64,621,126. The amount resulting from the issue of shares by Merck KGaA exceeding the nominal amount is recognized in the capital reserves. The reserves also contain the retained earnings and the net retained profit of the consolidated subsidiaries as well as the income and expenses taken directly to equity. The currency translation difference includes the differences not recognized in income from currency translation by subsidiaries abroad. Currency translation differences decreased equity in 2009 by € 20.1 million (2008: increased by € 878.0 million). Accordingly, as of December 31, 2009, cumulative currency translation differences in equity amounted to a gain of € 509.5 million (2008: gain of € 529.6 million). The disclosure of minority interest is based on the stated equity of the subsidiaries concerned after any adjustment required to ensure compliance with the accounting policies of the Merck Group, as well as pro rata consolidation entries. The interests of other shareholders in net equity mainly relates to the minority interests in Merck Ltd. India, Merck S.A. France, Merck Ltd., Thailand, and PT Merck Tbk, Indonesia. In addition to the dividend payments to the shareholders of Merck KGaA and to minority shareholders in subsidiary companies of the Merck Group, the appropriation of profits includes the transfer of profits from Merck & Cie KG to E. Merck KG in accord ance with the company agreements and the reciprocal transfer of profits be tween E. Merck KG and Merck KGaA in accordance with the Articles of Association. In accordance with the capital ratios, E. Merck KG has a 70.27% interest in the profit/loss of Merck KGaA while Merck KGaA has an interest of 29.73% in the profit/loss of E. Merck KG. Merck KGaA’s profit from ordinary activities adjusted for trade income tax, on which the appropriation of its profit is based, amounts to € 310.1 million. Merck KGaA transferred € 217.9 million of its profit to E. Merck KG (2008: € 126.5 million). In 2009, € 26.8 million was transferred from Merck & Cie KG to E. Merck KG (2008: € 34.9 million). The profit/loss of E. Merck KG, on which the appropriation of profit/loss is based, amounts to € 1.9 million (2008: € 5.9 million). Consequently, this results in a profit transfer to Merck KGaA of € 0.6 million (2008: € 1.8 million).For 2008, a dividend of € 1.50 per share was distributed. The dividend proposal for fiscal 2009 will be € 1.00 per share, corresponding to a total dividend payment of € 64.6 million to shareholders.
[31] net equity
merck Annual Report 2009142
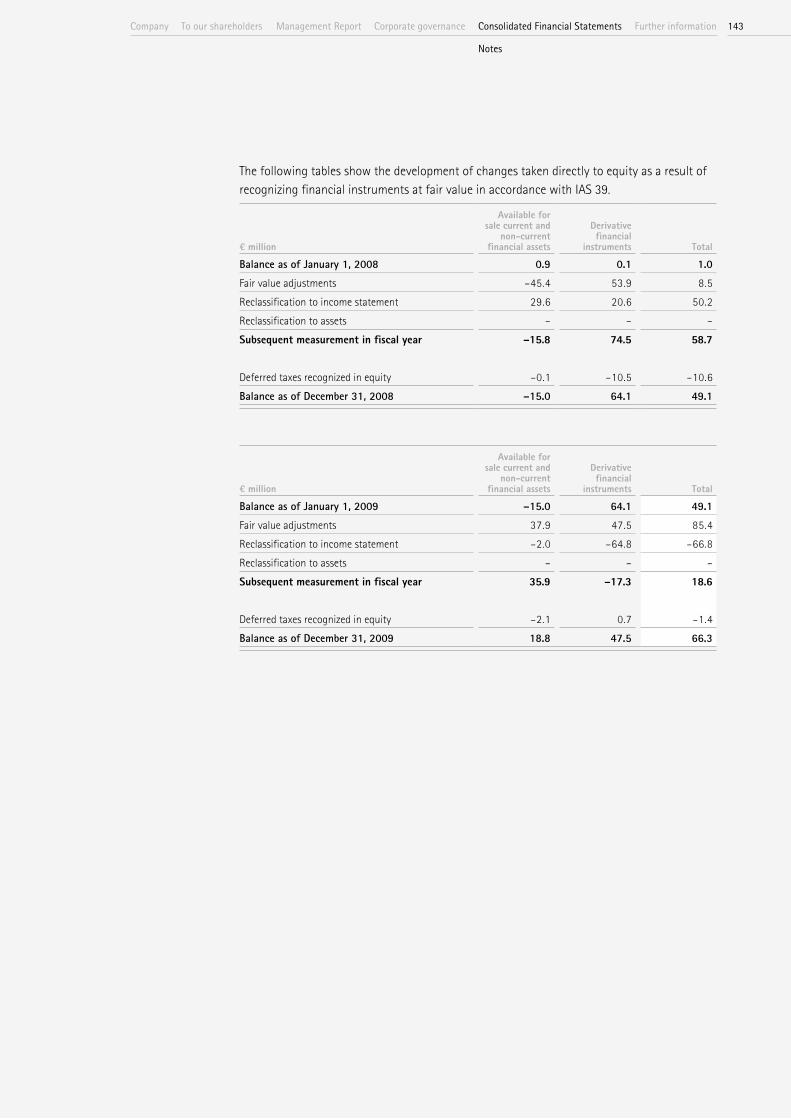
The following tables show the development of changes taken directly to equity as a result of recognizing financial instruments at fair value in accordance with IAS 39.
€ million
Available for sale current and
non-current financial assets
Derivative financial
instruments Total
Balance as of January 1, 2008 0.9 0.1 1.0Fair value adjustments –45.4 53.9 8.5Reclassification to income statement 29.6 20.6 50.2Reclassification to assets – – –Subsequent measurement in fiscal year –15.8 74.5 58.7
Deferred taxes recognized in equity –0.1 –10.5 –10.6Balance as of december 31, 2008 –15.0 64.1 49.1
€ million
Available for sale current and
non-current financial assets
Derivative financial
instruments Total
Balance as of January 1, 2009 –15.0 64.1 49.1Fair value adjustments 37.9 47.5 85.4Reclassification to income statement –2.0 –64.8 –66.8Reclassification to assets – – –Subsequent measurement in fiscal year 35.9 –17.3 18.6
Deferred taxes recognized in equity –2.1 0.7 –1.4Balance as of december 31, 2009 18.8 47.5 66.3
143Company management Report Corporate governanceto our shareholders Consolidated Financial Statements Further information
notes
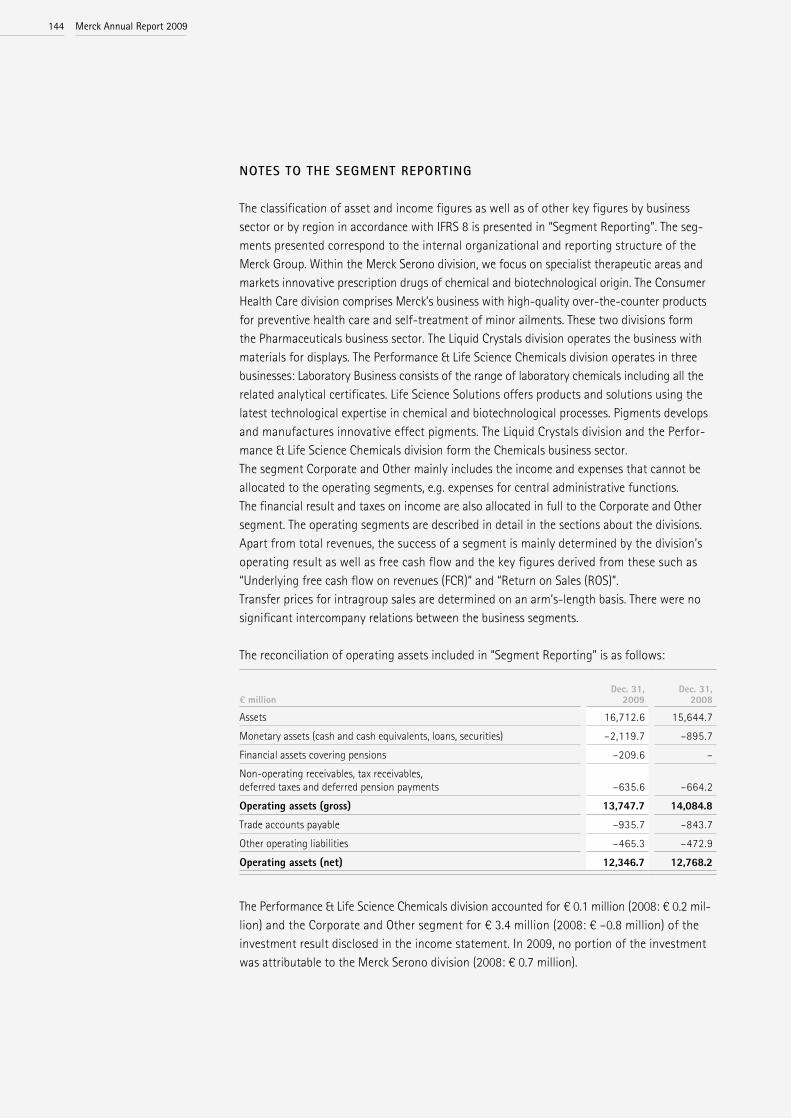
NoteS to the SeGmeNt RePoRtiNG
The classification of asset and income figures as well as of other key figures by business sector or by region in accordance with IFRS 8 is presented in “Segment Reporting”. The seg-ments presented correspond to the internal organizational and reporting structure of the Merck Group. Within the Merck Serono division, we focus on specialist therapeutic areas and markets innovative prescription drugs of chemical and biotechnological origin. The Consumer Health Care division comprises Merck’s business with high-quality over-the-counter products for preventive health care and self-treatment of minor ailments. These two divisions form the Pharmaceuticals business sector. The Liquid Crystals division operates the business with materials for displays. The Performance & Life Science Chemicals division operates in three businesses: Laboratory Business consists of the range of laboratory chemicals including all the related analytical certificates. Life Science Solutions offers products and solutions using the latest technological expertise in chemical and biotechnological processes. Pigments develops and manufactures innovative effect pigments. The Liquid Crystals division and the Perfor-mance & Life Science Chemicals division form the Chemicals business sector. The segment Corporate and Other mainly includes the income and expenses that cannot be allocated to the operating segments, e.g. expenses for central administrative functions.The financial result and taxes on income are also allocated in full to the Corporate and Other segment. The operating segments are described in detail in the sections about the divisions. Apart from total revenues, the success of a segment is mainly determined by the division’s operating result as well as free cash flow and the key figures derived from these such as “Underlying free cash flow on revenues (FCR)“ and “Return on Sales (ROS)”.Transfer prices for intragroup sales are determined on an arm’s-length basis. There were no significant intercompany relations between the business segments.
The reconciliation of operating assets included in “Segment Reporting” is as follows:
€ millionDec. 31,
2009Dec. 31,
2008
Assets 16,712.6 15,644.7Monetary assets (cash and cash equivalents, loans, securities) –2,119.7 –895.7Financial assets covering pensions –209.6 –Non-operating receivables, tax receivables, deferred taxes and deferred pension payments –635.6 –664.2Operating assets (gross) 13,747.7 14,084.8Trade accounts payable –935.7 –843.7Other operating liabilities –465.3 –472.9Operating assets (net) 12,346.7 12,768.2
The Performance & Life Science Chemicals division accounted for € 0.1 million (2008: € 0.2 mil-lion) and the Corporate and Other segment for € 3.4 million (2008: € –0.8 million) of the investment result disclosed in the income statement. In 2009, no portion of the investment was attributable to the Merck Serono division (2008: € 0.7 million).
merck Annual Report 2009144
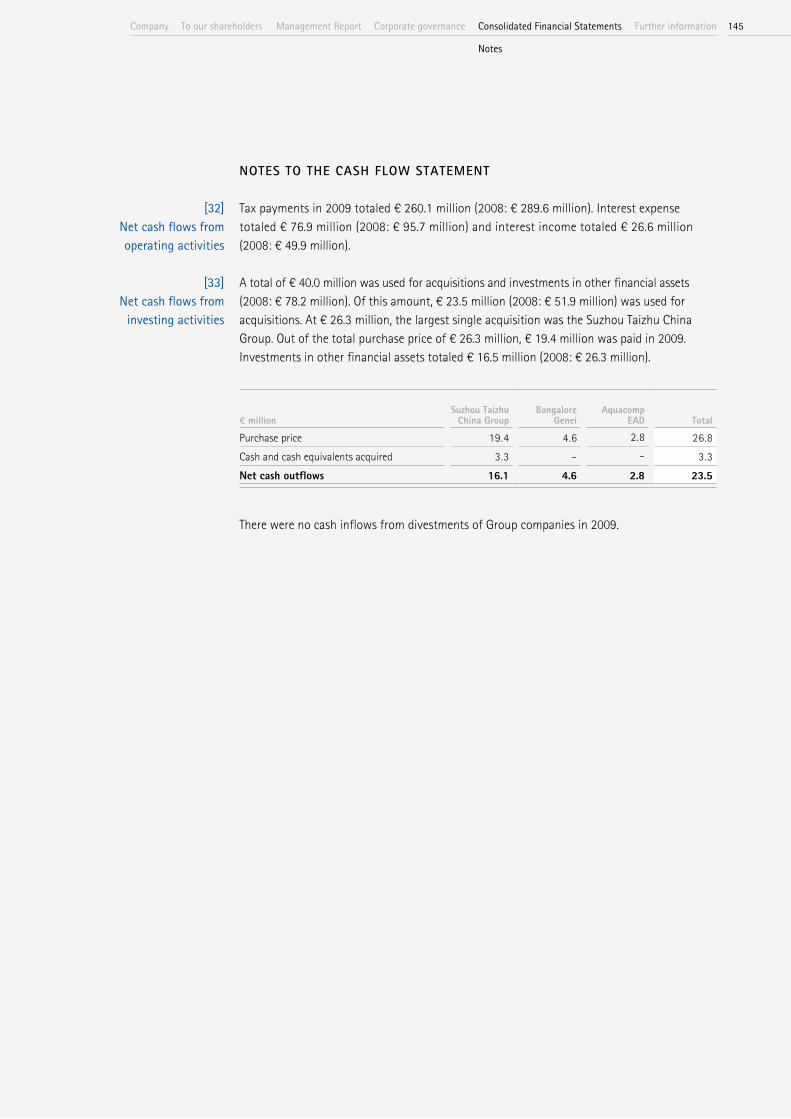
NoteS to the CaSh flow StatemeNt
Tax payments in 2009 totaled € 260.1 million (2008: € 289.6 million). Interest expense totaled € 76.9 million (2008: € 95.7 million) and interest income totaled € 26.6 million (2008: € 49.9 million).
A total of € 40.0 million was used for acquisitions and investments in other financial assets (2008: € 78.2 million). Of this amount, € 23.5 million (2008: € 51.9 million) was used for acquisitions. At € 26.3 million, the largest single acquisition was the Suzhou Taizhu China Group. Out of the total purchase price of € 26.3 million, € 19.4 million was paid in 2009. In vestments in other financial assets totaled € 16.5 million (2008: € 26.3 million).
€ millionSuzhou Taizhu
China GroupBangalore
GeneiAquacomp
EAD Total
Purchase price 19.4 4.6 2.8 26.8Cash and cash equivalents acquired 3.3 – – 3.3Net cash outflows 16.1 4.6 2.8 23.5
There were no cash inflows from divestments of Group companies in 2009.
[32] net cash flows from operating activities
[33] net cash flows from
investing activities
145Company management Report Corporate governanceto our shareholders Consolidated Financial Statements Further information
notes
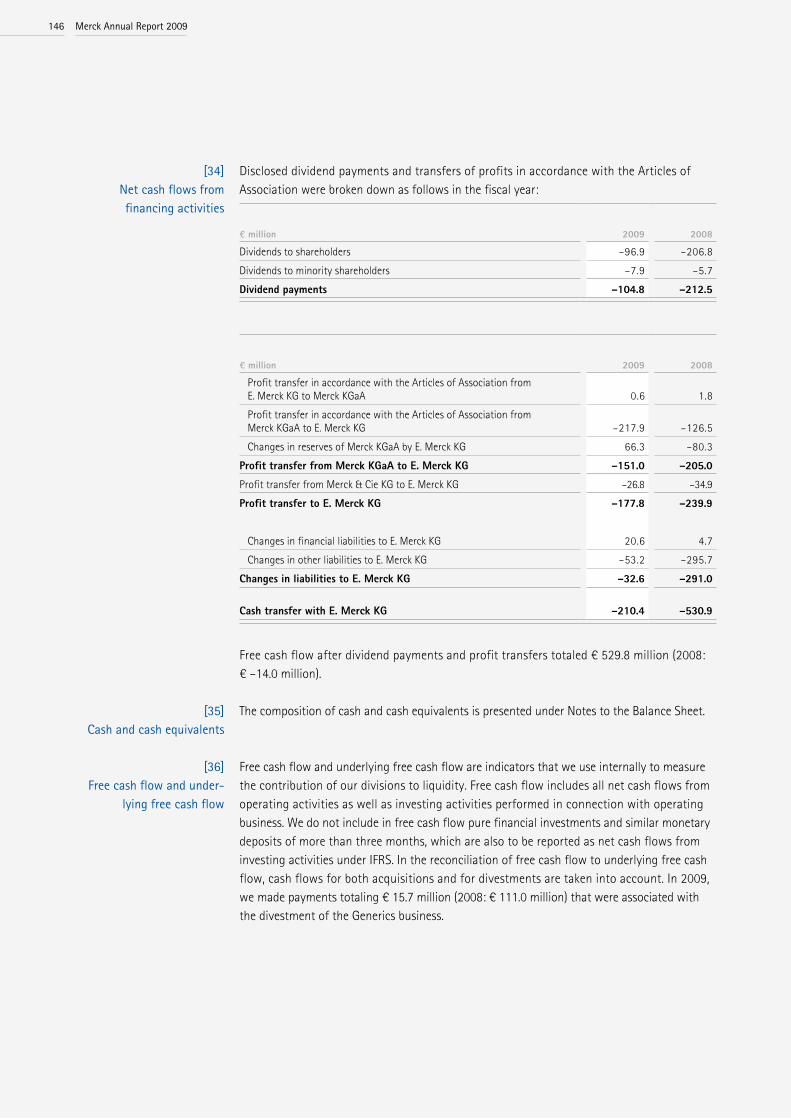
Disclosed dividend payments and transfers of profits in accordance with the Articles of Association were broken down as follows in the fiscal year:
€ million 2009 2008
Dividends to shareholders –96.9 –206.8Dividends to minority shareholders –7.9 –5.7Dividend payments –104.8 –212.5
€ million 2009 2008
Profit transfer in accordance with the Articles of Association from E. Merck KG to Merck KGaA 0.6 1.8 Profit transfer in accordance with the Articles of Association from Merck KGaA to E. Merck KG –217.9 –126.5 Changes in reserves of Merck KGaA by E. Merck KG 66.3 –80.3Profit transfer from Merck KGaA to E. Merck KG –151.0 –205.0Profit transfer from Merck & Cie KG to E. Merck KG –26.8 –34.9Profit transfer to E. Merck KG –177.8 –239.9
Changes in financial liabilities to E. Merck KG 20.6 4.7 Changes in other liabilities to E. Merck KG –53.2 –295.7Changes in liabilities to E. Merck KG –32.6 –291.0
Cash transfer with E. Merck KG –210.4 –530.9
Free cash flow after dividend payments and profit transfers totaled € 529.8 million (2008: € –14.0 million).
The composition of cash and cash equivalents is presented under Notes to the Balance Sheet.
Free cash flow and underlying free cash flow are indicators that we use internally to measure the contribution of our divisions to liquidity. Free cash flow includes all net cash flows from operating activities as well as investing activities performed in connection with operating business. We do not include in free cash flow pure financial investments and similar monetary deposits of more than three months, which are also to be reported as net cash flows from investing activities under IFRS. In the reconciliation of free cash flow to underlying free cash flow, cash flows for both acquisitions and for divestments are taken into account. In 2009, we made payments totaling € 15.7 million (2008: € 111.0 million) that were associated with the divestment of the Generics business.
[34] net cash flows from financing activities
[35] Cash and cash equivalents
[36] Free cash flow and under-
lying free cash flow
merck Annual Report 2009146

otheR diSCloSuReS
Merck uses derivative financial instruments exclusively to hedge currency and interest rate positions, and thereby reduce currency and interest rate risks. Foreign currency risks from rec-ognized transactions are largely hedged. Merck currently uses marketable forward exchange contracts and interest rate swaps as hedging instruments. Depending on the nature of the hedging transaction, hedged items are disclosed either in the operating result or, in the case of financial transactions, in the financial result. The strategy to hedge interest rate and currency fluctuations arising from future transactions is set by a Merck Group currency and interest rate committee, which meets on a regular basis. A review period of up to 36 months normally serves as the basis for entering into currency derivative contracts. Extensive guidelines regulate the use of derivatives. There is a ban on speculation. Derivative transactions are subject to continuous risk management procedures. Trading, settlement and control functions are strictly separated. Derivative financial contracts are only entered into with banks that have a good credit rating.
The following derivative financial positions were held as of the balance sheet date:
€ million
Nominal volume Fair value
Dec. 31, 2009
Dec. 31, 2008
Dec. 31, 2009
Dec. 31, 2008
Cash flow hedge 902.0 936.9 57.6 74.6 Interest 100.0 – –0.3 – Currency 802.0 936.9 57.9 74.6Fair value hedge 520.9 553.5 14.5 2.0 Interest 500.0 500.0 14.6 –0.6 Currency 20.9 53.5 –0.1 2.6No hedge accounting 2,161.1 3,283.9 8.8 44.9 Currency 2,161.1 3,283.9 8.8 44.9
3,584.0 4,774.3 80.9 121.5
The nominal volume is the aggregate of all buy and sell amounts relating to derivative contracts. The fair values result from the valuation of open positions at market prices, ignoring any opposite movements in the value of the underlyings. They correspond to the income or expenses which would result if the derivatives contract were closed out as of balance sheet date. Transactions are recognized at fair value on the basis of quoted prices or current market data provided by a recognized information service.
[37] derivative financial
instruments
147Company management Report Corporate governanceto our shareholders Consolidated Financial Statements Further information
notes
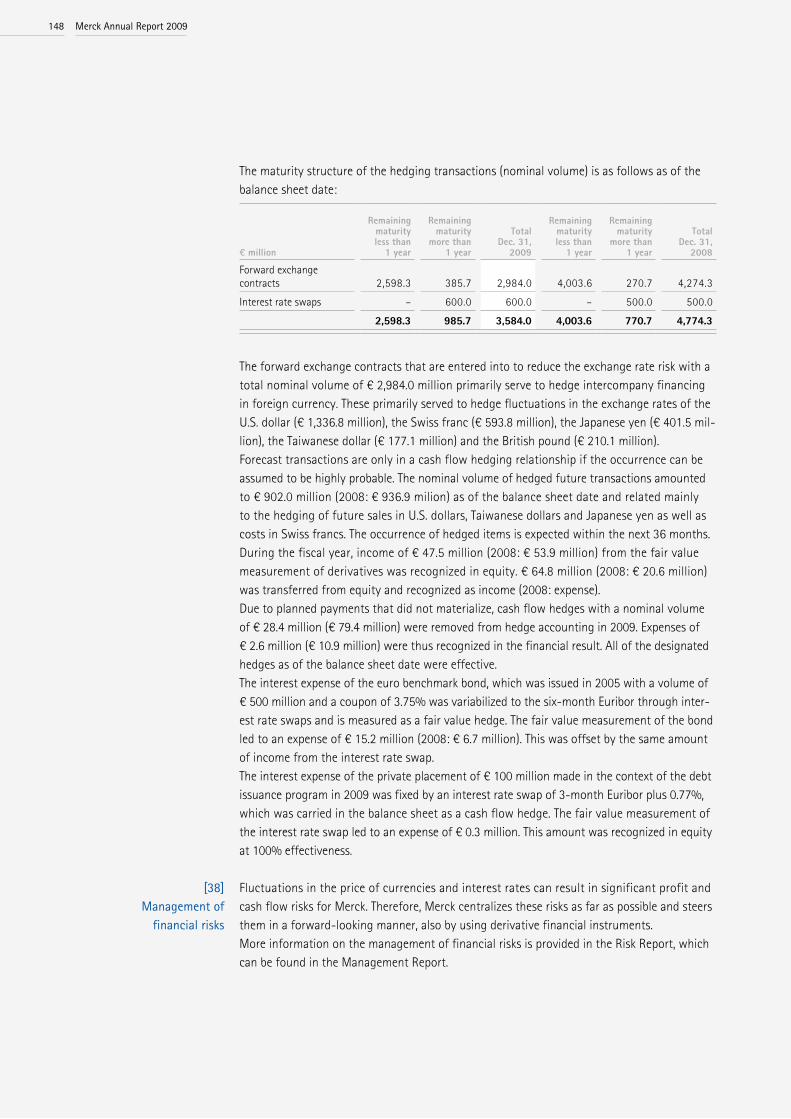
The maturity structure of the hedging transactions (nominal volume) is as follows as of the balance sheet date:
€ million
Remaining maturity less than
1 year
Remaining maturity
more than 1 year
Total Dec. 31,
2009
Remaining maturity less than
1 year
Remaining maturity
more than 1 year
Total Dec. 31,
2008
Forward exchange contracts 2,598.3 385.7 2,984.0 4,003.6 270.7 4,274.3Interest rate swaps – 600.0 600.0 – 500.0 500.0
2,598.3 985.7 3,584.0 4,003.6 770.7 4,774.3
The forward exchange contracts that are entered into to reduce the exchange rate risk with a total nominal volume of € 2,984.0 million primarily serve to hedge intercompany financing in foreign currency. These primarily served to hedge fluctuations in the exchange rates of the U.S. dollar (€ 1,336.8 million), the Swiss franc (€ 593.8 million), the Japanese yen (€ 401.5 mil-lion), the Taiwanese dollar (€ 177.1 million) and the British pound (€ 210.1 million).Forecast transactions are only in a cash flow hedging relationship if the occurrence can be assumed to be highly probable. The nominal volume of hedged future transactions amounted to € 902.0 million (2008: € 936.9 milion) as of the balance sheet date and related mainly to the hedging of future sales in U.S. dollars, Taiwanese dollars and Japanese yen as well as costs in Swiss francs. The occurrence of hedged items is expected within the next 36 months. During the fiscal year, income of € 47.5 million (2008: € 53.9 million) from the fair value measurement of derivatives was recognized in equity. € 64.8 million (2008: € 20.6 million) was transferred from equity and recognized as income (2008: expense). Due to planned payments that did not materialize, cash flow hedges with a nominal volume of € 28.4 million (€ 79.4 million) were removed from hedge accounting in 2009. Expenses of € 2.6 million (€ 10.9 million) were thus recognized in the financial result. All of the designated hedges as of the balance sheet date were effective. The interest expense of the euro benchmark bond, which was issued in 2005 with a volume of € 500 million and a coupon of 3.75% was variabilized to the six-month Euribor through inter-est rate swaps and is measured as a fair value hedge. The fair value measurement of the bond led to an expense of € 15.2 million (2008: € 6.7 million). This was offset by the same amount of income from the interest rate swap.The interest expense of the private placement of € 100 million made in the context of the debt issuance program in 2009 was fixed by an interest rate swap of 3-month Euribor plus 0.77%, which was carried in the balance sheet as a cash flow hedge. The fair value measurement of the interest rate swap led to an expense of € 0.3 million. This amount was recognized in equity at 100% effectiveness.
Fluctuations in the price of currencies and interest rates can result in significant profit and cash flow risks for Merck. Therefore, Merck centralizes these risks as far as possible and steers them in a forward-looking manner, also by using derivative financial instruments. More information on the management of financial risks is provided in the Risk Report, which can be found in the Management Report.
[38] management of
financial risks
merck Annual Report 2009148
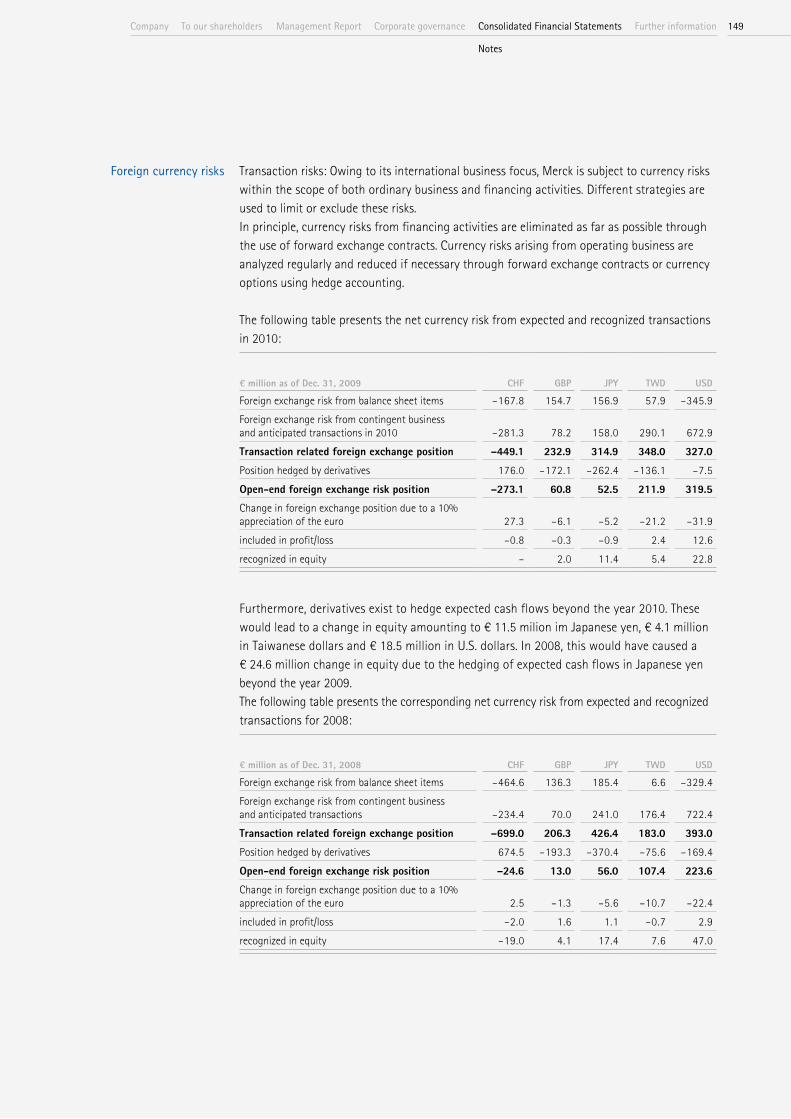
Transaction risks: Owing to its international business focus, Merck is subject to currency risks within the scope of both ordinary business and financing activities. Different strategies are used to limit or exclude these risks.In principle, currency risks from financing activities are eliminated as far as possible through the use of forward exchange contracts. Currency risks arising from operating business are analyzed regularly and reduced if necessary through forward exchange contracts or currency options using hedge accounting.
The following table presents the net currency risk from expected and recognized transactions in 2010:
€ million as of Dec. 31, 2009 CHF GBP JPY TWD USD
Foreign exchange risk from balance sheet items –167.8 154.7 156.9 57.9 –345.9Foreign exchange risk from contingent business and anticipated transactions in 2010 –281.3 78.2 158.0 290.1 672.9Transaction related foreign exchange position –449.1 232.9 314.9 348.0 327.0Position hedged by derivatives 176.0 –172.1 –262.4 –136.1 –7.5Open-end foreign exchange risk position –273.1 60.8 52.5 211.9 319.5Change in foreign exchange position due to a 10% appreciation of the euro 27.3 –6.1 –5.2 –21.2 –31.9included in profit/loss –0.8 –0.3 –0.9 2.4 12.6recognized in equity – 2.0 11.4 5.4 22.8
Furthermore, derivatives exist to hedge expected cash flows beyond the year 2010. These would lead to a change in equity amounting to € 11.5 milion im Japanese yen, € 4.1 million in Taiwanese dollars and € 18.5 million in U.S. dollars. In 2008, this would have caused a € 24.6 million change in equity due to the hedging of expected cash flows in Japanese yen beyond the year 2009.The following table presents the corresponding net currency risk from expected and recognized transactions for 2008:
€ million as of Dec. 31, 2008 CHF GBP JPY TWD USD
Foreign exchange risk from balance sheet items –464.6 136.3 185.4 6.6 –329.4Foreign exchange risk from contingent business and anticipated transactions –234.4 70.0 241.0 176.4 722.4Transaction related foreign exchange position –699.0 206.3 426.4 183.0 393.0Position hedged by derivatives 674.5 –193.3 –370.4 –75.6 –169.4Open-end foreign exchange risk position –24.6 13.0 56.0 107.4 223.6Change in foreign exchange position due to a 10% appreciation of the euro 2.5 –1.3 –5.6 –10.7 –22.4included in profit/loss –2.0 1.6 1.1 –0.7 2.9recognized in equity –19.0 4.1 17.4 7.6 47.0
Foreign currency risks
149Company management Report Corporate governanceto our shareholders Consolidated Financial Statements Further information
notes

Translation risks: Many Merck companies are located outside the euro zone. The financial statements of these companies are translated into euros. Exchange differences in the assets of these companies resulting from currency fluctuations are recognized in equity.
Interest rate risks relate mainly to financial liabilities of € 2.307.3 million(2008: € 1,301.4 million) and monetary deposits of € 2,372.6 million (2008: € 756.4 million). If necessary, derivative financial instruments are used to change fixed interest payments into variable interest payments. The aim is to optimize the interest result and to minimize interest rate risks. Relative to net interest liabilities on the balance sheet date, a parallel shift in interest rates by +100 basis points would affect profits by € 10.3 million. This corresponds to an increase in interest income of € 17.3 million (2008: € 5.9 million) on financial assets and additional interest expense of € 7.0 million (2008: € 6.9 million) on financial liabilities. The resulting change in the market value of assets recognized at fair value would lower equity by € 5.1 million. In 2008, this interest rate change would have changed the net result by € –1.0 million, while the equity would not have been impacted.
The share portfolio of publicly listed companies amounting to € 74.9 million is generally exposed to a market value risk. A 10% change in the value of the stock market would impact equity by € 7.5 million. These changes in value are recognized in income at the time of disposal.
The liquidity risk, meaning the risk that Merck cannot meet its financial obligations, is limited by effective cash management and by establishing the required financial flexibility. Apart from liquid assets of € 2,044.6 million (2008: € 869.5 million), Merck has at its disposal a multi-currency revolving credit line of € 2 billion to be used for business purposes with a remaining term of six years as well as bilateral credit facilities of € 233.1 million (2008: € 467.7 million). There are no indications that the availability of credit lines already extended will be restricted. Moreover, a commercial paper program with a volume of € 2 billion exists and a debt issuance program set up in 2009 with a volume of € 5 billion. Liquidity risks are regularly monitored and reported to the management. Our loan agreements do not contain any financial covenants. Trade payables amounting to € 935.7 million (2008: € 843.7 million) as well as operating liabilities from derivatives amounting to € 1.4 million (2008: € 8.8 million) have a remaining term of less than one year. Out of other financial liabilities amounting to € 275.1 million (2008: € 329.5 million), € 273.3 million (2008: € 324.8 million) are due within one year.
interest rate risks
Share price risks
liquidity risks
merck Annual Report 2009150

The following tables present the contractually set payments such as repayments and interest on financial liabilities and derivative financial instruments with a negative market value:
€ million as of Dec. 31, 2008 Book value
Cash flows 2009
Cash flows 2010–2014
Cash flows 2015–2020
InterestRepay-
ment InterestRepay-
ment InterestRepay-
ment
Debt securities and commercial paper 997.7 42.5 – 76.2 1,000.0 – –Bank loans and overdrafts 121.7 8.5 101.9 3.1 12.7 0.6 7.9Liabilities to related parties 98.2 – 98.2 – – – –Loans from third parties and other financial liabilities 74.3 3.5 24.2 6.2 40.0 – 10.1Liabilities from derivatives (financial transactions) 44.9 1.7 40.9 4.9 3.4 – –Financial leasing liabilities 9.5 0.1 5.1 0.2 4.4 – –
1,346.3 56.3 270.3 90.6 1,060.5 0.6 18.0
€ million as of Dec. 31, 2009 Book value
Cash flows 2010
Cash flows 2011–2015
Cash flows 2016–2022
InterestRepay-
ment InterestRepay-
ment InterestRepay-
ment
Debt securities and commercial paper 1,990.3 83.6 500.0 170.9 1,350.0 14.1 130.0Bank loans and overdrafts 87.4 1.6 63.8 3.5 14.8 0.4 5.2Liabilities to related parties 118.8 – 118.8 – – – –Loans from third parties and other financial liabilities 82.9 4.2 11.9 8.4 61.2 0.1 9.7Liabilities from derivatives (financial transactions) 17.5 2.1 16.0 10.6 1.2 – –Financial leasing liabilities 10.4 0.7 5.9 0.3 4.5 – –
2,307.3 92.2 716.4 193.7 1,431.7 14.6 144.9
Merck is only subject to a very low credit risk, meaning the unexpected loss of payment funds or income. Financial contracts are only entered into with banks with good ratings and the broad-based business structure of the Merck Group means that there is no particular concentration of credit risks. The credit risk with customers is continuously monitored by analyzing the age structure of trade accounts receivable. The theoretically maximum default risk corresponds to the book values.
Credit risks
151Company management Report Corporate governanceto our shareholders Consolidated Financial Statements Further information
notes

[39] other disclosures on financial instrumentsThe following table presents the reconciliation of the balance sheets items to the classes of financial instruments in accordance with IFRS 7:
€ million
Book value Dec. 31,
2009
Subsequent measurement according to IAS 39
Non-financial items
Fair value Dec. 31, 2009
Book value Dec. 31, 2008
Subsequent measurement according to IAS 39
Non-financial items
Fair value Dec. 31, 2008
Amortized cost At cost Fair value
Carrying value accord- ing to IAS 17
Amortized cost At cost Fair value
Carrying value accord- ing to IAS 17
assetsCash and cash equivalents 541.4 541.4 – – – – 541.4 692.7 692.7 – – – – 692.7Marketable securities and financial assets 1,503.2 1,199.1 – 304.1 – – 176.8 27.1 – 149.7 – – Held for trading (non-derivatives) 0.0 – – – – – 0.0 0.9 – – 0.9 – – 0.9 Non-hedging derivatives 27.0 – – 27.0 – – 27.0 90.6 – – 90.6 – – 90.6 Held to maturity 48.4 48.4 – – – – 48.4 27.0 27.0 – – – – 27.0 Loans and receivables 1,150.7 1,150.7 – – – – 1,150.7 0.1 0.1 – – – – 0.0 Available-for-sale 262.5 – – 262.5 – – 262.5 20.5 – – 20.5 – – 20.5 Hedging derivatives 14.6 – – 14.6 – – 14.6 37.7 – – 37.7 – – 37.7Trade receivables 1,788.7 1,788.7 – – – – 1,659.4 1,659.4 – – – – Loans and receivables 1,788.7 1,788.7 – – – – 1,788.7 1,659.4 1,659.4 – – – – 1,659.4Current and non-current other assets 375.1 231.3 – 58.1 – 85.7 347.0 214.3 – 47.0 – 85.7 Non-hedging derivatives 0.0 – – – – – 0.0 0.0 – – – – – 0.0 Loans and receivables 231.3 231.3 – – – – 231.3 214.3 214.3 – – – – 214.3 Hedging derivatives 58.1 – – 58.1 – – 58.1 47.0 – – 47.0 – – 47.0 Non-financial items 85.7 – – – – 85.7 85.7 – – – – 85.7Non-current financial assets 118.4 15.9 48.2 54.3 – – 97.4 25.4 25.5 46.5 – – Non-hedging derivatives 0.1 – – 0.1 – – 0.1 0.0 – – – – – 0.0 Held to maturity 0.0 – – – – – 0.0 10.1 10.1 – – – – 10.1 Loans and receivables 15.9 15.9 – – – – 15.9 15.3 15.3 – – – – 15.3 Available-for-sale 102.4 – 48.2 54.2 – – 102.4 72.0 – 25.5 46.5 – – 72.0 Hedging derivatives 0.0 – – – – – 0.0 0.0 – – – – – 0.0Financial assets covering pensions 209.6 61.1 – 148.5 – – – – – – – – Held to maturity 61.1 61.1 – – – – 61.1 – – – – – – – Available-for-sale 148.5 – – 148.5 – – 148.5 – – – – – – –
liabilitiesCurrent and non-current financial liabilities 2,307.3 2,279.4 – 17.5 10.4 – 1,346.3 1,291.9 – 44.9 9.5 – Non-hedging derivatives 17.2 – – 17.2 – – 17.2 44.9 – – 44.9 – – 44.9 Other liabilities 2,279.4 2,279.4 – – – – 2,350.7 1,291.9 1,291.9 – – – – 1,300.9 Hedging derivatives 0.3 – – 0.3 – – 0.3 0.0 – – – – – 0.0 Finance lease 10.4 – – – 10.4 – 10.4 9.5 – – – 9.5 – 9.5Trade accounts payable 935.7 935.7 – – – – 843.7 843.7 – – – – Other liabilities 935.7 935.7 – – – – 935.7 843.7 843.7 – – – – 843.7Current and non-current other liabilities 655.1 275.1 – 1.4 – 378.6 713.8 329.5 – 8.8 – 375.5 Non-hedging derivatives 1.1 – – 1.1 – – 1.1 0.7 – – 0.7 – – 0.7 Other liabilities 275.1 275.1 – – – – 275.1 329.5 329.5 – – – – 329.1 Hedging derivatives 0.3 – – 0.3 – – 0.3 8.1 – – 8.1 – – 8.1 Non-financial items 378.6 – – – – 378.6 375.5 – – – – 375.5
merck Annual Report 2009152

€ million
Book value Dec. 31,
2009
Subsequent measurement according to IAS 39
Non-financial items
Fair value Dec. 31, 2009
Book value Dec. 31, 2008
Subsequent measurement according to IAS 39
Non-financial items
Fair value Dec. 31, 2008
Amortized cost At cost Fair value
Carrying value accord- ing to IAS 17
Amortized cost At cost Fair value
Carrying value accord- ing to IAS 17
assetsCash and cash equivalents 541.4 541.4 – – – – 541.4 692.7 692.7 – – – – 692.7Marketable securities and financial assets 1,503.2 1,199.1 – 304.1 – – 176.8 27.1 – 149.7 – – Held for trading (non-derivatives) 0.0 – – – – – 0.0 0.9 – – 0.9 – – 0.9 Non-hedging derivatives 27.0 – – 27.0 – – 27.0 90.6 – – 90.6 – – 90.6 Held to maturity 48.4 48.4 – – – – 48.4 27.0 27.0 – – – – 27.0 Loans and receivables 1,150.7 1,150.7 – – – – 1,150.7 0.1 0.1 – – – – 0.0 Available-for-sale 262.5 – – 262.5 – – 262.5 20.5 – – 20.5 – – 20.5 Hedging derivatives 14.6 – – 14.6 – – 14.6 37.7 – – 37.7 – – 37.7Trade receivables 1,788.7 1,788.7 – – – – 1,659.4 1,659.4 – – – – Loans and receivables 1,788.7 1,788.7 – – – – 1,788.7 1,659.4 1,659.4 – – – – 1,659.4Current and non-current other assets 375.1 231.3 – 58.1 – 85.7 347.0 214.3 – 47.0 – 85.7 Non-hedging derivatives 0.0 – – – – – 0.0 0.0 – – – – – 0.0 Loans and receivables 231.3 231.3 – – – – 231.3 214.3 214.3 – – – – 214.3 Hedging derivatives 58.1 – – 58.1 – – 58.1 47.0 – – 47.0 – – 47.0 Non-financial items 85.7 – – – – 85.7 85.7 – – – – 85.7Non-current financial assets 118.4 15.9 48.2 54.3 – – 97.4 25.4 25.5 46.5 – – Non-hedging derivatives 0.1 – – 0.1 – – 0.1 0.0 – – – – – 0.0 Held to maturity 0.0 – – – – – 0.0 10.1 10.1 – – – – 10.1 Loans and receivables 15.9 15.9 – – – – 15.9 15.3 15.3 – – – – 15.3 Available-for-sale 102.4 – 48.2 54.2 – – 102.4 72.0 – 25.5 46.5 – – 72.0 Hedging derivatives 0.0 – – – – – 0.0 0.0 – – – – – 0.0Financial assets covering pensions 209.6 61.1 – 148.5 – – – – – – – – Held to maturity 61.1 61.1 – – – – 61.1 – – – – – – – Available-for-sale 148.5 – – 148.5 – – 148.5 – – – – – – –
liabilitiesCurrent and non-current financial liabilities 2,307.3 2,279.4 – 17.5 10.4 – 1,346.3 1,291.9 – 44.9 9.5 – Non-hedging derivatives 17.2 – – 17.2 – – 17.2 44.9 – – 44.9 – – 44.9 Other liabilities 2,279.4 2,279.4 – – – – 2,350.7 1,291.9 1,291.9 – – – – 1,300.9 Hedging derivatives 0.3 – – 0.3 – – 0.3 0.0 – – – – – 0.0 Finance lease 10.4 – – – 10.4 – 10.4 9.5 – – – 9.5 – 9.5Trade accounts payable 935.7 935.7 – – – – 843.7 843.7 – – – – Other liabilities 935.7 935.7 – – – – 935.7 843.7 843.7 – – – – 843.7Current and non-current other liabilities 655.1 275.1 – 1.4 – 378.6 713.8 329.5 – 8.8 – 375.5 Non-hedging derivatives 1.1 – – 1.1 – – 1.1 0.7 – – 0.7 – – 0.7 Other liabilities 275.1 275.1 – – – – 275.1 329.5 329.5 – – – – 329.1 Hedging derivatives 0.3 – – 0.3 – – 0.3 8.1 – – 8.1 – – 8.1 Non-financial items 378.6 – – – – 378.6 375.5 – – – – 375.5
153Company management Report Corporate governanceto our shareholders Consolidated Financial Statements Further information
notes
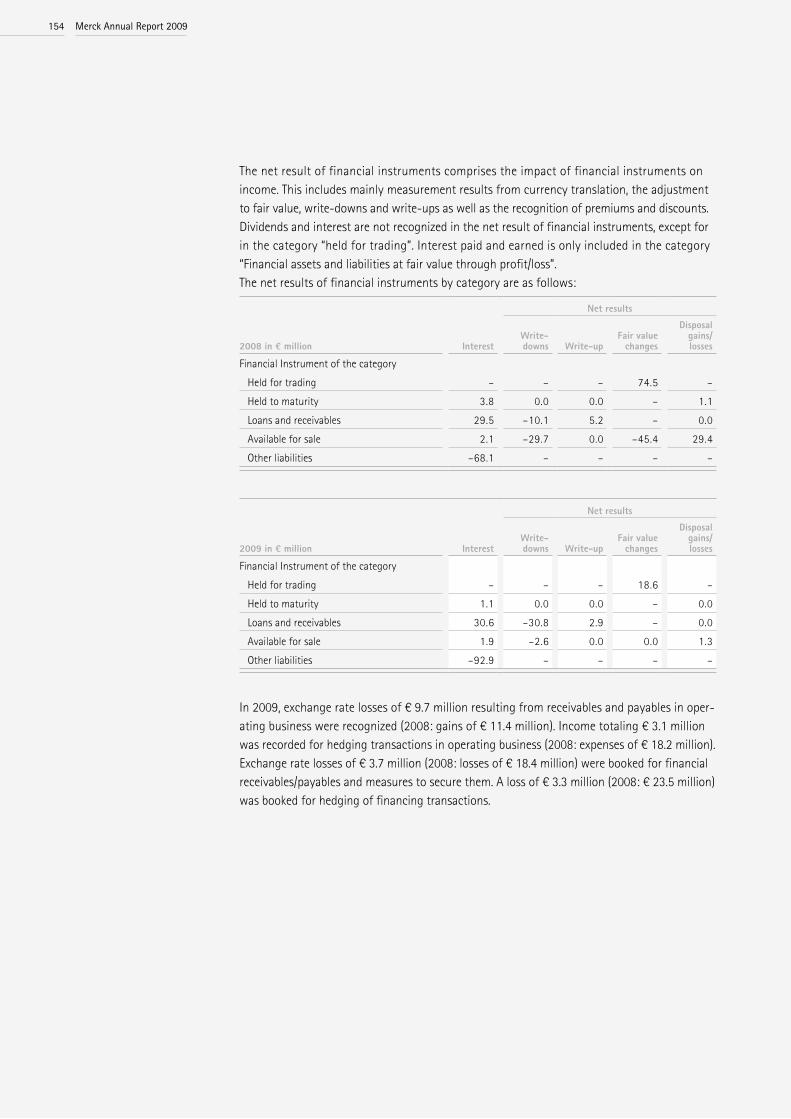
The net result of financial instruments comprises the impact of financial instruments on income. This includes mainly measurement results from currency translation, the adjustment to fair value, write-downs and write-ups as well as the recognition of premiums and discounts. Dividends and interest are not recognized in the net result of financial instruments, except for in the category “held for trading”. Interest paid and earned is only included in the category “Financial assets and liabilities at fair value through profit/loss”. The net results of financial instruments by category are as follows:
2008 in € million
Net results
InterestWrite-downs Write-up
Fair value changes
Disposal gains/losses
Financial Instrument of the category Held for trading – – – 74.5 – Held to maturity 3.8 0.0 0.0 – 1.1 Loans and receivables 29.5 –10.1 5.2 – 0.0 Available for sale 2.1 –29.7 0.0 –45.4 29.4 Other liabilities –68.1 – – – –
2009 in € million
Net results
InterestWrite-downs Write-up
Fair value changes
Disposal gains/losses
Financial Instrument of the category Held for trading – – – 18.6 – Held to maturity 1.1 0.0 0.0 – 0.0 Loans and receivables 30.6 –30.8 2.9 – 0.0 Available for sale 1.9 –2.6 0.0 0.0 1.3 Other liabilities –92.9 – – – –
In 2009, exchange rate losses of € 9.7 million resulting from receivables and payables in oper-ating business were recognized (2008: gains of € 11.4 million). Income totaling € 3.1 million was recorded for hedging transactions in operating business (2008: expenses of € 18.2 million). Exchange rate losses of € 3.7 million (2008: losses of € 18.4 million) were booked for financial receivables/payables and measures to secure them. A loss of € 3.3 million (2008: € 23.5 million) was booked for hedging of financing transactions.
merck Annual Report 2009154
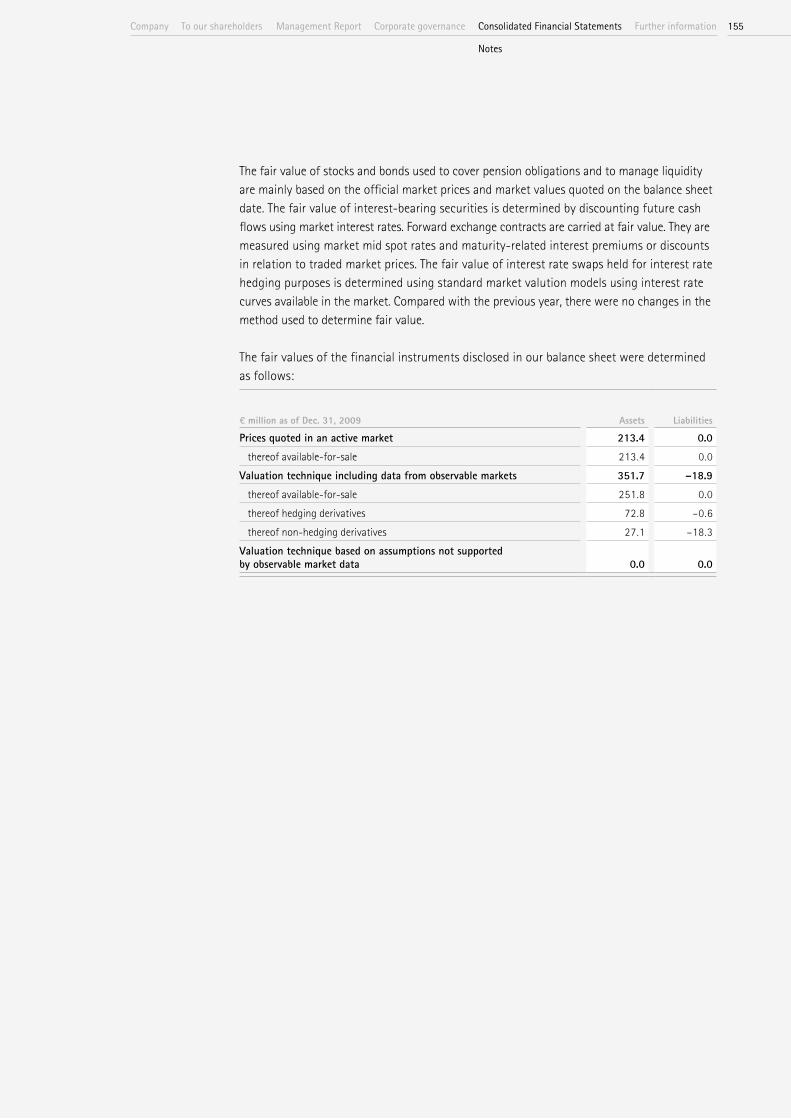
The fair value of stocks and bonds used to cover pension obligations and to manage liquidity are mainly based on the official market prices and market values quoted on the balance sheet date. The fair value of interest-bearing securities is determined by discounting future cash flows using market interest rates. Forward exchange contracts are carried at fair value. They are measured using market mid spot rates and maturity-related interest premiums or discounts in relation to traded market prices. The fair value of interest rate swaps held for interest rate hedging purposes is determined using standard market valution models using interest rate curves available in the market. Compared with the previous year, there were no changes in the method used to determine fair value.
The fair values of the financial instruments disclosed in our balance sheet were determined as follows:
€ million as of Dec. 31, 2009 Assets Liabilities
Prices quoted in an active market 213.4 0.0 thereof available-for-sale 213.4 0.0Valuation technique including data from observable markets 351.7 –18.9 thereof available-for-sale 251.8 0.0 thereof hedging derivatives 72.8 –0.6 thereof non-hedging derivatives 27.1 –18.3Valuation technique based on assumptions not supported by observable market data 0.0 0.0
155Company management Report Corporate governanceto our shareholders Consolidated Financial Statements Further information
notes

€ millionDec. 31,
2009thereof
subsidiariesDec. 31,
2008thereof
subsidiaries
Guarantees 69.0 – 71.2 –Warranties 1.3 – 1.4 –Other contingent liabilities 26.2 – 27.9 –
Most of the guarantees issued exist in connection with our pharmaceutical business in Italy, where pursuant to tax legislation, guarantees must be given for reimbursements of tax receivables from the Italian fiscal authorities as well as to secure the supply of products to public hospitals. As of December 31, 2009, these amounted to € 43.0 million. Other contin-gent liabilities include, among other things, collateral security given on property, plant and equipment, for example buildings and potential obligations from legal disputes, for which the probability of an outflow of resources did not suffice to recognize a provision as of the balance sheet date.
Other financial obligations comprise the following:
€ millionDec. 31,
2009thereof
subsidiariesDec. 31,
2008thereof
subsidiaries
Obligations to acquire intangible assets 1,207.5 – 1,643.1 –Orders for capital expenditure on property, plant and equipment 211.0 – 265.1 –Future operating lease payments 133.3 – 147.4 –Long-term purchase commitments 8.8 – 8.3 –Other financial obligations 18.6 – 22.6 –
1,579.2 – 2,086.5 –
[40] Contingent liabilities
[41)other financial obligations
merck Annual Report 2009156
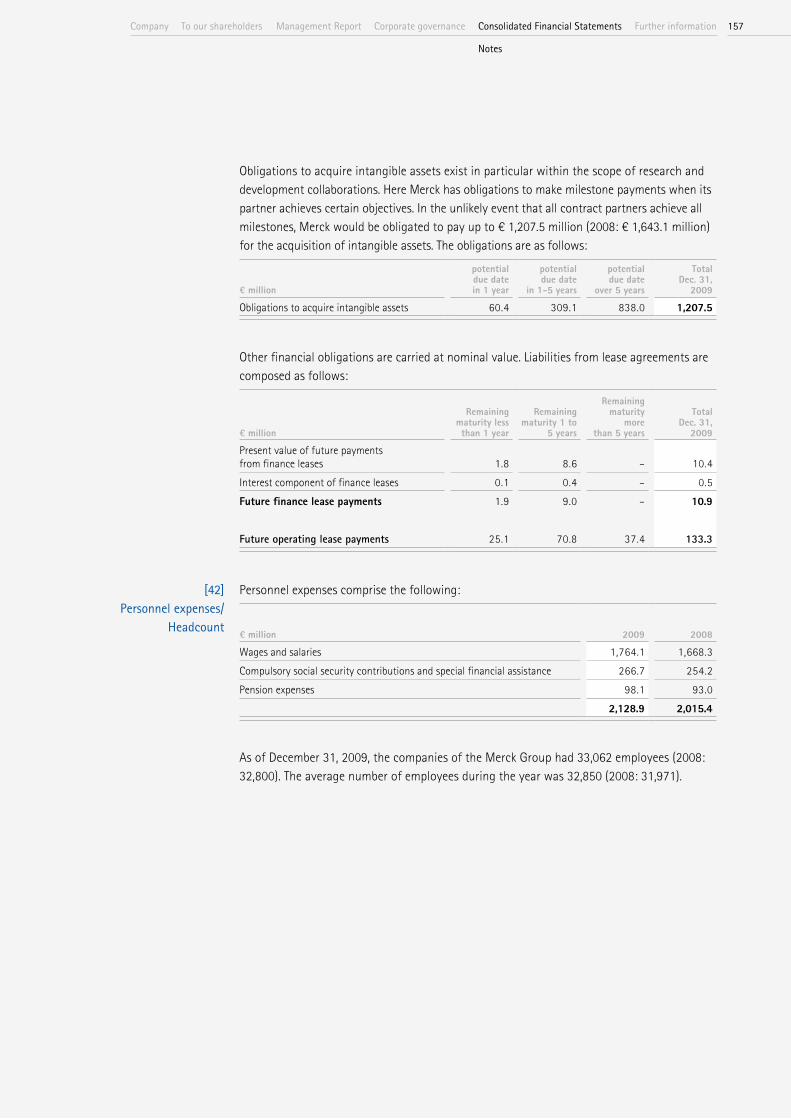
Obligations to acquire intangible assets exist in particular within the scope of research and development collaborations. Here Merck has obligations to make milestone payments when its partner achieves certain objectives. In the unlikely event that all contract partners achieve all milestones, Merck would be obligated to pay up to € 1,207.5 million (2008: € 1,643.1 million) for the acquisition of intangible assets. The obligations are as follows:
€ million
potential due date in 1 year
potential due date
in 1-5 years
potential due date
over 5 years
Total Dec. 31,
2009
Obligations to acquire intangible assets 60.4 309.1 838.0 1,207.5
Other financial obligations are carried at nominal value. Liabilities from lease agreements are composed as follows:
€ million
Remaining maturity less than 1 year
Remaining maturity 1 to
5 years
Remaining maturity
more than 5 years
Total Dec. 31,
2009
Present value of future payments from finance leases 1.8 8.6 – 10.4Interest component of finance leases 0.1 0.4 – 0.5Future finance lease payments 1.9 9.0 – 10.9
future operating lease payments 25.1 70.8 37.4 133.3
Personnel expenses comprise the following:
€ million 2009 2008
Wages and salaries 1,764.1 1,668.3Compulsory social security contributions and special financial assistance 266.7 254.2Pension expenses 98.1 93.0
2,128.9 2,015.4
As of December 31, 2009, the companies of the Merck Group had 33,062 employees (2008: 32,800). The average number of employees during the year was 32,850 (2008: 31,971).
[42] Personnel expenses/
headcount
157Company management Report Corporate governanceto our shareholders Consolidated Financial Statements Further information
notes
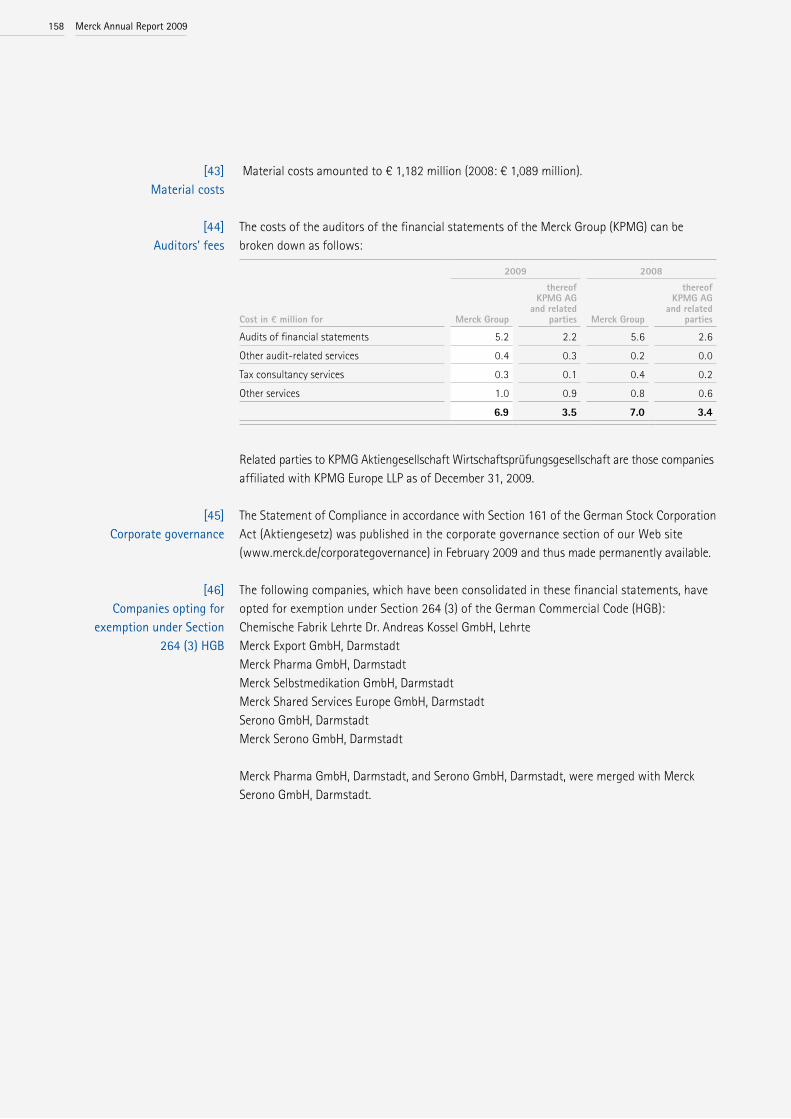
Material costs amounted to € 1,182 million (2008: € 1,089 million).
The costs of the auditors of the financial statements of the Merck Group (KPMG) can be broken down as follows:
Cost in € million for
2009 2008
Merck Group
thereof KPMG AG
and related parties Merck Group
thereof KPMG AG
and related parties
Audits of financial statements 5.2 2.2 5.6 2.6Other audit-related services 0.4 0.3 0.2 0.0Tax consultancy services 0.3 0.1 0.4 0.2Other services 1.0 0.9 0.8 0.6
6.9 3.5 7.0 3.4
Related parties to KPMG Aktiengesellschaft Wirtschaftsprüfungsgesellschaft are those companies affiliated with KPMG Europe LLP as of December 31, 2009.
The Statement of Compliance in accordance with Section 161 of the German Stock Corporation Act (Aktiengesetz) was published in the corporate governance section of our Web site (www.merck.de/corporategovernance) in February 2009 and thus made permanently available.
The following companies, which have been consolidated in these financial statements, have opted for exemption under Section 264 (3) of the German Commercial Code (HGB):Chemische Fabrik Lehrte Dr. Andreas Kossel GmbH, Lehrte Merck Export GmbH, DarmstadtMerck Pharma GmbH, Darmstadt Merck Selbstmedikation GmbH, Darmstadt Merck Shared Services Europe GmbH, DarmstadtSerono GmbH, Darmstadt Merck Serono GmbH, Darmstadt
Merck Pharma GmbH, Darmstadt, and Serono GmbH, Darmstadt, were merged with Merck Serono GmbH, Darmstadt.
[43] material costs
[44] Auditors’ fees
[45] Corporate governance
[46] Companies opting for
exemption under Section 264 (3) hGB
merck Annual Report 2009158
Related parties in respect of the Merck Group are E. Merck KG as well as Emanuel Merck Vermö-gens KG and E. Merck Beteiligungen KG. In principle, direct or indirect subsidiaries of Merck KGaA, associates and joint ventures of the Merck Group as well as pension funds that are classified as funded defined benefit plans in accordance with IAS 19, are also related parties within the meaning of IAS 24. Members of the Executive Board and the Supervisory Board of Merck KGaA, the Board of Management and the Board of Partners of E. Merck KG as well as close members of their families are also related parties. As of December 31, 2009, there were liabilities by Merck Financial Services GmbH, Merck KGaA and Merck & Cie KG, Altdorf, to E. Merck KG in the amount of € 292.6 million (2008: € 332.8 mil-lion). In addition, as of December 31, 2009 Merck KGaA had receivables in the amount of € 10.7 million (2008: € 18.0 million) from E. Merck KG and from E. Merck Beteiligungen KG in the amount of € 4.2 million (2008: € 4.5 million). The balances result mainly from the profit transfers by Merck & Cie to E. Merck KG, the reciprocal profit transfers between Merck KGaA and E. Merck KG as well as the extension of loans by E. Merck KG to Merck Financial Services GmbH (in 2008: Merck KGaA). These financial payables of € 118.8 million (2008: € 98.2 million) are subject to standard market interest rates. From January to December 2009, Merck KGaA and Merck Shared Services Europe GmbH performed services for E. Merck KG with a value of € 1.2 million (2008: € 1.2 million), for E. Merck Beteiligungen KG with a value of € 0.4 million (2008: € 0.5 million), and for Emanuel Merck Vermögens KG with a value of € 0.1 million (2008: € 0.1 million). During the same period, E. Merck KG performed services for Merck KGaA with a value of € 0.5 million (2008: € 0.5 million).Business transactions with major subsidiaries have been eliminated during consolidation and are not disclosed further in the Notes. Information on pension funds that are classified as funded defined benefit plans in accordance with IAS 19 can be found under Provisions for pensions and other post-employment benefits. There were no further material transactions with these pension funds. From January to December 2009, companies of the Merck Group supplied goods with a value of € 0.3 million (2008: € 0.3 million) to associates. There were no further material transactions with associates in 2009.There were no additional material transactions such as, for example, the provision of services or the extension of loans, between the companies of the Merck Group and members of the Executive Board and the Supervisory Board of Merck KGaA, the Executive Board and the Board of Partners of E. Merck KG or members of their immediate families.
[47] Related-party disclosures
159Company management Report Corporate governanceto our shareholders Consolidated Financial Statements Further information
notes
Consolidated Financial Statements

The compensation of the Executive Board of Merck KGaA is largely paid by the general partner, E. Merck KG, and recorded as an expense in its income statement. For January to December 2009, fixed salaries of € 3.5 million (2008: € 2.4 million) and variable compensation of € 4.0 million (2008: € 9.9 million) were recorded for Members of the Executive Board of Merck KGaA. Variable compensation is in principle based on the three-year rolling average of profit after tax of the E. Merck Group. Furthermore, additions to pension provisions of E. Merck KG include current service costs of € 1.6 million (2008: € 2.0 million) for members of the Executive Board of Merck KGaA. Subject to the approval of the Annual General Meeting on the proposed distribution of a dividend of € 1.00 per share, the compensation of the Supervisory Board amounting to € 435 thousand (2008: € 586 thousand) consists of a fixed portion of € 123 thousand (2008: € 116 thousand) and a variable portion of € 312 thousand (2008: € 470 thousand).
The Executive Board of Merck KGaA prepared the consolidated financial statements on Janu-ary 28, 2010 and approved them for forwarding to the Supervisory Board. The Supervisory Board has the responsibility to examine the consolidated financial statements and to declare whether it approves them.
(48) executive Board and Super-visory Board compensation
[49] information on preparation
and approval
merck Annual Report 2009160
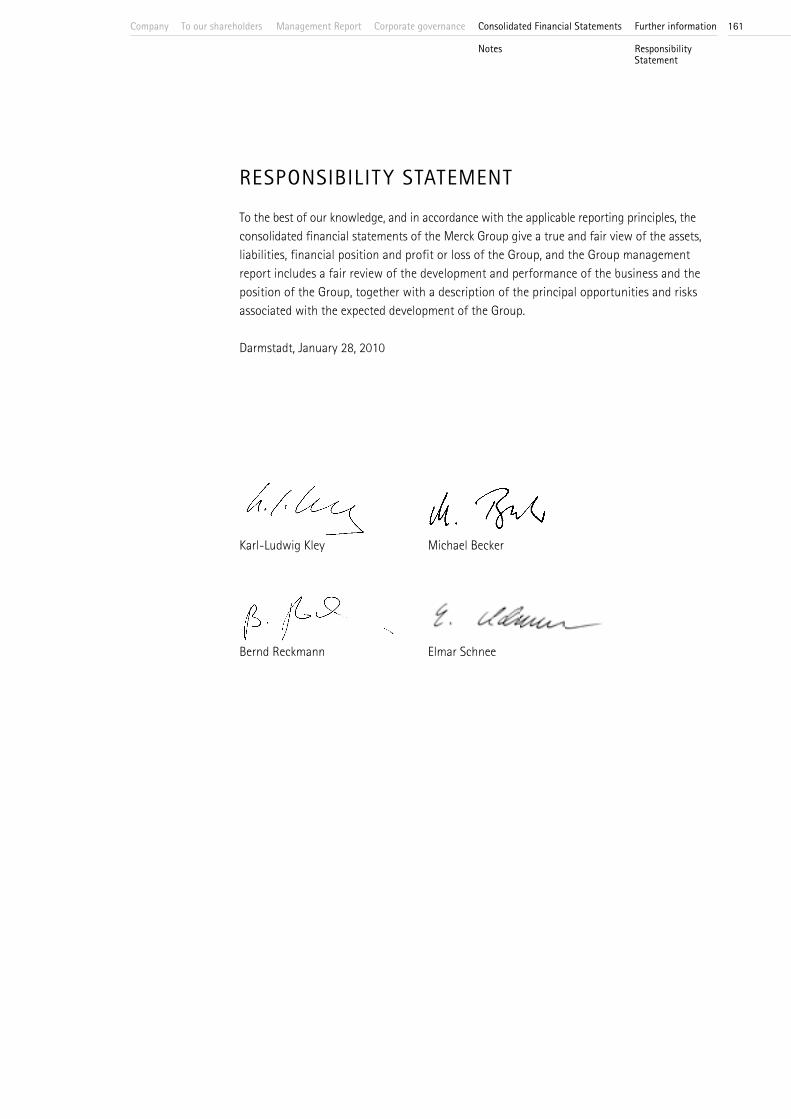
ReSPonSiBility StAtement
To the best of our knowledge, and in accordance with the applicable reporting principles, the consolidated financial statements of the Merck Group give a true and fair view of the assets, liabilities, financial position and profit or loss of the Group, and the Group management report includes a fair review of the development and performance of the business and the position of the Group, together with a description of the principal opportunities and risks associated with the expected development of the Group.
Darmstadt, January 28, 2010
Karl-Ludwig Kley Michael Becker
Bernd Reckmann Elmar Schnee
161Company management Report Corporate governanceto our shareholders Consolidated Financial Statements
notes
Further information
Responsibility Statement
AuditoR’S RePoRt “We have audited the consolidated financial statements prepared by Merck Kommanditgesell-schaft auf Aktien, Darmstadt, comprising the balance sheet, the income statement, the state-ment of comprehensive income, the cash flow statement, statement of changes in net equity including minority interest, and the notes to the consolidated financial statements together with the group management report, for the business year from January 1 to December 31, 2009. The preparation of the consolidated financial statements and the group management report in accord ance with International Financial Reporting Standards (IFRS) as adopted by the EU, and the additional requirements of German commercial law pursuant to § 315a Abs. 1 HGB as well as the supplementary provisions of the Articles of Association are the responsibility of the Executive Board of the company. Our responsibility is to express an opinion on the consolidated financial statements and the group management report based on our audit. We conducted our audit of the consolidated financial statements in accordance with § 317 of the German Commercial Code (HGB) and German generally accepted standards for the audit of financial statements promulgated by the Institut der Wirtschafts prüfer (IDW). Those standards require that we plan and perform the audit such that misstatements materially affecting the presentation of the net assets, financial position and results of operations in the consolidated financial statements in accordance with the applicable financial reporting framework and in the group management report are detected with reasonable assurance. Knowledge of the business activities and the economic and legal environment of the Group and expectations as to possible misstatements are taken into account in the determination of audit procedures. The effectiveness of the accounting-related internal control system and the evidence supporting the disclosures in the consolidated financial statements and the group manage ment report are examined primarily on a test basis within the framework of the audit. The audit includes assessing the annual financial statements of those entities included in consolidation, the determination of entities to be included in consolidation, the accounting and consolidation principles used and significant estimates made by the Executive Board, as well as evaluating the overall presentation of the consolidated financial statements and group management report. We believe that our audit provides a reasonable basis for our opinion.
merck Annual Report 2009162
Our audit has not led to any reservations.
In our opinion, based on the findings of our audit, the consolidated financial statements comply with IFRSs, as adopted by the EU, the additional requirements of German commercial law pursuant to § 315a Abs. 1 HGB as well as the supplementary provisions of the Articles of Association and give a true and fair view of the net assets, financial position and results of operations of the Group in accordance with these requirements. The group management report is consistent with the consolidated financial statements and as a whole provides a suitable view of the Group’s position and suitably presents the opportunities and risks of future development.”
Frankfurt am Main, February 1, 2010
KPMG AGWirtschaftsprüfungsgesellschaft
Dr. Bernd Erle Wirtschaftsprüfer
Manfred Jenal Wirtschaftsprüfer
163Company management Report Corporate governanceto our shareholders Further informationConsolidated Financial Statements
Auditor’s Report
BBeta-blockers A collective term for similarly acting drug substances that act as inverse agonists on the
body’s beta receptors and so inhibit the action of stress hormones (notably, norepinephrine and epinephrine). They lower the heart rate and blood pressure, make the heart beat less strongly, and reduce the heart’s excitability.
Bh4 Co-enzyme (tetrahydrobiopterin): the effects of BH4 deficiency include reduced levels of dopamine and serotonin.
Biomarkers The term refers both to substances in the body and cell properties. Biomarkers can help doctors to identify a patient’s disease. Certain genes tend to play a role in the treatment of cancers, in terms of whether they are “normal” (wild type) or have undergone transformation (mutant). A relatively simple test is usually done.
CCapital spending ratio Capital spending as a proportion of total revenues.
CeFiC European Chemical Industry Council.
ChmP Committee for Medicinal Products for Human Use: a scientific committee of the European Medicines Agency. It prepares the Agency’s opinions and handles the authorization and risk assessment of medicinal products.
Credit facility The financial scope up to which a bank has agreed to grant a loan to a borrower is referred to as a credit line or credit facility. A credit line is a revolving credit: the borrower can continu-ously draw funds and make payments until the term expires or the credit line is terminated.
ddAX ® Deutscher Aktienindex (German stock index): Its value is based on the stock prices of the
30 largest German companies by trading volume and market capitalization.
eeBit Earnings before interest and taxes. Equals the operating result plus exceptional items.
eBitdA Earnings before interest, taxes, depreciation and amortization: depreciation and amortization are added back to EBIT.
eGFR Epidermal Growth Factor Receptor: It is upregulated in various tumor types and/or present in mutated form, resulting in uncontrolled growth and replication of tumor cells. Novel cancer therapies are aimed at blocking EGFR’s oncogenic signal and hence stopping tumor growth.
emA (previously emeA) European Medicines Agency: an official body of the European Union, headquartered in London. It is responsible for evaluating and monitoring medicines and plays a key role in the marketing authorization of medicinal products.
equity ratio Indicator that shows equity capital in proportion to total capital, serving to evaluate the financial stability and independence of a comwpany.
GloSSARy
merck Annual Report 2009164

fFCR Underlying free cash flow on revenues: FCR is calculated from the underlying free cash flow
as a percentage of total revenues. This is a key performance indicator for steering the business.
FdA Food and Drug Administration: U.S. government agency responsible for protecting and advancing public health, especially as concerns food and drugs.
Financial covenants Financial figures stipulated in loan contracts to which the company must adhere during the duration of the loan.
First, second and third line therapy
First and second line therapies are curative in nature and therefore take precedence. Some patients derive little or no benefit from first and second line treatment. Patients who have not responded to the first two lines move on to a third line of treatment, which is palliative (i.e. it aims to relieve suffering).
Free cash flow Sum of the net cash flow from operating activities minus investments in intangible assets, property, plant and equipment, acquisitions as well as investments in other financial assets, plus proceeds from the disposal of assets and changes in securities.
GGdP Gross domestic product – total value of all goods (products and services) intended for final
consumption that are produced within a country’s borders in a given year.
Gearing Ratio of net debt including pension provisions to net equity.
GhS Globally Harmonized System of Classification and Labelling of Chemicals. An international standard system to classify chemicals, including labels and safety data sheets.
GPhF Global Pharma Health Fund e.V. is a non-profit initiative created by Merck. The organization’s goal is to promote health care within the scope of development assistance, especially with respect to the fight against counterfeit drugs through the use of the GPHF-Minilab ®.
GPhF-minilab ® With the GPHF-Minilab ®, the GPHF offers a unique mobile compact laboratory that is capable of testing the quality of drugs very quickly.
Greenhouse Gas Protocol Most widely used accounting and reporting system for greenhouse gas emissions.
iiCCA International Council of Chemical Associations.
imF International Monetary Fund, with headquarters in Washington, D.C., is a United Nations organization.
irinotecan An antineoplastic (chemotherapy) drug used to treat cancer.
iSo 14001 This international environmental management standard specifies globally recognized requirements for an environmental management system.
165Company management Report Corporate governanceto our shareholders Consolidated Financial Statements Further information
Glossary

KKRAS A recently identified biomarker that can show whether a patient with metastatic colorectal
carcinoma is likely to respond to EGFR antibody therapy. This is done by testing the status of the KRAS gene in the tumor to see if it is normal (wild type) or abnormal (mutant). The KRAS acronym stands for Kirsten Rat Sarcoma.
lled A light-emitting diode (LED) is an electronic semiconductor device. When an electric current
passes through it in the flow direction, it emits visible light, infrared radiation (infrared diode) or ultraviolet radiation. The wavelength of this depends on the semiconductor material used and the doping level.
liquid crystals (lC) These specialty chemicals are used in LC displays (LCD), for example, in flat-panel televisions, notebooks, mobile telephones, and cameras. This is also the name of the Merck division that researches and markets liquid crystals.
ltiP Long-term incentive plan: Performance-based remuneration component offered by Merck to eligible executives and experts.
ltiR Lost time injury rate: indicator for workplace safety. The number of workplace accidents with one or more days of lost time per million hours worked
lupus erythematosus (le) An autoimmune disease linked to inflammatory rheumatic disease and classified as a collagen disease. There are two main types: lupus of the skin, and systemic lupus erythematosus (SLE).It may affect other organ systems apart from the skin and joints, e.g. the kidneys in lupus nephritis (LN).
mmarketing and selling ratio Marketing and selling expenses as a percentage of total revenues.
metafolin® Biologically active form of folate that occurs naturally in the human body and is utilized better by the body than folic acid. Folic acid and Metafolin® are important for cell division and blood formation and therefore the development and growth of new life.
monoclonal antibodies Highly specialized targeted antibodies synthesized using biotechnological methods. What makes them special is their ability to activate the body’s natural mechanisms to fight disease. Monoclonal antibodies have mainly been used for cancer treatment and to suppress adverse immune responses.
muC1 Also known as PEM (polymorphic epithelial mucin), MUC1 is a glycoprotein group mucin embedded in cell membranes and occurring in all human organs. The MUC1 mucin is an established tumor marker. In oncology, this tumor marker is the starting point for several new cancer therapies.
ooeCd Organization for Economic Co-operation and Development, with headquarters in Paris, is a
forum of 30 countries, almost all of them industrialized.
oled Organic light-emitting diodes. New technology for displays and lighting used, for example, in mobile telephones, MP3 players, and since recently also in televisions and lamps.
merck Annual Report 2009166

otC Over-the-counter drugs is the term used for drugs that are available at stores and pharmacies without a prescription.
PPraziquantel A vermifuge used to fight flatworms, tapeworms and distoma including the schistosoma,
the pathogen that causes the tropical disease schistosomiasis.
PS-vA Polymer-stabilized vertical alignment: A polymer layer pre-aligns the molecules inside the display in a certain direction. In the black state, the liquid crystals are not exactly vertical, but slightly tilted: This allows the liquid crystals to switch more quickly. The light transmittance is higher, thus reducing the backlighting, one of the most costly components to produce.
RRating Rating is an assessment of a borrower’s ability to pay. Borrowers are classified according to
a bank’s own criteria (internal rating) or the criteria of international rating agencies such as Moody’s or Standard & Poor’s (external rating).
ReACh REACH stands for the Registration, Evaluation, Authorization and Restriction of Chemicals. This is an EU regulation that entered into force in mid-2007.
Research ratio Research spending as a proportion of the total revenues of the company or division.
RoS Return on sales: Ratio of operating result to total revenues. This is a key performance indicator for steering the business.
SSchistosomiasis Schistosomiasis, also known as bilharziosis, is a parasitic disease that is spread in warm lakes
and ponds by snails that serve as intermediate hosts.
Somatotropin A proteohormone occurring as a growth hormone in the human and animal organism. Somatotropin is essential to the achievement of normal height.
ttotal revenues Sum of sales as well as royalty and commission income. Royalties are earned primarily through
patents held by the Pharmaceuticals business sector.
touch panels Screens that are sensitive to touch, allowing users to perform operations at the touch of a finger, such as at kiosks.
uunderlying free cash flow Free cash flow adjusted for acquisitions and divestments
VvA Vertical alignment, a technology that orients the liquid crystals to lie nearly vertical to the glass
plates when they are switched off. This significantly improves switching times and reduces dependency on viewing angle, while also considerably improving the contrast thanks to the almost perfectly vertical alignment.
vCi Verband der Chemischen Industrie (German Chemical Industry Association) represents the economic-political interests of 1,600 German chemical companies.
167Company management Report Corporate governanceto our shareholders Further informationConsolidated Financial Statements
Glossary

FinAnCiAl CAlendAR FoR 2010
annual press conference: Tuesday, February 23
annual General meeting: Friday, April 9
Report on the first quarter: Wednesday, April 28
Report on the first half: Thursday, July 29
autumn press conference and Report on the third quarter: Tuesday, October 26
moRe inFoRmAtion
The Merck Annual Report for 2009 is available in German and English. An abridgedversion is also available in German and English. Both reports are available as navigableonline versions on the Web at www.merck.de/annualreport2009.More information about Merck can be found on the Web at www.merck.de and inthe following publications, which you may read or order (in German and English) atwww.merck.de/publications).
Responsibility – 2009 Corporate Resonsibility ReportMerck – Facts & Figures (also available in French and Spanish)
You can order these publications from Corporate Communications, Merck KGaA,64271 Darmstadt, Germany, or via the following e-mail address: [email protected].
merck Annual Report 2009168

Total revenues by business sector*
€ million8,000
6,000
4,000
2,000
2005 2006 2007 2008 2009
* excluding Corporate and Other
Chemicals Pharmaceuticals
Operating result by business sector
€ million1,200
800
400
0
2005 2006 2007 2008 2009
Chemicals Pharmaceuticals Corporate and Other
Contents
MERCK AT A GLANCE
Key figures for 2009
€ millionPharma-ceuticals Chemicals
Corporate and Other Total
Change in %
Total revenues 5,812 1,935 0 7,747 2.1Gross margin 4,805 913 0 5,718 0.6Research and development 1,203 142 – 1,345 8.9Operating result 403 324 –78 649 –43Exceptional items –40 12 – –28 –Earnings before interest and tax (EBIT) 363 336 –78 621 –15EBIT before depreciation and amorti-zation (EBITDA) 1,221 479 –75 1,625 –17Return on sales in % (ROS:operating result/total revenues) 6.9 16.8 – 8.4Free cash flow 913 410 –511 812 85Underlying free cash flow 916 432 –496 852 42Underlying free cash flowon revenues (FCR) in % 15.8 22.3 – 11.0
BUSINESS DEVELOPMENT 2000 – 2009This overview may include historically adjusted values in order to ensure comparability with 2009.
Change vs. 2008 in %€ million 2000 2001 2002 2003 2004 2005 20061 20071 2008 2009
Total revenues 2 6,910 7,721 7,521 7,364 6,017 5,887 4,485 7,081 7,590 7,747 2.1Pharmaceuticals 3,047 3,484 3,265 3,458 3,601 3,905 2,338 4,900 5,456 5,812 6.5 Merck Serono 1,941 2,228 1,850 1,546 1,619 1,817 1,938 4,480 5,014 5,345 6.6 Generics 3 790 936 1,096 1,585 1,625 1,712 – – – – – Consumer Health Care 299 320 319 327 357 376 400 420 442 467 5.7 Imaging 3 17 – – – – – – – – – –Chemicals 1,679 1,729 1,791 1,707 1,696 1,906 2,113 2,152 2,127 1,935 –9.0 Liquid Crystals 313 297 383 443 589 741 895 916 878 733 –17 Performance & Life Science Chemicals 1,174 1,216 1,216 1,083 1,107 1,165 1,218 1,236 1,249 1,202 –3.8 Electronic Chemicals 3 192 216 192 181 – – – – – – –Laboratory Distribution 3 2,374 2,754 2,711 2,427 582 – – – – – –Intragroup sales, Laboratory –190 –246 –246 –228 –62 – – – – – –Corporate and Other – – – – 200 76 34 29 7 – –Generics 3 – – – – – – 1,825 1,398 – – –
Operating result 746 877 616 736 776 883 799 976 1,131 649 –43 Pharmaceuticals 455 581 272 389 391 454 217 417 655 403 –39 Chemicals 247 204 260 316 420 492 641 631 558 324 –42 Laboratory Distribution 3 44 92 84 79 21 – – – – – – Corporate and Other 0 0 0 –48 –56 –63 –60 –72 –81 –78 –3.5 Generics 3 – – – – – – 307 189 – – –
Earnings before interest and tax (EBIT) 747 1,286 559 538 1,044 956 1,031 200 731 621 –15EBIT before depreciation and amortization (EBITDA) 1,184 1,694 985 1,008 1,419 1,245 1,334 1,858 1,947 1,625 –17Profit before tax 524 1,078 412 423 961 893 982 –111 575 486 –15Profit after tax 262 655 215 218 672 673 1,0014 3,5204 379 377 –0.6
Free cash flow 324 664 441 442 1,889 657 –1,0734 –1,4734 438 812 85Capital expenditure on property, plant and equipment 427 470 377 281 234 268 2534 2834 395 467 18Research and development 546 577 608 605 599 713 615 1,028 1,234 1,345 8.9
Total assets 8,235 8,255 7,511 6,982 5,754 7,281 8,102 14,922 15,645 16,713 6.8Net equity 1,947 2,336 2,054 2,363 2,800 3,329 3,807 8,688 9,563 9,514 –0.5Employees (number as of December 31) 33,520 34,294 34,504 34,206 28,877 29,133 25,531 30,968 32,800 33,062 0.8
Return on sales in % (ROS: operating result/total revenues) 10.8 11.4 8.2 10.0 12.9 15.0 17.8 13.8 14.9 8.4
Earnings per share in € 1.44 3.66 1.18 1.15 3.47 3.40 5.074 16.214 1.69 1.68 –0.6Dividend per share in € 0.90 0.95 1.00 0.80 0.80 0.85 0.90 1.20 1.50 1.00 –33One-time bonus per share in € – – – – 0.20 – 0.15 2.00 – –1 Continuing Operations (without Generics)2 In 2009, commission income was reclassified from marketing and selling expenses to total revenues. All figures from the previous year were also adjusted.3 Business was divested4 Including Generics
COMPANY 2 The history of Merck 3 Becoming a global, publicly listed company 4 Merck today 4 The future
TO OUR SHAREHOLDERS 6 Letter from Karl-Ludwig Kley 10 Executive Board
MANAGEMENT REPORT 13 Overall economic situation 15 Financial position and results of operations 26 Responsibility 29 Merck shares 34 Pharmaceuticals | Merck Serono 50 Pharmaceuticals | Consumer Health Care 56 Chemicals | Liquid Crystals 62 Chemicals | Performance & Life Science Chemicals 68 Corporate and Other 70 Risk report 75 Report on expected developments 80 Subsequent events
CORPORATE GOVERNANCE 82 Statement on corporate governance 93 Report of the Supervisory Board
CONSOLIDATED FINANCIALSTATEMENTS 96 Income Statement 97 Balance Sheet 98 Segment Reporting 100 Cash Flow Statement101 Free Cash Flow101 Statement of Comprehensive Income101 Statement of Changes in Net Equity
including Minority Interest103 Notes
FURTHER INFORMATION161 Responsibility Statement162 Auditor’s Report164 Glossary168 Financial calendar for 2010168 More information
Publication contributors
Contents
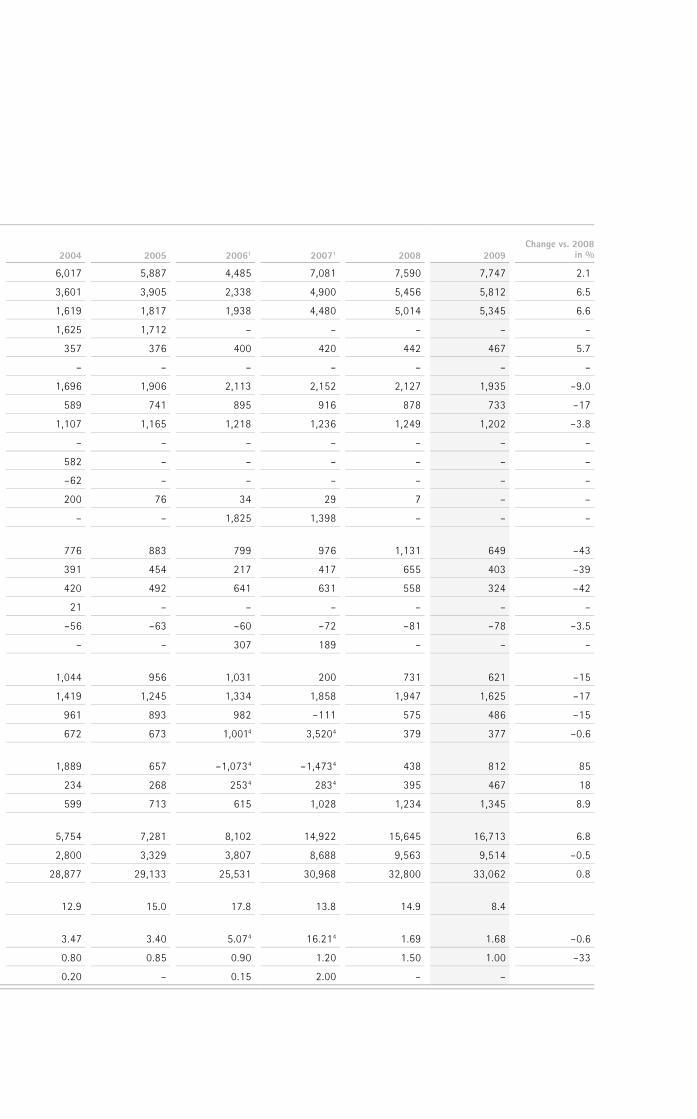

CONTENTS
Publication contributorsPublished on February 23, 2010 by Merck KGaA,Corporate CommunicationsFrankfurter Strasse 250, 64293 Darmstadt, GermanyTel.: +49 (0) 6151-72 0, fax: +49 (0) 6151-72 5577E-mail: [email protected]: www.merck.de
Concept, design and typesetting: XEO GmbH, Düsseldorf, GermanyPhotographs: Pages 6, 10 and 11: Catrin Moritz, Essen;Pages 1, 2, 4, 35, 51, 57, and 63: Reinhard Koslowski, DüsseldorfPrinting: Franz Kuthal GmbH & Co. KG, Mainaschaff, GermanyPaper: FSC-certified “heaven 42” by Scheufelen
Annu
al R
epor
t 200
9
Annual Report 2009
Mer
ck
www.merck.deW 8
40 5
3935
0210
More information inside the cover:Business development 2000 – 2009