memetic feature selection algorithm for multi-label ...mi.cau.ac.kr/teaching/tutorials/s07.pdf ·...
TRANSCRIPT

Information Sciences 293 (2015) 80–96
Contents lists available at ScienceDirect
Information Sciences
journal homepage: www.elsevier .com/locate / ins
Memetic feature selection algorithm for multi-labelclassification
http://dx.doi.org/10.1016/j.ins.2014.09.0200020-0255/� 2014 Elsevier Inc. All rights reserved.
⇑ Corresponding author. Tel.: +82 2 820 5304; fax: +82 2 820 5301.E-mail address: [email protected] (D.-W. Kim).
Jaesung Lee, Dae-Won Kim ⇑School of Computer Science and Engineering, Chung-Ang University, 221, Heukseok-Dong, Dongjak-Gu, Seoul 156-756, Republic of Korea
a r t i c l e i n f o a b s t r a c t
Article history:Received 17 March 2014Received in revised form 15 August 2014Accepted 12 September 2014Available online 20 September 2014
Keywords:Multi-label feature selectionMemetic algorithmLocal refinement
The use of multi-label classification, i.e., assigning unseen patterns to multiple categories,has emerged in modern applications. A genetic-algorithm based multi-label feature selec-tion method has been considered useful because it successfully improves the accuracy ofmulti-label classification. However, genetic algorithms are limited to identify fine-tunedfeature subsets that are close to the global optimum, which results in a long runtime. Inthis paper, we present a memetic feature selection algorithm for multi-label classificationthat prevents premature convergence and improves the efficiency. The proposed methodemploys memetic procedures to refine the feature subsets found through a genetic search,resulting in an improvement in multi-label classification. Empirical studies using varioustests show that the proposed method outperforms conventional multi-label featureselection methods.
� 2014 Elsevier Inc. All rights reserved.
1. Introduction
Multi-label classification is a challenging problem that has emerged in several modern areas of application, such as textcategorization [14], gene function classification [11], and the semantic annotation of images [1]. Let W � Rd denote an inputspace constructed from a set of features F, where jFj ¼ d and patterns drawn from W are assigned to a certain label subsetk # Y , where Y ¼ fy1; . . . ; ywg is a finite set of labels with jY j ¼ w. Thus, multi-label classification is the task of assigningunseen patterns to multiple labels. However, this is a difficult task because its efficacy can be varied according to the numberof labels, features, patterns, and evaluation measures used to assess the quality of the predicted labels from different aspects[4,5,18,23,28,29,36,37].
Based on exhaustive experiments, researchers have reported that feature selection can improve the performance of multi-label classification [2,12,13,15,16,20,26,33–35]. Researchers have considered various approaches to performing featureselection for multi-label learning. Among them, the genetic-algorithm (GA) based multi-label feature selection methodhas shown strength in terms of classification performance [34] because it evaluates the fitness of the feature subsets usinga multi-label classifier directly. However, owing to its inherent characteristics, a GA consumes enormous time to find a fea-ture subset and sometimes may not find the optimum subset with sufficient precision; thus, it often converges to pre-matured solutions.
Recent studies on memetic algorithms (MAs) have demonstrated that they converge to high-quality solutions more effi-ciently than GAs for complex problems. Zhu et al. and Oh et al. presented a memetic algorithm-based feature selection that

J. Lee, D.-W. Kim / Information Sciences 293 (2015) 80–96 81
converges to high-quality solutions faster than a GA for a single-label feature selection problem [21,38,39]. However, theextension of memetic single-label feature selection methods into a multi-label feature selection problem is non-trivial owingto a lack of consideration regarding the choice of meme for undergoing local refinement in multi-label classification.Therefore, in this paper, we propose a new memetic algorithm that unifies the specific issues related to the design of localrefinement on multi-label feature selection problems. The proposed hybridization improves the multi-label classificationaccuracy and accelerates the search speed, refining the population of feature subsets generated by a GA by adding relevantfeatures to, or removing redundant/irrelevant features from, multiple labels. To the best of our knowledge, this is the firststudy investigating multi-label feature selection on the basis of a memetic algorithm.
2. Related works
In the multi-label feature selection problem, a subset S composed of n selected features from F (n � d) that jointly havethe largest dependency on labels Y is chosen. Popular conventional algorithms first transform label sets into a single label (aprocess called problem transformation), and then solve the resultant single-label feature selection problem.
Yang and Pederson [33] compared five multi-label feature selection methods based on five score functions for text cat-egorization. However, the relations among the given labels are not captured because each label is treated independently.Chen et al. [2] proposed the use of an entropy-based label assignment (ELA), which assigns weights to a multi-label patternbased on the label entropy. Patterns that have too many labels are blurred out during the training phase because they areassigned low weights. Thus, it has been argued that a learning algorithm can avoid over-fitting from the learning process.A label powerset (LP) is applied to music information retrieval specifically for recognizing six emotions that are simulta-neously evoked by a music clip [29]. The v2 statistics are used to select effective features with an LP to improve the recog-nition performance of multi-labeled music emotions. Although they used v2 statistics, a recent study reported that the use ofReliefF as a score function for assessing each feature in an LP yields successful classification results [26]. Read [23] proposedthe use of a pruned problem transformation (PPT) to improve an LP. In a PPT, patterns with labels that occur very infre-quently are merely removed from the training set by considering label sets with a predefined minimum occurrence. Doquireand Veleysen [8,9] proposed a PPT-based multi-label feature selection method to improve the classification performance ofimage annotation and gene function classification.
Although the problem transformation-based feature selection approach reduces the effort expended in designing aspecific score function for multi-label problems, this process may cause subsequent problems. For example, problemtransformation methods convert multiple labels into a single-label composed of multiple classes. If there are too manydistinct label sets in the original labels, the resulting single-label will be composed of too many classes. Consequently,the performance of a learning algorithm may be degraded owing to a lack of training patterns for each class [27].
To tackle this, algorithm-adaptation approaches that directly handle multi-label problems can be considered [30]. Zhanget al. [34] proposed a multi-label feature selection method based on a GA that evaluates the benefits of a selected featuresubset using the actual accuracy of a multi-label classifier. However, this method suffers from common drawbacks suchas premature solutions and a slow convergence speed.
Ji and Ye [13] introduced an integrated learning framework in which the algorithm performs feature selection and multi-label classification simultaneously. This method assumes linear relations between the input features and multiple labels.Thus, the objective of this method is to find a combination of linear functions for each label. Because the coefficients of eachlinear function are trained using each label independently, it does not consider relations among labels. Nie et al. [20]designed an efficient feature selection method for genomic and proteomic biomarker selections that minimizes a jointl2;1-norm based loss function and regularization. However, this method suffers from iterative matrix inversion calculations.Qian and Davidson [22] proposed a multi-label classification algorithm for a semi-supervised input dataset; here, patterns inan input dataset are partially assigned to a certain label subset, while the rest remain unlabeled. Similar to the work of Ji andYe [13], Qian and Davidson assumed that the dependency between features and labels can be represented through linearcombinations.
Gu et al. [12] proposed a multi-label feature selection method that minimizes errors in label ranking. Although thismethod may result in a higher generalized performance owing to the merit of support vector machines, it suffers from a highcomputational cost resulting from the exhaustive calculations required to find an appropriate hyperspace using pair-wisepattern comparisons. Kong and Yu [15] proposed a multi-label feature selection method for graph classification for use indrug activity predictions and toxicology analysis. This feature selection method optimizes the Hilbert–Schmidt indepen-dence score of selected feature subsets. Lee and Kim [17] introduced a multi-label feature selection method that maximizesthe mutual information between a feature subset and multiple labels.
3. Proposed method
3.1. Motivation and approach
In this study, we enhance the performance of a population-based search, such as a GA, for multi-label feature selection byincorporating a multi-label-specific local refinement method. Fig. 1 shows a schematic of the cooperation process between a

A Chromosome located by Genetic Search
1 0 1 ... 0 0f1 f2 f3 fd-1 fd
Selected Features
ChromosomeFeatures
Improving Chromosome by Local Refinement
1. Ranking Features by considering Dependency
f
l1 l2
f
l1 l3l2
1. between Feature and Labels
f
l1 l3l2l2
l l l l l l f
l1 l3l2
l l
Strong Dependency
Ranks of Features
fd f3 f2 ... fd-1 f1
tsroWtseB
f1
l8l6
f3
l8l6
f2
l8l6
l4
l7
l5 l4 l5 l4 l5 fd
l8l6
l4 l5
l7 l7 l7
...
Original Chromosome
Del
Af A O i Af O i
2. Modifying Chromosome
Add
1 0 1 ... 0 0
1 0 1 ... 0 1
After ADD OperationBest feature fd was added
0 0 1 ... 0 0
After DEL OperationWorst feature f1 was deleted
Fig. 1. The cooperation process between genetic search and local refinement.
82 J. Lee, D.-W. Kim / Information Sciences 293 (2015) 80–96
genetic search and local refinement for the proposed algorithm. Among the chromosomes (feature subsets) in a populationgenerated by a genetic search, one chromosome is selected to undergo refinement. During local refinement, we calculate thedependency (significance) of features to multiple labels ðl1; l2; . . . ; l8Þ. After the ranking of each feature is computed, for exam-ple f d ! f 3 ! . . .! f 1, the original chromosome is refined through two refinement operations (ADD and DEL). The refinedchromosome is then updated into the population if it yields a better fitness value.
Fig. 1 shows that several key issues should be considered when designing a local refinement for a multi-label featureselection. First, we should consider how to select a chromosome to undergo local refinement among the GA population.In conventional MAs, it is common for a local refinement to be applied to all individual chromosomes in a population,which is very computationally inefficient. Second, we should employ an appropriate local refinement operation (ADDor DEL) for multi-label learning, which is related to the choice of memes for performing the refinement. The local refine-ment operation should be capable of scoring the dependency between features and multiple labels so that it can add rel-evant features or remove irrelevant and/or redundant features from a pre-selected feature subset. The third issue in anMA design is how much computational cost can be allocated to a local refinement; the effectiveness of an MA is influ-enced by the balance between a genetic search and local refinement. Moreover, we should also consider how many timesADD and DEL operations are allowed to refine a selected chromosome. Excessive refinements increase the total executiontime of an MA considerably. It is necessary to vary the number of refinement operations gradually as the searchprogresses.
This paper presents a memetic algorithm that unifies the aforementioned issue. In Section 3.2, we provide the proceduralsteps of the proposed method. Section 3.3 tackles the issues of local refinement associated with the selection of achromosome for refinement, as well as an adaptive approach to controlling the intensity of the refinement itself. Section 3.4then presents a mutual-information based refinement method for efficiently capturing the relations between features andlabels.

J. Lee, D.-W. Kim / Information Sciences 293 (2015) 80–96 83
3.2. Algorithm
Algorithm 1. Proposed memetic algorithm.
1: procedure MEMETIC ALGORITHM ðv;m;hÞ
Table 1Notations used in the design of the proposed method
Terms Meanings
t Number of generPðtÞ The population am The size of the poc A chromosome inSc A selected featureNðtÞ A set of newly crv Maximum numbeh Number of FFCs su Number of spentfþ A feature to be ad
f� A feature to be dp Number of featurq Number of featur
. allowed FFC v
2: t 0;u 0 . t-th generation 3: initializing PðtÞ . population P of t-th generation 4: evaluating PðtÞ 5: while u 6 v do . if spent FFC u is less than v 6: apply Local Refinement(h) to PðtÞ 7: create NðtÞ using genetic operators . offspring set NðtÞ 8: evaluate NðtÞ using a multi-label classifier 9: add NðtÞ to PðtÞ 10: t t þ 1 11: select PðtÞ from Pðt � 1Þ . natural selection 12: u mþ 2 � h � t . update u based on spent FFC 13: end while 14: end procedureAlgorithm 1 outlines the procedures used in the proposed method. The terms used for describing the algorithm are sum-marized in Table 1. The feature selection vector in the chromosome is a binary string, and each bit represents an individualfeature, with values of one and zero representing selected and unselected features, respectively. In the initialization step(line 3), the algorithm generates m chromosomes by random assignment of binary bits. The selected feature subset ðScÞencoded in c 2 PðtÞ is then evaluated using a fitness function; herein, we used a multi-label classification error for evaluatingthe fitness of selected feature subset. In this study, three evaluation scores are employed independently as the fitness func-tion: Hamming loss, Multi-label accuracy, and Subset accuracy. The detailed information on these measures are given in Sec-tion 4.1. The proposed algorithm is a single-objective memetic algorithm, thus one of the three measures is used as thefitness function during the optimization process. Because m chromosomes must be evaluated to obtain their fitness values,m Fitness Function Calls (FFCs) are spent in line 4.
Next, the local refinement modifies the representation of c selected in PðtÞ (line 6). The refinement algorithm evaluatesthe variants of c to identify the best one; during this process, the local refinement consumes a number of FFCs, denoted as h.The variant with the best fitness replaces c if its fitness is better than the fitness of c.
After performing a local refinement, the proposed method creates the offspring set NðtÞ (line 7) using a restrictive crossoverand mutation operators to control the number of selected features [39]. For balance between a genetic search and local refine-ment, we set the size of NðtÞ to h because NðtÞmust be evaluated to determine the fitness (line 8). Thus, the proposed methodspends 2 � h of FFCs in one generation: h for local refinement, and h for a genetic search. Next, NðtÞ is added to PðtÞ, and m chro-mosomes with higher fitness values are selected (line 11). This procedure is repeated until the algorithm spends all of itsallowed FFCs, denoted as v, given by the user. The output of Algorithm 1 is the best feature subset obtained during the evolution.
3.3. Local refinement
The local refinement fine-tunes the selected features from a genetic search for relevance to multiple labels. To resolve thekey design issues for a local refinement, we propose a simple and intuitive method that is easy to implement and understand
.
ationst the t-th generationpulation, jPðtÞj ¼ mPðtÞsubset represented by c
eated solutions from PðtÞr of allowed fitness function calls (FFCs)pent by a genetic search/ local refinementFFCs, u ¼ mþ 2 � h � tded to Sc by a local refinement
iscarded from Sc by a local refinementes to be added by a local refinementes to be deleted by a local refinement

84 J. Lee, D.-W. Kim / Information Sciences 293 (2015) 80–96
by users by employing the notion of a Steady-State GA (SSGA) [32]. First, regarding the issue of selecting appropriate chro-mosomes among a GA population, we choose an elite chromosome from PðtÞ, i.e., the chromosome with the best fitness valueundergoes a local refinement. We replace the best chromosome if the newly refined chromosome is better because it is morestable and allows the results of the local refinement to reside in the population for a longer period of time.
Algorithm 2. Procedures of adaptive local refinement process.
1: procedure LOCAL REFINEMENT (h)
2: c top elitist in PðtÞ . locate the best chromosome 3: for i ¼ 1 to h do 4: TðiÞ Sc . copy current solution Sc to array T 5: b ðv � uÞ=v . ratio of remained FFC 6: p roundðminðjScj; jF � ScjÞ � b � randð0;1ÞÞ 7: for j ¼ 1 to p do . repeat ADD operations p times 8: updating TðiÞ by using ADD(TðiÞ) 9: end for 10: q roundðminðjScj; jF � ScjÞ � b � randð0;1ÞÞ 11: for j ¼ 1 to q do . repeat DEL operations q times 12: updating TðiÞ by using DEL(TðiÞ; Sc) 13: end for 14: evaluate TðiÞ 15: end for 16: find the best T� from Tð1Þ; . . . ; TðhÞ based upon the fitness 17: if fitness of T� is better than the fitness of c then 18: replace c with new solution using T�19: end if
20: end procedureAlgorithm 3. Procedures of ADD operator
1: procedure ADD TðiÞ
2: W F n TðiÞ . locate unselected features by TðiÞ 3: find the best feature fþ ¼ arg maxfþ2W Qðfþ;YÞ 4: TðiÞ TðiÞ [ fþ . add fþ to TðiÞ 5: return TðiÞ 6: end procedureAlgorithm 4. Procedures of DEL operator
1: procedure DelTðiÞ; Sc
2: W TðiÞ \ Sc
. locate selected features by TðiÞ \ Sc3: find the worst feature f� ¼ arg minf�2W Qðf�;YÞ
4: TðiÞ TðiÞ n f� . delete f� from TðiÞ 5: return TðiÞ 6: end procedureAlgorithm 2 shows the detailed procedures of the proposed local refinement. As mentioned earlier, to balance NðtÞ in agenetic search, the local refinement modifies the elite chromosome h times (line 3–15), and determines whether the newlyrefined chromosomes are superior (line 16–19). Let TðiÞ be a duplicated feature subset Sc for a top elite chromosome. We cansee that a local refinement adds p features to (line 7–9), and deletes q features from, Sc (line 11–13). The p number of featuresare added by the refinement operator ADDðTðiÞÞ (Algorithm 3); the ADD operator changes the status of a particular feature asselected after choosing a feature fþ from unselected features fF n TðiÞg that satisfies the following:
arg maxfþ2fFnTðiÞg
Qðfþ;YÞ ð1Þ
J. Lee, D.-W. Kim / Information Sciences 293 (2015) 80–96 85
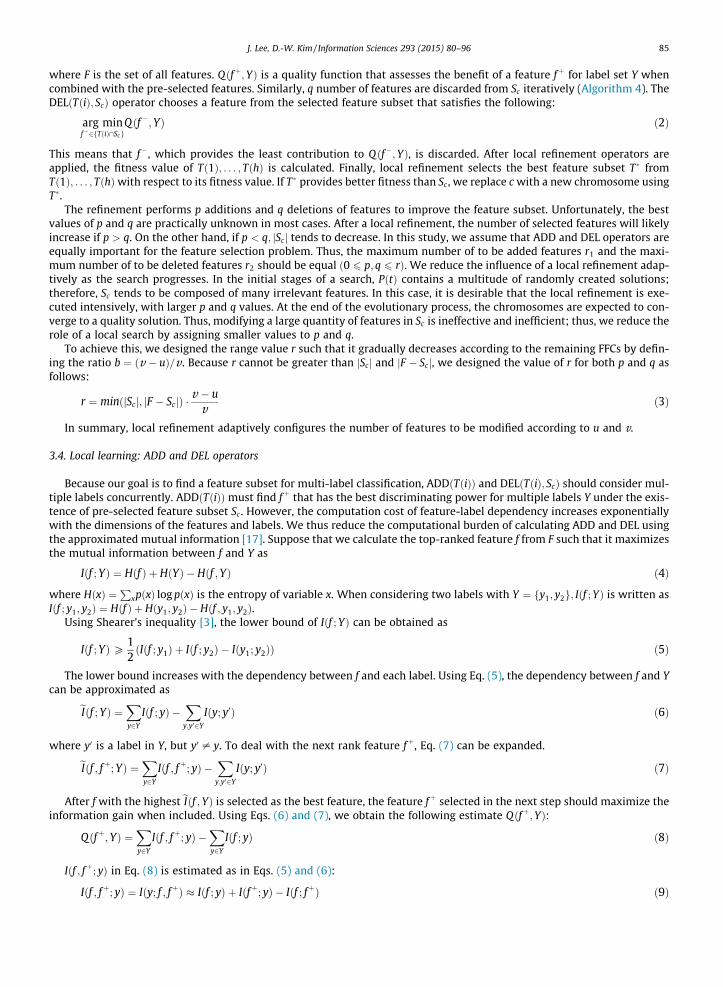
where F is the set of all features. Qðfþ;YÞ is a quality function that assesses the benefit of a feature fþ for label set Y whencombined with the pre-selected features. Similarly, q number of features are discarded from Sc iteratively (Algorithm 4). TheDELðTðiÞ; ScÞ operator chooses a feature from the selected feature subset that satisfies the following:
arg minf�2fTðiÞ\Scg
Qðf�;YÞ ð2Þ
This means that f�, which provides the least contribution to Qðf�;YÞ, is discarded. After local refinement operators areapplied, the fitness value of Tð1Þ; . . . ; TðhÞ is calculated. Finally, local refinement selects the best feature subset T� fromTð1Þ; . . . ; TðhÞwith respect to its fitness value. If T� provides better fitness than Sc , we replace c with a new chromosome usingT�.
The refinement performs p additions and q deletions of features to improve the feature subset. Unfortunately, the bestvalues of p and q are practically unknown in most cases. After a local refinement, the number of selected features will likelyincrease if p > q. On the other hand, if p < q; jScj tends to decrease. In this study, we assume that ADD and DEL operators areequally important for the feature selection problem. Thus, the maximum number of to be added features r1 and the maxi-mum number of to be deleted features r2 should be equal ð0 6 p; q 6 rÞ. We reduce the influence of a local refinement adap-tively as the search progresses. In the initial stages of a search, PðtÞ contains a multitude of randomly created solutions;therefore, Sc tends to be composed of many irrelevant features. In this case, it is desirable that the local refinement is exe-cuted intensively, with larger p and q values. At the end of the evolutionary process, the chromosomes are expected to con-verge to a quality solution. Thus, modifying a large quantity of features in Sc is ineffective and inefficient; thus, we reduce therole of a local search by assigning smaller values to p and q.
To achieve this, we designed the range value r such that it gradually decreases according to the remaining FFCs by defin-ing the ratio b ¼ ðv � uÞ=v . Because r cannot be greater than jScj and jF � Scj, we designed the value of r for both p and q asfollows:
r ¼ minðjScj; jF � ScjÞ �v � u
v ð3Þ
In summary, local refinement adaptively configures the number of features to be modified according to u and v.
3.4. Local learning: ADD and DEL operators
Because our goal is to find a feature subset for multi-label classification, ADDðTðiÞÞ and DELðTðiÞ; ScÞ should consider mul-tiple labels concurrently. ADDðTðiÞÞmust find fþ that has the best discriminating power for multiple labels Y under the exis-tence of pre-selected feature subset Sc. However, the computation cost of feature-label dependency increases exponentiallywith the dimensions of the features and labels. We thus reduce the computational burden of calculating ADD and DEL usingthe approximated mutual information [17]. Suppose that we calculate the top-ranked feature f from F such that it maximizesthe mutual information between f and Y as
Iðf ; YÞ ¼ Hðf Þ þ HðYÞ � Hðf ;YÞ ð4Þ
where HðxÞ ¼P
xpðxÞ log pðxÞ is the entropy of variable x. When considering two labels with Y ¼ fy1; y2g; Iðf ; YÞ is written asIðf ; y1; y2Þ ¼ Hðf Þ þ Hðy1; y2Þ � Hðf ; y1; y2Þ.
Using Shearer’s inequality [3], the lower bound of Iðf ; YÞ can be obtained as
Iðf ; YÞP 12ðIðf ; y1Þ þ Iðf ; y2Þ � Iðy1; y2ÞÞ ð5Þ
The lower bound increases with the dependency between f and each label. Using Eq. (5), the dependency between f and Ycan be approximated as
eIðf ; YÞ ¼Xy2Y
Iðf ; yÞ �X
y;y02Y
Iðy; y0Þ ð6Þ
where y0 is a label in Y, but y0 – y. To deal with the next rank feature fþ, Eq. (7) can be expanded.
eIðf ; fþ; YÞ ¼Xy2Y
Iðf ; fþ; yÞ �X
y;y02Y
Iðy; y0Þ ð7Þ
After f with the highest eIðf ; YÞ is selected as the best feature, the feature fþ selected in the next step should maximize theinformation gain when included. Using Eqs. (6) and (7), we obtain the following estimate Qðfþ;YÞ:
Qðfþ;YÞ ¼Xy2Y
Iðf ; fþ; yÞ �Xy2Y
Iðf ; yÞ ð8Þ
Iðf ; fþ; yÞ in Eq. (8) is estimated as in Eqs. (5) and (6):
Iðf ; fþ; yÞ ¼ Iðy; f ; fþÞ � Iðf ; yÞ þ Iðfþ; yÞ � Iðf ; fþÞ ð9Þ

86 J. Lee, D.-W. Kim / Information Sciences 293 (2015) 80–96
Using Eqs. (8) and (9), we can formulate Qðfþ;YÞ as follows:
Qðfþ; YÞ ¼Xyj2Y
Iðfþ; yjÞ �Xf2Sc
Iðfþ; f Þ ð10Þ
If we already have a selected feature subset Sc , the goal of ADDðTðiÞÞ is to find a feature fþ that maximizes Qðfþ;YÞ during piterations.
Similarly, Qðf�;YÞ can be easily derived by finding f� that is similar to pre-selected features in Sc. Thus, DELðTðiÞ; ScÞ dis-cards f� that minimizes
Qðf�; YÞ ¼Xyj2Y
Iðf�; yjÞ �Xf2Sc
Iðf�; f Þ ð11Þ
It is worth noting that the local refinement method employed can be implemented efficiently using book-keeping tech-niques [21] because it only requires entropies of one variable, and joint entropies between two variables. If we calculate thevalues of entropies or mutual information between two variables, such as Iðfþ; yjÞ and Iðfþ; f Þ in the preprocessing step, thenADD and DEL can be processed using these pre-calculated values.
3.5. Time complexity
In this section, we demonstrate the theoretical computational cost of the proposed method. Let aðScÞ be the computationtime required to evaluate feature subset Sc , where jScj 6 n; Sc could contain maximum n of features in the worst case. Thevalue of aðScÞ can be influenced by the size of the training patterns and the number of given labels; however, it can beregarded as a constant value during a multi-label feature selection task because the size of the training patterns and thenumber of given labels do not change during the training process. As a consequence, the major factor of aðScÞ is the sizeof Sc . The evaluation of a single feature through the spending of an FFC is called a basic operation, and að1Þ for a basic oper-ation is referred to as the basic time. For a simpler analysis, we assumed that aðScÞ � jScj � r, where r represents the basictime. This linearity assumption holds for many multi-label classifiers such as a Multi-label Naive Bayes (MLNB) classifierbecause it predicts multi-labeled outputs by calculating the probabilistic mass function of each feature independently,and then multiplies them sequentially.
Based on these notations, we analyzed the computational complexity of the proposed method. During the initializationstep, the algorithm creates m of random solutions and evaluates them. Because each solution is allowed to contain a max-imum of n features, OðmnrÞ computations must be spent for the initialization step. In the process of local refinement, thenumber of features in a top elitist will be modified by adding p features or deleting q features; however, the number of fea-tures is still restricted to n after a local refinement. Because a local refinement is allowed to spend h FFCs, the local refine-ment process will consume OðhnrÞ computations. Similarly, the genetic search operators are also allowed to spend h FFCs; hoffspring can be created and evaluated during each generation. Therefore, the computational cost of the evolutionary stepaccording to each generation is Oð2hnrÞ. Finally, the number of allowed generations can be calculated according to v.Because 2h FFCs is spent during each generation, the maximum number of generations is approximately ðv �mÞ=2h. By mul-tiplying ðv �mÞ=2h with 2hnr, we obtain ðv �mÞnr. The computational cost of the proposed method is thereforeOðmnrþ ðv �mÞnrÞ ¼ OðvnrÞ. Because the r term is a constant basic time, this derivation indicates that the computationalcost of the proposed method is influenced by the maximum number of allowed FFCs, v, and the maximum number of allowedfeatures, n.
4. Experimental results
4.1. Experimental settings
We experimented on six datasets from different applications: a semantic scene analysis, bioinformatics, medical infor-matics, and text categorization. The image dataset Scene is concerned with the semantic indexing of still scenes [1]. Eachscene possibly contains multiple objects such as those found in urban environments and foliage. Therefore, such objectscan be used to comprise the multi-label of each image. The biological dataset Yeast is concerned with the gene function pre-diction of the Yeast Saccharomyces cerevisiae [11]. Gene functional classes were made from the hierarchies, which representa maximum of 190 gene functions; the top-four levels of the hierarchies were chosen to comprise the multi-label functions.Genbase dataset is related to predicting the functionality of proteins where the functionality can be assigned more than oneclass, which leads to a multi-label classification problem [7]. A Medical dataset was sampled from a large corpus of suicideletters, obtained after natural language processing for a clinical free text, and was used for the 2007 international challengeheld by the Computational Medicine Center. Remaining two datasets Slashdot and Enron are obtained from text categoriza-tion [14,37]. For example, a text may contain words of humor and admiration concurrently. Thus, the words and topics of atext can be naturally encoded into a multi-label data. We discretized the Scene and Yeast datasets using an equal-widthinterval scheme to apply the feature selection methods [10]. To select the number of bins, we observed the performanceof proposed method by changing the number of bins to two, three, four, and five. Among them, the proposed method

Table 2Standard characteristics of Multi-label data sets.
Datasets Domain Patterns Features Labels
Size Type
Scene Image 2407 294 Continuous 6Yeast Biology 2417 103 Continuous 14Slashdot Text 3782 1079 Binary 22Genbase Biology 662 1185 Binary 27Medical Text 978 1494 Binary 45Enron Text 1702 1001 Binary 53
J. Lee, D.-W. Kim / Information Sciences 293 (2015) 80–96 87
commonly gives better classification performance for Scene and Yeast datasets when the number of bins is set to three. As aresult, we mapped each numerical feature into a categorical feature with three bins for our experiments. Table 2 shows thedomains and standard statistics of the datasets used in our experiments.
To verify the potential of the proposed method, we compared the proposed method with conventional multi-label featureselection methods: Avg. CHI [33], LP + RF [26], ELA + CHI [2] (we represent these methods as problem transformation + scorefunction, for example, the score CHI indicates v2 statistics, and RF represents ReliefF [24]), RFS [20], gMLC [15], GA [34], Esti-mation of Distribution Algorithm (EDA) [25], and Particle Swarm Optimization (PSO) [31]. Brief description of each method isgiven below. Note that Avg. CHI, LP + RF, ELA + CHI, RFS, and gMLC select feature subset by choosing top-ranked n featuresaccording to importance of each feature. In contrast, the GA, EDA, PSO and the proposed method give selected feature subsetaccording to the best solution of population at the termination.
Avg. CHI assesses importance of each feature by calculating v2 statistics value between a feature and each label. Then theimportance of each feature was obtained by averaging v2 statistics values. LP + RF firstly transforms the multi-label into a single-label by using Label Powerset method [29]. Then original feature
set and transformed label are given to RF for obtaining importance of features. ELA + CHI also transforms multi-label into single-label by using Entropy-based Label Assignment method, and then v2
statistics is applied. RFS formulates the multi-label feature selection problem as objective function of minimizing l2;1-norms. After optimiza-
tion is terminated, the values of importance for input features are assigned. gMLC optimizes the Hilbert–Schmidt independence score of selected feature subset. Similar to RFS, the values of impor-
tance for each feature are assigned after optimization process. GA creates m initial solutions randomly based on the binary representation for feature selection problem. To obtain the
fitness, each solution in initial population PðtÞ where t = 0 for the initialization step, is evaluated using employed multi-label classifier. Next, GA creates offspring set NðtÞ by using crossover and mutation operators. To apply the crossoveroperator, two solutions in PðtÞ are randomly selected and mated. After that, one solution in PðtÞ is randomly selectedand mutated. In this paper, we employed restrictive crossover and restrictive mutation operators with both crossoverand mutation rate are set to 1.0. Therefore, for each iteration, GA creates three new solutions to compose NðtÞ. Each newlycreated solution is evaluated using the multi-label classifier. To create Pðt þ 1Þ;NðtÞ is added to PðtÞ, and m solutions withhigher fitness values are selected. This procedure is repeated until the GA spends all of its allowed FFCs. EDA creates m initial solutions randomly as the same as GA. Each solution in PðtÞ is evaluated using employed multi-label
classifier. Next, EDA selects NðtÞ by choosing half of good solutions in PðtÞ based upon their fitness values. Based on NðtÞ,EDA creates proto-type where it represents the likelihood of selection of each feature. Based on the proto-type, EDA cre-ates m solutions. These newly created m solutions form Pðt þ 1Þ. This procedure is repeated until the EDA spends all of itsallowed FFCs. PSO creates m initial solutions randomly as the same as GA. Each solution in PðtÞ is evaluated using employed multi-label
classifier. Next, PSO preserves the best solution of PðtÞ called global best solution. In addition, the best solution which eachchromosome experienced is also preserved; this is called individual best solution, whereby there are m individual bestsolutions. Next, PSO updates the representation of each chromosome based on the global best solution and its own indi-vidual best solution using velocity. After all chromosomes in PðtÞ are modified, they are evaluated using the multi-labelclassifier. Then they form Pðt þ 1Þ. This procedure is repeated until the PSO spends all of its allowed FFCs.
Comparison results will be demonstrated as follows. Firstly, we compare the proposed method with three population-based methods (GA, PSO, and EDA). Secondly, different memetic strategies by employing v2 statistics and MI, named asMA(CHI) and MA(MI), are compared to the proposed method; MA(CHI) and MA(MI) are implemented by replacing the scorefunction of local refinement process to v2 statistics and MI respectively. Lastly, we compare the proposed method with con-ventional feature selection methods.
For the GA, EDA, PSO, and the proposed method, we set the size of population to 50, and the maximum number of allowedfitness function calls was set to 100. Accordingly, m and v for the proposed method were set to m ¼ 50 and v ¼ 100. More-over, following the concept of the SSGA, the crossover creates two offspring using two randomly selected ancestors, whereas

Table 3Comparison results of the GA, EDA, PSO, and the proposed method in terms of Hamming loss.
Data sets Scene Yeast Slashdot Genbase Medical Enron
GA 0.1493 0.2203 0.0513 0.0343 0.0221 0.0604EDA 0.1492 0.2196 0.0512 0.0341 0.0206 0.0598PSO 0.1501 0.2210 0.0516 0.0360 0.0217 0.0605
Proposed� 0.1429 0.2150 0.0434 0.0044 0.0021 0.0583
Table 4Comparison results of the GA, EDA, PSO and the proposed method in terms of Multi-label accuracy.
Data sets Scene Yeast Slashdot Genbase Medical Enron
GA 0.5255 0.4730 0.0717 0.2985 0.2687 0.3301EDA 0.5208 0.4739 0.0787 0.3085 0.2863 0.3304PSO 0.5185 0.4733 0.0689 0.2390 0.2538 0.3200
Proposed� 0.5303 0.4816 0.3657 0.9564 0.9302 0.3782
88 J. Lee, D.-W. Kim / Information Sciences 293 (2015) 80–96
the mutation creates one offspring from one ancestor; the size of NðtÞ was set to h ¼ 3. Although larger values of m;v , and hwill allow the proposed method to perform more intensive search for finding better feature subset, however, we observedthat the proposed method following this parameter setting found good feature subset among experiments with differentparameter settings of proposed method. The maximum number of allowed features was set to 50.
For fairness, we conducted a hold-out cross-validation for each experiment; 80% of the patterns in a given dataset wererandomly chosen as training set for the multi-label feature selection process, and the remaining 20% of the patterns wereused as test set to obtain the multi-label classification performance to be reported. Each experiment was repeated 50 times,and the average value was taken to represent the classification performance according to each feature selection method. Weused Multi-Label Naive Bayes (MLNB) classifier for multi-label classification [34]. The MLNB classifier creates classificationmodels for each label of training dataset. Then these models are used to predict the likelihood of each label for given testpattern. If the value of likelihood is larger than 0.5, the test pattern will be assigned to corresponding label. This processwas repeated until all labels are tested. We used MLNB for obtaining the prediction results of test set according to all themulti-label feature selection methods employed in our experiments. Finally, we employed three evaluation measures to con-sider the quality of the predicted labels: the Hamming loss, Multi-label accuracy, and Subset accuracy [1,18,37]. LetP ¼ fðPi; kiÞj1 6 i 6 pg be a given test set where ki # Y is a correct label subset, and Yi # Y be a predicted label set correspondsto Pi. Then the Hamming loss is defined to be
Table 5Compar
Data
GAEDAPSO
Prop
Table 6Compar
Data
GAEDAPSO
Prop
hlossðPÞ ¼ 1p
Xp
i¼1
1tjkiMYij
where M denotes the symmetric difference between two sets. The Multi-label accuracy is defined to be
ison results of the GA, EDA, PSO and the proposed method in terms of Subset accuracy.
sets Scene Yeast Slashdot Genbase Medical Enron
0.3631 0.1260 0.0618 0.2821 0.2071 0.10420.3644 0.1295 0.0693 0.3033 0.2468 0.10490.3489 0.1272 0.0599 0.2371 0.1894 0.0952
osed� 0.3797 0.1373 0.3189 0.9226 0.9200 0.1091
ison results of the average time for the GA, EDA, PSO, and the proposed method (in Seconds).
sets Scene Yeast Slashdot Genbase Medical Enron
97.8 232.1 288.8 206.5 440.5 531.766.5 158.5 273.8 194.5 401.8 532.198.3 239.8 394.9 273.4 576.7 766.3
osed 109.9 230.2 382.0 259.7 515.0 470.2

10 20 30 40 50 60 70 80 90 1000.135
0.14
0.145
0.15
0.155
0.16
0.165
0.17
0.175
Number of spent fitness function calls
Ham
min
g lo
ssScene dataset
GAProposed
(a) Scene data set
10 20 30 40 50 60 70 80 90 1000.21
0.215
0.22
0.225
0.23
0.235
Number of spent fitness function calls
Ham
min
g lo
ss
Yeast dataset
GAProposed
(b) Yeast data set
10 20 30 40 50 60 70 80 90 1000
0.01
0.02
0.03
0.04
0.05
Number of spent fitness function calls
Ham
min
g lo
ss
Genbase dataset
GAProposed
(c) Genbase data set
10 20 30 40 50 60 70 80 90 100
0.042
0.044
0.046
0.048
0.05
0.052
0.054
Number of spent fitness function calls
Ham
min
g lo
ss
Slashdot dataset
GAProposed
(d) Slashdot data set
10 20 30 40 50 60 70 80 90 1000
0.005
0.01
0.015
0.02
0.025
0.03
Number of spent fitness function calls
Ham
min
g lo
ss
Medical dataset
GAProposed
(e) Medical data set
10 20 30 40 50 60 70 80 90 1000.056
0.058
0.06
0.062
0.064
0.066
0.068
0.07
Number of spent fitness function calls
Ham
min
g lo
ss
Enron dataset
GAProposed
(f) Enron data set
Fig. 2. Comparison results of the convergence between the GA and the proposed method in terms of Hamming loss (a lower value indicates a goodclassification performance).
J. Lee, D.-W. Kim / Information Sciences 293 (2015) 80–96 89
mlaccðPÞ ¼ 1p
Xp
i¼1
jki \ Yijjki [ Yij
� �
Lastly, the Subset accuracy is defined to be
50 100 150 200 250 300 350 400 450 500750
800
850
900
950
1000
1050
1100
1150Scene data set
Div
ersi
ty
Number of spent fitness function calls
GAProposed
(a) Scene data set
50 100 150 200 250 300 350 400 450 500500
600
700
800
900
1000Yeast data set
Div
ersi
ty
Number of spent fitness function calls
GAProposed
(b) Yeast data set
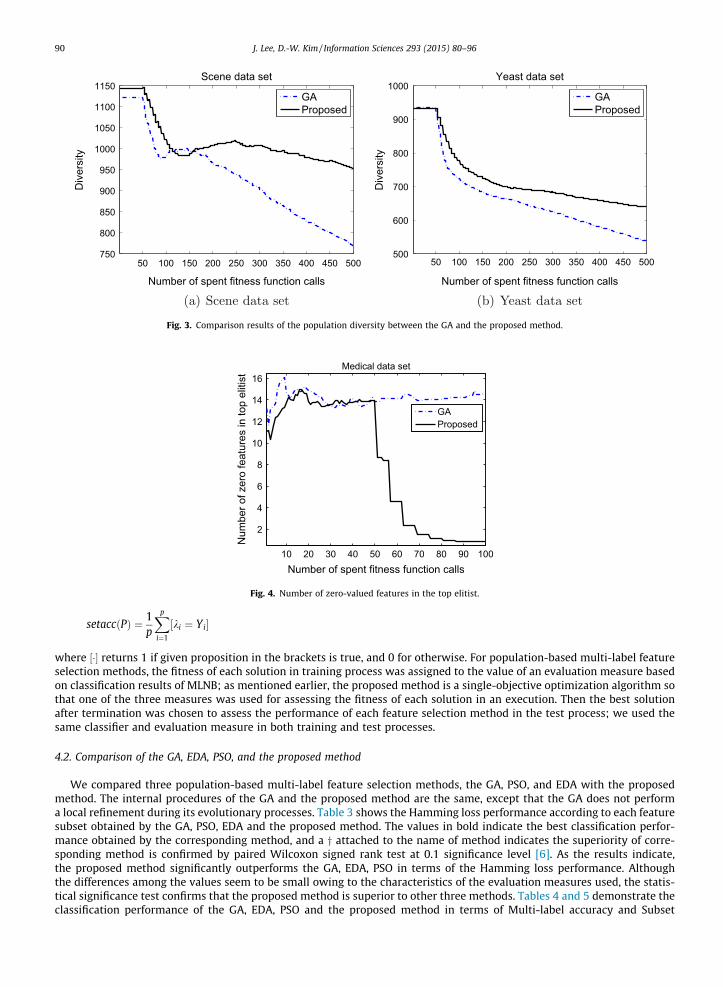
Fig. 3. Comparison results of the population diversity between the GA and the proposed method.
10 20 30 40 50 60 70 80 90 100
2
4
6
8
10
12
14
16
Number of spent fitness function calls
Num
ber o
f zer
o fe
atur
es in
top
eliti
st
Medical data set
GAProposed
Fig. 4. Number of zero-valued features in the top elitist.
90 J. Lee, D.-W. Kim / Information Sciences 293 (2015) 80–96
setaccðPÞ ¼ 1p
Xp
i¼1
½ki ¼ Yi
where ½� returns 1 if given proposition in the brackets is true, and 0 for otherwise. For population-based multi-label featureselection methods, the fitness of each solution in training process was assigned to the value of an evaluation measure basedon classification results of MLNB; as mentioned earlier, the proposed method is a single-objective optimization algorithm sothat one of the three measures was used for assessing the fitness of each solution in an execution. Then the best solutionafter termination was chosen to assess the performance of each feature selection method in the test process; we used thesame classifier and evaluation measure in both training and test processes.
4.2. Comparison of the GA, EDA, PSO, and the proposed method
We compared three population-based multi-label feature selection methods, the GA, PSO, and EDA with the proposedmethod. The internal procedures of the GA and the proposed method are the same, except that the GA does not performa local refinement during its evolutionary processes. Table 3 shows the Hamming loss performance according to each featuresubset obtained by the GA, PSO, EDA and the proposed method. The values in bold indicate the best classification perfor-mance obtained by the corresponding method, and a y attached to the name of method indicates the superiority of corre-sponding method is confirmed by paired Wilcoxon signed rank test at 0.1 significance level [6]. As the results indicate,the proposed method significantly outperforms the GA, EDA, PSO in terms of the Hamming loss performance. Althoughthe differences among the values seem to be small owing to the characteristics of the evaluation measures used, the statis-tical significance test confirms that the proposed method is superior to other three methods. Tables 4 and 5 demonstrate theclassification performance of the GA, EDA, PSO and the proposed method in terms of Multi-label accuracy and Subset

10 20 30 40 50 60 70 80 90 1000.135
0.14
0.145
0.15
0.155
0.16
0.165
0.17
0.175
Number of spent fitness function calls
Ham
min
g lo
ssScene dataset
MA(CHI)MA(MI)Proposed
(a) Scene data set
10 20 30 40 50 60 70 80 90 1000.21
0.215
0.22
0.225
0.23
0.235
Number of spent fitness function calls
Ham
min
g lo
ss
Yeast dataset
MA(CHI)MA(MI)Proposed
(b) Yeast data set
10 20 30 40 50 60 70 80 90 100
0.042
0.044
0.046
0.048
0.05
0.052
0.054
Number of spent fitness function calls
Ham
min
g lo
ss
Slashdot dataset
MA(CHI)MA(MI)Proposed
(c) Slashdot data set
10 20 30 40 50 60 70 80 90 1000
0.01
0.02
0.03
0.04
0.05
Number of spent fitness function calls
Ham
min
g lo
ss
Genbase dataset
MA(CHI)MA(MI)Proposed
(d) Genbase data set
10 20 30 40 50 60 70 80 90 1000
0.005
0.01
0.015
0.02
0.025
0.03
Number of spent fitness function calls
Ham
min
g lo
ss
Medical dataset
MA(CHI)MA(MI)Proposed
(e) Medical data set
10 20 30 40 50 60 70 80 90 1000.056
0.058
0.06
0.062
0.064
0.066
0.068
0.07
Number of spent fitness function calls
Ham
min
g lo
ss
Enron dataset
MA(CHI)MA(MI)Proposed
(f) Enron data set
Fig. 5. Comparison results of convergence between MA(CHI), MA(MI), and the proposed method in terms of Hamming loss.
J. Lee, D.-W. Kim / Information Sciences 293 (2015) 80–96 91
accuracy, respectively. Similar to the Hamming loss experiments, the proposed method outperforms the GA, EDA, and PSO interms of Multi-label accuracy and Subset accuracy respectively. Table 6 shows the average execution time of each method.Experimental results indicate that the proposed method expends similar average execution time with other three multi-labelfeature selection methods.

MA(CHI) MA(MI) Proposed0
5
10
15
20x 10−3 Scene dataset
Impr
ovem
ents
of H
amm
ing
loss
(a) Scene data setMA(CHI) MA(MI) Proposed
0
5
10
15
20x 10−3 Yeast dataset
Impr
ovem
ents
of H
amm
ing
loss
(b) Yeast data set
MA(CHI) MA(MI) Proposed
1
2
3
4
5
6
7
8
9x 10⁻³ Slashdot dataset
Impr
ovem
ents
of H
amm
ing
loss
(c) Slashdot data set
MA(CHI) MA(MI) Proposed0
0.005
0.01
0.015
0.02
0.025
0.03
0.035Genbase dataset
Impr
ovem
ents
of H
amm
ing
loss
(d) Genbase data set
MA(CHI) MA(MI) Proposed0
0.005
0.01
0.015
0.02
Medical dataset
Impr
ovem
ents
of H
amm
ing
loss
(e) Medical data setMA(CHI) MA(MI) Proposed
0
0.5
1
1.5
2
2.5
3
3.5
4x 10⁻³ Enron dataset
Impr
ovem
ents
of H
amm
ing
loss
(f) Enron data set
Fig. 6. Comparison results showing the improvement of Hamming loss between MA(CHI), MA(MI), and the proposed method.
92 J. Lee, D.-W. Kim / Information Sciences 293 (2015) 80–96
Fig. 2 shows the convergence behaviors of the GA and the proposed method according to the number of spent FFCs (u) interms of the Hamming loss performance; the horizontal axis represents the number of spent FFCs, and the vertical axis indi-cates the Hamming loss performance. Because the convergence behaviors may differ according to each experiment owing tothe stochastic nature of the population-based search methods, we averaged the Hamming loss performance of the top elitistin PðuÞ after conducting the experiment 50 times. The experimental results of the EDA and the PSO were excluded for claritybecause the convergence behaviors of the GA, EDA and PSO were similar to each other. We can see from Fig. 2 that the Ham-ming loss performance monotonically improves as u increases. Because the initialization steps consume 50 FFCs, and the twomethods employ a random creation process to obtain an initial population, both methods gradually improve the Hammingloss performance initially. However, the experimental results indicate that the Hamming loss value of the proposed method
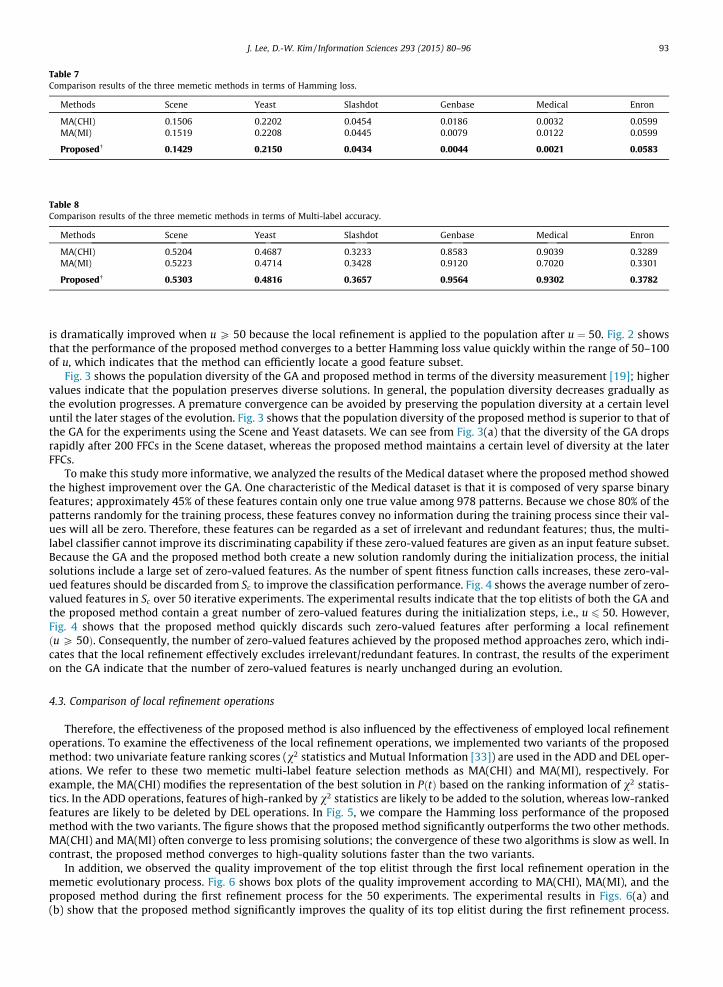
Table 7Comparison results of the three memetic methods in terms of Hamming loss.
Methods Scene Yeast Slashdot Genbase Medical Enron
MA(CHI) 0.1506 0.2202 0.0454 0.0186 0.0032 0.0599MA(MI) 0.1519 0.2208 0.0445 0.0079 0.0122 0.0599
Proposed� 0.1429 0.2150 0.0434 0.0044 0.0021 0.0583
Table 8Comparison results of the three memetic methods in terms of Multi-label accuracy.
Methods Scene Yeast Slashdot Genbase Medical Enron
MA(CHI) 0.5204 0.4687 0.3233 0.8583 0.9039 0.3289MA(MI) 0.5223 0.4714 0.3428 0.9120 0.7020 0.3301
Proposed� 0.5303 0.4816 0.3657 0.9564 0.9302 0.3782
J. Lee, D.-W. Kim / Information Sciences 293 (2015) 80–96 93
is dramatically improved when u P 50 because the local refinement is applied to the population after u ¼ 50. Fig. 2 showsthat the performance of the proposed method converges to a better Hamming loss value quickly within the range of 50–100of u, which indicates that the method can efficiently locate a good feature subset.
Fig. 3 shows the population diversity of the GA and proposed method in terms of the diversity measurement [19]; highervalues indicate that the population preserves diverse solutions. In general, the population diversity decreases gradually asthe evolution progresses. A premature convergence can be avoided by preserving the population diversity at a certain leveluntil the later stages of the evolution. Fig. 3 shows that the population diversity of the proposed method is superior to that ofthe GA for the experiments using the Scene and Yeast datasets. We can see from Fig. 3(a) that the diversity of the GA dropsrapidly after 200 FFCs in the Scene dataset, whereas the proposed method maintains a certain level of diversity at the laterFFCs.
To make this study more informative, we analyzed the results of the Medical dataset where the proposed method showedthe highest improvement over the GA. One characteristic of the Medical dataset is that it is composed of very sparse binaryfeatures; approximately 45% of these features contain only one true value among 978 patterns. Because we chose 80% of thepatterns randomly for the training process, these features convey no information during the training process since their val-ues will all be zero. Therefore, these features can be regarded as a set of irrelevant and redundant features; thus, the multi-label classifier cannot improve its discriminating capability if these zero-valued features are given as an input feature subset.Because the GA and the proposed method both create a new solution randomly during the initialization process, the initialsolutions include a large set of zero-valued features. As the number of spent fitness function calls increases, these zero-val-ued features should be discarded from Sc to improve the classification performance. Fig. 4 shows the average number of zero-valued features in Sc over 50 iterative experiments. The experimental results indicate that the top elitists of both the GA andthe proposed method contain a great number of zero-valued features during the initialization steps, i.e., u 6 50. However,Fig. 4 shows that the proposed method quickly discards such zero-valued features after performing a local refinementðu P 50Þ. Consequently, the number of zero-valued features achieved by the proposed method approaches zero, which indi-cates that the local refinement effectively excludes irrelevant/redundant features. In contrast, the results of the experimenton the GA indicate that the number of zero-valued features is nearly unchanged during an evolution.
4.3. Comparison of local refinement operations
Therefore, the effectiveness of the proposed method is also influenced by the effectiveness of employed local refinementoperations. To examine the effectiveness of the local refinement operations, we implemented two variants of the proposedmethod: two univariate feature ranking scores (v2 statistics and Mutual Information [33]) are used in the ADD and DEL oper-ations. We refer to these two memetic multi-label feature selection methods as MA(CHI) and MA(MI), respectively. Forexample, the MA(CHI) modifies the representation of the best solution in PðtÞ based on the ranking information of v2 statis-tics. In the ADD operations, features of high-ranked by v2 statistics are likely to be added to the solution, whereas low-rankedfeatures are likely to be deleted by DEL operations. In Fig. 5, we compare the Hamming loss performance of the proposedmethod with the two variants. The figure shows that the proposed method significantly outperforms the two other methods.MA(CHI) and MA(MI) often converge to less promising solutions; the convergence of these two algorithms is slow as well. Incontrast, the proposed method converges to high-quality solutions faster than the two variants.
In addition, we observed the quality improvement of the top elitist through the first local refinement operation in thememetic evolutionary process. Fig. 6 shows box plots of the quality improvement according to MA(CHI), MA(MI), and theproposed method during the first refinement process for the 50 experiments. The experimental results in Figs. 6(a) and(b) show that the proposed method significantly improves the quality of its top elitist during the first refinement process.

Table 9Comparison results of the six conventional methods and the proposed method in terms of Hamming loss.
Methods Scene Yeast Slashdot Genbase Medical Enron
Avg. CHI 0.1742 0.2259 0.0447 0.0062 0.0024 0.0601LP + RF 0.1801 0.2252 0.0501 0.0057 0.0076 0.0565ELA + CHI 0.1742 0.2232 0.0449 0.0228 0.0238 0.0597RFS 0.1600 0.2267 0.0537 0.0425 0.0281 0.0602gMLC 0.1773 0.2208 0.0440 0.0071 0.0133 0.0559GA 0.1493 0.2203 0.0513 0.0343 0.0221 0.0604
Proposed� 0.1429 0.2150 0.0434 0.0044 0.0021 0.0583
Table 10Comparison results of six conventional methods and the proposed method in terms of Multi-label accuracy.
Methods Scene Yeast Slashdot Genbase Medical Enron
Avg. CHI 0.3910 0.4673 0.3300 0.9312 0.9272 0.2888LP + RF 0.4765 0.4773 0.2237 0.9402 0.8242 0.3480ELA + CHI 0.3825 0.4689 0.3299 0.5761 0.1509 0.2909RFS 0.5065 0.4490 0.0297 0.1595 0.0274 0.2758gMLC 0.3596 0.4684 0.3385 0.9249 0.6346 0.3397GA 0.5255 0.4730 0.0717 0.2985 0.2687 0.3301
Proposed� 0.5303 0.4816 0.3657 0.9564 0.9302 0.3782
Table 11Comparison results of six conventional methods and the proposed method in terms of Subset accuracy.
Methods Scene Yeast Slashdot Genbase Medical Enron
Avg. CHI 0.1297 0.1251 0.2852 0.8706 0.9036 0.0490LP + RF 0.2530 0.1276 0.1965 0.9044 0.7401 0.0908ELA + CHI 0.1272 0.1253 0.2860 0.5333 0.1412 0.0643RFS 0.3261 0.1087 0.0239 0.1367 0.0173 0.0795gMLC 0.1022 0.1246 0.2917 0.8594 0.4838 0.1017GA 0.3631 0.1260 0.0618 0.2821 0.2071 0.1042
Proposed� 0.3797 0.1373 0.3189 0.9226 0.9200 0.1091
Table 12Comparison results of the number of features selected by all the multi-label feature selection methods when Hamming loss is used.
Data sets Scene Yeast Slashdot Genbase Medical Enron
Avg. CHI 1 4 47 48 36 1LP + RF 3 23 45 47 37 8ELA + CHI 1 5 48 38 8 4RFS 23 9 14 34 36 4gMLC 1 5 49 43 9 4GA 22 16 35 37 31 3EDA 23 18 37 36 35 3PSO 21 18 37 33 34 3MA(CHI) 19 16 40 33 34 2MA(MI) 23 16 37 40 33 2
Proposed 24 16 42 36 28 3
94 J. Lee, D.-W. Kim / Information Sciences 293 (2015) 80–96
On the contrary, MA(CHI) and MA(MI) barely improve the quality of their top elitists, where the improvements in Hammingloss are zero for most of the experiments. Therefore, MA(CHI) and MA(MI) should expend more FFCs than the proposedmethod in finding an effective feature subset. Tables 7 and 8 show the multi-label classification performance in terms ofHamming loss and Multi-label accuracy when allowed FFCs are spent. We can see that the choice of local refinement signif-
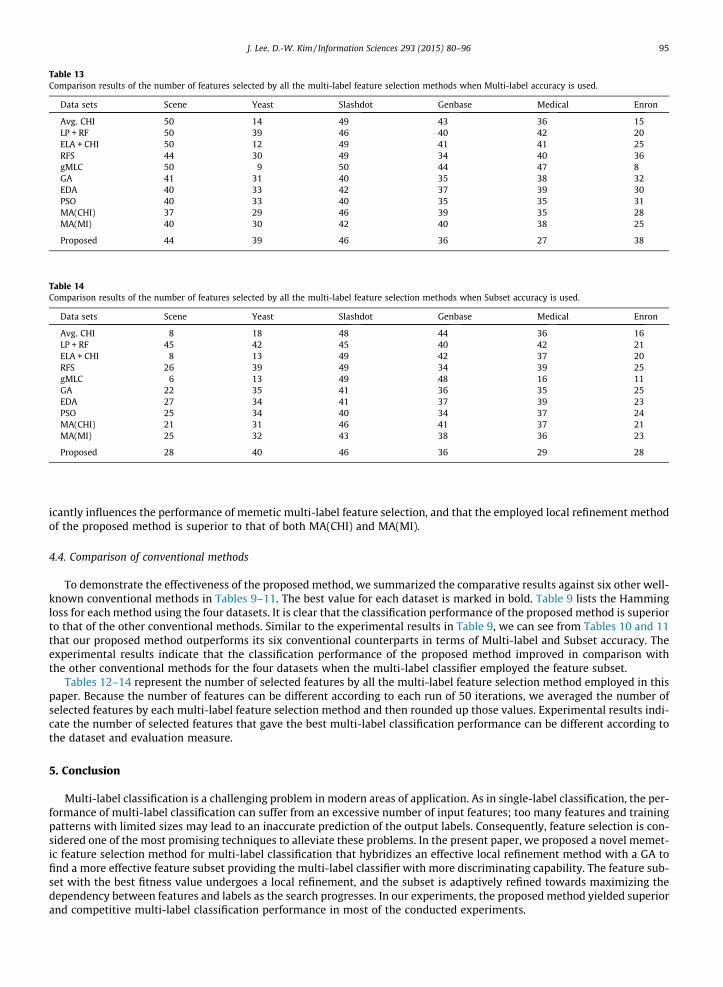
Table 13Comparison results of the number of features selected by all the multi-label feature selection methods when Multi-label accuracy is used.
Data sets Scene Yeast Slashdot Genbase Medical Enron
Avg. CHI 50 14 49 43 36 15LP + RF 50 39 46 40 42 20ELA + CHI 50 12 49 41 41 25RFS 44 30 49 34 40 36gMLC 50 9 50 44 47 8GA 41 31 40 35 38 32EDA 40 33 42 37 39 30PSO 40 33 40 35 35 31MA(CHI) 37 29 46 39 35 28MA(MI) 40 30 42 40 38 25
Proposed 44 39 46 36 27 38
Table 14Comparison results of the number of features selected by all the multi-label feature selection methods when Subset accuracy is used.
Data sets Scene Yeast Slashdot Genbase Medical Enron
Avg. CHI 8 18 48 44 36 16LP + RF 45 42 45 40 42 21ELA + CHI 8 13 49 42 37 20RFS 26 39 49 34 39 25gMLC 6 13 49 48 16 11GA 22 35 41 36 35 25EDA 27 34 41 37 39 23PSO 25 34 40 34 37 24MA(CHI) 21 31 46 41 37 21MA(MI) 25 32 43 38 36 23
Proposed 28 40 46 36 29 28
J. Lee, D.-W. Kim / Information Sciences 293 (2015) 80–96 95
icantly influences the performance of memetic multi-label feature selection, and that the employed local refinement methodof the proposed method is superior to that of both MA(CHI) and MA(MI).
4.4. Comparison of conventional methods
To demonstrate the effectiveness of the proposed method, we summarized the comparative results against six other well-known conventional methods in Tables 9–11. The best value for each dataset is marked in bold. Table 9 lists the Hammingloss for each method using the four datasets. It is clear that the classification performance of the proposed method is superiorto that of the other conventional methods. Similar to the experimental results in Table 9, we can see from Tables 10 and 11that our proposed method outperforms its six conventional counterparts in terms of Multi-label and Subset accuracy. Theexperimental results indicate that the classification performance of the proposed method improved in comparison withthe other conventional methods for the four datasets when the multi-label classifier employed the feature subset.
Tables 12–14 represent the number of selected features by all the multi-label feature selection method employed in thispaper. Because the number of features can be different according to each run of 50 iterations, we averaged the number ofselected features by each multi-label feature selection method and then rounded up those values. Experimental results indi-cate the number of selected features that gave the best multi-label classification performance can be different according tothe dataset and evaluation measure.
5. Conclusion
Multi-label classification is a challenging problem in modern areas of application. As in single-label classification, the per-formance of multi-label classification can suffer from an excessive number of input features; too many features and trainingpatterns with limited sizes may lead to an inaccurate prediction of the output labels. Consequently, feature selection is con-sidered one of the most promising techniques to alleviate these problems. In the present paper, we proposed a novel memet-ic feature selection method for multi-label classification that hybridizes an effective local refinement method with a GA tofind a more effective feature subset providing the multi-label classifier with more discriminating capability. The feature sub-set with the best fitness value undergoes a local refinement, and the subset is adaptively refined towards maximizing thedependency between features and labels as the search progresses. In our experiments, the proposed method yielded superiorand competitive multi-label classification performance in most of the conducted experiments.

96 J. Lee, D.-W. Kim / Information Sciences 293 (2015) 80–96
Acknowledgment
This research was supported by Basic Science Research Program through the National Research Foundation of Korea (NRF)funded by the Ministry of Education (2013R1A1A2A10005255).
References
[1] M. Boutell, J. Luo, X. Shen, C. Brown, Learning multi-label scene classification, Pattern Recognit. 37 (9) (2004) 1757–1771.[2] W. Chen, J. Yan, B. Zhang, Z. Chen, Q. Yang, Document transformation for multi-label feature selection in text categorization, in: Proc. 7th IEEE Int. Conf.
Data Mining, Omaha, USA, 2007, pp. 451–456.[3] F.R. Chung, R.L. Graham, P. Frankl, J.B. Shearer, Some intersection theorems for ordered sets and graphs, J. Comb. Theor. Ser. A 43 (1986) 23–37.[4] K. Dembczynski, W. Waegeman, W. Cheng, E. Hüllermeier, Regret analysis for performance metrics in multi-label classification: the case of hamming
and subset zero-one loss, Lect. Note Comput. Sci. 6321 (2010) 280–295.[5] K. Dembczynski, W. Waegeman, W. Cheng, E. Hüllermeier, On label dependence and loss minimization in multi-label classification, Mach. Learn. 88 (1-
2) (2012) 5–45.[6] J. Derrac, S. García, D. Molina, F. Herrera, A practical tutorial on the use of nonparametric statistical tests as a methodology for comparing evolutionary
and swarm intelligence algorithms, Swarm Evol. Comput. 1 (2011) 3–18.[7] S. Diplaris, G. Tsoumakas, P. Mitkas, I. Vlahavas, Protein classification with multiple algorithms, Adv. Inform. 3746 (2005) 448–456.[8] G. Doquire, M. Verleysen, Feature selection for multi-label classification problems, Lect. Note Comput. Sci. 6691 (2011) 9–16.[9] G. Doquire, M. Verleysen, Mutual information-based feature selection for multilabel classification, Neurocomputing 122 (2013) 148–155.
[10] J. Dougherty, R. Kohavi, M. Sahami, Supervised and unsupervised discretization of continuous features, in: Proc. 12th Int. Conf. Machine Learning,Tahoe City, USA, 1995, pp. 194–202.
[11] A. Elisseeff, J. Weston, A kernel method for multi-labelled classification, Adv. Neural Inf. Process. Syst. 14 (2001) 681–687.[12] Q. Gu, Z. Li, J. Han, Correlated multi-label feature selection, in: Proc. 20th ACM Int. Conf. Information and Knowledge Management, Glasgow, UK, 2011,
pp. 1087–1096.[13] S. Ji, J. Ye, Linear dimensionality reduction for multi-label classification, in: Proc. 21th Int. Joint Conf. Artificial Intelligence, Pasadena, USA, 2009, pp.
1077–1082.[14] B. Klimt, Y. Yang, The enron corpus: a new dataset for email classification research, Lect. Notes Comput. Sci. 3201 (2004) 217–226.[15] X. Kong, P. Yu, gMLC: a multi-label feature selection framework for graph classification, Knowl. Inf. Syst. 31 (2) (2012) 281–305.[16] J. Lee, D.W. Kim, Feature selection for multi-label classification using multivariate mutual information, Pattern Recogn. Lett. 34 (3) (2013) 349–357.[17] J. Lee, H. Lim, D.W. Kim, Approximating mutual information for multi-label feature selection, Electron. Lett. 48 (15) (2012) 929–930.[18] G. Madjarov, D. Kocev, D. Gjorgjevikj, S. Dzeroski, An extensive experimental comparison of methods for multi-label learning, Pattern Recogn. 45 (9)
(2012) 3084–3104.[19] R.W. Morrison, K.A. De Jong, Measurement of population diversity, Lect. Note Comput. Sci. 2310 (2002) 31–41.[20] F. Nie, H. Huang, X. Cai, C. Ding, Efficient and robust feature selection via joint l2;1-norms minimization, Adv. Neural Inf. Process. Syst. 23 (2010) 1813–
1821.[21] I. Oh, J. Lee, B. Moon, Hybrid genetic algorithms for feature selection, IEEE Trans. Pattern Anal. Mach. Intell. 26 (11) (2004) 1424–1437.[22] B. Qian, I. Davidson, Semi-supervised dimension reduction for multi-label classification, in: Proc. 24th AAAI Conf. Artificial Intelligence, Atlanta, USA,
2010, pp. 569–574.[23] J. Read, A pruned problem transformation method for multi-label classification, in: Proc. New Zealand Computer Science Research Student Conf.,
Christchurch, New Zealand, 2008, pp. 143–150.[24] M. Robnik-Šikonja, I. Kononenko, Theoretical and empirical analysis of ReliefF and RReliefF, Mach. Learn. 53 (1-2) (2003) 23–69.[25] Y. Saeys, S. Degroeve, D. Aeyels, Y. Van de Peer, P. Rouzé, Fast feature selection using a simple estimation of distribution algorithm: a case study on
splice site prediction, Bioinformatics 19 (2003) ii179–ii188.[26] N. Spolaôr, E.A. Cherman, M.C. Monard, H.D. Lee, A comparison of multi-label feature selection methods using the problem transformation approach,
Electron. Notes Theor. Comput. Sci. 292 (2013) 135–151.[27] Y. Sun, A. Wong, M. Kamel, Classification of imbalanced data: a review, Int. J. Pattern Recogn. Artif. Intell. 23 (4) (2009) 687.[28] L. Tenenboim, L. Rokach, B. Shapira, Multi-label classification by analyzing labels dependencies, in: Proc. 1st Int. Workshop Learning from Multi-label
Data, Bled, Slovenia, 2009, pp. 117–132.[29] K. Trohidis, G. Tsoumakas, G. Kalliris, I. Vlahavas, Multi-label classification of music into emotions, in: Proc. 9th Int. Society Music Information
Retrieval, Philadelphia, USA, 2008, pp. 325–330.[30] G. Tsoumakas, I. Katakis, I. Vlahavas, Random k-labelsets for multilabel classification, IEEE Trans. Knowl. Data Eng. 23 (7) (2011) 1079–1089.[31] A. Unler, A. Murat, R.B. Chinnam, mr2PSO: a maximum relevance minimum redundancy feature selection method based on swarm intelligence for
support vector machine classification, Inf. Sci. 181 (2011) 4625–4641.[32] D. Whitley, The GENITOR algorithm and selection pressure: why rank-based allocation of reproductive trials is best, in: Proc. 3rd Int. Conf. Genetic
Algorithms, pp. 116–121.[33] Y. Yang, J. Pedersen, A comparative study on feature selection in text categorization, in: Proc. 14th Int. Conf. Machine Learning, Nashville, USA, 1997,
pp. 412–420.[34] M. Zhang, J. Peña, V. Robles, Feature selection for multi-label naive Bayes classification, Inf. Sci. 179 (19) (2009) 3218–3229.[35] M. Zhang, K. Zhang, Multi-label learning by exploiting label dependency, in: Proc. 16th ACM SIGKDD Int. Conf. Knowledge Discovery and Data Mining,
Washington, USA, 2010, pp. 999–1008.[36] M. Zhang, Z. Zhou, ML-KNN: a lazy learning approach to multi-label learning, Pattern Recognit. 40 (7) (2007) 2038–2048.[37] M. Zhang, Z. Zhou, A review on multi-label learning algorithm, IEEE Trans. Knowl. Data Eng. 99 (2013), http://dx.doi.org/10.1109/TKDE.2013.39.[38] Z. Zhu, S. Jia, Z. Ji, Towards a memetic feature selection paradigm, IEEE Comput. Intell. Mag. 5 (2) (2010) 41–53.[39] Z. Zhu, Y. Ong, M. Dash, Wrapper–filter feature selection algorithm using a memetic framework, IEEE Trans. Syst. Man Cybern. Part B: Cybern. 37 (1)
(2007) 70–76.
Jaesung Lee takes Post-doctoral course at Chung-Ang University in Seoul, Korea, in the School of Computer Science and Engineering. He is currentlyinteresting in data mining with applications to biomedical informatics and affective computing. In theoretical domain, he also studies classification, featureselection, and especially multi-label learning with information theory.
Dae-Won Kim is currently an associated professor in the School of Computer Science and Engineering, Chung-Ang University in Seoul, Korea. Prior tocoming to Chung-Ang University, he did his postdoc, Ph.D., M.S. at KAIST, and the B.S. at Kyungpook National University, Korea. His research interestincludes advanced data mining algorithms with innovative applications to bioinformatics, music emotion recognition, educational data mining, affectivecomputing, and robot interaction.