mechanisms of carbon sequestration within the organic rich ...€¦ · mechanisms of carbon...
TRANSCRIPT

Mechanisms of Carbon
Sequestration within the Organic
Rich Miocene Monterey Formation
Rebecca L. Collett
Geology and Geophysics School of Earth & Environmental Sciences
The University of Adelaide, Australia
Supervisors: Martin Kennedy and David Chittleborough

P a g e | 2
Table of Contents
Table of Contents ............................................................................................................ 2
Table of Tables ................................................................................................................ 3
Table of Figures ............................................................................................................... 3
ABSTRACT ....................................................................................................................... 4
INTRODUCTION ............................................................................................................... 5
GEOLOGICAL SETTING ...................................................................................................... 9
ANALYTICAL METHODS .................................................................................................. 12
Organic Matter removal ................................................................................................. 12
Calcium exchange .......................................................................................................... 13
Ethylene Glycol Monoethyl Ether analysis ...................................................................... 13
Total carbon, inorganic carbon and organic carbon ......................................................... 15
Environmental Scanning Electron Microscope Imaging and Mapping ............................... 15
RESULTS ........................................................................................................................ 16
Mineral Surface Area vs. Total Organic Carbon ............................................................... 16
Mineral Surface Area ..................................................................................................... 18
Error Analysis................................................................................................................. 19
Environmental Scanning Electron Microscope Imaging .................................................... 20
DISCUSSION .................................................................................................................. 20
CONCLUSION ................................................................................................................. 27
ACKNOWLEDGMENTS .................................................................................................... 28
REFERENCES .................................................................................................................. 29
FIGURE CAPTIONS .......................................................................................................... 32
APPENDICES .................................................................................................................. 39

P a g e | 3
Table of Tables
Table 1: Lithologies identified in the studied section of the Monterey Formation at
Naples
Beach...................................................................................................................388
Table of Figures
Figure 1............................................................................................................................50
Figure 2............................................................................................................................51
Figure 3............................................................................................................................52
Figure 4............................................................................................................................53
Figure 5............................................................................................................................54
Figure 6............................................................................................................................55
Figure 7............................................................................................................................56
Figure 8............................................................................................................................57
Figure 9............................................................................................................................58
Figure 10..........................................................................................................................59
Figure 11..........................................................................................................................60
Figure 12..........................................................................................................................61
Figure 13..........................................................................................................................62

P a g e | 4
ABSTRACT
Carbon preservation in the geological past has been an important process for global climate
and the onset of glacial events. The majority of carbon preservation occurs in marine continental
margin settings that consist of fine grained sediments like the Monterey Formation, California, USA.
The mechanisms driving carbon preservation remain highly controversial and the Monterey
Formation has served as a prominent test case used to determine these mechanisms. Organic-
carbon rich deposits in this formation have been attributed to high organic productivity enhanced
fluxes of organic matter (OM) to the sea floor and/or enhanced OM preservation through anoxia. In
this study, the Monterey Formation was used as a natural experiment to focus on a new
mechanism of carbon preservation, in the form of mineral surface area (MSA) as a control on total
organic carbon (TOC). Mineral surface area was determined using the Ethylene Glycol Monoethyl
Ether free surface procedure and TOC was derived from high temperature combustion. The
relationship between the OM and the surface of the shale samples was viewed using an
environmental scanning electron microscope (ESEM) with micron resolution. The major findings
indicate a first-order relationship between MSA and TOC, where the mineral surface area
adsorption of organic carbon offers an alternative mechanism and control for carbon preservation.
This relation is held most strongly in bioturbated intervals as it is indicating oxygenated bottom
waters and lower biological productivity intervals which are indicated by carbonate microfossils.
Intervals with laminated siliceous sediment reflective of alternative oceanographic hypotheses
(linking high productivity and anoxia with organic enrichment) showed lower carbon preservation.
Ash beds derived from volcanic glass deposition in the water column showed high surface area
from post alteration to bentonite but had low TOC indicating that the association with TOC and
MSA occurred in the water column or early diagenetic environment. The MSA within the Monterey
Formation is controlled by the abundance of detrital smectitic clays initially formed in hydrologic
equilibrium within soils at the prevailing continental climate conditions. Organic matter enrichment
in these (marine) continental margin sediments, is thus a function of continental climate. Carbon
preservation in the Monterey Formation and similar black shales is not an oceanic mechanism as
widely believed, but rather derived through continental controls. An implication of this conclusion
is that climate influences detrital clay formation and carbon burial in marine sediments thereby
providing a feedback to climate cooling through CO₂ drawdown during high carbon burial events.
KEY WORDS: Monterey Formation, Black Shale, Carbon Preservation, Mineral Surface
Area (MSA), Total Organic Carbon (TOC), Smectite.
P a g e | 5
INTRODUCTION
Carbon preservation in the geological record is a fundamental control of global
temperature patterns, oxygen flux to the atmosphere and hydrocarbon source rocks.
Carbon burial in sediments is an essential biogeochemical process that acts to regulate
global temperature via the drawdown of carbon dioxide while releasing oxygen
through photosynthesis (Equation 1). Increases in carbon burial efficiency through
time can result in planetary cooling and glaciation (Vincent & Berger 1985), changes in
redox conditions in the marine environment (Jenkyns 1980) and widespread
deposition of hydrocarbon source rocks (Summerhayes 1981), which have even been
attributed to the rise of planetary oxygen leading to metazoan evolution (Kennedy et
al. 2006).
Equation 1: light + 6CO₂ + 12H₂0 C6H12O6 + 6O₂ + 6H₂0
Organic matter (OM) in soils and sediments is widely distributed over the Earth’s
surface occurring in almost all terrestrial and aquatic environments (Schnitzer 1978). In
sediments there are two basic forms of carbon that may be present, (1) inorganic and
(2) organic (Schumacher 2002). Naturally occurring organic carbon is derived from
reduction of CO2 by autotrophs and converted back to respiration CO2 heterotrophic
respiration associated with decomposition.
The mechanisms of organic carbon preservation in the geologic record remain
controversial with no clear consensus on the dominant mechanism of organic carbon
burial emerging. Intervals of globally widespread organic-rich sediment deposition are
episodic and imply substantial variations in the carbon cycle, as well as providing
targets for hydrocarbon exploration (Ulmishek & Klemme 1990). Research has focused

P a g e | 6
on better preservation efficiency of reduced carbon in anoxic conditions
(Summerhayes 1981), higher organic productivity (Pedersen & Calvert 1990), a greater
flux of organic material to sedimentary environments (Pedersen & Calvert 1990) and
preservation through rapid burial (Tyson 2001). However, these competing theories
have significant ramifications for models of the carbon cycle and the role of the ocean
processes regulating it. For example, intervals of high carbon productivity and flux to
sediment related to ocean circulation changes have been attributed to the onset of
glaciation (Vincent & Berger 1985).
Modern sediments are often used as analogues to study these mechanisms,
especially water column process and sediment traps situated on the sea floor. These
studies show that only a fraction of organic particles arriving on the seafloor survive
early diagenesis (<1m) and have a chance at entering the sedimentary record (Dickens
et al. 2006). A greater fraction of OM is shown to reach the sea floor in special
environments that have been used as analogs to explain geologic enrichments. These
include the Oman Margin (Lückge et al. 1996) and the Cariaco Basin in Central America
(Pedersen & Calvert 1990). However, these special and restricted environments may
not be representative of the mechanisms of organic enrichments seen in more
continuous open marine settings nor similar to the typical broad intracratonic basin
settings associated with most of the black shale typical of specific intervals of the
geologic past (e.g. Carboniferous and Miocene). Also, studies of modern carbon burial
that include diagenetic reactions in the first 20cm of the sediment indicate that the
organic carbon form is different to that found on the sea bed. Essentially, the only
carbon that survives transit through the first 20cm of sediment is physically associated

P a g e | 7
with mineral surfaces and not in a recognizable particulate form (Mayer 1994). For
these reasons, sediment trap and water column processes may be unrepresentative of
the critical processes influencing geologic enrichment. The exact mechanism of how
organic carbon is preserved by minerals remains unspecified, but mineral surface area
(MSA) may also be an important, though not commonly considered control in the
geologic past (Kennedy et al. 2002).
To evaluate the role of MSA, this thesis focuses on the Monterey Formation,
California, USA. The Monterey Formation is a classic black shale in the sense that it has
high total organic carbon (TOC) content, 6-12 %wt (Isaacs 2001), is regional in its
extent and is an economically important hydrocarbon source rock. The Monterey
Formation has also been used to explain the onset of northern hemisphere glaciations,
a popular hypothesis, evoking climate cooling induced by high productivity and carbon
dioxide draw down (Vincent & Berger 1985). The Monterey Formation has been
intensively studied as a model system of organic carbon burial, and from these studies
no single dominant control is evident (Isaacs 2001). Here, the effects of mineral surface
preservation are investigated for the first time to determine if, like in modern
sediments, this mechanism played an important role in the past accumulations of
organic carbon.
The following research investigates the hypothesis that, in a classic black shale
like the Monterey Formation, MSA controls organic carbon preservation. This
hypothesis will be tested by comparing measurements of TOC content and MSA on a
range of samples from the Monterey Formation and using scanning electron
microscopy to identify whether organic carbon exists as discrete particles or has a

P a g e | 8
mineral association at micron scales. The role of carbon preservation by MSA is poorly
known due to the sub-micron scale at which interactions are likely to occur. Thus, the
Quanta 450, an environmental scanning electron microscope (ESEM) will be used due
to its micron-scale resolution to image and map the distribution of carbon in the
Monterey Formation.
A mineral control of organic carbon burial has different implications for carbon
burial feedbacks on climate because minerals buried in marine sediments are actually
sourced from continental environments. Minerals with high surface area reflect
formation under continental hydrologic conditions, but are buried and preserved in
continental margin sediments (Hedges & Keil 1995). The Monterey Formation is an
example of this. If minerals are responsible for carbon burial, then they could
potentially provide a sensitive feedback to changing climate (Kennedy & Wagner
2011). A relation between MSA and TOC in the Monterey Formation would thus have
implications for distribution of source rocks that are now attributed to oceanic
processes including productivity or preservation. A feedback between climate and
carbon burial through detrital mineral surfaces could potentially provide an alternative
explanation of climate change at the start of the Cenozoic glaciation.
This paper demonstrates a dominant or first-order influence of MSA on carbon
burial that is then modified by other processes in the sediment or water column. This
relation has implications for climate change, shale formation, and the distribution of
carbon in marine sediments and the implications of other black shale deposits.
This study will test the hypothesis that there is a first-order influence of MSA in
carbon burial, following which the organo-mineral complexes are manifested in the
P a g e | 9
sedimentary column. The implications for climate change, shale formation, the
distribution of carbon in marine sediments and other black shale deposits are
explored.
GEOLOGICAL SETTING
The Monterey Formation is early to middle Miocene in age and occurs in California,
USA, along a present day active margin and consists of fine-grained sediments, which
are both source and reservoirs for major quantities of hydrocarbons both on and off-
shore California, USA. The Monterey Formation is California’s most important source
rock and is one of the most important in the United States of America (Bodnar 1990).
One of the most intensively studied sections of the Monterey Formation is the
section at Naples Beach, which occurs 25km west of Santa Barbara (Isaacs 2001) and is
part of the Santa Barbara basin as seen in Figure 1.
This section of the Monterey Formation is outstanding with regard to its quality
of outcrop, continuity and lithological diversity and freshness of weathering. It is
regarded as a classic type locality for the Monterey Formation (Hornafius 1994). In
many studies the Monterey Formation is considered to be the product of local
restricted basin development and the sedimentary processes that govern the present
Californian border-land basins (Ingle 1980; Blake 1981; Isaacs 1984; Graham &
Williams 1985; Lagoe 1987). However, more recent work reconstructing the margin
shows that in the Miocene the depositional environment was a low-gradient slope
(Isaacs 2001) and sediments of the Monterey Formation were deposited on an open

P a g e | 10
margin. The samples collected and used in in this study were taken from the Naples
Beach section, on the eastern side of the Dos Pueblos Creek.
The Monterey Formation, is commonly divided into three main facies: lower
calcareous facies, a middle transitional facies and a thick upper siliceous facies (Figure
2) (Isaacs et al. 1983). The middle facies is predominately phosphatic in composition
and the upper facies is composed of diatomaceous rocks and their diagenetic
equivalents (Isaacs et al. 1983). The widespread siliceous facies has been interpreted
to record rapidly deposited diatom ooze, indicating high plankton productivity and is
attributed to intensified upwelling in the late Miocene (Isaacs et al. 1983).
The ages of the formation range from 9.4-14.3 Ma with the TOC content of the
shales varying from 6-12.6 wt% (Follmi et al. 2005). As seen in Figure 2, the lower
calcareous facies is between 18.4-13.6 million years old, whereas the upper siliceous
facies is as young as 6.7 million years old.
The Monterey Formation overlies the lower Miocene Rincon Formation, which
consists of clayey mudstones containing dolomite concretions and siltstone (Hornafius
1994;Follmi et al. 2005). The Rincon Formation is capped by a thin layer of bentonite
as seen in Figure 2, which is the diagenetic product of a siliceous ash and defines the
contact between the Rincon Formation and the Monterey Formation. The Sisquoc
Formation is upper Miocene and lower Pliocene in age (Ingle 1981; Barron 1985). The
contact to the overlying Sisquoc Formation is marked by an erosive surface and
transition from diatomite to clayey siliceous mudstones (Follmi et al. 2005).
The mineralogical composition of the Monterey Formation at Naples Beach is
influenced by early digenetic processes that have especially led to the precipitation of

P a g e | 11
phosphate, which was formed at a very early stage of digenesis (Follmi et al. 2005).
Diagenesis of the Monterey Formation typically involved the widely recognized
sequence of silica phases, from an initial biogenic opal-A to diagenetic quartz (Isaacs et
al. 1983). Accompanying this sequence was a typical diagenetic succession of rocks:
diatomites and diatomaceous shales to opal-CT cherts, porcelanites, and mudrocks to
quartz cherts, porcelanites, and mudrocks (Isaacs et al. 1983). Diagenesis of carbonate
sediments in the Monterey Formation consists of six major processes: cementation,
microbial micritization, neomorphism, dissolution, compaction and dolomitization.
Thermal generation of hydrocarbons within more deeply buried portions of the
Monterey Formation has resulted in migration and oil staining, and bitumen
accumulation along fractures within the formation (Figure 3).
The Monterey Formation is an older Miocene stratigraphic unit. It shows
different patterns of thickness variation and facies arrangements that are not directly
related to present structural or topographic basin configurations. Subsidence and
volcanism indicated in this formation is a manifestation of early Miocene regional
crustal extension (Tennyson & Isaacs 2001). Through most of the ensuing Miocene (10
million years) a blanket of siliceous, phosphatic and/or calcareous, clastic-poor, organic
matter rich mudrock accumulated, burying the old fault-controlled topography
(Tennyson & Isaacs 2001). By the late Miocene (6 Ma) the region began to experience
compressive deformation that intensified into the Pliocene (Tennyson & Isaacs 2001).
Folds and reverse faults widespread throughout the area indicate that compressive
deformation within the Monterey Formation was significant (Tennyson & Isaacs 2001).

P a g e | 12
ANALYTICAL METHODS
The samples were collected by hand from clean coastal outcrops tied to Follmi’s
section (2005) within the different evident facies of the middle Monterey Formation.
They were then air-dried, ground and passed through a 2.0mm (10 miesh) sieve.
Analytical work carried out on the samples involved measurement of MSA using the
Ethylene Glycol Monoethyl Ether (EGME) free surface procedure. These samples then
underwent inorganic carbonate and organic carbon analysis by high temperature
combustion, as well as carbonate carbon analysis through the use of a manometer to
determine TOC.
Organic Matter removal
Analytical techniques for the removal of OM from samples follow those of
Schumacher (2002) and Jackson (1979). A fraction of the shale samples obtained from
the Naples Beach section of the Monterey Formation underwent OM removal through
the hydrogen peroxide digestion method (Mayer, 1994). The hydrogen peroxide
digestion method destroys the organic matter by oxidation. The method involves the
addition of concentrated hydrogen peroxide (30 wt %) to a sediment, where it is
continually added to the sample until frothing of the sample ceases, a sign that the
reaction is complete. Once the digestion process is completed the sample is dried at
105°C for a period of 24 hours.
The peroxide digestion method has several limitations in that it is only semi-
quantitative (Schumacher 2002) and the oxidation of OM is often incomplete
(Robinson 1927). This was not a significant problem in this study because removal of

P a g e | 13
OM was performed only to check for any effects on measured surface area and to
determine if OM itself had a measureable surface area.
Calcium exchange
Analytical techniques for the exchange of calcium on the cation exchange sites
follow those of Moore & Reynolds (1989). All samples from the Monterey Formation
underwent this process so that a known ion was on the exchange sites of the clays. The
samples were weighed (3g) and placed into a centrifuge tube, where 10-20ml of 1M
calcium chloride was added to the sample. The sample and added calcium chloride was
then shaken for five minutes to allow for the interaction of the entire sample with the
calcium chloride solution. The samples were then left for 24 hours to allow for the
sediment to settle out of suspension. The supernatant was then siphoned off.
The samples then underwent the same procedure but with deionised water, to
remove any excess calcium that was leftover on the sample’s exchange sites. This
procedure was repeated twice, with both processes allowing 24 hours for the
suspension to settle out of solution, and the supernatant was siphoned off. The
samples then underwent the same procedure as with the calcium chloride but with
ethanol, where there was only one repeat.
If the ethanol suspensions remained after 24 hours, the samples were centrifuged
for 3 minutes at 2400 reps. The samples were then oven dried at 105°C for 24 hours.
Ethylene Glycol Monoethyl Ether analysis
Analytical techniques for EGME analysis to obtain MSAs follow those of Eltantawy
& Arnold (1973), Churchman et al. (1991) and Tiller & Smith (1990), where the “Free
Surface” procedure was used. Ethylene Glycol Monoethyl Ether (3ml) was added to 1g

P a g e | 14
of oven dried sediment in a glass vial and a slurry was formed. The empty glass vial and
cap was initially weighed, and then weighed again with the ground shale sample to
allow for the calculations of MSA. A diamond tip pen was used to label the sample due
to the strength of the EGME.
The slurry was then allowed to stand for 30 minutes in a sealed vacuum chamber,
containing 200g of dried calcium chloride and 40ml of EGME in separate containers.
The vacuum was then evacuated for 30-60 minutes and the samples were stood under
vacuum until the end point was reached. This occurred when the samples were dry
and still in equilibrium with the free surface of EGME in the chamber whilst
maintaining a constant mass. This took 5-7 days as some samples dried out quicker
than others depending on the mineralogy of the sediment sample. When dry air was
emitted into the chamber, it was important to immediately seal the glass weigh bottles
with their lids to decrease the amount of water to compete with the EGME and to
attach to the clay surfaces within the samples. The MSA was calculated from the mass
of the retained EGME liquid under the assumption that a monomolecular layer was
adsorbed on the surface.
It was important to maintain a free surface of EGME as it tended to evaporate after
a couple of days. Also it was important to turn over the calcium chloride as the
efficiency of it as a sink for the EGME evaporated from the sediment slurry was
relatively quick and a hard impenetrable surface to the EGME formed. The analysis
from the MSA methods were used to determine the surface area present on the clays.

P a g e | 15
Total carbon, inorganic carbon and organic carbon
Analytical techniques for TOC analysis followed those of Soil Chemical Methods
Australia (Rayment & Lyons 2010), where the total carbon, which includes inorganic
carbonate and organic carbon analysis, was carried out at the University of Maine
(USA) by high temperature combustion using a Perkin-Elmer 2400B Elemental
Analyser. This procedure involved ignition of the sediments at high temperature in a
stream of oxygen followed by detection of CO2 liberated by an infrared detector.
The inorganic carbon (carbonate) analysis was undertaken at the University of
Adelaide (Australia) using a manometer, where 1g of a sample was added to 20ml of
4M hydrochloric acid in a sealed vessel. The change in volume associated with the
conversion of carbonate carbon to CO2 was used to define the amount of inorganic
carbon present in the samples after calibration with a pure carbonate standard.
TOC was determined by difference, i.e.
Total Carbon =Inorganic Carbon + Organic Carbon
Every tenth sample was duplicated, and one sample underwent the procedure
ten times to determine the error in the experiment.
Environmental Scanning Electron Microscope Imaging and Mapping
The Quanta-450 environmental electron microscope was used to take images
of the shale samples at the micron-scale, to map carbon over the surface of the
samples and to use point analysis to determine where the carbon occurred.
Four samples were chosen to provide a range in TOC values. Rock chips for
each of these samples were mounted and carbon coated to minimise scatter. The TOC
values ranged from 4-21%.

P a g e | 16
The Quanta-450 ESEM was used in the high vacuum mode with a spot size of 5.5
and a beam voltage of 20kv to allow for higher counts for carbon mapping. Both
secondary electron and back scatter detectors were used to obtain images, and a SDD
X-ray defector was used for the carbon mapping/point analysis. The secondary
electron images showed the topography of the samples due to secondary electrons
being low energy electrons (<50eV). Therefore, only the secondary electrons from first
few atomic layers escape. Topographic highs appear as bright spots and areas of
topographic lows appear as dark regions (Wade 2010), whereas the back scatter
images showed the contrasts due to atomic numbers. This is because backscattered
electrons are high energy electrons scattered from atoms (up to 50nm) below the
surface of the sample, where information is obtained from the Z contrast of the
sample (Z = atomic number) (Wade 2010). Regions containing atoms with high Z values
are viewed as bright regions, whereas dark regions are areas with atoms that have low
Z values (Wade, 2010).
RESULTS
Mineral Surface Area vs. Total Organic Carbon
Comparison of TOC with MSA (Figure 4a-b) shows a first-order linear relationship
(R²=0.53 and 0.85) across a range of TOC (non-carbonate diluted intervals) from 1-27%
validating the hypothesis. The study covered three lithofacies, which show a similar
loading ratio of OM to MSA. There is a first-order relationship (primary relationship)
and a second-order relationship present in the following data. The first-order
P a g e | 17
relationship is the primary control and occurs as a linear function of MSA, whereas the
second relationship results in divergence of data to the right of the linear array.
The samples were taken from different stratigraphic intervals. Samples from
from the base to 900 metres can be viewed in Figure 4a. Figure 4b shows samples in
the stratigraphic interval of 900-1150 metres, and Figure 4c shows samples in the
stratigraphic interval of 1150-1600 metres. The lower facies of the Monterey
Formation consists of phosphatic- and mudstone-rich sediments, where dolomite and
clay/shale lithologies are also present. The middle facies of the formation consist of
phosphatic- and porcelanite-rich lithologies and the upper facies of the formation is
composed of porcelanite lithologies.
The X axis (Figures 4, 5, 6, 7) is the MSA of the samples minus the carbonate
percent, which has been subtracted in order to remove the effects of dilution by
carbonate causing an auto correlation with TOC. The Y axis (Figures 4, 5, 6, 7) is the
TOC minus the carbonate percentage. The MSA and the TOC have been normalised to
the siliciclastic fraction so that the overall result would not be affected and driven by
the carbonate variation (2-50%).
Mineral surface area is the combined surface area of the external and interlayer
sites of the minerals in the sediment samples. It was measured using the EGME
method, thereby providing a total surface area determination of the smectite clays
versus external only typically reported from Brunauer–Emmett–Teller instrument (BET)
measurements and determined by N₂ adsorption. This allows for the interlayer loading
of OM onto the surface areas of the minerals assuming that interlayer sites are
accessible to organic compounds. Smectite has a surface area that is an order of

P a g e | 18
magnitude greater than illite because EGME can enter the interlayer sites in smectite
but not illite. Interlayer preservation can thus, lead to significant carbon preservation
with TOC as high as 25% for a single molecular monolayer (Kennedy and Wagner
2011).
The distribution of the data relative to a monolayer equivalent line (Mayer 1994)
provides some insight into the carbon and MSA association. As seen in Figure 5 the
laminated mudstone lithology is dominant in the Monterey Formation and has a
positive relationship with R²=0.66. Different extents of loading of organic matter onto
the surface area of the minerals account for the difference in the slope.
The following seven lithologies were distinguished in the Monterey Formation
(Table 1). A comparison of TOC and MSA in the different lithologies shows a first order
linear relationship for carbonate cements (Figures 5 and 6) R²= 0.82, phosphatic
mudstone (Figure 7) R²= 0.79 and clay shale (Figures 5 and 7) R²= 0.97. The nodular
mudstone had a positive relationship, R²= 0.59 (Figure 7), although there was scatter in
the data. The porcelenite and ash lithologies showed no relationship between MSA
and TOC (Figures 6 and 7).
Mineral Surface Area
Samples of the Monterey Formation were analysed after OM was removed so that
the surface area of the bare mineral surfaces in a sample could be measured. This
would determine whether adsorption of the EGME on the OM was an important
contributor to the total MSA and to determine whether EGME was measuring OM
surface area, and thus, scaling with TOC. The samples with OM removal were plotted
against samples that still had OM present (Figure 8). Removal of the OM tended to

P a g e | 19
cause variable effects on the MSA. Across the majority of the samples a tendency
existed for the sediments to give higher surface area in the presence of OM. In two
cases, OM removal led to a significant increase in surface area, which could be
explained by either the creation of high surface area oxy-hydroxide phases or Fe-
oxides or by the removal of OM occluding microporosity and interlayer space of 2:1
clays. This occurrence has been recorded before in Weiler and Mills (1965) and Titley
(1987), where the relationship could also be attributed to the exposure of small pores,
which was originally blocked by the OM. Mayer (1994) concluded that the occurrence
of the MSA decreasing could be attributed to dissolution of roughness elements on the
mineral, which are responsible for surface area. Overall, Mayer (1994) and Kennedy &
Wagner (2011) have shown that there is no significant difference in surface area
indicating that OM does not interact with EGME. Therefore, in this experiment
excessive hydrogen peroxide digestion may have occurred with a number of samples
destroying the MSAs.
Error Analysis
The MSA mean of the Clay Mineral Society SAz Smectite was 805.25 m²g¯¹ with a
standard error of ± 3.63 and the Clay Mineral Society Mancos had a mean MSA of
210.06 m²g¯¹ with a standard error of ± 0.64. Overall, the average percentage
coefficient of variation between the standards was 1.23, which was acceptable.
Therefore. it can be assumed that all of the Monterey Formation samples analysed had
a percentage coefficient variation of 1.23 for the MSA. The TOC mean of the Clay
Mineral Society SAz Smectite was 0.02% with a standard error of ± 0.0007 and the Clay
Mineral Society Mancos had a mean TOC of 2.47 % with a standard error of ± 0.27.

P a g e | 20
Overall, the average percentage coefficient of variation between the standards was
7.20, which was satisfactory.
Environmental Scanning Electron Microscope Imaging
The ESEM was used to determine where the organic carbon was located, how it
was occurring and if there were any mineral or structural relationships, such as
preservation of organic particles in mineral pores. Evidence of samples that showed
greater carbon than the monolayer equivalent loading imply that addition of
particulate material) only occurred in one sample (Figure 4a). Particulate carbon was
not evident in ESEM images. However, to image the distribution of carbon a greater
than µm scale of resolution was necessary. Diatoms and other broken up fossil matter
was also imaged. Figure 9 shows an image of a diatom using the secondary electron
detector (a), a secondary image of the outer surface of a diatom (b), a carbon map of
the same diatom (c), and, a point analysis of the outer edge of the diatom (d). The
carbon map shows that carbon is present on the surface and it concentrates around
the surface of the diatom where the clay platelets (Figure 9b) are present inferring the
carbon is clay, and not diatom associated.
DISCUSSION
Black shales occur episodically throughout the geological record and signify high
organic carbon enrichment relative to background sediments. Black Shales are most
common in greenhouse periods (Negri et al. 2008) and are assumed to correspond
with sluggish oceanographic circulation patterns resulting in low dissolved oxygen,
such as in the Late Cretaceous. However, the Monterey Formation contrasts with

P a g e | 21
these examples as it is an organic carbon enrichment in an ice-house period. Organic
carbon enrichment in the Monterey Formation has been hypothesized to reflect
enhanced upwelling as a function of the California current and nutrient delivery to
ecosystems driving heightened biological productivity and sedimentation of OM to the
sea floor (Vincent & Berger 1985). This enhanced carbon burial is linked to a positive
feedback driving global cooling and the onset of northern hemisphere glaciation in the
Monterey Formation Hypothesis (Vincent & Berger 1985). The Monterey Formation
was used in this study as a natural experiment of how organic carbon enters the
geological record.
Determination of the origin of organic carbon in sediments is difficult, as its
composition is not readily visible to the naked eye or with the use of a light
microscope. Organic carbon however, can be visible with the use of an electron
microscope. There were no visible discrete concentrated areas of organic carbon
identified where the organic compound could be imaged (Figure 9). Alternatively, the
organic matter could be at submicron scales in these samples that they may only be
visible using a much higher magnification. As determined by Mayer (1994) and Hedges
& Keil (1995), the bulk of organic compounds cannot be physically separated from the
mineral phase in sediments below 20cm of the sea floor. Above the 20cm, particulate
material is more common. This suggests that the occurrence of organic carbon could
be attributed to mineral associations. Currently, the association between MSA and
TOC is established in modern sediments, and is less established in ancient marine
sediments.

P a g e | 22
The relationship and occurrence of organic carbon had to be tested indirectly
through the use of bulk properties because it was not imageable with the ESEM. The
TOC was tested as a function of MSA to test the hypothesis that there is a strong
influence of mineral preservation effects in ancient sediments as well. A linear
relationship is present in some facies of the Monterey Formation (Figure 4).
The majority of clay minerals are formed in soils and are transported to continental
margins settings. Pedogenic clays thus reflect continental climates, not marine
processes. The presence and abundance of clay minerals in marine sediments is
dependent upon specific climate conditions as well as provenance with volcanic
sediments prone to smectite composition. Thus they form a link between continental
climate variations as a function of clay mineralogy with marine carbon burial (Kennedy
& Wagner 2011). As a result enhanced MSA could be a feedback to climatic changes
(Figure 10). Clay mineral changes may be significant to climate because marine
sediments, like the Monterey Formation, are made up of 60% mudstone (Blatt et al.
1980), which consists of greater than 60% clay. Figure 10 shows a feedback system,
where carbon burial increases with warming through MSA control on carbon burial,
driving the temperature down through atmospheric carbon dioxide sequestration in
organic carbon preserved on clay minerals. This then forces the climate to become
colder, reducing MSA through clay composition changes thus reducing organic matter
sequestration and carbon dioxide removal from atmosphere. This outlines a possible
feedback between continental weathering, clay formation and erosion and carbon
burial (Kennedy & Wagner 2011).

P a g e | 23
The MSA values found in this study are 140-450 m²g¯¹ which are high relative to
quartz (<10 m²g¯¹), kaolinite (20 m²g¯¹) and illite (<90 m²g¯¹) (Kennedy & Wagner
2011). The reason these values are large is because of the high smectite content
(which was determined with the Clay Mineral Society SAz Smectite surface area to be
805.25 m²g¯¹. Imogolite, allophane, and iron oxides also all have high surface area but
are geologically unstable and are unlikely to be present in these sediments (Theng et
al. 1982). Conversely, OM has comparative surface areas in soils but little surface area
in mature sediments when functional groups are lost (Kennedy & Wagner 2011). There
is no loss of surface area with removal or organic matter (figure 8). Therefore, the high
MSA in the Monterey Formation is a function of smectite deposition.
The TOC values are variable between lithologies in the Monterey Formation (Figure
5). A lot of TOC means a lot of surface area which is only possible if interlayers are
active and only smectite has accessible/hydratable interlayers. This study infers that
the high TOC values of the Monterey Formation (<26%) is related to the activity of
internal surfaces of the mineral where organic carbon preservation occurs according to
the bulk property constraints provided by the TOC-MSA relation in Figures 5, 6, and 7.
There are other influences likely affecting the TOC-MSA relation based on the
variability of slope and of values evident in Figure 5. Different mechanisms of carbon
deposition occurred due to the distribution between the lithologies. A sequence of
samples fall off the monolayer equivalent line, which are indicative of a series of
processes involved in organic carbon loss (Figure 11). The organic carbon loss (Figure
11-B) can be attributed to thermogenic degradation or microbial respiration. However,
several data points are displaced from the line towards a lower TOC, where the MSA-

P a g e | 24
TOC relation may not be valid due to lithological controls, i.e. an ash bed. A sequence
of samples (Figure 11-A) fall above the line and are attributed to organic carbon
addition. Organic carbon addition could possibly be due to particulate carbon,
migrated hydrocarbons or multilayer loading. Multilayer loading cannot be confirmed
with the data collected, as there are only a few isolated samples, but the organic
carbon addition is consistent with particulate carbon. Nevertheless, the culmination of
these observations supports MSA as an organic carbon burial mechanism for majority
of the lithologies present in the Monterey Formation.
A range of lithologies from the Monterey Formation show that the MSA-TOC
relation accounts for organic carbon burial in marine sediments. As seen in Figures 6
and 7, the laminated mudstone, carbonate cement, nodular mudstone, phosphatic
mudstone and clay shale lithologies all show an effect of MSA on TOC content. The
claystone lithology has the strongest relationship (R²=0.97) and is associated with
lower biologic productivity in the water column which is evidence against the leading
model of organic carbon enrichment. The Monterey Formation has been replaced
selectively by dolomite and subsequently fractured, brecciated, and relithified with
several generations of dolomite cement (Roehl 1981). The carbonate cement lithology
also shows a relationship and is further evidence for internal organic cycling in upper
sediments, where they are a product of sulphate oxidation of carbon in sediments.
Phosphatic intervals in the Monterey Formation are dominant and show areas where
significant organic diagenesis occurred, which resulted in OM oxidation (Follmi et al.
2005). Phosphate traces the amount of organic carbon loss from OM (Follmi et al.

P a g e | 25
2005) as wherever OM is oxidised, phosphorous remains. However, the MSA-TOC
relationship is not consistent in all lithologies that occur in the Monterey Formation.
The ash and porcelanite lithologies do not show a relationship between MSA and
TOC (Figures 6 and 7). This is consistent with the hypothesis in the case of ash as it is
not associated with OM when deposited due to the clay composition of an ash being a
post-depositional product of volcanic loss. This is indicative of how proficient organic
carbon preservation is in a depositional environment. The porcelanite lithology is
interesting as it has significant surface areas and deposition occurred in marine waters
that were likely anoxic (laminated and bioturbaceous), where almost no OM was
preserved. This implies that specific clay minerals may have properties of carbon
preservation that generic surface area does not provide. This is likely a function of
charge, as well as the interlayer of smectite clays.
Mineral surface area provides a control on organic carbon preservation in marine
sediments, since MSA is a function of continental processes. Thus organic carbon
preservation is not only oceanically controlled as according to the dominant paradigm.
This data argues against the Monterey Formation hypothesis (Vincent & Berger 1985),
which predicts higher oceanic circulation rates leading to organic carbon control.
The data from the Monterey Formation was plotted with additional data from
other black shale units (Kennedy & Wagner 2011) (Figure 12c). These data were
normalised to a similar suite of standards, thereby establishing a valid comparison with
the Monterey Formation. As observed in Figure 12c, the Cretaceous examples from the
Ivorian Basin, West Africa, and the samples from the Monterey Formation show similar
grouping. The Monterey Formation samples have similar slope and proximity on the

P a g e | 26
cross-plot with the Ivorian Basin bioturbated and laminated interval data (Figure 12c).
Therefore it can be inferred that the preservation of organic carbon in the Monterey
Formation and the depositional environment in the Ivorian Basin, West Africa, could
be similar. However, this can only be speculated as the similar redox evidence was not
collected in samples of the Monterey Formation.
There are different loadings of organic carbon onto the surface area of the
smectite mineral. Figure 13 shows that there are four different models for surface
loading (Figure 13); A, B, C and D, which can occur. This is shown by the slope of the
relationship between the MSA and the TOC content. Models A and B show organic
carbon addition, where A is limited by surface area and is saturated by OM, and B has
the same slope as the monolayer equivalent line but has greater number of interlayer
sites for loading. Models C and D show organic carbon loss, where C has lost a
proportionality of organic carbon through the oxidation of the external edges of the
loading sites. However, the organic carbon in C is still proportional to the MSA. Model
D is organic carbon limited, where the loading rate is smaller than the other models;
leading to excess surface area.
Particulate OM is able to reach the sea floor passively (sedimentation), and actively
(organism filter feeder) (Zonneveld et al. 2009). As previously discussed one sample in
the Monterey Formation shows evidence of particulate OM (Fig 12c, red circle).
However, particulate OM is not evident on the SEM images (Fig 12d). Mayer (1994)
found that particulate OM only survives to a depth of 20cm below the seafloor (Fig
12b). High fluxes of OM in part form from super-productive episodes as hypothesised
in the Monterey Formation but did not enter the geologic record. This is suggested in

P a g e | 27
the Monterey Formation by the abundance of phosphate nodules, which are
suggested to record respiration of significant OM, leaving phosphate behind as stated
previously (Fig 12a). This supports the idea that mineral surfaces provide preservative
effects that can transfer terrestrially derived organic carbon to the sediment reservoir
and that the oceanographic processes, such as productivity and anoxia, are restricted
to shorter internal cycles between the upper sediments and the water column.
CONCLUSION
The major findings in this study validate the hypothesis that; MSA enhances
organic carbon preservation and provides a first-order control of carbon burial in
marine sediments. The relationship between MSA and TOC, however, was not
consistent for the variety of lithologies occurring in the studied section, indicating that
there are conditions that modify the relationship. For example, while volcanic ash
beds have high mineral surface area, that surface area was established after deposition
and shows no relation with TOC. At the micron scale, the OM could not be resolved
using ESEM implying that discrete organic particles were not present in the samples
studied and that the OM (comprising upto 20% of the weight of the sample) was at the
micrometer scale. It implies that this OM existed as organo-mineral complexes with
carbon on surfaces likely occurring at micrometer scales. Comparison of TOC with MSA
from different intervals of the Monterey Formation show the surprising result that
high TOC intervals do not correlate with the high productivity anoxic interval of the
formation, but rather within the bioturbated (oxygenated) low productivity clay-rich
intervals. This is evidence against the dominant paradigm for carbon enrichment in the

P a g e | 28
Monterey Formation of anoxia and high productivity, reinforces the first-order controls
of MSA. Surface area of minerals is created in continental soils under particular
climatic conditions. Thus, implying that the mineral properties of the sediments in
marine sediments are sometimes at least a function of continental climate. Changes in
climate then can feedback on carbon burial, which is an important control on climate
through atmospheric CO2 drawdown and reduced greenhouse warming.
There are some micro/nano techniques that could help resolve the nature of
organo-mineral associations in future research. The chemistry, form and distribution of
the OM may be resolved by high resolution transmission electron microscopy (TEM)
and synchrotron based small angle X-ray scattering combined with nano secondary ion
mass spectrometry. Further research could also resolve whether the TOC-MSA
relationship can change on a timescale relevant to future climate.
ACKNOWLEDGMENTS
This work was funded by the Australian Research Council. I would like to acknowledge my
amazing supervisor Martin Kennedy for all of his support, enthusiasm, motivation and inspiration
throughout the year. I would also like to thank David Chittleborough, my secondary supervisor for his
advice and mentoring.
Jock Churchman and Jeffrey Baldock who are affiliates with the University of Adelaide are
kindly thanked for their assistance and guidance. Acknowledgments are also given to Lawrence Mayer
from the University of Maine for guidance and analytical TOC work carried out on the samples. Ken
Neubauer and Ben Wade from Adelaide Microscopy are thanked for their assistance on the Quanta 450,
and John Stanley for assistance with anything needed in the Mawson laboratory.
I would also like to thank Katie Howard for providing so much assistance and support and Rob
Klaebe for being my partner in crime for honours. I would also like to thank the Geology and Geophysics
Honours year of 2011. I would like to thank my family, especially my parents for their encouragement
and support as well as the Baldocks who have helped me become a scientist. Lastly I would like to thank
Joshua for believing in me.

P a g e | 29
REFERENCES
BARRON J. 1985. Miocene to Holocene planktic diatoms in Plankton stratigraphy. Cambridge University Press, Cambridge.
BLAKE G. 1981. Biostratigraphic relationship of Neogene benthic foraminifera from the southern California outer continental bordeland to the Monterey Formation. In: Garrison R. & Douglas R. eds., The Monterey Formation and Related Siliceous Rocks of California, pp 1-14, Pacific Section SEPM, Los Angeles.
BLATT H., MIDDLETON G. & MURRAY R. 1980. Origin of Sedimentary Rocks. Prentice Hall, New Jersey.
BODNAR R. 1990. Petroleum migration in the Miocene Monterey Formation, Califronia, USA: constraints from fluid-inclusion studies. Mineralogical Magazine 54, 295-304.
CHURCHMAN G. J., BURKE C. M. & PARFITT R. L. 1991. Comparison of various methods for the determination of specific surfaces of subsoils. Journal of Soil Science 42, 449-461.
DEPAOLO D. & FINGER K. 1991. High-resolution strontium-isotope stratigraphy and biostratigraphy of the Miocene Monterey Formation, central California. Geological Society of America Bulletin 103, 112-124.
DICKENS A., BALDOCK J., SMERNIK R., WAKEHAM S., ARNARSON T., GÉLINAS Y. & HEDGES H. 2006. Solid-state 13C NMR analysis of size and density fractions of marine sediments: Insight into organic carbon sources and preservation mechanisms. Geochimica et Cosmochimica Acta, 666-686.
ELTANTAWY I. & ARNOLD P. 1973. Reappraisal of ethylene glycol monoethyl ether (EGME) method for surface area estimations of clays. Journal of Soil Science 24, 232-238.
FOLLMI K., KAENEL E., STILLE P., JOHN C., ADATTE T. & STEINMAN P. 2005. Phosphogenesis and organic-carbon preservation in the Miocene Monterey Formation at Naples Beach, California-The Monterey hypothesis revisited. Geological Society of America Bulletin 117, 589-619.
GRAHAM S. & WILLIAMS L. 1985. Tectonic, depositional, and diagenetic history of Monterey Formation (Miocene), central San Joaquin basin, California. America Association Petroleum Geology Bulletin 69, 385-411.
HEDGES J. I. & KEIL R. G. 1995. Sedimentary organic matter preservation-an assessment and speculative synthesis. Marine Chemistry 49, 137-139.
HORNAFIUS J. E. 1994. Field Guide to the Monterey Formation between Santa Barbara and Gaviota, California. American Association of Petroleum Geologists, Pacific Section, California.
INGLE J. 1980. Cenozoic paleobathymetry and depositional history of selected sequences within the southern California continental borderland. In, Studies in Micropaleontology, pp 163-195, Cushman Foundation, Washington.
INGLE J. 1981. Origin of Neogene diatomites around the North Pacific rim in Monterey Formation and related siliceous rocks of California. Society of Economic Paleontologists and Mineralogists, Pacific Section.

P a g e | 30
ISAACS C. 1984. Hemipelagic deposits in a Miocene basin, California: Toward a model of lithologies variation and sequence. In: Stow D. & Piper D. eds., Fine-Grained Sediments: Deep-Water Processes and Facies, pp 481-496, Blackwell, Oxford.
ISAACS C. 2001. Depositional framework of the Monetery Formation, California. In: Isaacs C. & RullKotter J. eds., The Monterey Formation: from Rocks to Molecules, pp 31-59, Columbia University Press, New York.
ISAACS C., PISCIOTTO K. & GARRISON R. 1983. Chapter 15 Facies and Diagenesis of the Miocene Monterey Formation, Califronia: A Summary. Developments in Sedimentology 36, 247-282.
JACKSON M. 1979. Soil Chemical Analysis ((2nd ed.) edition). (Advanced Course). JENKYNS H. C. 1980. Cretaceous oceanic anoxic events from continents to oceans.
Journal of the Geological Society of London 137, 171-188. JENNY H. 1941. Factors of Soil Formation. McGraw-Hill, New York. KENNEDY M. & DERKOWSKI A. 2007. Organic enrichment controlled by smectite clay
minerals in the Miocene Monterey Formation and Cretaceous Pierre Shale. Geophysical Research Abstracts 9.
KENNEDY M., DROSER M., MAYER L. M., PEVEAR D. & MROFKA D. 2006. Late Precambrian oxygenation; Inception of the clay mineral factory. Science 311, 1446-1449.
KENNEDY M. J., PEVEAR D. R. & HILL R. J. 2002. Mineral surface control of organic carbon in black shale. Science 295, 657-660.
KENNEDY M. J. & WAGNER T. 2011. Clay mineral continental amplifier for marine carbon sequestration in a greenhouse ocean. Proceedings of the National Academy of Sciences of the United States of America 108, 9776-9781.
LAGOE M. 1987. Middle Cenozoic basin development, Cuyama basin, California. In: Ingersoll R. & Ernst W. eds., Cenozoic Basin Development of Coastal California, pp 173-206, Prentice-Hall, New Jersey.
LÜCKGE A., BOUSSAFIR M., LALLIER-VERGÈS E. & LITTLE R. 1996. Comparative study of organic matter preservation in immature sediments along the continental margins of Peru and Oman. Part I: Results of petrographical and bulk geochemical data. Organic Geochemistry 24, 437-451.
MAYER L. M. 1994. Surface area control of organic carbon accumulation in continental shelf sediments. Geochimica et Cosmochimica Acta 58, 1271-1284.
MOORE D. & REYNOLDS R. 1989. X-Ray diffraction and the identification and analysis of clay minerals. Oxford University Press, Oxford.
NEGRI A., FERRETTI A., WAGNER T. & MEYERS P. A. 2008. Phanerozoic organic-carbon-rich marine sediments: Overview and future research challenges. Palaeogeography, Palaeoclimatology, Palaeoecology 273, 218-227.
PEDERSEN T. F. & CALVERT S. E. 1990. Anoxia vs Productivity-what controls the formation of organic carbon rich sediments and sedimentary rocks. Aapg Bulletin-American Association of Petroleum Geologists 74, 454-466.
RAYMENT G. & LYONS D. 2010. Soil Chemical Methods-Australasia (Australian Soil and Land Survey Handbooks Series). CSIRO Publishing, Collingwood.
ROBINSON W. 1927. The determination for organic matter in soils by means of hydrogen peroxide. Journal of Agricultural Research 34, 339-356.

P a g e | 31
ROEHL P. 1981. Dilation brecciation: proposed mechanism of fracturing, petroleum expulsion, and dolomitization in Monterey formation, California. America Association Petroleum Geology Bulletin, 980-981.
SCHNITZER M. 1978. Humic substances: Chemistry and reactions (Soil Organic Matter). Elsevier Scientific Publishing Co., New York.
SCHUMACHER B. 2002. Methods for the determination of total organic carbon (TOC) in soils and sediments. United States Environmental Protection Agency.
SUMMERHAYES C. P. 1981. Organic facies of Middle Cretaceous black shales in deep North Atlantic. AAPG Bulletin 65, 2364-2380.
TENNYSON M. & ISAACS C. 2001. Geologic Setting and Petroleum Geology of Santa Maria and Santa Barbara Basins, Coastal California. In: Issacs C. & Rullkotter J. eds., The Monterey Formation from Rocks to Molecules, Columbia University Press, West Sussex.
THENG B., RUSSELL M., CHURCHMAN G. & PARFITT R. 1982. Surface Properties of Allophane, Halloysite and Imogolite. Clays and Clay Minerals 30, 143-149.
TILLER K. G. & SMITH L. H. 1990. Limitations of EGME retention to estimate the surface area of soils. Australian Journal of Soil Research 28, 1-26.
TITLEY J., GLEGG G., GLASSON D. & MILLWARD G. 1987. Surface areas and porosities of particulate matter in turbid estuaries. Continental Shelf Research 7, 1363–1366.
TYSON R. V. 2001. Sedimentation rate, dilution, preservation and total organic carbon: some results of a modelling study. Organic Geochemistry 32, 333-339.
ULMISHEK G. & KLEMME H. 1990. Depositional controls, distribution and effectiveness of world's petroleum source rocks. U.S. Geological Survey Bulletin 1931.
VINCENT E. & BERGER W. H. 1985. Carbon dioxide and polar cooling in the Miocene: The Monterey Hypothesis (The carbon cycle and atmospheric CO2: Natural variations Archean to present). American Geophysical Union, Washington, D.C.
WADE B. 2010. Philips XL30 Scanning Electron Microscope operating instructions. WEILER R. & MILLS A. 1965. Surface properties and pore structure of marine sediments.
Deep Sea Research 12, 511-529. ZONNEVELD K., VERSTEEGH G., KASTEN S., EGLINTON T., EMEIS K., HUGUET C., KOCH B., LANGE G.,
DE LEEUM J., MIDDELBURG J., MOLLENHAUER G., PRAHL F., RETHEMEYER J. & WAKEHAM S. 2009. Selective preservation of organic matter in marine environments – processes and impact on the fossil record. Biogeosciences Discuss 6, 6371–6440.

P a g e | 32
FIGURE CAPTIONS
Figure 1: Map of the Californian Coast line adapted from Follmi et al (2005), showing
location of Naples Beach (black box) and inclusion of the Santa Barbara Basin (dotted
line).
Figure 2: Generalised stratigraphic column of the Monterey Formation Naples Beach
Section, California (modified from DePaolo & Finger 1991) showing ages of the
lithologic members (Isaacs, 2001)
Figure 3: Image showing naturally formed bitumen flowing up through the fractures.
The image was taken at Naples Beach, east of the Dos Pueblos Creek. Courtesy of
M.Kennedy.
Figure 4 a-c: Cross-plots of the lower member (a), middle member (b) and upper
member (c) of the Monterey Formation. The x-axis is mineral surface area- CO3 dilution
and y-axis is % total organic carbon siliclastic. A one to one line is present in all plots.
Identified loading rate for each lithology is calculated using a regression within that
grouping with an overall relationship: R²=0.53 lower member, R²=0.85 middle member
and R²= 0.03 upper member. The middle member facies has a positive linear
relationship.
Figure 5: % total organic carbon siliclastic cross-plot with mineral surface area- CO3
dilution for the different lithologies present in the sampled area of the Monterey
P a g e | 33
Formation: laminated mudstone (diamond), nodular mudstone (square), phosphatic
mudstone (triangle), carbonate cemented (open triangle), clayshale (circle), ash (open
circle) and porcelanite (open diamond). A tightening of subsets occurs where there are
positive linear relationships in the clay shale, laminated mudstone and carbonate
cement lithologies. A one to one line is present in plot. The ethylene glycol monoethyl
ether standards line, monolayer equivalent line was identified by measuring weight
addition of ethylene glycol by a series of standards exposed to ethylene glycol
monoethyl ether (Kennedy & Wagner 2011). The monolayer equivalent line is included
to show a reference line only and does not imply that organic matter in natural
samples occurs in a monolayer coating (Kennedy & Wagner 2011).
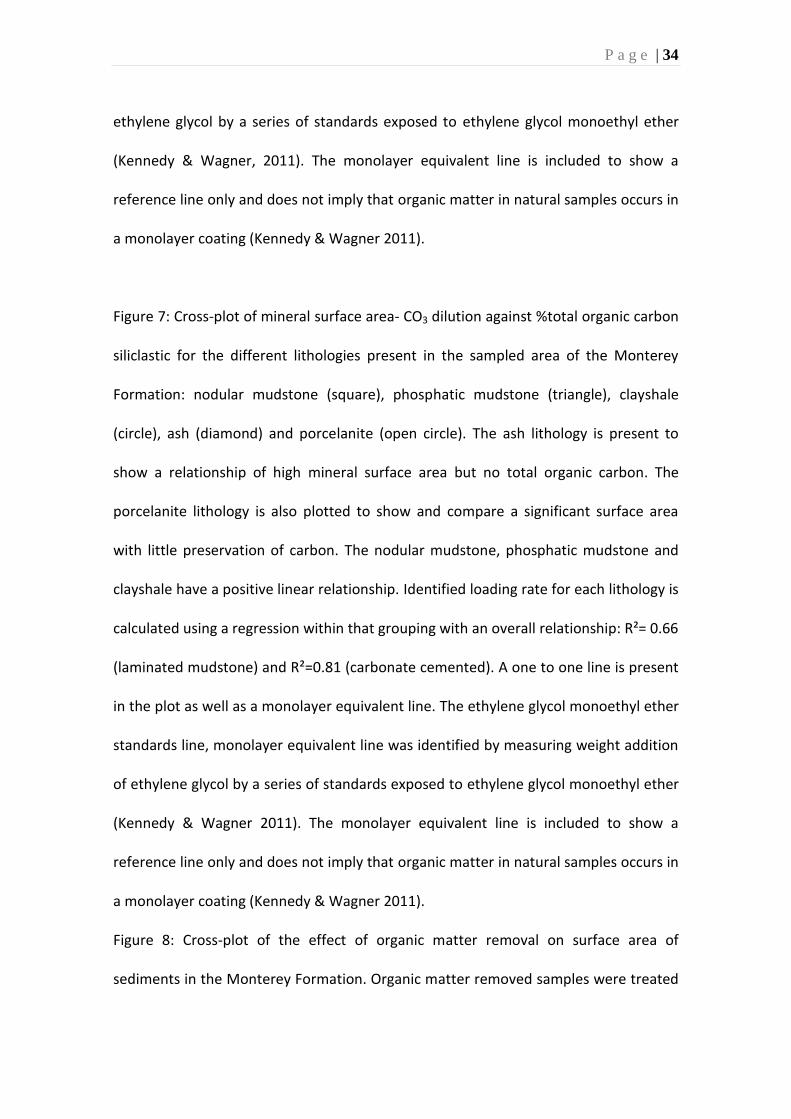
Figure 6: Cross-plot of mineral surface area- CO3 dilution against % total organic carbon
siliclastic for the different lithologies present in the sampled area of the Monterey
Formation: laminated mudstone (diamond), carbonate cement (square), ash (circle)
and porcelanite (triangle). The ash lithology is present to show a relationship of high
mineral surface area but no total organic carbon. The porcelanite lithology is also
plotted to show and compare a significant surface area with little preservation of
carbon. The laminated mudstone and carbonate cement lithologies show a positive
linear relationship. Identified loading rate for each lithology is calculated using a
regression within that grouping with an overall relationship: R²= 0.66 (laminated
mudstone) and R²=0.81 (carbonate cemented). A one to one line is present in the plot
as well as a monolayer equivalent line. The ethylene glycol monoethyl ether standards
line, monolayer equivalent line was identified by measuring weight addition of
P a g e | 34
ethylene glycol by a series of standards exposed to ethylene glycol monoethyl ether
(Kennedy & Wagner, 2011). The monolayer equivalent line is included to show a
reference line only and does not imply that organic matter in natural samples occurs in
a monolayer coating (Kennedy & Wagner 2011).
Figure 7: Cross-plot of mineral surface area- CO3 dilution against %total organic carbon
siliclastic for the different lithologies present in the sampled area of the Monterey
Formation: nodular mudstone (square), phosphatic mudstone (triangle), clayshale
(circle), ash (diamond) and porcelanite (open circle). The ash lithology is present to
show a relationship of high mineral surface area but no total organic carbon. The
porcelanite lithology is also plotted to show and compare a significant surface area
with little preservation of carbon. The nodular mudstone, phosphatic mudstone and
clayshale have a positive linear relationship. Identified loading rate for each lithology is
calculated using a regression within that grouping with an overall relationship: R²= 0.66
(laminated mudstone) and R²=0.81 (carbonate cemented). A one to one line is present
in the plot as well as a monolayer equivalent line. The ethylene glycol monoethyl ether
standards line, monolayer equivalent line was identified by measuring weight addition
of ethylene glycol by a series of standards exposed to ethylene glycol monoethyl ether
(Kennedy & Wagner 2011). The monolayer equivalent line is included to show a
reference line only and does not imply that organic matter in natural samples occurs in
a monolayer coating (Kennedy & Wagner 2011).
Figure 8: Cross-plot of the effect of organic matter removal on surface area of
sediments in the Monterey Formation. Organic matter removed samples were treated

P a g e | 35
with hydrogen peroxide whereas the untreated samples were not. Removal of the
organic matter tended to cause variable effects on the mineral surface area. Across the
majority of the samples a tendency existed for the sediments to give higher surface
area in the presence of organic matter. The cross plot also shows a one-one line
(dashed).
Figure 9: The following figure shows: a) environmental scanning electron microscope
image of a diatom on the surface using secondary electron detector at a scale of 50μm
(magnification 2772 x). b) secondary electron image showing the edge of a diatom
where the clay plates occur, which has an affiliation with carbon at a scale of 10 μm
(magnification 13960 x). c) Carbon map of a diatom where no discrete areas of organic
matter are visible at a scale of 20 μm. d) point analysis plot showing that the carbon is
occurring, and that the high peak accounts for the carbon occurring around the edge
of diatom, where the clay plates occurred.
Figure 10: Schematic figure illustrating a feedback system of carbon burial and
seasonal climate. Showing that carbon burial increases as it gets warmer (wet, glacial
period), until there is too much carbon buried. This then forces the climate to become
colder driving the system back down again (seasonal, interglacial period).
Figure 11: A schematic figure showing mineral surface area vs total organi carbon in
regards to divergence in the data set. A monolayer equivalent line is present as a
comparison. There is a sequence of samples that fall off the line and this is indicative of

P a g e | 36
a series of processes involved in carbon loss (B). A number of samples (A) are above
the line are attributed to carbon gain. Carbon loss can be attributed to thermogenic
degradation or microbial respiration, carbon gain can be attributed to multilayer
loading or particulate carbon.
Figure 12: The following figure shows an image of the Monterey Formation beach (a), a
graph of total organic carbon vs depth taken and adapted from Mayer (1994) (b)
showing that particulate organic matter only survives to a depth of 20cm below the
seafloor, a cross-plot showing relationship between mineral surface area in m²g¹
silicate fraction and %TOC siliclastic taken and adapted from Kennedy & Wagner
(2011) (c). The Monterey Formation data from this paper has been added to the cross-
plot allowing the formation of a comparison (c). The monolayer equivalent line was
identified by measuring weight addition of ethylene glycol by a series of standards
exposed to ethylene glycol monoethyl ether (Kennedy & Wagner 2011); it is included
to show a reference line only and does not imply that organic matter in natural
samples occurs in a monolayer coating (Kennedy & Wagner 2011). (c) An
environmental scanning electron microscope image of a sample of the Monterey
Formation also present where no particulate organic matter was observed on the
surface (d).
Figure 13: A schematic figure showing four different models for surface loading A, B, C
and D. Models A and B show carbon addition, where A is limited by surface area and is
saturated by organic matter, and B has the same slope as the monolayer equivalent

P a g e | 37
line but has greater number of interlayer sites for loading. Models C and D show
carbon loss where C has lost a proportionality of carbon through the oxidation of the
external edges of the loading sites; however it is still proportional to mineral surface
area. Model D is organic matter limited where the loading rate is smaller than the
other models; leading to excess surface area.

P a g e | 38
TABLES
Table 1: Lithologies identified in the studied section of the Monterey Formation at Naples Beach
LITHOLOGY DESCRIPTION
Laminated mudstone a grey to black coloured mudstone
characterised by the regular occurrence of
light-coloured phosphatic laminae
Nodular mudstone grey to dark coloured mudstone characterised
by frequent phosphatic particles and nodules;
where phosphatic laminae are less abundant
Phosphatic mudstone grey coloured mudstone where granular
phosphatic layers and isolated phosphatic
nodules are frequent, phosphatic laminae are
less abundant
Carbonate Cemented Claystone Light coloured with no visible grain size
Ash yellow to grey coloured in composition, very
fine grain size, no phosphatic presence
Clay shale grey to dark coloured shale characterised by
fine grains and no laminae or phosphatic
intervals present
Porcelanite laminated fine grained clay stone, white to
yellow in colour

P a g e | 39
APPENDICES
sample number
Determination of MSA
weight of initial
container (g)
initial container + sample
(g)
initial container + sample DRY (g)
sample mass
(g)
final container + sample + EGME¹ (g)
mass EGME¹
(g)
mass EGME¹ (mg)
Surface area
(m^2/g) H
MSA²-CO3
dilution
060105 /06
2 17.0280 18.0397 18.0138 1.0116 18.0897 0.0759 75.9500 240.2531 269.7268
3 17.1767 18.1804 18.1578 1.0036 18.2192 0.0614 61.4000 195.7742 217.4021
5 17.1814 18.1860 18.1728 1.0510 18.2287 0.0558 55.8100 169.9339 217.7028
6 17.1759 18.1914 18.1774 1.0155 18.2373 0.0599 59.9000 188.7571 257.9172
10 17.2011 18.1561 18.1147 0.9550 18.1929 0.0782 78.1900 261.9952 310.3503
11 17.3488 18.4143 18.3712 1.0657 18.4469 0.0756 75.6500 227.1516 305.0631
12 17.1688 18.2662 18.2466 1.0974 18.3321 0.0855 85.4900 249.2988 292.8345
18 a 17.2527 18.3001 18.2591 1.0474 18.3915 0.1323 132.3100 404.2199 485.8614
18 b 17.6840 18.2066 18.1707 0.7804 18.2337 0.0630 63.0200 258.4111 316.1039
19 17.2982 18.3474 18.30714 1.0492 18.3757 0.0685 68.5500 209.0746 291.1422
20 17.5365 18.5778 18.5305 1.0412 18.6361 0.1056 105.6300 324.6299 358.8888
22 17.2169 18.2794 18.2362 1.0624 18.3432 0.1070 107.0000 322.2785 379.4061
23 17.1803 18.2448 18.2240 1.0644 18.2865 0.0625 62.4800 187.8383 257.9061
24 17.1416 18.1733 18.1432 1.0316 18.1917 0.0485 48.5200 150.5065 209.7562

P a g e | 40
25 17.1337 18.1915 18.1664 1.0577 18.2179 0.0515 51.5300 155.8939 300.879634
26 17.1334 18.1655 18.1432 1.0320 18.1949 0.0517 51.6900 160.2721 243.9493
28 17.2071 18.3055 18.2596 1.0984 18.3885 0.1289 128.9000 375.5400 377.9234
29 17.2188 18.2930 18.2778 1.0741 18.3283 0.0505 50.4800 150.3871 158.5549
30 17.2155 18.2805 18.2583 1.0650 18.3374 0.0791 79.1100 237.7115 301.1698
31 17.0612 18.0664 18.0367 1.0051 18.1263 0.0896 89.6200 285.3231 395.7911
32 17.2524 18.2552 18.2157 1.0026 18.3399 0.1242 124.1700 396.3037 396.3037
33 17.2781 18.3002 18.2750 1.0221 18.4200 0.1451 145.0500 454.1239 454.1239
34 17.2959 18.3774 18.3419 1.0814 18.4570 0.1151 115.0700 340.5036 348.2014
35 17.1291 18.2379 18.2158 1.1088 18.3687 0.1530 152.9500 441.4221 442.3689
36/1 17.5217 18.6095 18.6027 1.0877 18.6276 0.0249 24.8500 73.1074 173.5736
36/2 17.1667 18.2816 18.2727 1.1148 18.2986 0.0259 25.9500 74.4867 185.2600
37 17.2789 18.2993 18.2674 1.0203 18.3312 0.0639 63.8700 200.3126 224.9933
38 17.1367 18.2010 18.1669 1.0642 18.2257 0.0588 58.8200 176.8690 212.8970
40 17.2861 18.3745 18.3366 1.0884 18.4064 0.0698 69.8200 205.2765 224.4405
41 17.1553 18.1902 18.1668 1.0349 18.2405 0.0738 73.7700 228.1065 228.6959
42 17.0064 18.0953 18.0673 1.0887 18.1672 0.0999 99.9300 293.7160 294.1553
43 17.0448 18.0514 18.0243 1.0066 18.08856 0.0643 64.2500 204.2621 204.6625
45 17.2683 18.2977 18.2865 1.0293 18.3768 0.0902 90.2100 280.4465 281.0268
47 17.1296 18.2097 18.1816 1.0799 18.2622 0.0806 80.5900 238.8040 239.5754
48 17.3457 18.4177 18.3855 1.0719 18.4974 0.1119 111.9100 334.0831 336.1499
49 17.3274 18.4274 18.3991 1.0999 18.5028 0.1037 103.7200 301.7501 303.5125
50 17.4167 18.4464 18.4190 1.0297 18.5090 0.0900 90.0000 279.6999 279.6999
52 17.3128 18.4004 18.3829 1.0875 18.4488 0.0659 65.8800 193.8565 246.7694
53 17.1758 18.2584 18.2302 1.0824 18.2858 0.0556 55.6400 164.4907 174.4718
55 17.0429 18.1297 18.1006 1.0867 18.1811 0.0804 80.4300 236.8451 248.6368

P a g e | 41
56 17.2176 18.2886 18.2624 1.0710 18.3374 0.0749 74.9300 223.8815 230.6074
57 16.9521 18.0412 18.0169 1.0890 18.1076 0.0906 90.6300 266.3202 287.9412
58 17.2642 18.2767 18.2534 1.0125 18.3231 0.0697 69.7000 220.2951 255.3547
59 17.2500 18.3366 18.3062 1.0865 18.3886 0.0823 82.3300 242.4925 276.0942
60 17.2139 18.2897 18.27498 1.0758 18.3079 0.0330 32.9600 98.0442 178.7059
61 17.1353 18.1685 18.1377 1.0332 18.2426 0.1049 104.8600 324.7744 397.6815
62 17.0843 18.1434 18.1153 1.0591 18.2763 0.1611 161.0700 486.6600 507.9706
22406/02
1 17.4297 18.4998 18.4644 1.0701 18.5202 0.0558 55.8300 166.9589 197.0522
2 17.2621 18.3448 18.3186 1.0827 18.3672 0.0487 48.6600 143.8149 144.2750
3 17.2479 18.2938 18.2545 1.0459 18.3184 0.0639 63.9200 195.5665 196.7228
5 17.1697 18.2435 18.2291 1.0738 18.2758 0.0467 46.6600 139.0507 174.1190
7 17.4395 18.5334 18.5199 1.0939 18.5798 0.0599 59.9100 175.2595 175.8164
11 17.1984 18.2678 18.2468 1.0692 18.3005 0.0537 53.7300 160.8021 169.5933
12 17.3869 18.4137 18.3809 1.0267 18.4792 0.0983 98.2800 306.3203 359.6318
13 17.2499 18.3079 18.2838 1.0581 18.3586 0.0749 74.8700 226.4381 362.0716
14 17.1292 18.1986 18.1623 1.0695 18.2248 0.0624 62.4400 186.8264 233.7186
15 17.1732 18.2609 18.2477 1.0876 18.3230 0.0753 75.2800 221.4912 292.9638
16 17.2643 18.2745 18.2561 1.0102 18.3353 0.0792 79.1800 250.8264 282.2309
17 17.1172 18.1661 18.1485 1.0490 18.2223 0.0738 73.7600 225.0174 273.3118
18 17.1375 18.2058 18.1743 1.0683 18.2362 0.0619 61.9400 185.5342 252.6588
20 17.3416 18.3960 18.3599 1.0544 18.4379 0.0780 77.9500 236.5728 317.6024
21 17.3133 18.3912 18.3738 1.0779 18.4590 0.0853 85.2800 253.1855 301.8746
22 17.2518 18.3058 18.2853 1.0539 18.3800 0.0947 94.7200 287.5995 365.0469
23 17.2811 18.3447 18.3330 1.0636 18.4050 0.0720 71.9800 216.5596 323.0498
24 17.3407 18.3810 18.3580 1.0402 18.4273 0.0693 69.3000 213.1816 325.5380

P a g e | 42
25 17.2331 18.3063 18.2865 1.0731 18.3349 0.0484 48.4500 144.4759 278.8232
26 17.2547 18.2855 18.2653 1.0308 18.3055 0.0402 40.2200 124.8644 233.5043
27 17.0699 18.0950 18.0739 1.0250 18.1427 0.0687 68.7400 214.6040 304.4215
30 17.0705 18.1115 18.0851 1.0410 18.1774 0.0923 92.3000 283.7176 332.6068
31 17.1382 18.1834 18.1640 1.0452 18.2759 0.1119 111.8900 342.5543 355.2720
32 17.0139 18.0917 18.0757 1.0778 18.1862 0.1104 110.4400 327.8976 330.4940
33 17.3077 18.3195 18.3040 1.0117 18.4071 0.1031 103.1055 326.1123 401.8234
34 17.3163 18.4213 18.4046 1.1051 18.4991 0.0945 94.5000 273.6503 379.2402
35 17.4910 18.4992 18.4795 1.0082 18.5768 0.0973 97.3000 308.8230 386.8960
36 17.2562 18.3074 18.2922 1.0511 18.3827 0.0906 90.5500 275.6731 437.4736
37 17.0778 18.0988 18.0825 1.0210 18.1897 0.1072 107.2100 336.0206 418.4035
38 17.0410 18.0314 18.0133 0.9904 18.1136 0.1003 100.2700 323.9676 415.6275
39 17.1777 18.2491 18.2258 1.0714 18.3276 0.1018 101.7900 304.0351 399.9800
40 17.3537 18.3736 18.3561 1.0199 18.4436 0.0875 87.5200 274.6035 319.4882
41 17.2837 18.3113 18.2939 1.0276 18.4004 0.1066 106.5700 331.8645 477.8905
42 17.2583 18.3337 18.3178 1.0754 18.4311 0.1133 113.3100 337.1804 405.2787
43 17.3621 18.3570 18.3433 0.9948 18.4297 0.0863 86.3500 277.7700 367.8508
44 17.3181 18.3800 18.3614 1.0619 18.4888 0.1274 127.3500 383.7595 386.0560
45 17.2717 18.2890 18.2759 1.0173 18.4079 0.1321 132.0800 415.4623 419.9202
46 17.5065 18.5346 18.5138 1.0281 18.6611 0.1473 147.3100 458.5012 465.1429
47 17.3162 18.3896 18.3710 1.0735 18.5276 0.1567 156.6800 467.0697 516.5854
48 17.3186 18.3155 18.2984 0.9969 18.4129 0.1145 114.4600 367.4054 438.1134
49 17.2525 18.2503 18.2303 0.9977 18.3509 0.1206 120.5800 386.7378 496.2151
50 17.2198 18.2712 18.2561 1.0514 18.3446 0.0885 88.5300 269.4375 329.0901
50 B 17.1716 18.2654 18.2517 1.0938 18.3349 0.0831 83.1200 243.1720 270.6810
50C 17.5518 18.5487 18.5360 0.9969 18.6075 0.0715 71.5200 229.5803 284.2833

P a g e | 43
51 17.1221 18.2046 18.1882 1.0825 18.2873 0.0990 99.0300 292.7446 433.9359
52a 17.2781 18.3246 18.30987 1.0465 18.4239 0.1140 114.0500 348.7368 350.9156
52b 17.3484 18.3542 18.3368 1.0055 18.4572 0.1205 120.4500 383.3145 385.7095
53 17.1948 18.1190 18.0808 0.9242 18.1917 0.1109 110.9000 383.9820 444.4079
64 17.2730 18.3019 18.2697 1.0289 18.4026 0.1328 132.8200 413.1059 445.9705
100 17.2422 18.2598 18.2072 1.0175 18.2769 0.0698 69.7700 219.4295 220.8152
102 17.1670 18.2194 18.1709 1.0524 18.2419 0.0710 71.0500 216.0395 217.6304
SA2-1
1 17.1342 17.6646 17.6369 0.5304 17.7733 0.1364 136.4200 823.1088 826.5192
2 17.0571 17.5784 17.5554 0.5213 17.6861 0.1307 130.7200
3 17.1180 17.6269 17.6032 0.5088 17.7322 0.1290 129.0000 811.3128 813.6923
4 17.2997 17.8137 17.7884 0.5140 17.9192 0.1308 130.7700
5 17.1197 17.6493 17.6139 0.5294 17.7460 0.1321 132.0800
6 17.3451 17.8635 17.8345 0.5185 17.9603 0.1258 125.8000
7 17.1642 17.6761 17.6462 0.5119 17.7749 0.1287 128.6500
8 17.1526 17.6749 17.6419 0.5223 17.7726 0.1308 130.7600
9 17.1200 17.6378 17.6049 0.5178 17.7365 0.1316 131.5900
10 17.3589 17.8817 17.8531 0.5228 17.9842 0.1311 131.1300
STD 17.1584 17.6867 17.6582 0.5283 17.7921 0.1339 133.8800
MANCOS
1 17.2174 18.1339 18.1022 0.9164 18.1620 0.0598 59.7800 208.7427 212.2142
2 17.2530 18.1743 18.1414 0.9207 18.2017 0.0603 60.3300
3 17.0513 17.9554 17.9239 0.9040 17.9838 0.0599 59.9500 212.2112 208.1324
4 16.9899 17.9038 17.8732 0.9139 17.9326 0.0594 59.4400
5 17.1590 18.0645 18.0325 0.9055 18.0908 0.0584 58.3700
6 17.2192 18.1320 18.1001 0.9128 18.1599 0.0598 59.7600

P a g e | 44
7 17.2878 18.1955 18.1615 0.9076 18.2219 0.0604 60.4100
8 17.0492 17.9644 17.9344 0.9151 17.9946 0.0602 60.2200
9 17.0162 17.9218 17.8854 0.9055 17.9450 0.0596 59.6500
10 17.1178 18.0294 17.9984 0.9116 18.0587 0.0603 60.3000
OM² removed
060105/06
2 17.3625 18.3830 18.3511 1.0204 18.4118 0.0608 60.7700 190.5706 209.3518
3 17.2431 18.3314 18.2878 1.0881 18.3688 0.0810 81.0000 238.2079 255.2580
4 17.0591 18.1206 18.0963 1.0615 18.1348 0.0385 38.4900 116.0331 174.4134
6 17.2943 18.3351 18.3075 1.0406 18.3546 0.0472 47.1900 145.1128 198.6562
7 17.1326 18.1844 18.1597 1.0518 18.2083 0.0486 48.5900 147.8367 180.6204
8 17.3154 18.3402 18.2966 1.0246 18.3533 0.0567 56.6700 176.9987 204.7746
9 17.0231 18.0236 17.9817 1.0004 18.0479 0.0662 66.2100 211.7820 250.3704
10 17.0835 18.1232 18.0850 1.0397 18.1520 0.0670 67.0100 206.2491 233.6227
12 17.3009 18.3570 18.3173 1.0560 18.3854 0.0681 68.1400 206.4760 246.5406
13 17.2540 18.2652 18.2329 1.0112 18.2897 0.0567 56.7300 179.5200 221.2372
15 17.3285 18.3982 18.3872 1.0697 18.4136 0.0263 26.3300 78.7656 253.6169
16 17.3328 18.4075 18.3747 1.0746 18.4502 0.0755 75.4900 224.7928 286.0919
19 17.3141 18.3554 18.3229 1.0412 18.3580 0.0351 35.0900 107.8417 152.4651
20 17.3344 18.3791 18.3428 1.0446 18.3956 0.0528 52.7800 161.6887 164.6940
22 17.2089 18.2693 18.2388 1.0603 18.2916 0.0528 52.7900 159.3194 175.4204
25 17.1805 18.2116 18.1947 1.0310 18.2210 0.0263 26.3100 81.6589 160.3000
26 17.2795 18.3108 18.2910 1.0310 18.3217 0.0307 30.7200 95.3464 162.9752
27 17.3730 18.4227 18.3918 1.0498 18.4384 0.0466 46.5900 142.0197 155.6333
29 17.3131 18.3685 18.3579 1.0552 18.3805 0.0226 22.5800 68.4768 73.6502
30 17.0873 18.1292 18.1183 1.0419 18.1373 0.0190 18.9800 58.2915 72.4517
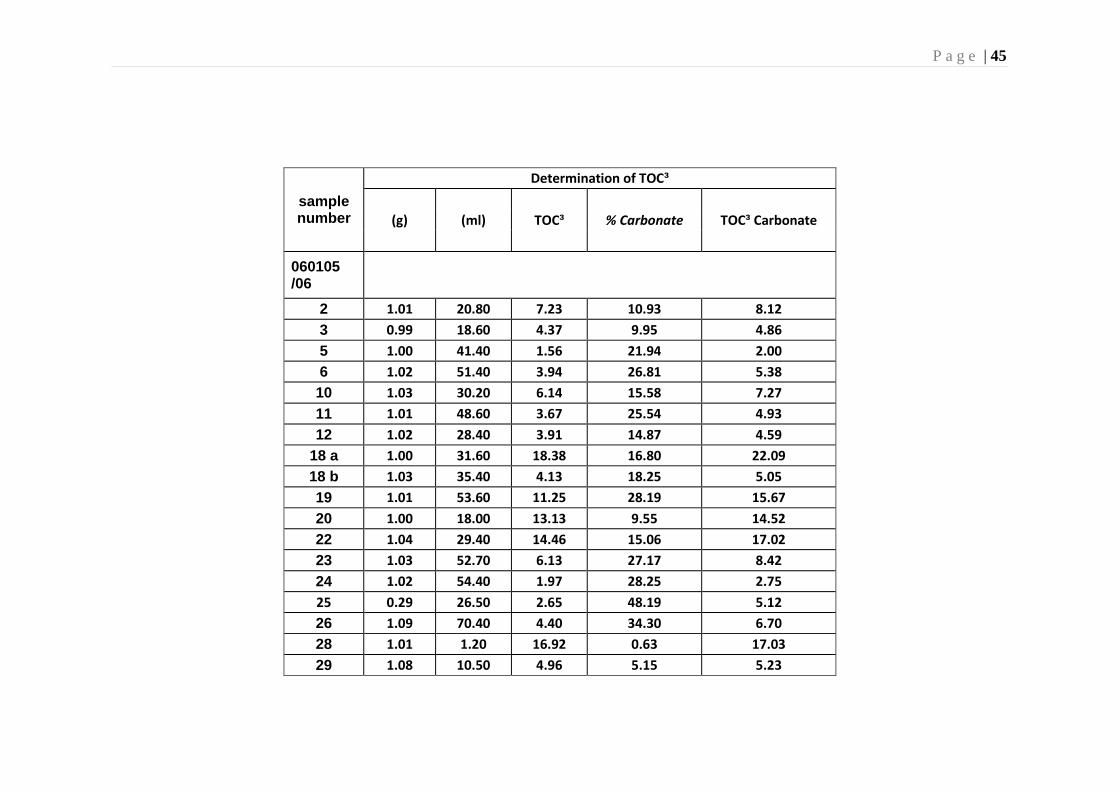
P a g e | 45
sample number
Determination of TOC³
(g) (ml) TOC³ % Carbonate TOC³ Carbonate
060105 /06
2 1.01 20.80 7.23 10.93 8.12
3 0.99 18.60 4.37 9.95 4.86
5 1.00 41.40 1.56 21.94 2.00
6 1.02 51.40 3.94 26.81 5.38
10 1.03 30.20 6.14 15.58 7.27
11 1.01 48.60 3.67 25.54 4.93
12 1.02 28.40 3.91 14.87 4.59
18 a 1.00 31.60 18.38 16.80 22.09
18 b 1.03 35.40 4.13 18.25 5.05
19 1.01 53.60 11.25 28.19 15.67
20 1.00 18.00 13.13 9.55 14.52
22 1.04 29.40 14.46 15.06 17.02
23 1.03 52.70 6.13 27.17 8.42
24 1.02 54.40 1.97 28.25 2.75
25 0.29 26.50 2.65 48.19 5.12
26 1.09 70.40 4.40 34.30 6.70
28 1.01 1.20 16.92 0.63 17.03
29 1.08 10.50 4.96 5.15 5.23

P a g e | 46
30 1.01 40.10 11.11 21.07 14.08
31 1.01 52.80 13.08 27.91 18.15
32 1.01 0.00 19.30 0.00 19.30
33 1.01 0.00 26.06 0.00 26.06
34 1.03 4.30 16.93 2.21 17.32
35 0.99 0.40 24.48 0.21 24.53
36/1 0.63 68.60 1.98 57.88 4.70
36/2 0.54 60.60 2.68 59.79 6.66
37 1.00 20.60 5.36 10.97 6.02
38 1.01 32.20 4.81 16.92 5.79
40 1.04 16.70 4.75 8.54 5.20
41 1.03 0.50 0.90 0.26 0.90
42 1.07 0.30 1.99 0.15 2.00
43 1.09 0.40 3.43 0.20 3.43
45 1.03 0.40 3.23 0.21 3.24
47 0.99 0.60 8.96 0.32 8.99
48 1.04 1.20 4.70 0.61 4.73
49 1.01 1.10 2.13 0.58 2.14
50 1.04 0.00 3.09 0.00 3.09
52 1.01 40.80 4.09 21.44 5.21
53 0.70 7.50 3.49 5.72 3.70
55 1.01 9.00 7.50 4.74 7.87
56 0.91 5.00 6.75 2.92 6.95
57 1.06 15.00 2.26 7.51 2.45
58 0.99 25.60 7.23 13.73 8.38
59 1.07 24.50 9.01 12.17 10.26

P a g e | 47
60 0.51 43.40 2.56 45.14 4.67
61 1.10 37.90 16.68 18.33 20.42
62 1.01 8.00 24.72 4.20 25.80
22406/02
1 1.09 31.40 1.97 15.27 2.33
2 1.00 0.60 0.56 0.32 0.56
3 1.00 1.10 0.11 0.59 0.11
5 1.02 38.60 0.01 20.14 0.01
7 0.84 0.50 0.41 0.32 0.41
11 1.01 9.80 1.07 5.18 1.12
12 1.01 28.10 12.22 14.82 14.34
13 0.47 32.90 8.38 37.46 13.40
14 1.01 38.20 9.27 20.06 11.60
15 1.02 46.60 9.47 24.40 12.53
16 1.00 21.00 11.01 11.13 12.39
17 1.05 34.80 10.05 17.67 12.21
18 1.03 51.40 6.10 26.57 8.30
20 1.01 48.30 9.76 25.51 13.10
21 1.00 30.40 9.89 16.13 11.80
22 1.01 40.30 11.68 21.22 14.83
23 1.01 62.40 5.78 32.96 8.62
24 1.00 65.00 7.48 34.51 11.42
25 0.49 44.00 4.23 48.18 8.16
26 0.46 40.40 2.58 46.53 4.83
27 1.10 61.00 10.29 29.50 14.59
30 1.03 28.40 11.95 14.70 14.01

P a g e | 48
31 1.07 7.20 14.69 3.58 15.23
32 1.08 1.60 14.12 0.79 14.23
33 1.08 38.10 9.39 18.84 11.57
34 1.08 56.40 12.42 27.84 17.21
35 1.08 40.90 13.20 20.18 16.54
36 1.08 75.40 8.93 36.99 14.17
37 1.06 39.40 13.13 19.69 16.34
38 1.02 42.20 15.71 22.05 20.15
39 1.04 46.70 13.09 23.99 17.23
40 0.52 13.80 15.65 14.05 18.21
41 1.07 61.30 7.64 30.56 11.00
42 1.04 32.70 16.52 16.80 19.85
43 1.05 48.40 13.76 24.49 18.22
44 1.07 1.20 16.15 0.59 16.24
45 1.00 2.00 15.58 1.06 15.75
46 1.04 2.80 21.42 1.43 21.73
47 1.01 18.20 22.52 9.59 24.91
48 1.03 31.40 20.56 16.14 24.51
49 1.07 44.30 16.71 22.06 21.44
50 1.07 36.60 10.79 18.13 13.17
50 B 1.10 21.00 12.51 10.16 13.92
50C 1.00 36.20 6.41 19.24 7.94
51 1.05 64.00 6.66 32.54 9.88
52a 1.03 1.20 17.40 0.62 17.51
52b 1.03 1.20 19.02 0.62 19.14
53 1.05 26.80 17.70 13.60 20.48

P a g e | 49
64 1.07 14.80 20.17 7.37 21.77
100 0.51 0.60 0.30 0.63 0.30
102 0.58 0.80 0.17 0.73 0.17
SA2-1
1 0.32 0.25 0.02 0.41 0.02
3 0.18 0.10 0.02 0.29 0.02
MANCOS
1 0.20 0.60 2.61 1.64 2.66
3 0.20 0.62 2.238 1.69 2.28
¹ Ethylene Glycol Monoethyl Ether (EGME)
² Mineral Surface Area (MSA)
³ Total Organic Carbon (TOC)

P a g e | 50
FIGURES
Figure 1
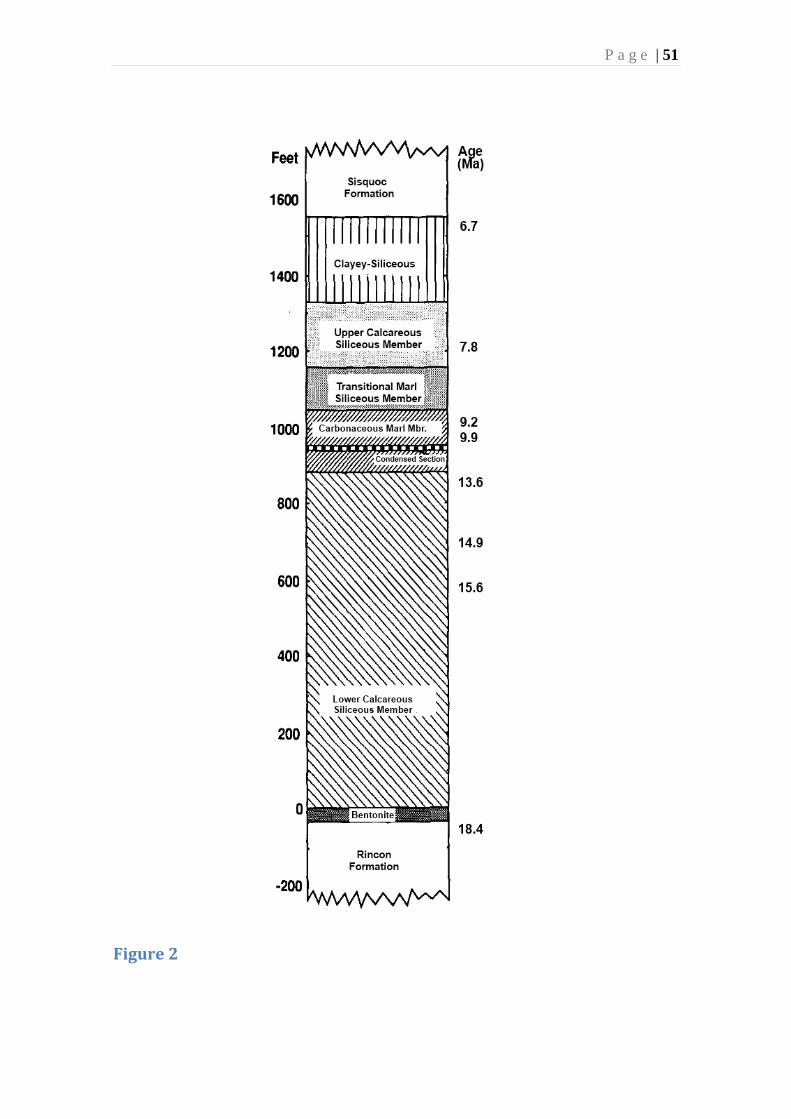
P a g e | 51
Figure 2

P a g e | 52
Figure 3

P a g e | 53
R² = 0.8509
0
5
10
15
20
25
30
35
0 100 200 300 400 500 600
% T
ota
l Org
anic
Car
bo
n o
f si
licla
stic
fra
ctio
n
Mineral Surface Area-CO₃ dilution (m²/g¹)
R² = 0.5323
0
5
10
15
20
25
30
35
0 100 200 300 400 500 600
% T
ota
l Org
anic
Car
bo
n o
f s
ilicl
asti
c fr
acti
on
Mineral Surface Area-CO₃ dilution (m²/g¹)
R² = 0.0276
0
5
10
15
20
25
30
35
0 100 200 300 400 500 600
% T
ota
l Org
anic
Car
bo
n o
f si
licla
stic
fr
acti
on
Figure 4
a)
b)
c)
Mineral Surface Area-CO₃ dilution (m²/g¹)

P a g e | 54
Figure 5
R² = 0.6617
R² = 0.8153
R² = 0.9713
0
5
10
15
20
25
30
35
0 100 200 300 400 500 600 700 800 900
% T
ota
l Org
anic
Car
bo
n o
f s
ilicl
asti
c fr
acti
on
Mineral Surface Area-CO₃ dilution (m²/g¹)
laminated mudstone
nodular mudstone
phosphatic mudstone
carbonate cemented
clay shale
ash
porcelanite
standard monolayer

P a g e | 55
Figure 6
R² = 0.6617
R² = 0.8153
0
5
10
15
20
25
30
35
0 100 200 300 400 500 600 700 800 900
% T
ota
l Org
anic
Car
bo
n o
f s
ilicl
asti
c fr
acti
on
Mineral Surface Area-CO₃ dilution (m²/g¹)
laminated mudstone
carbonate cemented
ash
porcelanite
standard monolayer

P a g e | 56
Figure 7
R² = 0.5927R² = 0.7863
R² = 0.9713
0
5
10
15
20
25
30
35
0 100 200 300 400 500 600 700 800 900
% T
ota
l Org
anic
Car
bo
n o
f si
licla
stic
fra
ctio
n
Mineral Surface Area-CO₃ dilution (m²/g¹)
nodular mudstone
phosphatic mudstone
clay shale
ash
porcelanite
standard monolayer

P a g e | 57
Figure 8
R² = 0.3388
0
50
100
150
200
250
300
0 50 100 150 200 250 300 350
Surf
ace
Are
a, O
rgan
ic M
atte
r re
mo
ved
(m
²/g
¹)
Surface Area, Untreated (m²/g¹)

P a g e | 58
Figure 9
a) b) c)
d)

P a g e | 59
Figure 10
Seasonal Interglacial Warm
Wet Glacial Cool
Low (cold)
High (warm)
Carbon Burial

P a g e | 60
Figure 11
a) b)
d)
c)
Mineral Surface Area (m²/g¹)
Total Organic Carbon
(%)
Monolayer Equivalent Line A
B

P a g e | 61
Figure 12

P a g e | 62
Figure 13
A B C
D
Mineral Surface Area (m²/g¹)
Total Organic Carbon
(%)