mechanism of the growth-related activation of the low ...tected until at least 4 h after growth...
TRANSCRIPT

THE JOURNAL OF BIOLOGICAL CHEMISTRY 0 1989 by The American Society for Biochemistry and Molecular Biology, Inc.
VOl. 264, No. 3, Issue of January 25, pp. 1787-1792,1989 Printed in U.S.A.
Mechanism of the Growth-related Activation of the Low Density Lipoprotein Receptor Pathway*
(Received for publication, January 4, 1988)
Theodore Mazzone$#llII, Khaja BasheeruddinSlI, Liang Pingll**, Sarah Frazerll, and Godfrey S. Getz#**SSll From the $.Department of Medicine, Michael Reese Hospital and the Departments of §Medicine, **Pathology, $$Biochemistry and Molecular Biology, and the !Specialized Center of Research in Atherosclerosis, University of Chicago, Chicago, Illinois 60637
Growth activation of quiescent cells leads to en- hanced low density lipoprotein (LDL) receptor expres- sion at the cell surface. To determine the basis for this stimulated receptor activity, we measured LDL recep- tor activity, changes in receptor protein mass, and mRNA abundance in quiescent and growth-activated cultured human skin fibroblasts. Growth activation, using insulin or platelet-derived growth factor, led to dose-dependent increases in cellular LDL receptor mRNA level (average 5.2-fold increase at 10 ng/ml platelet-derived growth factor, 4.1-fold increase at 58 ng/ml insulin) and cell surface expression (average 3.5- fold increase at 10 ng/ml platelet-derived growth fac- tor, 2.5-fold increase at 58 ng/ml insulin). Increased LDL receptor mRNA levels could be detected as early as 2 h after addition of growth factor (3.2-fold), whereas increased levels of LDL receptor binding and mass were not detected until after 4-8 h. Growth ac- tivation led to induction of LDL receptor gene tran- scription, and the increase of LDL receptor mRNA produced by addition of growth factor was completely prevented by actinomycin D. These observations indi- cate that growth-related activation of the LDL recep- tor pathway is accounted for, primarily, by growth- activated enhancement of LDL receptor gene tran- scription.
The low density lipoprotein (LDL)’ receptor is a widely distributed cellular endocytic receptor that functions to inter- nalize cholesterol-containing LDL particles (1, 2). Lipopro- tein cholesterol that is internalized via this receptor is re- quired for optimal cell growth in culture (3) and may serve to provide cholesterol for synthesis of new plasma membrane, which contains the largest portion of cellular cholesterol (4). The function of this receptor is negatively regulated by cel- lular cholesterol content (1, 5, 6). Thus, sterol enrichment of cells has been shown to depress LDL receptor expression at the cell surface (as measured by lZ5I-LDL binding) and to decrease the cellular level of LDL receptor mRNA. On the other hand, cholesterol depletion of cells using lipoprotein-
* This work was supported by Grant HL 15062 from the National Institutes of Health. The costs of publication of this article were defrayed in part by the payment of page charges. This article must therefore be hereby marked “advertisement” in accordance with 18 U.S.C. Section 1734 solely to indicate this fact.
11 To whom correspondence should be addressed Michael Reese Hospital, 31st. and Lake Shore Dr., Chicago, IL 60616.
The abbreviations used are: LDL, low density lipoprotein; PDGF, platelet-derived growth factor; DMEM, Dulbecco’s modified Eagle’s medium; Hepes, 4-(2-hydroxyethyl)-l-piperazineethanesulfonic acid; bp, base pair.
deficient serum or human high density lipoprotein-3 (both of which promote cholesterol efflux from cells) enhances LDL receptor expression. Growth stimuli such as insulin and plate- let-derived growth factor also augment LDL receptor activity in fibroblasts and arterial smooth muscle cells (7-9). Analysis of binding kinetics has provided indirect evidence that this enhancement of LDL receptor activity is due to an increase in the number of LDL receptors at the cell surface. The mechanism for this increase has not been reported, but it has been shown for other proteins that the net positive effect of insulin on protein levels is due to combined inhibition of protein degradation and stimulation of protein synthesis (10- 12). The latter effect for certain proteins may result from regulation at a translational level where insulin increases the rate of peptide chain initiation (13). For other proteins, in- sulin induction of protein synthesis occurs via increases in relevant mRNA species (14). Likewise, growth activation of quiescent cells with serum has been shown to positively mod- ulate synthesis of certain proteins by modulating cognate mRNA species, whereas other proteins are stimulated only at the translational level (15).
In this study, we probe the mechanisms for humoral en- hancement of LDL receptor activity. We report that growth activation of quiescent human skin fibroblasts leads to en- hanced LDL receptor gene transcription. In addition, actino- mycin D completely abolishes growth-related increases in LDL receptor mRNA. Increased levels of LDL receptor mRNA can be detected as early as 2 h after addition of growth factor. Increased LDL receptor mass or activity are not de- tected until at least 4 h after growth factor addition. These data indicate that the growth-related activation of the LDL receptor pathway occurs primarily at a transcriptional locus.
MATERIALS AND METHODS
Cell Culture-Human skin fibroblasts were grown from explants of penile foreskin as previously described (16). Cells were used be- tween the 7th and 18th subculture. Subcultured cells were fed twice weekly with 10% fetal bovine serum in DMEM. Cells were plated at 5 X lo4 per 35-mm dish or 5 X lo5 per 75-cm2 flask. After 6 days cells were confluent at 3-4 X lo6 per 35-mm dish and 3-4 X IO6 per 75- cm2 flask. In some experiments, cells were preincubated in 1% pooled human lipoprotein-deficient plasma-derived serum. The efficacy of such incubations in establishing quiescence was confirmed by the observation that subconfluent cells incubated in 1% lipoprotein- deficient plasma-derived serum showed no increase in cell number or protein over 3 days, whereas identically plated cells grown in 10% fetal bovine serum showed a doubling of both parameters. In addition, cells incubated in 1% lipoprotein-deficient plasma-derived serum incorporated 4.7 +- 0.5 X lo3 dpm/106 cells of [3H]thymidine into DNA, which is similar to levels of incorporation reported in other studies of quiescent fibroblasts (17). Plasma-derived serum was pre- pared as described by Kazlauskas and DiCorleto (18) and lipoproteins were removed by ultracentrifugation in potassium bromide (d = 1.215 g/ml) as previously described (16). Partially purified PDGF (19) was
1787

1788 Growth Activation of the LDL Receptor Pathway provided by E. Raines and R. Ross (University of Washington, Seattle, WA). The PDGF content of these preparations was deter- mined by radioreceptor assay (19) and this information was used to
body to PDGF inhibits 100% of the mitogenic activity of these PDGF calculate PDGF concentration in culture media. A polyclonal anti-
preparations.' Lipoproteins-Human blood was drawn into EDTA-containing
syringes (final concentration 1.5 mg/ml). After removal of red blood cells, phenylmethylsulfonyl fluoride (10 p ~ ) and Trasylol (10 rg/ml) were added and LDL (d = 1.019-1.063 g/ml) was isolated by sequen- tial ultracentrifugation in potassium bromide (16). Lipoprotein frac- tions were dialyzed into 1 mM EDTA in phosphate-buffered saline and stored sterilely at 4 "C under nitrogen. Lipoprotein fractions were checked for purity by agarose gel electrophoresis, and appropriate apoprotein composition was confirmed by sodium dodecyl sulfate- polyacrylamide gel electrophoresis (20). LDL was iodinated with lZ5I by the iodine monochloride method as modified for lipoproteins to yield specific activities of 80-210 cpm/ng of LDL protein (21). Radio- activity in LDL tracer preparations was >96% precipitable in 10% trichloroacetic acid.
LDL Receptor Binding and Mass Measurements-Binding of lZ5I- LDL to fibroblast monolayers was measured using displacement by dextran sulfate as described by Goldstein and Brown (22) except that preincubations prior to chilling cells to 4 "C were performed as described in the figure legends. lZ6I-LDL was added to cells at a concentration of 5 pg of LDL proteinlml, plus or minus a 100-fold excess of unlabeled LDL. The binding of iodinated ligand which occurred in the presence of 100-fold excess of unlabeled LDL was subtracted from total binding to give a measure of high affinity receptor binding. Measurement of '"I-LDL binding provides a meas- ure of active cell surface receptors and not total cell receptor mass. Binding data were calculated as nanograms of ligand bound per milligram of cell protein.
LDL receptor mass was assayed by Western blot and slot blot hybridization. Fibroblasts were scraped into a buffer containing 10 mM Hepes (pH 7.4), 2.5 mM MgC12, 200 mM NaC1, 2 mM CaC12, 0.5 mM phenylmethylsulfonyl fluoride, 0.5 mg/ml leupeptin, 15 mg/ml soybean trypsin inhibitor, and 40 mM octyl glucoside. After 10 min at 4 "C, cell extracts were spun at 100,000 X g for 20 min and the supernatant was recovered for measurement of protein. For Western blotting, electrophoresis and transfer to nitrocellulose were performed as described by Beisiegel et al. (23). After transfer, nitrocellulose was incubated for 1 h at room temperature in blocking buffer (10 mM Tris-HCl (pH 8), 50 mM NaCl, 2 mM CaC12, 1% non-fat dry milk) and then washed quickly in reaction buffer (1% non-fat dry milk in phosphate-buffered saline). Filters were then incubated for 2 h at room temperature in this buffer containing 1 pl/ml rabbit antisera prepared against LDL receptor purified from bovine adrenal cortex (24). Following this incubation, nitrocellulose was washed three times for 15 min each in reaction buffer and again incubated in this buffer containing 0.4 ml of '"I-protein A (Du Pont, 133 pCi/ml, 8.3 pCi/ mg) for 2 h at room temperature. Filters were then washed quickly five times with reaction buffer and two times with phosphate-buffered saline, and dried for autoradiography. For slot blots, 50, 25, 12.5, and 6.25 pg of cell extract protein was applied to nitrocellulose paper using a slot blot apparatus and the filters were processed as described above. Autoradiograms of slot blots were quantitated as described for slot blot mRNA analyses.
LDL Receptor mRNA Measurements-For quantitation of LDL receptor mRNA, total cellular RNA was extracted in guanidine thi- ocyanate as previously described (20). Radiolabeled LDL receptor cDNA probe was prepared by random primed synthesis (25) and was hybridized to cellular RNA immobilized on nitrocellulose paper (20). Clone pLDL-RP/HHl is a 1919-base pair BamHI subfragment of the 5.3-kilobase pair cDNA clone for the human LDL receptor (5) cloned into pSP64 and was generously provided by Dr. David Russell (Uni- versity of Texas Health Science Center, Dallas, TX). A range of cellular RNA concentrations was applied to nitrocellulose using a slot blot apparatus (Schleicher & Schuell) to yield a linear response of hybridization signal with RNA load. Autoradiographs of the slot blot hybridizations were quantitated by scanning densitometry or by measuring the optical density at 500 nm of autoradiographic silver grains which were eluted in NaOH and resuspended in 30% glycerol (20). Film exposures of varying duration were quantitated to ensure linearity of film response to the hybridization signal. Changes in the slope of lines generated by either quantitation method reflect relative
' E. Raines, personal communication.
changes in LDL receptor mRNA abundance. For Northern blot hybridization, electrophoresis and transfer were performed as de- scribed by Maniatis et al. (26) and hybridization was performed as previously described (20).
described above except that this probe was radiolabeled by nick Experiments using a human 0-actin probe were performed as
translation (20). The @actin cDNA clone has been previously de- scribed (27).
Run-on Transcription Assay-Human skin fibroblast nuclei were
by Greenberg and Ziff (28) except that the reaction buffer contained isolated and nuclear run-on transcription was performed as described
10 mM MgC12, 1 mM MnC12, 6.7 mM creatine phosphate, and 1 mM ATP. Newly generated transcripts were isolated as described by Groudine et al. (29). In three experiments, final counts in isolated transcripts averaged 1 cpm/nucleus. Equal numbers of counts/minute from labeled transcripts were hybridized to 3 pg of linearized cDNA for the human LDL receptor (pLDL-RP/HHl) as described by Bren- ner and Chojkier (30). Dried nitrocellulose filters were exposed to x- ray film for 3-7 days.
Other Assays-DNA synthesis was measured as the incorporation of [3H]thymidine (2.5 pCi/ml) into DNA during a 2-h pulse (16). Protein determinations were performed by the method of Lowry et al. (31) using bovine serum albumin as standard.
RESULTS
The addition of biosynthetic human insulin, in doses rang- ing from 0.58 to 58 ng/ml, led to enhanced DNA synthesis (24,982 & 3,411 uersus 74,201 f 10,700 dpm [3H]thymidine incorporated into DNA per milligram of cell protein) and LDL receptor expression in cultured fibroblasts (Fig. lA). Enhanced LDL receptor binding at the cell surface reflected the increased abundance of LDL receptor mRNA species (Fig. 1B). The increased DNA synthesis in response to insulin demonstrates that biosynthetic human insulin, at the concen- trations used, acts as a mitogen for cultured human skin fibroblasts. This observation is in accord with observations by Conover et al. (32), demonstrating increased human skin fibroblast thymidine incorporation and cell number in re- sponse to similar insulin concentrations.
Growth activation using partially purified PDGF likewise augmented DNA synthesis (24,672 f 5,958 versus 475,275 f 73,133 dpm/mg), LDL receptor expression, and mRNA abun- dance in human fibroblasts (Fig. 2, A and B ) . Relative changes in mRNA abundance exceeded changes in LDL receptor activity when compared over similar dose ranges for both insulin and PDGF. For example, from 0 to 58 ng/ml insulin there is a 4.5-fold increase in LDL receptor mRNA abundance but a 2.5-fold increase in LDL receptor cell surface expression. Comparing 2 ng/ml PDGF (the lowest concentration used in Fig. 2B) to 10 ng/ml PDGF, LDL receptor mRNA increases 3.7-fold, whereas binding increases 1.7-fold. These observa- tions suggest that stimulation of LDL receptor activity by these two growth-promoting agents is accomplished predom- inantly at pretranslational levels. In three separate experi- ments similar to the one presented in Fig. lB, 58 ng/ml insulin produced an average 4.1-fold increase in LDL receptor mRNA. In two additional experiments similar to that shown in Fig. 2B, PDGF at 10 ng/ml led to an average 5.2-fold increase in LDL receptor mRNA levels compared with cells incubated in serum-free medium alone. Wells incubated with 58 ng/ml insulin contained 18% more cell protein compared with control wells. PDGF (10 ng/ml)-containing wells showed a 26% increase in protein content, which is the largest increase we observed under our experimental conditions.
Fig. 3 provides time course information on PDGF induction of the LDL receptor pathway. Increased relative abundance of LDL receptor mRNA (Fig. 3, A and B ) can be detected as early as 2 h after PDGF addition (3.2-fold). This increase precedes, by several hours, detectable increases in LDL recep- tor mass (Fig. 3C) or activity (Fig. 30) . LDL receptor protein

Growth Activation of the LDL Receptor Pathway 1789
A “1
‘1 I
I I I I
11.6 23.2 34.8 46.4 58.0
Insulin (ng/ml)
B
0.30
Slope Control 0.01 12
A Insulin 11.6nglml 0.0361
// o Insulin 58.0nglml 0.0501 Insulin 29.0nglml 0.041 1
~
0 0 In
0 n
0.25
0.20
0.15
0.10
0.05
2.0 4.0 6.0 8.0 10.0
RNA ( p g )
FIG. 1. Insulin stimulation of LDL receptor expression. Hu- man skin fibroblasts were incubated in 0.2% bovine serum albumin in DMEM containing the indicated concentration of biosynthetic human insulin for 18 h. A t that time, measurements of LDL receptor activity ( A ) or LDL receptor mRNA abundance ( B ) , as described under “Materials and Methods,” were performed. The data shown in B were quantitated by elution of silver grains as described in the text; LDL binding is reported as the mean f S.D. of triplicate measure- ments. R values for the lines in B are: control, 0.97; insulin, 0.96 (11.6 ng/ml); 0.99 (29.0 ng/ml), and 0.99 (58.0 ng/ml).
(Fig. 3C) is unchanged in control and PDGF-treated cultures 1, 2, and 4 h after addition of PDGF. PDGF-treated cells demonstrate a 2.7- and 4.5-fold increase in LDL receptor protein at 8 and 16 h, respectively. LDL receptor cell surface activity (binding) did not change for at least 6 h after PDGF addition. At 24 h, a 3.2-fold increase in LDL receptor binding is noted.
Fig. 4 shows autoradiographs of Northern (Fig. 4A) and Western blot (Fig. 423) transfers performed on extracts from control and PDGF-treated fibroblasts. Each autoradiogram is representative of three separate analyses done on extracts from three separate experiments which show similar results. In each case, a single band of appropriate size is detected by the LDL receptor cDNA (Fig. 4A) or antisera (Fig. 423). Also in each case, the degree of induction observed after PDGF stimulation is appropriate when compared with that observed by slot blot analysis.
To examine the events accounting for PDGF induction of mRNA levels, nuclear run-on transcription analysis was per- formed on control and PDGF-treated cells (Fig. 5A). Relative transcription rates were increased by PDGF addition at 1 and 2 h. Fig. 5B shows that inhibition of new transcription using actinomycin D at 5 pg/ml (a dose which inhibited >95% incorporation of [14C]uridine into RNA) completely prevents PDGF stimulation of LDL receptor mRNA levels at 3 h.
Experiments probing RNA from growing and quiescent
0 0
a“ 0
q 10
PDGF Ing/mll
RNA lug1
FIG. 2. PDGF stimulation of LDL receptor expression. Fi- broblasts were incubated for 48 h in DMEM containing 1% lipopro- tein-deficient plasma-derived serum. Cultures were washed four times with serum-free medium and incubated for another 18 h in serum- free medium containing the indicated concentrations of PDGF. At that time, LDL receptor activity ( A ) and mRNA abundance ( B ) were quantitated as described in the legend to Fig. 1. Points shown for mRNA measurements in PDGF at 10 ng/ml represent analysis of RNA pooled from two separate flasks. R values for lines in B are PDGF, 0.99 (2 ng/ml), 0.92 (5 ng/ml), and 0.99 (10 ng/ml).
fibroblasts with a labeled cDNA for human P-actin indicated that insulin, at 18 h, had no effect on P-actin mRNA levels, whereas PDGF increased these levels, as has been reported by others (28) (not shown).
DISCUSSION
In animal cells the pathways for internalization of choles- terol, via the LDL receptor, and synthesis of endogenous cholesterol are regulated in an integrated fashion to preserve cell cholesterol content (33). Cholesterol depletion enhances whereas cholesterol repletion suppresses the activity of each of these pathways. Activation of growth in quiescent cells also stimulates lipoprotein cholesterol internalization and choles- terol synthesis (7, 8). The importance of this growth-related enhancement of the LDL receptor pathway is demonstrated by the observation that cells fail to respond optimally to mitogens in absence of cholesterol-containing lipoproteins (3, 34).
Russell and co-workers (5, 6) have demonstrated that in- creased LDL receptor activity at the cell surface after cellular cholesterol depletion occurs via induction of its cognate
1790 Growth Activation of the LDL Receptor Pathway
O W 5 1 00102 00328
%?re
uu 2h 2h
Control PDGF
+LDL Receptor Stondord
Control PDGF 16h 16h
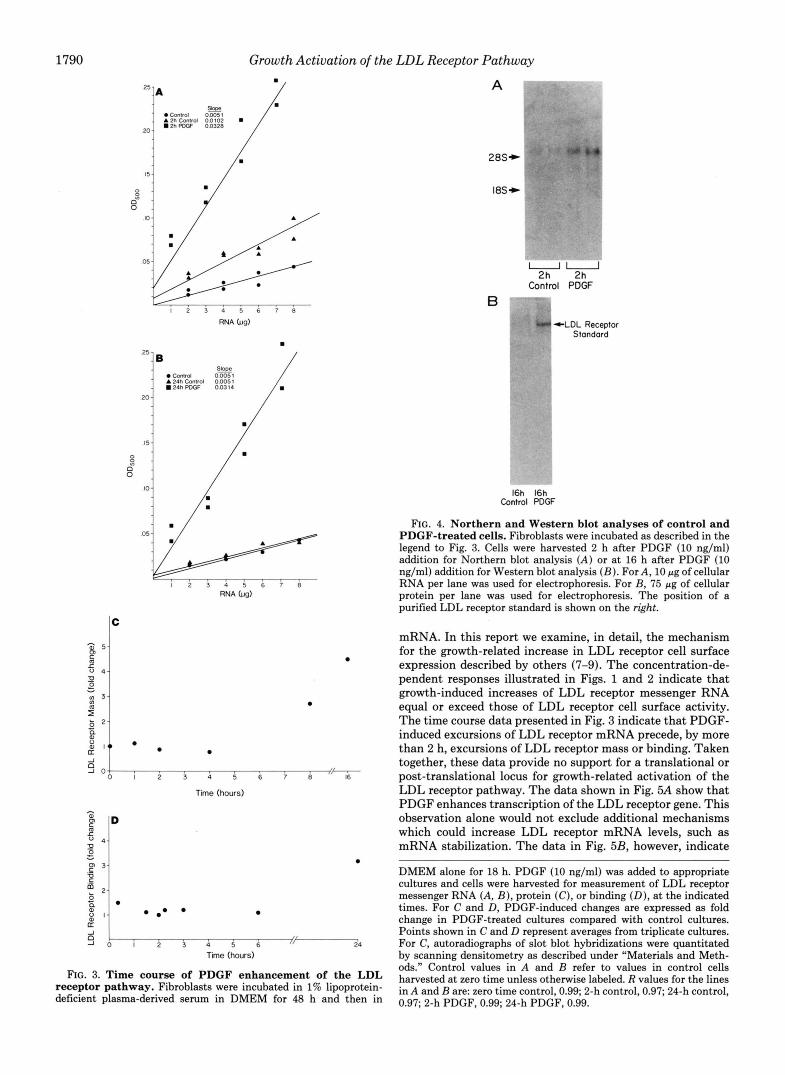
FIG. 4. Northern and Western blot analyses of control and PDGF-treated cells. Fibroblasts were incubated as described in the legend to Fig. 3. Cells were harvested 2 h after PDGF (10 ng/ml) addition for Northern blot analysis ( A ) or at 16 h after PDGF (10 ng/ml) addition for Western blot analysis (B) . For A, 10 pg of cellular RNA per lane was used for electrophoresis. For B, 75 pg of cellular protein per lane was used for electrophoresis. The position of a purified LDL receptor standard is shown on the right.
IC 8
8
8 8
8
8
-I
s b i i i i i a // 24
Tine (hours)
FIG. 3. Time course of PDGF enhancement of the LDL receptor pathway. Fibroblasts were incubated in 1% lipoprotein- deficient plasma-derived serum in DMEM for 48 h and then in
mRNA. In this report we examine, in detail, the mechanism for the growth-related increase in LDL receptor cell surface expression described by others (7-9). The concentration-de- pendent responses illustrated in Figs. 1 and 2 indicate that growth-induced increases of LDL receptor messenger RNA equal or exceed those of LDL receptor cell surface activity. The time course data presented in Fig. 3 indicate that PDGF- induced excursions of LDL receptor mRNA precede, by more than 2 h, excursions of LDL receptor mass or binding. Taken together, these data provide no support for a translational or post-translational locus for growth-related activation of the LDL receptor pathway. The data shown in Fig. 5A show that PDGF enhances transcription of the LDL receptor gene. This observation alone would not exclude additional mechanisms which could increase LDL receptor mRNA levels, such as mRNA stabilization. The data in Fig. 5B, however, indicate
DMEM alone for 18 h. PDGF (10 ng/ml) was added to appropriate cultures and cells were harvested for measurement of LDL receptor messenger RNA (A, B ) , protein ( C ) , or binding (D), at the indicated times. For C and D, PDGF-induced changes are expressed as fold change in PDGF-treated cultures compared with control cultures. Points shown in C and D represent averages from triplicate cultures. For C, autoradiographs of slot blot hybridizations were quantitated by scanning densitometry as described under “Materials and Meth- ods.” Control values in A and B refer to values in control cells harvested at zero time unless otherwise labeled. R values for the lines in A and B are: zero time control, 0.99; 2-h control, 0.97; 24-h control, 0.97; 2-h PDGF, 0.99; 24-h PDGF, 0.99.

A I h 2h Control PDGF Control PDGF
The mechanism by which LDL receptor gene transcription is facilitated by growth activation remains to be determined. Whether or not the promoter regulatory sequences responsi- ble for enhanced transcription after growth initiation are
L D L R
i
t
encompassed within previously defined regulatory sequences will reauire further detailed exDerimentation. As noted me-
FIG. 5. Role of LDL receptor gene transcription in media- ting PDGF effect on mRNA level. Fibroblasts were incubated as described in the legend to Fig. 3. PDGF was added to appropriate cultures and cells were harvested at the indicated time for run-on transcription ( A ) or mRNA measurement ( B ) . R values for the lines shown in B are: control, 0.83; actinomycin D, 0.98; PDGF, 0.94; PDGF + actinomycin D, 0.97. Each time point in A represents measurements made on nuclei prepared from cells grown in two separate experiments.
that, in the absence of ongoing transcription, PDGF induction of the LDL receptor mRNA is completely lost. We believe that a synthesis of the data presented in this manuscript makes it most likelv that erowth-related increases of LDL - receptor activity are accounted for primarily by regulation of LDL receDtor gene transcrbtion.
A number of recent publications have examined regulatory sequences from the LDL receptor gene promoter in detail (35-37). Data obtained from stable transfection experiments utilizing portions of the human LDL receptor promoter fused to the bacterial chloramphenicol acetyltransferase gene iden-
"
tified a 177-bp sequence which extends 144 bp upstream from the major transcription initiation site as the most important sequence for LDL receptor gene basal expression and sterol regulation. Within this sequence there are three imperfect repeats, each 16 bp long, which are particularly important for expression and end-product repression by sterol. Repeats 2 and 3, which are located adjacent to each other with their 5' end at -68, have been studied in great detail using a hybrid promoter containing a 42-bp sequence from the LDL receptor promoter (which encompasses these repeats) inserted imme- diately upstream of the TATA box (position 32) in the HSV- T K gene promoter. Studies using this hybrid promoter fused to chloramphenicol acetyltransferase structural sequences have shown that repeat 3 is a strong constitutive positive transcription element which binds purified Spl. Repeat 2 is responsible for strongly suppressing repeat 3 when sterols are present.
viously, growth activation not only leads to increased LDL receptor expression, but also to increased endogenous choles- terol synthesis. This observation, taken together with the data indicating that lipoprotein cholesterol is required for optimal cell growth after mitogenic stimulation, strongly sug- gests that cell growth imposes an increased cellular require- ment for cholesterol. This increased need for cholesterol (to be used, for example, for new membrane synthesis) may release sterol-mediated remession of the LDL receDtor Dro- moter and thereby account for enhanced transcription. This hypothesis requires that common sequences would transduce the regulatory activity of sterols and growth on the LDL receptor promoter. An alternative hypothesis would suggest that growth-enhanced LDL receptor gene transcription oc- curs, a t least partially, independent of changes in cell choles- terol homeostasis. An example of the latter situation applies to the humoral regulation of steroidogenesis and LDL receptor expression in ovarian granulosa cells. In these cells Golos and
"
Strauss (38) have shown that gonadotrophin enhancement of LDL receptor synthesis occurs even when normally suppres- sive concentrations of 25-hydroxycholestero1 are included in the cell culture medium. Determining whether this model of
Growth Activation of the LDL Receptor Pathway 1791
- regulation applies to the mechanism for growth-related acti- vation of LDL receptor gene expression will require additional investigation.
Acknowledgments-We are grateful to Dr. David Russell for pro- viding the LDL receptor cDNA, to Dr. Elaine Fuchs for providing the @-actin cDNA, to Dr. Russell Ross and Elaine Raines for providing the platelet-derived growth factor preparations, to Eli Lilly & Co. for providing biosynthetic human insulin, to Cecelia Lopez for technical assistance, and to Lynn Pertum for typing the manuscript.
REFERENCES 1. Goldstein, J. L., and Brown, M. S. (1977) Annu. Rev. Biochem.
2. Schneider, W. J., Beisiegel, U., Goldstein, J. L., and Brown, M. S. (1982) J. Biol. Chem. 257,2664-2673
3. Libby, P., Miao, P., Ordovas, J. M., and Schaefer, E. J. (1985) J . Cell. Physiol. 124, 1-8
4. Lange, Y., and Ramos, B. V. (1983) J. Bioi. Chem. 2 5 8 , 15130- 15134
5. Yamamoto, T., Davis, C. G., Brown, M. S., Schneider, W. J., Casey, M. L., Goldstein, J. L., and Russel, D. W. (1984) Cell
6. Russell, D. W., Schneider, W. J., Yamamoto, T., Luskey, K. L., Brown, M. S., and Goldstein, J . L. (1984) Cell 37,577-585
7. Chait. A., Bierman, E. L.. and Alhers, J. J. (1977) J. Clin. Invest.
46,897-930
39,27-38
64,1309-1319 8. Chait. A.. Ross. R.. Albers. J. J.. and Bierman. E. L. (1980) Proc. . .
Natl. Acad. Sci. U. S. A.'77,4084-4088 '
(1982) J. Riol. Chem. 257,5392-5401
E. (1971) J. Biol. Chem. 246, 2163-2170
9. Witte, L. D., Cornicelli, J. A., Miller, R. W., and Goodman, D. S.
10. Morgan, H. E., Jefferson, L. S., Wolpert, E. B., and Rannels, D.
11. Jefferson, L. S., Li, J. B., and Rannels, S. R. (1977) J. Bioi. Chem.
12. Ballard, F. J., Wong, S. S. C., Knowles, S. E., Partridge, N. C., Martin, T. J., Wood, C. M., and Gunn, J. M. (1980) J. Cell. Physiol. 105, 335-346
13. Sato, F., Ignotz, G. G., Ignotz, R. A., Gander, T., Tsukada, K., and Lieherman, I. (1981) Biochemistry 20,5550-5556
14. Messina, J. L., Hamlin, J., and Larner, J . (1985) J. Biol. Chem.
15. Thomas, G., and Thomas, G . (1986) J. Cell Bioi. 103,2137-2144 16. Chait, A., and Mazzone, T. (1982) Arteriosclerosis 2 , 134-141
252, 1476-1483
260,16418-16423

1792 Growth Activation of the LDL Receptor Pathway 17. Fairbanks, K. P., Witte, L. D., and Goodman, D. S. (1984) J. 28. Greenberg, M. E., and Ziff, E. B. (1984) Nature 311,433-438
18. Kazlauskas, A., and DiCorleto, P. E. (1986) J. Cell. Physiol. 126, Biol. 1 , 281-288
19. Bowen-Pope, D. F., and Ross, R. (1985) Methods Enzymol. 109 , 262,17690-17695
20. Mazzone, T., Gump, H., Diller, P., and Getz, G. S. (1987) J. Biol. (1951) J. Biol. Chem. 153,265-275
21. Hirsch, L. J., and Mazzone, T. (1986) J. Clin. Znuest. 77, 485- Physiol. 122, 133-141
22. Goldstein, J. L., and Brown, M. S. (1983) Methods Enzymol. 98, 1461
23. Beisiegel, U., Schneider, W. J., Brown, M. S., and Goldstein, J. 7808-7818 L. (1982) J. Eiol. Chem. 257, 13150-13156 35. Sudhof, T. C., Russell, D. W., Brown, M. S., and Goldstein, J. L.
24. Schneider, W. J., Beisiegel, U., Goldstein, J. L., and Brown, M. (1987) Cell 48, 1061-1069 S. (1982) J. Biol. Chern. 257, 2664-2673 36. Sudhof, T. C., Van Der Westhuyzen, D. R., Goldstein, J. L.,
25. Fox, J. C., McGill, H. C., Carey, K. D., and Getz, G. S. (1987) J. Biol. Chem. 262,7014-7020
Brown, M. S., and Russel, D. W. (1987) J. Biol. Chem. 262,
26. Maniatis, T., Fritsch, E. F., and Sambrook, J. (1982) Molecular 37. Dawson, D. A., Hoffman, S. L., Van Der Westhuyzen, D. R., Cloning: A Laboratory Manual, pp. 202-203, Cold Spring Har- Sudhof, T. C., Brown, M. S., and Goldstein, J. L. (1988) J. Biol. bor Laboratory, Cold Spring Harbor, NY Chem. 263,3372-3379
27. Hanukoglu, I., Tanese, N., and Fuchs, E, (1983) J. Mol. Biol. 38. Golos, T. G., and Strauss, J. F. (1985) J. Biol. Chem. 260,14399- 163,673-678 14402
Bioi. Chem. 259, 1546-1551 29. Groudine, M., Peretz, M., and Weintraub, H. (1981) Mol. Cell.
225-236 30. Brenner, D. A,, and Chojkier, M. (1987) J. Biol. Chem.
69-100 31. Lowry, 0. H., Rosebrough, N. J., Farr, A. L., and Randall, R. J.
Chem. 262,11657-11662 32. Conover, C. A,, Hintz, R. L., and Rosenfeld, R. G. (1985) J. Cell.
490 33. Goldstein, J. L., and Brown, M. S. (1984) J. Lipid Res. 25,1450-
241-260 34. Cuthbert, J. A., and Lipsky, P. E. (1987) J. Biol. Chem. 262,
10773-10779