measuring the australian night time economy 2016 …...file name...
TRANSCRIPT
Measuring the Australian Night Time Economy 2016-17
A project for the Council of Capital City Lord Mayors
Prepared by the team at Ingenium Research
Enquiries about this document can be addressed to:
Andrew License / Anna Edwards / Terry Bevan
14 September 2018
Ingenium Research Pty Ltd.
Melbourne
Australia
Ingenium Research
Document Information
Prepared by Ingenium Research - September
2018
Document Information
Project reference number P18-02-01
File name P18-02-01_Measuring-the-Australian-NTE_2016-17_v15.docx
Title Measuring the Australian Night Time Economy 2016-17
Version number V15
Last update 14/09/18
Name of authors Andrew License, Anna Edwards
Name of reviewer Terry Bevan
Document status Public
Review status Complete
Approval status Final

Table of Contents
Prepared by Ingenium Research - September
2018
GLOSSARY OF TERMS ....................................................................................................................................... 4
1. THE AUSTRALIAN NTE .............................................................................................................................. 5
1.1. INTRODUCTION ............................................................................................................................................ 5
1.2. THE AUSTRALIAN NTE ................................................................................................................................ 5
1.3. THE AUSTRALIAN NTE IN THE STATES AND TERRITORIES .......................................................................... 7
2. THE NTE IN AUSTRALIAN CAPITAL TERRITORY (ACT) ...................................................................... 9
3. THE NTE IN NEW SOUTH WALES (NSW) ............................................................................................ 10
3.1. NSW: CITY OF NEWCASTLE ....................................................................................................................... 11
3.2. NSW: CITY OF PARRAMATTA ................................................................................................................... 12
3.3. NSW: CITY OF SYDNEY ............................................................................................................................. 13
4. THE NTE IN NORTHERN TERRITORY (NT) .......................................................................................... 14
4.1. NT: CITY OF DARWIN ................................................................................................................................ 15
5. THE NTE IN QUEENSLAND (QLD) ........................................................................................................ 16
5.1. QLD: BRISBANE CITY COUNCIL ................................................................................................................ 17
5.2. QLD: CITY OF GOLD COAST .................................................................................................................... 18
6. THE NTE IN SOUTH AUSTRALIA (SA) .................................................................................................. 19
6.1. SA: CITY OF ADELAIDE .............................................................................................................................. 20
7. THE NTE IN TASMANIA (TAS) ............................................................................................................... 21
7.1. TAS: CITY OF HOBART .............................................................................................................................. 22
8. THE NTE IN VICTORIA (VIC) .................................................................................................................. 23
8.1. VIC: CITY OF MELBOURNE ........................................................................................................................ 24
8.2. VIC: MAROONDAH CITY COUNCIL .......................................................................................................... 25
8.3. VIC: PORT PHILLIP CITY COUNCIL ........................................................................................................... 26
9. THE NTE IN WESTERN AUSTRALIA (WA) ............................................................................................ 27
9.1. WA: CITY OF PERTH .................................................................................................................................. 28
10. APPENDIX ................................................................................................................................................. 29
10.1. SOURCES .................................................................................................................................................... 29
10.2. METHODOLOGY ......................................................................................................................................... 29
10.3. CORE NTE SUB-SECTOR TABLES FOR STATES, TERRITORIES AND LGAS ................................................ 33
10.4. CORE NTE DENSITY RANKINGS ................................................................................................................. 40

Glossary of terms
P a g e | 4 Prepared by Ingenium Research - September
2018
Glossary of terms
This section lays out the key terms referred to in this report and their meaning.
Term Definition
Establishment(s) Actively trading business(es) recorded in the Australian Bureau of Statistics Business
Register (ABSBR) as at 30th June in the reporting year.
Employment The number of employees associated with the establishment(s).
Turnover ($m) The sales and service income generated by the establishment(s), exclusive of goods
and service tax (GST).
LGA
Local Government Area – usually a city council or shire area. Each section in this report
reviews the trend within the listed LGA. Please note that LGAs are not homogenous in
terms of population size, geographic scale or density of establishments, which can
make comparisons difficult.
LGSCN Local Government Safe Cities Network – a committee operated by the Council of
Capital Cities Lord Mayors (CCCLM).
NTE
Night Time Economy – economic activity which occurs at establishments primarily
between the hours of 6 p.m. and 6 a.m. The NTE can be broken down into Core, Non-
Core and Supply as per the table below.
Sector Description
Core NTE
The activities that provide primary establishment services to NTE leisure users in the
evening (6pm to midnight) and night-time (midnight to 6am). The Core NTE is split
into sub-sectors of Drink, Entertainment and Food.
Non-Core NTE
Establishments that primarily operate during the day but may provide integral services
to the Core NTE, such as public and private transport, hotels and other forms of
accommodation, retail services and public services such as policing, health services,
parking and lighting. These tend to be presented at a higher aggregated data level
due to availability of data at a more detailed level. Non-Core indicates the scale of the
supply chain with which the Core NTE is linked.
Supply NTE
As with Non-Core NTE these establishment types tend to operate during the day but
are part of the Core NTE supply chain through the production or wholesaling of food,
drink or entertainment products for resale. Similar to Non-Core NTE, these activities
are presented as an aggregate.
Non-NTE This refers to all the other economic activities outside the NTE definition.
Total Economy Refers to the sum of all economic activity within a defined geography.
Please note that within this document several charts present the trend in establishments, employment and
turnover in an indexed manner, so that the quantum of the figures is expressed such that the individual trends
can be compared. Figures are indexed to 2009 (with 2009 equal to 1.0) with performance in subsequent years
shown relative to this starting point.
The Australian NTE
P a g e | 5 Prepared by Ingenium Research - September
2018
1. The Australian NTE
1.1. Introduction
The Council of Capital City Lord Mayors (CCCLM) has developed a globally unique statistical tool which
captures the scale, diversity and direction of the development of local, state and federal Night Time Economy
(NTE) activity in Australia.
Consistency of local comparative performance measurement has been a hallmark of the approach of the
work commissioned by the Local Government Safe Cities Network (LGSCN1) over the last eight2 years and
these outcomes can be accessed by participating local government areas (LGAs) that sign up to the use of
CCCLM’s NTE Profiler tool.
In this latest iteration the scope of this tool has been extended beyond the current LGSCN members to
examine and evidence data for 88 LGAs3. This includes those LGAs that are among the top 21 growing cities
in Australia as well as a number of LGAs selected on the basis of their population or because they are known
to be working on their NTE strategy.
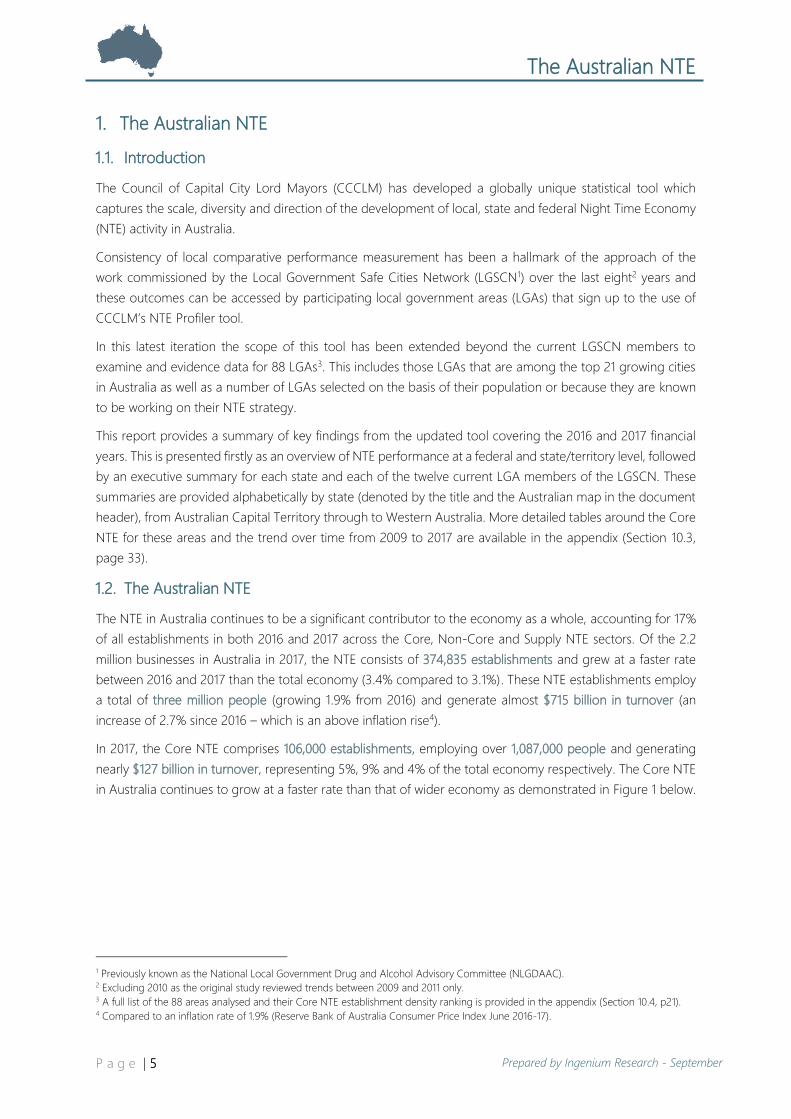
This report provides a summary of key findings from the updated tool covering the 2016 and 2017 financial
years. This is presented firstly as an overview of NTE performance at a federal and state/territory level, followed
by an executive summary for each state and each of the twelve current LGA members of the LGSCN. These
summaries are provided alphabetically by state (denoted by the title and the Australian map in the document
header), from Australian Capital Territory through to Western Australia. More detailed tables around the Core
NTE for these areas and the trend over time from 2009 to 2017 are available in the appendix (Section 10.3,
page 33).
1.2. The Australian NTE
The NTE in Australia continues to be a significant contributor to the economy as a whole, accounting for 17%
of all establishments in both 2016 and 2017 across the Core, Non-Core and Supply NTE sectors. Of the 2.2
million businesses in Australia in 2017, the NTE consists of 374,835 establishments and grew at a faster rate
between 2016 and 2017 than the total economy (3.4% compared to 3.1%). These NTE establishments employ
a total of three million people (growing 1.9% from 2016) and generate almost $715 billion in turnover (an
increase of 2.7% since 2016 – which is an above inflation rise4).
In 2017, the Core NTE comprises 106,000 establishments, employing over 1,087,000 people and generating
nearly $127 billion in turnover, representing 5%, 9% and 4% of the total economy respectively. The Core NTE
in Australia continues to grow at a faster rate than that of wider economy as demonstrated in Figure 1 below.
1 Previously known as the National Local Government Drug and Alcohol Advisory Committee (NLGDAAC). 2 Excluding 2010 as the original study reviewed trends between 2009 and 2011 only. 3 A full list of the 88 areas analysed and their Core NTE establishment density ranking is provided in the appendix (Section 10.4, p21). 4 Compared to an inflation rate of 1.9% (Reserve Bank of Australia Consumer Price Index June 2016-17).

The Australian NTE
P a g e | 6 Prepared by Ingenium Research - September
2018
Figure 1: Comparing establishments, employment and turnover ($m) in Australia – indexed to 2009
Source: Based on Australian Bureau of Statistics CABEE 2013-2017 dataset, Ref: WTS1/2_Aus
Between 2016 and 2017, Core NTE:
• establishments increased by 3.2% (compared to 3.1% in the wider economy),
• employment increased by 3.7% (compared to 2.1%) and
• turnover increased by 3.1%, which was slightly less than witnessed in the wider economy (3.5%).
Food establishments remain the key driver behind the Core NTE’s growth, accounting for over 67,000 (or
63%) of the sector in 2017. This share has grown consistently over the past eight years rising from 57% in 2009
to its peak in 2017. Drink and Entertainment establishments have also increased over the same period, albeit
at a slower rate compared to Food, leading to their share of Core NTE establishments declining. Despite this,
both Drink and Entertainment maintain a strong Core NTE market share in terms of turnover (15% and 33%
respectively), due to establishments in these sub-sectors having a higher average turnover per establishment
than those in Food.
Figure 2: Australia’s Core NTE split by sub-sector for establishments, employment and turnover ($m)
Source: Based on Australian Bureau of Statistics CABEE 2013-2017 dataset, Ref: WTS1/1_Aus

The Australian NTE
P a g e | 7 Prepared by Ingenium Research - September
2018
1.3. The Australian NTE in the states and territories
Of all the states and territories, New South Wales and Victoria are the largest contributors to the Australian
Core NTE across establishments (34% and 28% respectively), employment (30% and 25%) and turnover (30%
and 26%) as shown in Table 1. While New South Wales has the largest Core NTE, it has grown at a slower rate
than that of Australia across all the key metrics. All states have witnessed growth in their Core NTE, particularly
Victoria and Queensland who have grown at a quicker rate than the national average.
While the territories tend to have smaller NTEs, they look to be increasing their establishment base at a much
swifter rate, particularly the Australian Capital Territory, whose growth is matched in employment and
turnover. Conversely, Northern Territory has remained fairly static in terms of employment and is the only
area to witness a drop in its Core NTE turnover (-1.5%). Across the board it is clear the Core NTE continues to
be a growth sector with positive change occurring across nearly every measured factor.
Table 1: Core NTE by state/territory in 2017 with change from 2016-17
Source: Based on Australian Bureau of Statistics CABEE 2013-2017 dataset, Ref: WTS2/State_Core_NTE
This picture is slightly different when looking at the individual sub-sectors within the Core NTE, as shown in
Table 2, Table 3 and Table 4 over leaf.
As is the case with Australia as a whole, the Core NTE growth is primarily driven by the Food sub-sector, which
has witnessed establishment growth across every state and territory of between 3-5%. By comparison growth
in the Drink sub-sector is more modest in the larger states and has even declined in some areas, particularly
South Australia and Northern Territory. This is similar for Entertainment, where there has been relatively good
growth in establishments but modest growth in employment and turnover. Tasmania again shows the highest
increase in turnover within the Food and Entertainment sub-sectors. Its decline in Drinks turnover suggests a
transition with which establishments and employment have not yet fully processed.

The Australian NTE
P a g e | 8 Prepared by Ingenium Research - September
2018
Table 2: Drink by state/territory in 2017 with change from 2016-17
Table 3: Entertainment by state/territory in 2017 with change from 2016-17
Table 4: Food by state/territory in 2017 with change from 2016-17
Source: Based on Australian Bureau of Statistics CABEE 2013-2017 dataset, Ref: WTS2/State_Core_NTE
The NTE in Australian Capital Territory (ACT)
P a g e | 9 Prepared by Ingenium Research - September
2018
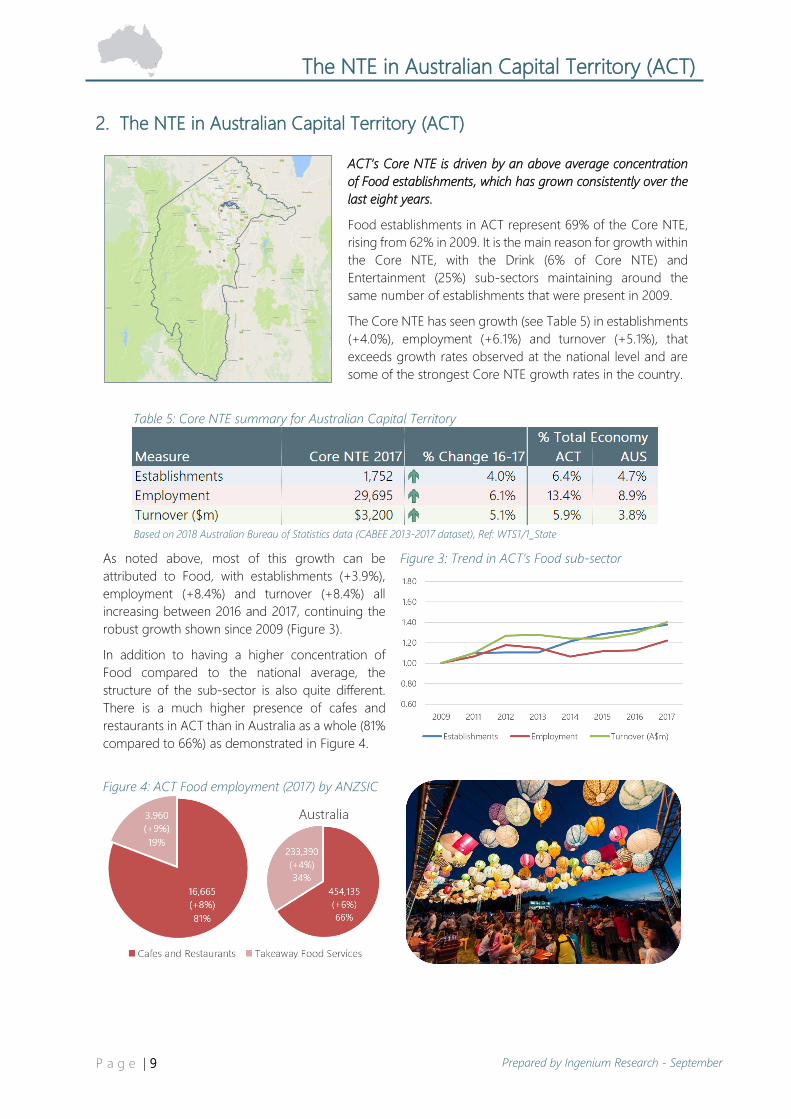
2. The NTE in Australian Capital Territory (ACT)
ACT’s Core NTE is driven by an above average concentration
of Food establishments, which has grown consistently over the
last eight years.
Food establishments in ACT represent 69% of the Core NTE,
rising from 62% in 2009. It is the main reason for growth within
the Core NTE, with the Drink (6% of Core NTE) and
Entertainment (25%) sub-sectors maintaining around the
same number of establishments that were present in 2009.
The Core NTE has seen growth (see Table 5) in establishments
(+4.0%), employment (+6.1%) and turnover (+5.1%), that
exceeds growth rates observed at the national level and are
some of the strongest Core NTE growth rates in the country.
Table 5: Core NTE summary for Australian Capital Territory
Based on 2018 Australian Bureau of Statistics data (CABEE 2013-2017 dataset), Ref: WTS1/1_State
As noted above, most of this growth can be
attributed to Food, with establishments (+3.9%),
employment (+8.4%) and turnover (+8.4%) all
increasing between 2016 and 2017, continuing the
robust growth shown since 2009 (Figure 3).
In addition to having a higher concentration of
Food compared to the national average, the
structure of the sub-sector is also quite different.
There is a much higher presence of cafes and
restaurants in ACT than in Australia as a whole (81%
compared to 66%) as demonstrated in Figure 4.
Figure 3: Trend in ACT’s Food sub-sector
Figure 4: ACT Food employment (2017) by ANZSIC

The NTE in New South Wales (NSW)
P a g e | 10 Prepared by Ingenium Research - September
2018
3. The NTE in New South Wales (NSW)
NSW is the largest contributor to Australia’s Core
NTE, accounting for 34% of Core NTE establishments
and 30% of Core NTE employment and turnover.
The distribution of NSW’s Core NTE is broadly
similar to that of Australia, which is not unsurprising
given it is major contributor to the Australian NTE.
Approximately 8% of establishments are Drink
based (compared to 8% in Australia), 30% are in
Entertainment (29%) and 62% are in Food (63%).
Figure 5: NSW’s establishments by sub-sector
Between 2016 and 2017 the Core NTE in NSW grew
across establishments (+3.1%), employment (+2.4%)
and turnover (+1.7%) (see Table 6), although the
growth in these key metrics occurred at a slower rate
than observed at the national level (+3.2% in
establishments, +3.7% in employment and +3.1% in
turnover). While Core NTE growth in NSW is slightly
slower than that of Australia, the main driver behind
this growth is common; namely increases in the size
of the Food sub-sector across all key metrics.
Food establishments in NSW increased by 3.5% over
the 2016 to 2017 period (compared to +3.6%
nationally), which led to similar expansions in
employment (+4.4% compared to +5.2% nationally)
and turnover (+4.3% compared to +5.2%).
Whilst Food is the key driver of the Core NTE it is
also worth noting that NSW possesses the largest
Drink and Entertainment sub-sectors in Australia.
Both of these sectors have remained fairly static in
size between 2016 to 2017, but this is also the case
nationally.
Figure 6: Trend in NSW’s Core NTE
In summary, NSW’s Core NTE is the largest amongst all the states and territories but has experienced
slower than average growth in recent years compared to the Core NTE in Australia as a whole. It’s Core
NTE distribution is similar to that of Australia with around 62% of establishments focused on Food activities,
which continue to grow at a quicker pace than that of Drink and Entertainment activities.
Table 6: Core NTE summary for New South Wales
Based on 2018 Australian Bureau of Statistics data (CABEE 2013-2017 dataset), Ref: WTS1/1_State

The NTE in New South Wales (NSW)
P a g e | 11 Prepared by Ingenium Research - September
2018
3.1. NSW: City of Newcastle
Newcastle has the seventh largest Drink sub-sector of the 88
LGAs analysed measured by the number of establishments.
Newcastle’s Core NTE represents an above average proportion
of its total economy compared to that of NSW and Australia
(see Table 7). In addition, it has grown at a much faster rate
between 2016 and 2017 than NSW across establishments (8.4%
compared to 3.1% in NSW), employment (7.8% compared to
2.4%) and turnover (7.8% compared to 1.7%).
Newcastle has a higher than average concentration of Drink
establishments (14% of the Core NTE) compared to NSW (8%)
and Australia (8%), driven primarily by pubs, taverns and bars
as opposed to liquor retailing.
Table 7: Core NTE summary for City of Newcastle
Based on 2018 Australian Bureau of Statistics data (CABEE 2013-2017 dataset), Ref: WTS1/1_LGA
The proportion of Core NTE employment that is
based in Drink establishments is also higher than
average, although turnover represents a lower
proportion of the Core NTE than that witnessed at
the state or federal level, indicating a lower than
average turnover.
While Drink looks to be stronger than average in
Newcastle, it should also be noted that the Food
sub-sector has grown by over 10% in terms of
establishments, employment and turnover
between 2016 and 2017, indicating a recent shift in
NTE focus for the LGA.
Figure 7: Newcastle’s employment by sub-sector
Figure 8: Trend in Newcastle’s Food sub-sector

The NTE in New South Wales (NSW)
P a g e | 12 Prepared by Ingenium Research - September
2018
3.2. NSW: City of Parramatta
Parramatta’s Food sub-sector is the seventh largest of the 88
LGAs analysed, in terms of the number of establishments.
Parramatta has a particularly strong Food sub-sector in terms
of establishments, making up 77% of the Core NTE, which is
much higher compared to NSW (61%) and Australia (63%).
Employment (66%) and turnover (48%) are lower in this sub-
sector, however, suggesting Paramatta has a higher
proportion of smaller establishments.
Parramatta’s boundary was recently changed in 2016, with
parts of the previous boundary being combined with parts of
The Hills Shire, Auburn City, Holroyd City and Hornsby Shire,
meaning a slight disconnect in figures between 2015 and 2016.
Table 8: Core NTE summary for City of Parramatta
Based on 2018 Australian Bureau of Statistics data (CABEE 2013-2017 dataset), Ref: WTS1/1_LGA
Over the course of 2016 to 2017, the number of
establishments in all three sub-sectors (Food, Drink
and Entertainment) grew in Parramatta in terms of
the number of establishments, employment and
turnover. Although this was at a slightly slower rate
than witnessed in these sub-sectors in NSW.
While the Food sub-sector is the primary driver
behind Parramatta’s Core NTE performance (48%
of Core NTE turnover or $496m), it has remained
static over the past few years in terms of growth, as
explored in Figure 9.
Figure 9: Trend in Parramatta’s Food sub-sector
Figure 10: Parramatta establishments by sub-sector

The NTE in New South Wales (NSW)
P a g e | 13 Prepared by Ingenium Research - September
2018
3.3. NSW: City of Sydney
Sydney has the strongest and most concentrated NTE in
Australia, with over 180 Core NTE establishments per km2.
Sydney’s Core NTE is a clear strength for the LGA (Table 9) as
it represents almost 11% of all of Sydney’s establishments. In
terms of establishments per km2, it is ranked:
• first in Drink (22 per km2),
• second in Entertainment (33 per km2) and
• first in Food (128 per km2).
Each of these sub-sectors experienced continued growth
between 2016 and 2017, suggesting these positions are likely
to be maintained in the future. Overall growth in turnover has
occurred much faster than inflation (6.3% compared to 1.9%4).
Table 9: Core NTE summary for City of Sydney
Based on 2018 Australian Bureau of Statistics data (CABEE 2013-2017 dataset), Ref: WTS1/1_LGA
Food remains Sydney’s strongest NTE sub-sector,
accounting for 70% of all NTE establishments in
2017, which is well above the averages for NSW
(61%) and Australia (63%).
The greatest growth over this period was in the
Drink sub-sector, with increases in establishments
(+4.9%), employment (+8.7%) and turnover
(+6.5%), well above the NSW and national
averages. This growth comes off the back of decline
between 2014 and 2015 (-8%) following the
introduction of the lockouts in February 2014.
Figure 11: Trend in Sydney’s Core NTE
Entertainment in Sydney is growing at a faster rate
than that of NSW in terms of employment (+2.4%
compared to -1.0%) and turnover (+5.0%
compared to -1.6%). This is driven primarily by
strong performance in creative and performing arts,
consisting of over 460 establishments (+4% since
2016) employing 3,100 people (+12% since 2016)
and generating nearly $572m in turnover for the
LGA (+20% since 2016). Should this growth
continue it may help Sydney to first place in terms
of the density of Entertainment establishments.

The NTE in Northern Territory (NT)
P a g e | 14 Prepared by Ingenium Research - September
2018
4. The NTE in Northern Territory (NT)
The Core NTE in NT is smaller than other states and
territories, but it represents a higher proportion of the
total economy across all key metrics.
The Core NTE represents approximately 5.2% of all
establishments in NT (compared to 4.7% nationally),
in addition to 13.9% of employment (8.9%
nationally) and 6.6% of turnover (3.8%), highlighting
that this is an important sector for the NT’s total
economy (Table 10).
Figure 12: Core NTE growth 2016-2017 in NT
NT has increased its Core NTE establishments at the
quickest rate of all states and territories in Australia
between 2016 and 2017 (+4.7%). Unfortunately, this
has not transferred through to employment, which
has remained relatively static (+0.1%), or turnover
which has seen a small decline (-1.5%). This suggests
that the newer firms are likely to be very small in
nature and that increases may follow in future years.
The main drivers of the employment and turnover
change are the Drink and Entertainment sub-sectors
which have both observed losses from 2016 to 2017.
Whilst the Drink sub-sector has not lost any
establishments since 2016, its employment and
turnover have both decreased by 6.4%.
Entertainment has increased in establishments
(+4.5%) but decreases in employment and turnover
(-4.2% and -5.9%).
These decreases in employment and turnover have
been effectively negated through strong growth in
the Food sub-sector across establishments (+5.3%),
employment (+4.6%) and turnover (+4.7%).
Figure 13: Sub-sector NTE growth 2016-2017 in NT
In summary, NT’s Core NTE is relatively small but particularly important in terms of its contributions to the
wider economy within the territory (13.9% of all employment in NT). It has seen many new establishments
added in the last year, but this has yet to impact on employment and turnover, which have seen losses in
Drink and Entertainment, but have been maintained due to a growing Food sub-sector.
Table 10: Core NTE summary for Northern Territory
Based on 2018 Australian Bureau of Statistics data (CABEE 2013-2017 dataset), Ref: WTS1/1_State

The NTE in Northern Territory (NT)
P a g e | 15 Prepared by Ingenium Research - September
2018
4.1. NT: City of Darwin
Darwin’s Core NTE represents nearly 6% of all establishments
in the LGA, which is above the territory and national average.
The structure of Darwin’s Core NTE is slightly different to that
of NT and Australia, with less reliance on Drink (4% of Core
NTE establishments) and Entertainment (27%) and more of an
emphasis on Food establishments (69%).
This is also supported when looking at growth rates by sub-
sector, with Drink and Entertainment witnessing slight declines
between 2016 and 2017 across establishments (-5% and -3%
respectively), employment (-4% and -2%) and turnover (-4%
and -1%). This suggests a potential shift towards an even
greater emphasis on Food in the future.
Table 11: Core NTE summary for City of Darwin
Based on 2018 Australian Bureau of Statistics data (CABEE 2013-2017 dataset), Ref: WTS1/1_LGA
This shift seems more likely when considering that
Darwin experienced strong growth in the Food sub-
sector over the same period in terms of
establishments (+7%), employment (+13%) and
turnover (+13%).
Establishment growth in Food over this period is
driven by an increase in takeaway food services
(+10%), with a lower growth in cafe and restaurant
establishments (+4%). Turning to employment and
turnover though, it is cafes and restaurants driving
the growth (+14% employment, +15% turnover).
Figure 14: Darwin’s Food Employment by type
Figure 15: Trend in Darwin’s Food sub-sector

The NTE in Queensland (QLD)
P a g e | 16 Prepared by Ingenium Research - September
2018
5. The NTE in Queensland (QLD)
QLD has the third largest Core NTE in Australia
across all key metrics and is growing at faster pace
than that of VIC and NSW.
The Core NTE in QLD consists of over 19,100
establishments, employing over 221,600 people and
generating $25.3bn in turnover. Each of these key
metrics have grown in the last year by 3.8%, 5.0%
and 4.1% respectively, which is quicker than the
national average (+3.2%, +3.7% and +3.1%).
Figure 16: Trend in QLD’s Core NTE
The structure of the Core NTE in QLD is similar to
that of Australia, although with slightly less reliance
on Drink establishments (6% of Core NTE compared
to 8% nationally) and more reliance on Food (65%,
63% nationally).
As with most other states and territories, growth in
the Core NTE is primarily due to an increase in the
Food sub-sector, which has increased in
establishments (+4.2%), employment (+5.9%) and
turnover (+5.9%) between 2016 and 2017.
The state’s Core NTE has also been assisted by
strong growth in Entertainment from 2016 to 2017
that has occurred at almost double the national
average for employment (+3.0% compared to
+1.5% in Australia) and turnover (+1.6% compared
to +0.4%).
The same is also true of the Drink sub-sector, which
experienced particularly strong growth across
employment (+4.3%) and turnover (+3.8%),
although a small decline in establishments (-0.1%).
Figure 17: Growth in QLD’s Entertainment 2016-17
In summary, QLD’s Core NTE is one of the largest in Australia and is growing at a rate quicker than Australia,
NSW and VIC. Its Core NTE structure is similar to that of Australia, with slightly less reliance on Drink and
more emphasis on Food. Between 2016 and 2017 QLD’s Core NTE has grown in employment and turnover
across all Core NTE sub-sectors. If this trend continues, its size could rival that of VIC and NSW.
Table 12: Core NTE summary for Queensland
Based on 2018 Australian Bureau of Statistics data (CABEE 2013-2017 dataset), Ref: WTS1/1_State

The NTE in Queensland (QLD)
P a g e | 17 Prepared by Ingenium Research - September
2018
5.1. QLD: Brisbane City Council
Brisbane has the largest Food and Entertainment sub-sectors
across the 88 LGAs, as well as the largest Core NTE.
Brisbane naturally ranks highly in all three NTE sub-sectors,
due to its geographical size, which makes comparisons to
other LGAs difficult and leads to a much lower concentration
per km2 than that of other areas.
Brisbane’s proportional split in Food, Drink and Entertainment
is similar to QLD and Australia in establishments, employment
and turnover. While similar in this vein, Brisbane’s wider
economy has more of a reliance on the Core NTE than that
of QLD and Australia, as demonstrated in Table 13 below, with
the Core NTE representing a higher than average proportion
of the total economy.
Table 13: Core NTE summary for Brisbane City Council
Based on 2018 Australian Bureau of Statistics data (CABEE 2013-2017 dataset), Ref: WTS1/1_LGA
All of Brisbane’s Core NTE sub-sectors (Drink,
Entertainment and Food) grew between 2016 and
2017 across all measures, although some sub-
sectors grew quicker than others.
The largest percentage growth was witnessed in
Food employment (+7%) and turnover (+7%),
representing an addition of 3,190 jobs and $317m in
turnover to the sub-sector. As highlighted in Figure
18, this trend has been fairly continual for almost a
decade and doesn’t show any signs of slowing,
meaning Food will remain key.
Figure 18: Trend in Brisbane’s Food sub-sector
Figure 19: Brisbane’s establishments by sub-sector
The NTE in Queensland (QLD)
P a g e | 18 Prepared by Ingenium Research - September
2018
5.2. QLD: City of Gold Coast
Gold Coast has the third largest Core NTE of all 88 LGAs
analysed and the second largest Entertainment sub-sector.
In a similar fashion to Brisbane, Gold Coast’s large physical size
means it naturally ranks highly, particularly in Food (sixth) and
Entertainment, but lower in terms of density. Entertainment
represents a larger proportion of Core NTE establishments
(32%) than it does in the state (29%) and Australia (29%) and
this is also true when it comes to employment and turnover.
The Core NTE has grown across most measures over the 2016
to 2017 period and at a faster rate than witnessed in QLD and
Australia. This growth has not occurred across all sub-sectors
though, with Drink declining by 7% in establishments.
Table 14: Core NTE summary for City of Gold Coast
Based on 2018 Australian Bureau of Statistics data (CABEE 2013-2017 dataset), Ref: WTS1/1_LGA
Entertainment and Food have both experienced
growth in employment and turnover between 2016
and 2017. While Entertainment has grown at a
quicker rate than QLD and Australia between 2016
and 2017 its growth since 2012 is relatively static. It
has not grown as quickly as the Food sub-sector as
demonstrated in Figure 20 and Figure 21. Over the
2016 and 2017 period employment in Food has
increased by 10% (+1,935 jobs) compared to an
increase of 5% in Entertainment (+500 jobs).
Figure 20: Trend in Gold Coast’s Entertainment
Figure 21: Trend in Gold Coast’s Food sub-sector

The NTE in South Australia (SA)
P a g e | 19 Prepared by Ingenium Research - September
2018
6. The NTE in South Australia (SA)
SA has a modestly sized Core NTE, which has a
greater focus on Drink activities than other states and
less reliance on Entertainment activities.
SA’s Core NTE employs almost 77,000 people across
6,441 establishments and generated $8.6bn in
turnover in 2017 (Table 15). Almost 12,000 of these
employees (16%) are based in Drink establishments,
which represents a much higher proportion than
seen in the Core NTE nationally (12%).
Figure 22: SA’s employment by sub-sector
Entertainment represents a much lower proportion
of employment in SA’s Core NTE (19%) compared to
Australia (25%) whereas the concentration of Food
based establishments is broadly similar, albeit
slightly higher (65% in SA compared to 63% in
Australia).
Growth in the Core NTE in SA has been relatively
static over the 2016 to 2017 period, with
establishments increasing by 2.4% (below the
national rate of +3.2%) and employment and
turnover increasing by 0.6% and 0.7% respectively.
While the Drink sub-sector represents an above
average concentration of Core NTE activities in SA,
it has observed little to no change in its
establishment base over the last eight years, along
with a slow reduction in employment and turnover.
Entertainment has also experienced a decline in
establishments over the 2009 to 2015 period but
looks to be resurging in 2016 and 2017. Food on the
other hand is the main driver for growth from 2016
to 2017, having increased in establishments (+3.1%),
employment (+2.2%) and turnover (+2.2%).
Figure 23: Trend in SA’s Drink sub-sector
In summary, the Core NTE in SA is slightly different to that of Australia, with more emphasis on Drink and
less focus on Entertainment. These two sectors have witnessed relatively static growth between 2016 and
2017 and in the period prior to this, whilst Food has continued to rise. This could signify a potential shift in
NTE focus from Drink to Food based activities or could simply suggest a move to smaller Drinks venues
given the number of establishments has remained effectively unchanged over the last eight years.
Table 15: Core NTE summary for South Australia
Based on 2018 Australian Bureau of Statistics data (CABEE 2013-2017 dataset), Ref: WTS1/1_State

The NTE in South Australia (SA)
P a g e | 20 Prepared by Ingenium Research - September
2018
6.1. SA: City of Adelaide
Adelaide has the second largest concentration of Drink
establishments per km2 out of the 88 LGAs analysed.
Adelaide’s Core NTE is very different to that of SA and
Australia, with a much higher concentration of Drink
establishments (16% compared to 12% in SA and 8% in
Australia) and significantly smaller proportion of
Entertainment establishments (15% compared to 26% in SA
and 29% in Australia).
Adelaide’s disparity with SA and Australia is also apparent
when looking at the proportion of the total economy that the
Core NTE represents (see Table 16) across establishments
(5%), employment (13%) and turnover (5%).
Table 16: Core NTE summary for City of Adelaide
Based on 2018 Australian Bureau of Statistics data (CABEE 2013-2017 dataset), Ref: WTS1/1_LGA
Core NTE establishments in Adelaide declined by
2.2% over 2016 to 2017. This loss was experienced
across all three sub-sectors, although employment
and turnover have increased in Entertainment
(+3%, +4% respectively) and Food (+4%, +4%),
indicating a move to larger establishments.
By comparison, employment and turnover in Drink
contracted by 1% over the same period (Figure 25),
driven mainly by pubs, taverns and bars, which
represent 91% of the sub-sector. This activity is
important to Adelaide’s live music scene, with a
high number of gigs occurring in this venue type5.
Figure 24: Adelaide’s establishments by sub-sector
Figure 25: Trend in Adelaide’s Drink sub-sector
5 Music SA, (2017), Adelaide Live Music Census 2017 (recorded in May)
http://www.musicsa.com.au/wp-content/uploads/2017/12/LMO-Adelaide-Live-Music-Census-2017_v2.pdf

The NTE in Tasmania (TAS)
P a g e | 21 Prepared by Ingenium Research - September
2018
7. The NTE in Tasmania (TAS)
The Core NTE in TAS represents a higher than
average proportion of the total economy and is
growing at a quicker pace than seen nationally.
As shown in Table 17, TAS’ Core NTE accounts for
5.2% of all TAS establishments (compared to 4.7%
nationally), 9.4% of all employment (compared to
8.9%) and 4.1% of all turnover (compared to 3.8%).
Over the 2016 to 2017 period each of these metrics
have increased at a faster rate than Australia.
Figure 26: Trend in TAS’s Drink sub-sector
This is particularly true of employment (+8.3%), due
to strong growth across all three sub-sectors:
• Drink (+190 / +5.5%)
• Entertainment (+420 / +8.8%)
• Food (+1,165 / +8.7%).
The increase in Drink is particularly positive, given
that almost half of other states and territories have
witnessed decline within this sub-sector over the last
couple of years (including TAS). This could mean the
sub-sector is experiencing some form of revival.
This would be welcome within TAS, as Drink
activities represent 12% of all Core NTE
establishments (compared to 8% nationally), 16% of
Core NTE employment (compared to 12%) and 17%
of turnover (compared to 15%).
Given TAS’ rural nature, it might be expected that
the two key cities, Hobart and Launceston, drive the
Core NTE. However, the two cities account for 40%
of Core NTE establishments, 39% of employment
and 36% of turnover, indicating that there are other
Core NTEs operating elsewhere across the state.
Figure 27: Trend in TAS’s Food sub-sector
In summary, TAS’ Core NTE is one that is important to the states’ total economy (5.2% of all TAS
establishments) and is growing at a rate quicker than the national average, particularly in employment. This
is driven by strong growth between 2016 and 2017 across all three Core NTE sub-sectors, with Food
contributing the greatest number of jobs. Recent growth in Drink establishments, could signify a potential
resurgence for the sub-sector following a steady decline over the last few years.
Table 17: Core NTE summary for Tasmania
Based on 2018 Australian Bureau of Statistics data (CABEE 2013-2017 dataset), Ref: WTS1/1_State

The NTE in Tasmania (TAS)
P a g e | 22 Prepared by Ingenium Research - September
2018
7.1. TAS: City of Hobart
Core NTE employment represents 14% of all employment in
Hobart.
As can be seen in Table 18, Core NTE employment represents
a much higher proportion of total employment than across
Tasmania (9%) and Australia (9%). The same is true of
establishments (8% compared to 5% in TAS and Australia) and
turnover (5% compared to 4% in TAS and Australia).
While the number of Core NTE establishments in Hobart
increased (+5.6%) between 2016 and 2017, employment in the
Core NTE remained fairly static (declining by 0.3%), while
turnover increased only slightly (+0.2%). This suggests a
higher number of smaller establishments.
Table 18: Core NTE summary for City of Hobart
Based on 2018 Australian Bureau of Statistics data (CABEE 2013-2017 dataset), Ref: WTS1/1_LGA
The maintaining of Hobart’s employment and
turnover position is driven mainly by an increase in
Food establishments (+10%), which increased in
employment and turnover by 4% each. Conversely
the Drink and Entertainment sub-sectors saw
declines in employment of 7% and 6% respectively.
This could signify a shift in the composition of
Hobart’s Core NTE towards a more Food focused
approach. It will be important to review this trend
in future years to understand the changes.
Figure 28: Hobart’s Entertainment sub-sector
Figure 29: Trend in Hobart’s Food sub-sector

The NTE in Victoria (VIC)
P a g e | 23 Prepared by Ingenium Research - September
2018
8. The NTE in Victoria (VIC)
The Core NTE in VIC is the second largest in Australia
and is expanding at a faster rate than NSW and
Australia as a whole.
VIC’s Core NTE (Table 19) accounts for 28% of
Australia’s Core NTE establishments, 25% of its
employment and 26% of its turnover. As with NSW,
the distribution of the Core NTE amongst sub-
sectors is broadly similar to that of Australia, except
with a slightly increased focus on Food activities.
Figure 30: Sub-sector NTE growth 2016-2017 in VIC
Between 2016 and 2017, the Core NTE in VIC grew
across establishments (+3.4% compared to 3.2%
nationally), employment (+4.5% compared to
+3.7%) and turnover (+3.9% compared to +3.1%).
The above average growth witnessed in VIC’s Core
NTE is courtesy of strong increases across every
metric and sub-sector between 2016 and 2017. This
is particularly true in the Entertainment and Food
sub-sectors (Figure 30) which added 11,455 jobs to
the Core NTE during this period.
The increase across key metrics in Food was
comparable to that of Australia, whilst growth in
Entertainment surpassed the national trend. While
Drink employment grew (+0.8%), it was slightly less
than the trend seen nationally (+1.1%).
The increase in Drink was driven by a similar increase
(+1.1%) in employment in pubs, taverns and bars,
whilst liquor retailing declined (-0.8%).
Comparatively in the Food sub-sector, growth was
relatively consistent across takeaway food services
(+3.8%) and cafes and restaurants (+5.8%).
Figure 31: Trend in VIC’s Core NTE
In summary, the Core NTE in VIC is one of the largest in the country and is growing more quickly than that
of NSW and Australia. It is particularly strong in Food and Entertainment activities, which have grown
considerably over the last year. The Drink sub-sector has grown at a similar pace to the national trend,
which is positive considering the decline seen in other areas. Should these trends continue VIC’s share of
the Australian Core NTE is likely to increase in future years.
Table 19: Core NTE summary for Victoria
Based on 2018 Australian Bureau of Statistics data (CABEE 2013-2017 dataset), Ref: WTS1/1_State
The NTE in Victoria (VIC)
P a g e | 24 Prepared by Ingenium Research - September
2018
8.1. VIC: City of Melbourne
Melbourne’s NTE continues to be driven by growth in its Food
sub-sector. It has the second largest concentration of Core NTE
and Food establishments per km2 of the 88 LGAs analysed.
The number of Core NTE establishments remained relatively
steady between 2016 and 2017 (-1.2%), while employment
(+7.4%) and turnover (+6.5%) continued to rise, suggesting
larger establishments with higher turnover.
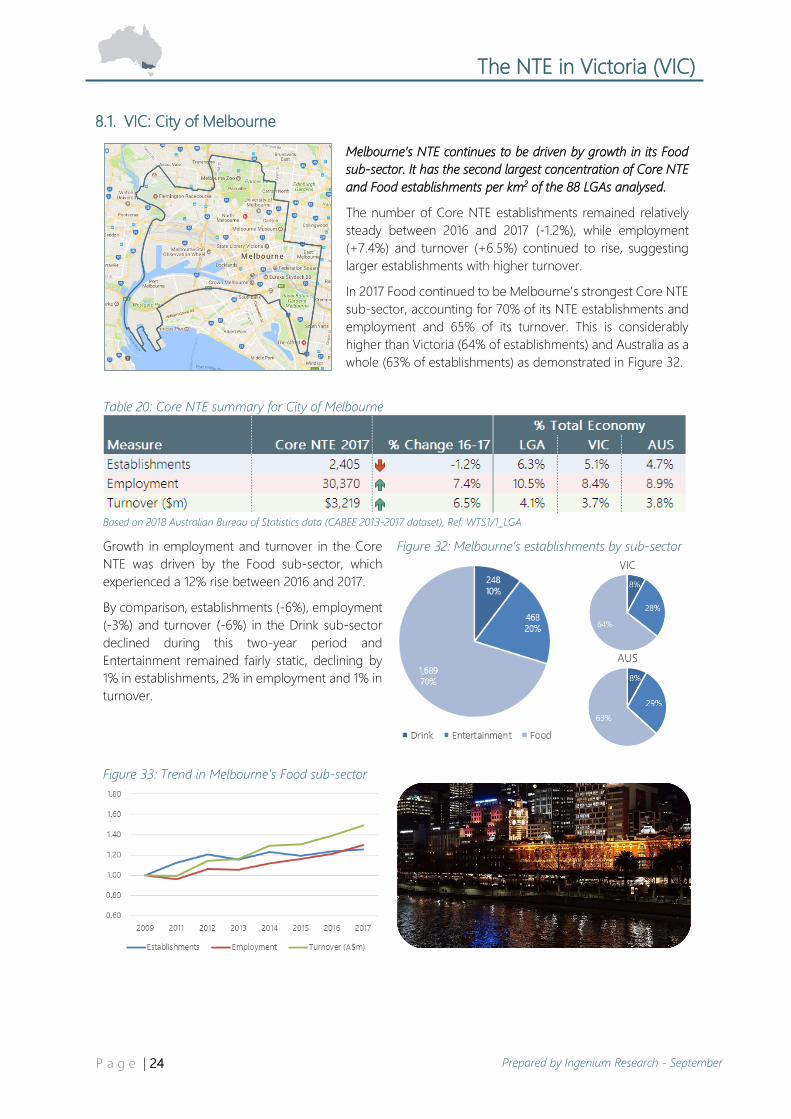
In 2017 Food continued to be Melbourne’s strongest Core NTE
sub-sector, accounting for 70% of its NTE establishments and
employment and 65% of its turnover. This is considerably
higher than Victoria (64% of establishments) and Australia as a
whole (63% of establishments) as demonstrated in Figure 32.
Table 20: Core NTE summary for City of Melbourne
Based on 2018 Australian Bureau of Statistics data (CABEE 2013-2017 dataset), Ref: WTS1/1_LGA
Growth in employment and turnover in the Core
NTE was driven by the Food sub-sector, which
experienced a 12% rise between 2016 and 2017.
By comparison, establishments (-6%), employment
(-3%) and turnover (-6%) in the Drink sub-sector
declined during this two-year period and
Entertainment remained fairly static, declining by
1% in establishments, 2% in employment and 1% in
turnover.
Figure 32: Melbourne’s establishments by sub-sector
Figure 33: Trend in Melbourne’s Food sub-sector
The NTE in Victoria (VIC)
P a g e | 25 Prepared by Ingenium Research - September
2018
8.2. VIC: Maroondah City Council
Maroondah’s Core NTE is relatively small, with less reliance on
Drink and an emphasis on Food.
Food is key in Maroondah accounting for 67% of Core NTE
establishments, 63% of employment and 54% of turnover. This
is slightly higher than that of Victoria and Australia.
All aspects of Maroondah’s Core NTE grew slightly between
2016 and 2017, with the exception of the Food sub-sector,
which experienced growth in the number of establishments
(+2.1%) but a decline in employment (-5.7%) and turnover (-
5.4%).
Table 21: Core NTE summary for Maroondah City Council
Based on 2018 Australian Bureau of Statistics data (CABEE 2013-2017 dataset), Ref: WTS1/1_LGA
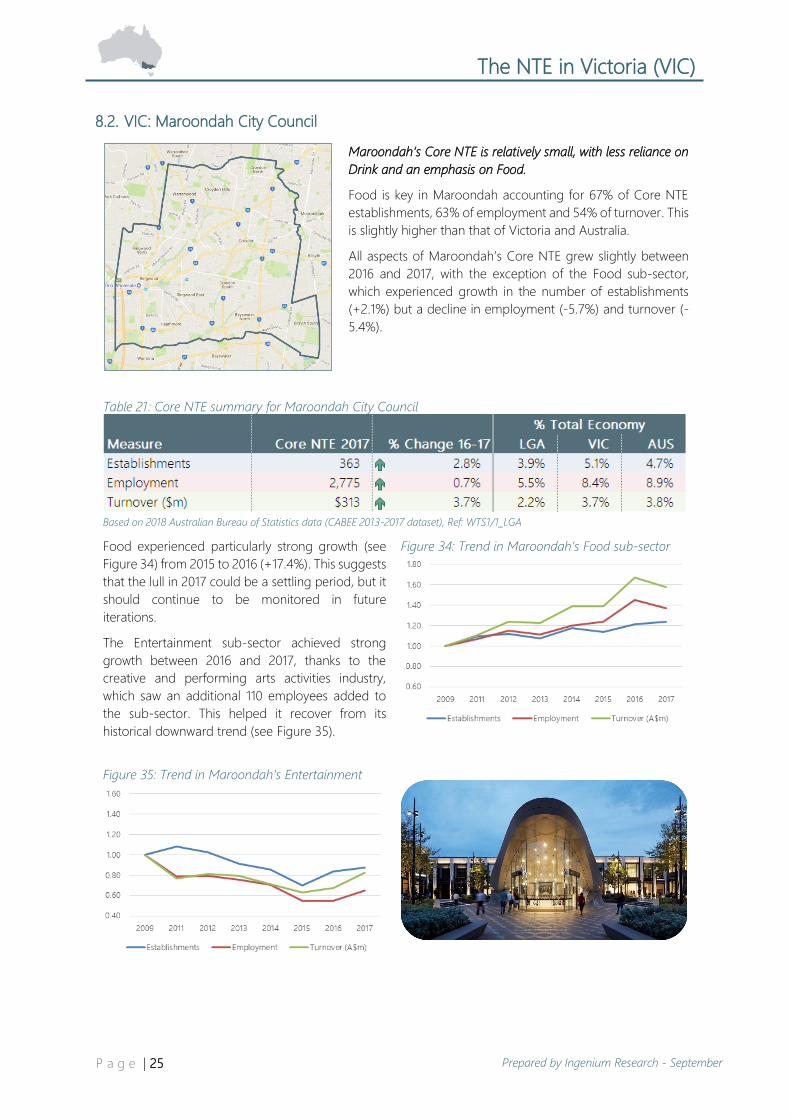
Food experienced particularly strong growth (see
Figure 34) from 2015 to 2016 (+17.4%). This suggests
that the lull in 2017 could be a settling period, but it
should continue to be monitored in future
iterations.
The Entertainment sub-sector achieved strong
growth between 2016 and 2017, thanks to the
creative and performing arts activities industry,
which saw an additional 110 employees added to
the sub-sector. This helped it recover from its
historical downward trend (see Figure 35).
Figure 34: Trend in Maroondah’s Food sub-sector
Figure 35: Trend in Maroondah’s Entertainment

The NTE in Victoria (VIC)
P a g e | 26 Prepared by Ingenium Research - September
2018
8.3. VIC: Port Phillip City Council
Of the 88 LGAs analysed, Port Phillip has the sixth highest
concentration of Core NTE establishments per km2 and the fifth
highest concentration of Entertainment establishments.
Entertainment is a key strength of Port Phillip accounting for
38% of its Core NTE establishments, 31% of employment and
42% of turnover, which is quite different to that of Victoria and
Australia as a whole. The Drink sub-sector represents a similar
proportion to that of the state, whereas Food is a much smaller
proportion by comparison (as shown in Figure 36).
The trend in Entertainment is driven primarily by a large
number of establishments, employment and turnover in the
creative and performing arts space.
Table 22: Core NTE summary for Port Phillip City Council
Based on 2018 Australian Bureau of Statistics data (CABEE 2013-2017 dataset), Ref: WTS1/1_LGA
Over the 2016 to 2017 period, Port Phillip
experienced growth across all three measures, with
employment and turnover growing quicker than
rates witnessed at the state and national level.
While Entertainment is one of Port Phillip’s key sub-
sectors, its growth has been relatively slow between
2016 and 2017 across establishments (+1.3%) with
stronger growth in employment (+3.5%) and
turnover (+7.9%). As with several LGAs in this
report, Food is the sub-sector, that has grown the
most over the last eight years (Figure 37).
Figure 36: Port Phillip’s establishments by sub-sector
Figure 37: Trend in Port Phillip’s Food sub-sector

The NTE in Western Australia (WA)
P a g e | 27 Prepared by Ingenium Research - September
2018
9. The NTE in Western Australia (WA)
WA has stronger than average Food and Drink sub-
sectors and has the fourth largest Core NTE of all
Australia’s states and territories.
Whilst the number of establishments in WA overall
economy grew at a much slower rate than the
national average between 2016 and 2017 (1.5%
compared to 3.1% nationally), the number of
establishments in WA’s Core NTE increased at the
same rate as the national average (+3.2%).
Figure 38: WA’s and Australia’s Core NTE turnover
The Core NTE in WA grew across all three metrics
between 2016 and 2017. In particular, employment
and turnover in WA’s Core NTE, grew at a much
stronger rate than the national average (+4.8% and
+4.4% respectively compared to +3.7% and 3.1%
nationally).
The Food sub-sector in WA experienced particularly
strong employment and turnover growth between
2016 and 2017 (both +6.5%). The Drink sub-sector
also experienced particularly strong increase in
turnover (+6.6%), primarily in liquor retailing (+14%).
WA’s strongest NTE sub-sectors are Food and Drink,
which hold a higher proportion of the Core NTE
across all metrics. Entertainment, however, is weaker
than the national average, representing a lower
proportion of the Core NTE across all metrics:
• Establishments: 26% in WA, 29% nationally
• Employment: 17% in WA, 25% nationally
• Turnover: 24% in WA, 33% nationally
This sub-sector also grew at a lower rate than the
national average between 2016 and 2017.
Figure 39: Trend in WA’s Core NTE sector
In summary, WA’s Core NTE is the fourth largest of Australia’s states and territories. The state has a strong
Food and Drink sub-sector but a comparatively weaker Entertainment sub-sector, suggesting an
opportunity for development. Over the last year, WA’s Core NTE has grown at a faster rate than its overall
economy, especially in Food turnover and employment, as well as Drink turnover.
Table 23: Core NTE summary for Western Australia
Based on 2018 Australian Bureau of Statistics data (CABEE 2013-2017 dataset), Ref: WTS1/1_State

The NTE in Western Australia (WA)
P a g e | 28 Prepared by Ingenium Research - September
2018
9.1. WA: City of Perth6
Of the 88 LGAs analysed, Perth’s Drink sub-sector ranks sixth
highest in terms of establishments per km2. and third for
turnover and employment density.
The Drink sub-sector represents 14% of Perth’s Core NTE. This
compares to just 8% Australia wide. Not only does Perth have
a stronger than average Drink sub-sector, this sub-sector
experienced growth between 2016 and 2017 in establishments
(+8.8%), employment (+2.1%) and turnover (+2.0%).
In Perth’s Core NTE overall, the number of establishments
increased but employment and turnover declined. This is
against the trend witnessed across WA, as can be seen in
Figure 40.
Table 24: Core NTE summary for City of Perth
Based on 2018 Australian Bureau of Statistics data (CABEE 2013-2017 dataset), Ref: WTS1/1_LGA
Drink was the only Core NTE sub-sector in Perth to
experience growth during this period, with both
Entertainment and Food experiencing declines in
employment (-12.2% and -4.3% respectively) and
turnover (-12.9% and -4.2%).
Compared to Drink, Perth’s Entertainment sub-
sector is relatively smaller, representing just 15% of
all Perth’s Core NTE turnover. This compares to
Entertainment representing 33% Australia wide.
Figure 40: Change in Core NTE in Perth and WA
Figure 41: Perth’s turnover by sub-sector
6 Please note that due to changes in ABS methodologies that there is a disconnect from 2015 to 2016 data, as explained in the method.
Appendix
P a g e | 29 Prepared by Ingenium Research - September
2018
10. Appendix
10.1. Sources
Table 25: Sources for images used
Council Area Source
Australian Capital Territory Supplied by CCCLM
City of Adelaide www.flickr.com/photos/dynamix00/
Brisbane City Council www.flickr.com/photos/lennykphotography/
City of Darwin www.flickr.com/photos/httpwwwflickrcomphotostopend/
City of Gold Coast www.flickr.com/photos/bruvva/
City of Hobart www.flickr.com/photos/michelphan/
Maroondah City Council www.qicgre.com/places/eastland
City of Melbourne Supplied by City of Melbourne Council
City of Newcastle www.visitnewcastle.com.au/
City of Parramatta www.dailytelegraph.com.au/newslocal/parramatta/praise-for-parramattas-proud-
beating-heart/news-story/ea490bf9fae8e906f245bb4997b78ad0
City of Perth www.flickr.com/photos/steve_ellis/2709732487/
Port Phillip City Council www.flickr.com/photos/scott-s_photos/
City of Sydney www.flickr.com/photos/mklapper/
10.2. Methodology
10.2.1. Definitions
As noted in the Glossary (p4), the NTE refers to economic activity which occurs at establishments primarily
between the hours of 6 p.m. and 6 a.m. This is then broken down further into Core, Non-Core and Supply.
These NTE sectors are defined using the Australian and New Zealand Standard Industrial Classification
(ANZSIC) system, which are aligned with definitions used in previous work in the United Kingdom and New
Zealand. The codes used to define Core, Non-Core and Supply are provided below.
Table 26: Core NTE ANZSIC definition
NTE Sub-Sector ANZSIC Description
Drink 4123 Liquor Retailing
4520 Pubs, Taverns and Bars
Entertainment 5517 Motion Picture and Video Activities
900 Creative and Performing Arts Activities
911 Sports and Physical Recreation Activities
912 Horse and Dog Racing Activities
913 Amusement and Other Recreation Activities
920 Gambling Activities
4530 Clubs (Hospitality)
9534 Brothel Keeping and Prostitution
Food 4511 Cafes and Restaurants
4512 Takeaway Food Services
7 For all LGAs except City of Sydney, Motion Picture and Video Activities (ANZSIC 551) is captured as a Supply NTE activity. For City of
Sydney, the Floor and Employment Survey in the original Sydney Cost Benefit Analysis work (2011) allowed further disaggregation of this
ANZSIC to reach Motion Picture Exhibition (ANZSIC 5513), i.e. cinemas, meaning it can still be presented in the following years. This level
of ANZSIC detail is not normally available at LGA level via ABS request due to small numbers that would not pass confidentiality rules.
Appendix
P a g e | 30 Prepared by Ingenium Research - September
2018
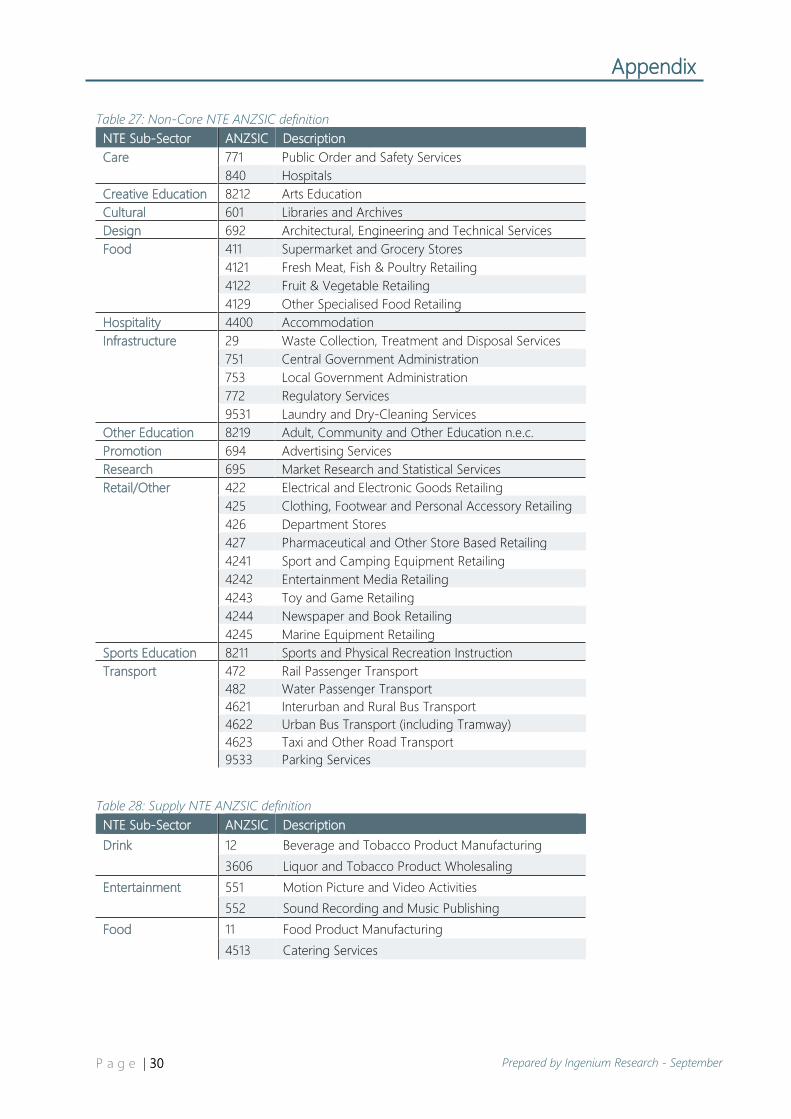
Table 27: Non-Core NTE ANZSIC definition
NTE Sub-Sector ANZSIC Description
Care 771 Public Order and Safety Services
840 Hospitals
Creative Education 8212 Arts Education
Cultural 601 Libraries and Archives
Design 692 Architectural, Engineering and Technical Services
Food 411 Supermarket and Grocery Stores
4121 Fresh Meat, Fish & Poultry Retailing
4122 Fruit & Vegetable Retailing
4129 Other Specialised Food Retailing
Hospitality 4400 Accommodation
Infrastructure 29 Waste Collection, Treatment and Disposal Services
751 Central Government Administration
753 Local Government Administration
772 Regulatory Services
9531 Laundry and Dry-Cleaning Services
Other Education 8219 Adult, Community and Other Education n.e.c.
Promotion 694 Advertising Services
Research 695 Market Research and Statistical Services
Retail/Other 422 Electrical and Electronic Goods Retailing
425 Clothing, Footwear and Personal Accessory Retailing
426 Department Stores
427 Pharmaceutical and Other Store Based Retailing
4241 Sport and Camping Equipment Retailing
4242 Entertainment Media Retailing
4243 Toy and Game Retailing
4244 Newspaper and Book Retailing
4245 Marine Equipment Retailing
Sports Education 8211 Sports and Physical Recreation Instruction
Transport
472 Rail Passenger Transport
482 Water Passenger Transport
4621 Interurban and Rural Bus Transport
4622 Urban Bus Transport (including Tramway)
4623 Taxi and Other Road Transport
9533 Parking Services
Table 28: Supply NTE ANZSIC definition
NTE Sub-Sector ANZSIC Description
Drink 12 Beverage and Tobacco Product Manufacturing
3606 Liquor and Tobacco Product Wholesaling
Entertainment 551 Motion Picture and Video Activities
552 Sound Recording and Music Publishing
Food 11 Food Product Manufacturing
4513 Catering Services
Appendix
P a g e | 31 Prepared by Ingenium Research - September
2018
10.2.2. Data sources
Data was acquired from the Australian Bureau of Statistics (ABS) via bespoke request from their Counts of
Australian Businesses, including Entries and Exits (CABEE), June 2013 to June 2017 dataset8. Through a
collaborative approach with the ABS, the bespoke request covered the ANZSICs set out in Section 10.2.1 (p29)
for a total of 88 LGAs, including:
• The current and previous members of the LGSCN (15 LGAs),
• Areas considered to be in the top 21 growing cities9 of Australia (13 LGAs),
• A selection of areas that had a large population density (per km2), were listed as a city council area
or a ‘major city of Australia’ and met the confidentiality constraints of the ABS (55 LGAs),
• An additional set of areas in NSW which are actively working on their NTE strategy (5 LGAs).
This extended the coverage of the analysis considerably when compared to previous years, which included
members of the LGSCN only. In addition to this extended LGA coverage, data was acquired from the CABEE
dataset for federal and state / territory figures.
This dataset was analysed and modelled using additional ABS datasets including labour force data10 and
industry turnover11 data. Once finalised data was presented across the geographic areas of LGA, state /
territory and Australia as a whole, by a variety of ANZSIC groupings including NTE sector and sub-sector.
In some cases, ANZSIC level data can be provided, but in others the numbers can be small leading to large
percentage swings when reviewing comparatively between years. This can be problematic as the ABS applies
perturbation12 techniques when dealing with smaller numbers in order to maintain confidentiality of businesses
involved in the dataset. This is the main reason why ANZSIC data is not published widely within this document
and is only used in those LGAs where numbers are large enough.
Important points to note about the CABEE dataset
The CABEE dataset captures actively trading establishments with an Australian Business Number (ABN) who
are registered for Goods and Services Tax (GST) as at the 30th June each year. Establishments without an ABN
or that are not registered for GST are excluded from the dataset.
Most establishments are counted as a single unit, at the location of their registered address, or at the address
with the highest employment. Establishments operating from multiple locations (for example large cinema
chains) may only be counted once. Conversely, establishments whose legal structure means they have
registered for separate ABNs may be counted multiple times.
Irrespective of any diversity of business activity undertaken, each establishment is classified to a single ANZSIC
code based on the main source of industry value added (sales of goods and services, wages and salaries or
number of employees as a proxy), which is generally based on a description provided by the business. ANZSIC
classifications may therefore not reflect all activities of one establishment, particularly where different activities
are undertaken at different locations and the establishment is counted as a single unit.
8 ABS Catalogue 8165.0 - Counts of Australian Businesses, including Entries and Exits, Jun 2013 to Jun 2017
http://www.abs.gov.au/ausstats/[email protected]/mf/8165.0 9 Smart Cities Plan: https://smart-cities.dashboard.gov.au/all-cities/overview 10 ABS Catalogue 6202.0 - Labour Force http://www.abs.gov.au/ausstats/[email protected]/mf/6202.0 11 ABS Catalogue 8155.0 – Australian Industry http://www.abs.gov.au/ausstats/[email protected]/mf/8155.0 12 The ABS Catalogue 8165.0 (link at footnote 8) for CABEE explains the use of perturbation in the context of business counts. Additional
information on the perturbation technique is available in the Census of Population and Housing dataset (ABS Catalogue 2011.0.55.001)
http://www.abs.gov.au/ausstats/[email protected]/Lookup/by%20Subject/2011.0.55.001~2016~Main%20Features~Data%20Quality%20and%20R
andom%20Perturbation~18

Appendix
P a g e | 32 Prepared by Ingenium Research - September
2018
10.2.3. Changes to geographic boundaries
Between the 2015 iteration of this study and this 2016-17 iteration there have been a number of LGA boundary
changes introduced across Australia.
One LGA affected within this report is the City of Parramatta, the boundary of which was revised in 201613.
This change saw parts of the previous Parramatta boundary combined with parts of The Hills Shire, Auburn
City, Holroyd City and Hornsby Shire. While figures for this LGA do not look too different between 2015 and
2016, it should be noted that there is a disconnect in the time series between these years and this should be
borne in mind when reviewing data over this period.
Another LGA affected was City of Perth, the boundary of which was also revised in 201614, absorbing part of
the City of Subiaco (south of Aberdare Road). As above, this change creates a disconnect in the time series
between 2015 and 2016. As 2016 and 2017 data for City of Perth was acquired from the CABEE 2017 dataset,
both reporting years make use of the new LGA boundary.
In addition to this, the City of Perth is affected by a change in ABS methodology introduced in the CABEE
2017 dataset, which means data can now be provided by non-standard geographies (i.e. LGA, postcode, etc.).
Previously, ABS could only provide data at Statistical Area 2 (SA2) boundaries and LGA boundaries had to be
constructed using these building blocks. This approach correlates for other LGAs except in the case of Perth
where the LGA boundary is particularly small. In this case the SA2s used cover a larger area than the LGA
boundary, meaning that in the past more businesses have been counted in the data than are actually in the
LGA (approximately 40% more). This should also be considered when reviewing data between 2015 and 2016.
As noted above, the approach of using SA2 areas as a proxy for LGA boundaries correlates for other LGAs,
the ABS change to the use of actual LGA boundaries should be borne in mind when comparing 2016 or 2017
results to earlier years at an LGA level. Data at a state, territory or national level are unaffected by this change.
10.2.4. Revision to 2015 state, territory and federal employment and turnover figures
Please note, that during the course of this iteration of the research, an anomaly was identified in the 2015
employment and turnover estimates for state, territory and federal levels. These figures have been revised
within this latest report and may differ from the previously published report15. There is no impact on LGA
figures, which remain unchanged between this 2016-17 report and the previous report.
13 https://www.cityofparramatta.nsw.gov.au/council/governance-of-the-council/wards 14 https://www.perth.wa.gov.au/city-perth-boundary-map 15 Houghton, M. and Rowell, A. (2017), The Australian Night Time Economy 2015, Ortus Economic Research

Appendix
P a g e | 33 Prepared by Ingenium Research - September
2018
10.3. Core NTE sub-sector tables for states, territories and LGAs
10.3.1. Australian Capital Territory
Table 29: Australian Capital Territory – Core NTE Establishments, Employment and Turnover ($m) – by sub-sector
Based on 2018 Australian Bureau of Statistics data (CABEE 2013-2017 dataset), Ref: WTS1/3_State
10.3.2. New South Wales
Table 30: New South Wales – Core NTE Establishments, Employment and Turnover ($m) – by sub-sector
Based on 2018 Australian Bureau of Statistics data (CABEE 2013-2017 dataset), Ref: WTS1/3_State
Table 31: City of Newcastle – Core NTE Establishments, Employment and Turnover ($m) – by sub-sector
Based on 2018 Australian Bureau of Statistics data (CABEE 2013-2017 dataset), Ref: WTS1/3_LGA

Appendix
P a g e | 34 Prepared by Ingenium Research - September
2018
Table 32: City of Parramatta16 – Core NTE Establishments, Employment and Turnover ($m) – by sub-sector
Based on 2018 Australian Bureau of Statistics data (CABEE 2013-2017 dataset), Ref: WTS1/3_LGA
Table 33: City of Sydney – Core NTE Establishments, Employment and Turnover ($m) – by sub-sector
Based on 2018 Australian Bureau of Statistics data (CABEE 2013-2017 dataset), Ref: WTS1/3_LGA
10.3.3. Northern Territory
Table 34: Northern Territory – Core NTE Establishments, Employment and Turnover ($m) – by sub-sector
Based on 2018 Australian Bureau of Statistics data (CABEE 2013-2017 dataset), Ref: WTS1/3_State
16 Please note that the Parramatta LGA boundary was revised in 2016 causing a disconnect in the time series from 2015 to 2016. For
additional details please see Section 10.2.3, page 31.

Appendix
P a g e | 35 Prepared by Ingenium Research - September
2018
Table 35: City of Darwin – Core NTE Establishments, Employment and Turnover ($m) – by sub-sector
Based on 2018 Australian Bureau of Statistics data (CABEE 2013-2017 dataset), Ref: WTS1/3_LGA
10.3.4. Queensland
Table 36: Queensland – Core NTE Establishments, Employment and Turnover ($m) – by sub-sector
Based on 2018 Australian Bureau of Statistics data (CABEE 2013-2017 dataset), Ref: WTS1/3_State
Table 37: Brisbane City Council – Core NTE Establishments, Employment and Turnover ($m) – by sub-sector
Based on 2018 Australian Bureau of Statistics data (CABEE 2013-2017 dataset), Ref: WTS1/3_LGA

Appendix
P a g e | 36 Prepared by Ingenium Research - September
2018
Table 38: City of Gold Coast – Core NTE Establishments, Employment and Turnover ($m) – by sub-sector
Based on 2018 Australian Bureau of Statistics data (CABEE 2013-2017 dataset), Ref: WTS1/3_LGA
10.3.5. South Australia
Table 39: South Australia – Core NTE Establishments, Employment and Turnover ($m) – by sub-sector
Based on 2018 Australian Bureau of Statistics data (CABEE 2013-2017 dataset), Ref: WTS1/3_State
Table 40: City of Adelaide – Core NTE Establishments, Employment and Turnover ($m) – by sub-sector
Based on 2018 Australian Bureau of Statistics data (CABEE 2013-2017 dataset), Ref: WTS1/3_LGA

Appendix
P a g e | 37 Prepared by Ingenium Research - September
2018
10.3.6. Tasmania
Table 41: Tasmania – Core NTE Establishments, Employment and Turnover ($m) – by sub-sector
Based on 2018 Australian Bureau of Statistics data (CABEE 2013-2017 dataset), Ref: WTS1/3_State
Table 42: City of Hobart – Core NTE Establishments, Employment and Turnover ($m) – by sub-sector
Based on 2018 Australian Bureau of Statistics data (CABEE 2013-2017 dataset), Ref: WTS1/3_LGA
10.3.7. Victoria
Table 43: Victoria – Core NTE Establishments, Employment and Turnover ($m) – by sub-sector
Based on 2018 Australian Bureau of Statistics data (CABEE 2013-2017 dataset), Ref: WTS1/3_State

Appendix
P a g e | 38 Prepared by Ingenium Research - September
2018
Table 44: City of Melbourne – Core NTE Establishments, Employment and Turnover ($m) – by sub-sector
Based on 2018 Australian Bureau of Statistics data (CABEE 2013-2017 dataset), Ref: WTS1/3_LGA
Table 45: Maroondah City Council – Core NTE Establishments, Employment and Turnover ($m) – by sub-sector
Based on 2018 Australian Bureau of Statistics data (CABEE 2013-2017 dataset), Ref: WTS1/3_LGA
Table 46: Port Phillip City Council – Core NTE Establishments, Employment and Turnover ($m) – by sub-sector
Based on 2018 Australian Bureau of Statistics data (CABEE 2013-2017 dataset), Ref: WTS1/3_LGA

Appendix
P a g e | 39 Prepared by Ingenium Research - September
2018
10.3.8. Western Australia
Table 47: Western Australia – Core NTE Establishments, Employment and Turnover ($m) – by sub-sector
Based on 2018 Australian Bureau of Statistics data (CABEE 2013-2017 dataset), Ref: WTS1/3_State
Table 48: City of Perth17 – Core NTE Establishments, Employment and Turnover ($m) – by sub-sector
Based on 2018 Australian Bureau of Statistics data (CABEE 2013-2017 dataset), Ref: WTS1/3_LGA
17 Please note that the Perth LGA boundary was revised in 2016 and is also affected by a change in ABS methodology, both of which
cause a disconnect in the time series from 2015 to 2016. For additional details please see Section 10.2.3, page 31.

Appendix
P a g e | 40 Prepared by Ingenium Research - September
2018
10.4. Core NTE density rankings
Table 49: Ranking of Core NTE establishments density per km2 across the 88 LGAs analysed – part one

Appendix
P a g e | 41 Prepared by Ingenium Research - September
2018
Table 50: Ranking of Core NTE establishments density per km2 across the 88 LGAs analysed – part two