best practices measuring border agency performance …€¦ · measuring border agency performance...
TRANSCRIPT

Measuring Border Agency
Performance
Options for Benchmarking
Best Practices
at
Border Crossings
Gerard Rodrigues
Director, Cargo Operations
Australian Customs and Border Protection Service

Overview of session
• What is Benchmarking? • Methodologies • Measuring performance • Why do we need measures? • Performance indicators • Collecting and Analysing Data • Using Data and Performance Information • The Way Forward

Benchmarking Customs Operations
Definition of Benchmarking
• Business Improvement Process
• Comparing like procedures and performance with others
• Uses data and information to allow analysis
• Is systematic and methodical
• Identifies opportunities or performance “gaps”
• Drives continuous improvement

Benchmarking Customs Operations
Modes of Benchmarking
• Introspective • Compares current with past performance
• Internal • Within an organisation
• External • With other organisations for a one or more processes

Benchmarking Customs Operations
Benefits and Keys to Success
•Identifies Best Practice
•Identifies performance gaps and strengths
•Provides data and information to create a strategy for improvement
•Promotes collaboration and partnerships
•Must have senior management commitment and resources

Benchmarking Customs Operations
General Methodology for Benchmarking
1.
Identify
Process
Form
Team Monitor
Best
Practice
Identify
Partner
Analyse
Process
Gap
Analysis
Action
Plan
TYPICAL
MODEL

Benchmarking Customs Operations
WCO Benchmarking Methodology
3 PHASES
1. PLANNING
• Define objectives and criteria for success
• Select Partners
• Plan for the exercise
• Form team and assign resources
• Obtain Senior Management Commitment

Benchmarking Customs Operations
WCO Benchmarking Methodology
2. EXECUTION
• Map processes
•Collect and analyse data and information
• Site visits
• Collate data and information to enable comparisons
• Identify performance gaps and improvement opportunities

ABOUT CUSTOMS
Benchmarking Customs Operations
WCO Benchmarking Methodology
3. IMPLEMENTATION AND FOLLOW UP
• Create implementation plan
• Implement improvements
• Monitor and evaluate

Measuring Performance – Legal Framework
Why do we need Performance Measures?
“What gets measured, gets done”
International Convention on the
Harmonization of Frontier
Controls of Goods
Revised Kyoto Convention
Country legislation and Service
Standards

ABOUT CUSTOMS
Benchmarking Customs Operations
PERFORMANCE INDICATORS
New Approaches:
Trade and Transport Facilitation in South East
Europe (TTSFE)
Targets, baselines,
outputs, benchmarks

Performance Measurement Systems
• Time-Cost Study (UNESCAP)
• Based on trade corridors
• Showed choke points
• Time Release Studies
• WCO tool
• Allows detailed analysis of processes
• TTFSE black box concept

Performance Measurement Systems
• World Bank - Doing Business Indicators
• World Bank - Logistics Performance Index
•Laufzettel (Control tag/tracer)
Computer based data systems
• eg ACBPS Integragted Cargo System
• Corridor Measurement
TTFSE
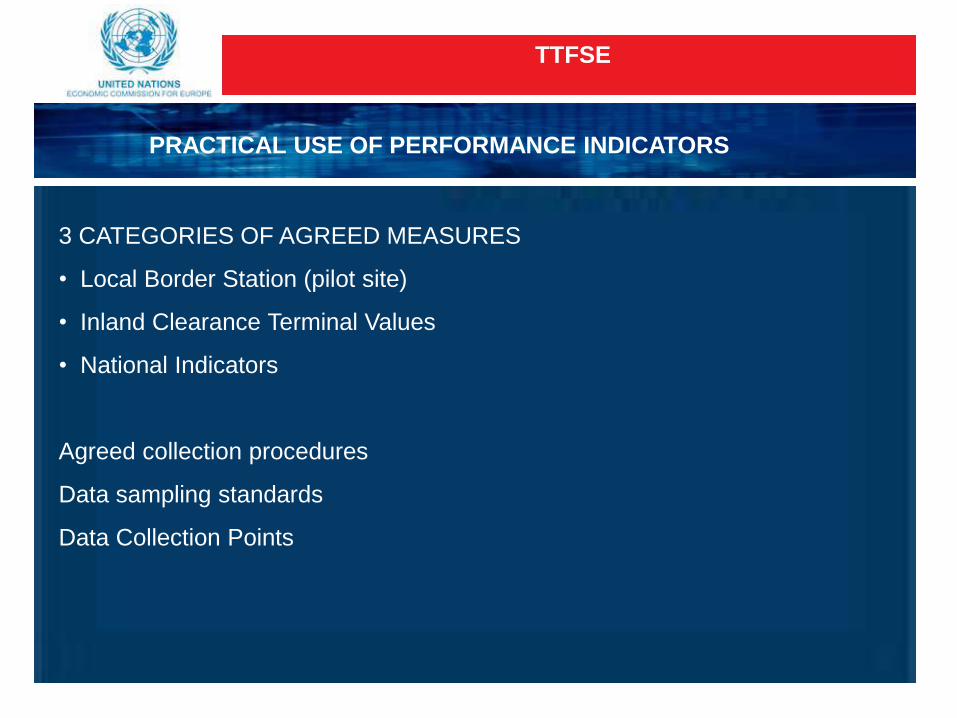
PRACTICAL USE OF PERFORMANCE INDICATORS
3 CATEGORIES OF AGREED MEASURES
• Local Border Station (pilot site)
• Inland Clearance Terminal Values
• National Indicators
Agreed collection procedures
Data sampling standards
Data Collection Points
TTFSE
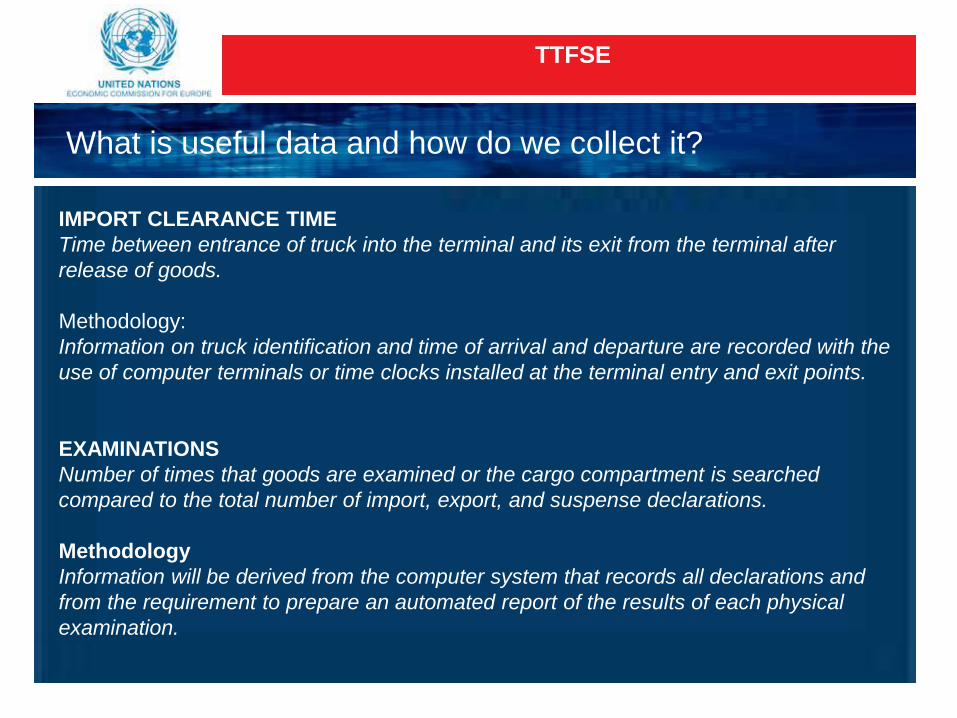
IMPORT CLEARANCE TIME
Time between entrance of truck into the terminal and its exit from the terminal after
release of goods.
Methodology:
Information on truck identification and time of arrival and departure are recorded with the
use of computer terminals or time clocks installed at the terminal entry and exit points.
EXAMINATIONS
Number of times that goods are examined or the cargo compartment is searched
compared to the total number of import, export, and suspense declarations.
Methodology
Information will be derived from the computer system that records all declarations and
from the requirement to prepare an automated report of the results of each physical
examination.
What is useful data and how do we collect it?

TTFSE
PRACTICAL USE OF PERFORMANCE INDICATORS
Number of times that a truck completes import clearance (time between entry into the terminal and departure after release of goods) in less than 15 minutes compared to the total number of import clearances.
PAD methodology
Information will be developed using the same system that provides the data on import clearance times.
TRUCKS CLEARED IN LESS THJAN 15 MINUTES
Number of times that a truck completes import clearance (time between entry
into the terminal and departure after release of goods) in less than 15 minutes
compared to the total number of import clearances.
Methodology
Information will be developed using the same system that provides the data on
import clearance times.
BREACHES or IRREGULARITIES / NUMBER OF EXAMINATIONS
Number of irregularities discovered during physical examinations compared to
the total number of physical examinations carried out.
Methodology
Information will be obtained from the automated reporting of the results of all
physical examinations.

TTFSE
PRACTICAL USE OF PERFORMANCE INDICATORS
TRUCK EXAMINATIONS
Number of trucks actually opened (i.e., seals broken) compared to the total
number of trucks processed.
PAD methodology
Information will be compiled through the use of computerized traffic logs and
the requirement to prepare an automated report of the results of each truck
examination.
IRREGULARITIES / NUMBER OF EXAMINATIONS
Number of irregularities discovered during examinations compared to the
total number of trucks examined.
PAD methodology
Information will be extracted from the automated reports of truck
examinations.

TTFSE
PRACTICAL USE OF PERFORMANCE INDICATORS
AVERAGE ORDER EXIT TIMES
For trucks exiting the country, it is the time between joining the queue and
crossing the border
Methodology
Information on truck identification and times will be recorded continuously
with the use of computer terminals or time clocks installed at appropriate
locations.
AVERAGE ORDER ENTRY TIME
For trucks entering the country, it is the time between crossing the border
and departing the station
Methodology
Same as exit time
For trucks entering the country, it is the time between crossing the border and departing the station
PAD methodology
Same as exit time

TTFSE
PRACTICAL USE OF PERFORMANCE INDICATORS
Number of cases when a driver makes or is asked to make an unauthorized payment compared to the total number of trucks/locations surveyed.
PAD methodology
Information to calculate this indicator will be derived from surveys of truck drivers using the crossing point. This survey will be conducted on a continuous basis through cooperating transport companies.
SURVEYED AND PERMANENT OCCRENCES OF CORRUPTION
Number of cases when a driver of non-driver makes or is asked to make an
unauthorized payment compared to the total number of trucks/locations
surveyed and instances are the time..
Methodology
Information to calculate this indicator will be derived from surveys of truck drivers
using the crossing point. This survey will be conducted on a continuous basis
through cooperating transport companies.
TRADE VOLUMES
NUMER OF DECLARATIONS
TOTAL COST OF OPERATIONS compared to RESULTS

Collecting and Analysing Data and Information
DATA COLLECTION POINTS

TIME RELEASE STUDY
(AUST CUSTOMS & BORDER SECURITY SERVICE)
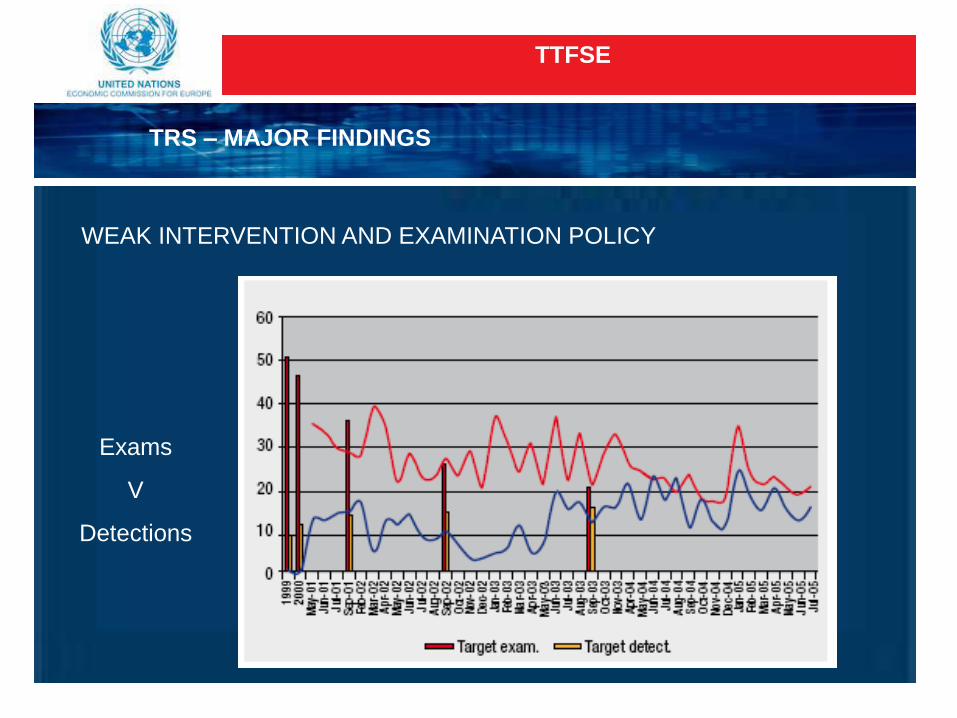
TRS – MAJOR FINDINGS
TIME TARGETS USUALLY ACHIEVED
TTFSE
WEAK INTERVENTION AND EXAMINATION POLICY
TRS – MAJOR FINDINGS
Exams
V
Detections

TTFSE
TRS – MAJOR FINDINGS
ROLE OF PRIVATE SECTOR IN DELAYS
RELATIONSHIP BETWEEN CLEARANCE AND REVENUE

Performance Measurement Systems
CASE STUDY – INTERGRATED CARGO SYSTEM
AUSTRLIAN CUSTOMS & BORDER PROTECTION
INTEGRATED CARGO SYSTEM (ICS)
• Fully integrated electronic reporting and clearance
• Allows for a SINGLE WINDOW for border processing
• Collection, analysis and profiling capability
• Comprehensive reporting and intervention
• Fully auditable

Import Process
TIME RELEASE STUDY
(AUST CUSTOMS & BORDER SECURITY SERVICE)
• Endorsed by the World Customs Organization
• Measures the average time from arrival of goods at the border until permission is given
for the goods to enter home consumption
• provides the border agencies with a holistic view of the cargo operating environment
and how the different parties (government agencies
and industry) impact clearance times
• enables the measurement of year-on-year improvements in clearance times, including
the effects of changes implemented as a result of previous studies or other initiatives
• enables the identification of other improvement opportunities to further streamline
border clearance processes and facilitate trade
•provides industry with a measure of border agency
performance in delivering timely cargo clearance

TIME RELEASE STUDY
(AUST CUSTOMS & BORDER SECURITY SERVICE)
TRS – KEY STEPS
1. ESTABLISH WORKING GROUP
2. SCOPE AND DESIGN
3. PLANNING INCLUDING TYPES OF GOODS, GEOGRAPHY
4. SAMPLING METHODOLOGY
5. DESIGN FORMS
6. DATA COLLECTION AND RECORDING METHODOLOGY
7. ANALYSIS AND VERIFICATION OF DATA (WCO Software?)
8. FINAL REPORT AND RECOMMENDATIONS
9. IMROVEMENTS

TIME RELEASE STUDY
(AUST CUSTOMS & BORDER SECURITY SERVICE)

TIME RELEASE STUDY
(AUST CUSTOMS & BORDER SECURITY SERVICE)

TIME RELEASE STUDY
(AUST CUSTOMS & BORDER SECURITY SERVICE)

CONTAINER EXAMINATION FACILITIES (Australian Customs)
CASE STUDY
• Truck arrival and departure times (lap time) from CRE
• Number of containers arriving
• In-CEF time
• % containers searched (imports/exports)
• Unpack/repack times
• Detections
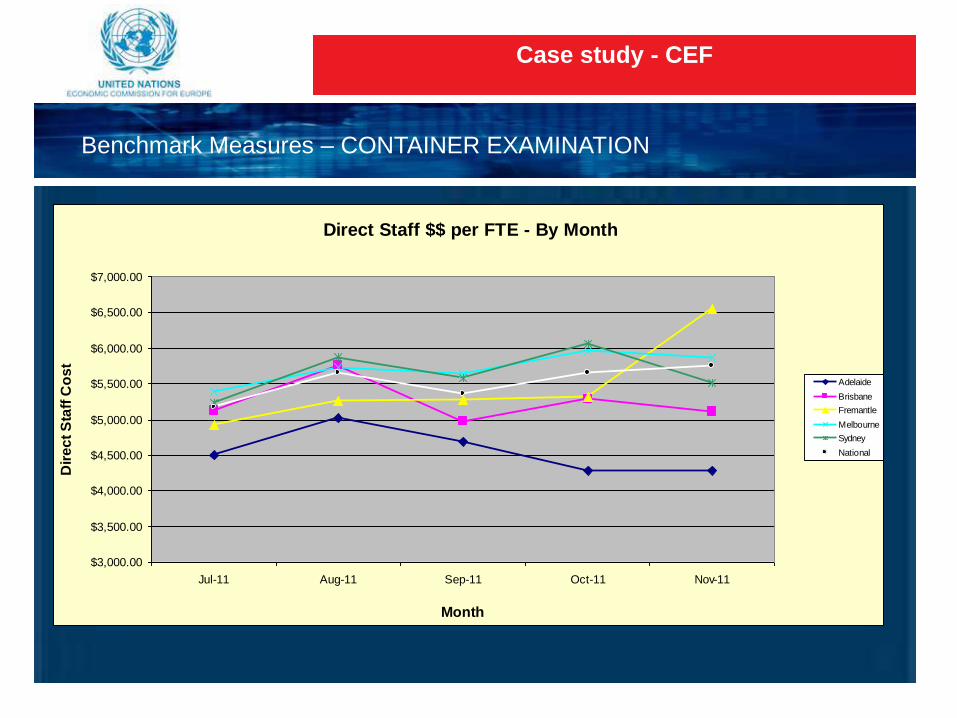
Case study - CEF
Benchmark Measures – CONTAINER EXAMINATION
Direct Staff $$ per FTE - By Month
$3,000.00
$3,500.00
$4,000.00
$4,500.00
$5,000.00
$5,500.00
$6,000.00
$6,500.00
$7,000.00
Jul-11 Aug-11 Sep-11 Oct-11 Nov-11
Month
Dir
ec
t S
taff
Co
st
Adelaide
Brisbane
Fremantle
Melbourne
Sydney
National

Case study - CEF
Benchmark Measures – CONTAINER EXAMINATION
Efficiency Factor - Exams
-0.60
-0.50
-0.40
-0.30
-0.20
-0.10
0.00
0.10
0.20
0.30
0.40
Jul-11 Aug-11 Sep-11 Oct-11 Nov-11
Month
Eff
icie
ncy F
acto
r Brisbane
Fremantle
Melbourne
Sydney
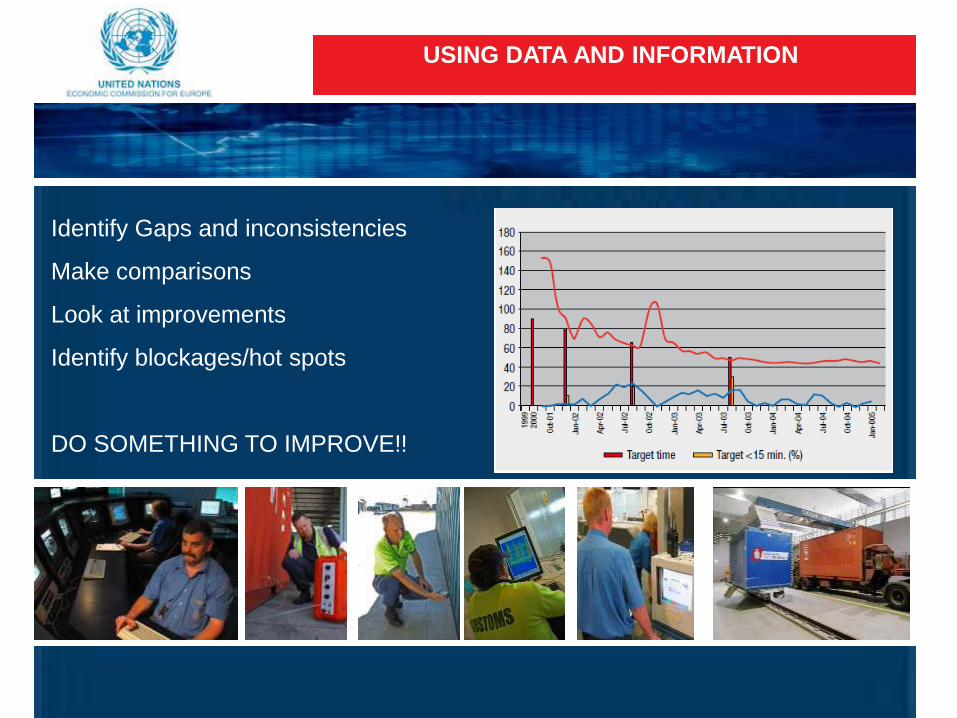
USING DATA AND INFORMATION
Identify Gaps and inconsistencies
Make comparisons
Look at improvements
Identify blockages/hot spots
DO SOMETHING TO IMPROVE!!

THE WAY FORWARD
Standardization of methodology and indicators:
Time
Facilitation
Procedures
Effectiveness measures
Collection methods
Qualitative measures also (not just numbers)
Use of Technology
Institutionalization of measures

KEY MESSAGES
1. Integrity and timeliness of information is dependent on the integrity of
officials
2. What gets measured gets done
3. Collection and analysis of data and information should be embedded in the
process
4. If you are not going to do something with the data, don’t collect it
5. Use data and information to make changes and decisions
6. Benchmarking is about comparison not competition so work collaboratively
7. Strive for perfection and never be satisfied with “close enough is good
enough”

QUESTIONS?