measuring healthy days: population assessment of
TRANSCRIPT
Measuring Healthy Days Population Assessment of Health-Related Quality of Life
U.S. DEPARTMENT OF HEALTH AND HUMAN SERVICES
Centers for Disease Control and Prevention
National Center for Chronic Disease Prevention and Health Promotion
Division of Adult and Community Health
November 2000

Measuring Healthy Days Population Assessment of Health-Related Quality of Life
U.S. DEPARTMENT OF HEALTH AND HUMAN SERVICES
Centers for Disease Control and Prevention
National Center for Chronic Disease Prevention and Health Promotion
Division of Adult and Community Health
Atlanta, Georgia
November 2000
Suggested citation: Centers for Disease Control and Prevention. Measuring Healthy Days. Atlanta, Georgia: CDC, November 2000.
For additional information: For general information about the Healthy Days measures, contact: Health Care and Aging Studies Branch, Mailstop K-45, DACH, NCCDPHP, CDC, 4770 Buford Highway NE, Atlanta, Georgia 30341 (Tel: 770-488-5464). For information about public-domain Behavioral Risk Factor Surveillance System (BRFSS) methods or data, see: http://www.cdc.gov/nccdphp/brfss/ or contact your State BRFSS Coordinator (contact information available on this website).
Acknowledgments: Virginia Ross Taylor (writer-editor), Kerstin Weis (manuscript design), Behavioral Risk Factor Surveillance System State Coordinators, CDC Health Care and Aging Studies Branch staff, reviewers of the draft manuscript who provided comments and corrections, and developers, researchers, and users of the Healthy Days measures, who provided the expert guidance and technical material on which this report was based. The cover design has been adapted from the Mona Lisa by Leonardo da Vinci, which is in the permanent collection of the Musee du Louvre in Paris, France.
Measuring Healthy Days 1
Measuring Healthy Days
EXECUTIVE SUMMARY . . . . . . . . . . . . . . . . . . . . . . . . . . . .4
INTRODUCTION . . . . . . . . . . . . . . . . . . . . . . . . . . . . . . . . .5
Why quality of life? . . . . . . . . . . . . . . . . . . . . . . . . . . . .5
What is quality of life? . . . . . . . . . . . . . . . . . . . . . . . . . .5
What is health-related quality of life? . . . . . . . . . . . . . . .6
Why is it important to track HRQOL? . . . . . . . . . . . . . . . .6
How can HRQOL be measured? . . . . . . . . . . . . . . . . . . . .7
HEALTHY DAYS METHODS . . . . . . . . . . . . . . . . . . . . . . . . .8
How is the summary index of unhealthy days calculated? . . . . . . . . . . . . . . . . . . . . . . .8
Why collect data about health perceptions? . . . . . . . . . . .9
What is the BRFSS? . . . . . . . . . . . . . . . . . . . . . . . . . . . .10
What is the advantage of having core HRQOL questions on the BRFSS? . . . . . . . . . . . . . . . . . . .10
Why ask “How many days . . . “ when other questions like rating your overall health are easier to answer? . . . .10
How can you measure HRQOL with only four questions? .10
Why are most of the measures oriented toward the negative side of health? . . . . . . . . . . . . . . . . . . . . . .11
How do the Healthy Days measures differ from QALYs, DALYs, and YHLs? . . . . . . . . . . . . . . . . . . .12
FINDINGS . . . . . . . . . . . . . . . . . . . . . . . . . . . . . . . . . . . . .12
What have been some of the findings from the Healthy Days core questions? (nationwide, state comparisons, seasonal patterns, and time trends) . .12
VALIDATION . . . . . . . . . . . . . . . . . . . . . . . . . . . . . . . . . . .15
Do these questions accurately measure HRQOL? . . . . . . .15
What challenges in measurement have been identified? . .18
What is being done to address problems in accuracy? . . .19
PRACTICAL APPLICATIONS . . . . . . . . . . . . . . . . . . . . . . . .20
What are some of the cross-cultural uses of the Healthy Days measures? . . . . . . . . . . . . . . . . . . . . . . . . .20
How are the Healthy Days measures useful at the state and local levels? . . . . . . . . . . . . . . . . . . . . . . . . . .20
How are the HRQOL measures being used to identify and address the needs of special populations? . .21
2 Measuring Healthy Days
POLICY IMPLICATIONS . . . . . . . . . . . . . . . . . . . . . . . . . . .26
What are the policy implications of HRQOL surveillance? . . . . . . . . . . . . . . . . . . . . . . . . . . .26
Why is HRQOL surveillance important in Healthy People 2010? . . . . . . . . . . . . . . . . . . . . . . . .26
How do Healthy Days relate to the Healthy People 2010 Leading Health Indicators? . . . . . . .26
How can the Healthy Days measures support epidemiologic and prevention research? . . . . . . . . . . . .28
How can an HRQOL focus support community mobilization? . . . . . . . . . . . . . . . . . . . . . . . .28
CONCLUSIONS AND FUTURE DIRECTIONS . . . . . . . . . . . .29
What are the main advantages of the Healthy Days measures and population data? . . . . . . . . . . . . . . . . . . .29
What areas need future study and analysis? . . . . . . . . . .30
Conclusion . . . . . . . . . . . . . . . . . . . . . . . . . . . . . . . . . .30
REFERENCES . . . . . . . . . . . . . . . . . . . . . . . . . . . . . . . . . . .31
RESOURCES . . . . . . . . . . . . . . . . . . . . . . . . . . . . . . . . . . . .33
TABLES . . . . . . . . . . . . . . . . . . . . . . . . . . . . . . . . . . . . . . .34
Table 1. . . . . . . . . . . . . . . . . . . . . . . . . . . . . . . . . . . . .34
Self-rated health, unhealthy days, and activity limitation days, adjusted for age—Behavioral Risk Factor Surveillance System, 1993–1997, by:
A. demographic group B. health condition C. behavioral risk factor D. self-rated health
Table 2. . . . . . . . . . . . . . . . . . . . . . . . . . . . . . . . . . . . . .37
Health-related quality-of-life measures for states using the optional Quality of Life Module–Behavioral Risk Factor Surveillance System, 1995–1997 by:
A. state and year B. demographic group C. health condition D. behavioral risk factor E. self-rated health F. extent of activity limitation G. main cause of activity limitation
Use of trade names and commercial sources is for identification only and does not imply
endorsement by the U.S. Department of Health and Human Services.
References to non-CDC sites on the Internet are provided as a service and do not con
stitute or imply endorsement of these organizations or their programs by CDC or the U.S.
Department of Health and Human Services. CDC is not responsible for the content of
pages found at these sites.
Measuring Healthy Days 3
Measuring Healthy Days E
xecu
tive
Su
mm
ary
EXECUTIVE SUMMARY World Health Organization’s definition of health. The demonstrated value of these measures and the
This technical report, Measuring Healthy Days, describes the origins, validi-
ty, and value of a set of survey measures developed by the Centers for Disease Control and Prevention (CDC) and its partners for use in tracking population health status and health-related quality of life (HRQOL) in states and communities. The first four of these measures pertain to general self-rated health and recent days of physical health, mental health, and activity limitation. These measures have been part of the full sample Behavioral Risk Factor Surveillance System (BRFSS) core since 1993 and were added, beginning in 2000, to the examination compo
continuous accumulation of public domain data have resulted in support from the CDC Disability, Women’s Health, and Arthritis Programs. The HRQOL measures and data have also been used for research or program planning by
“Health is a state of complete physical,
mental, and social well-being—not merely
the absence of disease, or infirmity.”
—-World Health Organization, 1948
nent of the National Health and Nutrition Examination Survey (NHANES). An additional five measures of activity limitation and five questions on recent days of pain, depression, anxiety, sleeplessness, and vitality constitute an optional quality-of-life module added to the BRFSS in 1995.
The primary target audiences for this report are public health professionals with a current stake or potential interest in HRQOL measurement. The report identifies the policy origins of the Healthy Days measures, discusses how HRQOL differs from other health and social constructs, and summarizes several studies designed to test the reliability, validity, and responsiveness of the measures. It also describes surveillance findings to date and provides methods and population reference data from 1993–97 to assist states and others in the appropriate use and interpretation of their own Healthy Days data.
In recent years, several organizations have found these Healthy Days measures useful at the national level for: 1) identifying health disparities, 2) tracking population trends, and 3) building broad coalitions around a measure of population health compatible with the
the CDC Cardiovascular Health, Nutrition and Physical Activity, and
HIV/AIDS Programs as well as by the Public Health Foundation, the Foundation for Accountability, the American Cancer Society, and several other government and academic programs.
One of the greatest anticipated uses of the BRFSS Healthy Days measures and data is at the state and local
levels in support of the two major goals of Healthy People 2010: Improving the Quality and Years of Healthy Life and Eliminating Health Disparities. Healthy People 2010 identifies the BRFSS as a key source for tracking several HRQOL measures. As knowledge builds about the value of HRQOL surveillance and how to use it, these validated measures and accumulating data give states and communities a unique resource for
tracking adult physical and mental health over time, identifying unmet health needs, and guiding broad community efforts to improve population health.
4 Measuring Healthy Days
INTRODUCTION
This report is designed for use by public health professionals who are involved or interested in health- related quality of life (HRQOL) surveil
lance or measurement. The report identifies the policy and conceptual origins of a set of Healthy Days HRQOL measures that were developed for use as public health outcome measures and summarizes the results of studies designed to test the accuracy and consistency of these measures. It also describes surveillance findings to date and provides analytical methods and population reference data from 1993–1997 to assist states and others in the appropriate use and interpretation of the Healthy Days measures and data.
This report is organized
This reframed definition of health also considered quality of life. As medical and public health advances led to cures and better treatments of existing diseases and delayed mortality, it seemed logical that those who measure health outcomes would begin to assess the population’s health not only on the basis of saving lives, but also in terms of improving them. The public, too, became aware that an important dimension was missing from the traditional health paradigm: the dimension of the quality of a person’s life. Although biochemical measures and morbidity data may indicate the need for treatment, they do not always correlate with the way people feel (Gill 1994, NIH 1993).
Intro
du
ction
around answers to questions peo- “The web of our life is of a mingled ple commonly ask about HRQOL and its measurement. yarn—good and ill together.”
Why quality of life? —-Shakespeare, All’s Well That Ends Well
Although the World Health Organization (WHO) defined health very broad
ly as long as a half century ago, health in the U.S. has traditionally been measured narrowly and in the negative. What is measured is ill health in its severe manifestations, those which are verifiable through physical examination and other objective procedures or tests. These measures have generally been done at the individual level, at clinics and hospitals.
Such traditional measures of morbidity and mortality provide information about the lowest levels of health, but they reveal little about other important aspects of an individual’s or a community’s level of health, including dysfunction and disability associated with diseases, injuries, and other health problems. Developing a composite index of overall health by combining data about the presence or absence of various diseases and conditions is problematic.
In the 1980s, the search began for additional measures to supplement traditional measures of morbidity and mortality. Health status is now seen by the public health community as a multidimensional construct (Patrick 1993). Some of the variables generally considered to be in the domain of health include premature mortality and life expectancy, various symptoms and physiologic states, physical functions, emotional and cognitive functions, and perceptions about present and future health.
What is quality of life?
Quality of life (QOL) is a popular term that conveys an overall sense of well-being, including aspects of happiness and satisfaction with life as
a whole. It is broad and subjective rather than specific and objective. What makes it so challenging to measure is that, although the term “quality of life” has meaning for nearly everyone and every academic discipline, what it actually means is somewhat different for each individual and group. How do you reach accord about a measure for quality of life? Perhaps the strongest area of a consensus is that quality of life is extraordinarily broad and conceptually complex, yet measures are most meaningful when they measure key concepts in a logical way and are as precise as possible.
Although health is an important domain of overall quality of life, there are other domains as well—for instance, jobs, housing, schools, and the neighborhood. Aspects of culture, values, and spirituality are also key aspects of overall quality of life that add to the complexity of its measurement. Nevertheless, researchers in the fields of psychology and sociology have developed useful techniques that have helped to conceptualize and measure these multiple domains and how they relate to each other.
Measuring Healthy Days 5
Intr
od
uct
ion
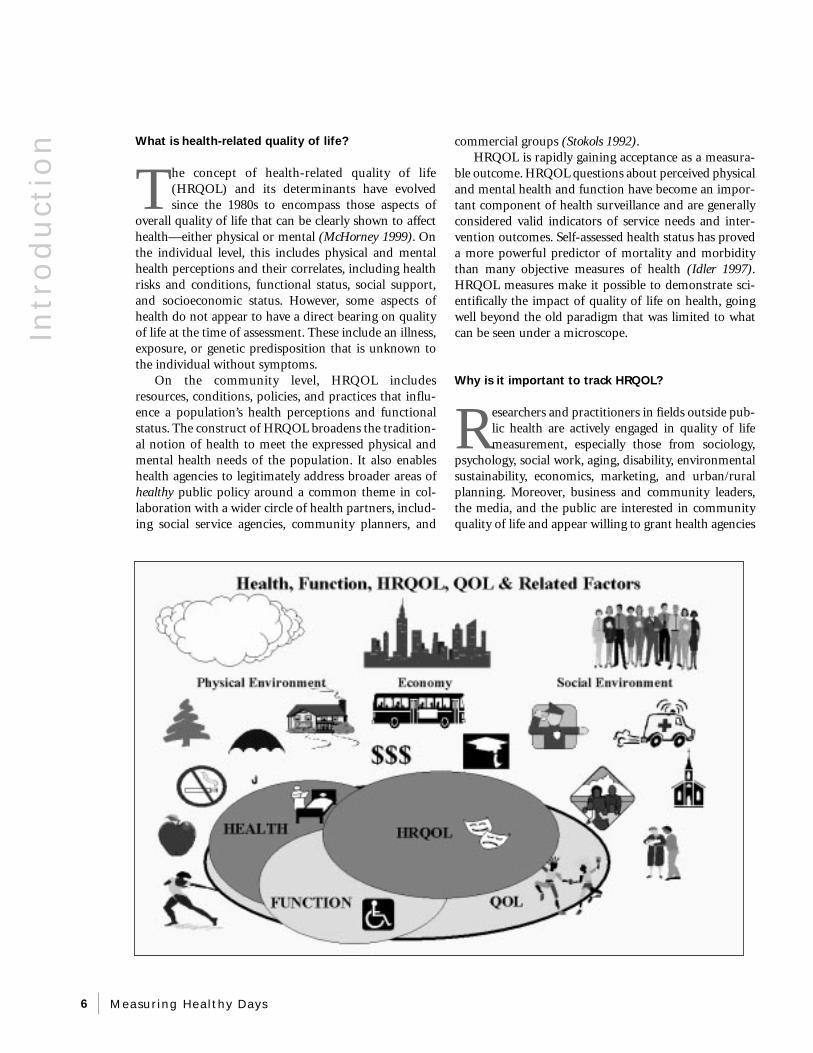
What is health-related quality of life?
The concept of health-related quality of life (HRQOL) and its determinants have evolved since the 1980s to encompass those aspects of
overall quality of life that can be clearly shown to affect health—either physical or mental (McHorney 1999). On the individual level, this includes physical and mental health perceptions and their correlates, including health risks and conditions, functional status, social support, and socioeconomic status. However, some aspects of health do not appear to have a direct bearing on quality of life at the time of assessment. These include an illness, exposure, or genetic predisposition that is unknown to the individual without symptoms.
On the community level, HRQOL includes resources, conditions, policies, and practices that influence a population’s health perceptions and functional status. The construct of HRQOL broadens the traditional notion of health to meet the expressed physical and mental health needs of the population. It also enables health agencies to legitimately address broader areas of healthy public policy around a common theme in collaboration with a wider circle of health partners, including social service agencies, community planners, and
commercial groups (Stokols 1992). HRQOL is rapidly gaining acceptance as a measura
ble outcome. HRQOL questions about perceived physical and mental health and function have become an important component of health surveillance and are generally considered valid indicators of service needs and intervention outcomes. Self-assessed health status has proved a more powerful predictor of mortality and morbidity than many objective measures of health (Idler 1997). HRQOL measures make it possible to demonstrate scientifically the impact of quality of life on health, going well beyond the old paradigm that was limited to what can be seen under a microscope.
Why is it important to track HRQOL?
Researchers and practitioners in fields outside public health are actively engaged in quality of life measurement, especially those from sociology,
psychology, social work, aging, disability, environmental sustainability, economics, marketing, and urban/rural planning. Moreover, business and community leaders, the media, and the public are interested in community quality of life and appear willing to grant health agencies
6 Measuring Healthy Days
CDC Mission
“to promote health and quality of life by preventing,
and controlling disease, injury and disability”
Intro
du
ction
a major responsibility for measuring and helping to sustain it. Focusing on HRQOL as a national health standard can thereby bridge artificial boundaries between disciplines and between social, mental, and medical services (Pope 1991).
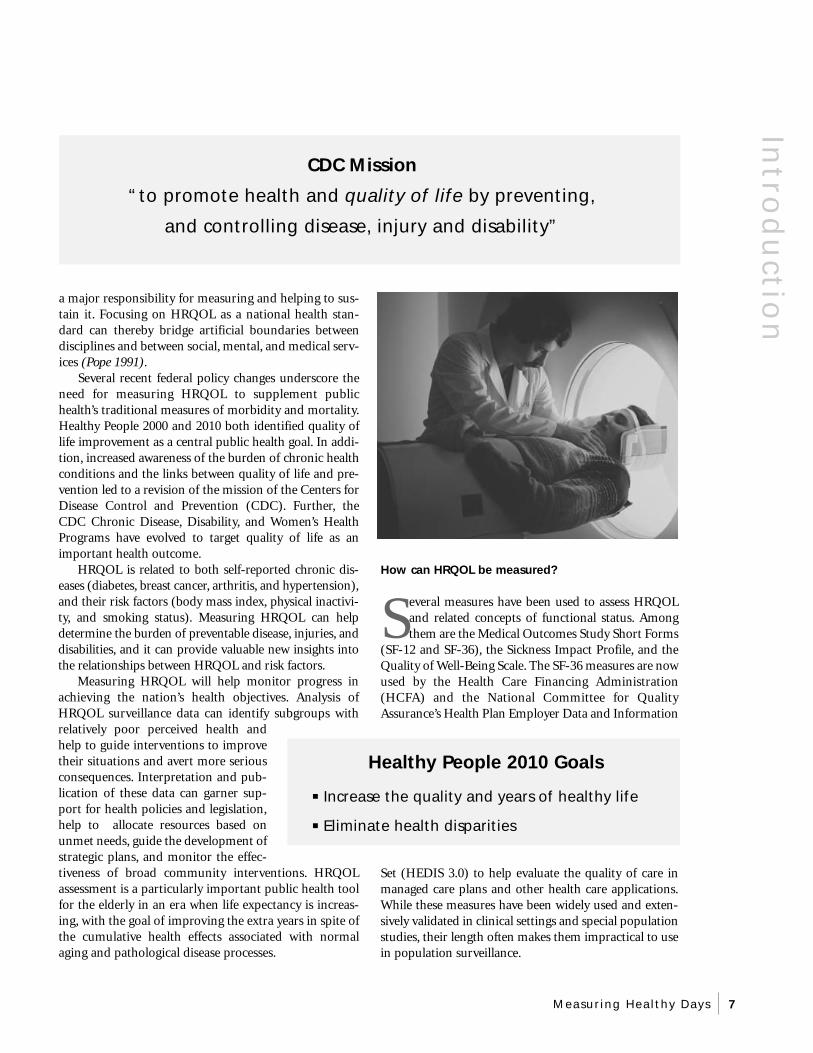
Several recent federal policy changes underscore the need for measuring HRQOL to supplement public health’s traditional measures of morbidity and mortality. Healthy People 2000 and 2010 both identified quality of life improvement as a central public health goal. In addition, increased awareness of the burden of chronic health conditions and the links between quality of life and prevention led to a revision of the mission of the Centers for Disease Control and Prevention (CDC). Further, the CDC Chronic Disease, Disability, and Women’s Health Programs have evolved to target quality of life as an important health outcome.
HRQOL is related to both self-reported chronic diseases (diabetes, breast cancer, arthritis, and hypertension), and their risk factors (body mass index, physical inactivity, and smoking status). Measuring HRQOL can help determine the burden of preventable disease, injuries, and disabilities, and it can provide valuable new insights into the relationships between HRQOL and risk factors.
Measuring HRQOL will help monitor progress in achieving the nation’s health objectives. Analysis of HRQOL surveillance data can identify subgroups with relatively poor perceived health and help to guide interventions to improve
How can HRQOL be measured?
Several measures have been used to assess HRQOL and related concepts of functional status. Among them are the Medical Outcomes Study Short Forms
(SF-12 and SF-36), the Sickness Impact Profile, and the Quality of Well-Being Scale. The SF-36 measures are now used by the Health Care Financing Administration (HCFA) and the National Committee for Quality Assurance’s Health Plan Employer Data and Information
their situations and avert more serious Healthy People 2010 Goals consequences. Interpretation and publication of these data can garner sup- ■ Increase the quality and years of healthy life port for health policies and legislation, help to allocate resources based on ■ Eliminate health disparities unmet needs, guide the development of strategic plans, and monitor the effectiveness of broad community interventions. HRQOL assessment is a particularly important public health tool for the elderly in an era when life expectancy is increasing, with the goal of improving the extra years in spite of the cumulative health effects associated with normal aging and pathological disease processes.
Set (HEDIS 3.0) to help evaluate the quality of care in managed care plans and other health care applications. While these measures have been widely used and extensively validated in clinical settings and special population studies, their length often makes them impractical to use in population surveillance.
Measuring Healthy Days 7
He
alt
hy
Da
ys M
eth
od
s HEALTHY DAYS METHODS
To meet the need for a standard set of valid HRQOL measures that could be used in our national health surveillance system, a collabora
tive program was initiated in 1989 by the Division of Adult and Community Health (DACH) in the CDC’s National Center for Chronic Disease Prevention and Health Promotion (NCCDPHP). This HRQOL surveillance program received its initial direction and guidance from several planning meetings that included representatives of state and local chronic disease and health promotion programs, relevant academic disciplines, and survey researchers (CDC 1993-1, CDC 1993-2).
During the next several years, the Division worked with CDC’s Disability Prevention Program, Women’s Health Program, National Center for Health Statistics Questionnaire Development Research Lab, and Epidemiology Program Office to develop and validate a compact set of measures that states and communities could use to measure HRQOL (Hennessy 1994). These are the Healthy Days measures, an integrated set of
Core Healthy Days Measures
1. Would you say that in general your health is excellent, very good, good, fair, or poor?
2. Now thinking about your physical health, which includes physical illness and injury, for how many days during the past 30 days was your physical health not good?
3. Now thinking about your mental health, which includes stress, depression, and problems with emotions, for how many days during the past 30 days was your mental health not good?
4. During the past 30 days, for about how many days did poor physical or mental health keep you from doing your usual activities, such as self-care, work, or recreation?
Definition
Health-related quality of life
“An individual’s or group’s perceived
physical and mental health over time”
broad questions about recent perceived health status and activity limitation. On the basis of a synthesis of the scientific literature and advice from its public health partners, the CDC has defined HRQOL as “an individual’s or group’s perceived physical and mental health over time.”
The core Healthy Days measures assess a person’s perceived sense of well-being through four questions on: 1) self-rated health, 2) number of recent days when physical health was not good, 3) number of recent days when mental health was not good, and 4) number of recent activity limitation days because of poor physical or mental health (see BRFSS “Health Status” questions @ http://www.cdc.gov/nccdphp/brfss/). For the Healthy Days measures, recent is defined as during the past 30 days.
The first item measures overall self-rated health on a scale from poor through excellent. Question #2 on physical health is a global measure of recent physical symptoms, and question #3 is a global measure of recent mental and emotional distress. Mental and physical health are probed in separate questions in order to link quality of life measurement to the medical, mental health, and behavioral medicine fields. Question #4 about recent activity limitation is a global indicator of perceived disability as well as an indicator of productivity and human capital.
How is the summary index of unhealthy days
calculated?
Unhealthy days are an estimate of the overall number of days during the previous 30 days when the respondent felt that either his or her
physical or mental health was not good. To obtain an estimate of a person’s overall unhealthy days, responses to questions #2 and #3 are added together, with a logical maximum of 30 unhealthy days. For example, a person who reports 4 physically unhealthy days and 2 mentally unhealthy days is assigned a value of 6 unhealthy days and someone who reports 30 physically unhealthy days
8 Measuring Healthy Days
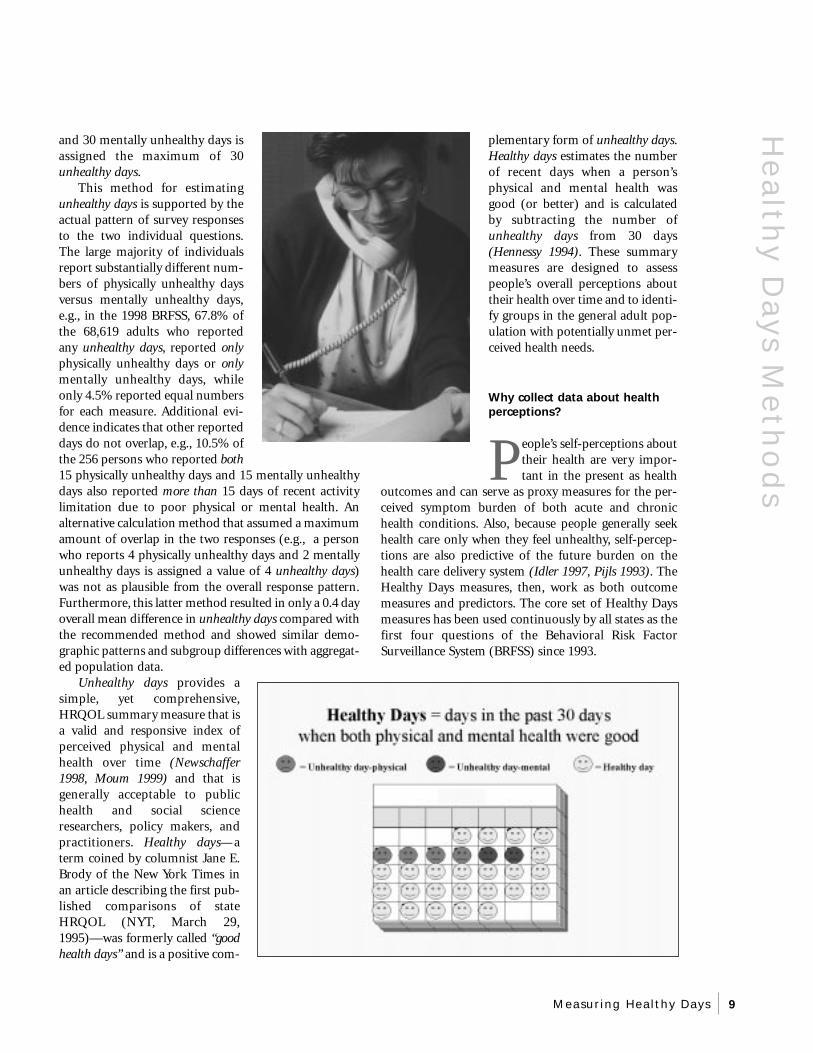
and 30 mentally unhealthy days is plementary form of unhealthy days. assigned the maximum of 30 Healthy days estimates the number unhealthy days. of recent days when a person’s
This method for estimating physical and mental health was unhealthy days is supported by the good (or better) and is calculated actual pattern of survey responses by subtracting the number of to the two individual questions. unhealthy days from 30 days The large majority of individuals (Hennessy 1994). These summary report substantially different num measures are designed to assess bers of physically unhealthy days people’s overall perceptions about versus mentally unhealthy days, their health over time and to identie.g., in the 1998 BRFSS, 67.8% of fy groups in the general adult pop-the 68,619 adults who reported ulation with potentially unmet per-any unhealthy days, reported only ceived health needs. physically unhealthy days or only mentally unhealthy days, while only 4.5% reported equal numbers Why collect data about health for each measure. Additional evi perceptions? dence indicates that other reported
He
alth
y Da
ys Me
tho
ds
days do not overlap, e.g., 10.5% of the 256 persons who reported both 15 physically unhealthy days and 15 mentally unhealthy days also reported more than 15 days of recent activity limitation due to poor physical or mental health. An alternative calculation method that assumed a maximum amount of overlap in the two responses (e.g., a person who reports 4 physically unhealthy days and 2 mentally unhealthy days is assigned a value of 4 unhealthy days) was not as plausible from the overall response pattern. Furthermore, this latter method resulted in only a 0.4 day overall mean difference in unhealthy days compared with the recommended method and showed similar demographic patterns and subgroup differences with aggregated population data.
Unhealthy days provides a simple, yet comprehensive, HRQOL summary measure that is a valid and responsive index of perceived physical and mental health over time (Newschaffer 1998, Moum 1999) and that is generally acceptable to public health and social science researchers, policy makers, and practitioners. Healthy days—a term coined by columnist Jane E. Brody of the New York Times in an article describing the first published comparisons of state HRQOL (NYT, March 29, 1995)—was formerly called “good health days” and is a positive com
People’s self-perceptions about their health are very important in the present as health
outcomes and can serve as proxy measures for the perceived symptom burden of both acute and chronic health conditions. Also, because people generally seek health care only when they feel unhealthy, self-perceptions are also predictive of the future burden on the health care delivery system (Idler 1997, Pijls 1993). The Healthy Days measures, then, work as both outcome measures and predictors. The core set of Healthy Days measures has been used continuously by all states as the first four questions of the Behavioral Risk Factor Surveillance System (BRFSS) since 1993.
Measuring Healthy Days 9

He
alt
hy
Da
ys M
eth
od
s What is the BRFSS?
The BRFSS is a continuous, state-based, random telephone survey of community-dwelling U.S. adults aged 18 and older (see BRFSS website at
http://www.cdc.gov/nccdphp/brfss/). It is the largest, continuously conducted telephone health survey in the world. It helps agencies monitor modifiable risk factors for chronic diseases and other leading causes of death. All 50 states and the District of Columbia participate in the BRFSS, and many specialized national, state, and local surveys use both its methods and its measures. Therefore, the BRFSS is an important public domain resource for continuous, comparable data about population health.
What is the advantage of having core HRQOL questions on the BRFSS?
The BRFSS is the primary source of state-based information on risk behaviors among adult populations. Data collection is flexible, timely, and
ongoing. CDC edits and processes data from each state’s monthly interviews, then returns prevalence information and selected reports to all states for their use, allowing for state-to-state and within-state comparisons. The BRFSS gathers information on age, gender, racial and ethnic background, education, marital and employment status, the county of residence, and other demographic factors so that estimates can be made for specific population groups. These data can be used as a benchmark to determine how perceived health and activity limitations vary over time.
More than 900,000 adults have responded to the core HRQOL questions as part of the BRFSS since their introduction in 1993. Adding the core HRQOL question to the
BRFSS has also stimulated interest in HRQOL as a public health outcome. Because the BRFSS is the survey that most closely tracks geographical and temporal differences, using the core questions on other special population studies and assessments permits comparability with general population data. For comparability with national surveys, the core Healthy Days questions were added to the examination component of the National Health and Examination Survey (NHANES) beginning in 2000.
The BRFSS was chosen as a vehicle for questions on HRQOL because of its broad coverage that permits state- and locality-based estimates and its high visibility as a surveillance mechanism within the public health community. The new annual survey format for NHANES offers additional opportunities for both surveillance and prevention research. Moreover, including the core questions in existing periodic surveys helps minimize the costs of HRQOL surveillance.
Why ask “How many days . . . “ when other questions like rating your overall health are easier to answer?
First, there is a policy value of estimating the burden of disease or disability in days, months, or years because it provides concrete measures that
can be understood by legislators and policy makers and can be used in prevention effectiveness studies to assess cost-effectiveness of alternative interventions. As they go about and plan their lives, people tend to think in terms of monthly intervals. High BRFSS response rates for these questions show that most adults are able to estimate the number of days—even if they are making only rough estimates, e.g., in 1998 there was a 98.6% response rate for recent physical health days, 98.5% for recent mental health days, and 99.3% for recent activity limitation days. In addition, quantifying estimates in terms of days in the most recent month avoids the need to use complex weights in aggregating and comparing data that are based on multiple choice questions. Most important, HRQOL is inherently a time-related phenomenon that is best measured over, or with reference to, a specified period of time.
How can you measure HRQOL with only four questions?
Although the four basic questions may tell how population subgroups rate next to the general population, they do not provide enough infor
mation to identify specific public health interventions because they only track general health needs.
10 Measuring Healthy Days
Therefore, CDC and several state and community health agencies began in January 1995 to collect data on an additional 10-item set of health perception and activity limitation questions. The additional set of 10 questions comprises an optional quality-of-life module that states and communities can choose to include in their surveys (see “Quality of Life Optional Module” questions on the BRFSS questionnaire at http://www.cdc.gov/nccdphp/brfss/). With support from CDC’s Arthritis Program and Disability and Health Program, about half of all states were using the additional 10-question set in 2000.
These questions include measures for pain, depression, anxiety, sleeplessness, and vitality. Data in response to these measures provide more information on specific potentially remediable causes of poor HRQOL indicated by the first four more global measures. The expanded HRQOL-14 questions measure the burden of both short-term and persistent physical and mental health problems in a manner that disease-specific health planners and legislators can use to allocate resources among competing health programs and to guide health policy by tracking important short- and long-term effects of health programs.
The expanded set of questions will make it possible to compare the perceived burdens of diseases and conditions as well as to differentiate health benefits that alternative interventions yield. Use of the expanded set of questions may be one of the most cost-effective ways
Additional Healthy Days Measures
1. any activity limitation
if yes…
of assessing the population need or susceptibility for health services, disease incidence, and death. HRQOL may be a major determinant of many behavioral risks and may be easier to directly modify than the risks themselves. For example, treatment of anxiety and depression among adults who smoke or are overweight may reduce their risk of disease and death and lead them to make and maintain healthy behavioral changes.
Why are most of the measures oriented toward the negative side of health?
Unlike disease or death, HRQOL is a health concept that covers the full spectrum of health and is not inherently positive or negative in its ori
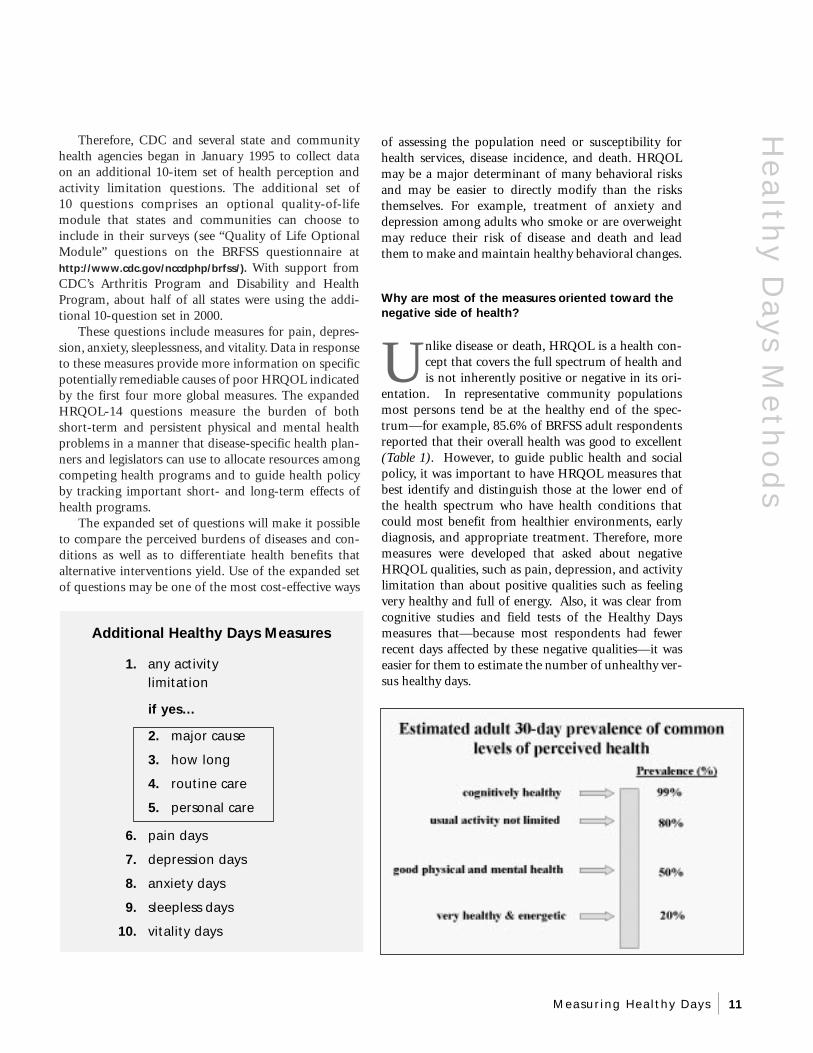
entation. In representative community populations most persons tend be at the healthy end of the spec-trum—for example, 85.6% of BRFSS adult respondents reported that their overall health was good to excellent (Table 1). However, to guide public health and social policy, it was important to have HRQOL measures that best identify and distinguish those at the lower end of the health spectrum who have health conditions that could most benefit from healthier environments, early diagnosis, and appropriate treatment. Therefore, more measures were developed that asked about negative HRQOL qualities, such as pain, depression, and activity limitation than about positive qualities such as feeling very healthy and full of energy. Also, it was clear from cognitive studies and field tests of the Healthy Days measures that—because most respondents had fewer recent days affected by these negative qualities—it was easier for them to estimate the number of unhealthy versus healthy days.
He
alth
y Da
ys Me
tho
ds
2. major cause
3. how long
4. routine care
5. personal care
6. pain days
7. depression days
8. anxiety days
9. sleepless days
10. vitality days
Measuring Healthy Days 11
He
alt
hy
Da
ys M
eth
od
s/Fi
nd
ing
s How do the Healthy Days measures differ from QALYs, DALYs, and YHLs?
Quality-adjusted life years (QALYs) are estimates of person-years lived at particular levels of health. They are mostly used in cost-effec
tiveness analysis and clinical trials involving health conditions that consider the quality as well as the length of life. Quality is typically measured on a scale of zero (death) to 1.0 (perfect health) by assigning various weights to potential health states. There is also a group of somewhat related measures, including Disability-Adjusted Life Years (DALYs) and Years of Healthy Life (YHL), that adjust life expectancy estimates with weighted estimates of health and function (Murray 1998, Erickson 1995). On a population level, these latter types of estimates are most useful for guiding health policy and for modeling what we know about death, disease, and their burden, especially at the national and multi-national level.
In contrast, the Healthy Days measures are direct estimates of a population’s health over time derived from asking a representative sample of people what proportion of their recent days were spent at particular levels of health. Although they could potentially be used for estimating a population’s healthy years of life and health-adjusted life expectancy, they were specifically designed as HRQOL surveillance measures capable of identifying disparities and trends and evaluating changes based on broad population interventions. Because they work well at the community and small-group level and also reflect population preferences for quality as well as length of life, the Healthy Days measures complement the other more complex and comprehensive population health measures.
FINDINGS
What have been some of the findings from the Healthy Days core questions?
Nationwide
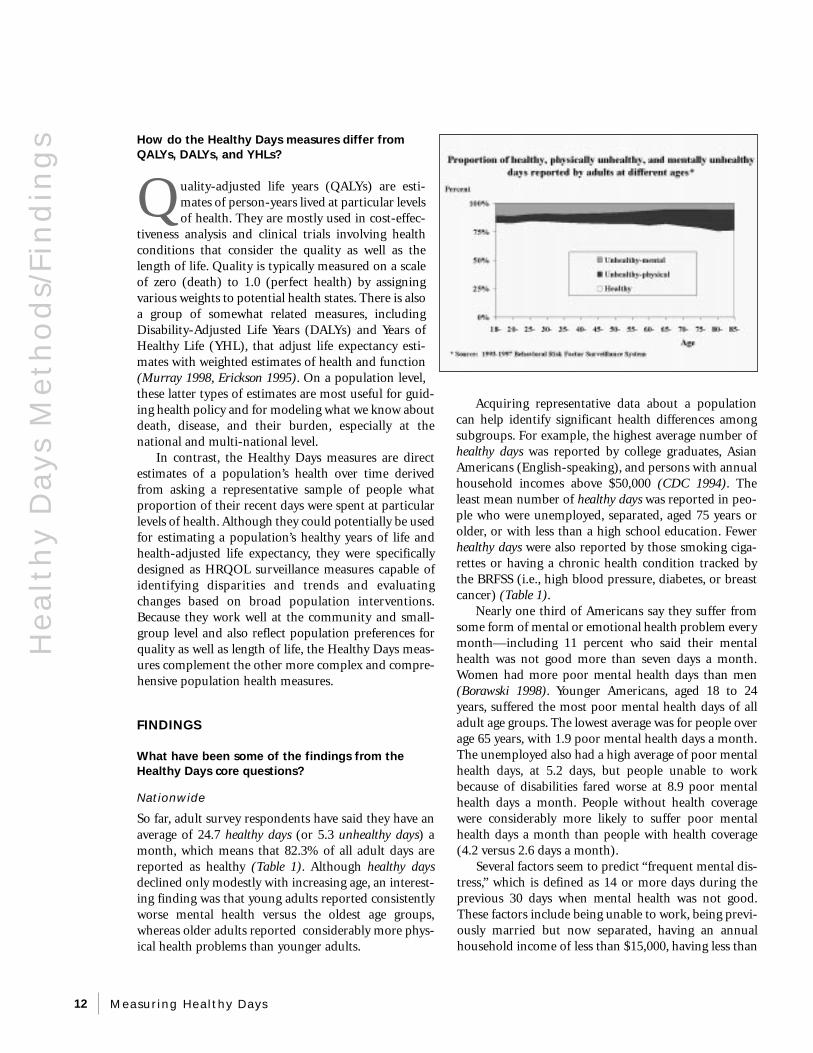
So far, adult survey respondents have said they have an average of 24.7 healthy days (or 5.3 unhealthy days) a month, which means that 82.3% of all adult days are reported as healthy (Table 1). Although healthy days declined only modestly with increasing age, an interesting finding was that young adults reported consistently worse mental health versus the oldest age groups, whereas older adults reported considerably more physical health problems than younger adults.
Acquiring representative data about a population can help identify significant health differences among subgroups. For example, the highest average number of healthy days was reported by college graduates, Asian Americans (English-speaking), and persons with annual household incomes above $50,000 (CDC 1994). The least mean number of healthy days was reported in people who were unemployed, separated, aged 75 years or older, or with less than a high school education. Fewer healthy days were also reported by those smoking cigarettes or having a chronic health condition tracked by the BRFSS (i.e., high blood pressure, diabetes, or breast cancer) (Table 1).
Nearly one third of Americans say they suffer from some form of mental or emotional health problem every month—including 11 percent who said their mental health was not good more than seven days a month. Women had more poor mental health days than men (Borawski 1998). Younger Americans, aged 18 to 24 years, suffered the most poor mental health days of all adult age groups. The lowest average was for people over age 65 years, with 1.9 poor mental health days a month. The unemployed also had a high average of poor mental health days, at 5.2 days, but people unable to work because of disabilities fared worse at 8.9 poor mental health days a month. People without health coverage were considerably more likely to suffer poor mental health days a month than people with health coverage (4.2 versus 2.6 days a month).
Several factors seem to predict “frequent mental distress,” which is defined as 14 or more days during the previous 30 days when mental health was not good. These factors include being unable to work, being previously married but now separated, having an annual household income of less than $15,000, having less than
12 Measuring Healthy Days
Find
ing
s
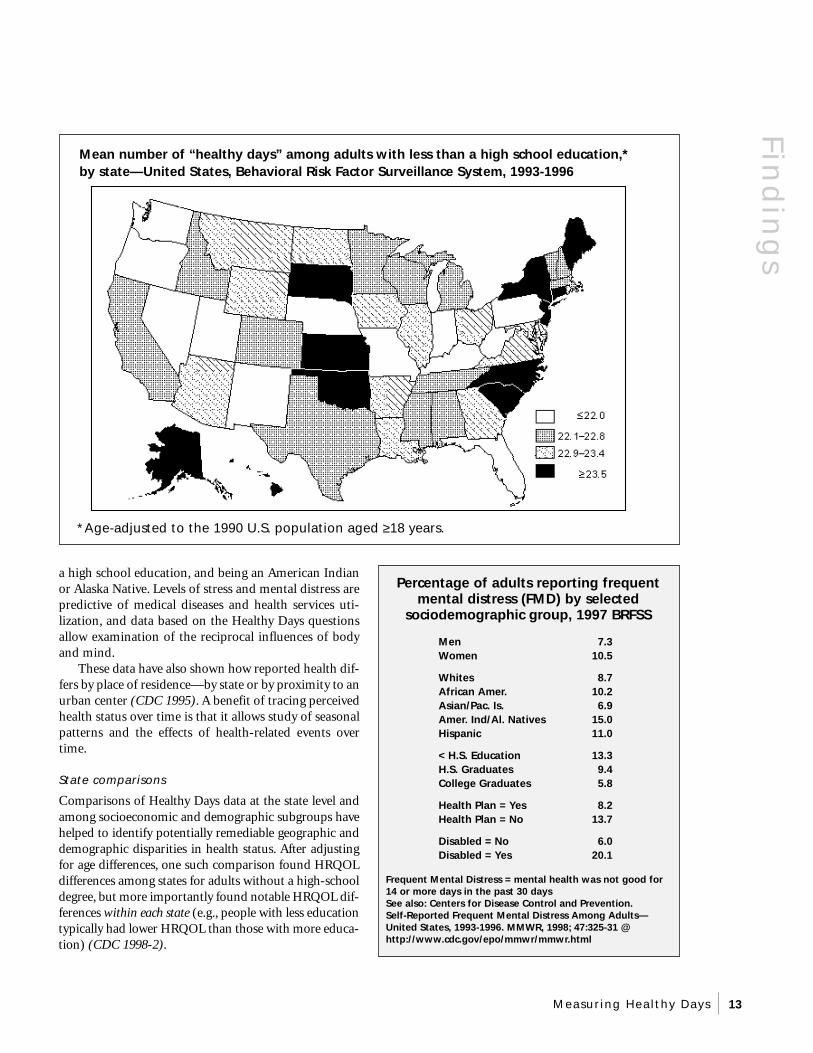
Mean number of “healthy days” among adults with less than a high school education,* by state—United States, Behavioral Risk Factor Surveillance System, 1993-1996
*Age-adjusted to the 1990 U.S. population aged ≥ 18 years.
a high school education, and being an American Indian or Alaska Native. Levels of stress and mental distress are predictive of medical diseases and health services utilization, and data based on the Healthy Days questions allow examination of the reciprocal influences of body and mind.
These data have also shown how reported health differs by place of residence—by state or by proximity to an urban center (CDC 1995). A benefit of tracing perceived health status over time is that it allows study of seasonal patterns and the effects of health-related events over time.
State comparisons
Comparisons of Healthy Days data at the state level and among socioeconomic and demographic subgroups have helped to identify potentially remediable geographic and demographic disparities in health status. After adjusting for age differences, one such comparison found HRQOL differences among states for adults without a high-school degree, but more importantly found notable HRQOL differences within each state (e.g., people with less education typically had lower HRQOL than those with more education) (CDC 1998-2).
Percentage of adults reporting frequent mental distress (FMD) by selected
sociodemographic group, 1997 BRFSS
Men 7.3 Women 10.5
Whites 8.7 African Amer. 10.2 Asian/Pac. Is. 6.9 Amer. Ind/Al. Natives 15.0 Hispanic 11.0
< H.S. Education 13.3 H.S. Graduates 9.4 College Graduates 5.8
Health Plan = Yes 8.2 Health Plan = No 13.7
Disabled = No 6.0 Disabled = Yes 20.1
Frequent Mental Distress = mental health was not good for 14 or more days in the past 30 days See also: Centers for Disease Control and Prevention. Self-Reported Frequent Mental Distress Among Adults— United States, 1993-1996. MMWR, 1998; 47:325-31 @ http://www.cdc.gov/epo/mmwr/mmwr.html
Measuring Healthy Days 13
Fin
din
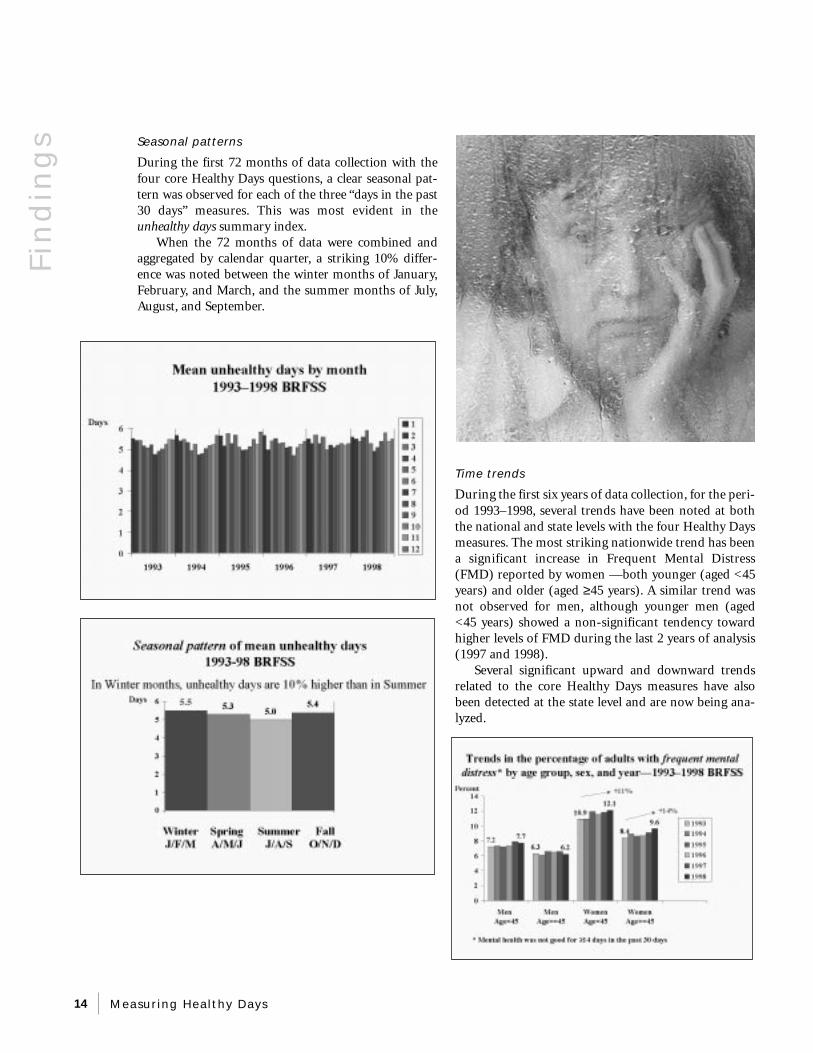
gs Seasonal patterns
During the first 72 months of data collection with the four core Healthy Days questions, a clear seasonal pattern was observed for each of the three “days in the past 30 days” measures. This was most evident in the unhealthy days summary index.
When the 72 months of data were combined and aggregated by calendar quarter, a striking 10% difference was noted between the winter months of January, February, and March, and the summer months of July, August, and September.
Time trends
During the first six years of data collection, for the period 1993–1998, several trends have been noted at both the national and state levels with the four Healthy Days measures. The most striking nationwide trend has been a significant increase in Frequent Mental Distress (FMD) reported by women —both younger (aged <45 years) and older (aged ≥ 45 years). A similar trend was not observed for men, although younger men (aged <45 years) showed a non-significant tendency toward higher levels of FMD during the last 2 years of analysis (1997 and 1998).
Several significant upward and downward trends related to the core Healthy Days measures have also been detected at the state level and are now being analyzed.
14 Measuring Healthy Days
VALIDATION
Do these questions accurately measure HRQOL?
Specifying HRQOL represents a unique effort on the part of national policy makers to formally recognize quality of life as an important component of
health. However, establishing valid and reliable measures of a subjective self-report is challenging. Validity is the degree to which a set of questions measures what it is supposed to measure. Validity can be assessed in several ways. Construct validity is the ability of the question to correlate with other measures that it should correlate with. Criterion validity compares the performance of a measure with some other measure of the condition under study—ideally a “gold standard” accepted in the field. Concurrent criterion validity means the measures being evaluated are correlated with an established criterion measure, both of which are available at the same time. Predictive criterion validity refers to the usefulness of the measure in predicting future health-related events and states (Streiner 1995).
Validation has been identified as an essential prerequisite for a useful set of measures by leaders in both of the major international quality of life research societies: ISQOLS, the professional society that concentrates on general QOL studies, and ISOQOL, the organization dedicated to HRQOL research. Therefore, the CDC HRQOL measurement program has concentrated its initial efforts on validation.
Construct validity
HRQOL, though fundamentally subjective, can be validated by statistically correlating self-reported survey data with other more objective or established health outcomes and measurements. Some studies have examined how the Healthy Days HRQOL measures compare with other established measures like the Medical Outcomes Study Short Form 36 (Newschaffer 1998, Andresen 19991). The SF-36, which is widely used in clinical studies of HRQOL, was developed by the Rand Corporation during the 1980s to measure the functional status and perceived well-being of representative U.S. patient populations. Analyses of the four core questions in representative surveys of adults found that the Healthy Days measures are internally consistent and that they identify known or suspected population groups with unmet health-related needs, including persons with reported chronic health conditions, disabilities, and low socioeconomic status (Diwan 1995, Nanda 1998, Andresen 1999-3, Moriarty 1999-2).
Important HRQOL Validation issues
■ Can HRQOL be clearly defined?
■ Can HRQOL be accurately measured by survey?
Will people answer?
Will their responses make sense?
■ Are responses merely personality-based?
■ Do interviewers influence responses?
■ Are responses consistent with other accepted data?
■ What do results mean in practical policy terms (i.e., why is HRQOL measurement important)?
Validation of BRFSS HRQOL Measures in a Statewide Sample
St. Louis University School of Public Health
C. Newschaffer, J. Jackson-Thompson, M. Counte
Key HRQOL-14 Findings: N=588
1. Good construct validity in a statewide adult population…
■ demography & socioeconomic status
■ reported chronic diseases
■ depression-screen positive
2. Acceptable correlation with related SF-36 scales
depression .55
pain .56
vitality .50
3. BRFSS items explain most variation in SF-36 summary scores
4 Qs -- >59% of PCS (physical)
3 Qs -- >64% of MCS (mental)
Va
lida
tion
Measuring Healthy Days 15
Va
lid
ati
on
Concurrent validity
Several validation studies are being conducted to assess the set of questions. A validation study performed by the St. Louis University Prevention Research Center and the Missouri Department of Health featured a simultaneous comparison of the 14 HRQOL questions on the BRFSS and the SF-36 in a statewide general population (Newschaffer 1998). Results for both sets of measures varied in similar fashion over sample characteristics. The researchers found that the HRQOL-14 has good construct validity and should be considered for both surveillance and research applications. In addition, they determined that the HRQOL-14 has acceptable criterion and known-groups validity. In this study, the healthy day’s summary measure was found to be the most valid measure of a quality-of-life deficit in a mixed population with concurrent physical and mental health problems.
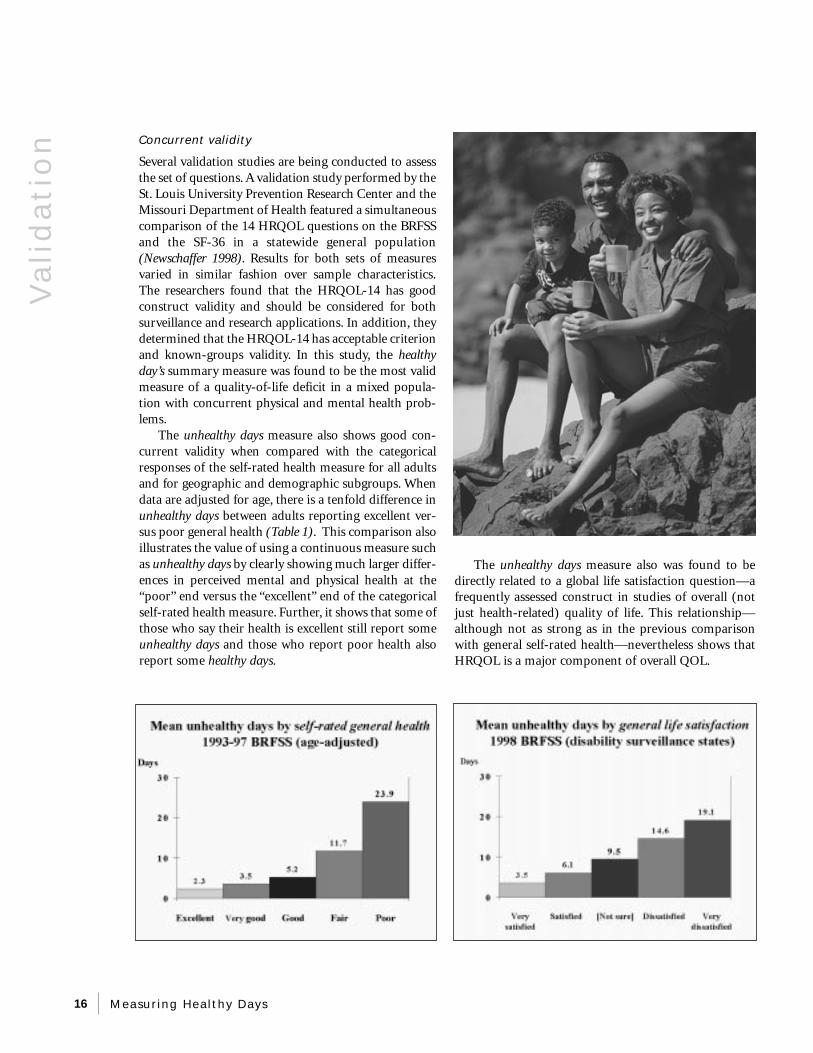
The unhealthy days measure also shows good concurrent validity when compared with the categorical responses of the self-rated health measure for all adults and for geographic and demographic subgroups. When data are adjusted for age, there is a tenfold difference in unhealthy days between adults reporting excellent versus poor general health (Table 1). This comparison also illustrates the value of using a continuous measure such as unhealthy days by clearly showing much larger differences in perceived mental and physical health at the “poor” end versus the “excellent” end of the categorical self-rated health measure. Further, it shows that some of those who say their health is excellent still report some unhealthy days and those who report poor health also report some healthy days.
The unhealthy days measure also was found to be directly related to a global life satisfaction question—a frequently assessed construct in studies of overall (not just health-related) quality of life. This relationship— although not as strong as in the previous comparison with general self-rated health—nevertheless shows that HRQOL is a major component of overall QOL.
16 Measuring Healthy Days
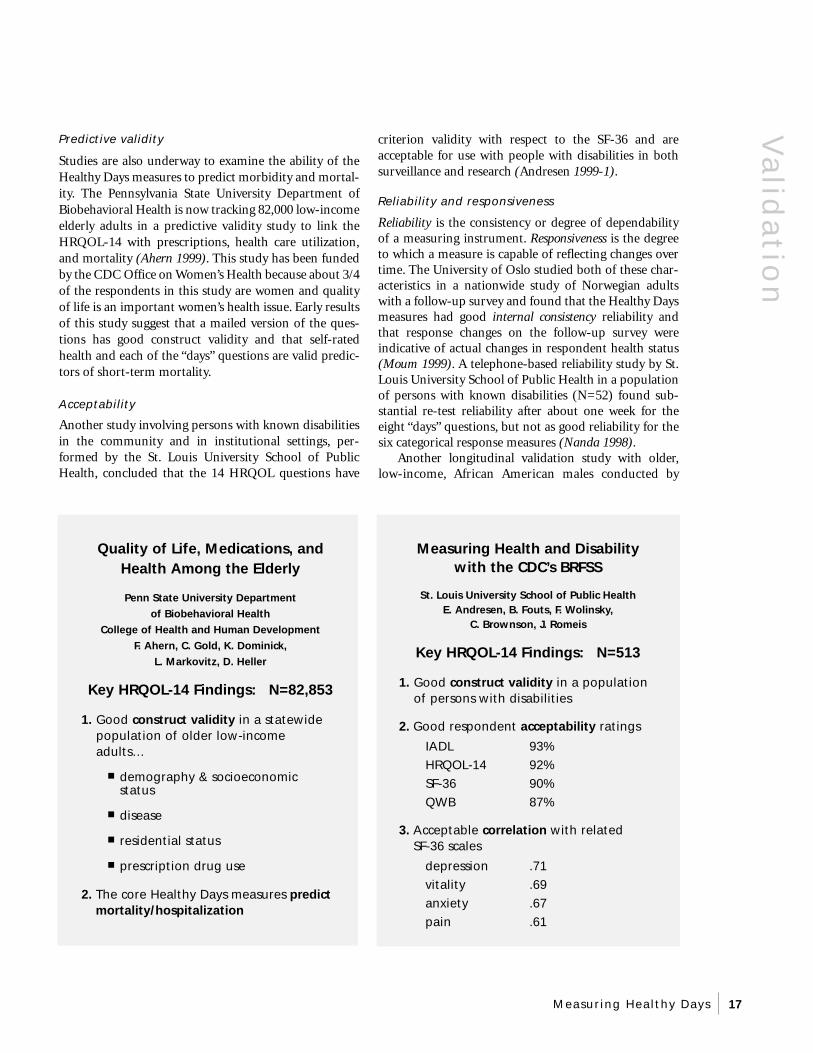
Predictive validity
Studies are also underway to examine the ability of the Healthy Days measures to predict morbidity and mortality. The Pennsylvania State University Department of Biobehavioral Health is now tracking 82,000 low-income elderly adults in a predictive validity study to link the HRQOL-14 with prescriptions, health care utilization, and mortality (Ahern 1999). This study has been funded by the CDC Office on Women’s Health because about 3/4 of the respondents in this study are women and quality of life is an important women’s health issue. Early results of this study suggest that a mailed version of the questions has good construct validity and that self-rated health and each of the “days” questions are valid predictors of short-term mortality.
Acceptability
Another study involving persons with known disabilities in the community and in institutional settings, performed by the St. Louis University School of Public Health, concluded that the 14 HRQOL questions have
Quality of Life, Medications, and Health Among the Elderly
Penn State University Department
of Biobehavioral Health
College of Health and Human Development
F. Ahern, C. Gold, K. Dominick,
L. Markovitz, D. Heller
Key HRQOL-14 Findings: N=82,853
1. Good construct validity in a statewide population of older low-income adults…
■ demography & socioeconomic status
■ disease
■ residential status
■ prescription drug use
2. The core Healthy Days measures predict mortality/hospitalization
criterion validity with respect to the SF-36 and are acceptable for use with people with disabilities in both surveillance and research (Andresen 1999-1).
Reliability and responsiveness
Reliability is the consistency or degree of dependability of a measuring instrument. Responsiveness is the degree to which a measure is capable of reflecting changes over time. The University of Oslo studied both of these characteristics in a nationwide study of Norwegian adults with a follow-up survey and found that the Healthy Days measures had good internal consistency reliability and that response changes on the follow-up survey were indicative of actual changes in respondent health status (Moum 1999). A telephone-based reliability study by St. Louis University School of Public Health in a population of persons with known disabilities (N=52) found substantial re-test reliability after about one week for the eight “days” questions, but not as good reliability for the six categorical response measures (Nanda 1998).
Another longitudinal validation study with older, low-income, African American males conducted by
Measuring Health and Disability with the CDC’s BRFSS
St. Louis University School of Public Health E. Andresen, B. Fouts, F. Wolinsky,
C. Brownson, J. Romeis
Key HRQOL-14 Findings: N=513
1. Good construct validity in a population of persons with disabilities
2. Good respondent acceptability ratings
IADL 93% HRQOL-14 92% SF-36 90% QWB 87%
3. Acceptable correlation with related SF-36 scales
depression .71 vitality .69 anxiety .67 pain .61
Va
lida
tion
Measuring Healthy Days 17
Va
lid
ati
on
Columbia University School of Public Health found that changes in respondents’ answers to the physical health days question were consistent with reported medical care utilization over a period of several months. In this study, the mental health days and depression days measures showed impressive correlations with the Center for Epidemiologic Studies Depression Scale (CES-D).
What challenges in measurement have been
identified?
Some degree of response error is unavoidable when complex concepts are being measured. Response errors can occur if the respondent has difficulty
interpreting either what the question is really asking or what a satisfactory response will be. Further confounding this potential difficulty are issues unique to surveying older respondents, differences in how cultural groups view their health (Larson 1998), and issues inherent in administering surveys by telephone, in-person, or by mail (Moum 1998).
Generally, the response format (in this case, number of days) signals respondents about what sort of infor-
Validation of BRFSS QOL Items: Harlem Prostate Screening Project
Columbia University College
of Physicians and Surgeons
S. Albert
Key HRQOL-14 Findings: N=239
1. Acceptable construct validity in a population of low-income older African American males
2. Good correlation with other scales
pain .60 SF-36 (pain)
days-mental .59 CESD
depression .58 CESD
2. Unhealthy physical days were responsive to changes in reported doctor appointments and hospitalizations
mation is being requested and how to formulate an answer. However, older people often provide narrative answers and are less likely to respond within the format specified by the question. A National Center for Health Statistics (NCHS) cognitive study indicated that older respondents may have trouble translating frequency information recalled from memory into required survey response categories (Beatty 1996, Schechter 1998). The level of their health and activity limitations may not easily be described as occurring or not occurring for a given number of discrete days, and memory problems may further compromise the accuracy of their answers. Many respondents appear to give a response that represents their overall impression of their health over the recent past versus an actual count of days.
Good results on reliability, responsiveness, and validity studies, however, suggest that the response error rate is not too great. For instance, in a recent mixed-mode panel study of the reliability, responsiveness, and other measurement properties of the
18 Measuring Healthy Days
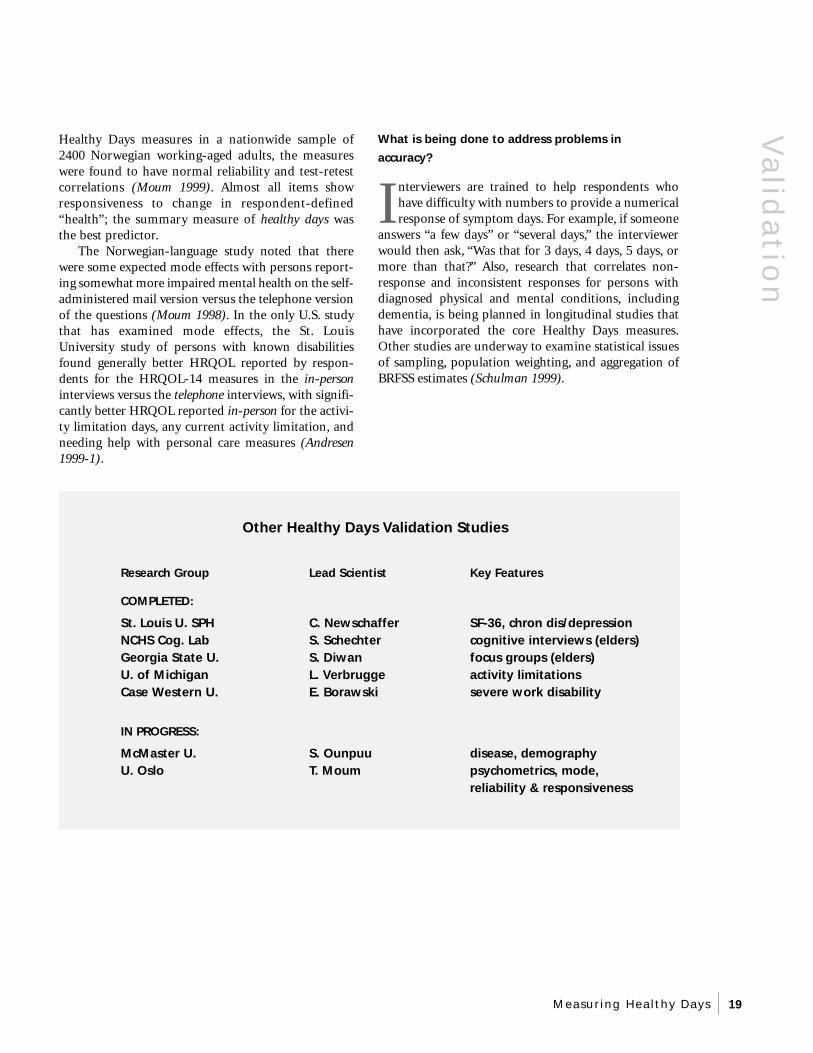
Healthy Days measures in a nationwide sample of What is being done to address problems in 2400 Norwegian working-aged adults, the measures accuracy? were found to have normal reliability and test-retest correlations (Moum 1999). Almost all items show I
nterviewers are trained to help respondents who responsiveness to change in respondent-defined have difficulty with numbers to provide a numerical “health”; the summary measure of healthy days was response of symptom days. For example, if someone the best predictor. answers “a few days” or “several days,” the interviewer
The Norwegian-language study noted that there would then ask, “Was that for 3 days, 4 days, 5 days, or were some expected mode effects with persons report- more than that?” Also, research that correlates noning somewhat more impaired mental health on the self- response and inconsistent responses for persons with administered mail version versus the telephone version diagnosed physical and mental conditions, including of the questions (Moum 1998). In the only U.S. study dementia, is being planned in longitudinal studies that that has examined mode effects, the St. Louis have incorporated the core Healthy Days measures. University study of persons with known disabilities Other studies are underway to examine statistical issues found generally better HRQOL reported by respon- of sampling, population weighting, and aggregation of dents for the HRQOL-14 measures in the in-person BRFSS estimates (Schulman 1999). interviews versus the telephone interviews, with significantly better HRQOL reported in-person for the activity limitation days, any current activity limitation, and needing help with personal care measures (Andresen 1999-1).
Other Healthy Days Validation Studies
Research Group Lead Scientist Key Features
COMPLETED:
St. Louis U. SPH C. Newschaffer SF-36, chron dis/depression NCHS Cog. Lab S. Schechter cognitive interviews (elders) Georgia State U. S. Diwan focus groups (elders) U. of Michigan L. Verbrugge activity limitations Case Western U. E. Borawski severe work disability
IN PROGRESS:
McMaster U. S. Ounpuu disease, demography U. Oslo T. Moum psychometrics, mode,
reliability & responsiveness
Va
lida
tion
Measuring Healthy Days 19
Pra
ctic
al
Ap
pli
cati
on
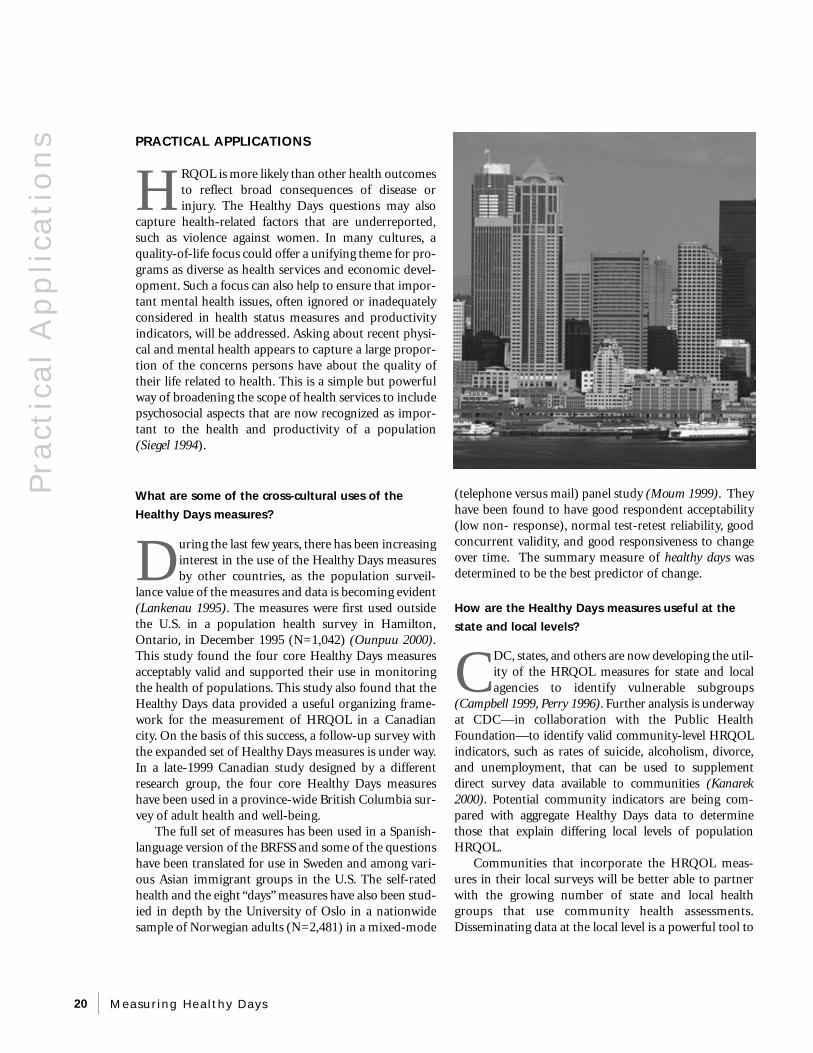
s PRACTICAL APPLICATIONS
HRQOL is more likely than other health outcomes to reflect broad consequences of disease or injury. The Healthy Days questions may also
capture health-related factors that are underreported, such as violence against women. In many cultures, a quality-of-life focus could offer a unifying theme for programs as diverse as health services and economic development. Such a focus can also help to ensure that important mental health issues, often ignored or inadequately considered in health status measures and productivity indicators, will be addressed. Asking about recent physical and mental health appears to capture a large proportion of the concerns persons have about the quality of their life related to health. This is a simple but powerful way of broadening the scope of health services to include psychosocial aspects that are now recognized as important to the health and productivity of a population (Siegel 1994).
What are some of the cross-cultural uses of the
Healthy Days measures?
During the last few years, there has been increasing interest in the use of the Healthy Days measures by other countries, as the population surveil
lance value of the measures and data is becoming evident (Lankenau 1995). The measures were first used outside the U.S. in a population health survey in Hamilton, Ontario, in December 1995 (N=1,042) (Ounpuu 2000). This study found the four core Healthy Days measures acceptably valid and supported their use in monitoring the health of populations. This study also found that the Healthy Days data provided a useful organizing framework for the measurement of HRQOL in a Canadian city. On the basis of this success, a follow-up survey with the expanded set of Healthy Days measures is under way. In a late-1999 Canadian study designed by a different research group, the four core Healthy Days measures have been used in a province-wide British Columbia survey of adult health and well-being.
The full set of measures has been used in a Spanish-language version of the BRFSS and some of the questions have been translated for use in Sweden and among various Asian immigrant groups in the U.S. The self-rated health and the eight “days” measures have also been studied in depth by the University of Oslo in a nationwide sample of Norwegian adults (N=2,481) in a mixed-mode
(telephone versus mail) panel study (Moum 1999). They have been found to have good respondent acceptability (low non- response), normal test-retest reliability, good concurrent validity, and good responsiveness to change over time. The summary measure of healthy days was determined to be the best predictor of change.
How are the Healthy Days measures useful at the
state and local levels?
CDC, states, and others are now developing the utility of the HRQOL measures for state and local agencies to identify vulnerable subgroups
(Campbell 1999, Perry 1996). Further analysis is underway at CDC—in collaboration with the Public Health Foundation—to identify valid community-level HRQOL indicators, such as rates of suicide, alcoholism, divorce, and unemployment, that can be used to supplement direct survey data available to communities (Kanarek 2000). Potential community indicators are being compared with aggregate Healthy Days data to determine those that explain differing local levels of population HRQOL.
Communities that incorporate the HRQOL measures in their local surveys will be better able to partner with the growing number of state and local health groups that use community health assessments. Disseminating data at the local level is a powerful tool to
20 Measuring Healthy Days
foster a sense of community ownership and participation (Dever 1991, IOM 1997). CDC and state and local health agencies benefit by learning about community indicators, concepts of sustainability, and the influences of the environment and the economy on population health.
Adopting a quality of life approach to community health assessment can offer health agencies a popular and positive way to integrate diverse activities and contribute to the vitality of their communities (Moriarty 1996, 1999-1). Impaired health days may reflect poor health days on the job and increased health care use as well as diminished quality of life. These measures translate well to partners in public health such as the business and education communities. Because data based on the Healthy Days measures reflect the combined effects of many groups’ actions in a community, successful interventions and healthy public policies require active partnerships with the community’s major players.
COST-EFFECTIVENESS ANALYSIS
An economic evaluation in which
alternative programs, services, or
interventions are compared in terms of
the cost per unit of clinical effect (for
example, cost per life saved, cost per
millimeter of mercury of blood pressure
lowered, or cost per quality-adjusted
life-year gained). The last form of meas
uring outcomes (and equivalents such
as “healthy days of life gained”) gives
rise to what is also referred to as
COST-UTILITY ANALYSIS.
From: Glossary of Methodologic Terms (American
Medical Association, Archives of Internal Medicine).
http://archinte.ama-assn.org/info/auinst_term.html
How are the HRQOL measures being used to identify
and address the needs of special populations?
Uses in clinical medicine
Although the HRQOL-14 measures were designed for public health surveillance, they may also prove useful in helping to measure the medium- and long-term effects of medical care. Recently, the Foundation for Accountability (FACCT) in Portland, Oregon, has been developing chronic disease outcome measures for diabetes, asthma, and coronary artery disease (See FACCT|ONE at http://www.facct.org/ ). The initial version of these measures includes both the SF-12 (an abbreviated form of the SF-36) and the core Healthy Days questions. Inclusion of the core Healthy Days questions in clinical assessments provides useful data on how patient populations differ from those in the broader geographic community.
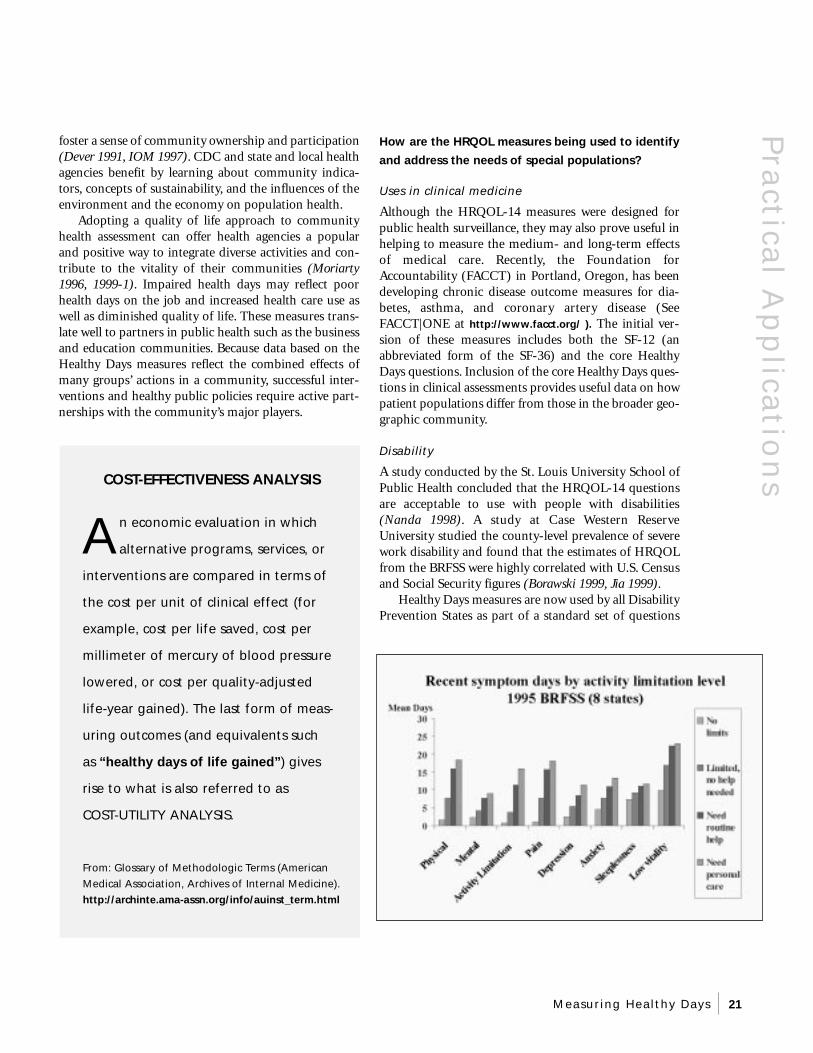
Disability
A study conducted by the St. Louis University School of Public Health concluded that the HRQOL-14 questions are acceptable to use with people with disabilities (Nanda 1998). A study at Case Western Reserve University studied the county-level prevalence of severe work disability and found that the estimates of HRQOL from the BRFSS were highly correlated with U.S. Census and Social Security figures (Borawski 1999, Jia 1999).
Healthy Days measures are now used by all Disability Prevention States as part of a standard set of questions
Pra
ctical A
pp
licatio
ns
Measuring Healthy Days 21
Pra
ctic
al
Ap
pli
cati
on
s
The Severe Work Disability Rate by County, 1995–1996 BRFSS
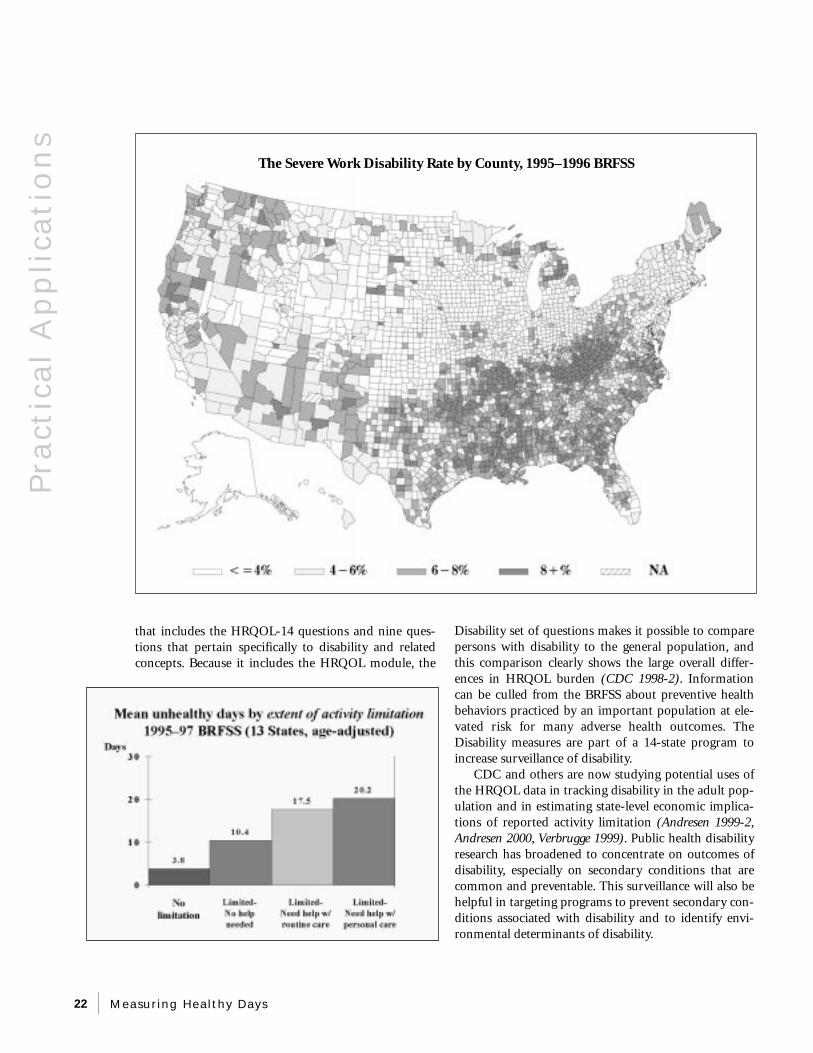
that includes the HRQOL-14 questions and nine questions that pertain specifically to disability and related concepts. Because it includes the HRQOL module, the
Disability set of questions makes it possible to compare persons with disability to the general population, and this comparison clearly shows the large overall differences in HRQOL burden (CDC 1998-2). Information can be culled from the BRFSS about preventive health behaviors practiced by an important population at elevated risk for many adverse health outcomes. The Disability measures are part of a 14-state program to increase surveillance of disability.
CDC and others are now studying potential uses of the HRQOL data in tracking disability in the adult population and in estimating state-level economic implications of reported activity limitation (Andresen 1999-2, Andresen 2000, Verbrugge 1999). Public health disability research has broadened to concentrate on outcomes of disability, especially on secondary conditions that are common and preventable. This surveillance will also be helpful in targeting programs to prevent secondary conditions associated with disability and to identify environmental determinants of disability.
22 Measuring Healthy Days
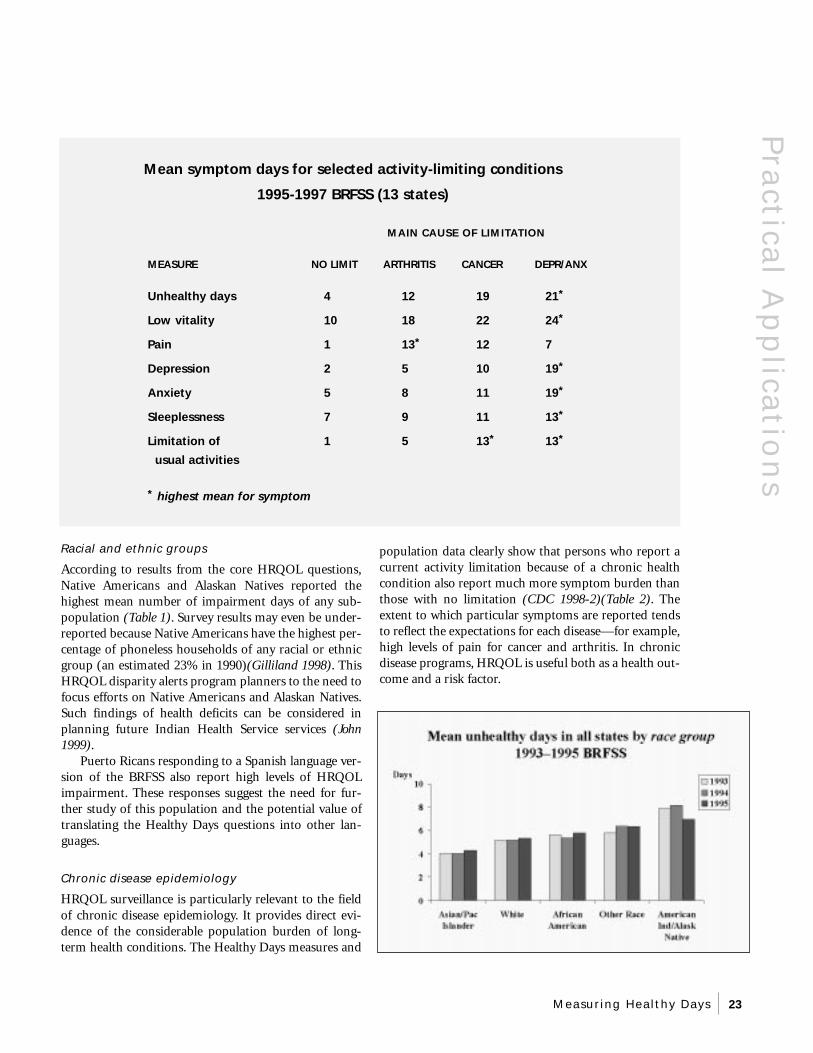
Mean symptom days for selected activity-limiting conditions
1995-1997 BRFSS (13 states)
MAIN CAUSE OF LIMITATION
MEASURE NO LIMIT ARTHRITIS CANCER DEPR/ANX
Unhealthy days 4 12 19 21*
Low vitality 10 18 22 24*
Pain 1 13* 12 7
Depression 2 5 10 19*
Anxiety 5 8 11 19*
Sleeplessness 7 9 11 13*
Limitation of 1 5 13* 13*
usual activities
* highest mean for symptom
Racial and ethnic groups population data clearly show that persons who report a
According to results from the core HRQOL questions, current activity limitation because of a chronic health
Native Americans and Alaskan Natives reported the condition also report much more symptom burden than
highest mean number of impairment days of any sub- those with no limitation (CDC 1998-2)(Table 2). The
population (Table 1). Survey results may even be under- extent to which particular symptoms are reported tends
reported because Native Americans have the highest per- to reflect the expectations for each disease—for example,
centage of phoneless households of any racial or ethnic high levels of pain for cancer and arthritis. In chronic
group (an estimated 23% in 1990)(Gilliland 1998). This disease programs, HRQOL is useful both as a health out-
HRQOL disparity alerts program planners to the need to come and a risk factor.
focus efforts on Native Americans and Alaskan Natives. Such findings of health deficits can be considered in planning future Indian Health Service services (John 1999).
Puerto Ricans responding to a Spanish language version of the BRFSS also report high levels of HRQOL impairment. These responses suggest the need for further study of this population and the potential value of translating the Healthy Days questions into other languages.
Chronic disease epidemiology
HRQOL surveillance is particularly relevant to the field of chronic disease epidemiology. It provides direct evidence of the considerable population burden of long-term health conditions. The Healthy Days measures and
Pra
ctical A
pp
licatio
ns
Measuring Healthy Days 23
Pra
ctic
al
Ap
pli
cati
on
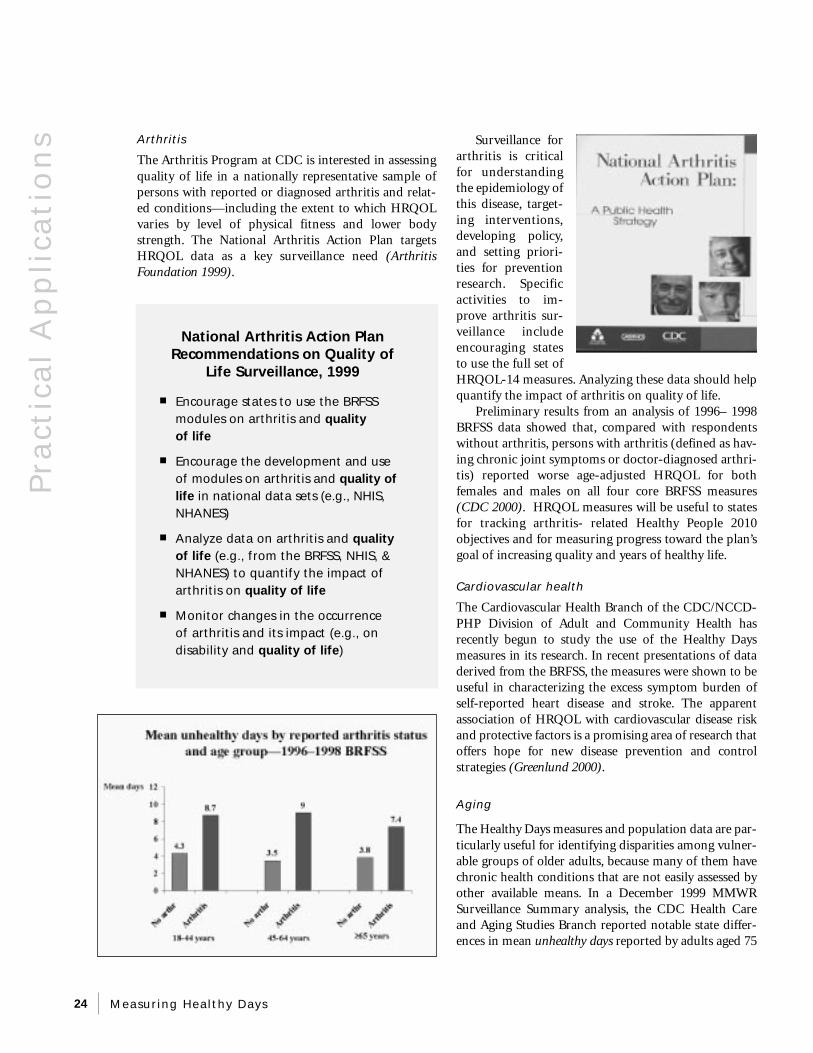
s Arthritis
The Arthritis Program at CDC is interested in assessing quality of life in a nationally representative sample of persons with reported or diagnosed arthritis and related conditions—including the extent to which HRQOL varies by level of physical fitness and lower body strength. The National Arthritis Action Plan targets HRQOL data as a key surveillance need (Arthritis Foundation 1999).
National Arthritis Action Plan Recommendations on Quality of
Life Surveillance, 1999
■ Encourage states to use the BRFSS modules on arthritis and quality of life
■ Encourage the development and use of modules on arthritis and quality of life in national data sets (e.g., NHIS, NHANES)
■ Analyze data on arthritis and quality of life (e.g., from the BRFSS, NHIS, & NHANES) to quantify the impact of arthritis on quality of life
■ Monitor changes in the occurrence of arthritis and its impact (e.g., on disability and quality of life)
Surveillance for arthritis is critical for understanding the epidemiology of this disease, targeting interventions, developing policy, and setting priorities for prevention research. Specific activities to improve arthritis surveillance include encouraging states to use the full set of HRQOL-14 measures. Analyzing these data should help quantify the impact of arthritis on quality of life.
Preliminary results from an analysis of 1996– 1998 BRFSS data showed that, compared with respondents without arthritis, persons with arthritis (defined as having chronic joint symptoms or doctor-diagnosed arthritis) reported worse age-adjusted HRQOL for both females and males on all four core BRFSS measures (CDC 2000). HRQOL measures will be useful to states for tracking arthritis- related Healthy People 2010 objectives and for measuring progress toward the plan’s goal of increasing quality and years of healthy life.
Cardiovascular health
The Cardiovascular Health Branch of the CDC/NCCDPHP Division of Adult and Community Health has recently begun to study the use of the Healthy Days measures in its research. In recent presentations of data derived from the BRFSS, the measures were shown to be useful in characterizing the excess symptom burden of self-reported heart disease and stroke. The apparent association of HRQOL with cardiovascular disease risk and protective factors is a promising area of research that offers hope for new disease prevention and control strategies (Greenlund 2000).
Aging
The Healthy Days measures and population data are particularly useful for identifying disparities among vulnerable groups of older adults, because many of them have chronic health conditions that are not easily assessed by other available means. In a December 1999 MMWR Surveillance Summary analysis, the CDC Health Care and Aging Studies Branch reported notable state differences in mean unhealthy days reported by adults aged 75
24 Measuring Healthy Days
considerable promise for improving
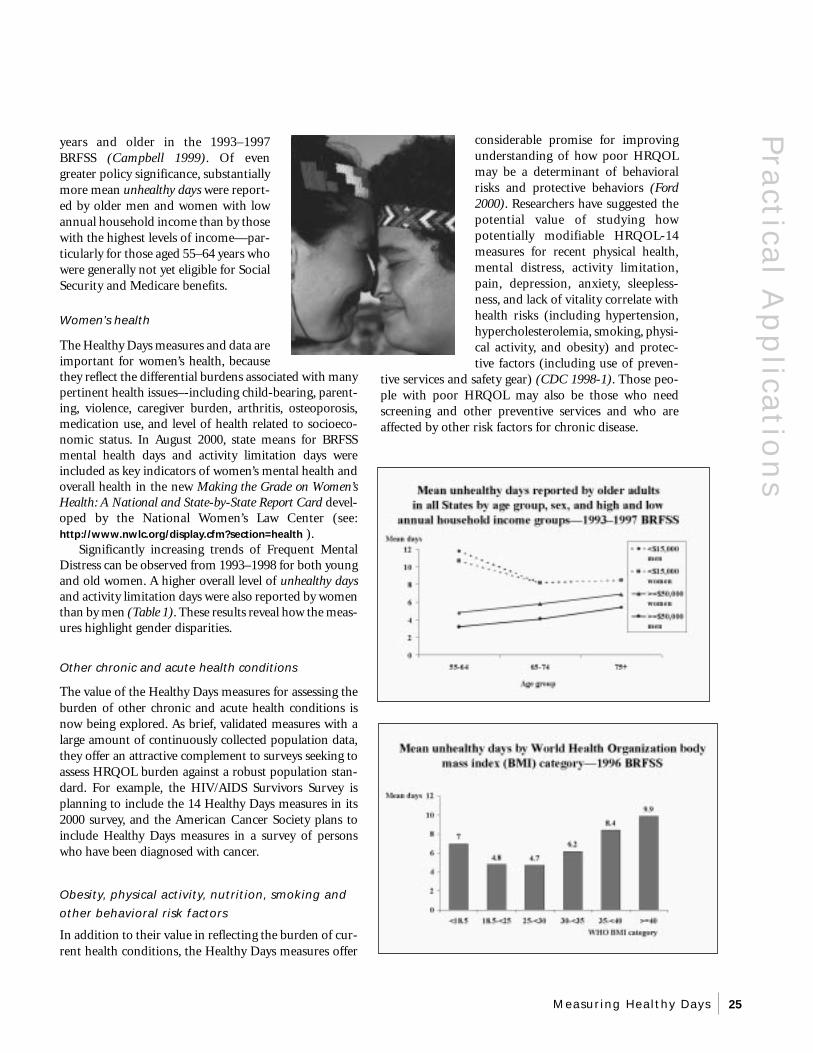
BRFSS (Campbell 1999). Of even years and older in the 1993–1997
understanding of how poor HRQOL
greater policy significance, substantially may be a determinant of behavioral
more mean unhealthy days were report- risks and protective behaviors (Ford
ed by older men and women with low 2000). Researchers have suggested the
annual household income than by those potential value of studying how
with the highest levels of income—par potentially modifiable HRQOL-14
ticularly for those aged 55–64 years who measures for recent physical health,
were generally not yet eligible for Social mental distress, activity limitation,
Security and Medicare benefits. pain, depression, anxiety, sleeplessness, and lack of vitality correlate with health risks (including hypertension, Women’s health hypercholesterolemia, smoking, physi-
The Healthy Days measures and data are cal activity, and obesity) and protecimportant for women’s health, because they reflect the differential burdens associated with many pertinent health issues–-including child-bearing, parenting, violence, caregiver burden, arthritis, osteoporosis, medication use, and level of health related to socioeconomic status. In August 2000, state means for BRFSS mental health days and activity limitation days were included as key indicators of women’s mental health and overall health in the new Making the Grade on Women’s Health: A National and State-by-State Report Card developed by the National Women’s Law Center (see: http://www.nwlc.org/display.cfm?section=health ).
Significantly increasing trends of Frequent Mental Distress can be observed from 1993–1998 for both young and old women. A higher overall level of unhealthy days and activity limitation days were also reported by women than by men (Table 1). These results reveal how the measures highlight gender disparities.
Other chronic and acute health conditions
The value of the Healthy Days measures for assessing the burden of other chronic and acute health conditions is now being explored. As brief, validated measures with a large amount of continuously collected population data, they offer an attractive complement to surveys seeking to assess HRQOL burden against a robust population standard. For example, the HIV/AIDS Survivors Survey is planning to include the 14 Healthy Days measures in its 2000 survey, and the American Cancer Society plans to include Healthy Days measures in a survey of persons who have been diagnosed with cancer.
Obesity, physical activity, nutrition, smoking and
other behavioral risk factors
In addition to their value in reflecting the burden of current health conditions, the Healthy Days measures offer
tive factors (including use of preventive services and safety gear) (CDC 1998-1). Those people with poor HRQOL may also be those who need screening and other preventive services and who are affected by other risk factors for chronic disease.
Pra
ctical A
pp
licatio
ns
Measuring Healthy Days 25
Po
licy
Im
pli
cati
on
s POLICY IMPLICATIONS
What are the policy implications of HRQOL
surveillance?
The Healthy Days measures are beginning to show their value for population surveillance and program planning and evaluation. Because the
Healthy Days measures consistently reflect population differences in educational attainment, income, employment status, marital status, chronic diseases, and disability, and because they correlate with broader community health status indicators such as the proportion of births to adolescents, they offer health agencies a useful tool for guiding healthy public policy and collaborating with partners outside the health community (Institute of Medicine 1997). These measures assess the burden of both short-term and persistent physical and mental health problems in a manner that is not disease-specific. Therefore, health planners and legislators can use the measures and resulting data to help allocate resources among competing health programs and to guide health policy by tracking important short- and long-term effects of health programs. Because of their sensitivity to broad influences such as seasonal patterns and time trends, the Healthy Days measures are also likely to be useful in detecting the impact of major population-based policy or interventions.
Why is HRQOL surveillance important in Healthy
People 2010?
Healthy People 2010, developed with leadership of the Department of Health and Human Services, is the nation’s prevention agenda with a score
card to assess progress toward meeting goals (DHHS 2000). It is a road map that can be used by states, communities, professional organizations, and others who are concerned about increasing life expectancy and enhancing population health. Healthy People 2010 has two major overall goals: 1) to increase the quality and years of healthy life and 2) to eliminate health disparities. By continuously tracking population HRQOL in national and state surveillance systems, the Healthy Days measures and
“To affect the quality of the day—that
is the highest of arts.” —-Thoreau
data will help to directly monitor the nation’s and states’ progress toward meeting the first goal of improved HRQOL. This will help to assure that the net progress in achieving targets set by the Healthy People 2010 objectives in specific focus areas is not offset by unanticipated new diseases, barriers, or health problems.
The second major goal of Healthy People 2010 is to eliminate health disparities among segments of the population. BRFSS and NHANES data obtained from socioeconomic and demographic questions and the Healthy Days measures will help to quantify perceived physical and mental health disparities among population subgroups on the basis of characteristics such as gender, race or ethnicity, education, income, place of residence, and sexual orientation. The Healthy Days population surveillance data also offer great promise as a tool to help identify more precisely which individual behaviors and community-level factors—such as physical activity and safe neighborhoods—contribute to good health. Identifying these factors in turn helps program planners to focus their resources on the health improvement interventions most likely to be effective in eliminating disparities.
How do Healthy Days relate to the Healthy People
2010 Leading Health Indicators?
The leading health indicators are a set of 10 measures intended to make Healthy People 2010 more useful as a focus of national attention and as a tool
for monitoring the health of Americans. Although the full set of objectives for Healthy People 2010 will be used by health professionals, the leading health indicators are
26 Measuring Healthy Days
intended to engage the public and Responsible sexual behavior other health partners. There is Although no such data are currently great potential for using the available for analysis, the core Healthy Healthy Days measures and popu- Days and sexual behavior measures now lation data as a unifying theme that being asked in the NHANES examinalinks the Healthy People 2010 tion component will provide data for a goals, leading health indicators, study of potential connections between and objectives. For example, HRQOL and responsible sexual behav-Healthy Days data can provide ior. This is an important prevention valuable insights on the individual
Po
licy Imp
licatio
ns
and community determinants of the leading health indicators and can demonstrate the overall population effects of improvements in the indicators:
Physical Activity
Cross-sectional analyses show that Healthy Days measures are correlated in expected ways with leisure-time physical activity and inactivity (Table 1). Healthy Days could be useful outcome measures that change positively in response to exercise programs and might also help to predict whether persons will begin and maintain an exercise program.
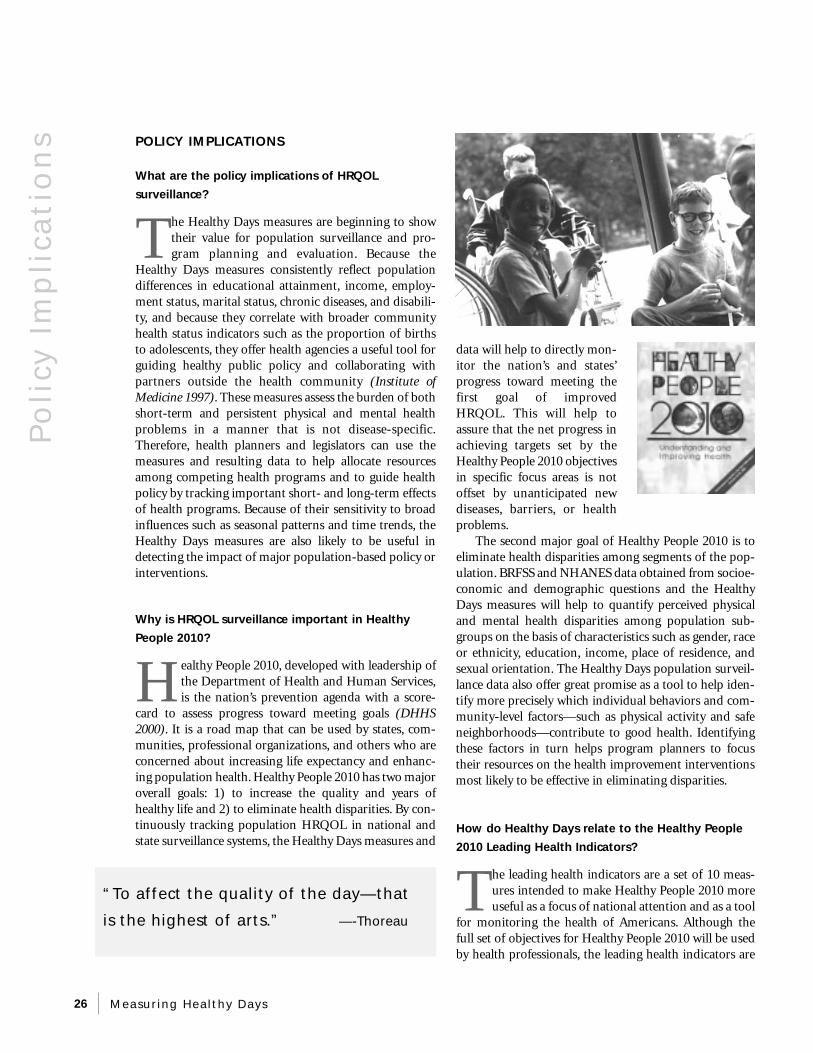
Overweight and obesity
Studies comparing unhealthy days with Body Mass Index (BMI) show that adults who are either underweight or obese report higher levels of impaired HRQOL (Ford 2000)(Table 1). BMI is similarly associated with depression days and anxiety days (Table 2). This information provides valuable insights into the causes and effects of obesity, a major U.S. public health problem.
Tobacco use
Compared with adults who have never smoked, those who are former smokers and current smokers report higher levels of unhealthy days (Table 1). Most of these unhealthy days are attributable to impaired mental rather than physical health, which should help focus exploration on potentially fruitful areas of prevention or health promotion.
Substance abuse
Population data provide some support that HRQOL is lower among those who report high levels of alcohol use in the past month. Although the accuracy of self-reported data may be especially problematic among this group, the collection of data about health perceptions of persons who use and abuse substances may yield new insights into prevention and treatment approaches.
research area that needs exploration.
Mental health
Population surveillance of perceived mental distress—in general as well as symptoms of depression, anxiety, sleeplessness, and lack of vitality—is an integral aspect of the Healthy Days measures (Borawski 1998). Of all adults who report a current activity limitation, those who say that the major cause is depression, anxiety, or some other emotional problem report the highest levels of recent sleeplessness, the lowest levels of vitality, and the highest levels of recent activity limitation (Table 2).
Injury and violence
The Healthy Days measures are potentially useful in measuring the perceived burden of injuries and disabilities—including the effects of partner violence. For example, in one study involving 13 states, the 1.7% of adults who reported a current activity limitation due mainly to a fracture, bone, or joint injury had these limitations for an average of 5.9 years and reported an average of 11.8 recent pain days—10 times as much as adults with no current activity limitation, who averaged only 1.1 pain days (CDC 1998-1)(Table 2).
Environmental quality
Although no analyses have yet been made of the relationships between unhealthy days and environmental quality, community residents who have asthma or similar respiratory conditions would likely report more unhealthy days in periods of poor air quality than during periods of clean air. Poor water and other environmental contaminants are also likely to be associated with reports of low HRQOL.
Immunization
Some BRFSS data are available for analysis of relationships between HRQOL and influenza and pneumonia immunization status. This is a prevention research area that needs exploration.
Measuring Healthy Days 27
Po
licy
Im
pli
cati
on
s Access to care
Adults who report having no health care coverage or insurance also report higher levels of unhealthy days compared with those with coverage (Tables 1, 2), mostly because of the higher levels of perceived mental distress among those with no coverage.
How can the Healthy Days measures support
epidemiologic and prevention research?
The validity, brevity, and comparability of the Healthy Days measures make them ideal additions to existing and new survey instruments to
enhance opportunities for epidemiologic and prevention research.
The addition of the core Healthy Days measures to the NHANES, beginning in 2000, supports public health prevention goals. NHANES measures the national burden of preventable disease, injuries, and disabilities. It will provide valuable new insights into the relationship between HRQOL and clinically-measured health characteristics and conditions such as blood pressure, physical strength and endurance, oral health, and mental health (http://www.cdc.gov/nchs/nhanes.htm).
Moreover, the addition of the HRQOL questions to the NHANES survey is important because it is a nationally representative survey that is linked with other national surveys and health outcomes. NHANES Healthy Days data will help validate people’s self-reports in comparison with the NHANES objective measures of physical health and blood work for interviewed subjects. NHANES studies of the levels of reported unhealthy days and activity limitation days in relation to measured body mass index and physical endurance, as well as to reported nutritional and physical activity patterns, can provide research-based messages to support related health communication objectives. Adding the Healthy
Days questions to NHANES extends the HRQOL surveillance to adolescents as well as adults and will yield important information on the nature and extent of health disparities among geographic and socio-demographic groups.
How can an HRQOL focus support community
mobilization?
The Healthy Days measures have been used effectively in Boone County, Missouri since 1993 to help identify health problems of vulnerable
groups and to justify additional funding for addressing these disparities. The measures are also proving to be valuable for population health assessment in Hamilton, Ontario (Ounpuu 2000), and as community health indicators in King County, Washington (see Communities Count 2000: Social and Health Indicators Across King County at http://www.communitiescount.org). In addition, the utility of the core measures to identify health needs and changes in communities is currently being tested by both the CDC Division of Adult and Community Health and the Urban Research Center Program of the CDC Epidemiology Program Office.
The Healthy Days measures and data have attracted the interest of the National Association of County and City Health Officials (NACCHO), and their applicability to local health agencies has been described in articles in the NACCHO monthly newsletter (Moriarty 1996, Centra 1998). More recently, with support from the Health Resources and Services Administration, the Public Health Foundation and its partners, NACCHO and ASTHO, have included county-level BRFSS data from the four core Healthy Days measures in their July 2000 Community Health Status Indicator (CHSI) reports (see: http://www.communityhealth.hrsa.gov/).
28 Measuring Healthy Days

The PHF is also now collaborating with the CDC to identify county-level indicators of HRQOL—using mean unhealthy days as a summary measure of perceived population physical and mental health (Kanarek 2000). Initial findings from this study show that adults residing in counties with the largest (i.e., ≥ 1 million) and smallest (i.e., <25,000) populations report the highest levels of unhealthy days while those in moderately large counties (i.e., between 500,000 and 999,999 residents) report the lowest level of mean unhealthy days. This study also found that counties with the highest rates of poverty, unemployment, births to teens, severe work disability, age-adjusted mortality, and lack of a high school diploma also had the highest reported levels of unhealthy days in comparison with counties with lower prevalences of these indicators.
The Institute of Medicine (IOM) recognized the value of tracking both self-rated health and the unhealthy days measure in its recent book, Improving Health in the Community: A Role for Performance Monitoring, available in its entirety on the National Academy of Sciences Press website (IOM 1997). The IOM identified these BRFSS-based measures as two of its recommended 25 Community Health Profile indicators that all communities should track. The book also contains a practical set of appendices with specific examples of how the BRFSS HRQOL measures can be used in combination with other measures that individual communities identify as important. For example, one appendix suggests the use of the Healthy Days depressive symptoms measure for estimating the prevalence of adult depression in the community, in conjunction with information on the prevalence of treatment for diagnosed depression and other community correlates of depression.
CONCLUSIONS AND FUTURE DIRECTIONS
The Healthy Days measures and accumulating population data offer considerable promise as part of a new public health paradigm that looks at health
as a broad multidimensional construct, comprising both physical and mental well-being.
What are the main advantages of the Healthy Days
measures and population data?
1. Relate directly to the Healthy People 2010 goals
2. Reflect known demographic and socioeconomic disparities and health patterns
Co
nclu
sion
s
3. Reflect the burden of physical and mental illness and disability
4. Are validated against other established measures (e.g., MOS Short Form 36)
5. Predict short-term mortality and hospitalization
6. Provide new insights into health behaviors
7. Indicate important new policy-relevant disparities and trends
8. Provide a focus for comprehensive community
health programs
9. Provide comparable population data from 1993 onward (nearly one million adults)
10. Are simple to measure, calculate, interpret, and add to other assessments
Measuring Healthy Days 29
Co
ncl
usi
on
s What areas need future study and analysis?
Areas in which future effort will extend the value of the Healthy Days measures include:
1. Use of alternative weighting methods for aggregating multiple years of data and for estimating the sub-state prevalence of HRQOL; use of other analytic methods, such as multilevel analyses, to describe relationships between aggregated BRFSS data and potential community indicators of population HRQOL.
2. Validation studies that simultaneously compare the Healthy Days measures with “gold standard” measures of mental illness, such as the Diagnostic Interview Schedule (DIS) for depression and anxiety; additional validation studies for persons with known major chronic health conditions, such as diabetes, cardiovascular disease, asthma, and cancer.
3. Measurement research, such as sensitivity/specificity analyses, to identify appropriate cutoff points for analysis and population prevalence threshold levels that indicate policy-relevant HRQOL changes for each Healthy Days variable.
4. Studies to demonstrate that the Healthy Days measures are suitable for measuring the HRQOL effects of public health interventions and are therefore suitable for use on cost-effectiveness studies.
5. Studies of mode effects (self-administered versus telephone versus in-person versus proxy) and feasibility in a variety of settings—including prisons, homeless shelters, clinics, and assisted-living and skilled nursing facilities.
Lessons learned from HRQOL surveillance in the U.S.
1. Consensus versus vision no one ideal set of
measures
2. Clarity is critical e.g., perceived good
mental and physical
health over time
3. Brevity is best four questions are easy
to add
4. Validity is essential comparisons with
validated measures;
prediction studies
5. Continuously collected show group
HRQOL data are useful differences, trends,
& socio-environmental
effects
6. Direct measure-to-measure (crosswalk) and risk-adjustment studies that examine potential uses of the continuous population data from the core Healthy Days measures to predict expected HRQOL results in other surveys that use both the Healthy Days and other HRQOL measures.
7. Predictors of HRQOL in persons.
8. Studies of HRQOL among the working-age population, including its effects on productivity and the costs of unhealthy days to employers and society.
9. Multi-variate analyses to quantify the associations of specific individual, group, and environmental characteristics with population HRQOL.
Conclusion
As knowledge builds about HRQOL surveillance and its potential uses, the Healthy Days measures and accumulating population data give states and
communities a unique nationwide standard for identifying and tracking perceived unmet health needs and disparities. Focusing on HRQOL will help health agencies bridge artificial distinctions between physical and mental health and spur collaboration with a wider circle of health partners toward shared goals.
30 Measuring Healthy Days
REFERENCES
Ahern F. Quality of life, medications, and health among the elderly (TS-213 Final report—Part I). State College, PA: Pennsylvania State University, 1999.
Andresen EM, Fouts BS, Romeis JC, Brownson CA. Performance of health-related quality-of life instruments in a spinal cord injured population. Arch Phys Med Rehabil 1999-1; 80:877-84.
Andresen EM, Prince-Caldwell A, Akinci F, Brownson CA, Hagglund K, Jackson-Thompson J, Crocker R. The Missouri disability and health project. Am J Prev Med 1999-2; 16(3S):63-71.
Andresen EM. Population Measurement of Health-Related Quality-of-Life (HRQoL). Quality of Life Newsletter 1999-3 (21):7. (http://www.mapi-research-inst.com/newslett/21/2107.htm) (Accessed 9- 5-2000)
Andresen EM, Brownson RC. Disability and health status: Ethnic differences among women in the United States. J Epidemiol Community Health 2000; 54:200-206.
Arthritis Foundation, Association of State and Territorial Health Officials, CDC. National Arthritis Action Plan: A public health strategy. Atlanta, Georgia: Arthritis Foundation, 1999 (accessible at: http://www.cdc.gov/nccdphp/arthritis.htm).
Beatty P, Schechter S, Whitaker K. Evaluating subjective health questions: cognitive and methodological investigations. Proceedings of the American Statistical Association, Section on Survey Research Methods, 1996.
Borawski E, Wu G, Jia H, SAMHSA, CDC. Self-reported frequent mental distress among adults—United States, 1993–1996. MMWR 1998; 47:325-31.
Borawski EA, Jia H, Wu GW and Case Western Reserve University. The Use of the Behavioral Risk Factor Surveillance System (BRFSS) to estimate the prevalence of state and substate Disability. Atlanta, Georgia: CDC, 1999.
Campbell VA, Crews JE, Moriarty DG, Zack MM, Blackman DK. Surveillance for sensory impairment, activity limitation, and health-related quality of life for older adults. MMWR Surveillance Summary, 1999; 48 (SS-8):131-156.
CDC. Workshop on quality of life/health status surveillance for states and communities: Report of a meeting held on December 2–4, 1991, Stone Mountain, Georgia. Atlanta: Centers for Disease Control and Prevention, 1993-1.
CDC. Consultation on functional status surveillance for states and communities: Report of a meeting held on June 4–5, 1992, Decatur, Georgia. Atlanta: Centers for Disease Control and Prevention, 1993-2.
Re
fere
nce
s
CDC. Quality of life as a new public health measure— Behavioral Risk Factor Surveillance System, 1993. MMWR 1994; 43:375-80.
CDC. Health-related quality of life measures—United States, 1993. MMWR 1995; 44:195-200.
CDC. Health-related quality of life and activity limitation— eight states, 1995. MMWR 1998-1; 47:134-40.
CDC. State differences in reported healthy days among adults— United States, 1993–1996. MMWR 1998-2; 47:239-44.
CDC. Health-related quality of life among adults with arthritis—Behavioral Risk Factor Surveillance System, 11 States, 1996–1998. MMWR 2000; 49:366-69.
Centra L. New information about health-related quality of life. NACCHO News;1998; 13(2):13.
Dever GEA. Community health analysis: Global awareness at the local level. Gaithersburg, MD: Aspen Publishers, 1991.
DHHS. Healthy People 2010: Understanding and improving health. http://web.health.gov/healthypeople/ (accessed 7-52000).
Diwan S, Moriarty DG. A conceptual framework for identifying unmet health care needs of community dwelling elderly. J Applied Geront 1995; 14(1):47-63.
Erickson P, Wilson R, Shannon I. Years of Healthy Life. Healthy People 2000 Statistical Notes (No. 7), DHHS Publication No. (PHS) 95-1237 4-1484 (4/95). http://www.cdc.gov/nchs/data/statnt_7.pdf (Accessed 7-8-2000).
Measuring Healthy Days 31
Re
fere
nce
s Ford ES, Moriarty DG, Zack MM, Mokdad AH, Chapman DP. Self-Reported Body Mass Index and Health-Related Quality of Life: Findings from the Behavioral Risk Factor Surveillance System. Obesity Research (accepted, 8-23-2000).
Gill TM, Feinstein AR. A critical appraisal of the quality of quality-of-life measurements. JAMA 1994; 272:619-26.
Gilliland FD, Mahler R, Davis SM. Health-related quality of life for rural American Indians in New Mexico. Ethnic and Health 1998; 3(13):223-229.
Greenlund KJ, Giles HW, Keenan NL, Croft JB. Health related quality of life associated with cardiovascular disease risk factors among women in the United States. First International Conference on Women, Heart Disease, and Stroke, Victoria, British Columbia, May 7–10, 2000.
Hennessy CH, Moriarty DG, Zack MM, Scherr PA, Brackbill R. Measuring health-related quality of life for public health surveillance. Public Health Reports 1994; 109:665-672.
Idler EL, Benyamini Y. Self-rated health and mortality: A review of twenty-seven community studies. J Health Soc Behav 1997; 38:21-37.
Institute of Medicine. Improving health in the community: A role for performance monitoring. Washington, D.C.: National Academy Press, 1997; http://www.nap.edu/readingroom/enter2.cgi?0309055342.html (accessed July 16, 2000).
Jia, H. Small area estimates of severe work disability prevalence based on the Behavioral Risk Factor Surveillance System. Doctoral thesis; Department of Epidemiology and Biostatistics, Case Western Reserve University; E. Borawski, Thesis Advisor; 1999, 201pp.
John R, Hennessy CH, Denny CH. Preventing chronic illness and disability among Native American elders. In: Serving Minority Elders in the 21st Century. New York: Springer, 1999.
Kanarek N, Sockwell D, Jia H, CDC. Community indicators of health-related quality of life—United States, 1993–1997. MMWR 2000; 49:281-85.
Lankenau, BH, Hennessy CH, Moriarty DG, Schmid TL. Health-related quality of life: A new approach to measuring the health status of a population. Istanbul: Ninth World Productivity Congress, 1995.
Larson CO, Colangelo M, and Goods K. Black-white differences in health perceptions among the indigent. J Ambulatory Care Manage 1998; 21:35-43.
McHorney, CA. Health status assessment methods for adults: past accomplishments and future challenges. Annual Rev Public Health, 1999; 20:309-35.
32 Measuring Healthy Days
Moriarty D. CDC studies community quality of life. NACCHO News; 1996; 12(3):10.
Moriarty D. Health-related quality of life survey. Urban quality indicators; Ann Arbor, MI; 1999-1; 13 (Spring):9.
Moriarty D, Zack M. Validation of the Centers for Disease Control and Prevention’s Healthy Days measures (abstract). Quality of Life Research, Abstracts Issue, 6th Annual Conference of the International Society for Quality of Life Research, Barcelona, Spain, 1999-2; 8(7):617.
Moum TA. Mode of administration and response style effects in self-reported health and health behavior: An experimental broad-population study. Presented at the National Conference on Sociology, Longyearbyen, Spitsbergen, Norway; June 18–20, 1998.
Moum TA. Health-related Quality of Life in Norway—A nationwide mixed-mode panel study of the CDC Healthy Days measures. CDC Quality of Life Seminar; Atlanta, GA, July 28, 1999.
Murray C, Lopez A. The global burden of disease: A comprehensive assessment of mortality and disability from diseases, injuries, and risk factors in 1990 and projected to 2020. 1st ed, Cambridge: Harvard University Press, 1996.
Murray CJ, Michaud CM, McKenna MT, Marks, JS. U.S. patterns of mortality by county and race: 1965–1994. Cambridge, MA: Harvard Center for Population and Development Studies and Atlanta: CDC, 1998.
Nanda U, Andresen EM. Performance of measures of health-related quality of life and function among disabled adults (abstract). Qual Life Res 1998; 7:644.
Newschaffer CJ. Validation of Behavioral Risk Factor Surveillance System (BRFSS) HRQOL measures in a statewide sample. Atlanta: CDC, 1998.
NIH. Quality of life assessment: Practice, problems, and promise—proceedings of a workshop. Bethesda, Maryland: NIH, 1993.
Ounpuu S, Kreuger P, Vermeulen M, Chambers L. Using the U.S. Behavior[al] Risk Factor Surveillance System’s health related quality of life survey tool in a Canadian city. Can J Public Health, 2000; 91(1):67-72.
Patrick DL, Erickson P. Health status and health policy: Quality of life in health care evaluation and resource allocation. New York: Oxford University Press, 1993.
Perry M, Tasheff L, Marmet P, Miller C, Potsic S, Pezzino G. Factors associated with self-perceived excellent and very good health among blacks—Kansas, 1995. MMWR 1996; 45:906911.
Pijls LT, Feskens EJ, Kromhout D. Self-rated health, mortality, and chronic diseases in elderly men: The Zutphen study, 1985–1990. Amer J Epidemiol 1993; 138(10):840-8.
Pope AM, Tarlov AR, eds. Disability in America: Toward a national agenda for prevention. Washington, DC: National Academy Press, 1991.
Schechter S, Beatty P, Willis, GB. Asking survey respondents about health status: Judgment and response issues. In: Cognition, Aging, and Self-reports. Philadelphia: Psychology Press, 1998.
Schulman J. Can BRFSS data be pooled for national estimates? Presented at the 16th annual BRFSS Conference, Minneapolis, MN, May 1999.
Siegel PZ. Self-reported health status: public health surveillance and small-area analysis. In: Schechter S, ed. Proceedings of the 1993 NCHS Conference on the Cognitive Aspects of Self-Reported Health Status. Cognitive Methods Staff Working Paper Series (No. 10). Hyattsville, Maryland: US Department of Health and Human Services, Public Health Service, National Center for Health Statistics, 1994.
Stokols D. Establishing and maintaining healthy environments: Toward a social ecology of health promotion. Amer Psychol 1992; 47(1):6-22.
Streiner DL, Norman GR. Health measurement scales: A practical guide to their measurement and use (2nd ed) Oxford University Press, New York;1995.
Verbrugge LM, Merrill SS, Liu X. Measuring disability with parsimony. Disabil Rehab 1999; 21(5-6):295-306.
RESOURCES
A. CDC Behavioral Risk Factor Surveillance System Home Page (with links to BRFSS questionnaires, public domain data, State Coordinators): http://www.cdc.gov/nccdphp/brfss/.
B. CDC National Center for Environmental Health, Division of Child Development, Disability, and Health. Secondary Conditions Prevention Branch: http://www.cdc.gov/nceh/cddh/dh/scstates.htm
C. CDC Arthritis Program Website: http://www.cdc.gov/nccdphp/arthritis.htm
D. Healthy People 2010: http://web.health.gov/healthypeople
E. CDC’s MMWR articles: http://www.cdc.gov/epo/mmwr/mmwr.html
F. International Society for Quality of Life Studies (ISQOLS): http://www.cob.vt.edu/market/isqols/
G. International Society for Quality of Life Research (ISOQOL): http://www.isoqol.org/
H. Community Health Status Indicators Project: http://www.communityhealth.hrsa.gov/ and http://www.phf.org
Re
sou
rces
Measuring Healthy Days 33
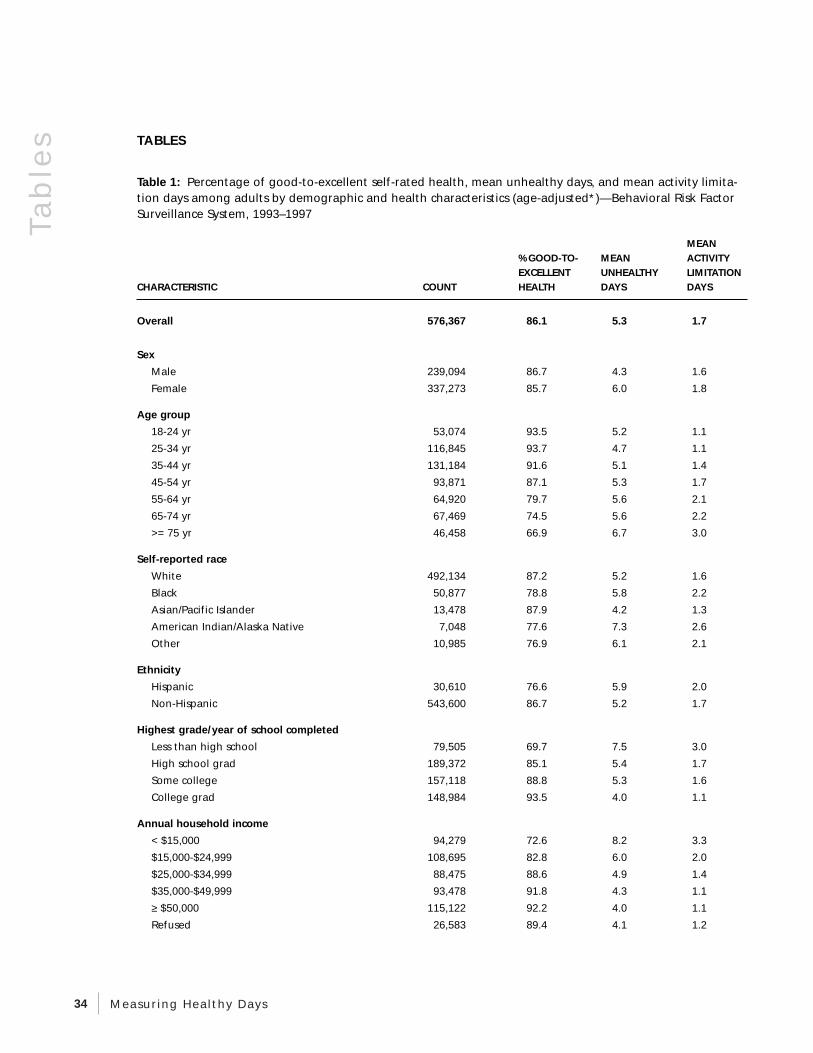
Tab
les TABLES
Table 1: Percentage of good-to-excellent self-rated health, mean unhealthy days, and mean activity limitation days among adults by demographic and health characteristics (age-adjusted*)—Behavioral Risk Factor Surveillance System, 1993–1997
CHARACTERISTIC COUNT
%GOOD-TOEXCELLENT HEALTH
MEAN UNHEALTHY DAYS
MEAN ACTIVITY LIMITATION DAYS
Overall 576,367 86.1 5.3 1.7
Sex
Male 239,094 86.7 4.3 1.6
Female 337,273 85.7 6.0 1.8
Age group
18-24 yr 53,074 93.5 5.2 1.1
25-34 yr 116,845 93.7 4.7 1.1
35-44 yr 131,184 91.6 5.1 1.4
45-54 yr 93,871 87.1 5.3 1.7
55-64 yr 64,920 79.7 5.6 2.1
65-74 yr 67,469 74.5 5.6 2.2
>= 75 yr 46,458 66.9 6.7 3.0
Self-reported race
White 492,134 87.2 5.2 1.6
Black 50,877 78.8 5.8 2.2
Asian/Pacific Islander 13,478 87.9 4.2 1.3
American Indian/Alaska Native 7,048 77.6 7.3 2.6
Other 10,985 76.9 6.1 2.1
Ethnicity
Hispanic 30,610 76.6 5.9 2.0
Non-Hispanic 543,600 86.7 5.2 1.7
Highest grade/year of school completed
Less than high school 79,505 69.7 7.5 3.0
High school grad 189,372 85.1 5.4 1.7
Some college 157,118 88.8 5.3 1.6
College grad 148,984 93.5 4.0 1.1
Annual household income
< $15,000 94,279 72.6 8.2 3.3
$15,000-$24,999 108,695 82.8 6.0 2.0
$25,000-$34,999 88,475 88.6 4.9 1.4
$35,000-$49,999 93,478 91.8 4.3 1.1
≥ $50,000 115,122 92.2 4.0 1.1
Refused 26,583 89.4 4.1 1.2
34 Measuring Healthy Days
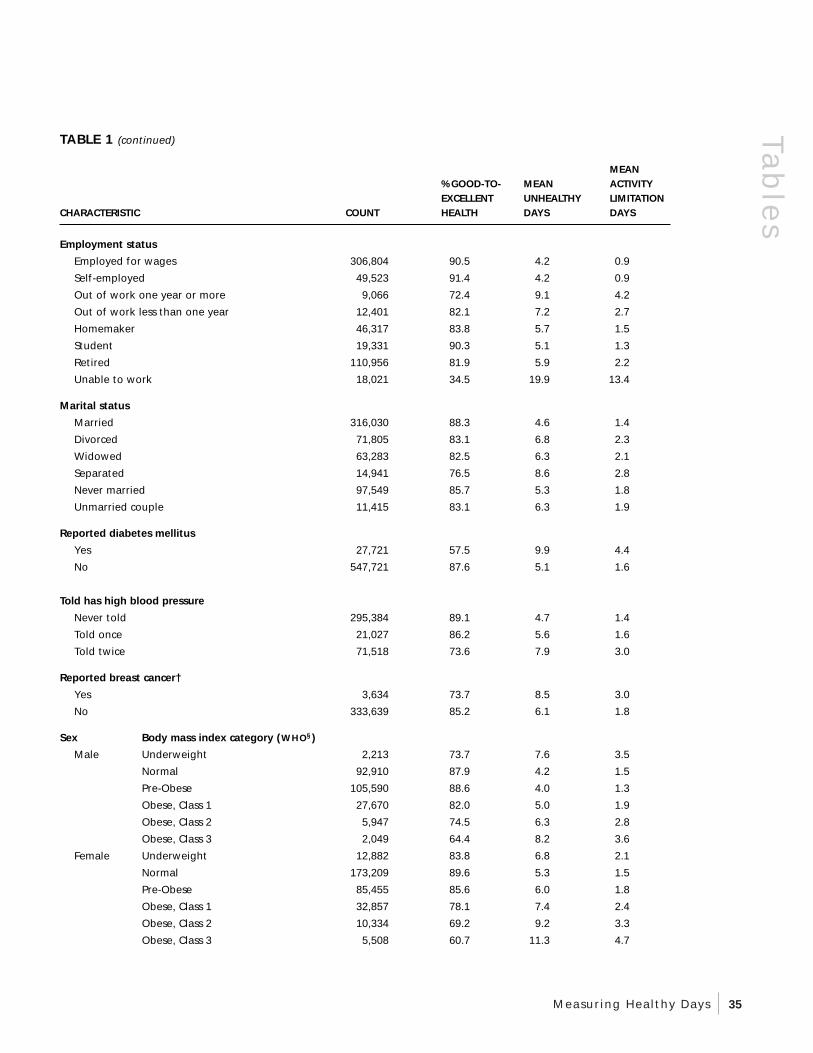
TABLE 1 (continued)
MEAN %GOOD-TO MEAN ACTIVITY EXCELLENT UNHEALTHY LIMITATION
CHARACTERISTIC COUNT HEALTH DAYS DAYS
Employment status
Employed for wages 306,804 90.5 4.2 0.9
Self-employed 49,523 91.4 4.2 0.9
Out of work one year or more 9,066 72.4 9.1 4.2
Out of work less than one year 12,401 82.1 7.2 2.7
Homemaker 46,317 83.8 5.7 1.5
Student 19,331 90.3 5.1 1.3
Retired 110,956 81.9 5.9 2.2
Unable to work 18,021 34.5 19.9 13.4
Marital status
Married 316,030 88.3 4.6 1.4
Divorced 71,805 83.1 6.8 2.3
Widowed 63,283 82.5 6.3 2.1
Separated 14,941 76.5 8.6 2.8
Never married 97,549 85.7 5.3 1.8
Unmarried couple 11,415 83.1 6.3 1.9
Reported diabetes mellitus
Yes 27,721 57.5 9.9 4.4
No 547,721 87.6 5.1 1.6
Told has high blood pressure
Never told 295,384 89.1 4.7 1.4
Told once 21,027 86.2 5.6 1.6
Told twice 71,518 73.6 7.9 3.0
Reported breast cancer†
Yes 3,634 73.7 8.5 3.0
No 333,639 85.2 6.1 1.8
Sex Body mass index category (WHO§ )
Male Underweight 2,213 73.7 7.6 3.5
Normal 92,910 87.9 4.2 1.5
Pre-Obese 105,590 88.6 4.0 1.3
Obese, Class 1 27,670 82.0 5.0 1.9
Obese, Class 2 5,947 74.5 6.3 2.8
Obese, Class 3 2,049 64.4 8.2 3.6
Female Underweight 12,882 83.8 6.8 2.1
Normal 173,209 89.6 5.3 1.5
Pre-Obese 85,455 85.6 6.0 1.8
Obese, Class 1 32,857 78.1 7.4 2.4
Obese, Class 2 10,334 69.2 9.2 3.3
Obese, Class 3 5,508 60.7 11.3 4.7
Tab
les
Measuring Healthy Days 35
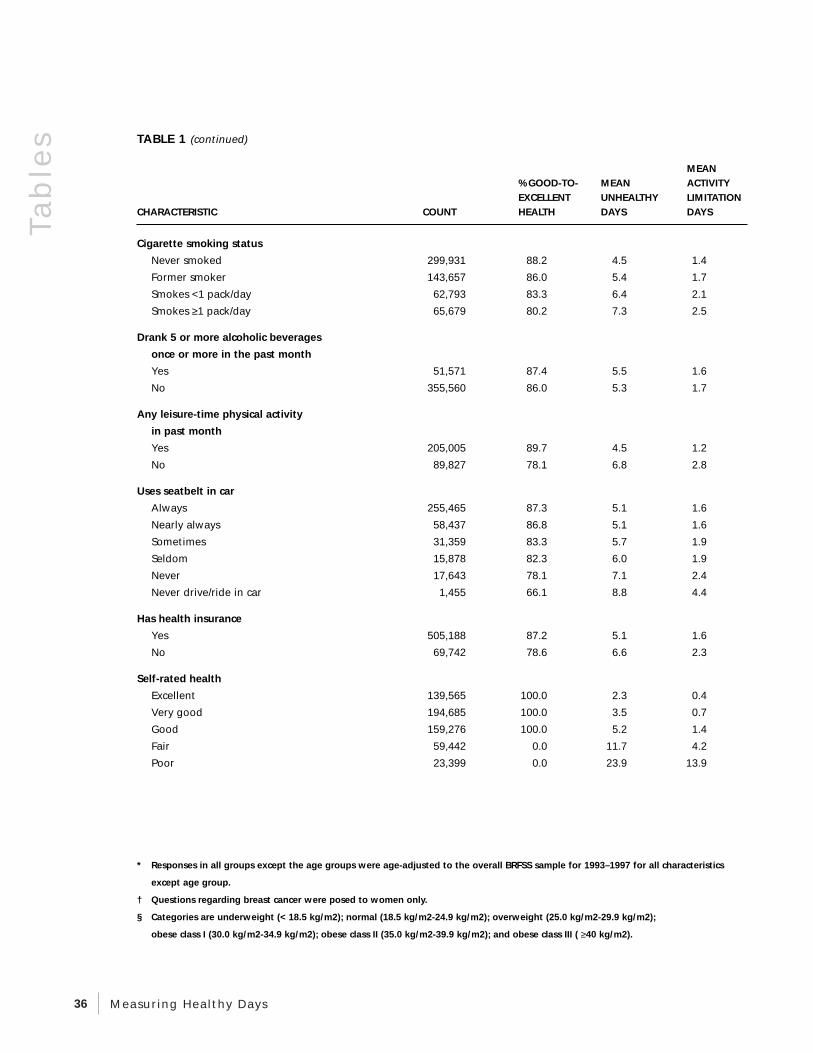
Tab
les TABLE 1 (continued)
MEAN %GOOD-TO MEAN ACTIVITY EXCELLENT UNHEALTHY LIMITATION
CHARACTERISTIC COUNT HEALTH DAYS DAYS
Cigarette smoking status
Never smoked 299,931 88.2 4.5 1.4
Former smoker 143,657 86.0 5.4 1.7
Smokes <1 pack/day 62,793 83.3 6.4 2.1
Smokes ≥ 1 pack/day 65,679 80.2 7.3 2.5
Drank 5 or more alcoholic beverages
once or more in the past month
Yes 51,571 87.4 5.5 1.6
No 355,560 86.0 5.3 1.7
Any leisure-time physical activity
in past month
Yes 205,005 89.7 4.5 1.2
No 89,827 78.1 6.8 2.8
Uses seatbelt in car
Always 255,465 87.3 5.1 1.6
Nearly always 58,437 86.8 5.1 1.6
Sometimes 31,359 83.3 5.7 1.9
Seldom 15,878 82.3 6.0 1.9
Never 17,643 78.1 7.1 2.4
Never drive/ride in car 1,455 66.1 8.8 4.4
Has health insurance
Yes 505,188 87.2 5.1 1.6
No 69,742 78.6 6.6 2.3
Self-rated health
Excellent 139,565 100.0 2.3 0.4
Very good 194,685 100.0 3.5 0.7
Good 159,276 100.0 5.2 1.4
Fair 59,442 0.0 11.7 4.2
Poor 23,399 0.0 23.9 13.9
* Responses in all groups except the age groups were age-adjusted to the overall BRFSS sample for 1993–1997 for all characteristics
except age group.
† Questions regarding breast cancer were posed to women only.
§ Categories are underweight (< 18.5 kg/m2); normal (18.5 kg/m2-24.9 kg/m2); overweight (25.0 kg/m2-29.9 kg/m2);
obese class I (30.0 kg/m2-34.9 kg/m2); obese class II (35.0 kg/m2-39.9 kg/m2); and obese class III ( ≥ 40 kg/m2).
36 Measuring Healthy Days
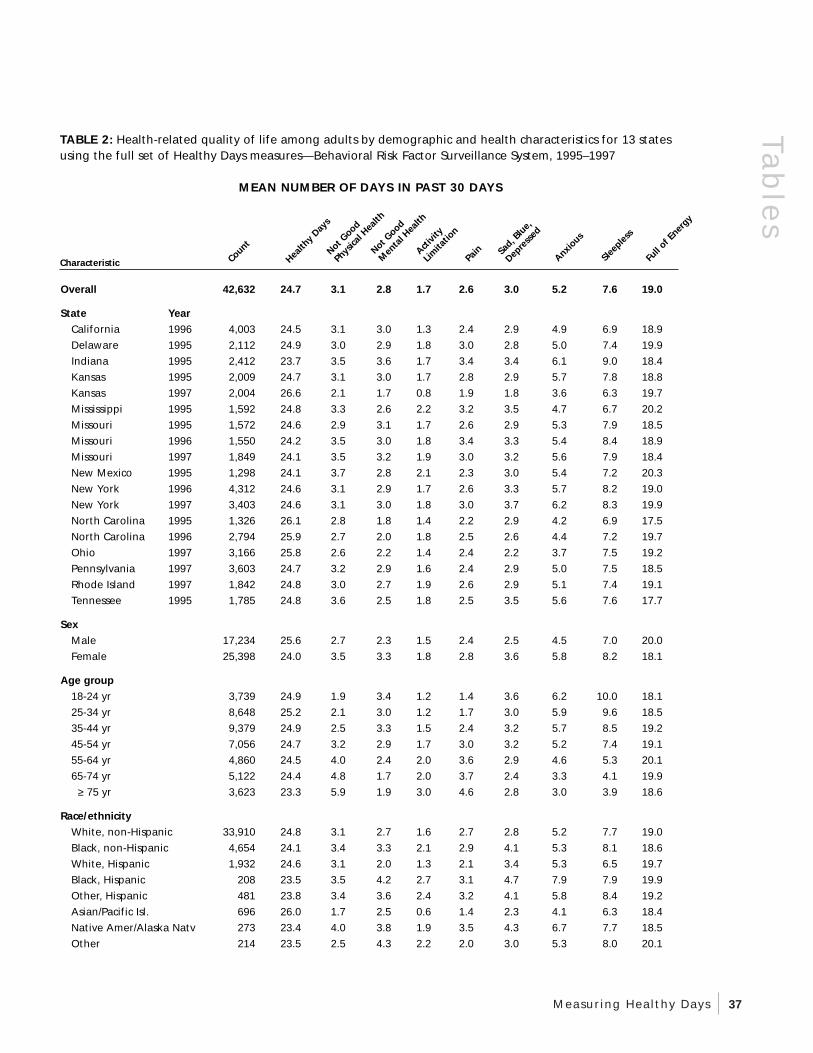
Count
Health
y Day
s
Not Good
Phys
ical H
ealth
Not Good
Men
tal H
ealth
Activit
y
Limita
tion
Pain
Sa
d, Blu
e,
Depre
ssed
Anxious
Sleep
less
Full
of Ener
gy
TABLE 2: Health-related quality of life among adults by demographic and health characteristics for 13 states using the full set of Healthy Days measures—Behavioral Risk Factor Surveillance System, 1995–1997
MEAN NUMBER OF DAYS IN PAST 30 DAYS
Characteristic
Overall 42,632 24.7 3.1 2.8 1.7 2.6 3.0 5.2 7.6 19.0
State Y ear
California 1996 4,003 24.5 3.1 3.0 1.3 2.4 2.9 4.9 6.9 18.9
Delaware 1995 2,112 24.9 3.0 2.9 1.8 3.0 2.8 5.0 7.4 19.9
Indiana 1995 2,412 23.7 3.5 3.6 1.7 3.4 3.4 6.1 9.0 18.4
Kansas 1995 2,009 24.7 3.1 3.0 1.7 2.8 2.9 5.7 7.8 18.8
Kansas 1997 2,004 26.6 2.1 1.7 0.8 1.9 1.8 3.6 6.3 19.7
Mississippi 1995 1,592 24.8 3.3 2.6 2.2 3.2 3.5 4.7 6.7 20.2
Missouri 1995 1,572 24.6 2.9 3.1 1.7 2.6 2.9 5.3 7.9 18.5
Missouri 1996 1,550 24.2 3.5 3.0 1.8 3.4 3.3 5.4 8.4 18.9
Missouri 1997 1,849 24.1 3.5 3.2 1.9 3.0 3.2 5.6 7.9 18.4
New Mexico 1995 1,298 24.1 3.7 2.8 2.1 2.3 3.0 5.4 7.2 20.3
New York 1996 4,312 24.6 3.1 2.9 1.7 2.6 3.3 5.7 8.2 19.0
New York 1997 3,403 24.6 3.1 3.0 1.8 3.0 3.7 6.2 8.3 19.9
North Carolina 1995 1,326 26.1 2.8 1.8 1.4 2.2 2.9 4.2 6.9 17.5
North Carolina 1996 2,794 25.9 2.7 2.0 1.8 2.5 2.6 4.4 7.2 19.7
Ohio 1997 3,166 25.8 2.6 2.2 1.4 2.4 2.2 3.7 7.5 19.2
Pennsylvania 1997 3,603 24.7 3.2 2.9 1.6 2.4 2.9 5.0 7.5 18.5
Rhode Island 1997 1,842 24.8 3.0 2.7 1.9 2.6 2.9 5.1 7.4 19.1
Tennessee 1995 1,785 24.8 3.6 2.5 1.8 2.5 3.5 5.6 7.6 17.7
Sex
Male 17,234 25.6 2.7 2.3 1.5 2.4 2.5 4.5 7.0 20.0
Female 25,398 24.0 3.5 3.3 1.8 2.8 3.6 5.8 8.2 18.1
Age gr oup
18-24 yr 3,739 24.9 1.9 3.4 1.2 1.4 3.6 6.2 10.0 18.1
25-34 yr 8,648 25.2 2.1 3.0 1.2 1.7 3.0 5.9 9.6 18.5
35-44 yr 9,379 24.9 2.5 3.3 1.5 2.4 3.2 5.7 8.5 19.2
45-54 yr 7,056 24.7 3.2 2.9 1.7 3.0 3.2 5.2 7.4 19.1
55-64 yr 4,860 24.5 4.0 2.4 2.0 3.6 2.9 4.6 5.3 20.1
65-74 yr 5,122 24.4 4.8 1.7 2.0 3.7 2.4 3.3 4.1 19.9
≥ 75 yr 3,623 23.3 5.9 1.9 3.0 4.6 2.8 3.0 3.9 18.6
Race/ethnicity
White, non-Hispanic 33,910 24.8 3.1 2.7 1.6 2.7 2.8 5.2 7.7 19.0
Black, non-Hispanic 4,654 24.1 3.4 3.3 2.1 2.9 4.1 5.3 8.1 18.6
White, Hispanic 1,932 24.6 3.1 2.0 1.3 2.1 3.4 5.3 6.5 19.7
Black, Hispanic 208 23.5 3.5 4.2 2.7 3.1 4.7 7.9 7.9 19.9
Other, Hispanic 481 23.8 3.4 3.6 2.4 3.2 4.1 5.8 8.4 19.2
Asian/Pacific Isl. 696 26.0 1.7 2.5 0.6 1.4 2.3 4.1 6.3 18.4
Native Amer/Alaska Natv 273 23.4 4.0 3.8 1.9 3.5 4.3 6.7 7.7 18.5
Other 214 23.5 2.5 4.3 2.2 2.0 3.0 5.3 8.0 20.1
Tab
les
Measuring Healthy Days 37

Count
Health
y Day
s
Not Good
Phys
ical H
ealth
Not Good
Men
tal H
ealth
Activit
y
Limita
tion
Pain
Sa
d, Blu
e,
Depre
ssed
Anxious
Sleep
less
Full
of Ener
gy
Tab
les
TABLE 2 (continued)
MEAN NUMBER OF DAYS IN PAST 30 DAYS
Characteristic
Educational level
< High school grad 5,944 22.5 5.4 3.6 3.0 4.4 4.6 6.0 6.9 17.5
High school grad 14,243 24.7 3.1 2.9 1.6 2.8 3.2 5.1 7.6 19.2
Some college 11,233 24.8 2.8 3.0 1.6 2.5 3.0 5.4 8.3 18.9
College grad 11,073 25.9 2.1 2.3 1.0 1.7 2.1 4.6 7.4 19.8
Annual household income
< $15,000 5,666 21.6 5.5 4.4 3.4 4.6 5.1 6.9 8.0 17.0
$15,000-$24,999 8,216 23.7 4.0 3.3 2.3 3.4 3.8 5.5 7.5 18.2
$25,000-$34,999 6,533 25.0 2.7 2.8 1.4 2.4 2.9 5.4 7.8 19.3
$35,000-$49,999 6,864 25.8 2.0 2.4 1.0 1.9 2.4 4.8 7.6 19.4
≥ $50,000 8,618 26.1 2.0 2.1 0.9 1.6 1.9 4.5 7.9 19.7
Missing/Unknown income 6,735 25.0 3.2 2.5 1.5 2.8 2.9 4.7 6.9 19.8
Employment status
Employed, wages 23,190 25.9 1.8 2.5 0.9 1.6 2.5 5.1 8.4 19.5
Self-employed 3,023 25.9 2.1 2.4 1.0 1.9 2.5 5.3 7.2 20.6
Unemployed ≥ 1 yr 696 20.8 5.4 5.3 3.9 5.4 5.8 7.8 9.2 16.5
Unemployed <1 yr 875 21.9 3.9 5.4 2.8 3.0 6.1 8.7 7.5 17.8
Homemaker 3,301 24.1 3.3 3.2 1.6 2.5 3.5 5.3 7.3 18.5
Student 1,324 25.0 1.7 3.4 0.9 1.4 3.3 6.2 9.6 18.3
Retired 8,705 24.2 5.0 1.8 2.2 4.0 2.5 3.1 4.0 19.7
Unable to work 1,473 10.7 16.1 9.6 12.9 14.5 10.6 12.2 11.7 9.1
Marital status
Currently married 22,589 25.3 2.9 2.4 1.5 2.5 2.5 4.6 7.3 19.6
Divorced 5,336 23.4 3.8 3.9 2.3 3.7 4.2 6.7 8.6 18.0
Widowed 4,876 22.7 5.7 2.8 2.8 4.7 3.9 4.3 4.9 18.4
Separated 1,346 21.9 4.4 5.0 2.6 4.0 5.8 8.2 9.3 17.1
Never married 7,511 24.7 2.3 3.3 1.4 1.8 3.5 6.0 8.8 18.4
Unmarried couple 861 24.1 2.4 3.9 1.4 2.1 3.5 5.9 8.9 18.3
Told has diabetes
Yes 2,115 19.7 8.5 3.8 4.7 6.6 5.0 6.2 7.3 15.3
No 40,462 25.0 2.8 2.8 1.5 2.4 2.9 5.1 7.6 19.2
Told has high blood pressure
Never told 28,920 25.3 2.5 2.7 1.3 2.1 2.9 5.1 7.7 19.4
Told once 1,953 24.0 3.5 3.3 1.6 2.8 3.3 5.6 7.9 18.7
Told twice 7,180 22.4 5.5 3.4 3.0 4.9 3.9 5.8 7.1 17.0
Reported breast cancer*
Yes 333 21.7 5.7 4.1 3.7 5.3 4.3 6.7 6.6 16.6
No 25,065 24.0 3.4 3.3 1.8 2.8 3.5 5.8 8.2 18.2
38 Measuring Healthy Days
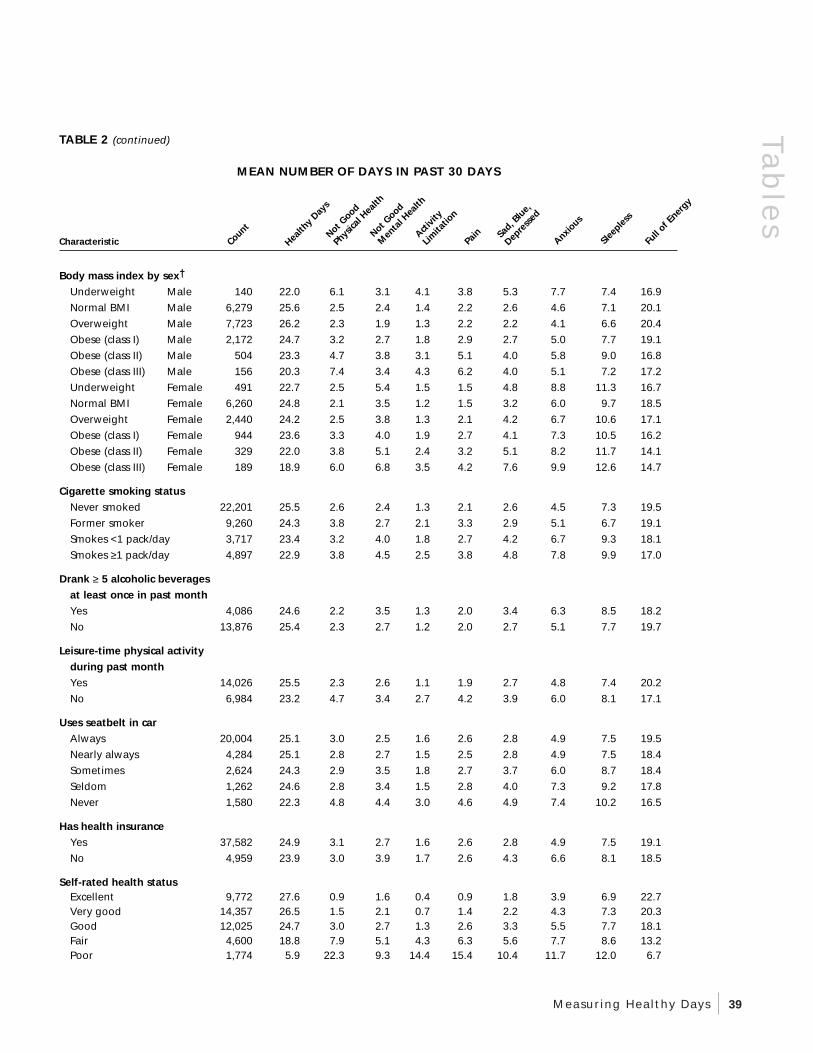
Count
Health
y Day
s
Not Good
Phys
ical H
ealth
Not Good
Men
tal H
ealth
Activit
y
Limita
tion
Pain
Sa
d, Blu
e,
Depre
ssed
Anxious
Sleep
less
Full
of Ener
gy
TABLE 2 (continued)
MEAN NUMBER OF DAYS IN PAST 30 DAYS
Characteristic
Body mass index by sex†
Underweight Male 140 22.0 6.1 3.1 4.1 3.8 5.3 7.7 7.4 16.9
Normal BMI Male 6,279 25.6 2.5 2.4 1.4 2.2 2.6 4.6 7.1 20.1
Overweight Male 7,723 26.2 2.3 1.9 1.3 2.2 2.2 4.1 6.6 20.4
Obese (class I) Male 2,172 24.7 3.2 2.7 1.8 2.9 2.7 5.0 7.7 19.1
Obese (class II) Male 504 23.3 4.7 3.8 3.1 5.1 4.0 5.8 9.0 16.8
Obese (class III) Male 156 20.3 7.4 3.4 4.3 6.2 4.0 5.1 7.2 17.2
Underweight Female 491 22.7 2.5 5.4 1.5 1.5 4.8 8.8 11.3 16.7
Normal BMI Female 6,260 24.8 2.1 3.5 1.2 1.5 3.2 6.0 9.7 18.5
Overweight Female 2,440 24.2 2.5 3.8 1.3 2.1 4.2 6.7 10.6 17.1
Obese (class I) Female 944 23.6 3.3 4.0 1.9 2.7 4.1 7.3 10.5 16.2
Obese (class II) Female 329 22.0 3.8 5.1 2.4 3.2 5.1 8.2 11.7 14.1
Obese (class III) Female 189 18.9 6.0 6.8 3.5 4.2 7.6 9.9 12.6 14.7
Cigarette smoking status
Never smoked 22,201 25.5 2.6 2.4 1.3 2.1 2.6 4.5 7.3 19.5
Former smoker 9,260 24.3 3.8 2.7 2.1 3.3 2.9 5.1 6.7 19.1
Smokes <1 pack/day 3,717 23.4 3.2 4.0 1.8 2.7 4.2 6.7 9.3 18.1
Smokes ≥ 1 pack/day 4,897 22.9 3.8 4.5 2.5 3.8 4.8 7.8 9.9 17.0
Drank ≥ 5 alcoholic beverages
at least once in past month
Yes 4,086 24.6 2.2 3.5 1.3 2.0 3.4 6.3 8.5 18.2
No 13,876 25.4 2.3 2.7 1.2 2.0 2.7 5.1 7.7 19.7
Leisure-time physical activity
during past month
Yes 14,026 25.5 2.3 2.6 1.1 1.9 2.7 4.8 7.4 20.2
No 6,984 23.2 4.7 3.4 2.7 4.2 3.9 6.0 8.1 17.1
Uses seatbelt in car
Always 20,004 25.1 3.0 2.5 1.6 2.6 2.8 4.9 7.5 19.5
Nearly always 4,284 25.1 2.8 2.7 1.5 2.5 2.8 4.9 7.5 18.4
Sometimes 2,624 24.3 2.9 3.5 1.8 2.7 3.7 6.0 8.7 18.4
Seldom 1,262 24.6 2.8 3.4 1.5 2.8 4.0 7.3 9.2 17.8
Never 1,580 22.3 4.8 4.4 3.0 4.6 4.9 7.4 10.2 16.5
Has health insurance
Yes 37,582 24.9 3.1 2.7 1.6 2.6 2.8 4.9 7.5 19.1
No 4,959 23.9 3.0 3.9 1.7 2.6 4.3 6.6 8.1 18.5
Self-rated health status Excellent 9,772 27.6 0.9 1.6 0.4 0.9 1.8 3.9 6.9 22.7 Very good 14,357 26.5 1.5 2.1 0.7 1.4 2.2 4.3 7.3 20.3 Good 12,025 24.7 3.0 2.7 1.3 2.6 3.3 5.5 7.7 18.1 Fair 4,600 18.8 7.9 5.1 4.3 6.3 5.6 7.7 8.6 13.2 Poor 1,774 5.9 22.3 9.3 14.4 15.4 10.4 11.7 12.0 6.7
Tab
les
Measuring Healthy Days 39
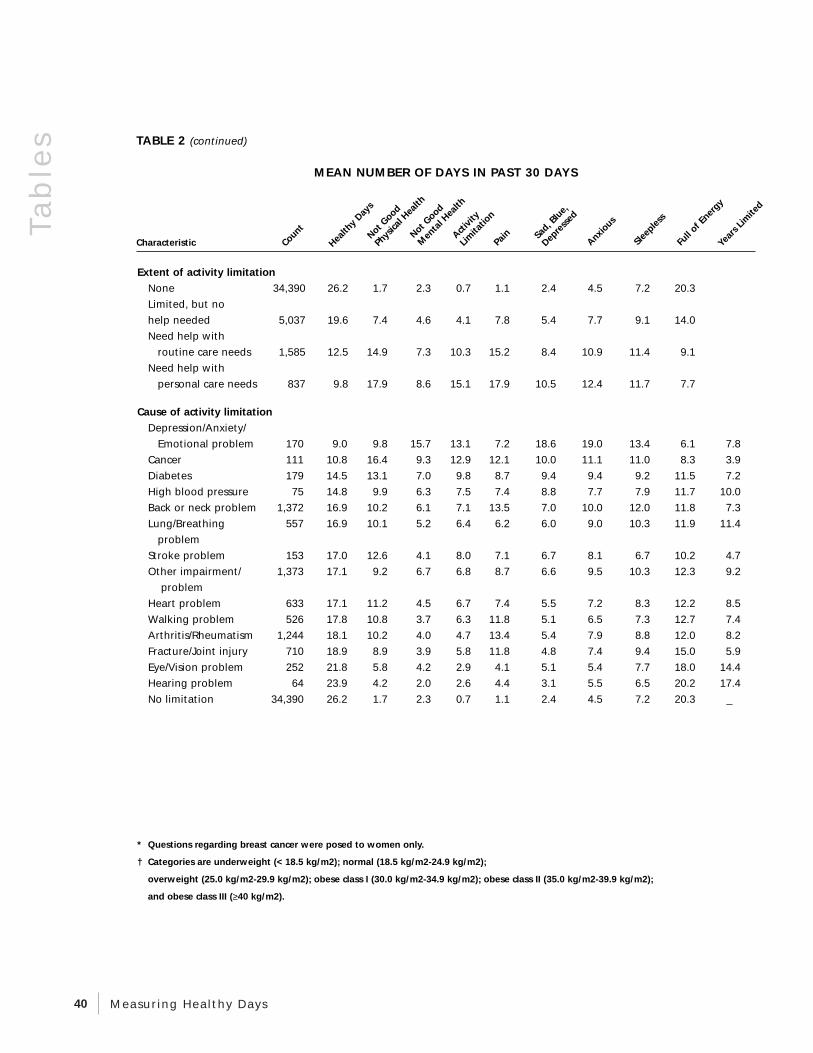
gy
Sad, B
lue,
Characteristic ears
Limite
d
Count
Health
y Day
s
Not Good
Phys
ical H
ealt
Not Good
Men
tal H
ealt
Activit
y
Limita
tion
Pain
Dep
ress
ed
Anxious
Sleep
less
Full
of Ener
Y
Extent of activity limitation
None 34,390 26.2 1.7 2.3 0.7 1.1 2.4 4.5 7.2 20.3
Limited, but no
help needed 5,037 19.6 7.4 4.6 4.1 7.8 5.4 7.7 9.1 14.0
Need help with
routine care needs 1,585 12.5 14.9 7.3 10.3 15.2 8.4 10.9 11.4 9.1
Need help with
personal care needs 837 9.8 17.9 8.6 15.1 17.9 10.5 12.4 11.7 7.7
Cause of activity limitation
Depression/Anxiety/
Emotional problem 170 9.0 9.8 15.7 13.1 7.2 18.6 19.0 13.4 6.1 7.8
Cancer 111 10.8 16.4 9.3 12.9 12.1 10.0 11.1 11.0 8.3 3.9
Diabetes 179 14.5 13.1 7.0 9.8 8.7 9.4 9.4 9.2 11.5 7.2
High blood pressure 75 14.8 9.9 6.3 7.5 7.4 8.8 7.7 7.9 11.7 10.0
Back or neck problem 1,372 16.9 10.2 6.1 7.1 13.5 7.0 10.0 12.0 11.8 7.3
Lung/Breathing 557 16.9 10.1 5.2 6.4 6.2 6.0 9.0 10.3 11.9 11.4
problem
Stroke problem 153 17.0 12.6 4.1 8.0 7.1 6.7 8.1 6.7 10.2 4.7
Other impairment/ 1,373 17.1 9.2 6.7 6.8 8.7 6.6 9.5 10.3 12.3 9.2
problem
Heart problem 633 17.1 11.2 4.5 6.7 7.4 5.5 7.2 8.3 12.2 8.5
Walking problem 526 17.8 10.8 3.7 6.3 11.8 5.1 6.5 7.3 12.7 7.4
Arthritis/Rheumatism 1,244 18.1 10.2 4.0 4.7 13.4 5.4 7.9 8.8 12.0 8.2
Fracture/Joint injury 710 18.9 8.9 3.9 5.8 11.8 4.8 7.4 9.4 15.0 5.9
Eye/Vision problem 252 21.8 5.8 4.2 2.9 4.1 5.1 5.4 7.7 18.0 14.4
Hearing problem 64 23.9 4.2 2.0 2.6 4.4 3.1 5.5 6.5 20.2 17.4
No limitation 34,390 26.2 1.7 2.3 0.7 1.1 2.4 4.5 7.2 20.3 _
h h
Tab
les
TABLE 2 (continued)
MEAN NUMBER OF DAYS IN PAST 30 DAYS
* Questions regarding breast cancer were posed to women only.
† Categories are underweight (< 18.5 kg/m2); normal (18.5 kg/m2-24.9 kg/m2);
overweight (25.0 kg/m2-29.9 kg/m2); obese class I (30.0 kg/m2-34.9 kg/m2); obese class II (35.0 kg/m2-39.9 kg/m2);
and obese class III (≥ 40 kg/m2).
40 Measuring Healthy Days

