no.4 measuring health in a population
TRANSCRIPT
2014-01-31 HCC 1
Health Care Concepts
Measuring health in populations,
Anders L Nielsen Senior Lecturer

2014-01-31 HCC 2
Public Health in Practice
©lassen-nielsen.com
Three highly interrelated domains of public health. They are?
Health improvement (including people’s lifestyles as well as inequalities in health and the wider social influences of health).
Health protection (including infectious diseases, environmental hazards and emergency preparedness).
Health services (including service planning, efficiency, audit and evaluation).
Griffiths S, Jewell T, Donnelly P. Public health in practice: the three domains of public
health. Public Health 2005;119(10):907-913.

2014-01-31 HCC 3
Definition of health
©lassen-nielsen.com
The most ambitious definition of health is that proposed by WHO in 1948: “health is a state of complete physical, mental, and social well-being and not merely the absence of disease or infirmity.”

2014-01-31 HCC 4
Evaluate the health of populations
©lassen-nielsen.com
Today, despite extensive analytic efforts to assess health more accurately, measures available to evaluate the health of populations continue to be
• mortality
• morbidity
• disability

Economics, health policy and equity
Walshe and Smith argues that the primary forces that drives the pressure for health care reforms (=change) is:
• Demographic shift
• Technological Interventions
• Consumerism
• Economy in recession
2014-01-31 5
© lassen-nielsen.com 2013
Walshe K, Smith J. Healthcare Management. Maidenshead,Berksire,UK: Open University Press; 2012. 1-589 p.
Economics, health policy and equity
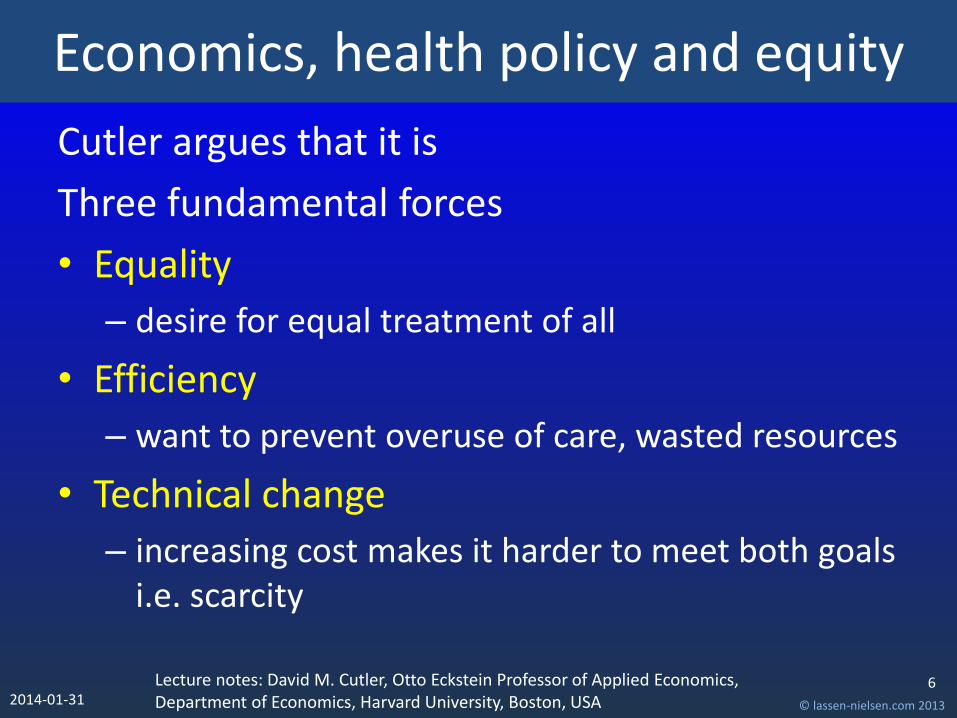
Cutler argues that it is
Three fundamental forces
• Equality
– desire for equal treatment of all
• Efficiency
– want to prevent overuse of care, wasted resources
• Technical change
– increasing cost makes it harder to meet both goals i.e. scarcity
2014-01-31
6
© lassen-nielsen.com 2013
Lecture notes: David M. Cutler, Otto Eckstein Professor of Applied Economics, Department of Economics, Harvard University, Boston, USA

Horizontal / Vertical Equity
2014-01-31 7 Donaldson C, Gerard K. Economics of Health Care Financing. London: MacMillan; 1993.
Equal treatment for equals
i.e. Equal treatment for equal need
Unequal treatment for unequals

Horizontal-equity criteria
2014-01-31 8 Donaldson C, Gerard K. Economics of Health Care Financing. London: MacMillan; 1993.
1. Equal expenditure for equal need; e.g. equal nurse cost per bed ratios in all acute hospitals
2. Equal utilization for equal need; e.g. equal length of stay per health condition
3. Equal access for equal need; e.g. equal waiting time for treatment for patients with similar conditions
4. Equal health/reduced inequalities in health; e.g. equal age- and sex-adjusted standardized mortality ratios across health regions

Vertical-equity criteria
2014-01-31 9 Donaldson C, Gerard K. Economics of Health Care Financing. London: MacMillan; 1993.
1. Unequal treatment for unequal need; e.g. unequal treatment of those with treatable trivial versus serious conditions
2. Progressive financing based on ability to pay; e.g. progressive income tax rates and mainly income-tax financed
2014-01-31 ©lassen-nielsen.com
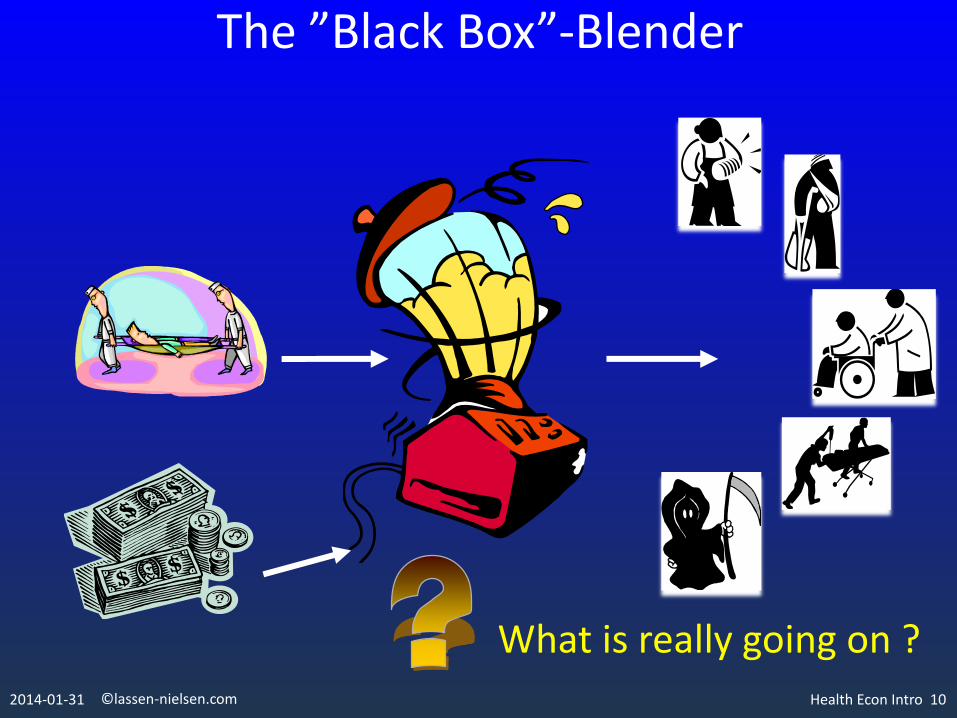
The ”Black Box”-Blender
Health Econ Intro 10
What is really going on ?

2014-01-31 ©lassen-nielsen.com
The Evaluation
Health Econ Intro 11
What are my
options ?
The activities Transparency,
Choice & Thrust

2014-01-31 ©lassen-nielsen.com
The Evaluation
Health Econ Intro 12
What is the outcome ?
Quality

2014-01-31 ©lassen-nielsen.com
The Evaluation
Health Econ Intro 13
Where does the money go?
Documentation of the relation between resources,
activity and outcome

They want to stay healthy
Efficiency
Delivered in their neighborhood
The best treatment available anywhere in the world
At a price they can afford
When they need it
The pressure for efficiency
The Health Care System
The consumers
2014-01-31 ©lassen-nielsen.com Health Econ Intro 14
Consumerism

2014-01-31
Efficacy, Efficiency and Effectiveness
Effectiveness – we have an effective procedure, we
want it to be provided, and we do not want to wait for it
Efficiency – benefits provided by the treatment in a
cost-effective way
Efficacy – best possible outcome from a procedure
under optimal conditions
Is Outcome Important for Setting Priorities in Health Care?
15
© lassen-nielsen.com

2014-01-31 16
Some even argues for 5Es
Effectiveness – check at a higher level that this intervention is
worth doing because it makes a contribution to some higher
level or long-term aim
Efficiency – check that the minimum resources are used
to obtain the output
Efficacy – check that the output is produced
Is Outcome Important for Setting Priorities in Health Care?
Ethicality - is the intervention morally correct
Elegance - is this an aesthetically pleasing intervention
Checkland, P. Soft Systems Methodology: A 30-Year Retrospective. Chichester: Wiley. 1999 © lassen-nielsen.com

Health care reforms
The Three Waves of Medical Care Reforms
First wave (1950-1970):
Universal coverage, generous benefits
Second wave (1970-1990):
Cost control
Third wave (1990-):
Focus on incentives and competition?
2014-01-31 17 Lecture notes: David M. Cutler, Otto Eckstein Professor of Applied Economics,
Department of Economics, Harvard University, Boston, USA © lassen-nielsen.com

Understanding
2014-01-31
data
information
knowledge
wisdom
Understanding relations
Understanding principles
Understanding patterns
Understanding
18
© lassen-nielsen.com

Value of data
2014-01-31
DATA
INFORMATION Relevance
KNOWLEDGE Inference
ACTION Decision-Making
OUTCOMES Accountability
VALUE WITHIN THE
ORGANIZATION
19
© lassen-nielsen.com

Definitions always needed
2014-01-31 20
Definitions of health states used by epidemiologists tend to be simple, for example, “disease present” or “disease absent” The development of criteria to establish the presence of a disease requires a definition of “normality” and “abnormality.” However, it may be difficult to define what is normal, and there is often no clear distinction between normal and abnormal, especially with regard to normally distributed continuous variables that may be associated with several diseases

2014-01-31 Source: OECD Health Data 2009, OECD (http://www.oecd.org/health/healthdata).
2007 (or latest year available)
Life expectancy versus spending?
21
© lassen-nielsen.com

2014-01-31 Source: World Bank data for 2010 - Accesed 2013-01-23 (http://data.worldbank.org)
2007 (or latest year available)
Life expectancy versus spending?
How does our region compare ?
Caribbean small states Life expectancy: 72.1 Health spending: 502
Your conclusion?
22
© lassen-nielsen.com

2014-01-31 23
What do we want to measure?
The burden of disease and disability
We have • mortality • morbidity • disability

Mortality Rates
• Mortality rates are incidence rates
= the incidence of death
• Most reliable and available data, so most used for health status assessment
• Crude mortality rates
all deaths during a the year x 1000
population at the mid-year

Crude, Specific & Standardized Rates
• A crude rate - entire population.
• A specific rate - particular sub-group
– e.g. age specific rates, infant mortality rate
• Standardized rates - compare two or more populations with the effects of differences in age or other confounding variables removed.
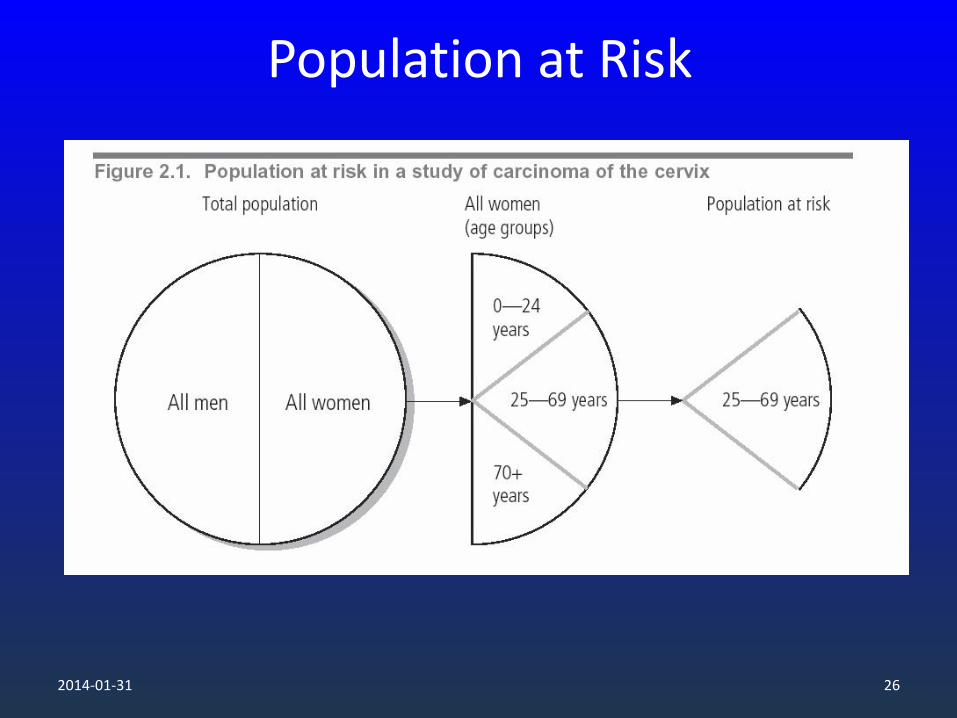
Population at Risk
2014-01-31 26
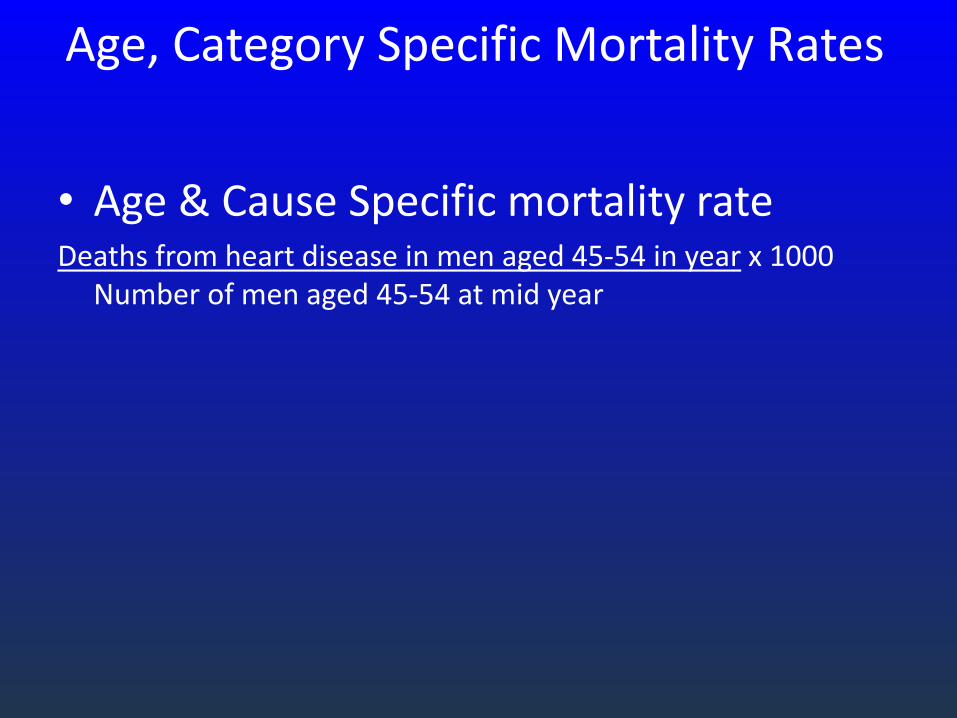
Age, Category Specific Mortality Rates
• Age & Cause Specific mortality rate Deaths from heart disease in men aged 45-54 in year x 1000
Number of men aged 45-54 at mid year

Crude vs. adjusted rates
• Crude rates are the real rates
• Adjusted rates are artificial / made up rates, for the purpose of fair comparison

Age adjusted / Age standardized mortality rates
• Crude mortality rates can be very misleading if comparing mortality of different populations.
• Age is the single most important determinant of
mortality. • Differences in age structure between the populations
must be taken into account. • A crude mortality rate depends on the age specific
death rates and the proportion of the population in each of the age bands.

Which is crude rates / a risk?
2014-01-31 30
What does this table suggest?

2014-01-31 31
Mortality by age

2014-01-31 32
Mortality by race

2014-01-31 33
Premature death
In constructing a measure of premature death, an arbitrary limit to life is chosen, and the calculation of the difference between an age at death and this arbitrary limit is defined as the life lost as a result of that death.
premature mortality measured by years of potential life lost (YPLL)
2014-01-31 34
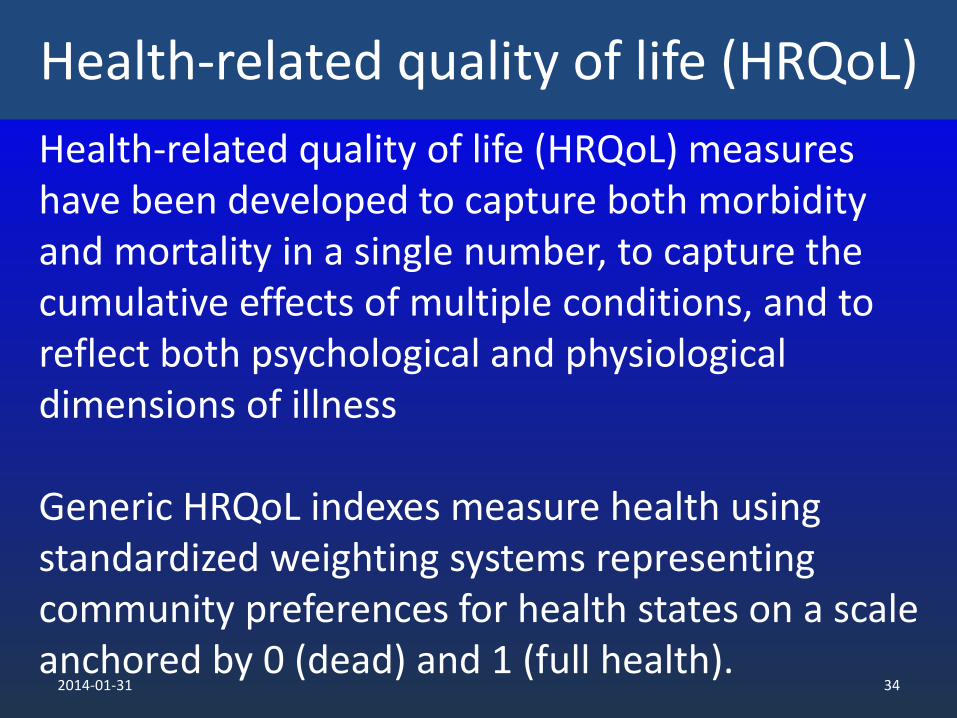
Health-related quality of life (HRQoL)
Health-related quality of life (HRQoL) measures have been developed to capture both morbidity and mortality in a single number, to capture the cumulative effects of multiple conditions, and to reflect both psychological and physiological dimensions of illness Generic HRQoL indexes measure health using standardized weighting systems representing community preferences for health states on a scale anchored by 0 (dead) and 1 (full health).
2014-01-31 35
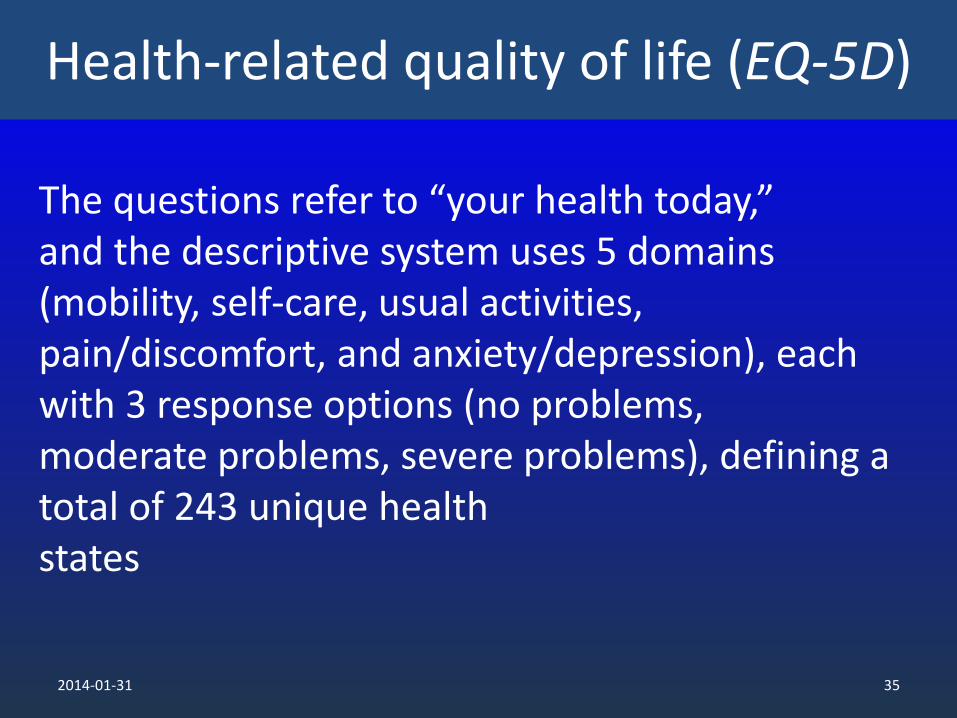
Health-related quality of life (EQ-5D)
The questions refer to “your health today,” and the descriptive system uses 5 domains (mobility, self-care, usual activities, pain/discomfort, and anxiety/depression), each with 3 response options (no problems, moderate problems, severe problems), defining a total of 243 unique health states

2014-01-31 36
Health-related quality of life (HUI2)
Health Utilities Index Marks 2 and 3(commercial) The HUI2 defines health status on six attributes (sensation, mobility, emotion, cognition, self-care, and pain—excluding an optional fertility dimension, as is usual in the literature). Each attribute is divided into 4 or 5 levels, resulting in 8,000 unique health states

2014-01-31 37
Health-related quality of life (QWB-SA)
the QWB-SA assesses health over the past 3 days. It combines three domains of functioning (mobility, physical activity, and social activity) with a lengthy list of symptoms and health problems, each assigned a weight, using an algorithm that yields a single summary score

2014-01-31 38
Health-related quality of life (SF-X)
While the SF-36v2 yields a health profile summary using 8 domains, the SF-6D has reduced this to 6 domains (physical function, role limitation, social function, pain, mental health, and vitality), each comprised of 5 to 6 levels and jointly defining about 18,000 health states

2014-01-31 39
Health-related quality of life (QALY)
A QALY is a summary measure of health—based on subjective quantification of illness—that includes both morbidity and mortality. A year in perfect health is equal to 1.0 QALY. The value of a year in ill health is discounted to reflect the relative utility of the ill state versus perfect health; for example, a year bedridden may be valued at 0.5 QALY. In cost-effectiveness analysis of health care interventions, QALYs are now the standard metric for health impacts

2014-01-31 40
Health-related quality of life (QALE)
A second acronym—QALE (for quality-adjusted life expectancy)—is used in the population health literature as a summary measure of current health status. QALE is life expectancy adjusted for the quality of surviving years and so is measured in QALYs. QALE is by definition less than life expectancy computed in unadjusted years

2014-01-31 41
Disease specific
However, as a general population-wide measure of health, disease-specific data have several problems. To be comprehensive, an enormous number of diseases would need to be covered, so the price tag would be high. Aggregation into a single or a few measures seems very difficult. How would one add up cases of asthma and breast cancer, or even cases of breast cancers of different severity?

2014-01-31 42
Disease specific ?
By these criteria, data concerning risk factors today should include information related to:
• smoking and tobacco use; • physical activity;
• sleep habits; • obesity (i.e., body mass index, although
waist/height may work better as a predictor);
• measures of diet (apart from obesity); • high blood pressure;
• cholesterol; • alcohol use, especially when driving;
• education; • birth weight and prematurity;
• participation in screening (e.g., mammography,
colorectal cancer screening);
• vaccination (e.g., childhood, pneumococcal,
human papillomavirus);
• oral hygiene; • preventive interventions (e.g., seat belt use);
• exposure to environmental factors (e.g., violet A
and ultraviolet B light);
• diseases such as diabetes, chronic kidney
disease, cardiovascular disease, and cancer, which
have a major impact on future as well as present
health.

2014-01-31 43
Leading causes of public health burden using alternative measures of burden, United States
Mortality (2002) a YPLL before 75 (2002) a DALY (1996) b
1. Diseases of heart 1. Malignant neoplasms 1. Ischemic heart disease
2. Malignant neoplasms 2. Diseases of heart 2. Cerebrovascular disease
3. Cerebrovascular disease 3. Unintentional injuries 3. Motor vehicle crashes
4. Chronic lower respiratory
disease
4. Suicide 4. Depression
5. Unintentional injuries 5. Homicide 5. Lung cancer
6. Diabetes mellitus 6. Cerebrovascular disease 6. Chronic lower respiratory
disease
7. Influenza and pneumonia 7. Diabetes mellitus 7. Alcohol use
8. Alzheimer’s disease 8. Chronic lower respiratory
disease
8. HIV
9. Nephritis, nephrotic
syndrome and nephrosis
9. Chronic liver disease 9. Diabetes mellitus
10. HIV 10. Osteoarthritis 10. Septicemia

2014-01-31 44
Leading causes of public health burden using alternative measures of burden, United States
Actual causes of death
(2000) c
Hospital discharges (2001) Hospital days (2001) d
1. Tobacco 1. Heart disease 1. Perinatal conditions
2. Poor diet/physical
inactivity
2. Delivery 2. Septicemia
3. Alcohol 3. Psychoses 3. Psychoses
4. Microbial agents 4. Pneumonia 4. Malignant neoplasms
5. Toxic Agents 5. Malignant neoplasms 5. Pneumonia
6. Motor vehicle crashes 6. Fractures 6. Congenital anomalies
7. Firearms 7. Cerebrovascular disease 7. Fractures
8. Sexual behavior 8. Diabetes mellitus 8. Alcohol dependence
9. Illicit drug use 9. Volume depletion 8. Nervous system and sense
organs
10. Pregnancy
complications
10. Chronic bronchitis
10. Cerebrovascular disease
10. Diverticula of the
intestine

2014-01-31 45
Leading causes of public health burden using alternative measures of burden, United States
Disability (1999)e Costly conditions (2000) f
1. Arthritis 1. Heart disease
2. Back problems 2. Trauma
3. Heart trouble 3. Cancer
4. Respiratory problems 4. Pulmonary conditions
5. Hearing problems 5. Mental disorders
6. Limb stiffness 6. Hypertension
7. Mental/emotional
problems
7. Diabetes
8. Diabetes 8. Arthritis
9. Vision problems 9. Back problems
10. Stroke 10. Cerebrovascular
disease

2014-01-31 46
Is mortality a measure of healthcare quality ?
Yes it can be
Mortality amenable to health care
But as allways there is pro and cons.
• Nolte E, McKee M. Measuring the health of nations: analysis of mortality amenable to health care. BMJ 2003;327(7424):1129-0. • Nolte E, McKee M. Does Healthcare Save Lives. London, UK: The Nuffield Trust; 2004. • Shahian DM, Wolf RE, Iezzoni LI, Kirle L, Normand SL. Variability in the Measurement of Hospital-wide Mortality Rates. New England
Journal of Medicine 2010;363(26):2530-2539.
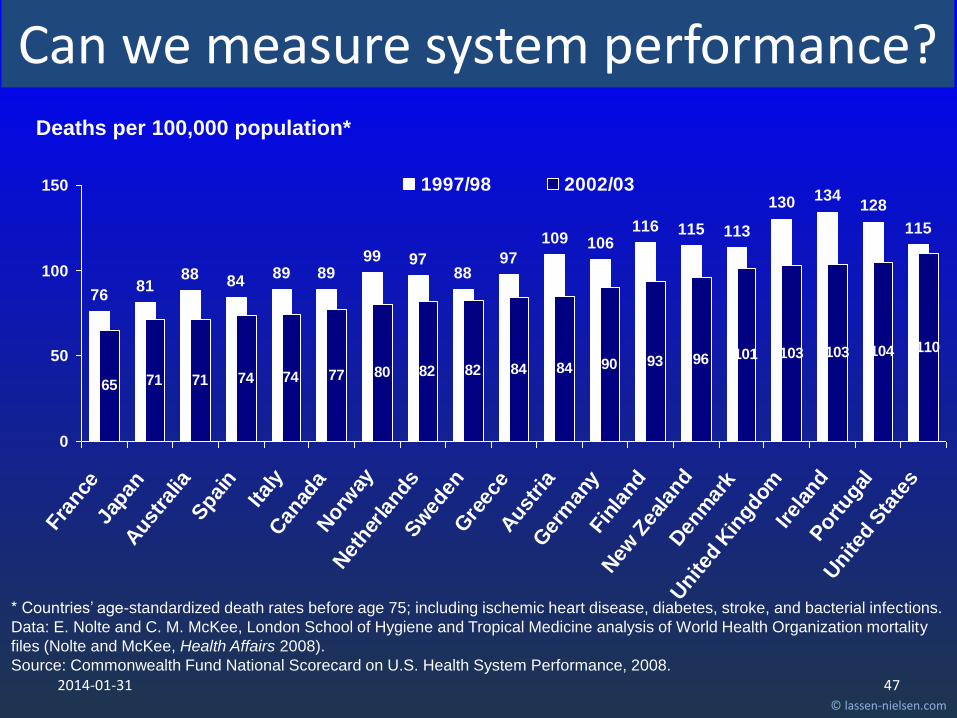
Can we measure system performance?
© lassen-nielsen.com
2014-01-31
7681
88 8489 89
99 9788
97
109 106116 115 113
130 134128
115
65 71 71 74 74 77 80 82 82 84 84 90 93 96 101 103 103 104 110
0
50
100
150
Fra
nce
Japan
Aust
ralia
Spai
n
Ital
yCan
ada
Norw
ay
Net
her
lands
Sw
eden
Gre
ece
Aust
ria
Ger
man
yFin
land
New
Zea
land
Den
mar
k
United
Kin
gdom
Irel
and
Portugal
United
Sta
tes
1997/98 2002/03
Deaths per 100,000 population*
* Countries’ age-standardized death rates before age 75; including ischemic heart disease, diabetes, stroke, and bacterial infections.
Data: E. Nolte and C. M. McKee, London School of Hygiene and Tropical Medicine analysis of World Health Organization mortality
files (Nolte and McKee, Health Affairs 2008).
Source: Commonwealth Fund National Scorecard on U.S. Health System Performance, 2008.
Can we measure system performance?
47 © lassen-nielsen.com

2014-01-31
Methods depend on aim?
48 © lassen-nielsen.com

2014-01-31
Methods depend on aim?
49 © lassen-nielsen.com
The correspondence between population health measures and types of intervention to enhance health. Interventions may be directed at several levels (shown in the ellipses), and these correspond broadly to stages in the etiologic sequence (shown at the left of the diagram) and Morgenstern’s classification of population health indicators(shown at the right).

2014-01-31 50

The share of GDP allocated to health is increasing in all OECD countries, mostly due to new medical technologies and population
ageing
Source: OECD Health Data 2009, OECD (http://www.oecd.org/health/healthdata). 51
© lassen-nielsen.com

Life expectancy at birth has increased by more than 10 years in OECD countries since 1960, reflecting a sharp decrease in mortality rates at all ages
Source: OECD Health Data 2009, OECD (http://www.oecd.org/health/healthdata). 52
© lassen-nielsen.com
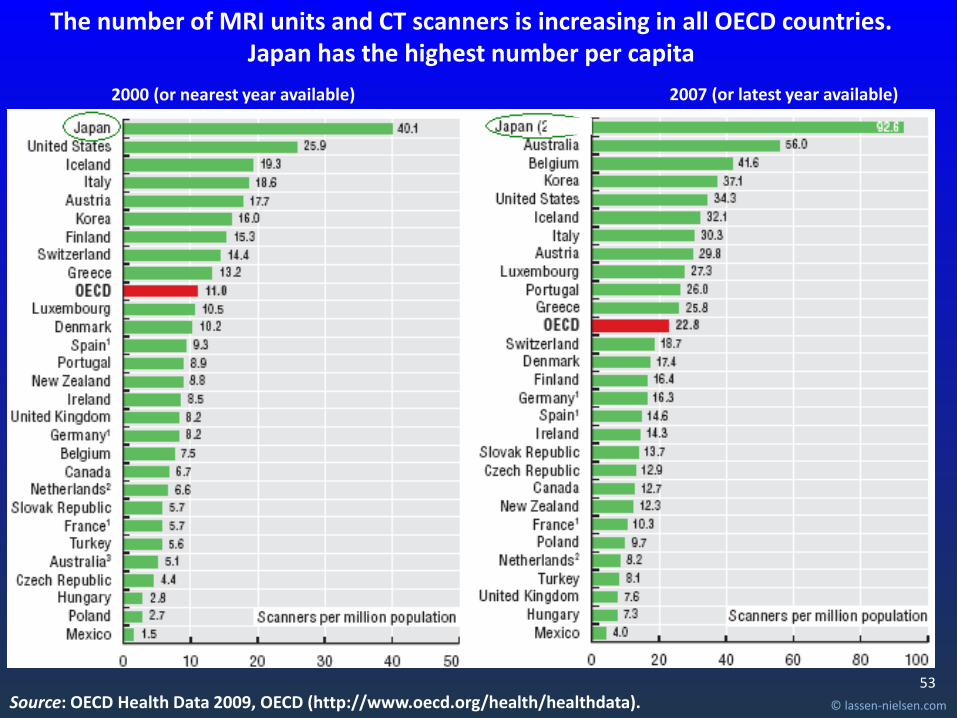
The number of MRI units and CT scanners is increasing in all OECD countries. Japan has the highest number per capita
2007 (or latest year available)
Source: OECD Health Data 2009, OECD (http://www.oecd.org/health/healthdata).
2000 (or nearest year available)
53
© lassen-nielsen.com

The United States has the highest number of MRI and CT exams per capita, followed by Luxembourg, Belgium and Iceland
1. Only include exams for out-patients and private in-patients (excluding exams in public hospitals). Note: Several countries, including Japan, have not provided any data.
2007 (or latest year available)
Source: OECD Health Data 2009, OECD (http://www.oecd.org/health/healthdata).
2000 (or nearest year available)
54
© lassen-nielsen.com

The number of physicians per capita has increased in all OECD countries since 1990, except in Italy
2007 (or latest year available) 1990-2007 (or nearest year)
1. Ireland, the Netherlands, New Zealand and Portugal provide the number of all physicians entitled to practise rather than only those practising. 2. Data for Spain include dentists and stomatologists.
Source: OECD Health Data 2009, OECD (http://www.oecd.org/health/healthdata). 55
© lassen-nielsen.com

The number of nurses per capita has increased in all OECD countries since 2000, except in Australia, the Netherlands and the Slovak Republic
2000-2007 2007 (or latest year available)
Source: OECD Health Data 2009, OECD (http://www.oecd.org/health/healthdata). 56
© lassen-nielsen.com

Treatment for chronic diseases is not optimal. Too many persons are admitted to hospitals for asthma …
1. Does not fully exclude day cases. 2. Includes transfers from other hospital units, which marginally elevates rates.
Asthma admission rates, population aged 15 and over, 2007
Source: OECD Health Care Quality Indicators Data 2009 (OECD). 57
© lassen-nielsen.com

Cancer survival rates are increasing in all OECD countries
Source: OECD Health Care Quality Indicators Data 2009 (OECD).
Cervival cancer Breast cancer
Note: Survival rates are age standardised to the International Cancer Survival Standards Population. 95% confidence intervals are represented by H in the relevant figures.
Five-year relative survival rates
58
© lassen-nielsen.com

… too many persons are admitted to hospitals for diabetes complications, highlighting the need to improve primary care
Diabetes acute complications admission rates, population aged 15 and over, 2007
1. Does not fully exclude day cases. 2. Includes transfers from other hospital units, which marginally elevates rates.
Source: OECD Health Care Quality Indicators Data 2009 (OECD). 59
© lassen-nielsen.com

In-hospital mortality rates following heart attack are decreasing in all OECD countries
Note: Rates are age-sex standardised to 2005 OECD population (45+). 95% confidence intervals are represented by H.
Source: OECD Health Care Quality Indicators Data 2009 (OECD). 60
© lassen-nielsen.com

The average length of stay for acute care has fallen in nearly all OECD countries
Average length of stay for acute care
Source: OECD Health Data 2009, OECD (http://www.oecd.org/health/healthdata). 61
© lassen-nielsen.com