measuring financial investment development in … › articles ›...
TRANSCRIPT

1
MEASURING FINANCIAL INVESTMENT DEVELOPMENT IN CAMBODIA
Dr Chhiv Sok Thet*
ABSTRACT
Financial markets performed a vital function within the global economic system. It is the heart of
global financial system, which channels savings to the institutions needing funds for business
development. Moreover, it develops a mechanism for financial investments which private firms and
government institutions can issue the stock, bond and other securities in order to raise funds to
support the investment and business development projects. Simultaneously, the publics and investors
are interested to invest in the financial instruments for the income generation. Hence, this mechanism
has provided the chances and benefits to support the economic growth and the challenges to the
financial sector development in the country as well.
The study intends to define the development of financial investment mechanism and the benefits of
financial investment development to support the economic growth and the challenges of the financial
investment that have an impact on the financial sector development in the country. The descriptive
research and quantitative and qualitative approach has been used to meet the objectives and test the
variables and the hypotheses of study. Descriptive statistic model of Excel is used to analyze and
assess the sources of data and aims to summarize and describe the samples that are concerned with
the research, the measures commonly used to describe a data set and measures of variability. The
convenience sampling technique is used in the survey by drawing the samples from interviews, as the
result, 120 respondents selected from the population size 300. After analysis and evaluation, the
findings found that first, 70 percent of respondents expressed their lack of financing source to support
the economic development. Second, most of firms are not yet to prepare themselves to list in the CSX
and have insufficient knowledge of the financial investment and its process, thus; they are worry
about high risk in the investment and legal framework, transparent and efficient market operations
and managements and the investor protection. Third, although, the financial investment development
is less profited to support the current economy growth of Cambodia, but at least, there is a number of
benefits to support macroeconomic such as the tax income, the employment opportunity creation and
the financial legal framework improvement as well as the financial sector development.
Key Words: Financial Markets, Money and Capital Markets, Security Markets, Financial Investment
Development, Global Economic and Financial System, Financial Asset Transaction, Financial
Institutions, Securities Investment, Financial Market Development & Economic Growth

2
1. INTRODUCTION
The financial market development in the country provided the chances and benefits to the economic
growth and financial sector development. Likewise, it creates a mechanism for financial investment in
the country, which all the private enterprises, corporations and government institutions issue the
financial instruments such as stock, bond and other securities in order to raise funds for support of the
business and investment development. In this regards, the investors, savers and businesspersons have
taken their chances go into the securities investment to obtain the incomes from the interest rate,
dividend growth and appreciation of securities prices.
The road map of financial sector development of Cambodia aims at to improve the national economic
growth sustainably and the contribution of poverty reduction. The Government has set out the
Financial Sector Development Strategy 2006-2015 (FSD) in order to strengthen the financial system
through the capital market development to increase the national revenue for support of the economic
growth and assure the competitiveness advantage of Cambodia within the globalization framework.
According to the FSDS, the securities market of Cambodia established to mobilize the resources for
financing to the government institutions and the private corporations to the business and investment
expansion projects that recently relied on the banking system. In addition, this mechanism supports
the financial sector development in the country and increases the productions, goods and services to
meet the needs of the local markets. Although, the financial investment is a source of economic
growth, but it is a basis of the financial crises, because this mechanism is a newest one in the country,
thus, the challenges may happening because of the most capital flows in the capital markets is a
sources of debt and currency crises. Moreover, the most important concern is that the people still do
not participate in this investment process. Because their knowledge are still low and incomplete in
terms of the investment principle, the risk reduction and portfolio managements, and unreliability on
the investor’s right protection, the transparency and operation of the securities market as well as
carrying out of the securities laws, regulations, and policies involving the financial investment process.
Therefore, in order to assure the investment process in the country to be efficient and transparent,
Cambodia must face many difficulties and challenges in the new mechanism. Thus, the study aims to
determine the relationship between financial investment developments and economic growth since the
capital markets has been developed that intends to see the market is providing the opportunities and
benefits to the financial sector development and economic growth or not. The study also defines the
challenges of market development to the economic and financial sector development. How does the
financial investment development really support the economic growth in country or not anything?
3
2. PROBLEM STATEMENT AND QUESTIONS
The research aims to study the problems that Cambodia is facing since development of capital market
order to reinforce the financial system and the economic growth. Currently, the banking systems is
unable to finance the economic growth in the country, because of the banking system has an
inadequate progress relying on the amounts of saving mobilization from depositors throughout the
county, if compared to the neighboring countries in ASEAN. The financial system is unable to sustain
the well-functioning operation to improve the economic growth. Thus, in order to sustain the national
economic growth, Cambodia has committed to develop the capital markets, besides the banking
system to mobilize the savings from the publics and investors to support the long-term investment.
However, the market development is difficult that needs to develop strong components of the markets
in order to acquire an efficient market.
Accordingly, the research intends to investigate to see that the mechanism of financial investment
development is offering the opportunities and benefits to support the economic growth in the country
or not? In addition, the study aims to examine the challenges happening from financial investment
development have an impact on the economic and financial sector development in the country or not?
3. RESEARCH OBJECTIVE
The research intends to see that since the capital markets development has been developed in the
country. It provides opportunities to develop the financial investment mechanism to support the
economic growth and financial sector development in the country. Thus, the main purpose of this
study aims at to define an alternative financing source from the financial investment development to
support the economic growth and financial sector development in the country. The study also
determines the benefits from the financial investment development in the country that can funding to
the long-term investment and business development through raising funds from the capital markets to
support the economic growth. In addition, the study intends to find out the challenges from the
financial investment development in the country that have an impact on the economic growth and
financial sector development in Cambodia.
4. HYPOTHESIS OF STUDY
H1: Financial investment development has provided a chance of new financing to support the
economic growth in the country.
H2: Financial investment development has provided benefits to support the economic growth and the
financial sector development in the country
H3: Financial investment development has provided challenges to economic growth and financial
sector development in the country
5. PROPOSED CONCEPTUAL FRAMEWORK/MODEL

4
The study aims to determine the interrelationship between the independent variables and dependent
variable conducting the research on how the three independent variables affect the economic growth
and financial sector development. To illustrate, the study tries to figure out how a new financing from
capital market development aligns to benefits and challenges to economic growth. In short, the
proposed framework suggests how a new financing, benefits and challenges from financial investment
development can be linked together in reaching conclusion
6. RESEARCH METHODOLOGY
The quantitative data is collected using the non-probability self-administered questionnaire consisting
of 3 parts and 19 questions distributing to the respondents. In analyzing the data collected, the
Microsoft Excel’s Descriptive Statistics and Statistics Model have been applying. This section also
introduced the sampling techniques aiming to collect information from the target population using the
questionnaires in the forms of frequency and percentage and then implement into the Normal
Distribution and Descriptive Statistics to make the reliability test and subsequent empirical analysis.
6.1 Research Designs
According to the research problems and objectives, the methods that used for the research purpose is
descriptive research design. The design has been used both quantitative and qualitative approaches for
reaching conclusion. The conceptual model has been formulated to show the interrelationships
between the variables and hypotheses. The study intends to determine the inputs and outcome of the
research focusing on the financial investment development in the country given the chances to raise a
new fund to support the economic growth and the benefits to the economic growth and financial
sector development in the country. In addition, the study determines its challenges or impact on the
economic growth and financial sector development as well. The variables for experiment are divided
into dependent variable (DV)and independent variable (DV). The cause and effect model has been
applying as depicted in the following figure:
o (Y) Opportunity of financial investment development (Output)
o (X1) Development of financial investment mechanism
Economic Growth and Financial Sector Development
Chance of new financing to support the economic growth
Benefits of financial investment development
Challenges of financial investment development

5
o (X2) Benefits of financial investment development (Inputs)
o (X3) Challenges of financial investment development
6.2 Sampling Design
The key investors from the private business organization and institutional individuals were selected as
respondents in the research. The 120 respondents selected from the population size 300. The sample
size calculation of the Indochina Countries showed that if the level of confident 95 percent was taken,
the sample size should be betwenn 100 to 200. Hence, the margin error is about seven percent. The
calculation is conformed to Taro Yamane (1967), which can calculate the sample sizes, shown below.
Where N is the population size (300) and e is the sampling error (0.07) assumed for this equation:
N 300 n = ————— = ——————— = 121 (≈120)
1 + N (e) 2 1 + 300 (0.07)2
Accordingly, the 120 investors has been selected to be the respondents in this research. To avoid the
bias in selecting the respondents, the Systematic Random Sampling used for selection.
6.3 Data Collection Methods
The data collections for the research are quantitative and qualitative design. The requirement of data
sources and other information for this research are primary data and secondary data. The researcher
creates the structured questionnaire as the research instrument to collect data and specific information
from the institutional and public investors. The samples scientifically selected in the right place are
the questionable representatives of the target population. The process of sampling selection used the
personal interviews between researcher and respondents at their offices for this survey. Primary data
provides the raw facts through questionnaires interviewing with 120 respondents and used it to test an
experiment of the working variables and hypotheses as the evidences to support my proclamation. To
Opportunity of F
inancial Investment
Developm
ent in Cam
bodia (Output)
Ha1
Ha 2
Ha 3
Financial investment development has provided the
chances for new financing to support the economic
growth in the country.
Financial investment development has provided the
benefits to support the economic growth though
raising funds in the capital markets.
Financial investment development has provided the
challenges to the economic growth and financial
sector development in the country

6
support the research for full investigation, the secondary data has been used such as official statistics,
government reports, website, and previous researches, historical data and existing information are
collected from other resources.
6.4 Research Instrument
The questionnaires orderly formulated and manipulated into the three parts consisting of 19 questions,
the data gathered from the questionnaires and then prepared them to make tabulation of frequency,
percentage, means and standard deviation and the normal distribution to indicate the consistent degree
among respondents and to test the variables and research hypotheses based on the subjective and
objective statistical analysis and evaluation on the interviewing result. The variables that used in this
research are determined as the independent variables and dependent variables.
6.5 Measurement Model for Research
The descriptive statistic model used to analyze and interpret the data. The data that collected from the
questionnairs are required to compute in the Microsoft excel using arithmetic formulas such as the
average, mean, median, mode, standard deviation, variance, minimum and maximum, range, sum,
count, kurtosis and skewness. The mean and standard deviation and the normal distribution have been
used to find the relationship between mean and standard deviation. The Normal Distribution
Calculator of David M. Lane (2012) has been using. The ANOVA, T-test, Scatter Plot, Pearson
Correlation Coefficient and Multiple Linear Regressions Model Y = a + b1x1 ...+ bnxn and other
formula have been used to compute for finding the conclusion of the research.
6.6 Data Analytical Methods
The primary and secondary data has been used to analyze by the quantitative and qualitative designs.
The primary data is analyzed by the quantitative design based on the statistics model and tabulation,
the calculation of average, percentage and growing ratio to show and interpret the data. In the analysis,
the data manipulated in computer using the excel spreadsheet in order to draw charts such as bar, line,
column, scatter to analyze and evaluate each figure. Whereas, the secondary data has been used
because of the questionnaires are not fully covered and questioned. Thus, the secondary data is
analyzed and evaluated by the qualitative design to make conclusion. The data used to analyze on the
chances, benefits and challenges from financial investment development in the country basing on the
specific variables for measuring and classified into three independent variables and the t-Test has been
used to test the research hypotheses.

7. DATA COLLECTION ANALYSIS
7.1 Normal Distribution Analysis
95% confidence level = 1.96
The Normal Distribution Calculator of David M. Lane (2012) has been
and standard deviation (SD) to see
constancy of respondent’s response.
7.1.1 Interpretation of the Questions:
Part I: Chance of Financial Investment Development
Question 1: the variable in the question 1
high frequency, it is approximate
= 24 and SD = 21.60 identifying the
is close to the mean and lies between
45.60 that contains 68% of distribution.
it can conclude that respondent’s
accurate constant.
Question 2: the variable in the question
highest frequency, it is approximately 60
= 60 and SD = 17 identifying the
close to the mean and lies between
that contains 68% of distribution.
conclude that respondent’s
accurate constant.
DATA COLLECTION ANALYSIS
Analysis
Xmin is for P (-∞ to Xmin) = 0.025
95% confidence level = 1.96 Xmax is for P (-∞ to Xmax) = 0.975
The Normal Distribution Calculator of David M. Lane (2012) has been used to compute
and standard deviation (SD) to see the percentage of distribution of the shade area
response.
Questions:
Part I: Chance of Financial Investment Development (IV 1):
in the question 1 is a
approximately 43.5%,
identifying the SD point
between 24 and
68% of distribution. Thus,
respondent’s response is
in the question 2 is a
, it is approximately 60%,
identifying the SD point is
between 43 and 77
68% of distribution. Thus, it can
response is
7
used to compute the mean ( )
of the shade area of accurate
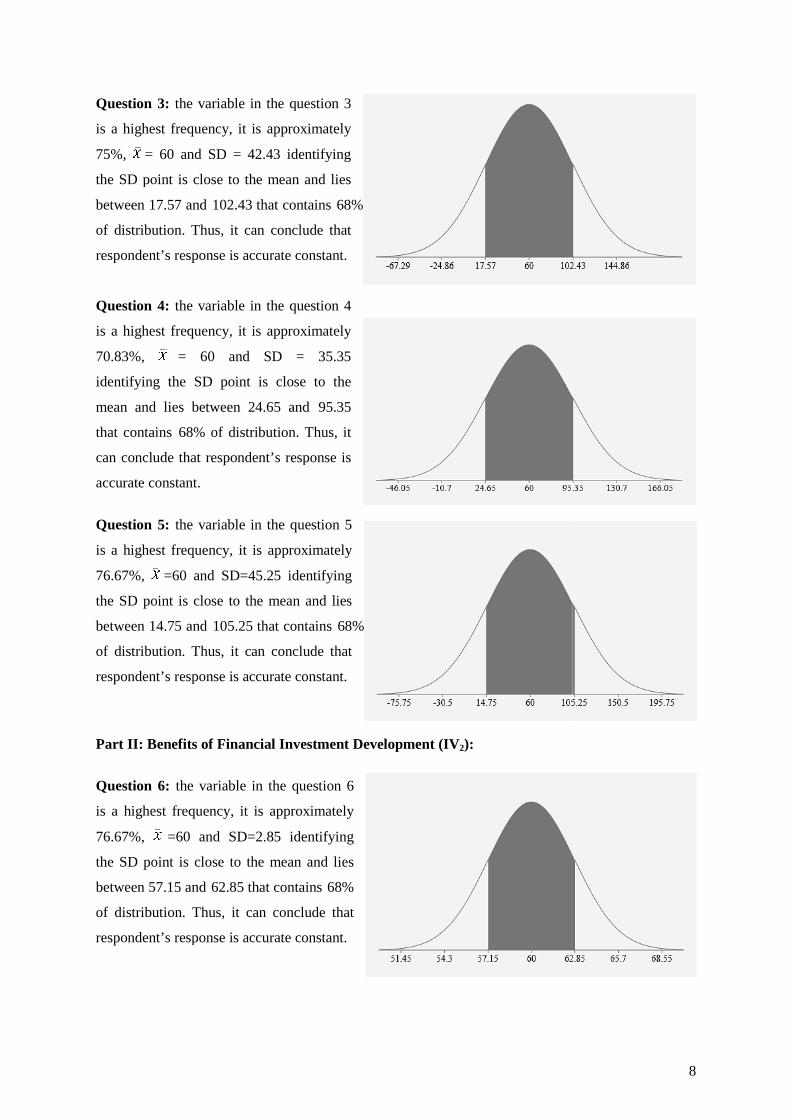
Question 3: the variable in the question
is a highest frequency, it is approximately
75%, = 60 and SD = 42.43
the SD point is close to the mean
between 17.57 and 102.43 that contains
of distribution. Thus, it can conclude that
respondent’s response is accurate constant.
Question 4: the variable in the question 4
is a highest frequency, it is approximately
70.83%, = 60 and SD = 35.35
identifying the SD point is close to the
mean and lies between 24.65
that contains 68% of distribution.
can conclude that respondent’s response is
accurate constant.
Question 5: the variable in the question
is a highest frequency, it is approximately
76.67%, =60 and SD=45.25
the SD point is close to the mean
between 14.75 and 105.25 that contains
of distribution. Thus, it can conclude that
respondent’s response is accurate constant.
Part II: Benefits of Financial Investment Development
Question 6: the variable in the question
is a highest frequency, it is approximately
76.67%, =60 and SD=2.85
the SD point is close to the mean
between 57.15 and 62.85 that contains
of distribution. Thus, it can conclude that
respondent’s response is accurate constant.
in the question 3
, it is approximately
identifying
point is close to the mean and lies
that contains 68%
Thus, it can conclude that
response is accurate constant.
in the question 4
, it is approximately
= 60 and SD = 35.35
point is close to the
and 95.35
istribution. Thus, it
response is
in the question 5
, it is approximately
identifying
point is close to the mean and lies
that contains 68%
Thus, it can conclude that
response is accurate constant.
Part II: Benefits of Financial Investment Development (IV 2):
in the question 6
, it is approximately
identifying
point is close to the mean and lies
that contains 68%
Thus, it can conclude that
response is accurate constant.
8

Question 7: the variable in the question
is a high frequency, it is approximately
58.33%, =40 and SD=27.85 identifying
the SD point is close to the mean
between 12.15 and 67.85 that contains
of distribution. Thus, it can conclude that
respondent’s response is accurate constant.
Question 8: the variable in the question 8
is a highes frequency, it is approximately
90%, = 30 and SD=26.60 identifying the
SD point is close to the mean
between 3.4 and 56.60 that contains
of distribution. Thus, it can conclude that
respondent’s response is accurate constant.
Question 9: the variable in the question
is a high frequency, it is approximately
26%, = 20 and SD=10 identifying the
SD point is close to the mean
between 10 and 30 that contains
distribution. Thus, it can conclude that
respondent’s response is accurate constant.
Question 10: the variable in the question
10 is a highest frequency
approximately 75%, = 60 and SD
42.42 identifying the SD point is close to
the mean and lies between 17.58
102.42 that contains 68% of distribution.
Thus, it can conclude that respondent’s
response is accurate constant.
in the question 7
, it is approximately
identifying
point is close to the mean and lies
that contains 68%
Thus, it can conclude that
se is accurate constant.
in the question 8
, it is approximately
identifying the
point is close to the mean and lies
that contains 68%
, it can conclude that
response is accurate constant.
in the question 9
, it is approximately
identifying the
point is close to the mean and lies
ntains 68% of
Thus, it can conclude that
response is accurate constant.
in the question
frequency, it is
= 60 and SD =
point is close to
17.58 and
68% of distribution.
respondent’s
9

Question 11: the variable in the question
11 is a high frequency, it is approximately
50%, = 30 and SD = 27.73 identifying
the SD point is close to the mean
between 2.27 and 57.73 that contains
of distribution. Thus, it can conclude that
respondent’s response is accurate constant.
Question 12: the variable in the question
12 is a high frequency, it is approximately
50%, = 30 and SD = 22.73 identifying
the SD point is close to the mean
between 7.27 and 52.73 that contains
of distribution. Thus, it can conclude that
respondent’s response is accurate constant.
Question 13: the variable in the question
13 is a highest frequency
approximately 79%, = 30 and SD = 4.10
identifying the SD point is close to the
mean and lies between 25.90
that contains 68% of distribution.
can conclude that respondent’s respo
accurate constant.
Part III: Challenges of Financial Investment Development
Question 14: the variable in the question
14 is a high frequency, it is approximately
50%, = 40 and SD = 20 identifying the
SD point is close to the mean
between 20 and 60 that contains
distribution. Thus, it can conclude that
respondent’s response is accurate constant.
in the question
, it is approximately
identifying
point is close to the mean and lies
that contains 68%
Thus, it can conclude that
response is accurate constant.
in the question
, it is approximately
identifying
point is close to the mean and lies
that contains 68%
Thus, it can conclude that
response is accurate constant.
in the question
frequency, it is
= 30 and SD = 4.10
point is close to the
and 34.10
68% of distribution. Thus, it
response is
Part III: Challenges of Financial Investment Development (IV 3):
in the question
, it is approximately
identifying the
point is close to the mean and lies
that contains 68% of
Thus, it can conclude that
response is accurate constant.
10

Question 15: the variable in the question
15 is a high frequency, it is approximately
26.67%, = 40 and SD = 36.66
the SD point is close to the mean
between 3.34 and 76.66 that contains
of distribution. Thus, it can conclude that
respondent’s response is accurate constant.
Question 16: the variable in the question
16 is a high frequency, it is approxim
50%, = 40 and SD = 23 identifying the
SD point is close to the mean
between 17 and 63 that contains
distribution. Thus, it can conclude that
respondent’s response is accurate constant.
Question 17: the variable in the question
17 is a high frequency, it is approximately
62.50%, = 40 and SD = 35 identifying
the SD point is close to the mean
between 5 and 75 that contains
distribution. Thus, it can conclude that
respondent’s response is accurate constant.
Question 18: the variable in the question
18 is a high frequency, it is approximately
29.17%, = 20 and SD = 14 identifying
the SD point is close to the mean
between 6 and 34 that contains
distribution. Thus, it can conclude that
respondent’s response is accurate constant.
in the question
, it is approximately
identifying
point is close to the mean and lies
that contains 68%
Thus, it can conclude that
response is accurate constant.
in the question
, it is approximately
identifying the
point is close to the mean and lies
that contains 68% of
Thus, it can conclude that
response is accurate constant.
in the question
, it is approximately
identifying
point is close to the mean and lies
that contains 68% of
Thus, it can conclude that
response is accurate constant.
in the question
, it is approximately
identifying
point is close to the mean and lies
that contains 68% of
Thus, it can conclude that
onse is accurate constant.
11

Question 19: the variable in the question
19 is a high frequency, it is approximately
58.8%, = 40 and SD = 30 identifying the
SD point is close to the mean
between 10 and 70 that contains
distribution. Thus, it can conclude that
respondent’s response is accurate constant.
Source: Developed from PhD Dissertation 8. MAJOR RESEARCH FINDINGS
8.1 Experiment of Variables
�
2
6
10
14
18
22
26
30
In order to make an experiment of the relationship between the independent variables (X) and a
dependent variable (Y), the Multiple Regressio
independent variables (IVs), if they have positive relationship with the dependent variable (DV) or not.
The slope shows that the regression line is
relationship between X and Y. In order to explain the behavior of DV, the multiple regression
equation here Y = a + b1x1 …+ b
8.2 Descriptive Statistics for Standard Outputs
DV (�) IV(s) Group Mean
11.40 IV1 (X1) 52.80
IV2 (X2) 37.50
IV3 (X3) 36.67
Source: Developed from PhD Dissertation from page 145
in the question
, it is approximately
identifying the
point is close to the mean and lies
that contains 68% of
it can conclude that
response is accurate constant.
Developed from PhD Dissertation from page 103 - 144
8. MAJOR RESEARCH FINDINGS
X1
X2
X3
24 60 40
60 40 40
60 30 40
60 20 40
60 60 20
- 30 40
- 30 -
- 30 -
In order to make an experiment of the relationship between the independent variables (X) and a
the Multiple Regression Model and Scatter Plot have been used to test the
if they have positive relationship with the dependent variable (DV) or not.
The slope shows that the regression line is significantly different from 0 and has significant line
relationship between X and Y. In order to explain the behavior of DV, the multiple regression
…+ bnxn has been used to apply and calculate Y.
criptive Statistics for Standard Outputs
Group Mean Standard
Deviation
Median Mode
52.80 16.10 60 60
37.50 14.88 30 30
36.67 8.20 40 40
Developed from PhD Dissertation from page 145 -148
12
In order to make an experiment of the relationship between the independent variables (X) and a
have been used to test the
if they have positive relationship with the dependent variable (DV) or not.
significantly different from 0 and has significant linear
relationship between X and Y. In order to explain the behavior of DV, the multiple regression
Min Max
24 60
20 60
20 40

13
8. 3 Multiple Regression Model
8.3.1 Regression Model Summary
Multiple R R Square Adjusted R Square Standard Error
0.8954 0.8018 0.6533 5.7689
8.3.2 ANOVA Model Summary
ANOVA Model Sum of Square df Mean Square F Significant F
Regression 538.8760745 3 179.62536 5.397237 0.068527183
Residual 133.1239255 4
Total 672 7
8.3.3 Multiple Regression Analysis
Analysis Coefficients Standard Error t Stat P-value
Intercept (a) 36.36048511 6.517845666 5.5786048 0.005062
B1 -0.070845531 0.08817691 -0.803448 0.466746
B2 -0.225528554 0.148812135 -1.515525 0.20422
B3 -0.347827703 0.142223287 -2.445645 0.070776
-Y = a + B1x1 + B2x2 + B3x3 (the Multiple Regression Equation)
- a = y-intercept is constant
- B = coefficient or slope
Y=36.36048511 - 0.070845531*(X1) - 0.225528554*(X2) - 0.347827703 *(X3)
Y=36.36048511- 0.070845531*(52.8) - 0.225528554*(37.5) - 0.347827703 *(36.70)
Y=11.39724 ≅ 11.40
Source: Developed from PhD Dissertation from page 149 -150
R Square (R2) is the proportion of variance in the value of dependent variable that explained by the
independent variables in the equation together. According to the calculation above indicates that when
R2 = 0.80189892 (80%) or adjusted R2 has 0.653323111 and F=5.397237>F sig. = 0.068527183, are
statistically significant correlation between IVs and DV. Thus, we can conclude that there is positive
significant relationship between the financial investment development and economic growth in the
country. However, based on the result of the survey showed that P-value of B3 is 0.070776 ≅ 0.05,
thus, the figure indicates that B3 has more impact on Y than B1 that its value is 0.466746 > 0.05 and B2

14
is 00.20422 > 0.05 meaning that since the capital market development or financial investment
development in the country to support the economic growth and financial system development.
Cambodia is getting more challenges than chances and benefits. It means that that this mechanism
does not provide the chances to the investors to join in the financial investment both funds raising and
securities investment. Hence, according to above statistics, we can conclude that although we do not
have many chances and benefits from the financial investment development in the country, but R2 =
0.80189892 (80%) indicates that there is significant relationship between the financial investment
development and economic growth in Cambodia.
8.4 Hypotheses Testing Summary:
8.4.1 t-Test Model: Two-Sample Assuming Equal Variances
Hypotheses
Result
Supported P(T<=t)
two-tail
T Stat T Critical
two-tail
*R-value
H1: Financial investment development
has provided chances of new financing
to support the economic growth.
P = 0.10
P > 0.05
1.750
2.200
0.7666
No
H2: Financial investment development
has provided the benefits to support the
economic growth and financial sector
development.
P = 0.059
P = 0.05
0.123
2.178
-0.4798
Yes
H3: Financial investment development
has provided challenges to economic
growth and financial sector
development.
P = 0.904
P > 0.05
2.159
2.262
-0.0247
No
*R-value: Pearson Correlation Coefficient Source: Developed from PhD Dissertation from page 158 -163
H1: Financial investment development has provided chances of new financing to support the economic growth The result of hypotheses testing indicates that there is significantly positive relationship between the
independent variables “new financing from financial investment development” and the dependent
variable “supporting economic grow”. Even the P-value is greater than 0.05 (P = 0.10 P > 0.05), but
the value of t-critical two test is greater than t-Stat (2.200 > 1.75) and the value of R is 0.7666. The
value of 0.7666 shows that “new financing from financial investment development” has a positive

15
correlation with “supporting economic grow”, which means that high X variable scores go with high
Y variable scores. The value of R2, the coefficient of determination, is 0.5877.
H2: Financial investment development has provided the benefits to support the economic growth
and financial sector development
The result of hypotheses testing shows the P-value is equal to 0.05 (P = 0.05, P ≅ 0.05) indicates that
H2 is supported. The value of t-critical two test is greater than t-Stat (2.17 > 0.123) and the value of R
is -0.47 shows that there is a significant relationship between the independent variables “benefits from
financial investment development” and the dependent variable “supporting the economic growth and
financial sector development”. Although, the value of -0.47 shows technically a negative correlation,
but the relationship between both variables just shows a little weakness. However, the relationship
between IV and DV are still confident because the value of R is nearer to zero. The value of R2, the
coefficient of determination, is 0.2302.
H3: Financial investment development has provided challenges to economic growth and
financial sector development
The result of hypotheses testing indicates that there is significantly positive relationship between the
independent variables “challenges from financial investment development” and dependent variable
“supporting economic growth and financial sector development”. The P-value is greater than 0.05 (P
= 0.90 P > 0.05), the value of t-critical two test is greater than t-Stat (2.26 > 2.15) and the value of R
is -0.024 showing that there is a significant positive relationship between both variables. Although,
the value of -0.024 indicates technically a negative correlation, but the relationship between both
variables just shows a slight weakness. Thus, the relationship between IV and DV are still confident
because the value of R is nearer to zero. The value of R2, the coefficient of determination, is 0.0006.
9. Expectation of Cambodia Economic Growth (2012-2016)
9.1 GDP Growth Forecast and Market Capitalization to GDP Ratio
So far, the CSX has two listed companies are PPWSA and GTA. These are:
- Number of listed shares of PPWSA 86,973,162
- Average Share Prices in Riel 6,700
- Number of listed shares of GTI 40,000,000
- Average Share Prices in Riel 9,200
- Nominal GDP (Million $US) US$ 15,649,000,000
Source: Developed from PhD Dissertation from page163-172

16
The formula below has been applying to calculate the Market Capitalization to GDP ratio:
Market Capitalization to GDP = Stock Market Capitalization
Norminal GDPx 100
Forecast of GDP Growth Rate and Market Capitalization
The GDP in Constant Prices and the National Currency in Billion Riel (KHM Billion)
Year Real GDP (Nominal)
Real GDP growth rate
Market Capitalization to GDP ratio
GDP per Capita
2012 33,781.97 6.47% 0.65% 2.318
2013 35,975.01 6.50% 0.98% 2.444
2014 38,357.78 6.63% 1.65% 2.580
2015 40,956.35 6.78% 2.10% 2.727
2016 43,917.22 7.24% 2.70% 2.883
Sources: Developed from PhD Dissertation from page163-168
9.1.2 GDP Growth Forecast and Market Capitalization to GDP Ratio
Sources: Developed from PhD Dissertation from page168-169
33,781.9735,975.01
38,357.7840,956.35
43,917.22
2,318 2,444 2,580 2,727 2.883
0.00
5,000.00
10,000.00
15,000.00
20,000.00
25,000.00
30,000.00
35,000.00
40,000.00
45,000.00
50,000.00
2012 2013 2014 2015 2016
KH
M B
illio
n (N
atio
nal C
urre
ncy)
Real Nominal GDP and GDP Growths per Capita (2012 - 2016)
Real GDP (constant prices) GDP growth per capita
Expon. (Real GDP (constant prices)) Linear (GDP growth per capita)

17
9.1.3 GDP Growth Rate and Market Capitalization to GDP Ratio (2012–2016)
Sources: Developed from PhD Dissertation from page170-172
According to the results of calculation, showing Cambodia’s economic growth is expected to grow
gradually over the past 5 years (2012-2016), since the country launches the capital markets in early
2012. The value of GDP in the constant prices will increase from 33,781.97 billion to 43,917.22
billion riels. Whereas the growth rate of GDP expected to rise from 6.47 percent to 7.24 percent. For
the market capitalization as a source of fund raising from the capital markets has contributed to the
economic growth of country from 0.65% to 2,7%. For instance, 0.65 percent of GDP in 2012, 0.98
percent of GDP in 2013, 1.65 percent of GDP in 2014, 2.1 percent of GDP in 2015, and 2.7 percent of
GDP in 2016. However, Cambodia’s expectation growth is still lower than KSRI of Korea, which
forecasted that the national GDP growth will increase to 24.3 billion USD in 2016 and market
capitalization may worth 12 billion USD and size of bond market is 10.9 billion USD. The figure is
higher than the forecasts of IMF, which estimated that GDP of Cambodia might comprise 21,081
billion USD in 2016. However, the expectation is still higher than the market capitalization of the
Vietnam Stock Exchange that launched in 2000, which had an increase only 0.22 percent until 2005,
then the market capitalization continued to increase 0.88 percent. Whereas, Cambodia’s market
capitalization will increase similarly to China in 1991 with a growth rate of only 0.53 percent, and
then, the rate rose marginally to 89.3 percent in 2006. China's market capitalization rose sharply to
178.2 percent of GDP in 2007 and fell back by 81.02% in 2010. In addition, Cambodia’s market
capitalization is higher than the market capitalization of Indonesia in 1988 that increased only 0.28
6.7
0.1
5.9 66.47 6.5 6.63 6.78
7.24
0.65 0.98
1.652.1
2.7
0
1
2
3
4
5
6
7
8
2007 2008 2009 2010 2011 2012 2013 2014 2015 2016 2017
GDP Growth Rate and Market Cap. to GDP Ratio((((2012 - 2016))))
Real GDP growth ratio Market Capitalization (%GDP)
100%
0%
50%
Mar
ketC
apita
liza
tion
to G
DP
has
onl
y 2
.7%
of R
eal GDP

18
percent and then, the growth rate of the market capitalization of Indonesia has rose from 2.22 percent
to 50.01 percent in 2010 from year of 1989.
10. Discussion
This is a growth of the market capitalization of listed company contributing in the economic growth
of Cambodia. According to model of Garresten, Lensink, Sterken (2004) indicates that the national
market capitalization has contributed to the economic growth from 2012 to 2016 like this; 0.65
percent of GDP in 2012 and 0.98 percent of GDP in 2013 and 1.52 percent of GDP in 2014 and 2.1
percent of GDP in 2015 and 2.7 percent of GDP in 2016. Even if, we use a different calculation
method by the World Bank, but the result also showed that there is a smallest difference between two
methods. Thus, we conclude that there is a positive relationship between the financial investment
development or capital market development and economic growth.
Accordingly, the market capitalization of CSX has contributed to Cambodia’s economic growth since
2012 to 2016. The value of nominal GDP in the constant prices has increased from 33,781.97 billion
in 2012, 35,975.01 billion in 2013, and 38,357.78 billion in 2014, 40,956.35 billion in 2015 to
43,917.22 billion riels in 2016. Thus, the national economic growth has been improved at 6.46% in
2012, 6.5% in 2013, 6.63% in 2014, 6.78% in 2015 and 7.24% in 2016. The figures indicate that there
is a positive relationship between the economic growth and the market capitalization of the CSX for
the next five years. The market capitalization has contributed economic growth of the country.
Accurately, the Scatter plots has been used to compute and the result shows that there is a positive
relationship between the regression linear of national economic growth rate and the regression linear
of the market capitalization of the CSX as shown below:
Relationship between Economic Grow and Market Capitalization
Sources: Developed from PhD Dissertation from page181-183
6.47 6.5 6.63 6.78
7.24
0.650.98
1.65
2.1
2.7
0
1
2
3
4
5
6
7
8
2011.5 2012 2012.5 2013 2013.5 2014 2014.5 2015 2015.5 2016 2016.5
Growth rate Market Cap.Linear (Growth rate) Linear (Market Cap.)
19
The results are consistent with the outcomes of Harry Garresten, Robert Lensink and Elmer Sterken
(2004), who claimed that there is a relationship between the economic growth and the development of
capital markets meaning that when the economic growth increased an impetus of 1%, it defined the
growth rate of the market capitalization 0.4% of GDP. Whereas, the findings of Nieuwerberg, Buelens
and Cuyvers (2006) also indicated that there is a positive relationship between development of capital
markets and economic growth measured by the market capitalization and the number of shares listed.
However, Minier (2003) showed an evidence from the effect of the stock exchange development on
the positive economic growth unless the market has growth in terms of revenue. If the market has not
progress, so, the results obtained are negative. Whereas, Liu and Hsu (2006) also showed the positive
results of the stock market development and economic growth measured by the market capitalization
and revenue as a percentage of GDP, an influence of the capital market development has a positive
effect on both economic growth and production factor.
As the result of interviews indicated that 75% of respondents supported the CSX and 70.83% of
respondents strongly hope that they have chances to raise funds for business development and 76.67%
of respondent indicated that they want to invest the securities and other 60% expressed that they want
to list their firms in the CSX, although; they are not yet to prepare themselves. In addition, the
majority of respondents 92% revealed that their knowledge in the financial investment is still low and
over 50% showed they support the financial industrial services. A main factor beyond financing and
investment, the mechanism has brought Cambodia steps into the integration of financial globalization
generating the capital flows from abroad to the country through the financial investment and
contributions of foreign bankers and investors to invest in Cambodia. The financial globalization can
help a strong financial infrastructure and created a competition between internal and external
institutions to make the financial system to work well, effectively, and transparently and accept an
international accounting standard increasing the corporation governance, laws and regulations
involving the financial sector to maintain the competitive advantage, the stable macroeconomic, risk
management and strength of the financial sector.
11. Conclusion
According to the result of findings, we can conclude that development of financial investment in the
country has provided the chances and benefits to support the economic growth. Although, this
mechanism has provided challenges or many concerns to Cambodia’s economic growth and financial
sector development. But, the development of this mechanism is an approach to integrate the national
financial sector into the region and global financial systems and it also lead the country into the
financial crisis due to the effect of external fear or outer crisis spreading from one country to another
country because of their fears and panic behaviors. In addition, the human resources, the management
20
skills and implementation of international accounting standard can lead to the misconducts and create
a culture of competition for speculations in the national market, rather than investment for long-term
that caused an unstable securities trading and then effect the economic development and may lead the
country to the financial crisis, rather than supporting the financial system of country. Implementation
of laws and regulations did not fully applied and make the fraud and fear behaviors in the financial
investment and then lead country to crisis on health of the financial system of country. Although,
many challenge but they can be solved. Based on the international experiences indicates that the
development of efficient capital markets, most important factors is the use of public policy through
strengthening of legal framework, regulations and policies relating to the management of market in
ensuring an efficient process of financial investment, transparency and reliability for investors.
Additionally, the SECC has to develop the education programs for public awareness on knowledge of
securities investment and the legal framework to enable investors to manage risks that may occur in
the investment, because when banks, securities, insurance and industrial sectors have jointly operated,
the new risks may occur in the financial system and could threaten the financial stability.
In conclusion, although, financial investment development in the country has created the challenges to
the national economic and financial sector development, but, this mechanism has provided some
profits to contribute the current economy growth and financial sector development of Cambodia as
well. According to the experiment of variables and hypotheses testing and market capitalization
calculation to GDP ratio from 2012 - 2016 shows that Cambodia’s financial investment development
has provided benefits to sustain the economic and financial development in the country, Especially,
the mechanism supports the macroeconomics such as tax income, employment opportunity and legal
framework improvement and financial sector development. Additionally, the mechanism can sustain
the financial service industries, corporate governance and transparence as well public awareness for
companies and investors in the country. Accordingly, we can conclude that financial investment
development in the country has provided opportunities to support the economic growth and financial
sector development in Cambodia.
21
BIBLIOGRAPHY
1. Keown, Arthur J. John D. Martin, J. William Petty and David F. Scott. JR; (2005),
Financial Management, Pearson Prentice-Hall, USA, pp. 185.
2. O'Sullivan, Arthur and Steven M. Sheffrin (2003), “Economics: Principles in Action,
USA, Retrieved from http://www.pearsonschool/economics.com
3. Flyvbjerg , Bent, Nils Bruzelius, and Werner Rothengatter (2003), Megaprojects and
Risk: an Anatomy of Ambition, Cambridge University Press, U.K.
4. Bolbol, A., Fatheldin, A., and Omran, M., (2005), Financial Development, Structure, and
Economic Growth: the Case of Egypt, 1974-2002, Research in International Business and
Finance 19, pp.171-194.
5. ASEAN Exchanges (2011), Asean Exchange Collaboration, ASEAN Exchange Network,
Retrieved from http://www.aseanexchanges.org/partners.aspx
6. Australian Corporation Acts (2001), Corporation Acts, Section 763 B, Australia.
7. Bank for International Settlement (2001); Consultative Document for Operational Risk.
Retrieved from www.bis.org/publ/bcbsca07 and http://www/wiki/financial risk
8. Obama, Barak (2011), the Occupy the Wall Street Demonstration, a News Conference,
White House. Retrieved from http://www.cbsnews.com/8301-503544_ 16220116707-
503544/obama-occupy-wall-street-reflects-broad-based-frustration
9. BBC (2011), Leaders Agree Euro Zone Debt Deal after Late-night talks, UK, Retrieved
from http://www.bbc.co.uk/news/world-europe
10. Naceur, Ben S., and Ghazouani, S., (2007), Stock Markets, Banks and Economic Growth:
Empirical Evidence from the MENA region, Research in International Business and
Finance 21, pp.297-315.
11. Bond Valuation-Study Finance (2011), Bond Pricing Calculation and Bond Yield to
Maturity, Retrieved from http://www.studyfinance.com/templates/bondvalua
12. Bloomberg, Economist, Alpha (2010), Greek Deficit Revised to 13.6%; Moody's Cuts
Rating and Greek Debt Concerns Dominate -Who Will Be Next, Retrieved from
http://www.bloomberg.com, www.seekingalpha.com, http://www.economist
13. Calderon, C. and Liu, L. (2002), Direction of Causality between Financial Development
and Economic Growth. Retrieved from http://www.
comisiondistorsionesdeprecios.cl/eng/studies/working-papers/pdf/
14. Calvo, S., Leiderman, L., and Reinhart, C., (1996), Inflows of Capital to Developing
Countries, Journal of Economic Perspective, USA, Vol.10 (2), pp.123
15. Commodities Exchanges (2011), List of the World Commodities Exchanges, Retrieved
from http://en.wikipedia.org/wiki/Commodities_exchange
16. CDRI (2001), Cambodia Development Review, Phnom Penh, vol. 15, pp.2

22
17. CIA World Fact Book (2011), Public Debt US$ and Debt to %GDP-2010 for the Selected
European Countries, Retrieved from https://www.cia.gov/library/ publications/the-world
18. Hill, Charles W.L. (1998), Asian Financial Crisis in 1997-98, University of Washington,
Fact and Details. http://www.factsanddetails.com/Asian
19. Cobb, Charles and Paul Douglas 1900-1947 (2011), Cobb-Douglas Production Function,
Retrieved from http:www//dept.econ.yorku.ca/~sam/2350q/cd.pdf.
20. CNN Money (2010), Currency Graph Calculation, Currency Market, Retrieved from
http://www.money.cnn.com/currency
21. CNN Money (2011), European Union Debt Crisis, Retrieved from http://www. money.
cnn/european_sovereign_debt_crisis
22. Ackerman, Rick (2006), Market Capitalization as a % of nominal GDP, NYSE from
1925 and NASDAQ from 1985, the Ricks Pick’s Chart store, Retrieved from
http://www.thechartstore.com
23. Crockette, A., (2000), How Should Financial Market Regulations Respond to the New
Challenges of Global Economic Integration, the Federal Reserve Bank of Kansas City,
USA, pp. 6.
24. Christine Lagard (2011), IMF’s expression on EU Debt Crisis, Reuters, USA and Nigeria.
25. BOT, ThaiBMA, SET, SETSMART, MAI, Credit and Bond Outstanding and Equity
(2008), retrieved from http://www.sec.or.th/infocenter/th/seminar/demuse
26. Dorfman, Mark S. (1997), Introduction to Risk Management and Insurance, Prentice
Hall, USA, pp.8.
27. Dornbusch, Park, Claessens, (2000), Contagion: Understanding How It Spreads, the
World Bank Research Observer and Survey the Literature on Contagion, Retrieved from
http://www.worlbank.org/contagion
28. Economic Watch (2011), Cambodia Economic Statistic and Economic Indicators
Database 2011-2016. Retrieved http://www.economicwatch.com/economic-statistics
29. World Economic Watch (2011), Financial Investment, Investing Money, Retrieved from
http://www.economywatch.com/investment.
30. Economy Watch: Investment-Finance Reports (2011), Investment Opportunity. Retrieved,
http:www.economywatch.com/investment/investment-oppportunities
31. World Economy Watch (2011), Investment Securities and Speculation, Retrieved from
http:// www.economywatch.com/investment/investment-securities.html
32. Economy Watch (2010); Types of Financial Markets. Retrieved from
http:// www.economywatch.com
33. E-How Money, the Commodities Market Instruments. Retrieved from http://www.
ehow.com/info_8024407_traded-instrument-commodity-market.html

23
34. European Sovereign Debt Crisis (2011), 2008-2011 Icelandic Financial Crisis, Retrieved
from http:// www/wiki/European_sovereign_debt_crisis.
35. European Commission (2012), the Fiscal Compact Ready to Be Signed. Retrieved from
http://www.european-council.europa.eu
36. European Debt Crisis (2009), European Sovereign Debt Crisis. Retrieved from
http://www.wiki/European_sovereign_debt_crisis
37. Shik, Eom Kyong (2007), Initial Design for the Cambodian Securities Market, Projection
of the Cambodian GDP and Stock Market, Korean Securities Research Institute (KSRI).
38. Zhang, Fengbo (2008), Perspective on the United States Sub-prime Mortgage Crisis,
Special Report. Retrieved https://www.sites.google.com/site/fengbozhang
39. FOREX (2011), the Foreign Exchange Market. Retrieved from https://www.
en.wikipedia.org /wiki /Foreign_exchange_market.
40. Financialmirror (2010), Greek and German Bond Yield Spread More Than 1,000 bps.
Retrieved from http://www.financialmirror.com.
41. Fleming, Andrew (2011), Adbusters Sparks Wall Street protest Vancouver-Based
Activists behind Street Actions, USA. Retrieved from http://www.vancourier.com.
42. FDIC (Federal Deposit Insurance Corporation) (2008), Liquidity Risk Management,
Financial Institution Letter, USA. Retrieved http://www.fdic.gov/news/news/financial/
43. Financial Dictionary (2011), Financial Investment Set, the Free Dictionary
44. Garrestsen, Lensink and Sterken (2004), Growth, financial development, social norms and
legal institutions, Journal of International Financial Market, Institution and Money.
45. Garner, Carley (2010), Trader's First Book on Commodities, New Jersey, FT Press Hull
46. G8 Summit (2003), Confronting Global Economic and Financial Challenges, Lion, France.
47. Graff, M. A. (1999), Financial Development and Economic Growth, a New Empirical
Analysis in Economics.
48. Government Bond (2009), HNX Annual Report 2010, the Hanoi Stock Exchange,
Retrieved from http:www//en.hnx.vn/default.asp.
49. Hanoi Securities Trading (2009), Securities Trading, Center Hanoi STC, Retrieved from
http:www//en.wikipedia.org/wiki/Hanoi.
50. Hanoi Stock Exchange (2009), Listed Companies, HNX Annual Report 2010 and HASTC
Annual Report 2006, Retrieved from http:www//en.hnx.vn/default.asp
51. Horcher, Karen A (2005), Essentials of Financial Risk Management, John Wiley and Sons
USA.
52. Hondroyiannis, G., Lolos, S. and Papapetrou, E. (2005), Financial Market and Economic
Growth in Greece, 1986-1999, Journal of Economics, Vol.15.
53. Hochiminh Stock Exchange (2008); Vietnam Stock Market Overview, Vietnam
54. Hochiminh Stock Exchange (June 2009), Annual Report 2007, Vietnam

24
55. Hull, John C. (2006). Options, Futures and Other Derivatives, 6th edition, Prentice Hall
56. IAIS (2004), Guidance paper on investment risk management by the Investments
Subcommittee
57. IMF (1998), Asian Financial Crisis, www.imf.org/external/np/speeches/1998/012298
58. IMF Country Report (2009); Cambodia GDP Growth, Cambodia
(IMF, World Bank, UN, OECD, CIA Work fact, Transparency International)
59. Investment, Wikipedia, the free encyclopedia, http://en.wikipedia.org/wiki/investment
60. Investment Opportunities (2011); www.investment-help-info.com/Investment-
opportunities.html
61. Investment, Savings and Financial Development (2011), retrieve from
www.med. govt. nz/templates/MultipageDocumentPage____38485.aspx
62. Invest Korea (2012); Korea Financial System; Korea’s Financial Market Structure.
Retrieve from www.investkorea.org/
63. Investopedia, Stock split definition, http://www.investopedia.com/terms/s/stocksplits
64. International Business Time AU, (2011). Retrieve from http://au.ibtimes.com/articles
/110821/20110210/what-is-foreign-exchange-currency-conversion-financial-
markets-forex-foreign-exchange-markets.htm
65. James H. Cobbe, Fall 2001 ECO 2013 Cobbe, Chapter 10, Florida State University
and Faculty Senate (FSU)
66. John C. (2006), Options, Futures and Other Derivatives, 6th edition, Prentice Hall
67. John M. Dalton (1988); Stock Market Works; New York Institute of Finance, USA
http://www.bbc.co.uk/news/world-europe
68. Joseph Tigue and Joseph Lisanti (1997); Dividend Rich Investor; McGraw-Hill, USA
69. S. Kerry Cooper and Donal R. Fraser (1993), the Financial Marketplace, Fourth
Edition, A-W Publishing Company, USA
70. Kathy Kristof (2000); Investing 101; First Edition; Bloomberg Press Princeton, USA
71. Kishkin, F., (2003), “Financial policies & prevention of financial crisis in emerging
market countries,” University of Chicago Press
72. King, R. G. and Levine, R., (1993), Finance and Growth: Schumpeter might be right,
the Quarterly Journal of Economics, MIT Press, vol. 108 (3)
73. Krisada Sektrakul (June 2009); the Thai Securities market in context; Thailand
Securities Institute (STI)
74. Laura, Victor, and Delia, Andreas (2008): Correlation between capital market and
economic growth: the case of Romania
75. Lawrence J. Gitman (2003); Principle of Managerial Finance; Tenth International
Edition; printed by Lawrence J. Gitman, USA
76. Laeven L, Valencia F (2008) Systemic banking crises: a new database, IMF WP/08/224
25
77. Letter, Washington, www.fdic.gov/news/news/financial/2008/index.html
78. Liu, W. and Hsu, C., (2006), the role of financial development in economic growth:
the experiences of Taiwan, Japan and Korea, Journal of Asian Economics.
79. Marc Levinson (2005), Economist; Guide to Financial Markets, 4th edition, London
80. Merton Milller (2005); Financial Markets and Economic Growth; Article first
published by Journal of Applied Corporate Finance
81. Merton Milller, Financial Markets and Economic Growth, University of Chicago,
“Levend Beriker Associates”, USA
82. Miskin, F., (2003), financial policies and prevention of financial crisis in the emerging
market countries
83. McConnel and Bruel (1999) Economics: principles, problems and policies 14th edition
84. Myers, S.C., (1977), Determinants of Corporate Borrowing, Journal of Financial
Economics
85. Michael B. Lehmann (1996); the Wall Street Journal; Fifth Edition; IRWIN; USA
86. Nathan Rowader and Paul Herber (2011), Forward Management,
http://www.forwardfunds.com/pdfs/market_insights/Forward_What_Every_Investor_
Should_Know_About_Commodities.pdf
87. NBR-The National Bureau of Asian Research (2011): China’Outward Investment and Global
Financial Crisis: Challenges and Opportunities. Retrieved from
www.nbr.org/research/activities
88. Nombulelo Duma (2011) Dollarization in Cambodia: Causes and Policy
Implications by International Monetary Fund, (IMF)
89. Nieuwerburgh, S., Buelens, F. and Cuyvers, L., (2006), Stock market development
and economic growth, exploration in economic history in Belgium.
90. Oversea Indian Facilitation Centre (OIFC); YTM Calculation, www.moneychimp.com
91. Oliver Blanchard (2012), Europe pushes the world into crisis, IMF in Washington
92. Organization of the SEC, the U.S. Securities and Exchange Commission,
www.sec.gov/about/whatwedo.shtml
93. Pat Dorsey (2004); Successful Stock Investing: Morningstar’s Guide to Building
Wealth and Winning in the Market; Morningstar; USA
94. Pamela Peterson Drake; U.S Treasury Bill Yield Calculations; USA
95. Peter S Rose (2003), Money and Capital Markets: Financial Institution and
Instruments in a Global Marketplace, 8th edition, by McGraw-Hill Company, USA
96. Prum Somany (2006), Practical Guidelines for Social Science Research in BA, PUC
97. Pidd, Helen (2011-12-02) “Angela Merkel vows to create 'fiscal union' across Eurozone”
Guardian, http://www.guardian.co.uk/business/2011/dec/02/angela-merkel-
Eurozone-fiscal-union

26
98. Rajan, R. and Zingales, L. (1998), Financial Development and Growth, the American
Economic Review
99. Relationship between Financial Markets and Economic Growth (2003): Implications for
Canada. Retrieve from www.wise averties.ca/report/html/6E_markets /6E_ markets_
100. Reuters (2010), Greece's sovereign-debt crunch, http://www.reuters.com
101. Reuters (December 20, 2011), Christine Lagarde, IMF Head, speaks at a roundtable.
Event in Lagos, Nigeria
102. Reuters (January 25, 2012), IMF’s expression in Washington, USA
103. The Role of Financial Markets in Economic Growth (2009), retrieve from faculty.
fuqua .duke.edu/~charvey/Research/.../C6_The_role_of.pdf
104. Robert Merton Solow, theory of economic growth, the neo-classical growth model
105. Rose and Marquise (2006); Money and Capital Markets, McGraw Hill
International, Singapore
106. Rubinstein, Mark (1999), Rubinstein on derivatives, Risk Books, Chicago
107. Securities Commission Malaysia (2009); Introduction to Islamic Capital Market,
Equity Market and Valuation of Securities; Dolphin Press Sdn. Bhd; Malaysia
108. SEC protects investors, the U.S. SEC, www.sec.gov/about/whatwedo.shtml
109. Sergio L. Schmukler (2004), Benefits and Risks of Financial Globalization:
Challenges for Developing Countries, the World Bank
110. Solow–Swan growth model, the economic growth models, the framework of
Neoclassical growth models
111. Stephen A. Ross; Randolph W.Westerfield and Bradford D. Jordan (2000 & 2004),
Fundamentals of Corporate Finance; Fifth Edition; Fourth International Edition;
McGraw-Hill Company, USA
112. Smith, C. W. Jr., (1986), Investment Banking and Capital Acquisition Process, Journal
of Financial Economics 15
113. Stulz, R., (1999), “Globalization, Corporate Finance and Cost of Capital, “Journal of
Applied Corporate Finance
114. Stock Exchange of Thailand, number of listed companies, total market capitalization,
market information, http://www.wikinvest.com/wiki/Stock_Exchange_of_Thailand
115. Timothy E. Johnson (1978); Investment Principles, published by Prentice-Hall, inc.,
New Jersey, USA
116. Thailand Securities Institute (2005); Investment Knowledge for Investors and
Financial Professionals; the Stock Exchange of Thailand
117. Thailand Securities Institute (June 2009), Thai Securities Market in Context
118. Thecityuk, Financial market series (2011), Commodities trading report, retrieve from
http://www.thecityuk.com/assets/Uploads/Commodities-Trading-2011

27
119. Thetyee.ca (2011), “the Tyee – Adbusters' Kalle Lasn Talks About Occupy Wall Street”
http://thetyee.ca/News/2011/10/07/Kalle-Lasn-Occupy-Wall-Street/
120. The U.S. Securities Exchange Act of 1934, Section 4, www.sec.gov/about/laws/sea34.pdf
121. The U.S. Securities Exchange Commission (SEC); Stock Splits;
http://www.sec.gov/answers/stocksplit.htm
122. The World Bank, Cambodia (2011), www.worldbank.org/kh
123. World Bank (2012); Benefits and Risks of Financial Globalization: Challenges for
Developing Countries, retrieved from [email protected].
124. World Bank Report (2011); the Market capitalization of listed companies (% of GDP)
Thailand
125. William J. O’Neil (1995); Make Money in Stocks; Second Edition, R. R. Donnelley &
Sons Company; USA
126. World Bank Indicators (2011), Capital market, market capitalization of listed
companies (% of GDP) in China
127. World Bank Indicators (2011), Capital market, market capitalization of listed
companies by countries
128. William Boyes and Michael Melvin (2005); Macroeconomics; Arizona S. University, USA
129. The Wall Street Journal Online, T-Bills Listing on January 4, 2007, New York, USA
130. Zvi Bodie, Alex Kane, and Alan J Marcus (2008), Essentials of Investments, Seventh
International Edition, Singapore
131. Zhang, Fengbo (2008), Perspective on the United States Sub-prime Mortgage Crisis,
Special Report. Retrieved from https://www.sites.google.com/site/fengbozhang/
*Dr Chhiv Sok Thet is a Professor at Pannasastra University of Cambodia (PUC), and Asia Euro University (AEU). Dr Chhiv holds BBA and Master Degrees in Public Administration and Political Science and PhD in Economics. Currently, Dr Chhiv is an Assistant Dean of the Graduate School of Management and Economics (GSME) of PUC and a Chairman of CMI Cambodia (NGO). Before entering an academic affairs and educational sector, Dr Chhiv was an public official working for the National Assembly of Cambodia and he started teaching the professional and academic courses of the Capital Markets,
Strategic Management and Human Resource Management since 2008 at CMI Cambodia, PUC, AEU and CUS in Phnom Penh. He may be reached at [email protected]