measuring commitment-seknas-fitra-english
TRANSCRIPT

Measuring Commitment i
MEASURINGCOMMITMENT:An Analysis of National Budget andPlanning Policies and the Impact on Land andForest Governance in Indonesia
Writing TeamHadi PrayitnoAhmad TaufikRizki FitriyaniDadan RamdanGunawanR. Alam Surya Putra
EditorR. Alam Surya Putra
PhotoOwnership of R. Alam Surya PutraMining in the Makroman district, Samarinda, East Kalimantan
Printed on recycled content paper
This report was produced with support from the UK Climate Change Unit (UKCCU). The opinions, findings, interpretations and summary expressed in this report are those of the civil society groups involved and do not reflect those of the Asia Foundation and UKCCU.

Measuring Commitmentii
APBN : State Revenue and Expenditure BudgetAPBN-P : Amended State Revenue and Expenditure BudgetAPL : Other Use AreaBansos : Social Assistance ExpenditureDBH : Profit-Sharing FundDAK : Special Allocation FundDAU : General Allocation FundDeficit : Negative difference of revenue after expenditure deductedDR : Reforestation FundsGRNT : Stumpage Value CompensationHKm : Community ForestHTR : Community Forest PlantationHD : Village ForestHP : Production ForestHK : Conservation ForestHL : Protected ForestHPT : Limited Production ForestHPDD : Convertible Production ForestInpres : Presidential InstructionIIUPH : Forest Utilization License FeeLKPP : Central Government Financial ReportLHP BPK : Audit Reports of the Supreme Audit AgencyLAKIP : Government Agency Performance Accountability ReportsMP3EI : Master Plan for the Acceleration of the Expansion of Indonesia’s Economic DevelopmentPBB : Land and Building TaxPPh : Income TaxPPn : Value-Added TaxPDB : Gross Domestic ProductPNBP : Non-Tax RevenuePSDH : Forest Resource ProvisionPIPIB : Indicative Map of New License SuspensionRPJPN : National Long-Term Development PlanRPJMN : National Medium-Term (Five-Year) Development PlanRKP : Government Work PlanRenstra : Strategic PlanRenja KL : Ministry/Agency’s Work PlanRAN-GRK : National Action Plan for Greenhouse GasesRAD-GRK : Regional Action Plan for Greenhouse GasesTKHL : Land and Forest GovernanceUKP4 : Presidential Task Force Monitoring and Control of Development
Glossary
Measuring Commitment iii
Table of Contents
Glossary iiiList of Tables, Graphics, Diagrams, Images, Boxes viPreface viAcknowledgments viiExecutive Summary viii PART I Introduction : Budget Review as an Instrument for Evaluating National Policies on Land andForest Governance in Indonesia ...................................................................................................................... 11.1 Introduction ................................................................................................................................................... 11.2 Research Framework .................................................................................................................................... 31.3 Research Methodology ................................................................................................................................. 5 PART II National Policies on Land and Forestry Sector: Review of the Planning Policies ........................ 72.1 Authority Over Land and Forest Governance in Indonesia ................................................................. 72.2 Condition of Land and Forest Governance and Government Commitment .................................... 92.3 Commitment Predicted not to be Met ...................................................................................................... 12 PART III Politicization and Uneven Distribution of National Budget Policies in the Land andForest Sector ....................................................................................................................................................... 253.1 Contribution of Land and Forest Sector to State Revenue .................................................................... 253.2 Overview of State Spending and Land and Forest Sector Expenditure .............................................. 313.3 Expenditure Transfer to the Regions is Underresponsive to Land and Forest Governance ............ 373.4 State Funding Conditions: Budget Deficit and New Debt Policies ..................................................... 38 PART IV Conclusion and Recommendations ............................................................................................................ 414.1 Conclusion .................................................................................................................................................... 414.2 Recommendations ......................................................................................................................................... 44 Bibliography ..................................................................................................................................................... 46
Measuring Commitmentiv
LIST OF TABLES Table 1.1 Types of Data Collected .................................................................................................................. 5Table 2.1 Division of Authority Between Levels of Governance of Forestry, Mining and Plantation Affairs ............................................................................................................................... 8Table 2.2 Priorities of the National Action Plan for Greenhouse Gases (RAN-GRK) Based on Presidential Regulation 61/2011 ...................................................................................................... 12Table 2.3 Conformity and Consistency Between Achieved Targets and Performance Indicators in Central Government Planning Documents ............................................................................... 14Table 2.4 Area Covered by Moratorium (million Ha) by Island; Comparison With Area of Conservation Zones and Coverage in Indicative Map of New License Suspension (PIPB) .. 16Table 2.5 Comparison of Forest Areas, Production Forest Areas and Hkm, HD & HTR ..................... 17Table 2.6 Main Focus and Activities of Each M3EI Economic Corridor ................................................. 20Table 2.7 Area of Forestland in Indonesia by Function ............................................................................... 21Table 2.8 Changes to Forest Area Allocation 2007 – 2012 ........................................................................... 24Table 2.9 Estimated Funding Requirements of RAN-GRK and RAD-GRK Activities 2010-2020 (In Trillions of Rupiah) ..................................................................................................................... 24Table 2.10 Development of Environmental Function Expenditure (In Millions of Rupiah) .................. 24Table 3.1 Contribution of Land and Forests to Each Type of Revenue ................................................... 26Table 3.2 Forestry Profit-Sharing Funds 2011-2012 ..................................................................................... 37 LIST OF GRAPHICS Graphic 2.1 Emission Sources in Indonesia ................................................................................................... 9Graphic 2.2 Length of Rehabilitation Period by Area of Rehabilitation Land ........................................ 15Graphic 2.3 Target vs Actual of HTR, HKm and HD in the RPJMN ..................................................... 18Graphic 2.4 Comparison of Palm Oil Production in Indonesia and Malaysia ......................................... 21Graphic 2.5 Trend in Principal Approval of Forestland Utilization 2007-2011 ....................................... 23Graphic 3.1 Trends in State Revenue 2008-2012 ........................................................................................... 25Graphic 3.2 Comparison of Indonesia’s Tax Ratio to That of Other Countries .................................... 27Graphic 3.3 Composition of Land and Forest Sector Taxation ................................................................. 28Graphic 3.4 Composition of PNPB 2009-2012 ............................................................................................ 28Graphic 3.5 Growth in PNBP SDA on General Forestry and Mining ...................................................... 29Graphic 3.6 Trends & Growth in Reforestation Funds 2007-2011 ............................................................. 30Graphic 3.7 Composition of PNBP SDA for General Mining ................................................................... 30Graphic 3.8 Growth in State Spending 2007-2012 ........................................................................................ 31Graphic 3.9 Types of Central Government Spending .................................................................................. 32Graphic 3.10 Central Government Spending by Function (in Millions of Rupiah) .................................. 33Graphic 3.11 Domestic Revenue Capability Versus Fulfillment of Spending Needs ................................ 34Graphic 3.12 Ministerial Spending Trends and Averages Relevant to Land and Forest Sector .................. 35Graphic 3.13 Ministry of Environment Expenditure by Function .............................................................. 36Graphic 3.14 Priority Program Details in Forestry Ministry .......................................................................... 36Graphic 3.16 DAK for Forestry, Environment, Agriculture in 2011-2012 .................................................. 38Graphic 3.17 Growth in APBN Deficit ............................................................................................................. 39Graphic 3.18 Average Growth in Debt 2009-2013 ......................................................................................... 40
List of Graphics, Boxes and Tables

Measuring Commitment v
LIST OF DIAGRAMS Diagram 1.1 Research Framework for Budget Policies on Land and Forest Governance ...................... 4Diagram 3.1 State Revenue Scheme by Sources ............................................................................................. 25 LIST OF IMAGES Image 1.1 Scheme for National Budget Analysis ...................................................................................... 6Image 2.1 Map of Poor Land and Forest Governance In Indonesia .................................................... 10 LIST OF BOXES Box 1.1 Prior Studies by Seknas FITRA on National Budgets ........................................................... 3Box 2.1 Permit Moratorium Policy In Indonesia ................................................................................... 15Box 2.2 Proposal for Village Forest in North Kayong District Requires More Than 1,000 Days .. 19Box 2.3 Community Lawsuit in South Sumatra Against the Minister of Forestry ............................ 19Box 3.1 Subsidy Spending In Indonesia .................................................................................................. 32

Measuring Commitmentvi
Salute to Transparency,
Budgeting is a strategic instrument for assessing the quality of commitment to a policy, both at the central and local levels of government. Budget policies also cover all sectors, affairs and functions.
Land and forest based industrial activities have contributed an average of 27 percent of state revenue over the past four years (2009-2012) through a Non-Tax Revenue (PNBP) Scheme. This suggests the existence of land and forest exploitation activities of a high enough intensity to run the risk of potential ecological damage, economic loss and social inequality.
Fair redistribution of state spending policies for those sectors has become the starting point for Seknas FITRA to conduct a study and analysis of the budget, focusing on the land and forest sector. The forestry, mining and plantation sectors have been made the main focus of this study because the three sectors have enormous relevance to the issue of land and forest governance.
In addition, the central government’s policy commitments outlined in the government’s Development Plan document are reviewed in depth, in relation to performance indicators, which are then compared to realiza-tion data as relayed by statistics.
The SETAPAK program, funded by the United Kingdom Climate Change Unit (UKCCU), aims to improve land and forest governance in Indonesia to support the reduction of Indonesia’s greenhouse gas emissions. The SETAPAK program supports the efforts of NGOs in Indonesia that are able to play a role in land and forest governance, including lobbying for government policies to become more effective in achieving sus-tainable development. This study is part of that effort, as a monitoring instrument developed by civil society to assess and evaluate the process of land and forest governance from a budget perspective.
In drafting this report, we want to express our gratitude and highest appreciation to UKCCU for its support of the SETAPAK program in general and this study in particular. We also highly appreciate the hard work of national and local researchers in obtaining and analyzing the data. We hope that this study will be useful in improving land and forest governance in Indonesia.
Jakarta, December 2013
Yenny Sucipto Blair Palmer General Secretary Director of Environmental Governance Program Seknas FITRA The Asia Foundation
Preface
Measuring Commitment vii
This study report is the result of cooperation between Seknas FITRA and The Asia Foundation. The Seknas FITRA Team was coordinated by Hadi Prayitno, and consisted of Ahmad Taufik, Dadan Ramdan, Gunawan and Rizka. The Asia Foundation Team was coordinated by Blair Palmer, and consisted of Ade Cahyat and R. Alam Surya Putra.
The analysis and report-writing process was undertaken jointly by Hadi Prayitno, Dadan Ramdan and Ah-mad Taufik (Seknas FITRA), and R. Alam Surya Putra (The Asia Foundation). The report was edited by R. Alam Surya Putra.
Special thanks to Blair Palmer, Erman Rahman, Frans Siahaan, Prayekti Murharjanti, Ridwan, Ade Cahyat, Chitra Hariyadi and Rico Wahyudi who offered reviews, input and critiques of this report. Dorta Pardede and Kiki Tobing contributed much to the process of printing and publishing this report.
This activity was conducted with the support of the United Kingdom Climate Change Unit (UKCCU). However, the opinions, findings, interpretations and conclusions in this report are the views of civil groups and not the views of The Asia Foundation or UKCCU.
Acknowledgments
Measuring Commitmentviii
Indonesia is facing serious problems related to unsustainable land and forest governance, resulting in large scale deforestation and forest degradation. Budgets and budget policies are important elements of land and forest governance, critical to ensuring the implementation of development plans and addressing defor-estation and degradation problems. Good budget policy requires performance targets supported by budget availability and strict controls to measure implementation, specifically related to (i) rehabilitation and pre-venting deforestation; (ii) controlling land exploitation; (iii) optimizing plantation productivity; (iv) prevent-ing the clearing of more land for plantations.
The Indonesian Forum for Budget Transparency (Seknas FITRA) conducted a study analyzing national budget and planning policies on land and forest governance in Indonesia. The study aimed to assess central government performance on budgeting, including commitment to budget policies and the resulting expend-iture related to forest and land governance. Specifically, the study looked at two issues: the priority policies or plans by the central government related to land and forest governance as well as progress of achievements; and the orientation of national budget policy toward reducing deforestation and degradation.
The study revealed that performance indicators set by the central government in planning documents, aside from not being proportionate to the problems at hand, are not mutually integrated or linked to other plan-ning policies. Budget policies and schemes for revenue, expenditure and finance threaten to increase the rate of deforestation and degradation. High rates of state revenue loss occur in the natural revenue sector, due in part to low state revenue projections and weak public financial management. State expenditure has a huge impact on the quality of performance and achievement in accelerating the rehabilitation of land and forests.
Programs and activities to reduce deforestation and degradation require adequate state funds. Yet spending on the environment is only 1% of total state expenditure; much lower than spending on defense, public order and security. Of this small total, spending on subsidies and civil servants absorbs the biggest alloca-tion of state expenditure. Specific Purpose Grants (DAK) for forestry, agriculture and the environment are residual and unsustainable to fund the expenditure needs of environmental recovery and reducing defor-estation and degradation. Furthermore, the absence of benchmarks to define the cost of environmental recovery per hectare or the unit cost of preventing deforestation and degradation makes further analysis difficult. Budget deficit policy that intentionally leads to new debt poses a threat of increased deforestation and degradation. The level of budget deficit reached 8 percent and increased over recent years. The strategy of increasing exploration of non-oil and gas sources of non-tax state revenue (PNBP) to handle debt and budget deficit clearly poses an increased threat of deforestation and degradation.
Recommendations from this study relevant for central government include: to improve accountability of government performance to ensure that development goals (for reduced emissions and rate of deforestation and degradation) are consistent with the planning of ministries and other state institutions; strengthen the moratorium policy to respond to exisiting social-political conditions; and boost the role of local govern-ments in overcoming conditions of deforestation and degradation that are not yet improving.
Recommendations for civil society include: to conduct studies related to budget policy for better land and forest governance both at the national and local levels as a way to increase public debate on the issue; bolster their advocacy by working together with civil society groups that work on land and forest governance; and to get involved in budget planning and monitoring to ensure that the rights and aspirations of communities can be adequately considered by the government in formulating the budget, including aspirations to protect natural resources and reduce rates of deforestation.
Executive Summary

Measuring Commitment 1
1.1 INTRODUCTION
Various studies about land and forest govern-ance related budget policies in Indonesia con-firm that the system needs to be evaluated. Im-provements to financial management in the land and forest sector are important in order to prevent: first, a loss of state revenue due to technical errors and corruptive political practices; second, the increas-ing rate of deforestation and degradation, because existing incentives cannot reduce the problem; and third, worsening governance due to poor monitor-ing and law enforcement over grievous financial management violations, especially with respect to the land and forest sector. These studies suggest the importance of further research to generate policy schemes that give more attention to equilibrium in Indonesia’s economic development.
Research into budgets for land and forest gov-ernance is still often associated with issues of corruption arising from economic rent and climate change funding schemes. Corruption in land and forest governance has lately become a prominent issue in Indonesia. The arrest of a district head over allegations of corruption in land transfer suggests that there may be more cases of corruption related to land and forest governance yet to be un-covered. Forestry Ministry data from August 2011 reveals that state losses dues to forestland conces-
INTRODUCTION: BUDGET REVIEW AS AN INSTRUMENT FOR THE EVALUATION OF NATIONAL POLICIES ON LAND AND
FOREST GOVERNANCE IN INDONESIA
PART I
sion permits in seven provinces may have reached almost Rp 273 trillion. The estimated state losses were incurred due to the opening of 727 plantation units and 1,722 mining units that have since been judged to be problematic. Meanwhile, Indonesia Corruption Watch (ICW) research indicates that po-tential state losses reached Rp 169.797 trillion in the forestland non-tax sector from 2004 to 2007. This value was obtained by calculating the difference be-tween the potential state revenue from Reforestation Funds (DR) and Forest Resource Provision (PSDH) and the reduced amount of state revenue received. Meanwhile, budget studies related to climate change funding schemes are emerging together with the In-donesian government’s commitment to reduce car-bon emissions and the implementation of REDD+ in Indonesia.
This study was conducted as an effort to ex-pand the list of studies connecting land and forest governance with budget policies. How-ever, the main focus of this study is not corruption, nor for that matter climate change funding. This study is oriented toward examining the extent to which existing budget policies make allocations for land and forest governance as defined in the existing planning policies. Therefore, reviews of spending on land and forest governance and of revenue from the land and forest sector are frequently referred to in this study.
1 World Bank (2009), Investing in a More Sustainable Indonesia, Jakarta; Barr, C., Darmawan, A., Purnomo, H., Komarudin, H., 2009, Financial Governance and Reforestation Funding in the Suharto and post-Suharto period 1989 – 2009: CIFOR, Bogor., S. Mumbunan and R. Wahyudi, 2012, Income Transparency of Industrial Extractives in the Forestry Sector in Indo-nesia, Article 33, Jakarta
2 Ibid. 3 ICW (2012), Halfheartedly Eradicating Forestry Crime, page 12. 4 ICW (2012), ibid.
Measuring Commitment2
The perspective developed in this study is to look at the extent to which planning and budg-eting policies at the national level make a use-ful contribution to land and forest governance. With the aim of analyzing planning and budgeting policies on land and forest governance in Indonesia at the national level, the study looks at two things in particular: first, it examines the priority policies or plans of the central government related to land and forest governance as well as the progress made; sec-ond, it looks at the orientation of national budget policy toward reducing deforestation and land and forest degradation. In addition to examining state revenue, both potential and realized, from land and forest governance, this study also looks at the ori-entation of state spending policies in accelerating better land and forest governance. In this case, in terms of planning and spending allocation policies, achievement of performance targets supported by budget availability and strict controls able to ensure smooth implementation and significant contribu-tions to efforts to: (i) rehabilitate forest and prevent deforestation; (ii) control land exploitation; (iii) op-timize crop productivity; and (v) prevent more land from being cleared for plantations.
The study is part of a monitoring instrument devel-oped by civil society groups to assess and evaluate the process of land and forest governance in Indo-nesia under the framework of budget policies. The study is developed by a civil society network that
is experienced in reviewing budget management policies in various sectors of government. Seknas FITRA coordinated this study with the support of ten networks of regional civil groups. In the past three years, Seknas FITRA has intensively stud-ied the APBN, although the sectors or fields more extensively examined previously were education, health and infrastructure.
This study hopes to become the basis of public de-bate to further improve government policies. Aside from hopefully being a useful reference in support of previous studies, this study aims to provide input to the Indonesian government and other stakehold-ers. For the central government, this study can be part of the government’s evaluation and monitoring of performance achievements, policy commitments and implementation of land and forest governance. In addition, this study can provide input on the de-velopment of better fiscal policies, particularly in re-lation to land and forest governance. For the House of Representatives (DPR), this study of course can be used as material for the discussion on fiscal pol-icy, especially in the land and forest sectors. Mean-while, for think tank agencies and academics, this study can be a reference to complement previous studies in addition to inciting further study. Finally, for civil society this study intends to complement data and information to advocate for improved land and forest governance in Indonesia.
Measuring Commitment 3
1.2 RESEARCH FRAMEWORK
Budgets−both state (APBN) and regional (APBD)−are important instruments for the government to implement its programs. The adequacy of a government’s budget in funding its programs is greatly influenced by how the budget is managed. A government’s budget is a reflection of a political decision between the executive and the legislative branches regarding what the government is to carry out each year. This political decision has a broad impact not only on quality of life for citizens,
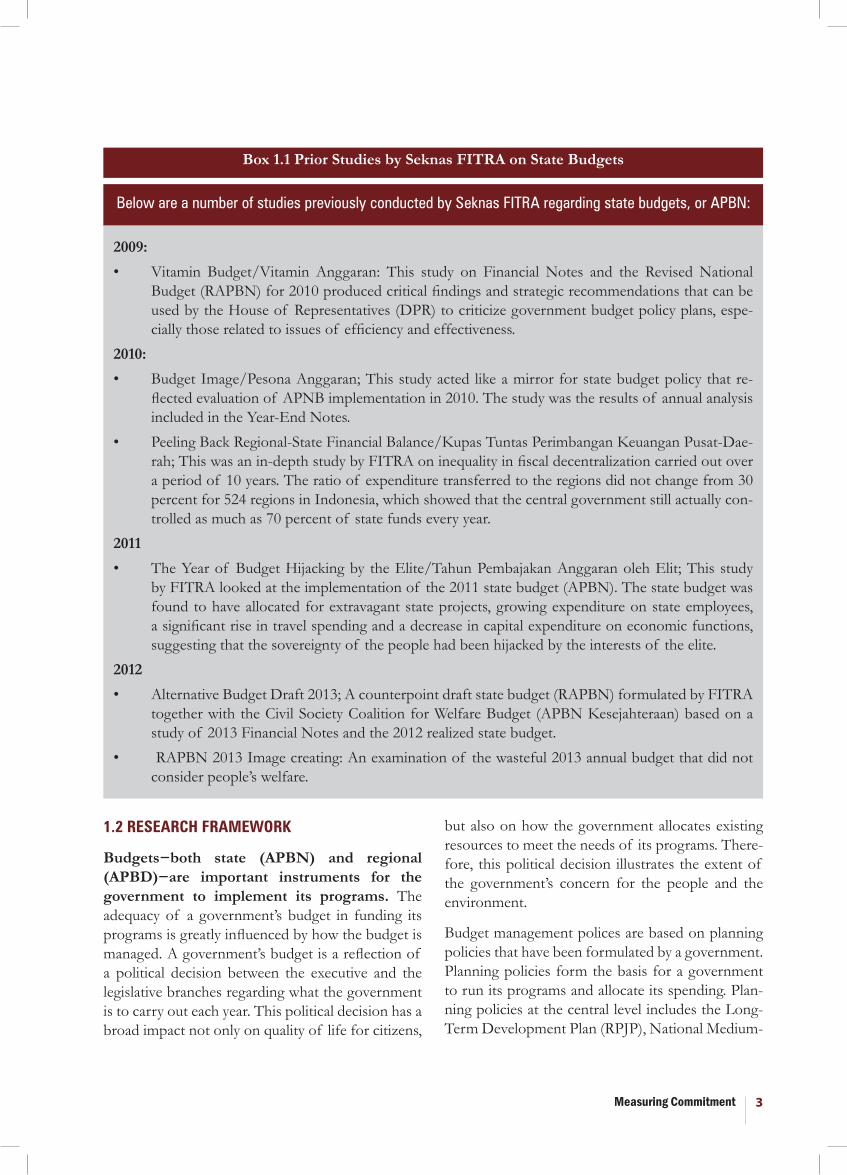
Box 1.1 Prior Studies by Seknas FITRA on State Budgets
Below are a number of studies previously conducted by Seknas FITRA regarding state budgets, or APBN:
2009: • Vitamin Budget/Vitamin Anggaran: This study on Financial Notes and the Revised National
Budget (RAPBN) for 2010 produced critical findings and strategic recommendations that can be used by the House of Representatives (DPR) to criticize government budget policy plans, espe-cially those related to issues of efficiency and effectiveness.
2010: • Budget Image/Pesona Anggaran; This study acted like a mirror for state budget policy that re-
flected evaluation of APNB implementation in 2010. The study was the results of annual analysis included in the Year-End Notes.
• Peeling Back Regional-State Financial Balance/Kupas Tuntas Perimbangan Keuangan Pusat-Dae-rah; This was an in-depth study by FITRA on inequality in fiscal decentralization carried out over a period of 10 years. The ratio of expenditure transferred to the regions did not change from 30 percent for 524 regions in Indonesia, which showed that the central government still actually con-trolled as much as 70 percent of state funds every year.
2011• The Year of Budget Hijacking by the Elite/Tahun Pembajakan Anggaran oleh Elit; This study
by FITRA looked at the implementation of the 2011 state budget (APBN). The state budget was found to have allocated for extravagant state projects, growing expenditure on state employees, a significant rise in travel spending and a decrease in capital expenditure on economic functions, suggesting that the sovereignty of the people had been hijacked by the interests of the elite.
2012• Alternative Budget Draft 2013; A counterpoint draft state budget (RAPBN) formulated by FITRA
together with the Civil Society Coalition for Welfare Budget (APBN Kesejahteraan) based on a study of 2013 Financial Notes and the 2012 realized state budget.
• RAPBN 2013 Image creating: An examination of the wasteful 2013 annual budget that did not consider people’s welfare.
but also on how the government allocates existing resources to meet the needs of its programs. There-fore, this political decision illustrates the extent of the government’s concern for the people and the environment.
Budget management polices are based on planning policies that have been formulated by a government. Planning policies form the basis for a government to run its programs and allocate its spending. Plan-ning policies at the central level includes the Long-Term Development Plan (RPJP), National Medium-
Measuring Commitment4
Term Development Plan (RPJMN), Strategic Plans (Renstra K/L) and Work Plans of ministries and agencies (Renja K/L). In addition to this, planning policies are also issued sectorally, aimed at achiev-ing certain development goals. In terms of reduc-ing carbon emissions, the government has issued a policy through the preparation of a national action plan to reduce greenhouse gases, known as RAN-GRK. Planning policies also exist at the local level in the form of certain documents, the scope of which determine the authority of each.
Budget policies are closely related to land and forest governance. In addition to land and forest governance being an instrument of state revenue, it is also an instrument of state spending and financ-ing. As a revenue instrument, land and forest gov-ernance is examined via incentive policies through taxes and royalties by the government for activities related to the land and forest sector. However, such policies can either increase or decrease deforestation and degradation. Political decisions to determine the sources of state revenue reflect the extent of a gov-ernment’s commitment to mitigating deforestation
and land and forest degradation.
In terms of state spending, it is the extent to which money owned by the government is spent on programs and activities that supports the objectives of development. In particular, to ensure that adequate budget funds are available for programs and activities that support the mitigation of deforestation and degradation. Additionally, to ensure that the allocated money is spent in an op-timal manner to achieve the objective of mitigating deforestation and degradation.
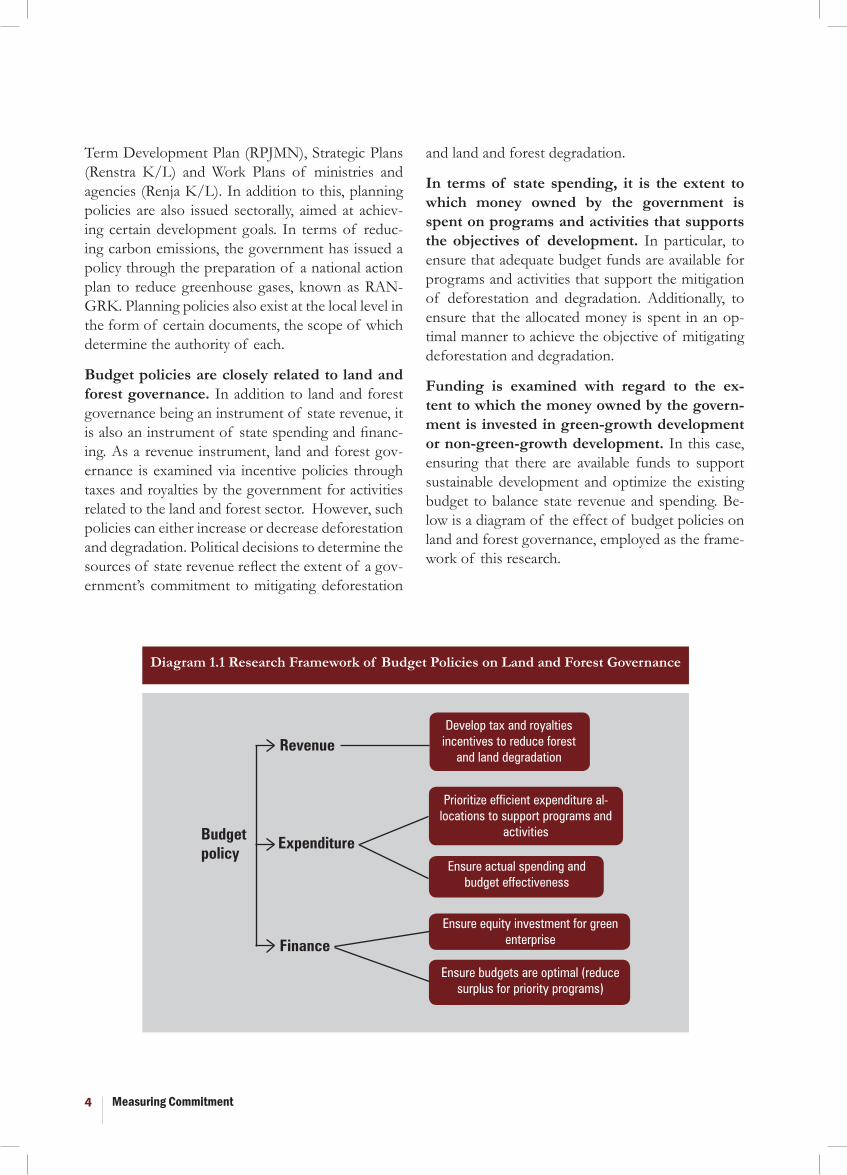
Funding is examined with regard to the ex-tent to which the money owned by the govern-ment is invested in green-growth development or non-green-growth development. In this case, ensuring that there are available funds to support sustainable development and optimize the existing budget to balance state revenue and spending. Be-low is a diagram of the effect of budget policies on land and forest governance, employed as the frame-work of this research.
Diagram 1.1 Research Framework of Budget Policies on Land and Forest Governance
Develop tax and royalties incentives to reduce forest
and land degradationRevenue
ExpenditureBudget policy
Finance
Prioritize efficient expenditure al-locations to support programs and
activities
Ensure actual spending and budget effectiveness
Ensure equity investment for green enterprise
Ensure budgets are optimal (reduce surplus for priority programs)
Measuring Commitment 5
b. Data Collection Technique
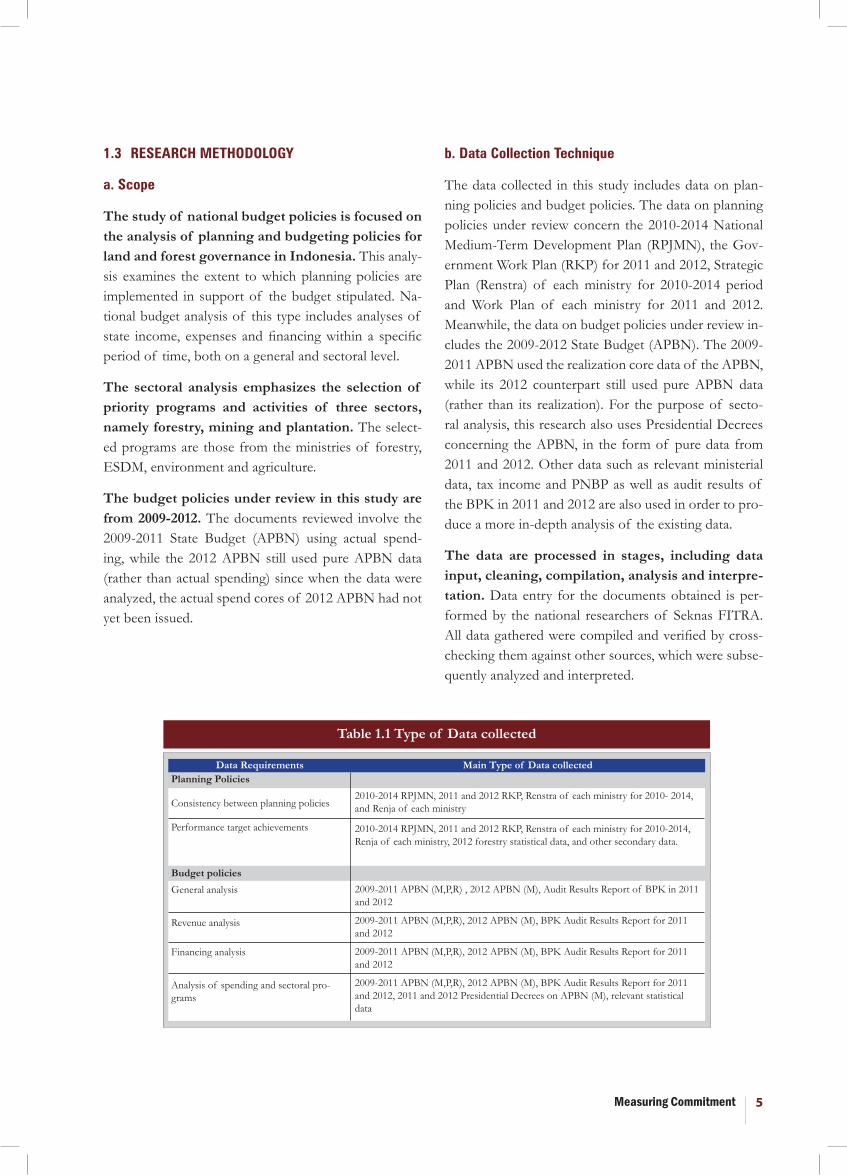
The data collected in this study includes data on plan-ning policies and budget policies. The data on planning policies under review concern the 2010-2014 National Medium-Term Development Plan (RPJMN), the Gov-ernment Work Plan (RKP) for 2011 and 2012, Strategic Plan (Renstra) of each ministry for 2010-2014 period and Work Plan of each ministry for 2011 and 2012. Meanwhile, the data on budget policies under review in-cludes the 2009-2012 State Budget (APBN). The 2009-2011 APBN used the realization core data of the APBN, while its 2012 counterpart still used pure APBN data (rather than its realization). For the purpose of secto-ral analysis, this research also uses Presidential Decrees concerning the APBN, in the form of pure data from 2011 and 2012. Other data such as relevant ministerial data, tax income and PNBP as well as audit results of the BPK in 2011 and 2012 are also used in order to pro-duce a more in-depth analysis of the existing data.
The data are processed in stages, including data input, cleaning, compilation, analysis and interpre-tation. Data entry for the documents obtained is per-formed by the national researchers of Seknas FITRA. All data gathered were compiled and verified by cross-checking them against other sources, which were subse-quently analyzed and interpreted.
1.3 RESEARCH METHODOLOGY
a. Scope
The study of national budget policies is focused on the analysis of planning and budgeting policies for land and forest governance in Indonesia. This analy-sis examines the extent to which planning policies are implemented in support of the budget stipulated. Na-tional budget analysis of this type includes analyses of state income, expenses and financing within a specific period of time, both on a general and sectoral level.
The sectoral analysis emphasizes the selection of priority programs and activities of three sectors, namely forestry, mining and plantation. The select-ed programs are those from the ministries of forestry, ESDM, environment and agriculture.
The budget policies under review in this study are from 2009-2012. The documents reviewed involve the 2009-2011 State Budget (APBN) using actual spend-ing, while the 2012 APBN still used pure APBN data (rather than actual spending) since when the data were analyzed, the actual spend cores of 2012 APBN had not yet been issued.
Table 1.1 Type of Data collected
Data RequirementsPlanning Policies
Consistency between planning policies
Performance target achievements
Budget policiesGeneral analysis
Revenue analysis
Financing analysis
Analysis of spending and sectoral pro-grams
2010-2014 RPJMN, 2011 and 2012 RKP, Renstra of each ministry for 2010- 2014, and Renja of each ministry
2010-2014 RPJMN, 2011 and 2012 RKP, Renstra of each ministry for 2010-2014, Renja of each ministry, 2012 forestry statistical data, and other secondary data.
2009-2011 APBN (M,P,R) , 2012 APBN (M), Audit Results Report of BPK in 2011 and 2012
2009-2011 APBN (M,P,R), 2012 APBN (M), BPK Audit Results Report for 2011 and 2012
2009-2011 APBN (M,P,R), 2012 APBN (M), BPK Audit Results Report for 2011 and 2012
2009-2011 APBN (M,P,R), 2012 APBN (M), BPK Audit Results Report for 2011 and 2012, 2011 and 2012 Presidential Decrees on APBN (M), relevant statistical data
Main Type of Data collected
Measuring Commitment6
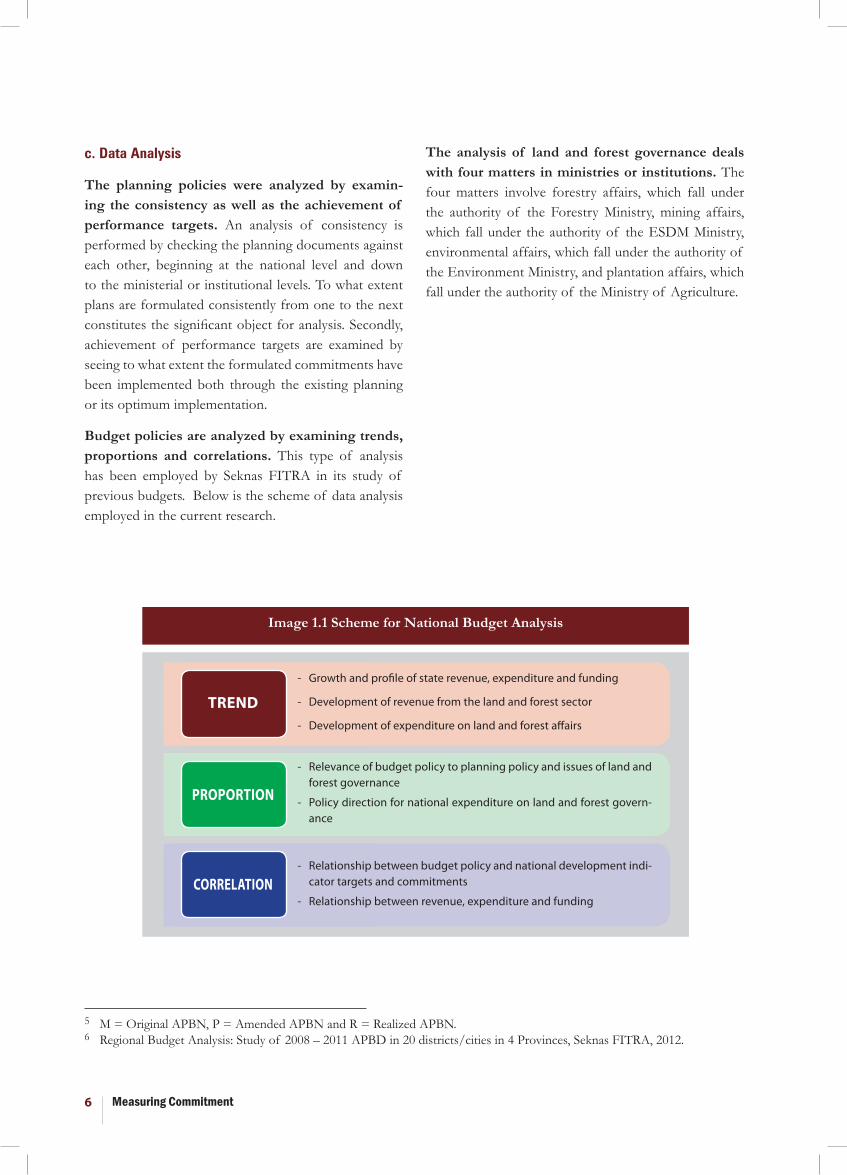
c. Data Analysis
The planning policies were analyzed by examin-ing the consistency as well as the achievement of performance targets. An analysis of consistency is performed by checking the planning documents against each other, beginning at the national level and down to the ministerial or institutional levels. To what extent plans are formulated consistently from one to the next constitutes the significant object for analysis. Secondly, achievement of performance targets are examined by seeing to what extent the formulated commitments have been implemented both through the existing planning or its optimum implementation.
Budget policies are analyzed by examining trends, proportions and correlations. This type of analysis has been employed by Seknas FITRA in its study of previous budgets. Below is the scheme of data analysis employed in the current research.
The analysis of land and forest governance deals with four matters in ministries or institutions. The four matters involve forestry affairs, which fall under the authority of the Forestry Ministry, mining affairs, which fall under the authority of the ESDM Ministry, environmental affairs, which fall under the authority of the Environment Ministry, and plantation affairs, which fall under the authority of the Ministry of Agriculture.
Image 1.1 Scheme for National Budget Analysis
TREND
CORRELATION
PROPORTION
- Growth and profile of state revenue, expenditure and funding
- Development of revenue from the land and forest sector
- Development of expenditure on land and forest affairs
- Relevance of budget policy to planning policy and issues of land and forest governance
- Policy direction for national expenditure on land and forest govern-ance
- Relationship between budget policy and national development indi-cator targets and commitments
- Relationship between revenue, expenditure and funding
5 M = Original APBN, P = Amended APBN and R = Realized APBN.6 Regional Budget Analysis: Study of 2008 – 2011 APBD in 20 districts/cities in 4 Provinces, Seknas FITRA, 2012.
Measuring Commitment 7
8 ICEL, Huma, Telapak, WRI (2013), An Overview of the Implementation of Forest Governance: Indepth study in Central Kalimantan and in West Nusa Tenggara.
9 National Council on Climate Change (DNPI) Indonesia, 2010.
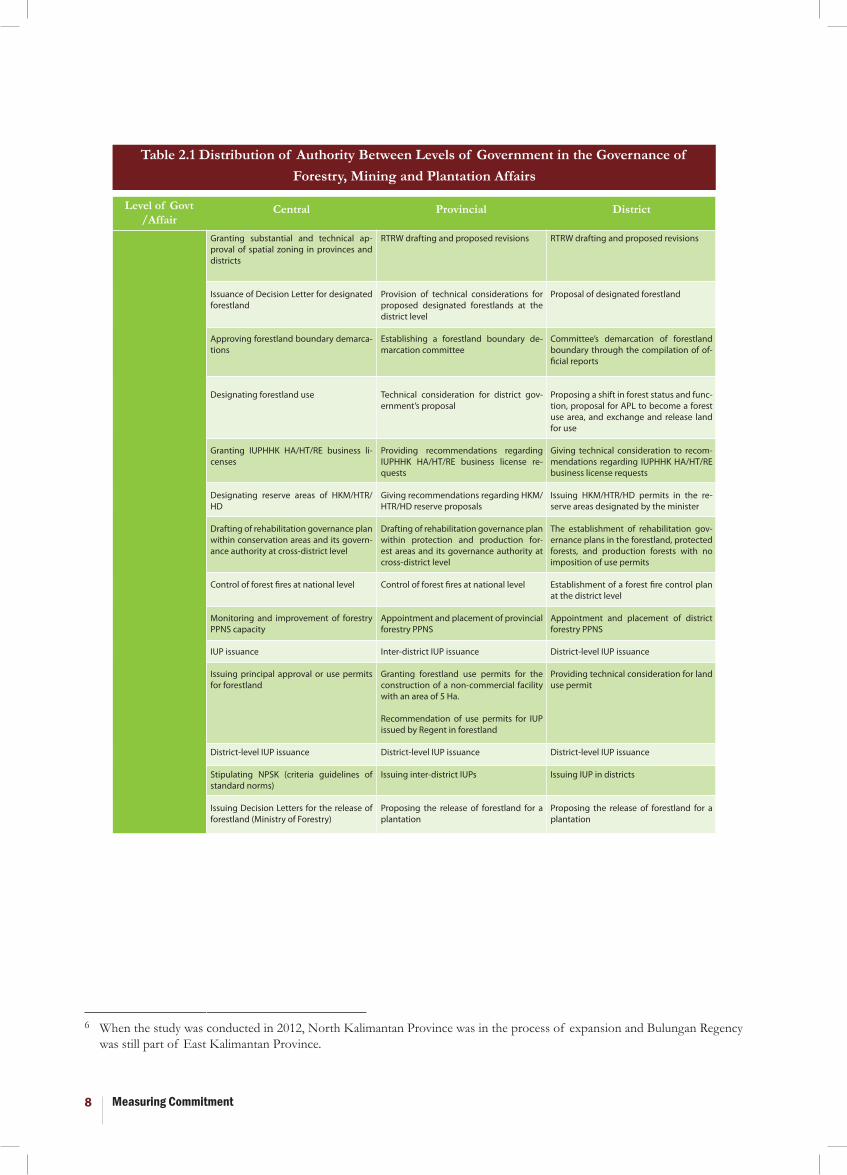
2.1 AUTHORITY OVER LAND AND FOREST GOV-ERNANCE IN INDONESIA
Decentralization has led to natural resource management practices that vary according to each sector and its managing department. For-estry affairs, which fall under the authority of the Forestry Ministry, are controlled by centralized poli-cies that have been practiced in the governance of forests. Meanwhile, for mining affairs, which come under the jurisdiction of the Energy and Mineral Resources (ESDM) Ministry, regional governments have been provided with some authority to manage their mining areas, for example, through the issu-ing of mining permits. Plantation affairs, which are under the authority of the Ministry of Agriculture, have the same practices as those used in mining af-fairs. The governance practices of each sector is based on different policy backgrounds.
The division of authority between central, pro-vincial and local governments shows a strong centralized tendency for forestry affairs. The central government, in this case the Ministry of Forestry, controls the determination of regions, the granting of approval for business activities, the allo-cation of governance rights for communities within forestland and the approval of changes in forestland functions. In many respects, the burden of manag-ing this great authority has led to a lengthy queue for approval by the Ministry of Forestry. Many RTRW revisions, both at the district/city level and at the provincial level, are pending approval and are still on
NATIONAL POLICIES ON LAND AND FOREST GOVERNANCE: REVIEW OF PLANNING POLICIES
PART II
the desk of the minister. The same also applies for community applications for land and forest govern-ance within forestland. Meanwhile, the provincial government prefers the role of just giving technical consideration to business activity proposals or gov-ernance allocation by the society brought forward by the regional governments, also accompanied by initiating cross-district governance proposals. This means that the authority of the provincial govern-ments and that of districts/cities as autonomous regions is limited to supportive roles, particularly in the area of evaluation and monitoring, and agents of policies formulated in a top-down manner by the central government in order to accelerate the national agenda. The following table depicts several realms of authority distributed based on the respec-tive levels of government.
The practice of managing authorities by affairs as depicted in the table above has resulted in several problems. Issues related to implementation, regulations and policies both in spatial planning and licensing overlap, budgeting and performance tar-get setting as well as sub-optimum monitoring and law enforcement are some of commonly occurring problems and are discussed in various studies by a number of parties. On the other hand, the govern-ance of and authority over these affairs should be consistent with the Indonesian government’s com-mitments in dealing with problems caused by land and forest destruction, increased carbon emissions and matters of the welfare of communities living near forests.
Measuring Commitment8
6 When the study was conducted in 2012, North Kalimantan Province was in the process of expansion and Bulungan Regency was still part of East Kalimantan Province.
Table 2.1 Distribution of Authority Between Levels of Government in the Governance ofForestry, Mining and Plantation Affairs
Level of Govt/Affair
Central
Granting substantial and technical ap-proval of spatial zoning in provinces and districts
Issuance of Decision Letter for designated forestland
Approving forestland boundary demarca-tions
Designating forestland use
Granting IUPHHK HA/HT/RE business li-censes
Designating reserve areas of HKM/HTR/HD
Drafting of rehabilitation governance plan within conservation areas and its govern-ance authority at cross-district level
Control of forest fires at national level
Monitoring and improvement of forestry PPNS capacity
IUP issuance
Issuing principal approval or use permits for forestland
District-level IUP issuance
Stipulating NPSK (criteria guidelines of standard norms)
Issuing Decision Letters for the release of forestland (Ministry of Forestry)
RTRW drafting and proposed revisions
Provision of technical considerations for proposed designated forestlands at the district level
Establishing a forestland boundary de-marcation committee
Technical consideration for district gov-ernment’s proposal
Providing recommendations regarding IUPHHK HA/HT/RE business license re-quests
Giving recommendations regarding HKM/HTR/HD reserve proposals
Drafting of rehabilitation governance plan within protection and production for-est areas and its governance authority at cross-district level
Control of forest fires at national level
Appointment and placement of provincial forestry PPNS
Inter-district IUP issuance
Granting forestland use permits for the construction of a non-commercial facility with an area of 5 Ha.
Recommendation of use permits for IUP issued by Regent in forestland
District-level IUP issuance
Issuing inter-district IUPs
Proposing the release of forestland for a plantation
RTRW drafting and proposed revisions
Proposal of designated forestland
Committee’s demarcation of forestland boundary through the compilation of of-ficial reports
Proposing a shift in forest status and func-tion, proposal for APL to become a forest use area, and exchange and release land for use
Giving technical consideration to recom-mendations regarding IUPHHK HA/HT/RE business license requests
Issuing HKM/HTR/HD permits in the re-serve areas designated by the minister
The establishment of rehabilitation gov-ernance plans in the forestland, protected forests, and production forests with no imposition of use permits
Establishment of a forest fire control plan at the district level
Appointment and placement of district forestry PPNS
District-level IUP issuance
Providing technical consideration for land use permit
District-level IUP issuance
Issuing IUP in districts
Proposing the release of forestland for a plantation
Provincial District
Measuring Commitment 9
2.2 THE CONDITIONS OF LAND AND FOREST GOVERNANCE, AND GOVERNMENT COM-MITMENT
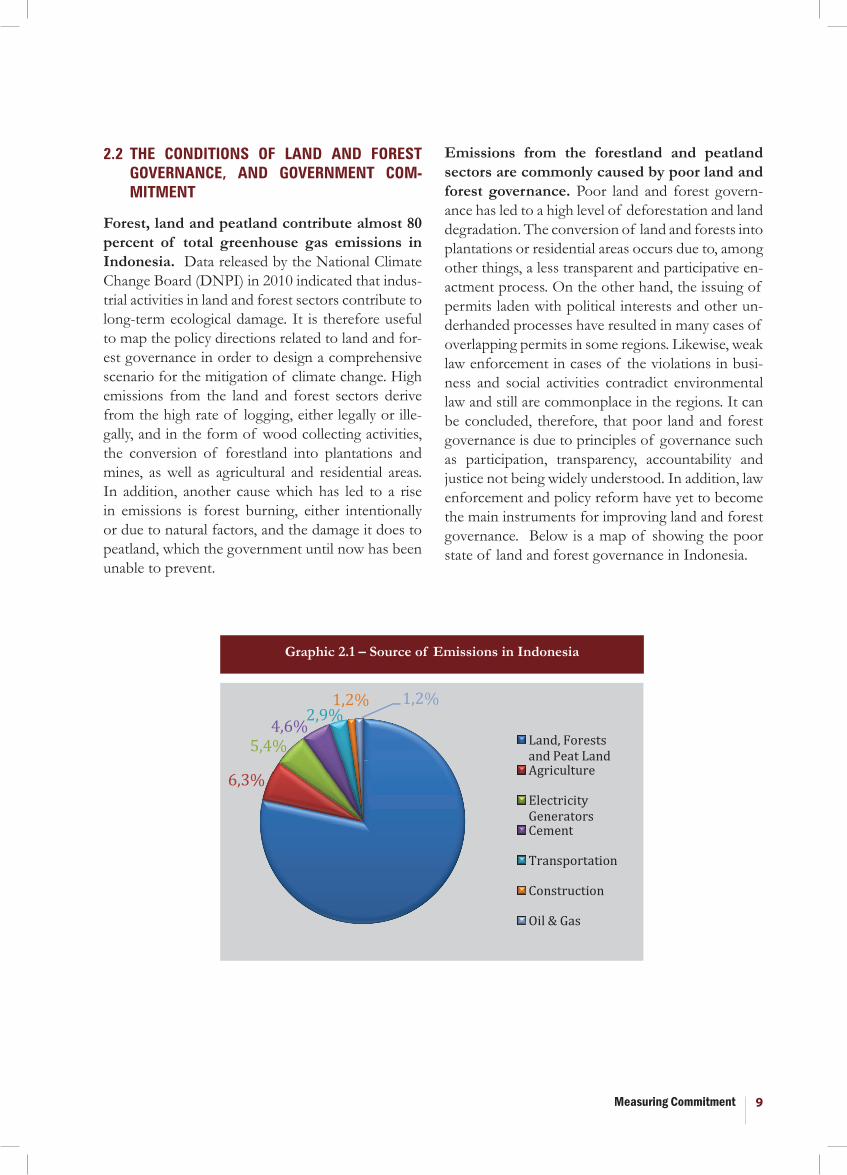
Forest, land and peatland contribute almost 80 percent of total greenhouse gas emissions in Indonesia. Data released by the National Climate Change Board (DNPI) in 2010 indicated that indus-trial activities in land and forest sectors contribute to long-term ecological damage. It is therefore useful to map the policy directions related to land and for-est governance in order to design a comprehensive scenario for the mitigation of climate change. High emissions from the land and forest sectors derive from the high rate of logging, either legally or ille-gally, and in the form of wood collecting activities, the conversion of forestland into plantations and mines, as well as agricultural and residential areas. In addition, another cause which has led to a rise in emissions is forest burning, either intentionally or due to natural factors, and the damage it does to peatland, which the government until now has been unable to prevent.
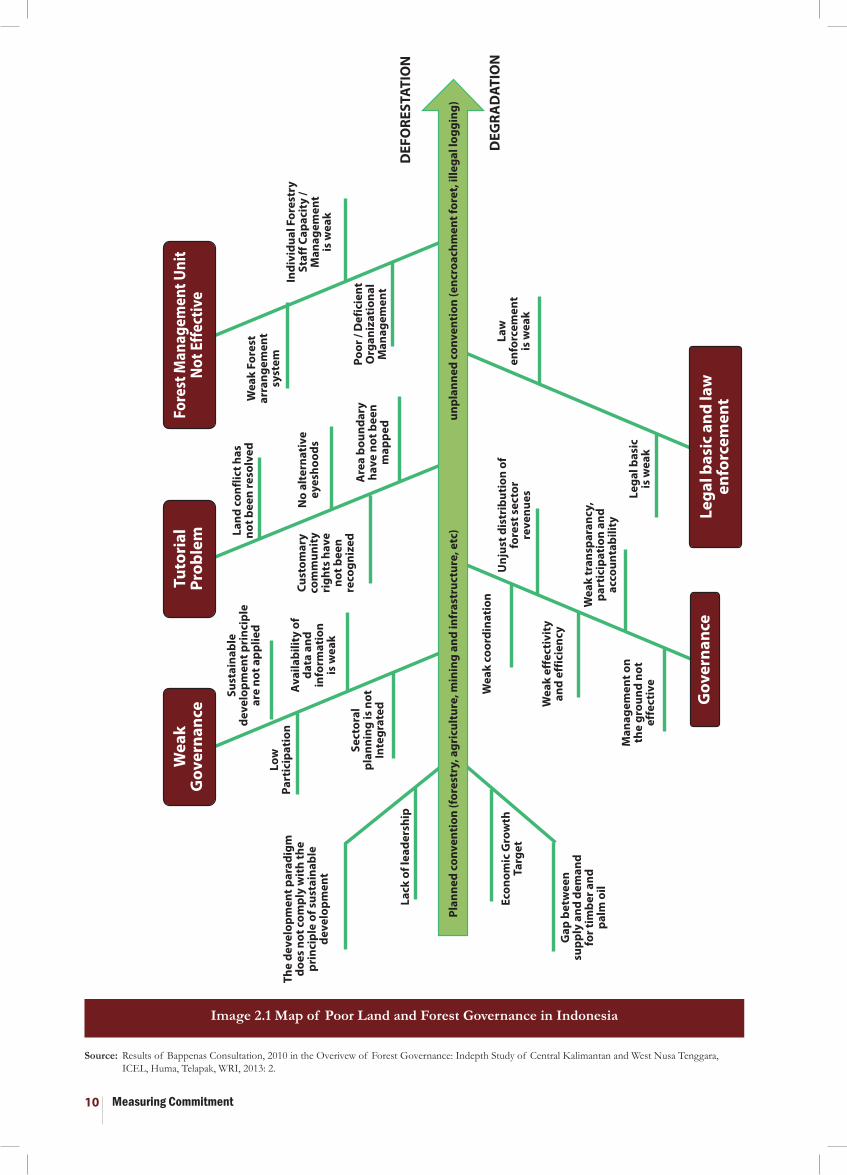
Emissions from the forestland and peatland sectors are commonly caused by poor land and forest governance. Poor land and forest govern-ance has led to a high level of deforestation and land degradation. The conversion of land and forests into plantations or residential areas occurs due to, among other things, a less transparent and participative en-actment process. On the other hand, the issuing of permits laden with political interests and other un-derhanded processes have resulted in many cases of overlapping permits in some regions. Likewise, weak law enforcement in cases of the violations in busi-ness and social activities contradict environmental law and still are commonplace in the regions. It can be concluded, therefore, that poor land and forest governance is due to principles of governance such as participation, transparency, accountability and justice not being widely understood. In addition, law enforcement and policy reform have yet to become the main instruments for improving land and forest governance. Below is a map of showing the poor state of land and forest governance in Indonesia.
Graphic 2.1 – Source of Emissions in Indonesia
Measuring Commitment10
Source: Results of Bappenas Consultation, 2010 in the Overivew of Forest Governance: Indepth Study of Central Kalimantan and West Nusa Tenggara, ICEL, Huma, Telapak, WRI, 2013: 2.
Image 2.1 Map of Poor Land and Forest Governance in Indonesia
Measuring Commitment 11
The Indonesian government’s commitment to decrease emissions by 26 percent with domestic funding or 41 percent with international fund-ing by 2020 needs to be appreciated. This com-mitment serves as a basis for the government and other stakeholders to get involved in promoting its fulfillment. For the government, and some of the relevant ministries, programs and jurisdictions need to be adapted in accordance with the orientation of the existing commitment. This commitment has demonstrated Indonesia’s important role in mitigat-ing carbon emissions on a global level.
Efforts to mitigate carbon emissions are part of an important program for the Indonesian gov-ernment. Although the carbon emissions mitiga-tion target has not been specifically included in the Long-Term Development Plan (RPJP) or National Medium-Term Development Plan (RPJMN), the government has generated numerous instruments such as policies, institutions and action documents. The issuance of sectoral policies also constitutes a form of commitment by the government to more serious monitoring of carbon emissions. The es-tablishment of the National Climate Change Board (DNPI), the REDD+ Task Force (Satgas REDD+), the National Forestry Board (DKN) and the Presi-dential Task Force for the Monitoring and Control
11 Such as Law No. 24/2009 concerning Mineral and Coal Mining, Law No. 32/2009 concerning Environment Protection and Governance and Presidential Instruction No. 10/2011 concerning Delayed Issuance of New Permits and Revision of Primary Natural Forest and Peatland Governance whose implementation period was then extended through Presidential Instruction No. 6/2013. Meanwhile, other sectoral policies have also been issued in previous years such as Law No. 41/1999 concerning Forestry, Law No. 18/2004 concerning Plantations, Law No. 26/2007 concerning Spatial Zoning.
12 The Asia Foundation (2011), Study on the Political Economy of Land Use, Land Use Change and Forestry at the Local Level in Indonesia.
of Development (UKP4) are some of the govern-ment’s efforts to follow through on its commitment to mitigate carbon emissions and, particularly, re-duce deforestation and degradation. The drafting of a National Action Plan and Greenhouse Gas Ar-eas (RAN – RAD GRK) are also seen as efforts to structure government programs and work to opera-tionalize its commitments. Below are examples of several policies, institutions and action documents that the government has produced in its efforts to mitigate carbon emissions.
Despite the many initiatives pioneered by the government as shown in the table above, the In-donesian government still faces great challeng-es from a governance standpoint in meeting its carbon emission mitigation targets. Aside from the challenges in industrial and economic develop-ment, the fulfillment of carbon emission mitigation targets is also hindered by poor governance. One important aspect in land and forest governance in Indonesia is inadequate availability of policies and budgets. Inconsistency between policies, overlap-ping policies, policies that contradict one another and budget policies that are insufficiently responsive to the land and forest governance have been critical issues from the perspective of poor governance in policy sector.

Measuring Commitment12
2.3 COMMITMENTS PREDICTED NOT TO BE MET
The Indonesian Government’s commitment to re-duce carbon emissions by 26 percent before 2020 is predicted not to be met. The commitment stated in Presidential Regulation No. 61/2011 concerning the National Action Plan for Greenhouse Gas Emis-sion Mitigation (RAN-GRK) aims at a reduction of emissions by 26 percent as an individual effort by Indonesia or by 41 percent with international sup-port. This policy has been downscaled as a priority program in each field, as shown in the table below:
This study has identified important challenges the Indonesian government is facing in mitigating car-bon emissions, in particular, deforestation and deg-radation due to poor land and forest governance with respect to budgeting and planning policies. The following challenges reflect the prediction that the Indonesian government’s commitment to mitigate carbon emission by 26 percent through its own ef-forts and 41 percent with international support by 2020 will not be met.
Table 2.2 Priority of National Action Plan for Greenhouse Gases (RAN-GRK) (Under Presidential Regulation No. 61/2011)
Measuring Commitment 13
11 Such as Law No. 24/2009 concerning Mineral and Coal Mining, Law No. 32/2009 concerning Environment Protection and Governance and Presidential Instruction No. 10/2011 concerning Delayed Issuance of New Permits and Revision of Primary Natural Forest and Peatland Governance whose implementation period was then extended through Presidential Instruction No. 6/2013. Meanwhile, other sectoral policies have also been issued in previous years such as Law No. 41/1999 concerning Forestry, Law No. 18/2004 concerning Plantations, Law No. 26/2007 concerning Spatial Zoning.
12 These policy documents have listed short-term and medium-term target indicators to be achieved as commitments to assessing the central government’s performance. In addition, these indicators aim to solve issues depicted in the map of problems the government has to face in a realistic, measurable, and timely manner. It is from here that the commitment, orientation, preci-sion, and successfulness of the government’s strategies will be assessed.
A. THE EMISSION MITIGATION TARGET HAS NOT BEEN INTEGRATED INTO OTHER PLAN-NING POLICIES.
The authority of the central government to man-age, govern and utilize mining and plantation for-ests is manifested in the main strategies in the Na-tional Medium-Term Development Plan (RPJMN), Government Work Plan (RKP), Strategic Work Plan (Ministries of Forestry, ESDM) and Work Plan of relevant ministries/agencies.
The planning policies do not explicitly con-tain mitigation targets for deforestation and degradation rates as important indicators of emission mitigation. Of the RPJMN and other planning documents down to the ministerial level, none include mitigation targets for deforestation and degradation or as strategic targets for mitigating the level of carbon emission. Shifts in the function of forestland and peatland, legal and illegal logging, and forest fires have all contributed to carbon emis-sions in Indonesia. The problem is that in the 2010-2014 RPJMN, the indicator of the rate of mitigation of deforestation is only identified as efforts to de-crease the number of fire hot spots and suspension of environmental damage. Meanwhile, function shifts and logging are not taken as strategic indica-tors. Secondly, the indicators of target fulfillment in lowering the number of fire hot spots and mitigat-ing the environmental damage rate do not contain any measurable variables, including the area of for-est and land over which the government can prevent fires or environmental damage. RPJMN does not contain any indicators at all to examine decreases in the number of hot spots.
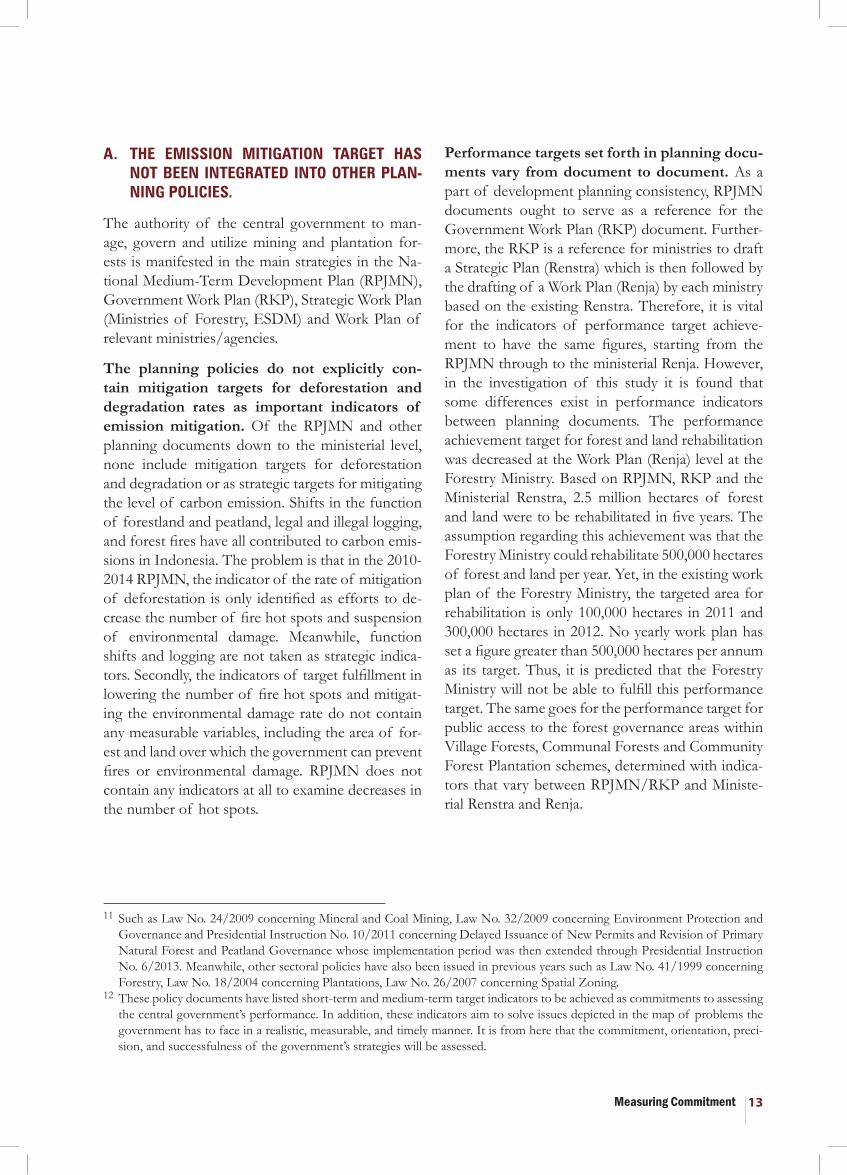
Performance targets set forth in planning docu-ments vary from document to document. As a part of development planning consistency, RPJMN documents ought to serve as a reference for the Government Work Plan (RKP) document. Further-more, the RKP is a reference for ministries to draft a Strategic Plan (Renstra) which is then followed by the drafting of a Work Plan (Renja) by each ministry based on the existing Renstra. Therefore, it is vital for the indicators of performance target achieve-ment to have the same figures, starting from the RPJMN through to the ministerial Renja. However, in the investigation of this study it is found that some differences exist in performance indicators between planning documents. The performance achievement target for forest and land rehabilitation was decreased at the Work Plan (Renja) level at the Forestry Ministry. Based on RPJMN, RKP and the Ministerial Renstra, 2.5 million hectares of forest and land were to be rehabilitated in five years. The assumption regarding this achievement was that the Forestry Ministry could rehabilitate 500,000 hectares of forest and land per year. Yet, in the existing work plan of the Forestry Ministry, the targeted area for rehabilitation is only 100,000 hectares in 2011 and 300,000 hectares in 2012. No yearly work plan has set a figure greater than 500,000 hectares per annum as its target. Thus, it is predicted that the Forestry Ministry will not be able to fulfill this performance target. The same goes for the performance target for public access to the forest governance areas within Village Forests, Communal Forests and Community Forest Plantation schemes, determined with indica-tors that vary between RPJMN/RKP and Ministe-rial Renstra and Renja.
Measuring Commitment14
Table 2.3 Appropriateness and Consistency of Achievement Targets and Performance Indicators Be-tween Central Government Planning Documents
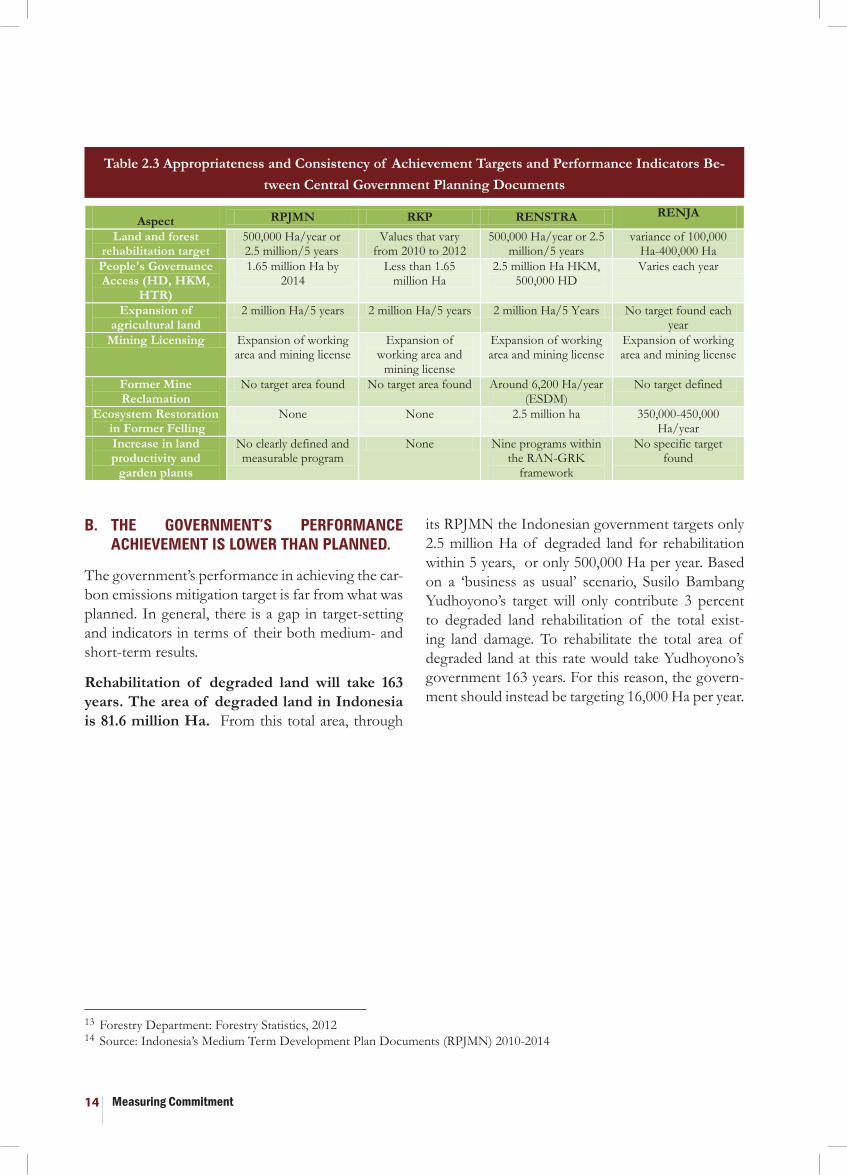
B. THE GOVERNMENT’S PERFORMANCE ACHIEVEMENT IS LOWER THAN PLANNED.
The government’s performance in achieving the car-bon emissions mitigation target is far from what was planned. In general, there is a gap in target-setting and indicators in terms of their both medium- and short-term results.
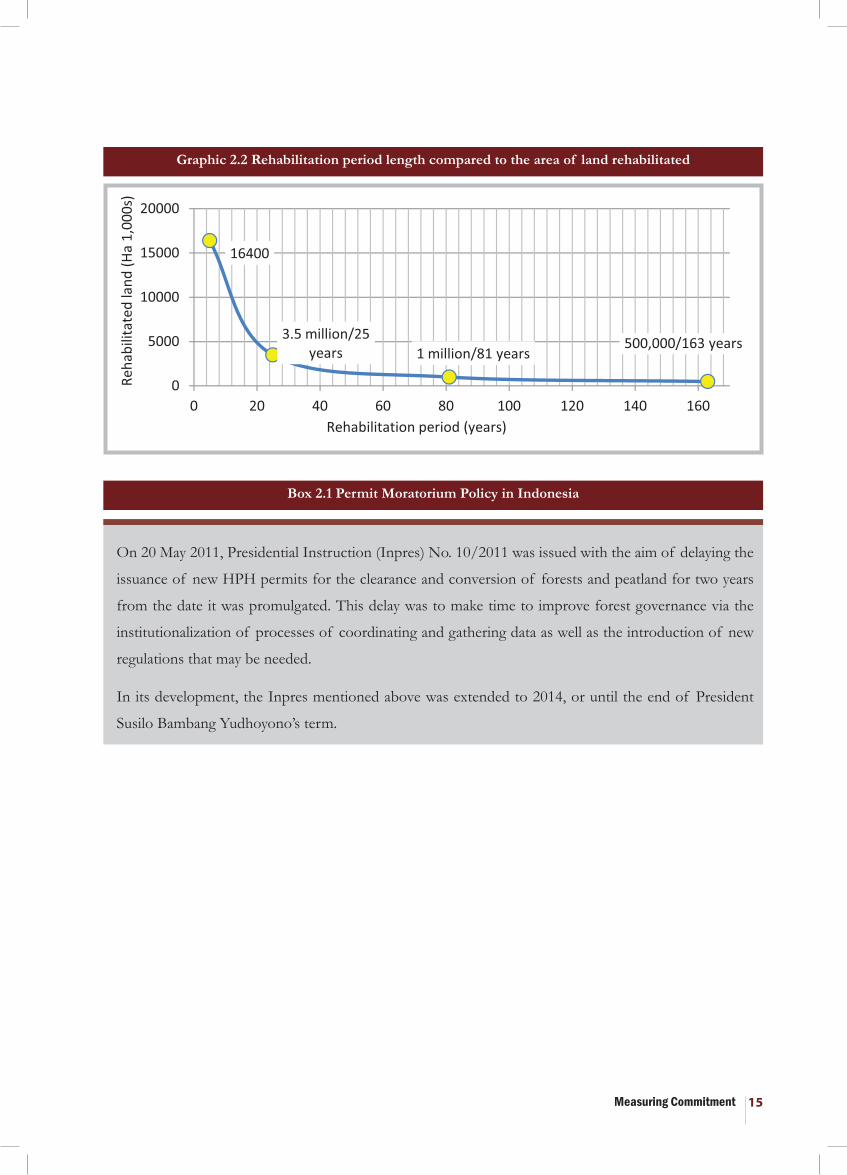
Rehabilitation of degraded land will take 163 years. The area of degraded land in Indonesia is 81.6 million Ha. From this total area, through
its RPJMN the Indonesian government targets only 2.5 million Ha of degraded land for rehabilitation within 5 years, or only 500,000 Ha per year. Based on a ‘business as usual’ scenario, Susilo Bambang Yudhoyono’s target will only contribute 3 percent to degraded land rehabilitation of the total exist-ing land damage. To rehabilitate the total area of degraded land at this rate would take Yudhoyono’s government 163 years. For this reason, the govern-ment should instead be targeting 16,000 Ha per year.
13 Forestry Department: Forestry Statistics, 201214 Source: Indonesia’s Medium Term Development Plan Documents (RPJMN) 2010-2014
Measuring Commitment 15
Graphic 2.2 Rehabilitation period length compared to the area of land rehabilitated
Box 2.1 Permit Moratorium Policy in Indonesia
On 20 May 2011, Presidential Instruction (Inpres) No. 10/2011 was issued with the aim of delaying the
issuance of new HPH permits for the clearance and conversion of forests and peatland for two years
from the date it was promulgated. This delay was to make time to improve forest governance via the
institutionalization of processes of coordinating and gathering data as well as the introduction of new
regulations that may be needed.
In its development, the Inpres mentioned above was extended to 2014, or until the end of President
Susilo Bambang Yudhoyono’s term.
Measuring Commitment16
The government has failed to fulfill the perfor-mance expected by the degraded land rehabili-tation program. Leaving aside the optimum target and looking only at the existing performance target, the government still has not succeeded in achieving the degraded land rehabilitation target of 500,000 Ha per year. Based on the data issued by the De-partment of Forestry (2012), it is found that the re-habilitation program from 2007-2012 could only be performed on 1.6 million Ha of land. This means that the government has only been able to rehabili-tate an average of 320,000 Ha of land per year. This figure is far from what is targeted in the RPJMN.
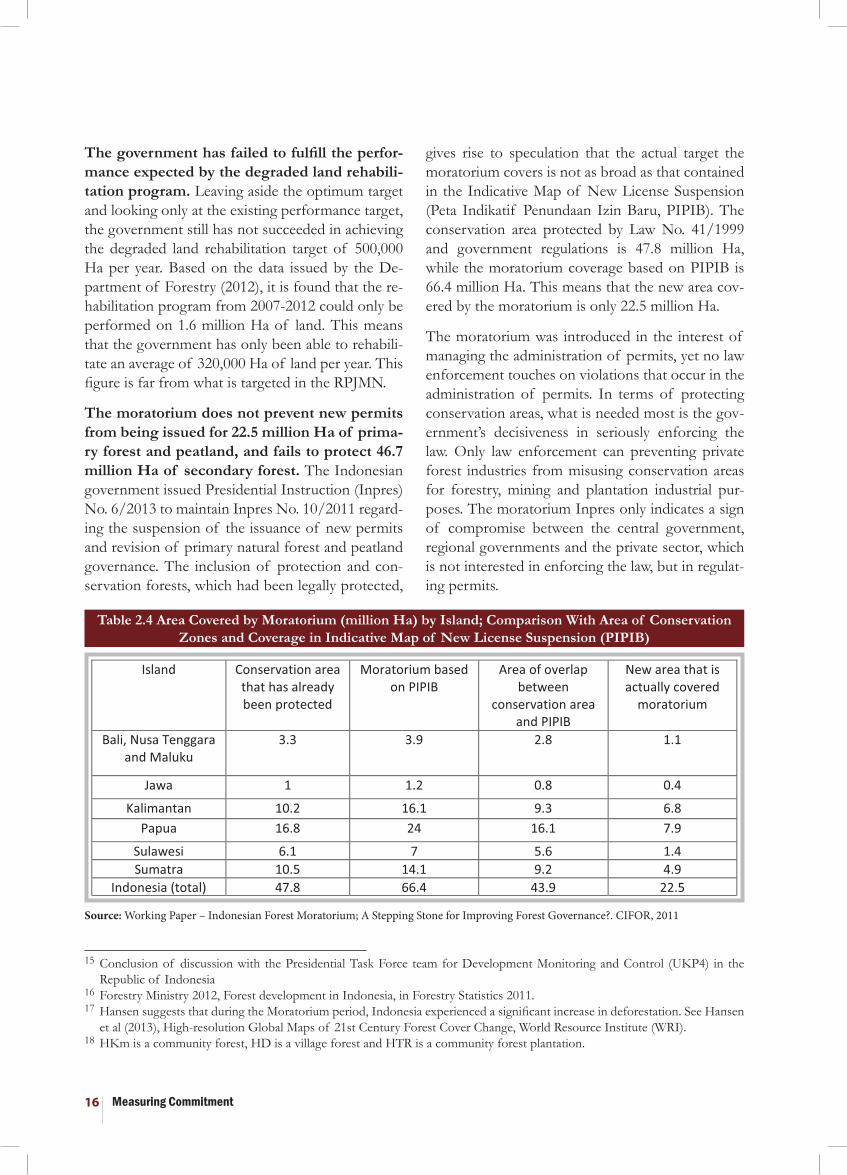
The moratorium does not prevent new permits from being issued for 22.5 million Ha of prima-ry forest and peatland, and fails to protect 46.7 million Ha of secondary forest. The Indonesian government issued Presidential Instruction (Inpres) No. 6/2013 to maintain Inpres No. 10/2011 regard-ing the suspension of the issuance of new permits and revision of primary natural forest and peatland governance. The inclusion of protection and con-servation forests, which had been legally protected,
gives rise to speculation that the actual target the moratorium covers is not as broad as that contained in the Indicative Map of New License Suspension (Peta Indikatif Penundaan Izin Baru, PIPIB). The conservation area protected by Law No. 41/1999 and government regulations is 47.8 million Ha, while the moratorium coverage based on PIPIB is 66.4 million Ha. This means that the new area cov-ered by the moratorium is only 22.5 million Ha.
The moratorium was introduced in the interest of managing the administration of permits, yet no law enforcement touches on violations that occur in the administration of permits. In terms of protecting conservation areas, what is needed most is the gov-ernment’s decisiveness in seriously enforcing the law. Only law enforcement can preventing private forest industries from misusing conservation areas for forestry, mining and plantation industrial pur-poses. The moratorium Inpres only indicates a sign of compromise between the central government, regional governments and the private sector, which is not interested in enforcing the law, but in regulat-ing permits.
Table 2.4 Area Covered by Moratorium (million Ha) by Island; Comparison With Area of Conservation Zones and Coverage in Indicative Map of New License Suspension (PIPIB)
Source: Working Paper – Indonesian Forest Moratorium; A Stepping Stone for Improving Forest Governance?. CIFOR, 2011
15 Conclusion of discussion with the Presidential Task Force team for Development Monitoring and Control (UKP4) in the Republic of Indonesia
16 Forestry Ministry 2012, Forest development in Indonesia, in Forestry Statistics 2011.17 Hansen suggests that during the Moratorium period, Indonesia experienced a significant increase in deforestation. See Hansen
et al (2013), High-resolution Global Maps of 21st Century Forest Cover Change, World Resource Institute (WRI). 18 HKm is a community forest, HD is a village forest and HTR is a community forest plantation.
Measuring Commitment 17
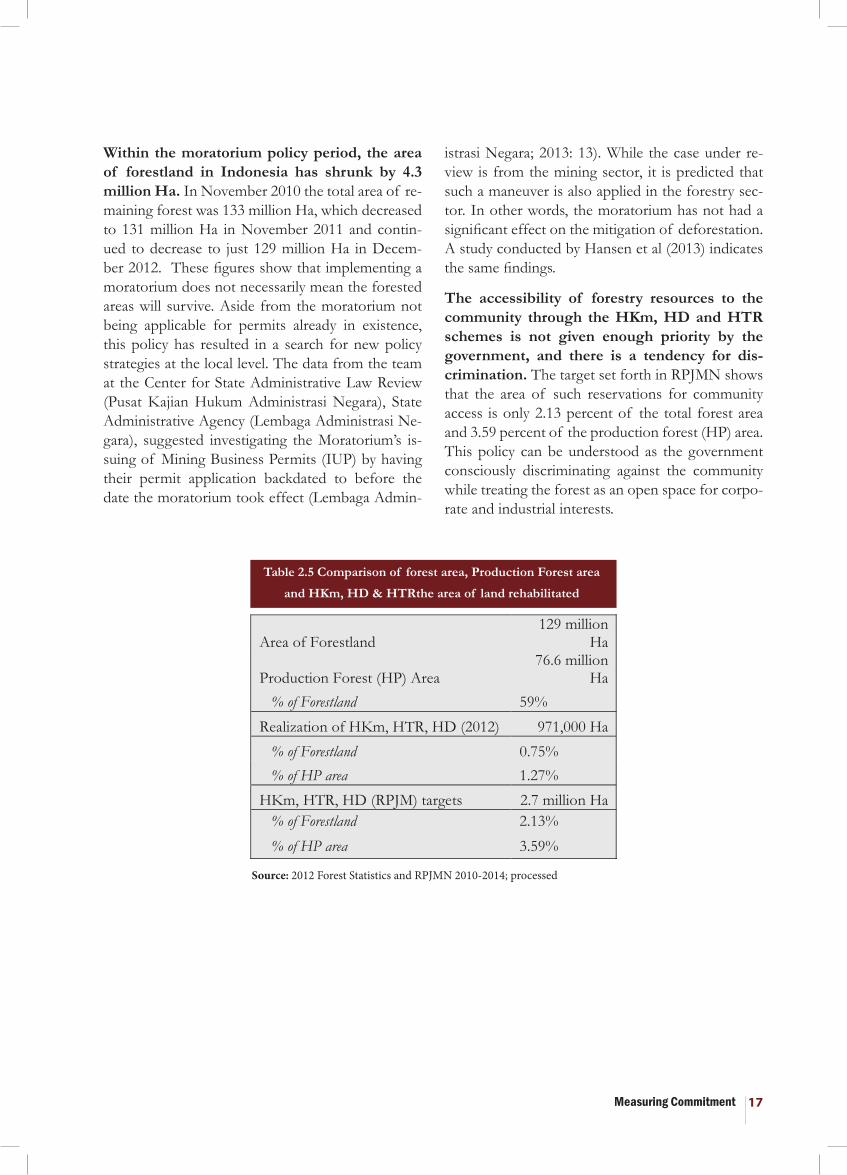
Within the moratorium policy period, the area of forestland in Indonesia has shrunk by 4.3 million Ha. In November 2010 the total area of re-maining forest was 133 million Ha, which decreased to 131 million Ha in November 2011 and contin-ued to decrease to just 129 million Ha in Decem-ber 2012. These figures show that implementing a moratorium does not necessarily mean the forested areas will survive. Aside from the moratorium not being applicable for permits already in existence, this policy has resulted in a search for new policy strategies at the local level. The data from the team at the Center for State Administrative Law Review (Pusat Kajian Hukum Administrasi Negara), State Administrative Agency (Lembaga Administrasi Ne-gara), suggested investigating the Moratorium’s is-suing of Mining Business Permits (IUP) by having their permit application backdated to before the date the moratorium took effect (Lembaga Admin-
Table 2.5 Comparison of forest area, Production Forest area
and HKm, HD & HTRthe area of land rehabilitated
Source: 2012 Forest Statistics and RPJMN 2010-2014; processed
istrasi Negara; 2013: 13). While the case under re-view is from the mining sector, it is predicted that such a maneuver is also applied in the forestry sec-tor. In other words, the moratorium has not had a significant effect on the mitigation of deforestation. A study conducted by Hansen et al (2013) indicates the same findings.
The accessibility of forestry resources to the community through the HKm, HD and HTR schemes is not given enough priority by the government, and there is a tendency for dis-crimination. The target set forth in RPJMN shows that the area of such reservations for community access is only 2.13 percent of the total forest area and 3.59 percent of the production forest (HP) area. This policy can be understood as the government consciously discriminating against the community while treating the forest as an open space for corpo-rate and industrial interests.
Measuring Commitment18
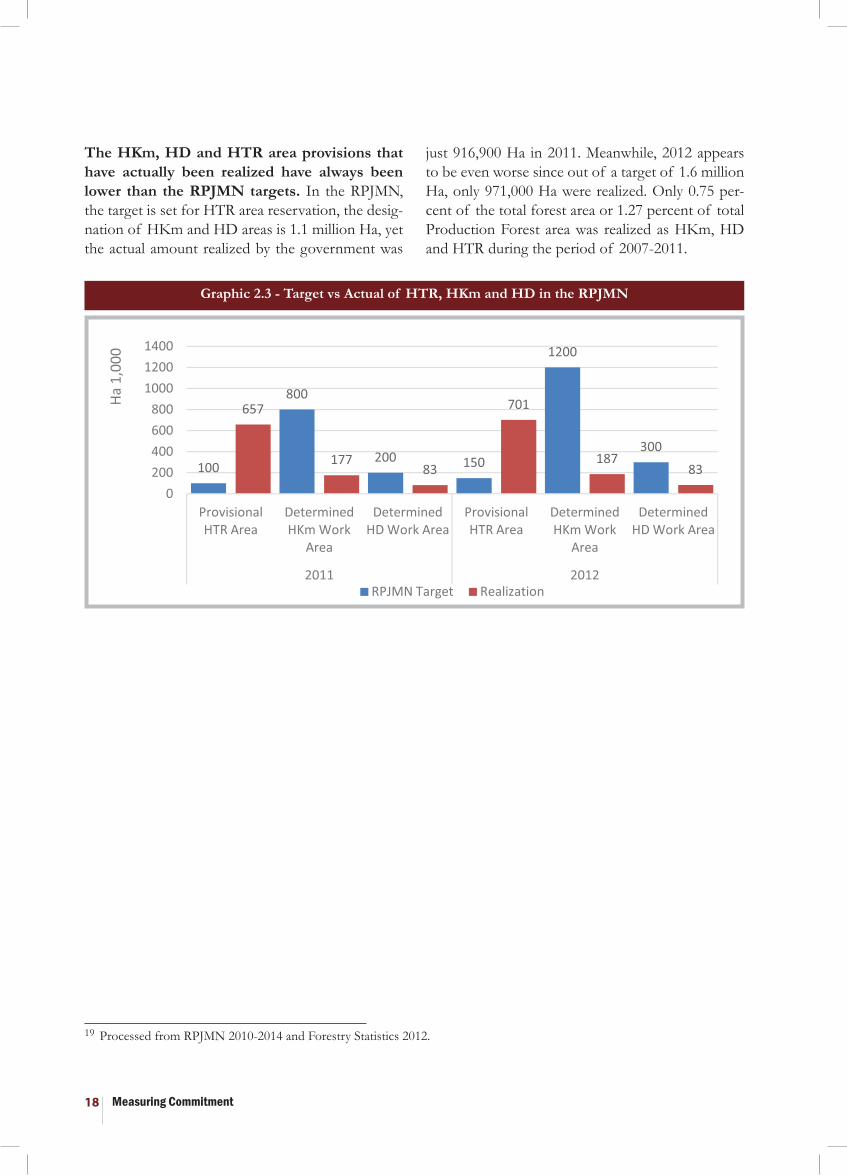
The HKm, HD and HTR area provisions that have actually been realized have always been lower than the RPJMN targets. In the RPJMN, the target is set for HTR area reservation, the desig-nation of HKm and HD areas is 1.1 million Ha, yet the actual amount realized by the government was
Graphic 2.3 - Target vs Actual of HTR, HKm and HD in the RPJMN
just 916,900 Ha in 2011. Meanwhile, 2012 appears to be even worse since out of a target of 1.6 million Ha, only 971,000 Ha were realized. Only 0.75 per-cent of the total forest area or 1.27 percent of total Production Forest area was realized as HKm, HD and HTR during the period of 2007-2011.
19 Processed from RPJMN 2010-2014 and Forestry Statistics 2012.

Measuring Commitment 19
Box 2.2 Proposal for Village Forest in North Kayong District Took More Than 1,000 Days
Box 2.3 Public Claim in South Sumatra against the Forestry Minister
The communities in five villages of the Pulau Maya sub-district, North Kayong district can now breathe a collective sigh of relief. Their proposal for the Forestry Ministry to establish a village forest work area of 52,794.16 Ha was finally approved by the minister at the end of July 2013. Their sense of relief is understandable, keeping in mind that they struggled to get approval for approximately three years.
The proposal for a village forest (HD) by the community began when the district head sent a proposal document of five village forest work areas on October 22, 2010. Meanwhile, in the same region, a pro-duction forest area proposed by the community to be a village forest had also been proposed to be an Ecosystem Restoration (RE) program by PT Gapura Persada Khatulistiwa. However, on November 10, 2010, the district head sent a letter to the Forestry Minister to confirm that the district government refused the company’s RE but supported the community’s HD proposal.
In March 2011, this was verified by a team from the Forestry Ministry, UPT and Provincial Department of Forestry. After being verified on March 25, the KKU district head once again sent the forestry min-ister a letter to explicitly ask for the exclusion of some HP areas from IUPHHK-RE. In reality, these two official letters by the KKU district head had gotten no response at all from the ministry. Meanwhile, the minister kept publicly expressing his political commitment to HD-HKM in various forums and on a variety of occassions.
Public disappointment led accompanying NGOs, along with elements of local government that received no logical explanation regarding their HD-HKM proposal, to report the minister’s maladministration to the Indonesian Ombudsman. Eventually, on July 26, 2013, Forestry Ministry staff said that the decree regarding the North Kayong HD had been signed by the minister. If counted from the beginning of the HD proposal, the process of obtaining the decree took more than 1,000 days, from October 22, 2010, when the proposal was submitted (source: www.gemawan.or.id).
The communities of six districts in South Sumatra that united to form the South Sumatra People’s Communication Forum on Forest Governance (FKMPH – SS) filed a claim against the Minister of For-estry of the Republic of Indonesia. The problem lay with the minister’s neglect of their proposals for a Community Forest (HKM) and Village Forest (HD). For all HKM schemes during 2010-2012, there was a proposed area of 3,432 hectares with a distribution across Musi Rawas and Lahat districts. For the Village Forest in the same year, a total area of 41,707 Ha was proposed, distributed across Musi Banyu-asin, Muara Enim and Musi Rawas districts. However, the fact of the matter is that there is still only one definitive Village Forest in South Sumatra, that is the Muara Merang Village Forest in Musi Banyuasin District, with an area of 7,250 Ha, which was granted its governance permit in 2010.
On almost all of these proposals a verification process was conducted by the Ministry of Forestry. To date, no information has been given related to the approval of permits. In accordance with Perdirjen No. 07/2010 and No. 11/2010 concerning the Procedure for the Implementation of HKM and Village Forest Working Area Establishment Permits, the forestry minister is to be given a maximum period of only 60 working days within which to issue a decree. 60 working days have elapsed, yet nothing about the permit is known. What do you have to say about that, Mr. Minister? (source: www.sumeks.co.id)
Measuring Commitment20
C. GROWTH POLICIES HAVE FAILED TO PRO-DUCE A GREEN-GROWTH DEVELOPMENT SCENARIO
Pro-poor, pro-job, pro-growth and pro-environ-ment as pillars of development are not enough to ensure environment-based sustainable develop-ment. With the issuance of Presidential Regulation No. 5/2010 concerning the National Medium-Term Development Plan (RPJMN), the government es-tablished four pillars in support of the orientation of development policy for the 2010-2014 period. State revenue policy, which for about 24 percent of its state spending needs depends on the exploitation of natural resources, is inconsistent with the gov-ernment’s pro-environment pillar.
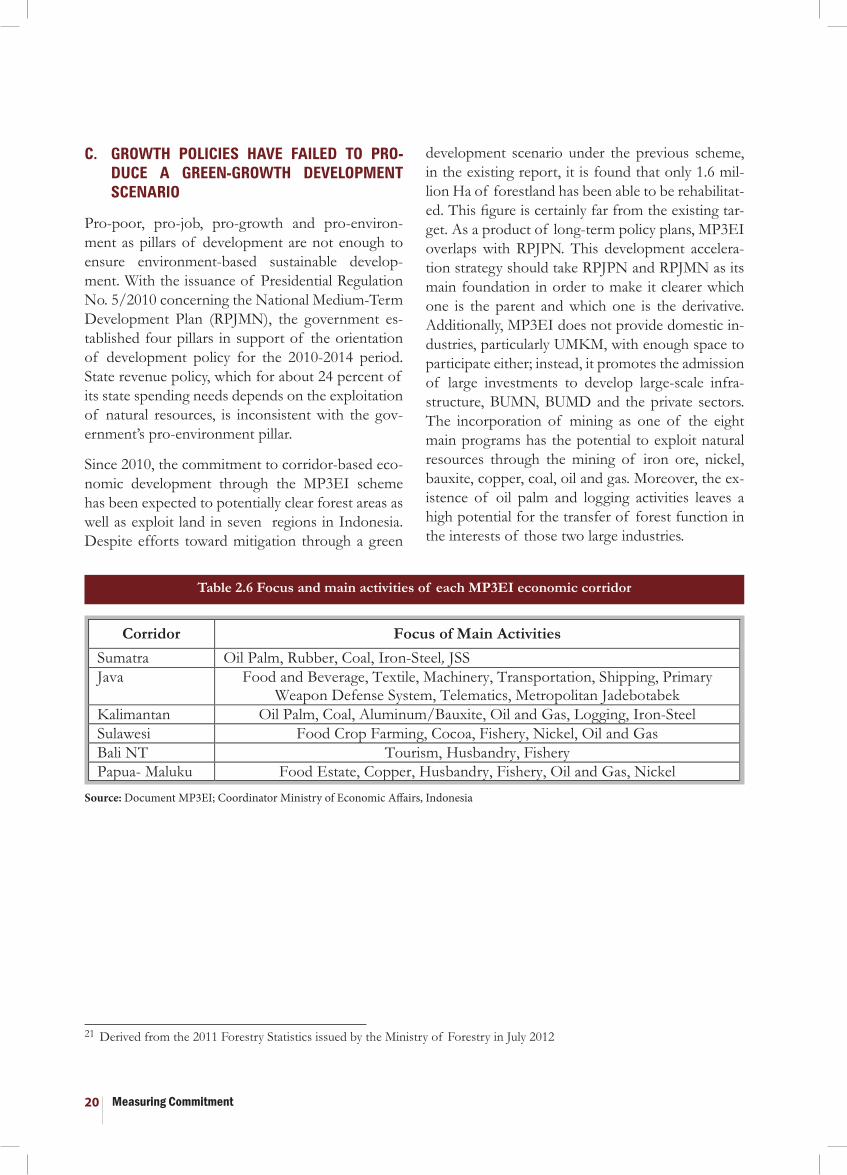
Since 2010, the commitment to corridor-based eco-nomic development through the MP3EI scheme has been expected to potentially clear forest areas as well as exploit land in seven regions in Indonesia. Despite efforts toward mitigation through a green
development scenario under the previous scheme, in the existing report, it is found that only 1.6 mil-lion Ha of forestland has been able to be rehabilitat-ed. This figure is certainly far from the existing tar-get. As a product of long-term policy plans, MP3EI overlaps with RPJPN. This development accelera-tion strategy should take RPJPN and RPJMN as its main foundation in order to make it clearer which one is the parent and which one is the derivative. Additionally, MP3EI does not provide domestic in-dustries, particularly UMKM, with enough space to participate either; instead, it promotes the admission of large investments to develop large-scale infra-structure, BUMN, BUMD and the private sectors. The incorporation of mining as one of the eight main programs has the potential to exploit natural resources through the mining of iron ore, nickel, bauxite, copper, coal, oil and gas. Moreover, the ex-istence of oil palm and logging activities leaves a high potential for the transfer of forest function in the interests of those two large industries.
Table 2.6 Focus and main activities of each MP3EI economic corridor
Source: Document MP3EI; Coordinator Ministry of Economic Affairs, Indonesia
21 Derived from the 2011 Forestry Statistics issued by the Ministry of Forestry in July 2012
Measuring Commitment 21
The pro-growth policy has increased the con-version rate of forestland for forest and land-based industries by an area of 9.4 million Ha. Forestry Ministry data for 2007-2012 has seen the area of forestland converted into plantations ex-pand by 6.7 million Ha. In addition, during the same period, the Forestry Ministry has also issued forestland usage permits for mining exploration and exploitation, which could result in the transfer of forest functions to mining, reaching 2.7 million Ha. From such data, it can also be concluded that the pro-growth policy has transferred the function in fa-vor of forest and land-based industries and the land consumed per year is nearly 2 million Ha.
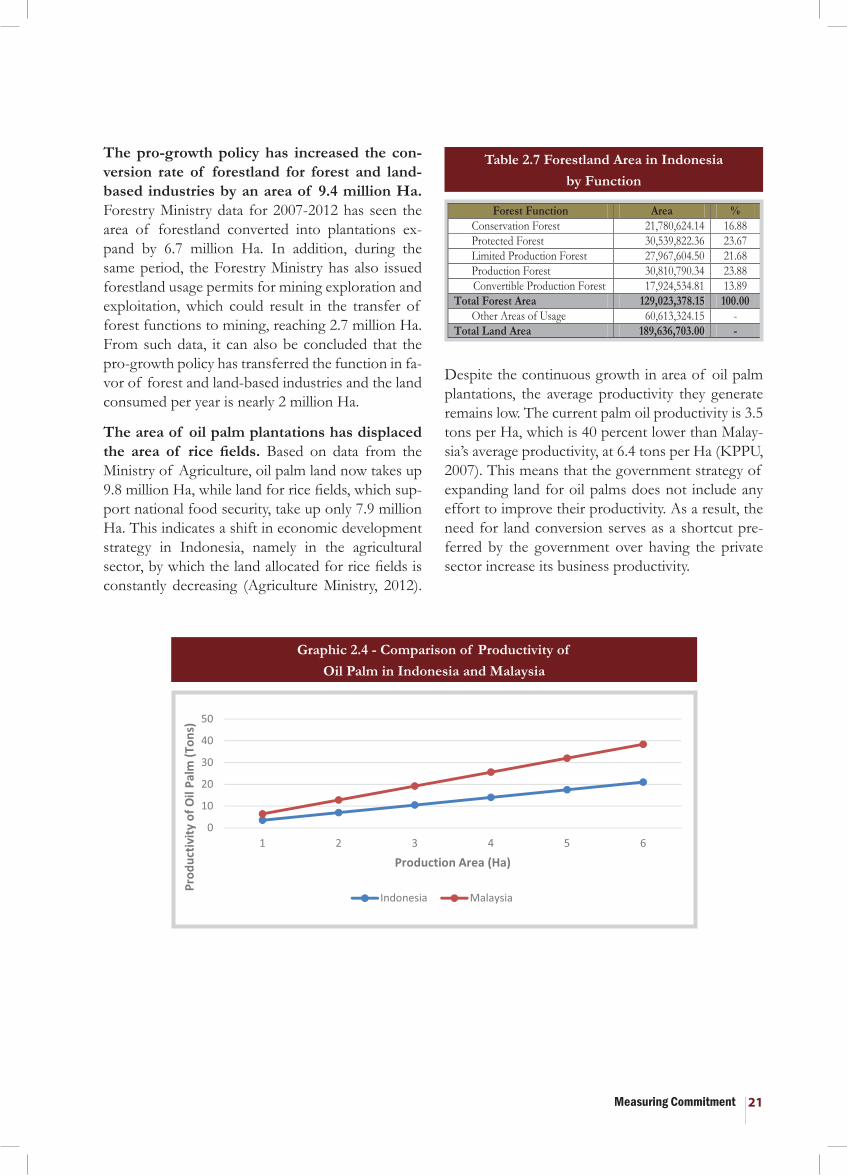
The area of oil palm plantations has displaced the area of rice fields. Based on data from the Ministry of Agriculture, oil palm land now takes up 9.8 million Ha, while land for rice fields, which sup-port national food security, take up only 7.9 million Ha. This indicates a shift in economic development strategy in Indonesia, namely in the agricultural sector, by which the land allocated for rice fields is constantly decreasing (Agriculture Ministry, 2012).
Table 2.7 Forestland Area in Indonesiaby Function
Graphic 2.4 - Comparison of Productivity ofOil Palm in Indonesia and Malaysia
Despite the continuous growth in area of oil palm plantations, the average productivity they generate remains low. The current palm oil productivity is 3.5 tons per Ha, which is 40 percent lower than Malay-sia’s average productivity, at 6.4 tons per Ha (KPPU, 2007). This means that the government strategy of expanding land for oil palms does not include any effort to improve their productivity. As a result, the need for land conversion serves as a shortcut pre-ferred by the government over having the private sector increase its business productivity.
Measuring Commitment22
22 Processed from 2011 Forestry Statistics issued by the Ministry of Forestry in July 2012
D. PRO-DEFORESTATION AND DEGRADATION PLANNING POLICIES
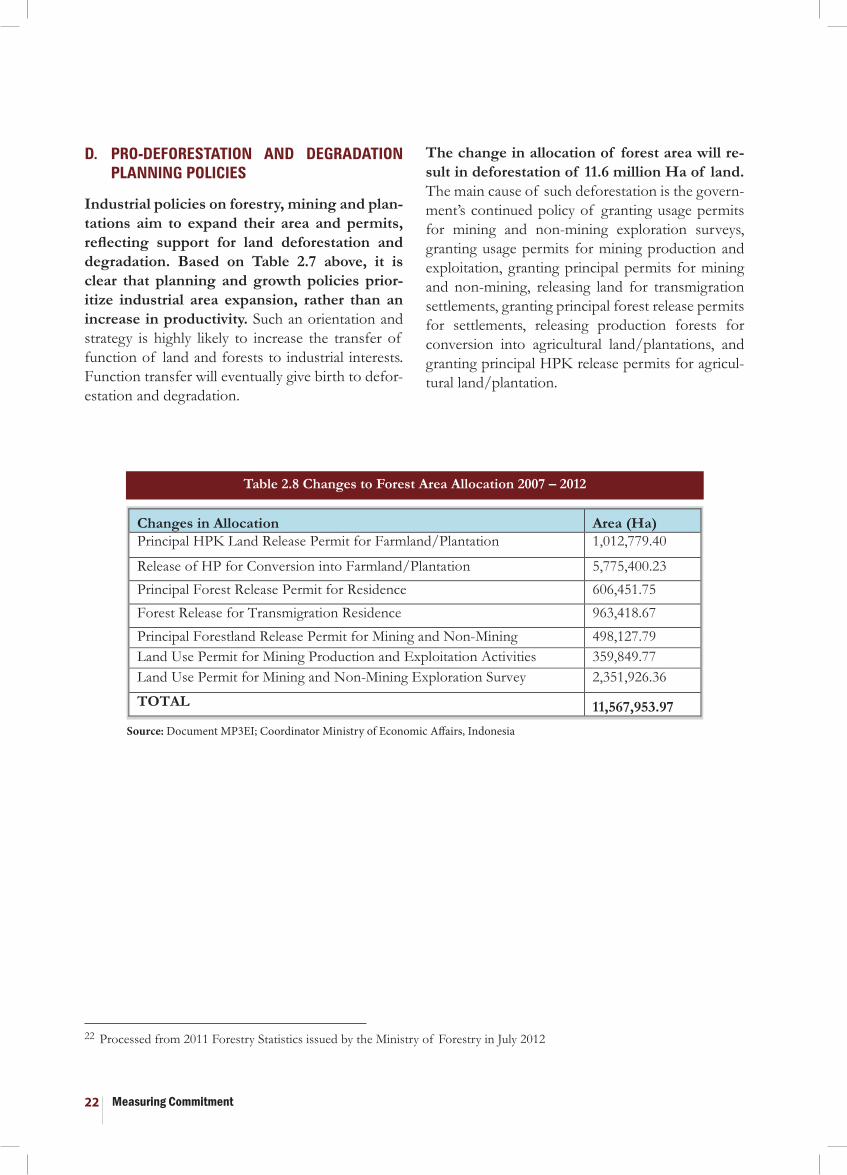
Industrial policies on forestry, mining and plan-tations aim to expand their area and permits, reflecting support for land deforestation and degradation. Based on Table 2.7 above, it is clear that planning and growth policies prior-itize industrial area expansion, rather than an increase in productivity. Such an orientation and strategy is highly likely to increase the transfer of function of land and forests to industrial interests. Function transfer will eventually give birth to defor-estation and degradation.
The change in allocation of forest area will re-sult in deforestation of 11.6 million Ha of land. The main cause of such deforestation is the govern-ment’s continued policy of granting usage permits for mining and non-mining exploration surveys, granting usage permits for mining production and exploitation, granting principal permits for mining and non-mining, releasing land for transmigration settlements, granting principal forest release permits for settlements, releasing production forests for conversion into agricultural land/plantations, and granting principal HPK release permits for agricul-tural land/plantation.
Table 2.8 Changes to Forest Area Allocation 2007 – 2012
Source: Document MP3EI; Coordinator Ministry of Economic Affairs, Indonesia
Measuring Commitment 23
23 Processed from 2011 Forestry Statistics issued by the Ministry of Forestry in July 201224 Processed by the researchers based on the recapitulated data of 2011 Forestry Statistics25 Presentation of Deputy for Development Planning of Ministry of National Development Planning/National Development
Planning Board (BAPPENAS) on October 23, 2013 in Konferensi Pembiayaan Perubahan Iklim (Conference of Climate Change Financing) in Jakarta
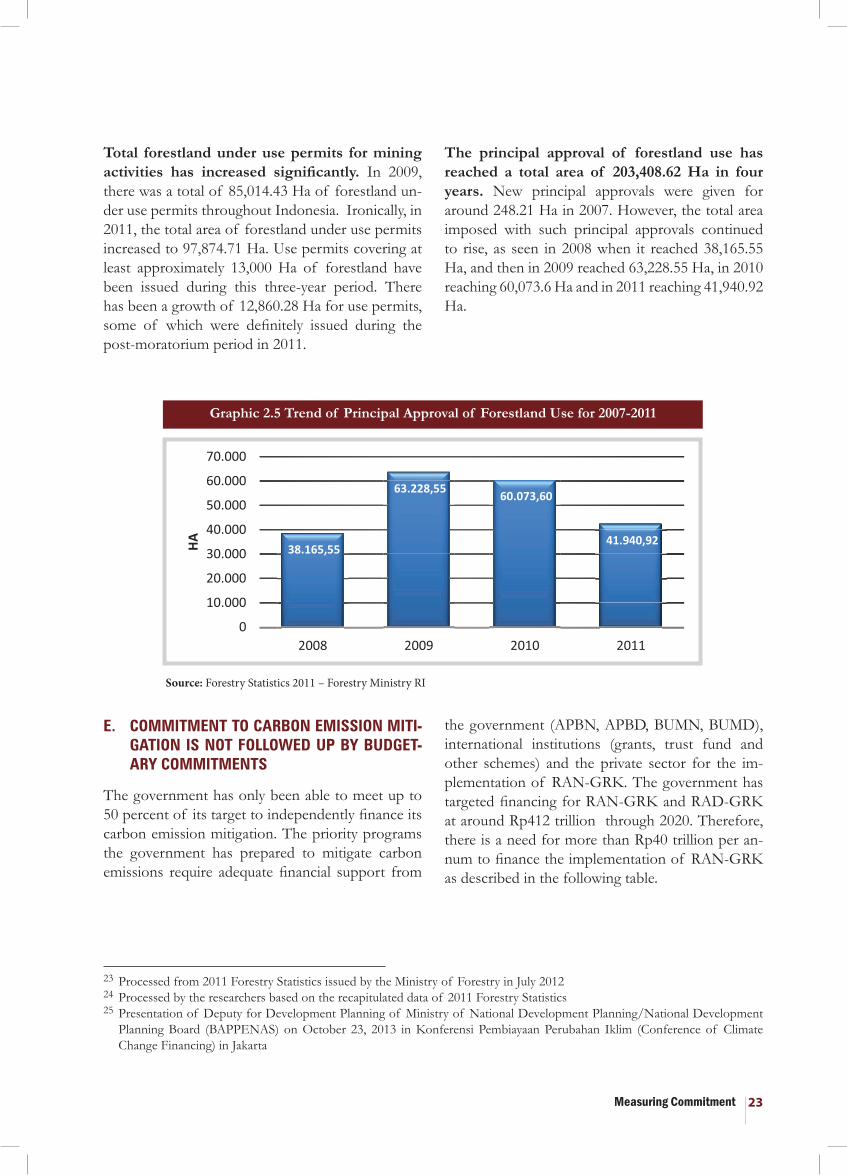
Total forestland under use permits for mining activities has increased significantly. In 2009, there was a total of 85,014.43 Ha of forestland un-der use permits throughout Indonesia. Ironically, in 2011, the total area of forestland under use permits increased to 97,874.71 Ha. Use permits covering at least approximately 13,000 Ha of forestland have been issued during this three-year period. There has been a growth of 12,860.28 Ha for use permits, some of which were definitely issued during the post-moratorium period in 2011.
E. COMMITMENT TO CARBON EMISSION MITI-GATION IS NOT FOLLOWED UP BY BUDGET-ARY COMMITMENTS
The government has only been able to meet up to 50 percent of its target to independently finance its carbon emission mitigation. The priority programs the government has prepared to mitigate carbon emissions require adequate financial support from
Graphic 2.5 Trend of Principal Approval of Forestland Use for 2007-2011
Source: Forestry Statistics 2011 – Forestry Ministry RI
The principal approval of forestland use has reached a total area of 203,408.62 Ha in four years. New principal approvals were given for around 248.21 Ha in 2007. However, the total area imposed with such principal approvals continued to rise, as seen in 2008 when it reached 38,165.55 Ha, and then in 2009 reached 63,228.55 Ha, in 2010 reaching 60,073.6 Ha and in 2011 reaching 41,940.92 Ha.
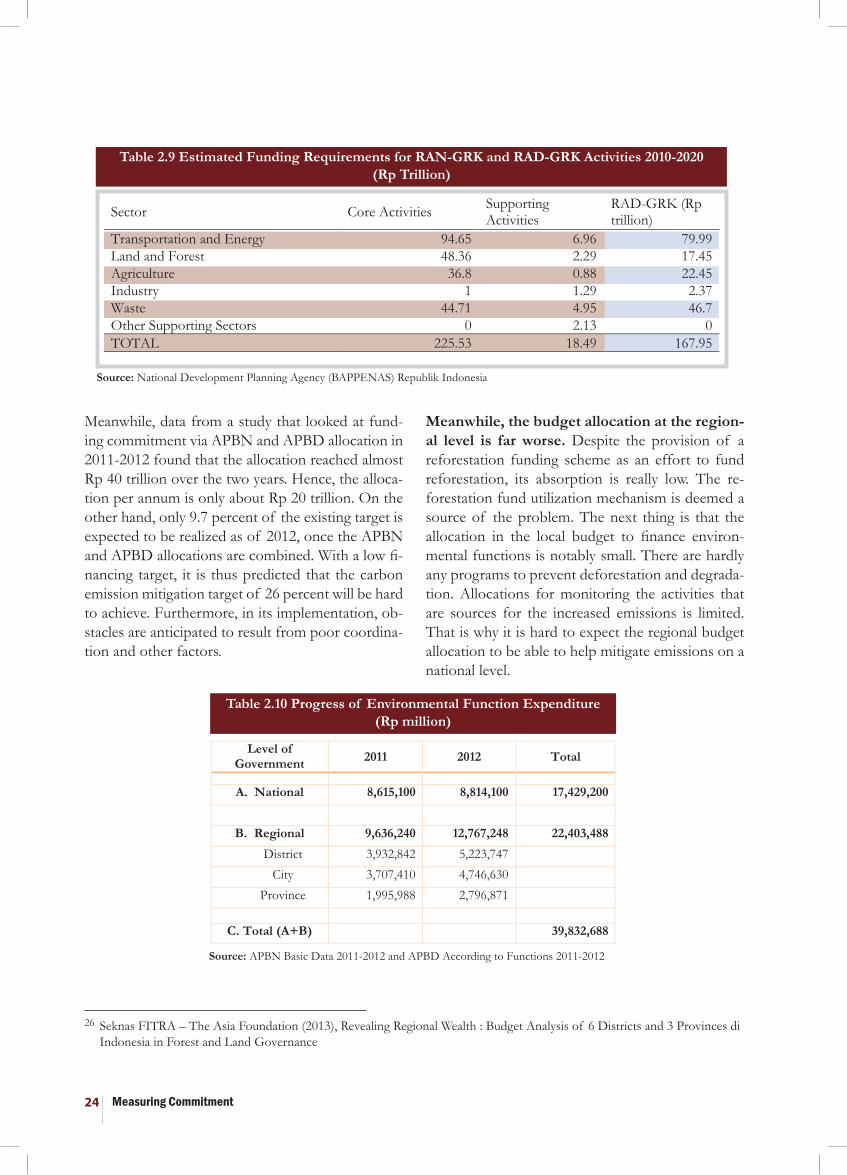
the government (APBN, APBD, BUMN, BUMD), international institutions (grants, trust fund and other schemes) and the private sector for the im-plementation of RAN-GRK. The government has targeted financing for RAN-GRK and RAD-GRK at around Rp412 trillion through 2020. Therefore, there is a need for more than Rp40 trillion per an-num to finance the implementation of RAN-GRK as described in the following table.
Measuring Commitment24
Meanwhile, data from a study that looked at fund-ing commitment via APBN and APBD allocation in 2011-2012 found that the allocation reached almost Rp 40 trillion over the two years. Hence, the alloca-tion per annum is only about Rp 20 trillion. On the other hand, only 9.7 percent of the existing target is expected to be realized as of 2012, once the APBN and APBD allocations are combined. With a low fi-nancing target, it is thus predicted that the carbon emission mitigation target of 26 percent will be hard to achieve. Furthermore, in its implementation, ob-stacles are anticipated to result from poor coordina-tion and other factors.
26 Seknas FITRA – The Asia Foundation (2013), Revealing Regional Wealth : Budget Analysis of 6 Districts and 3 Provinces di Indonesia in Forest and Land Governance
Table 2.9 Estimated Funding Requirements for RAN-GRK and RAD-GRK Activities 2010-2020(Rp Trillion)
Table 2.10 Progress of Environmental Function Expenditure (Rp million)
Source: National Development Planning Agency (BAPPENAS) Republik Indonesia
Source: APBN Basic Data 2011-2012 and APBD According to Functions 2011-2012
Meanwhile, the budget allocation at the region-al level is far worse. Despite the provision of a reforestation funding scheme as an effort to fund reforestation, its absorption is really low. The re-forestation fund utilization mechanism is deemed a source of the problem. The next thing is that the allocation in the local budget to finance environ-mental functions is notably small. There are hardly any programs to prevent deforestation and degrada-tion. Allocations for monitoring the activities that are sources for the increased emissions is limited. That is why it is hard to expect the regional budget allocation to be able to help mitigate emissions on a national level.
Measuring Commitment 25
Graphic 3.1 2008-2012 Trends in State Revenue
Source: APBN Spending 2008-2011 and Pure APBN 2012
3.1 CONTRIBUTION OF THE LAND AND FOREST SECTOR TO STATE REVENUE
State Revenue recorded in the State Budget (APBN) is divided into two sources, namely Domestic Rev-enue and Grants. The Domestic Revenue (PDN) derives from Tax Revenue and Non-Tax State Rev-enue (PNBP). The revenue from tax is generally ob-tained from estate tax (PBB), income tax (PPh), val-ue-added tax (PPN) and other kinds of tax managed by the central government. Non-Tax State Revenue (PNBP), on the other hand, is obtained from natural resources through fixed fees and royalties, BUMN’s profit portion, public service agencies and other sources.
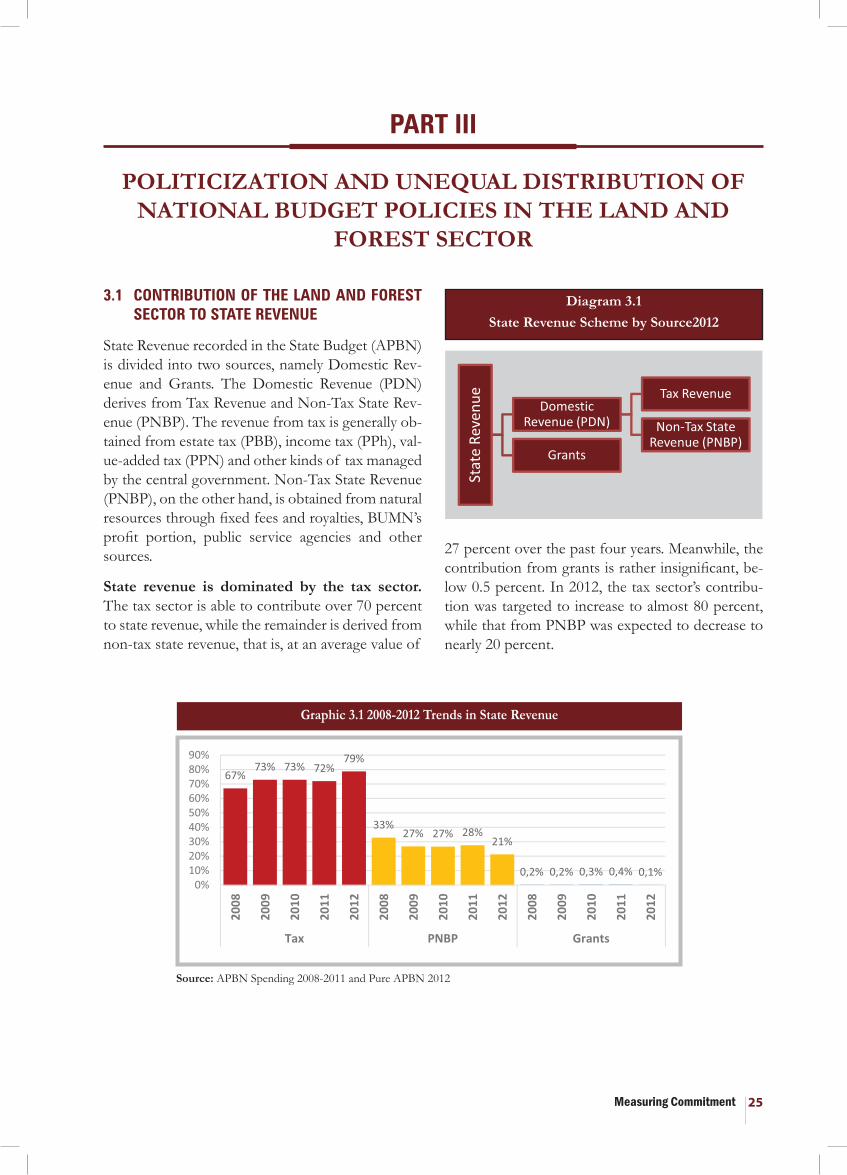
State revenue is dominated by the tax sector. The tax sector is able to contribute over 70 percent to state revenue, while the remainder is derived from non-tax state revenue, that is, at an average value of
POLITICIZATION AND UNEQUAL DISTRIBUTION OF NATIONAL BUDGET POLICIES IN THE LAND AND
FOREST SECTOR
PART III
27 percent over the past four years. Meanwhile, the contribution from grants is rather insignificant, be-low 0.5 percent. In 2012, the tax sector’s contribu-tion was targeted to increase to almost 80 percent, while that from PNBP was expected to decrease to nearly 20 percent.
Diagram 3.1State Revenue Scheme by Source2012
Measuring Commitment26
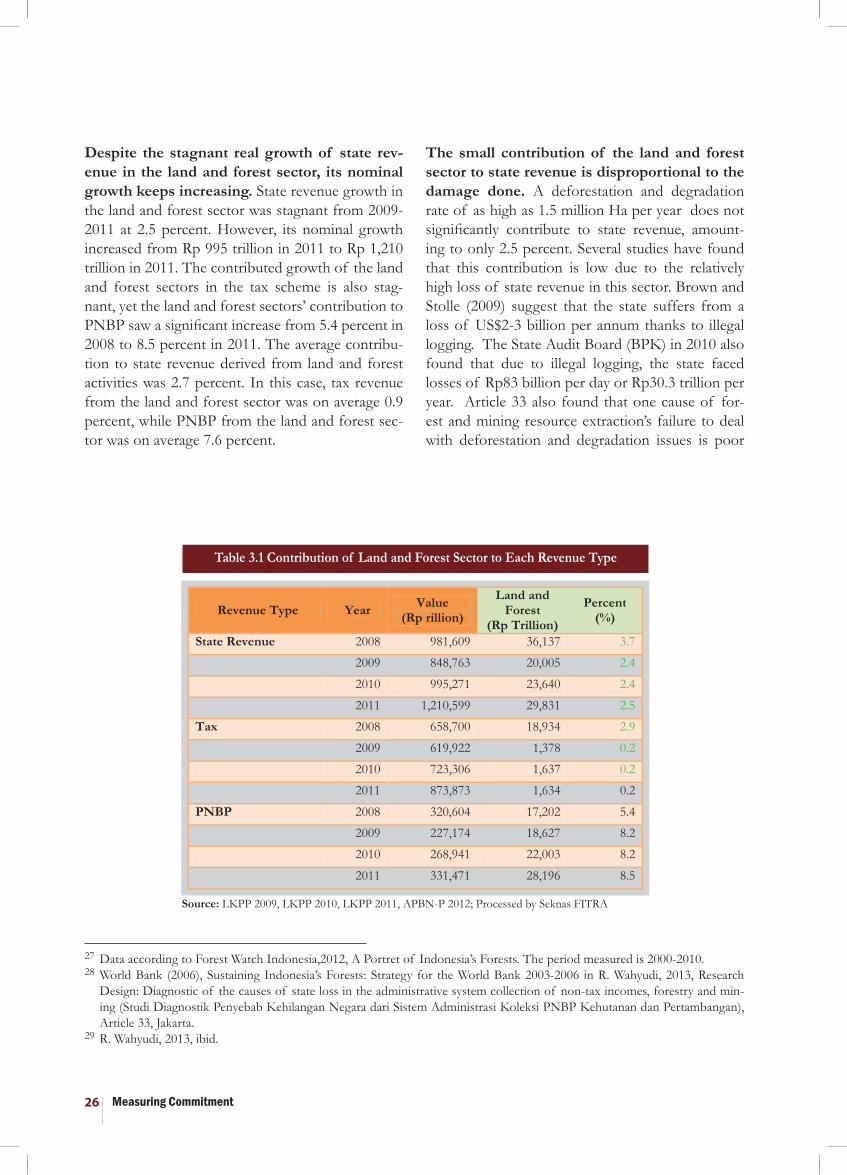
Despite the stagnant real growth of state rev-enue in the land and forest sector, its nominal growth keeps increasing. State revenue growth in the land and forest sector was stagnant from 2009-2011 at 2.5 percent. However, its nominal growth increased from Rp 995 trillion in 2011 to Rp 1,210 trillion in 2011. The contributed growth of the land and forest sectors in the tax scheme is also stag-nant, yet the land and forest sectors’ contribution to PNBP saw a significant increase from 5.4 percent in 2008 to 8.5 percent in 2011. The average contribu-tion to state revenue derived from land and forest activities was 2.7 percent. In this case, tax revenue from the land and forest sector was on average 0.9 percent, while PNBP from the land and forest sec-tor was on average 7.6 percent.
The small contribution of the land and forest sector to state revenue is disproportional to the damage done. A deforestation and degradation rate of as high as 1.5 million Ha per year does not significantly contribute to state revenue, amount-ing to only 2.5 percent. Several studies have found that this contribution is low due to the relatively high loss of state revenue in this sector. Brown and Stolle (2009) suggest that the state suffers from a loss of US$2-3 billion per annum thanks to illegal logging. The State Audit Board (BPK) in 2010 also found that due to illegal logging, the state faced losses of Rp83 billion per day or Rp30.3 trillion per year. Article 33 also found that one cause of for-est and mining resource extraction’s failure to deal with deforestation and degradation issues is poor
Table 3.1 Contribution of Land and Forest Sector to Each Revenue Type
Source: LKPP 2009, LKPP 2010, LKPP 2011, APBN-P 2012; Processed by Seknas FITRA
27 Data according to Forest Watch Indonesia,2012, A Portret of Indonesia’s Forests. The period measured is 2000-2010. 28 World Bank (2006), Sustaining Indonesia’s Forests: Strategy for the World Bank 2003-2006 in R. Wahyudi, 2013, Research
Design: Diagnostic of the causes of state loss in the administrative system collection of non-tax incomes, forestry and min-ing (Studi Diagnostik Penyebab Kehilangan Negara dari Sistem Administrasi Koleksi PNBP Kehutanan dan Pertambangan), Article 33, Jakarta.
29 R. Wahyudi, 2013, ibid.
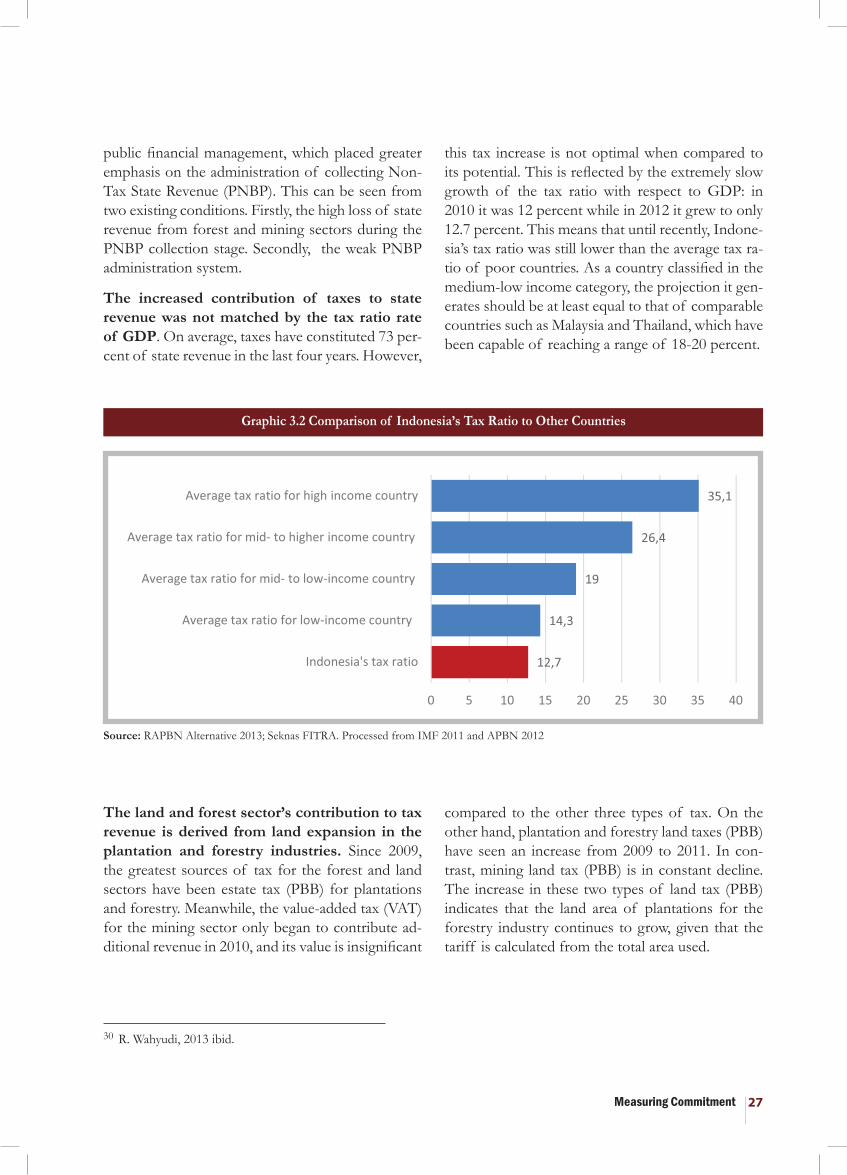
Measuring Commitment 27
30 R. Wahyudi, 2013 ibid.
Graphic 3.2 Comparison of Indonesia’s Tax Ratio to Other Countries
Source: RAPBN Alternative 2013; Seknas FITRA. Processed from IMF 2011 and APBN 2012
public financial management, which placed greater emphasis on the administration of collecting Non-Tax State Revenue (PNBP). This can be seen from two existing conditions. Firstly, the high loss of state revenue from forest and mining sectors during the PNBP collection stage. Secondly, the weak PNBP administration system.
The increased contribution of taxes to state revenue was not matched by the tax ratio rate of GDP. On average, taxes have constituted 73 per-cent of state revenue in the last four years. However,
The land and forest sector’s contribution to tax revenue is derived from land expansion in the plantation and forestry industries. Since 2009, the greatest sources of tax for the forest and land sectors have been estate tax (PBB) for plantations and forestry. Meanwhile, the value-added tax (VAT) for the mining sector only began to contribute ad-ditional revenue in 2010, and its value is insignificant
this tax increase is not optimal when compared to its potential. This is reflected by the extremely slow growth of the tax ratio with respect to GDP: in 2010 it was 12 percent while in 2012 it grew to only 12.7 percent. This means that until recently, Indone-sia’s tax ratio was still lower than the average tax ra-tio of poor countries. As a country classified in the medium-low income category, the projection it gen-erates should be at least equal to that of comparable countries such as Malaysia and Thailand, which have been capable of reaching a range of 18-20 percent.
compared to the other three types of tax. On the other hand, plantation and forestry land taxes (PBB) have seen an increase from 2009 to 2011. In con-trast, mining land tax (PBB) is in constant decline. The increase in these two types of land tax (PBB) indicates that the land area of plantations for the forestry industry continues to grow, given that the tariff is calculated from the total area used.
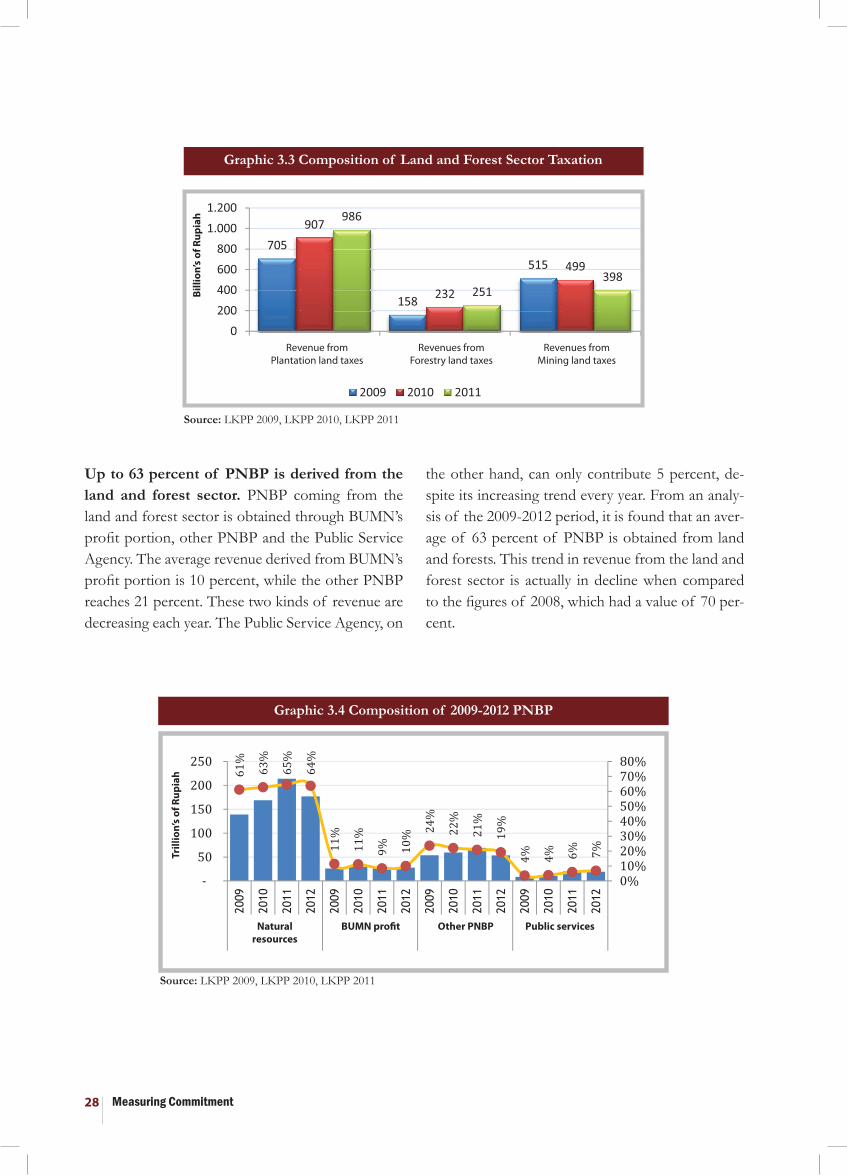
Measuring Commitment28
Graphic 3.3 Composition of Land and Forest Sector Taxation
Graphic 3.4 Composition of 2009-2012 PNBP
Source: LKPP 2009, LKPP 2010, LKPP 2011
Source: LKPP 2009, LKPP 2010, LKPP 2011
Up to 63 percent of PNBP is derived from the land and forest sector. PNBP coming from the land and forest sector is obtained through BUMN’s profit portion, other PNBP and the Public Service Agency. The average revenue derived from BUMN’s profit portion is 10 percent, while the other PNBP reaches 21 percent. These two kinds of revenue are decreasing each year. The Public Service Agency, on
the other hand, can only contribute 5 percent, de-spite its increasing trend every year. From an analy-sis of the 2009-2012 period, it is found that an aver-age of 63 percent of PNBP is obtained from land and forests. This trend in revenue from the land and forest sector is actually in decline when compared to the figures of 2008, which had a value of 70 per-cent.
Revenue fromPlantation land taxes
Revenues fromForestry land taxes
Revenues fromMining land taxes
Billi
on’s
of R
upia
h
Trill
ion’
s of
Rup
iah
Naturalresources
BUMN profit Other PNBP Public services
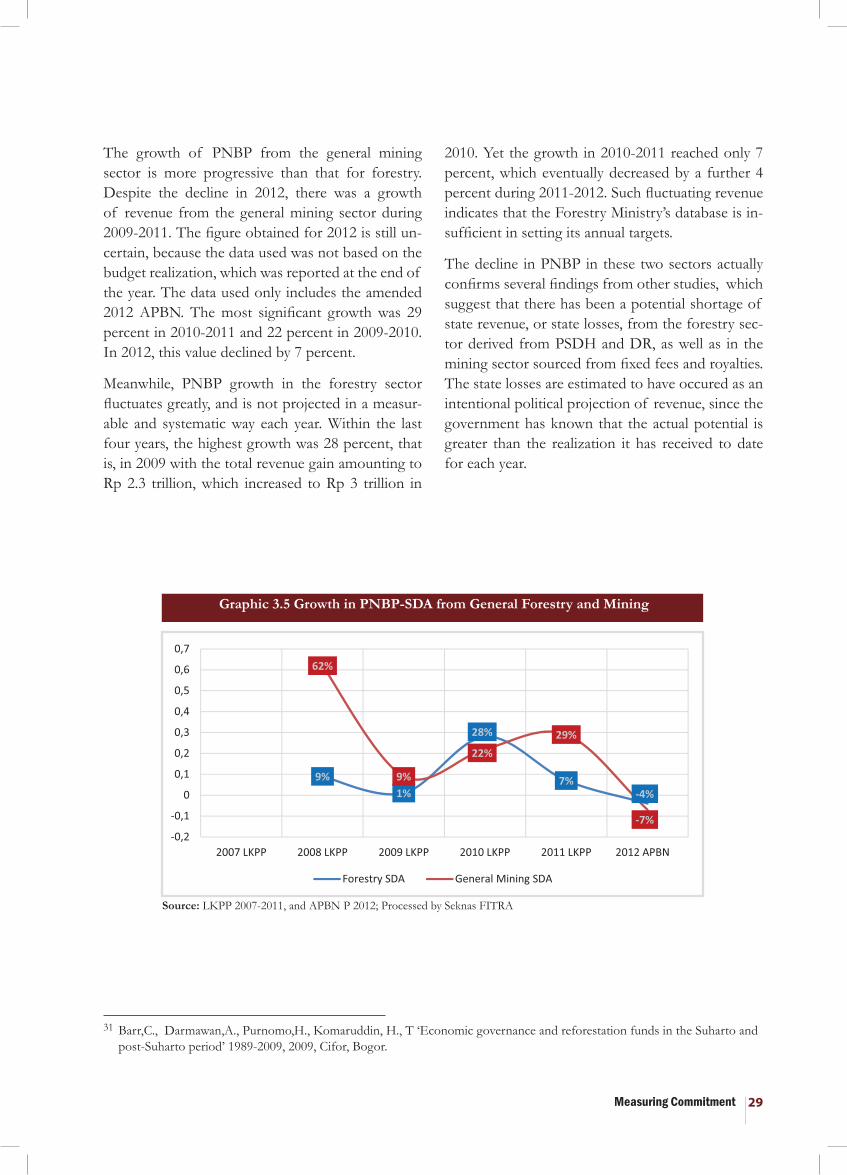
Measuring Commitment 29
Graphic 3.5 Growth in PNBP-SDA from General Forestry and Mining
Source: LKPP 2007-2011, and APBN P 2012; Processed by Seknas FITRA
The growth of PNBP from the general mining sector is more progressive than that for forestry. Despite the decline in 2012, there was a growth of revenue from the general mining sector during 2009-2011. The figure obtained for 2012 is still un-certain, because the data used was not based on the budget realization, which was reported at the end of the year. The data used only includes the amended 2012 APBN. The most significant growth was 29 percent in 2010-2011 and 22 percent in 2009-2010. In 2012, this value declined by 7 percent.
Meanwhile, PNBP growth in the forestry sector fluctuates greatly, and is not projected in a measur-able and systematic way each year. Within the last four years, the highest growth was 28 percent, that is, in 2009 with the total revenue gain amounting to Rp 2.3 trillion, which increased to Rp 3 trillion in
31 Barr,C., Darmawan,A., Purnomo,H., Komaruddin, H., T ‘Economic governance and reforestation funds in the Suharto and post-Suharto period’ 1989-2009, 2009, Cifor, Bogor.
2010. Yet the growth in 2010-2011 reached only 7 percent, which eventually decreased by a further 4 percent during 2011-2012. Such fluctuating revenue indicates that the Forestry Ministry’s database is in-sufficient in setting its annual targets.
The decline in PNBP in these two sectors actually confirms several findings from other studies, which suggest that there has been a potential shortage of state revenue, or state losses, from the forestry sec-tor derived from PSDH and DR, as well as in the mining sector sourced from fixed fees and royalties. The state losses are estimated to have occured as an intentional political projection of revenue, since the government has known that the actual potential is greater than the realization it has received to date for each year.
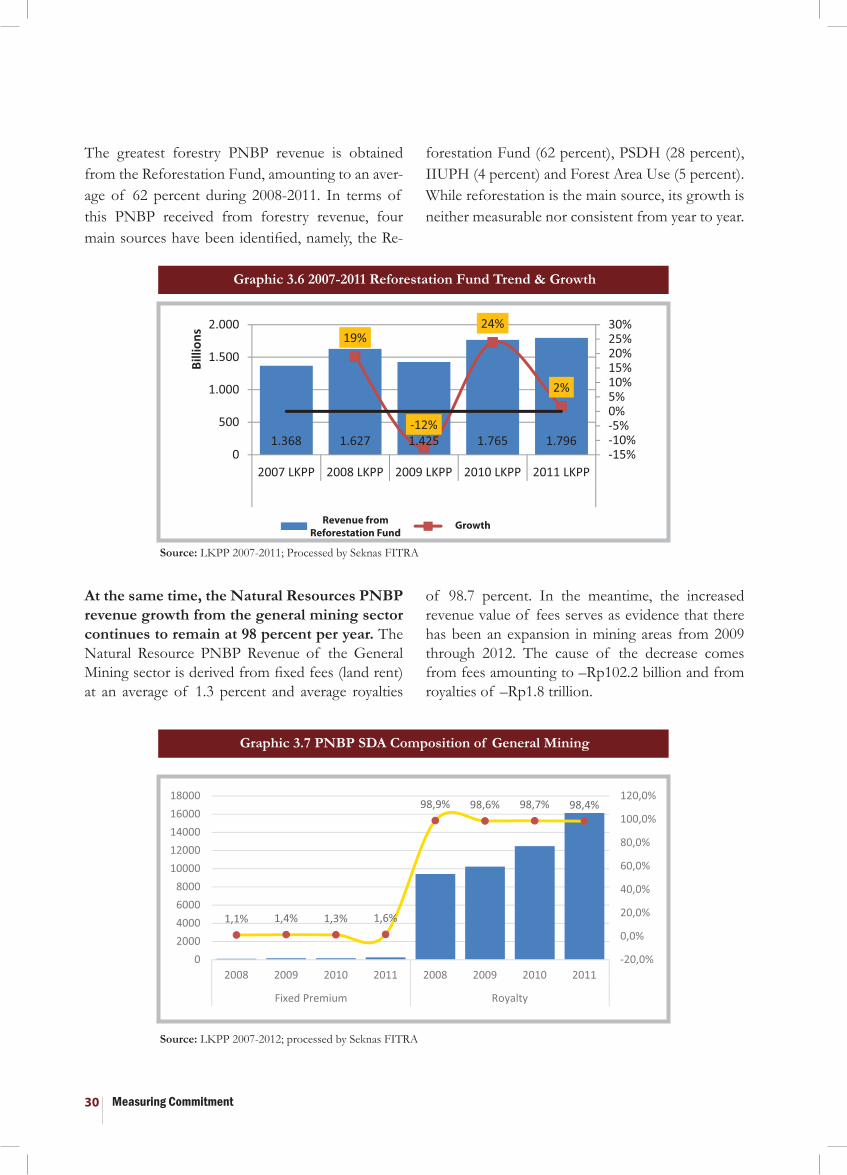
Measuring Commitment30
The greatest forestry PNBP revenue is obtained from the Reforestation Fund, amounting to an aver-age of 62 percent during 2008-2011. In terms of this PNBP received from forestry revenue, four main sources have been identified, namely, the Re-
At the same time, the Natural Resources PNBP revenue growth from the general mining sector continues to remain at 98 percent per year. The Natural Resource PNBP Revenue of the General Mining sector is derived from fixed fees (land rent) at an average of 1.3 percent and average royalties
forestation Fund (62 percent), PSDH (28 percent), IIUPH (4 percent) and Forest Area Use (5 percent). While reforestation is the main source, its growth is neither measurable nor consistent from year to year.
Graphic 3.6 2007-2011 Reforestation Fund Trend & Growth
Graphic 3.7 PNBP SDA Composition of General Mining
Source: LKPP 2007-2011; Processed by Seknas FITRA
Source: LKPP 2007-2012; processed by Seknas FITRA
of 98.7 percent. In the meantime, the increased revenue value of fees serves as evidence that there has been an expansion in mining areas from 2009 through 2012. The cause of the decrease comes from fees amounting to –Rp102.2 billion and from royalties of –Rp1.8 trillion.
Revenue fromReforestation Fund
Growth

Measuring Commitment 31
3.2. AN OVERVIEW OF STATE SPENDING AND LAND AND FOREST SECTOR SPENDING
State spending absorbed Rp 1,491.4 trillion of the budget in 2012. This figure was a nominal increase from the spending in the previous year, which amounted to Rp 1,295 trillion. This nominal in-crease was also followed by existing growth, particu-larly from 2009 to 2012. Such significant growth in the rate of state spending does not consider the real potential of annual state revenue which can never meet these needs. Unfortunately, the amount of state spending that is allocated to regions is only in the range of 30 percent, while the remainder is man-aged directly by the central government with ques-
Graphic 3.8 State Expenditure Growth, 2007-2012
Source: LKPP 2007-2012; processed by Seknas FITRA
tionable levels of targeting accuracy and efficiency.
The central government’s spending in 2012 reached Rp 1,010 trillion, which is 100 percent greater than that in 2007. This is influenced by some internal and external factors. External factors influencing the growth in the rate of government spending are the development of various macro-economic in-dicators, such as the crude oil price (ICP), that af-fect the subsidy spending, and the energy subsidy in particular. Internal factors include employee salary increases as well as increases in the number of civil servants due to increases in the number of non-structural institutions.

Measuring Commitment32
Subsidies and civil servant spending absorb the greatest allocation of state spending. In the 2009-2012 period, subsidies absorbed an average of 27 percent and employee spending an average of 14.2 percent of state spending. The subsidy expend-iture concerns spending on the oil and fuel (BBM) price subsidy program, which is increasing in value.
Spending to pay off interest on debt is allocated almost the same amount as that for infrastructure development. Capital spending and spending on debt interest payments are approximately the same, at around 12-14 percent. Capital spending is allo-cated to fund construction and repair of infrastruc-ture such as roads, bridges, markets and so forth. With such figures, it is quite clear that spending on foreign debt payments is proportional to that on in-frastructure interests. It is indeed ironic when we see the amount of spending on debt payments.
Box 3.1 Subsidy Spending in Indonesia
Subsidies are a component of state spending that have experienced a significant increase by as much as 151 percent in the period of the last six years.
In the period 2009-2012, realized subsidy spend-ing experienced an increase of Rp 208 trillion, or grew about 151 percent. From about Rp 138 trillion in 2009, or about 22 percent of the total state budget that year, it grew to Rp 346 trillion, or about 34 percent in the 2012 budget.
The spending subsidy is made up of energy sub-sidies and non-energy subsidies, with energy sub-sidies making up the greatest portion. Fuel sub-sidies experienced an increase of as much as Rp 166.8 trillion, or 370 percent, from Rp 45 trillion in 2009 to reach Rp 211.8 trillion in 2012. Mean-while, electricity subsidies also experienced an in-crease of 91 percent, that is, as much as Rp 49.5 trillion in 2009 to become Rp 94.5 trillion in
2012. (Source: Seknas FITRA 2012)
Graphic 3.9 Types of Central Government Spending
Source: LKPP 2009 - 2011 and APBN 2012; Processed by Seknas FITRA
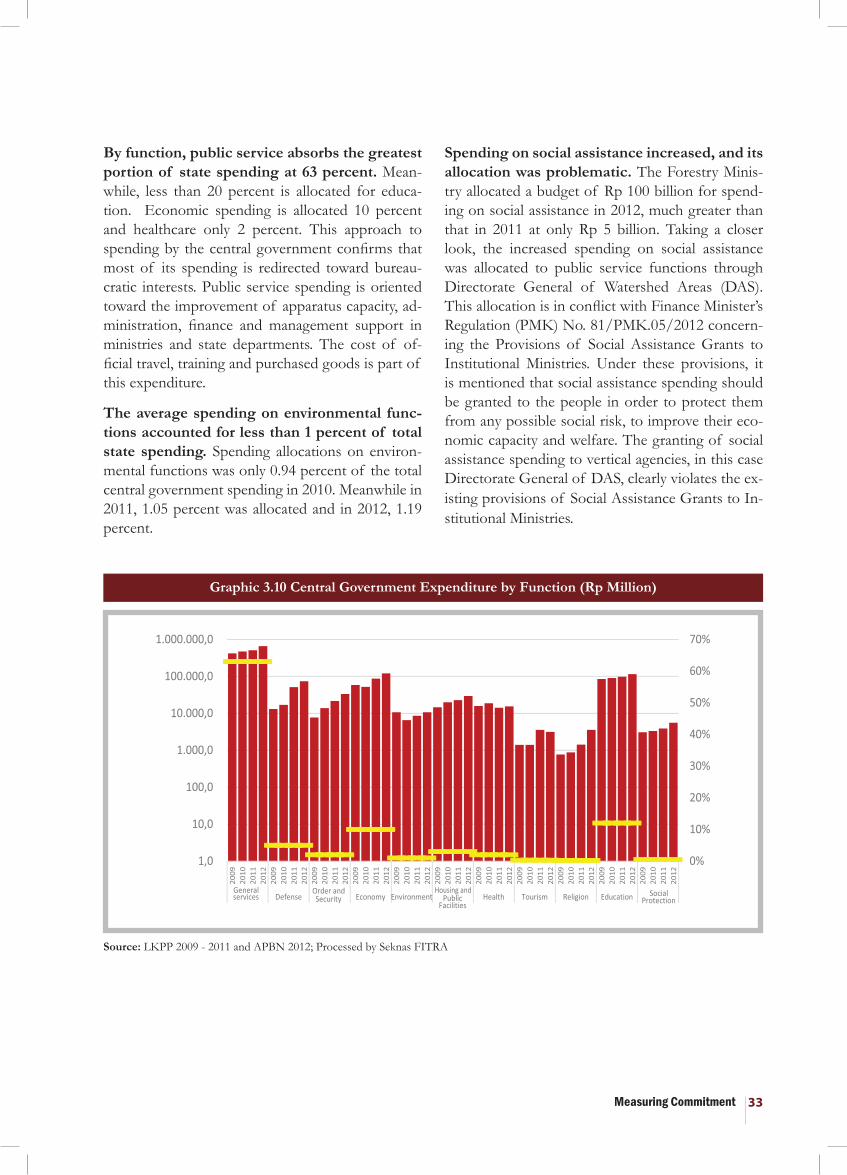
Measuring Commitment 33
By function, public service absorbs the greatest portion of state spending at 63 percent. Mean-while, less than 20 percent is allocated for educa-tion. Economic spending is allocated 10 percent and healthcare only 2 percent. This approach to spending by the central government confirms that most of its spending is redirected toward bureau-cratic interests. Public service spending is oriented toward the improvement of apparatus capacity, ad-ministration, finance and management support in ministries and state departments. The cost of of-ficial travel, training and purchased goods is part of this expenditure.
The average spending on environmental func-tions accounted for less than 1 percent of total state spending. Spending allocations on environ-mental functions was only 0.94 percent of the total central government spending in 2010. Meanwhile in 2011, 1.05 percent was allocated and in 2012, 1.19 percent.
Graphic 3.10 Central Government Expenditure by Function (Rp Million)
Source: LKPP 2009 - 2011 and APBN 2012; Processed by Seknas FITRA
Spending on social assistance increased, and its allocation was problematic. The Forestry Minis-try allocated a budget of Rp 100 billion for spend-ing on social assistance in 2012, much greater than that in 2011 at only Rp 5 billion. Taking a closer look, the increased spending on social assistance was allocated to public service functions through Directorate General of Watershed Areas (DAS). This allocation is in conflict with Finance Minister’s Regulation (PMK) No. 81/PMK.05/2012 concern-ing the Provisions of Social Assistance Grants to Institutional Ministries. Under these provisions, it is mentioned that social assistance spending should be granted to the people in order to protect them from any possible social risk, to improve their eco-nomic capacity and welfare. The granting of social assistance spending to vertical agencies, in this case Directorate General of DAS, clearly violates the ex-isting provisions of Social Assistance Grants to In-stitutional Ministries.
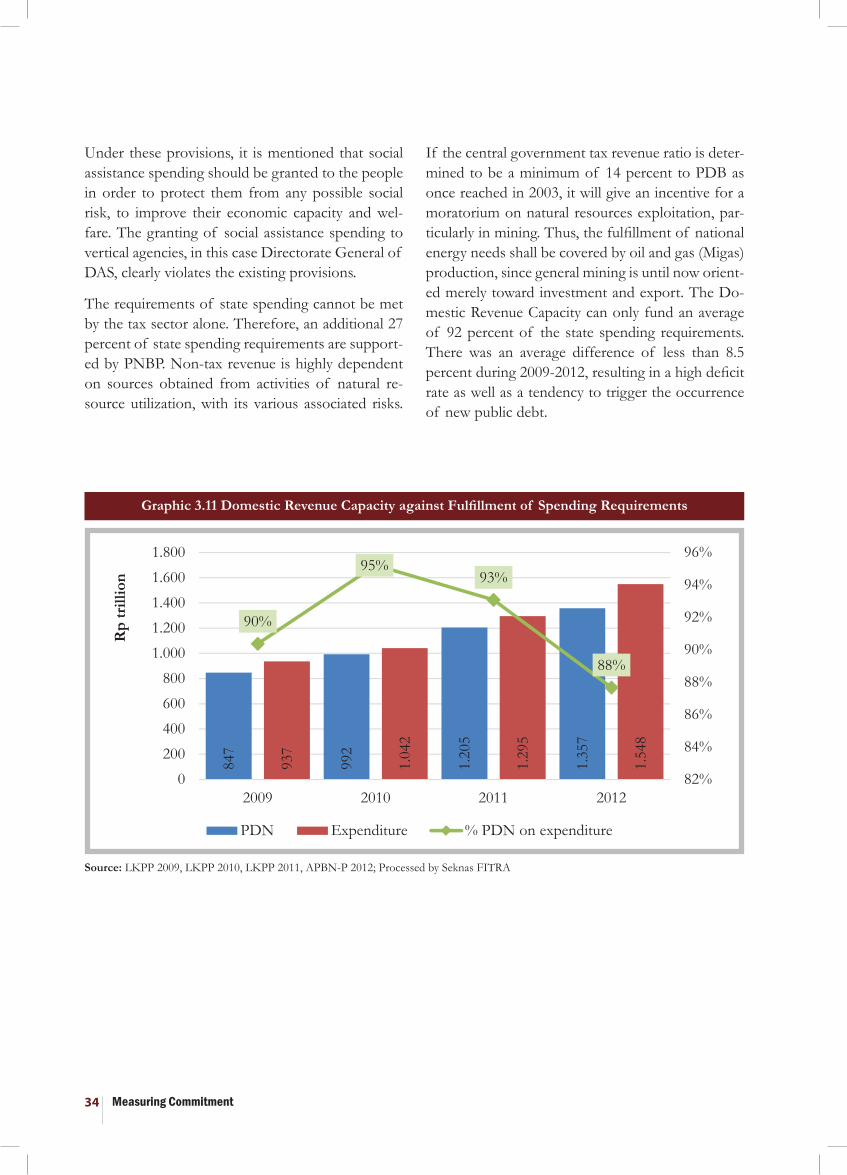
Measuring Commitment34
Under these provisions, it is mentioned that social assistance spending should be granted to the people in order to protect them from any possible social risk, to improve their economic capacity and wel-fare. The granting of social assistance spending to vertical agencies, in this case Directorate General of DAS, clearly violates the existing provisions.
The requirements of state spending cannot be met by the tax sector alone. Therefore, an additional 27 percent of state spending requirements are support-ed by PNBP. Non-tax revenue is highly dependent on sources obtained from activities of natural re-source utilization, with its various associated risks.
If the central government tax revenue ratio is deter-mined to be a minimum of 14 percent to PDB as once reached in 2003, it will give an incentive for a moratorium on natural resources exploitation, par-ticularly in mining. Thus, the fulfillment of national energy needs shall be covered by oil and gas (Migas) production, since general mining is until now orient-ed merely toward investment and export. The Do-mestic Revenue Capacity can only fund an average of 92 percent of the state spending requirements. There was an average difference of less than 8.5 percent during 2009-2012, resulting in a high deficit rate as well as a tendency to trigger the occurrence of new public debt.
Graphic 3.11 Domestic Revenue Capacity against Fulfillment of Spending Requirements
Source: LKPP 2009, LKPP 2010, LKPP 2011, APBN-P 2012; Processed by Seknas FITRA
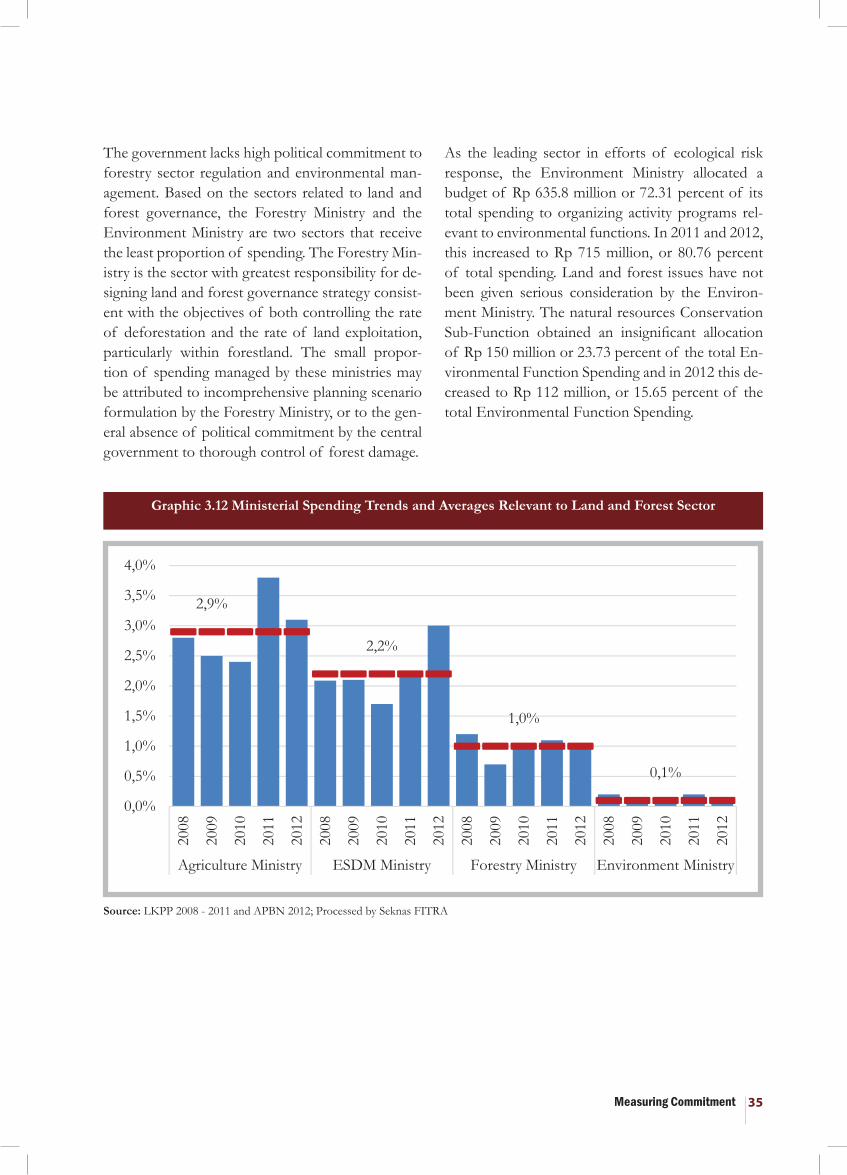
Measuring Commitment 35
The government lacks high political commitment to forestry sector regulation and environmental man-agement. Based on the sectors related to land and forest governance, the Forestry Ministry and the Environment Ministry are two sectors that receive the least proportion of spending. The Forestry Min-istry is the sector with greatest responsibility for de-signing land and forest governance strategy consist-ent with the objectives of both controlling the rate of deforestation and the rate of land exploitation, particularly within forestland. The small propor-tion of spending managed by these ministries may be attributed to incomprehensive planning scenario formulation by the Forestry Ministry, or to the gen-eral absence of political commitment by the central government to thorough control of forest damage.
Graphic 3.12 Ministerial Spending Trends and Averages Relevant to Land and Forest Sector
Source: LKPP 2008 - 2011 and APBN 2012; Processed by Seknas FITRA
As the leading sector in efforts of ecological risk response, the Environment Ministry allocated a budget of Rp 635.8 million or 72.31 percent of its total spending to organizing activity programs rel-evant to environmental functions. In 2011 and 2012, this increased to Rp 715 million, or 80.76 percent of total spending. Land and forest issues have not been given serious consideration by the Environ-ment Ministry. The natural resources Conservation Sub-Function obtained an insignificant allocation of Rp 150 million or 23.73 percent of the total En-vironmental Function Spending and in 2012 this de-creased to Rp 112 million, or 15.65 percent of the total Environmental Function Spending.
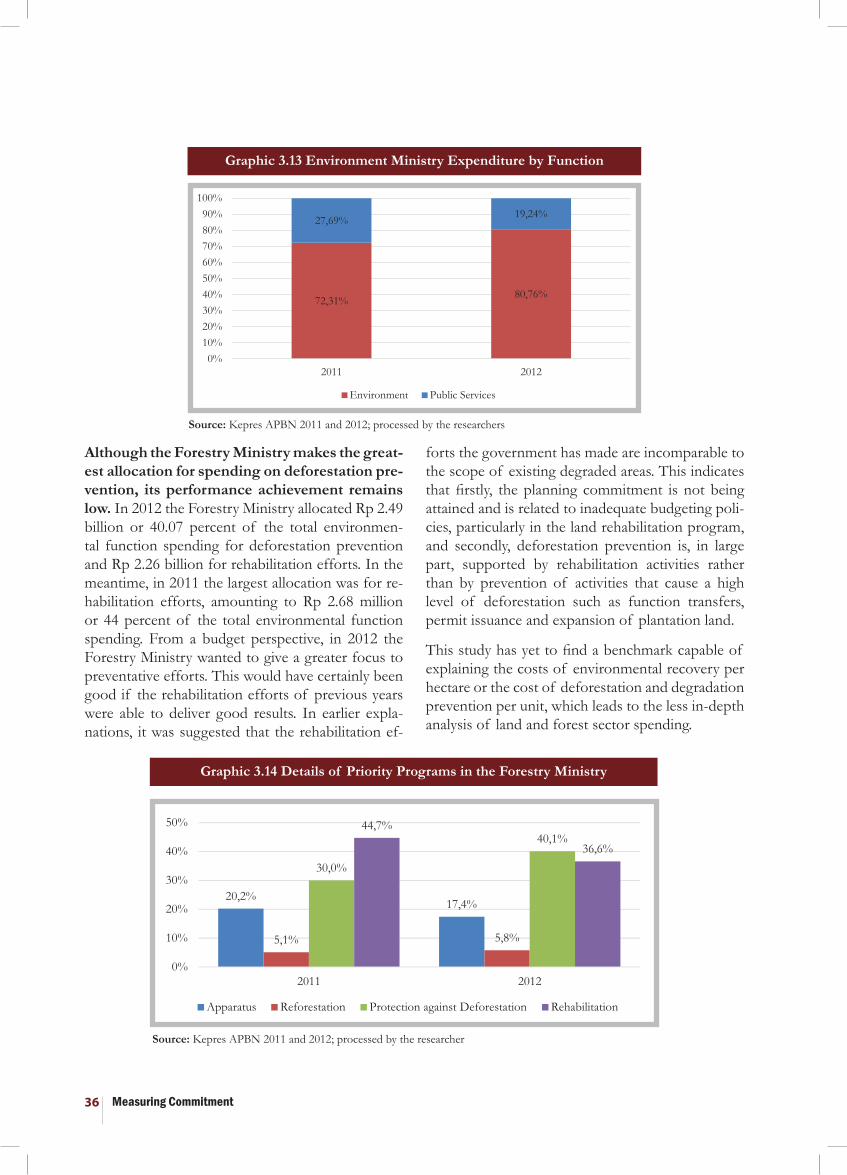
Measuring Commitment36
Although the Forestry Ministry makes the great-est allocation for spending on deforestation pre-vention, its performance achievement remains low. In 2012 the Forestry Ministry allocated Rp 2.49 billion or 40.07 percent of the total environmen-tal function spending for deforestation prevention and Rp 2.26 billion for rehabilitation efforts. In the meantime, in 2011 the largest allocation was for re-habilitation efforts, amounting to Rp 2.68 million or 44 percent of the total environmental function spending. From a budget perspective, in 2012 the Forestry Ministry wanted to give a greater focus to preventative efforts. This would have certainly been good if the rehabilitation efforts of previous years were able to deliver good results. In earlier expla-nations, it was suggested that the rehabilitation ef-
72,31% 80,76%
27,69% 19,24%
0% 10% 20% 30% 40% 50% 60% 70% 80% 90%
100%
2011 2012
Environment Public Services
Graphic 3.13 Environment Ministry Expenditure by Function
Graphic 3.14 Details of Priority Programs in the Forestry Ministry
forts the government has made are incomparable to the scope of existing degraded areas. This indicates that firstly, the planning commitment is not being attained and is related to inadequate budgeting poli-cies, particularly in the land rehabilitation program, and secondly, deforestation prevention is, in large part, supported by rehabilitation activities rather than by prevention of activities that cause a high level of deforestation such as function transfers, permit issuance and expansion of plantation land.
This study has yet to find a benchmark capable of explaining the costs of environmental recovery per hectare or the cost of deforestation and degradation prevention per unit, which leads to the less in-depth analysis of land and forest sector spending.
Source: Kepres APBN 2011 and 2012; processed by the researchers
Source: Kepres APBN 2011 and 2012; processed by the researcher
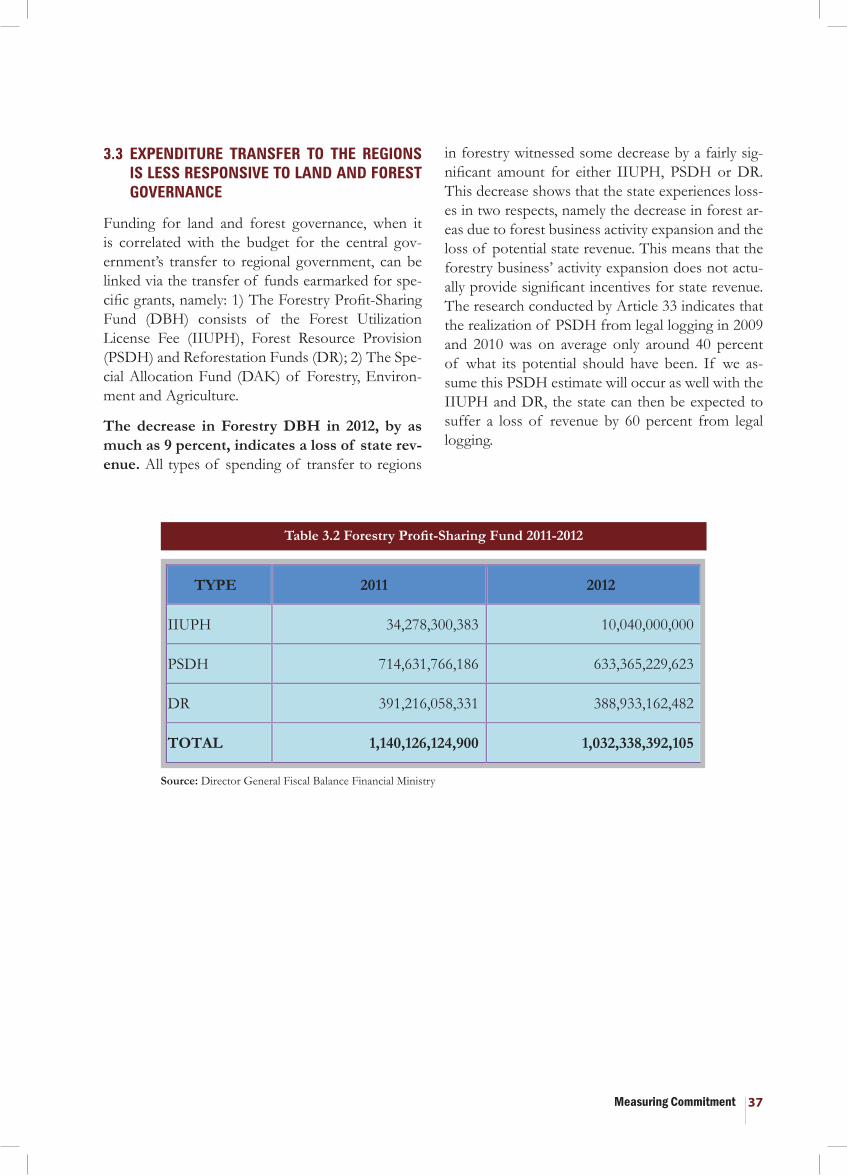
Measuring Commitment 37
3.3 EXPENDITURE TRANSFER TO THE REGIONS IS LESS RESPONSIVE TO LAND AND FOREST GOVERNANCE
Funding for land and forest governance, when it is correlated with the budget for the central gov-ernment’s transfer to regional government, can be linked via the transfer of funds earmarked for spe-cific grants, namely: 1) The Forestry Profit-Sharing Fund (DBH) consists of the Forest Utilization License Fee (IIUPH), Forest Resource Provision (PSDH) and Reforestation Funds (DR); 2) The Spe-cial Allocation Fund (DAK) of Forestry, Environ-ment and Agriculture.
The decrease in Forestry DBH in 2012, by as much as 9 percent, indicates a loss of state rev-enue. All types of spending of transfer to regions
Table 3.2 Forestry Profit-Sharing Fund 2011-2012
Source: Director General Fiscal Balance Financial Ministry
in forestry witnessed some decrease by a fairly sig-nificant amount for either IIUPH, PSDH or DR. This decrease shows that the state experiences loss-es in two respects, namely the decrease in forest ar-eas due to forest business activity expansion and the loss of potential state revenue. This means that the forestry business’ activity expansion does not actu-ally provide significant incentives for state revenue. The research conducted by Article 33 indicates that the realization of PSDH from legal logging in 2009 and 2010 was on average only around 40 percent of what its potential should have been. If we as-sume this PSDH estimate will occur as well with the IIUPH and DR, the state can then be expected to suffer a loss of revenue by 60 percent from legal logging.
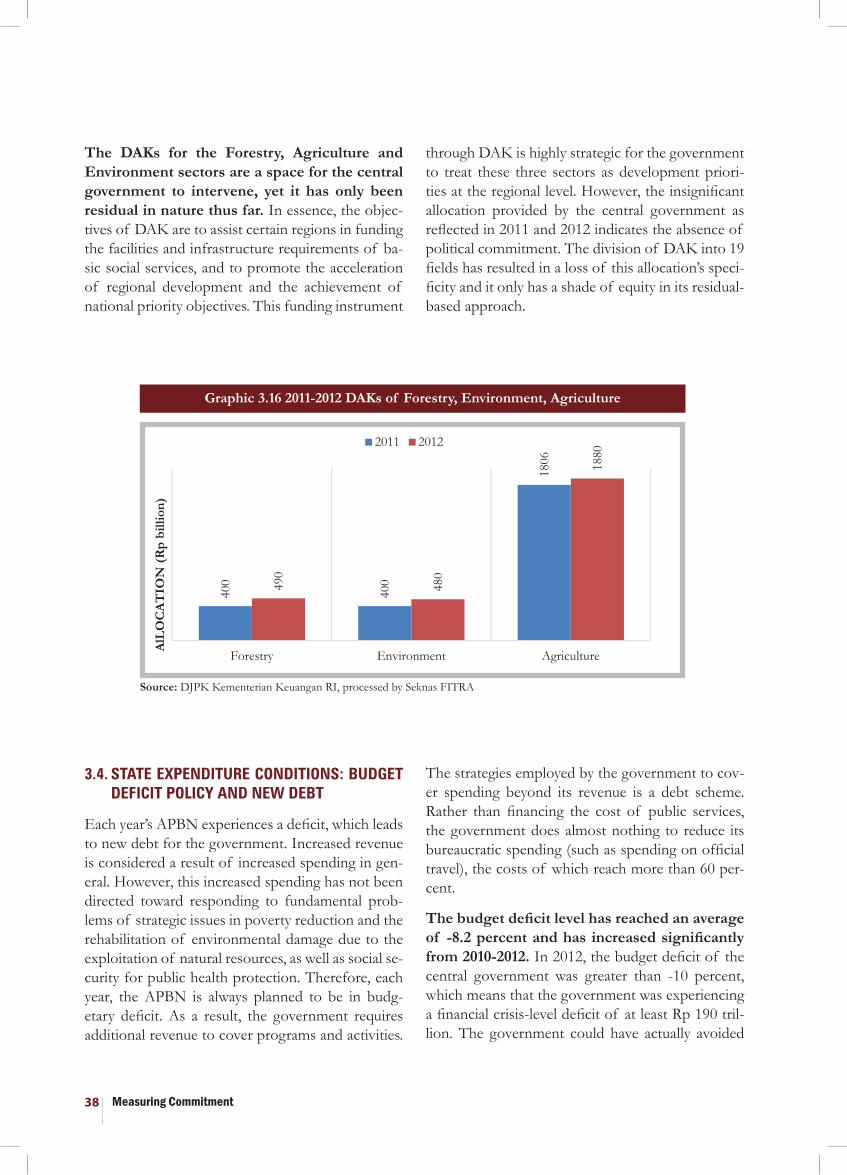
Measuring Commitment38
The DAKs for the Forestry, Agriculture and Environment sectors are a space for the central government to intervene, yet it has only been residual in nature thus far. In essence, the objec-tives of DAK are to assist certain regions in funding the facilities and infrastructure requirements of ba-sic social services, and to promote the acceleration of regional development and the achievement of national priority objectives. This funding instrument
through DAK is highly strategic for the government to treat these three sectors as development priori-ties at the regional level. However, the insignificant allocation provided by the central government as reflected in 2011 and 2012 indicates the absence of political commitment. The division of DAK into 19 fields has resulted in a loss of this allocation’s speci-ficity and it only has a shade of equity in its residual-based approach.
3.4. STATE EXPENDITURE CONDITIONS: BUDGET DEFICIT POLICY AND NEW DEBT
Each year’s APBN experiences a deficit, which leads to new debt for the government. Increased revenue is considered a result of increased spending in gen-eral. However, this increased spending has not been directed toward responding to fundamental prob-lems of strategic issues in poverty reduction and the rehabilitation of environmental damage due to the exploitation of natural resources, as well as social se-curity for public health protection. Therefore, each year, the APBN is always planned to be in budg-etary deficit. As a result, the government requires additional revenue to cover programs and activities.
Graphic 3.16 2011-2012 DAKs of Forestry, Environment, Agriculture
Source: DJPK Kementerian Keuangan RI, processed by Seknas FITRA
The strategies employed by the government to cov-er spending beyond its revenue is a debt scheme. Rather than financing the cost of public services, the government does almost nothing to reduce its bureaucratic spending (such as spending on official travel), the costs of which reach more than 60 per-cent.
The budget deficit level has reached an average of -8.2 percent and has increased significantly from 2010-2012. In 2012, the budget deficit of the central government was greater than -10 percent, which means that the government was experiencing a financial crisis-level deficit of at least Rp 190 tril-lion. The government could have actually avoided
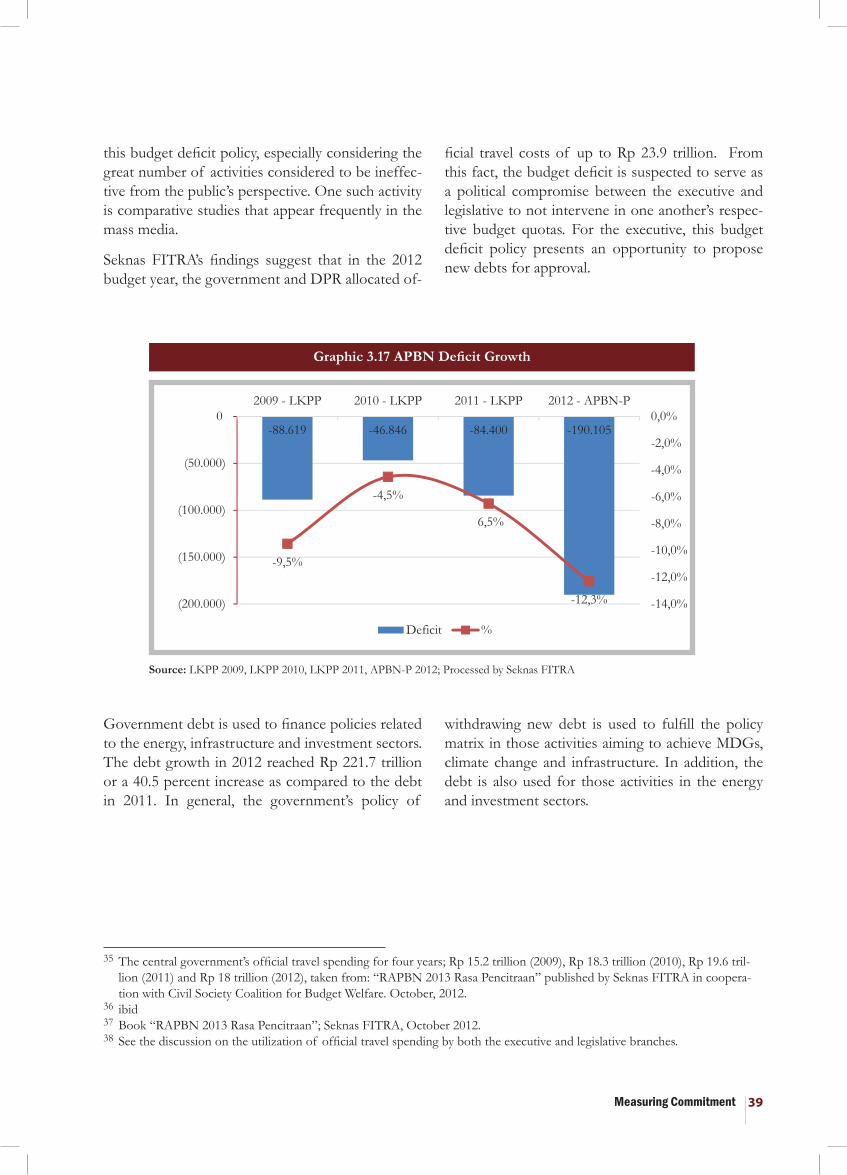
Measuring Commitment 39
Graphic 3.17 APBN Deficit Growth
Source: LKPP 2009, LKPP 2010, LKPP 2011, APBN-P 2012; Processed by Seknas FITRA
this budget deficit policy, especially considering the great number of activities considered to be ineffec-tive from the public’s perspective. One such activity is comparative studies that appear frequently in the mass media.
Seknas FITRA’s findings suggest that in the 2012 budget year, the government and DPR allocated of-
ficial travel costs of up to Rp 23.9 trillion. From this fact, the budget deficit is suspected to serve as a political compromise between the executive and legislative to not intervene in one another’s respec-tive budget quotas. For the executive, this budget deficit policy presents an opportunity to propose new debts for approval.
Government debt is used to finance policies related to the energy, infrastructure and investment sectors. The debt growth in 2012 reached Rp 221.7 trillion or a 40.5 percent increase as compared to the debt in 2011. In general, the government’s policy of
withdrawing new debt is used to fulfill the policy matrix in those activities aiming to achieve MDGs, climate change and infrastructure. In addition, the debt is also used for those activities in the energy and investment sectors.
35 The central government’s official travel spending for four years; Rp 15.2 trillion (2009), Rp 18.3 trillion (2010), Rp 19.6 tril-lion (2011) and Rp 18 trillion (2012), taken from: “RAPBN 2013 Rasa Pencitraan” published by Seknas FITRA in coopera-tion with Civil Society Coalition for Budget Welfare. October, 2012.
36 ibid37 Book “RAPBN 2013 Rasa Pencitraan”; Seknas FITRA, October 2012.38 See the discussion on the utilization of official travel spending by both the executive and legislative branches.

Measuring Commitment40
The increasing amount of debt is threatens continued deforestation and land and forest degradation. One of the strategies the government can employ to suppress its debt is by exploring non-oil and gas PNBP, for example from PNBP in the forestry, mining and plantation sectors. The increas-ing non-oil and gas PNBP has become an important indication that this policy will surely require land ex-
pansion which can be obtained from, among other things, land function transfer. This strategy, there-fore, certainly poses a threat of increasing the de-forestation and degradation rates. In the meantime, other strategies such as improving the efficiency and effectiveness of state spending, is an option that most likely will be rejected by both the executive and the legislative branches.
Graphic 3.18 2009-2013 Average Debt Growth
Source: processed from 2009-2012 APBN
Measuring Commitment 41
4.1 CONCLUSION
The Indonesian government’s commitment to re-duce carbon emissions by 26 percent by 2020 has not been followed up with consistent planning poli-cies. As a result, this commitment appears to be un-attainable. Despite the many institutional, resource and planning policy packages directed at carbon emission mitigation, this initiative has had a less than optimal impact due to the lack of consistency in planning in line with commitment goals, such as the mitigation of carbon emissions. The research in-dicates a number of findings which depict planning policies that are inconsistent with the government’s commitment to mitigate carbon emissions, such as:
Firstly, the carbon emission mitigation tar-gets which have been translated into RAN-GRK and the RPJMN have not been inte-grated into other planning policies. Tackling deforestation and degradation as the greatest contributors to carbon emissions has not been explicitly set as a performance target by the gov-ernment. Efforts to reduce deforestation and degradation have been interpreted as merely a matter of forest fire control. The deforestation and degradation issues resulting from function transfer, felling and corruption have not en-tered mainstream planning documents. On the other hand, government performance targets related to efforts to mitigate carbon emissions are formulated with different figures. RPJMN as the parent document for reference in the im-plementation of programs is not referred to in the implementation of programs or the setting of a performance target. There has even been an attempt to lower the performance target that was already set in the degraded land rehabilita-tion program.
At the same time, the planning policy does not attempt to respond earnestly to existing prob-lems. The degraded land rehabilitation pro-gram, for example, should be the government’s responsibility in dealing with degraded land of an area reaching almost 82 million Ha. The gov-ernment only plans to rehabilitate 3 percent of this in five years. The same also applies to the provision of publicly organized areas through village forest and community forest schemes.
Secondly, government planning policy is ac-tually pro-deforestation and degradation. In practice, the government continues to approve forest function transfer that will cause potential deforestation of 11.6 million Ha. Furthermore, the area of forestland under use permits has grown significantly. The principal approval of forest area use has reached more than 200,000 Ha within four years.
The moratorium policies are therefore consid-ered less than optimal in supporting the efforts of reducing deforestation and degradation. In addition to the area of forestland under pro-tection only covering approximately 30 percent of existing forests, the moratorium also fails to prevent the release of more forestland. During this policy period, forests shrunk by 4.3 million Ha. It is suspected that the practice of back-dating in the issuance of permits has become a new strategy since the moratorium was intro-duced, as was proven in cases of mining. The moratorium policies have also given insufficient consideration to law enforcement efforts.
Thirdly, government performance in the ef-fort to mitigate carbon emissions is lower than what was planned. The government
CONCLUSION AND RECOMMENDATIONS
PART IV
Measuring Commitment42
plans a target of rehabilitating 2.5 million Ha of degraded land in five years, but it has achieved only around 70 percent of that, that is, a total of 1.6 million Ha. In fact, the set performance target of 2.5 million Ha is deemed to be far be-low optimum capacity. With the existing per-formance target, the rehabilitation of degraded land would take 163 years to accomplish. This is far from expectations and from the govern-ment’s commitment to mitigate carbon emis-sions. The same is also the case in the provision of public access to forest governance space through HD, Hkm and HTR schemes, which are still far from the existing targets and have a tendency to be discriminative. The process of proposing a reservation area for one HD took more than three years and was not transparent, and hence inconsistent with existing Forestry Ministry regulations. Meanwhile, the realization of HKm, HD and HTR area provisions has al-ways been below the RPJMN targets.
Fourthly, the growth policies fail to gener-ate green-growth development scenarios. The growth policies have increased forestland conversion by 9.4 million Ha. At the same time, the oil palm development policy is understood as an expansion of land area, rather than an im-provement of productivity. Therefore, the cur-rent area of oil palm land has pushed aside that of agriculture. This is not just a threat to land degradation, but also a threat to state economic structure, in which the agricultural sector is de-teriorating.
Fifthly, the existing planning policies are not equipped with adequate budget poli-cies. The government’s target to independently finance its efforts at emissions mitigation can only be fulfilled at approximately 50 percent. It seems difficult for the government to increase the existing budget since other mandatory spending it should fulfill remains below its com-mitment, such as the allocation of 20 percent of the budget for education as mandated by the Constitution. The same goes for the healthcare sector.
Meanwhile, the budget allocation at the regional level is far worse. Despite the provision of a refor-estation funding scheme as an effort to fund refor-estation, its absorption is very low. The reforestation fund utilization mechanism is deemed a source of the problem. The next thing is that the allocation in the local budget to finance environmental functions is notably small. There are hardly any programs to prevent deforestation and degradation. The alloca-tion for monitoring the activities from which the increase in emission derives is limited. The great authority of the Forestry Ministry has failed to con-solidate the objectives of emissions mitigation at the regional level.
Measuring Commitment 43
Orientation of national budget policy is less than responsive to efforts at reducing defor-estation and degradation. Instead, such budget policies pose a threat of increased deforesta-tion and degradation. As a result, the government commitment to mitigate carbon emissions is merely an illusion. The continued dependence of budget policy on the land and forest sector for its revenue is not followed up with a spending allocation to adequately prevent and recover deforestation and degradation. The threat of increased deforestation and degradation will become real when state fund-ing that depends on debts also turns the land and forest sector into a cure-all to cover the Indonesian government’s debts.
In terms of revenue, the land and forest sec-tor’s contribution to state revenue is small, amounting to around 2.5 percent. This small contribution is disproportionate to the damage that has resulted. Low state revenue projections and weak public financial management has caused a potential loss of state revenue. Mean-while, the land and forest sector’s contributions to state revenue is derived from the expansion of plantations and forestry industries. The min-ing sector also contributes quite a large amount to PNBP.
In terms of state expenditure, the orienta-tion of state spending policy is still directed toward bureaucratic interests and problematic policies. On the other hand, state spending on environmental recovery and on reducing the rates of deforestation and degradation as mani-fested in spending on environmental functions
is far lower than spending on defense, public order and security functions. Environmental spending is only 1 percent of total state spend-ing. Meanwhile, bureaucracy and public servic-es represent 63 percent. Spending on subsidies and civil servants takes up the largest portion of state spending. Special Allocation Funds (DAK) for forestry, agriculture and the environment are residual and unsustainable in funding the spending needs of environmental recovery and reducing deforestation and degradation. Spend-ing on social assistance by the Forestry Ministry is problematic. Furthermore, the absence of a benchmark to define the cost of environmental recovery per hectare, or the unit cost of pre-venting deforestation and degradation, makes further analysis difficult.
In terms of financing, the budget deficit poli-cy that intentionally leads to new debt poses the threat of increased deforestation and degrada-tion. The strategy of increasing exploration of non-oil and gas sources of non-tax state rev-enue (PNBP) to handle debt and budget defi-cit clearly threatens an increase in deforestation and degradation.
Measuring Commitment44
4.2 RECOMMENDATIONS
Based on the findings above, this study is able to provide some input to various parties related to ef-forts of improving policies to achieve commitments to better mitigate emissions, and particularly to help lower the rate of deforestation and degradation.
For the central government, the researchers rec-ommend:
1. Increasing levels of accountability for its performance to ensure that development goals (for mitigation of emissions and lower-ing the rate of deforestation and degradation) are consistent with the planning of ministries and institutions. This can be done by:
• Improving the evaluation scheme of the Government Agency Performance Ac-countability Reports (LAKIP), which also includes RPJMN target achievement. Usu-ally, LAKIP only refers to strategic plan documents or work plans. This in turn causes the commitment generated through the RPJMN to be poorly captured in its evaluation scheme.
• Disclosing development progress to the public, particularly in relation to the efforts of mitigating emissions, deforestation and degradation.
2. Strengthening the moratorium policy to respond to existing social-political condi-tions. The 2014 General Election has the po-tential to change the commitment and initiation schemes the government has built, especially the moratorium policies. The moratorium poli-cies are believed to be an instrument capable of inhibiting the deforestation and degradation rate. Since the moratorium policies are only in effect until the end of President Susilo Bam-bang Yudhoyono’s administration, it seems there are still many pending agendas. Under this state of political affairs, the researchers recom-mend:
• Escalating the moratorium policy status from a Presidential Instruction to a strong-er policy platform to ensure its continua-tion after a change in office. The Presi-dential Regulation scheme is an adequate alternative for the time being.
• The moratorium policy scheme should be expanded by involving law enforcement in cases of administrative violations.
3. Increasing the role of local government in coping with conditions of deforestation and degradation that still have not yet im-proved. While the authority over land and for-est governance is still great at the central level, the role of the local government needs to be strengthened in efforts to mitigate the rate of deforestation and degradation. Schemes for in-creasing the local government’s role include:
• Devolving authority to regional govern-ments for implementing and optimizing performance targets, particularly with re-gard to accelerating the rehabilitation of degraded land and public accessibility to forest governance within HD, HKm and HTR schemes. While this method has not been tested for effectiveness in the min-ing and plantation sectors, in other sectors such as healthcare and education it is ac-knowledged to have been able to improve regional innovations in order to improve their public services and, of course, to help them achieve the Millennium Development Goals. Therefore, this issue needs to un-dergo more in-depth study with adequate reinforcement and support to accommo-date this scheme. What exactly needs to be devolved and how this is to be done are im-portant aspects requiring further study.
• Devolving power to regional governments should be followed up with fiscal policies in order to reinforce its implementation.
• Accelerating the demarcation of forestland boundaries in order to provide legal cer-
Measuring Commitment 45
tainty and force to public activities. In addi-tion, this acceleration of boundary demar-cation can also help accelerate the process of issuing HKm, HD, and HTR permits.
4. Improve fiscal policy in an effort to slow down rates of deforestation and degrada-tion as a way to mitigate carbon emissions. Fiscal policy reform can be accomplished by:
• Improving the performance target in the tax ratio achievement of 14 percent with respect to GDP.
• Raising the tax and PNBP tariff for land-based industries. The current tax and PNBP tariff are deemed to be too low, leading to an increased motive for exploitation and exploration activities.
• Revising the central-local profit-sharing scheme in Law No. 33/2004 (particularly in the forestry, mining and plantation sec-tors) by commiting to provide an adequate allocation to mitigating deforestation and degradation.
• Revising the profit-sharing fund manage-ment policy of the reforestation fund (DBH DR) by giving more space for re-gions to develop their innovation schemes and better budget absorption.
• Lowering the state revenue target for plan-tation land expansion and forestry indus-tries.
5. Initiating the drafting of a pro-environ-ment budget statement, especially in the Land Use, Land-Use Change and Forestry (LULUCF sector). This statement would be part of the APBN document the government should prepare prior to approval of the APBN each year. The statement made should be based on a study conducted by parties competent in assessing environmental impact, including the synergy between APBN and relevant key poli-cies concerning the protection of natural re-sources.
For civil society, the researchers recommend:
1. Conducting studies related to budget policy for better land and forest governance both at the national and regional levels as a way to increase public debate on the issue. Studies on financing benchmarks for environmental recovery and the mitigation of deforestation and degradation also need to be followed up onn. Meanwhile, studies on the loss of state revenue in the land and forest sector still need to be conducted be-cause of the considerable amount of money being lost.
2. Civil society groups that work on issues of budget policy should support a stronger civil society movement for land and forest govern-ance, as part of strengthening Indonesian civil society in general.
3. Advocating for civil society to be involved in the process of preparing and monitoring budgets so that the rights and aspirations of communities can be adequately considered by governments when drafting budgets, including aspirations for the conservation of natural resources and pre-vention of deforestation.

Measuring Commitment46
Barr, C., Darmawan, A., Purnomo, H., Komaruddin, H., Tata Kelola Keuangan dan Dana Reboisasi selama periode Soeharto dan pasca Soeharto 1989-2009 (Financial Governance and Reforestation Funding in the Suharto and post-Suharto period 1989 – 2009), 2009, CIFOR, Bogor.
Cahyat, A, 2005, Perubahan Perundang-Undangan Desentralisasi, (Changes to Decentralisation Laws) Gov-ernance Brief, August No. 22, CIFOR, Bogor.
Direktorat Jenderal Planologi Kehutanan, 2011, Data and Information about Forest Uses 2011, Forestry Minister, Jakarta.
Dokumen Masterplan Percepatan dan Perluasan Pembangunan Ekonomi (MP3EI) (Masterplan document for the Acceleration and Expansion of Economic Development) 2011 – 2025, 2011, Kementerian Koordi-nator Bidang Perekonomian, Jakarta.
Erani Yustika, A., Farhan, Y., Setiawan, D., Darmawan, R., Waidl, A., Sucipto, Y., Maulana, M, 2012, Ran-cangan Anggaran Pendapatan dan Belanja Negara Alternatif (The Draft Budget of State Expenditures and Alternative Revenue) 2013, Seknas FITRA, Indonesia.
Farhan, Y. (dkk), October 2012. RAPBN 2013 Rasa Pencitraan. Seknas FITRA, Jakarta
Fowler, M., Abbott, P., Akroyd, S., Channon, J., and Dodd, S, 2011, Forest Sector Public Expenditure Re-views: Review and guidance note, Program on Forests (PROFOR), Washington DC.
Herawati, T, 2011, Hutan Tanaman Rakyat: Analisis Proses Perumusan Kebijakan dan Rancang Bangun Model Konseptual Kebijakan (Community-based forests: An analysis of the process of policy formulation and devising a conceptual policy model), IPB, Bogor
Hansen et al, 2013, High resolution Global Maps of 21st Century Forest Cover Change, World Resource Institute, Indonesia
ICEL, Huma, Telapak, WRI, 2013, Potret Pelaksanaan Tata Kelola Hutan: Studi Mendalam di Propinsi Kalimantan Tengah dan Nusa Tenggara Barat, (An Overview of Forest Governance: An Indepth Study of Central Kalimantan and West Nusa Tenggara), Jakarta
Presidential Instruction No. 10/2011 concerning the Postponement of New Permit Issuance and revision of Primary Natural Forest and Peat Land Governance
Presidential Instruction No. 6 of 2013 concerning the Postponement of New Permit Issuance and revision of Primary Natural Forest and Peat Land Governance Sekretariat Kabinet Republik Indonesia, May 2013
Indonesia Corruption Watch (ICW), Greenomics Indonesia, Pungutan Usaha Kayu: Evolusi terhadap per-hitungan, pemungutan dan penggunaan pungutan usaha kayu kertas kerja (Timber Levy: The evolution towards counting, harvesting and the use of levy collection for timber paper work), No. 07, Indonesia Cor-ruption Watch (ICW) dan Greenomics Indonesia. Jakarta, Indonesia
Koalisi Masyarakat Sipil untuk APBN Kesejahteraan, Agustus 2012, RAPBN Alternatif tahun 2013: Menuju Anggaran Konstitusional, Jakarta.
Mumbunan, S., dan Wahyudi, R., 2013, Transparansi Penerimaan Negara Sektor Kehutanan (Transparency in Forestry Sector State Revenue). Jakarta: Article 33 Indonesia
Murdiyarso, D., Dewi, S., Lawrence, D. dan Seymour, F, 2011, Moratorium Hutan Indonesia: Batu Loncatan untuk Memperbaiki Tata Kelola Hutan (Indonesia’s Forest Moratorium: A Stepping stone to improving for-
Bibliography
Measuring Commitment 47
est and land governance). Working Paper 77. CIFOR, Bogor, Indonesia
Nasir, M., 2013, Utang Pemerintah: Peran dan Ancamannya terhadap APBN, Badan Kebijakan Fiskal, Ke-menterian Keuangan (Government debt: the role and threats to the state budget, Fiscal Ppolicy, Ministry of Finance), downloaded from www.fiskal.kemenkeu.go.id
Prayitno, Hadi, 2012, Kualitas Kebijakan Anggaran Sektor Hutan dan Lahan: Antara potensi besar penda-patan dan orientasi belanja Negara (The quality of Budget Policy in the Forest and Land Sector: the huge potential revenues and state spending). Presentation in Papua People Congress, Manokwari.
Seknas Fitra, 2012, Analisis Anggaran Daerah: Studi terhadap APBD 2008-2011 di 20 kabupaten/kota di 4 propinsi (Budget Analysis, A study of regional budgets 2008-11 in 20 districts / cities in 4 provinces), Seknas Fitra, Jakarta
Seknas Fitra., The Asia Foundation, 2013, Membongkar Harta Daerah: Kajian Analisis Anggaran 6 Kabu-paten dan 3 Propinsi di Indonesia dalam pengelolaan Hutan dan Lahan, (Uncovering Regional Wealth: An analysis of Budget Policies for Land and Forest Governance in 3 Provinces and 6 Districts in Indonesia), Seknas Fitra, Jakarta
Strategi Nasional REDD+ (National REDD+ Strategy), June 2012, Satuan Tugas Persiapan Kelembagaan REDD+ Indonesia (Indonesia’s Taskforce for REDD+ Institutional Preparedness), Jakarta, Indonesia
Rencana Pembangunan Jangka Menengah Nasional (RPJMN) (Medium Term Development Plan) 2010-2014
Rahman, Yustisia, 2013, Kerangka Acuan dan Studi Pelingkupan: Pengukuran Kondisi tata kelola pemerin-tahan yang baik di sector hutan dan lahan (Terms of Reference and study scoping: Measuring Conditions of Good Governance in the Forest and Land Sector). ICEL and Seknas FITRA, Jakarta
Statistik Kehutanan Indonesia 2011 (2011 Indonesian Forestry Statistics), July 2012, Indonesia’s Forestry Ministry, Jakarta.
Steni, Bernadius, Desentralisasi, Koordinasi Dan Partisipasi Masyarakat Dalam Pengelolaan Sumberdaya Alam Pasca Otonomi Daerah (Decentralisation, Coordination and Community Participation in the Manage-ment of Natural Resources in the Post Autonomy Era). Downloaded from www.huma.or.id on September 11, 2013
The Asia Foundation, 2011, Study on the Political economy of land use, land use change and forestry at the local level in indonesia, The Asia Foundation, Jakarta
Law Number 41 of 1999 Concerning Farming.
Law Number 26 of 2007 Concerning Spatial Zoning.
Law Number 24 of 2009 Concerning Mineral Mining and Coal.
Law Number 32 of 2009 Concerning Environment Protection and Governance.
Wahyudi, R., 2013, Desain Riset: Studi Diagnostik Penyebab Kehilangan Negara dari Sistem Administrasi Koleksi PNBP Kehutanan dan Pertambangan, (Research Design: A Diagnostic Study on the Causes of State Loss from Administrative Collections of non-tax incomes from forestry and mining), Article 33, Jakarta.

Measuring Commitment48

Measuring Commitment 49

Measuring Commitment50