behind the glitz of the 2010 budget - seknas fitra report’s critique of the 2010 budget highlights...
TRANSCRIPT

Behind the Glitz of the 2010 Budget -1-
BEHIND THE GLITZ OF THE 2010 BUDGET
Authors: Foreword by:
Yuna Farhan Diah Raharjo
Yenny Sucipto
Ucok Sky Khadafi
Hadi Prayitno
Mohammad Maulana Editor:
Ahmad Taufik Masmimar Mangiang
English Translator: Denis Fisher
Copyright:
National Secretariat, Indonesian Forum for Budget Transparency (Seknas FITRA), Jl Kalibata Utara II
Rt.011/02 No. 78 Jakarta Selatan, PO Box 7244 Tel/fax +62 21-794 7608
Email: [email protected]; [email protected]
Website: www.seknasfitra.org; www.budget-info.com

Behind the Glitz of the 2010 Budget -2-
Table of Contents
Glossary of Abbreviations and Terms ………………………….….. 3
Foreword ……………………………………………………….. 5
2010: End of Year Comments: A Year of Political Posturing &
a Budget Verging on the Unconstitutional ……………………........ 7
Budget 2011: Policy Projections …………………………………… 12
Resolving Budget Management Issues …………………………….. 17
Additional Remuneration: Masquerade of Bureaucratic Reform …. 22
Funding for Travel: Pocket Money for Beauty Parlors ……………. 25
Public Welfare Budget: Government Window Dressing ………….. 30
Secretive despite Obligation to be Accessible ……………………. 39
Annual Ritual of Audit Reports: Ending the Masquerade…………. 46
The DPR’s Dysfunctional Budget: a Black Mark against Senayan .. 49
Sub-national Finances: Paying Lip Service with Leftovers ……….. 57

Behind the Glitz of the 2010 Budget -3-
GLOSSARY OF TERMS AND ABBREVIATIONS
APBD Anggaran Pendapatan dan Belanja Daerah—regional (local)
government budget APBN Anggaran Pendapatan dan Belanja Negara—State budget
APBN-P Anggaran Pendapatan dan Belanja-Perubahan—(mid-year) revised
State budget APBN-R Anggaran Pendapatan dan Belanja-Realisasi—(end of year) realized
State budget
Bakosurtanal Badan Koordinasi Survei dan Pemetaan Nasional —National Coordinating Agency for Surveys and Mapping
Banggar Badan Anggaran (DPR RI)—Budget Committee (of the House of
Representatives of the Republic of Indonesia)
BNPB Badan Nasional Penanggulangan Bencana—National Disaster Management Agency
BOS Bantuan Operasional Sekolah—school operational fund, a central
government funding mechanism for state schools throughout Indonesia BPK Badan Pemeriksa Keuangan RI—Audit Board of the Republic of
Indonesia)
BPS Badan Pusat Statistik: Central Bureau of Statistics
BSN Badan Standardisasi Nasional: National Standardization Agency
BURT Badan Urusan Rumah Tangga—In-house affairs office (of the House
of Representatives)
DAK Dana Alokasi Khusus—Special Allocation Fund, a form of dana perimbangan
DBH Dana Bagi Hasil—Revenue Sharing Fund, a form of dana
perimbangan
DAU Dana Alokasi Umum—General Allocation Fund, a form of dana
perimbangan
dana aspirasi ‖aspiration funds‖—budget allocations for expenditure within DPR constituencies to meet popular hopes and wishes (aspirations)
dana perimbangan Fiscal transfers to sub-national (regional, local) governments to
reduce fiscal imbalance between the center and regions and among
regions
dana penyesuaian adjustment funds, a form of dana perimbangan
DDUB Dana Daerah untuk Urusan Bersama—regional funding for joint
activities (with the central government)
dekonsentrasi delegation of responsibility (and funds) from the center to region s
for the discharge of a task or function not yet decentralized
DIPA Daftar Isi Pelaksanaan Anggaran—budget implementation checklist,
part of the budget documentation of every public institution
Direct Expenditure a budgetary term designating spending directed at development
programs; cf. indirect expenditure
DISP Dana Infrastruktur dan Prasarana—Fund for Infrastructure and Public Facilities, a form of dana penyesuaian
DPD Dewan Perwakilan Daerah—national House of Regional Representatives
DPDF PPD Dana Penguatan Desentralisasi Fiskal Percepatan Pembangunan Daerah—Fund to Strengthen Fiscal Decentralization to Speed up Regional
Development, a dana penyesuaian program

Behind the Glitz of the 2010 Budget -4-
DPIP Dana Percepatan Infrastruktur Pendidikan—Fund to Speed up
Development of Educational Infrastructure, a dana penyesuaian program
DPIPD Dana Penguatan Infrastruktur dan Prasarana Daerah —Fund to
Strengthen Local Infrastructure and Public Facilities, a dana penyesuaian
program
DPR Dewan Perwakilan Rakyat—House of Representatives of the Republic of Indonesia
DPRD Dewan Perwakilan Rakyat Daerah—Regional/Local Legislative
Assembly: the legislative wing of sub-national/local governments
HoG head of a regional/local government (kepala daerah)
Indirect expenditure A budgetary term denoting spending on common, routine costs
incurred by a work unit in implementing its programs, excluding funding directly at a specific program, which is classed as ―direct expenditure‖
Jamkesmas Jaminan Kesehatan Masyarakat—community health insurance (a
system of health coverage of the poor throughout Indonesia)
Kab./Kabupaten regional (local) government area below province and equal in status to a city
Local government pemerintah daerah—any sub-national/regional government (i.e.
province, kabupaten or city)
LKPP Laporan Keuangan Pemerintah Pusat—central government economic
report, a State budget document
MDG Millennium Development Goals
MoF Ministry of Finance
MP Member of the House of Representatives (DPR)
MPR Majelis Permusyawaratan Rakyat RI—People’s Consultative Assembly
of the Republic of Indonesia
Musrenbangnas Musyawarah Rencana Pembangunan Nasional—national development
planning conference
PAD Pendapatan Asli Daerah—local government own source revenue
PMK Peraturan Menteri Keuangan—Minister of Finance regulation
PNPM Program Nasional Pemberdayaan Masyarakat—National Community
Empowerment Program
PP Peraturan Pemerintah—central government regulation
Region Any area of Indonesia at the sub-national level, including specifically
provinces, kabupatens and cities
RKA K/L Rencana Kerja dan Anggaram Kementerian/Lembaga— Ministry/Agency Budget and Work Plan, a part of the budgetary
documentation of every public institution
RKP Rencana Kerja Pemerintah—government work plans, part of the budget documentation of central and local governments
rumah aspirasi ―homes for aspirations‖ of the people, a form of DPR presence in
regions for keeping in closer contact with constituents’ aspirations
Sub-national government Any regional or local government (i.e. province, kabupaten or city)
Tugas pembantuan an arrangement by which the central government directs and funds a
region to co-administer a not-yet-decentralized activity or function
UU KIP Undang Undang No. 14 Tahun 2008 tentang Keterbukaan Informasi Publik—Law No. 14/2008 concerning Freedom of Access to Public
Information (Indonesia’s freedom of information law)

Behind the Glitz of the 2010 Budget -5-
Foreword
At the end of every year, it is important to reflect upon and evaluate the quality of national budget
policies. The National Secretariat of the Indonesian Forum for Budget Transparency (Seknas FITRA),
together with its network of budget advocacy units across Indonesia, has consistently provided annual
reports on budget performance as part of its budget transparency work program and its effort to
realize popular sovereignty over national budgets.
The 2010 review has been released in two segments. The first, Pembajakan Anggaran Daerah (The
Highjacking of Sub-national Budgets), was launched on 19 December 2010 in the Ambhara Hotel,
Jakarta. The second, Catatan Akhir Tahun 2010 (Year-End Notes 2010), was released on 21
December 2010 in the Bumbu Desa Restaurant.
Towards the end of 2010, the political leadership of government ministries and agencies made
increasingly frequent appearances before the news media to boast about their successes for the year or
to gain publicity for programs which were on the point of completion. This is a commonly used tactic
to achieve quick expenditure of budgetary funds in the midst of looming under-expenditure of the
budget. Government ministries and agencies were haunted by the prospect of having their funding
levels for 2011 cut if they did not fully expend their 2010 allocations. They therefore resorted to
spending for spending’s sake without considering the effectiveness of the spending or the extent to
which it would help achieve set budget targets. The government even claimed that it had achieved
budget ―savings‖ of Rp 100 trillion in 2010, even though those ―savings‖ amounted to no more than a
failure to spend allocated funds. All this is the result of poor budget planning processes which
unleash a lust to spend more and more each year, thereby justifying going even further into debt. The
Ministry of Finance has shown that it lacks the capacity to sift through the programs put forward by
ministries and agencies in order to accurately assess their respective absorptive capacities and to
prevent over-priced budgeting.
This report’s critique of the 2010 budget highlights that the formulation and management of the
budget are becoming further and further removed from the mandate of Article 23 of the Constitution.
Talk of bureaucratic reform, promotion of public welfare and achievement of budget savings was still
just so much rhetoric, high sounding phrases to make the authorities and political elite look good in
the public eye. In fact, under-expenditure of the national budget ─ just 78.2% of the 2010 budget was
spent by the end of November 2010 – will make it more difficult to achieve economic recovery which
remains one of the budget’s main goals.
Other budgetary problems were evident at the level of sub-national (regional) governments. These
included budgetary imbalances among regional government areas, out-of-control transfers of funds to
regional governments, a critical lack of regional government fiscal discretion, losses to the public
purse and wasteful spending. The report also records instances of highjacking of regional government
budgets notably in the areas of social welfare payments, operational support expenditure and financial
assistance for political parties, in part to finance extravagant travel by senior regional government
people.

Behind the Glitz of the 2010 Budget -6-
Compared to previous annual reports, the special features of the 2010 report are: the inclusion of more
comprehensive material on budget evaluation at national and regional levels; an analysis of the
challenges ahead; a forecast of likely future budget policies; and suggested solutions for the problems
that came to the fore during 2010.
The overall failure of fiscal policy to powerfully contribute, as it should, to economic growth and
community welfare indicates that the policy approaches adopted by governments amount to little
more than political posturing, disguising hesitancy and a critical lack of true commitment.
Accordingly, our 2010 report is entitled Dibalik Pesona Anggaran 2010 (Behind the Glitz of the
2010 Budget) and has been written with the intention of offering constructive criticism to government.
Jakarta, March 2011
Diah Raharjo
Head of Seknas FITRA’s National Board

Behind the Glitz of the 2010 Budget -7-
2010: End of Year Comments: A Year of Political Posturing & a Budget Verging on the Unconstitutional
2010 was the first year of President Susilo Bambang Yudoyono (SBY)’s second term of office
following his re-election in 2009. In this second term, SBY should be able to be more resolute in his
espousal of good budget policies and should not accord any priority to maintaining his political
image. The principal emphases in the 2010 State budget (APBN 2010) were that it should promote
―national economic recovery and boost community welfare‖. But all that turned out to be mere
rhetoric. The reality was that the budget was further removed than ever from the mandate of Article
23 of the Consititution that national budgets ―shall be implemented in an open and accountable manner in
order to best attain the prosperity of the people‖. Instead of being used to promote the public interest,
40.7% of the 2010 APBN was consumed by routine expenditure on the bureaucracy and top echelons
of the civil service. Furthermore, Rp 162.6 trillion of that 40.7% was spent on civil service costs, Rp
19.5 trillion on official travel and Rp 153.6 trillion on payment of interest on loans or loan
repayments.
Following are Seknas FITRA’s overall comments on the nation’s budget performance in 2010.
1. Extra Remuneration for Civil Servants: Bureaucratic Reform Losing its Way
The central government’s panacea for the elimination of corruption from the bureaucracy—the
payment of extra remuneration (remunerasi)—has not worked, as is clearly demonstrated by the
case of Gayus Tambunan, an official within the Directorate-General of Taxation in the Ministry
of Finance. Also contributing to the failure of bureaucratic reform—which remains a mere
catchcry—was the central government’s predilection for establishing special teams within the
Presidential Palace and for appointing an array of deputy ministers. All this had the effect of
creating a bureaucracy rich in structure but poor in functionality and efficiency. The additional Rp
34.7 trillion spent on the bureaucracy in 2010 did nothing to enhance the quality of its service.
2. The Race to Travel: More Money in the Pocket
Expenditure on official travel is one clear proof that the budget is framed to benefit the senior echelons of the bureaucracy. It is something of an annual budget ritual for the President to call for
reduced expenditure on official travel. But, in fact, over the past three years, the total cost of
offical travel has constantly risen by around Rp 4 trillion a year. That leaves little doubt that
promises to reduce expenditure on official travel are just political rhetoric. Indeed, the amount of money dedicated to official travel balloons out as the budget year proceeds through its various
stages. Thus in 2009 the allocation for official travel in the APBN, as originally approved by the
House of Representatives (DPR), was Rp 2.9 trillion. But in the mid-year revised budget (APBN-P) the amount had ballooned to Rp 12.7 trillion and, by the end of the budget year, had reached
Rp 15.7 trillion (realized budget (APBN-R) figure). The same happened in 2010: the APBN
originally allocated Rp 16.2 trillion for official travel, but the amount was upped to Rp 19.5 trillion in the APBN-P. The latter figure was four times more than the budget for health insurance for the
poor (known as jamkesmas). Official travel has become a productive source of additional income
for government staff. Findings of the national Audit Board (BPK) show that in 35 ministries and
agencies some Rp 73.6 billion have be syphoned off by bogus travel-related expenses such as imaginary trips, counterfeit tickets and multiple payments.
3. Community Welfare Budget Not Bringing Welfare
15% of the 2010 APBN – Rp 159.7 trillion – was allocated to the servicing of debt (both interest
payments and capital repayments). This amount exceeded allocations directed at the promotion of
community welfare in such areas as health (which received only Rp 31.6 trillion) and disaster

Behind the Glitz of the 2010 Budget -8-
relief (Rp 6.4 trillion). Only 2.3% of the 2010 APBN was dedicated to health – well short of the
5% required by law. And for a country as prone to natural disasters as Indonesia the funding allocated for disaster management was also far from sufficient. Moreover, given that funding was
dispersed across several ministries and agencies, much of it was consumed by bureaucratic costs.
The government regards the National Community Empowerment Program (PNPM) as the cure all
for poverty. But in reality it has become a political football and used to curry favour with the populace without having a significant impact on poverty numbers. A PNPM funding boost of Rp
1.3 trillion in 2008 lifted just 2.2 million people out of poverty and additional funding of Rp 4.9
trillion in 2009 only enabled the program to help 2.4 million to escape from poverty. In the area of education funding, which was also spread over various ministries and agencies (and included funds
for SEA Games-related activities), the BPK also found that 80 regional governments has
misapproprated funds amounting to Rp 900 billion.
4. Secretive Budgets in an Era of Freedom of Information
FITRA’s attempts to obtain copies of Budget Implementation Checklists (DIPA) from government
ministries and agencies have demonstated that most public institutions approached still regard budget documents as ―state secrets‖. Of the 69 public institutions approached, 54 (or 84%) did not
make copies of their DIPAs available. Half of the 15 that handed over the documnts did so ony
after FITRA had filed a follow letter of compaint. Ironically, many institutions proffered the excuse that that they were seeking confirmation from the Ministry of Finance and the BPK,
whereas in fact those two institutions do not have carriage of such freedom of information issues.
This exercise has shown that, as of 2010, the consitituional requirement that the budget be
implemented in an open manner is not being met.
5. Annual Ritual of National Audit Board (BPK) Reports
If it dared to, the government could take pride in the fact that, after receiving a ―disclaimer
opinion‖ (no opinion offered) from the BPK for five years in a row, it finally received a ―qualified
opinion‖ on its Government Financial Statement in the BPK’s report for the first semester of 2010. But
the problem is that national audit reports are really only annual rituals, because few of their
findings are followed up. Audit opinions also tend to be subject to negotiation. When BPK reports
come before the DPR, they do not receive the serious level attention which is accorded to the
budget. The DPR’s National Finances Accountability Committee is a new addition to the DPR’s
establishment and has not yet carved out a role for itself on BPK reports. Although the BPK’s
opinion on the Government 2010 Financial Statement was an improvement, it remains the case
that the BPK pointed to more problem areas in 2009 than it had in 2008. In 2008 it had identified
378 cases of misappropriation of funds totalling Rp 3.7 trillion, but in 2009 the number of cases
jumped to 650 (with revenue lost totaling Rp 4.98 trillion).
6. A “Fail” for the DPR for Budget Management
The DPR has the specific role of taking a critical look at the budget presented to it by the
government. But, instead of that, it has become ensnared by the misuse of its budgetary powers to
promote its own interests. The record shows that throughout 2010 the DPR stubbornly promoted
its plan to build a sumptuous new DPR building costing Rp 1.6 trillion. Equally stubbornly its
members took it in turns to travel abroad while ordinary people in several areas were being
buffeted by natural disasters. Under the guise of realizing ―popular aspirations‖, the DPR
obstinately launched what amounted to a ―let’s ransack the public purse‖ program. That program
included proposals to construct DPR offices in regional areas (so called ―rumah aspirasi”) and the
allocation of funds to be spent on people’s ―aspirations‖ in each DPR constituency (termed ―dana
aspirasi”). In 2010 most of the DPR’s members were new faces but, even in their first year, they
aroused public suspicion and gave the impression that they regarded themselves as immune to

Behind the Glitz of the 2010 Budget -9-
public criticism. It was difficult to hope that a DPR focused on pursuing its own interests would be
critical of the government’s budget.
7. Sub-national Finances: Mismanaged and Bordering on Bankruptcy
In the opening section of the Government Financial Statement, President SBY claimed that the
central government was continuously increasing the amount of funds transferred to regions. They
claim that such transfers have more than doubled from Rp 150.4 trillion in 2005 to Rp 344.6
trillion in the 2010 (APBN-P figure). But in fact, in a situation where central government spending has been constantly rising, the proportion of funds transferred to regional governments has been
stagnating at around 30% of total APBN expenditure. Regional governments depend on fiscal
transfers from Jakarta (dana perimbangan) for 82% of their total budget resources. But they are spending around 51% of those resources on public service costs─which amounted to Rp 153
trillion in 2009, rising even higher to Rp 168 trillion in 2010. As a result only 17% of all regional
government spending is capital expenditure on basic infrastructure of direct benefit to the people.
Regional governments have limited fiscal discretion and that situation is not helped by the central government’s half-heartedly implementation of fiscal decentralization. But the situation is being
aggravated by regional governments’ own lackluster performance in managing their own already
minimal budgets. In 2009 BPK audit reports identified misappropriations of regional government budgets amounting to Rp 306.6 billion, a rise of an incredible 173% over the the corresponding
figure in 2008.
Towards the end of 2010, the political leadership of government ministries and agencies made
increasingly frequent appearances before the news media to boast about their successes for the year or
to gain publicity for programs which were on the point of completion. This is a common tactic to
achieve quick expenditure of budgetary funds in the midst of looming under-expenditure of the
budget. Government ministries and agencies were haunted by the prospect of having their funding
levels for 2011 cut if they did not fully expend their 2010 allocations. They therefore resorted to
spending for spending’s sake without considering its effectiveness or the extent to which it would help
achieve set budget targets. The government even claimed that it had achieved budget ―savings‖ of Rp
100 trillion in 2010, even though those ―savings‖ amounted to no more than a failure to spend
allocated funds. All of this was the result of poor budget planning processes which unleash a lust to
spend more and more each year, thereby justifying going even further into debt. The Ministry of
Finance has shown that it lacks the capacity to sift through the programs put forward by ministries and
agencies in order to accurately assess their respective absorptive capacities and to prevent over-priced
budgeting.
This report’s critique of the conduct of the 2010 budget highlights that budget formulation and
management have become further and further removed from what Article 23 of the Constitution
demands. Talk of bureaucratic reform, promotion of public welfare and achievement of budget
savings is still just so much rhetoric — high sounding phrases to make the authorities and political
elite look good in the public eye. In fact, under-expenditure of the APBN – just 78.2 spent of which
was as of the end of November 2010 – will make it more difficult to achieve economic recovery
which remains one of the budget’s main objectives.
Increases in the size of the APBN, from Rp 509.6 trillion in 2005 to Rp 1 126 trillion in 2010 have not
seen a significant improvement in the welfare of the people. Indeed, Indonesia’s ranking in the
UNDP’s Human Development Index (HDI) worsened over the peiod, from 107th in 2006, to 109th in
2007-8 and 111th in 2009. In fact, Indonesia’s HDI ranking is below that conflict-ridden countries
like Palestine (110th) and Sri Lanka (102nd)

Behind the Glitz of the 2010 Budget -10-
Projections and Suggested Improvements for Budget 2011
The management of the 2011 APBN will very likely be plagued by the same chronic problems, with a
repetition of wasteful practices, some extent of commodification of the budget to serve the interests of
the elite, slow rates of expenditure and the continued incidence of misappropriation.
The government has decreed that the overall policy direction of the 2011 budget will be ―acceleration
of economic growth which is fair and supported by good management and synergy between central
and regional governments‖. President SBY’s speech before the DPR when presenting the Government Financial Statement was not very different to his 2010 speech. He reported only the
good news about Indonesia’s situation. But the contents of the President’s speech bore little
resemblance to actual budget policies. For example, the government claims that, to stimulate economic growth in 2011, Rp 121.7 trillion will be spent on capital items, but a look at overall
projected expenditure by category reveals that spending on capital items is not yet a true priority.
Thus it fades away in comparison to subsidies (Rp 184.8 trillion), civil service costs (Rp 180.6) and
spending on goods (Rp 131.5 trillion).
The government claims that fiscal transfers to regions (dana perimbangan) have risen sharply
between 2005 and 2011. But in fact they have stagnated at around 30-31% of APBN expenditure.
The inclusion of School Operational Assistance (BOS) funding within fiscal transfers to regions has
muddied the waters, given that regional governments merely include BOS funding in their budgets
without having any discretion on how it is spent.
President SBY’s assurances about budgets savings (to support which he has promised to issue new presidential decisions) is in no way reflected in the draft 2011 APBN. Indeed, Budget and Work Plans
of Government Ministries and Agencies for 2011 (RKA K/L) provide evidence of capital expenditure
proposals which are basically designed to serve bureaucratic interests. The proposals could result in wastage of funds and will in no way contribute to economic growth. They include funding for the
supply of 4 041 official motor vehicles of various sizes to ministries and agencies valued at Rp 371.5
billion; and the purchase of 3 109 notebook and desktop computers for 7 public institutions at a cost
of Rp 32.5 billion. The inclusion in RKA K/Ls of so bids for so many vehicles and computers at prices above the norm is indicative of the chaotic Ministry of Finance’s haphazard approach to sifting
through bids submitted by public insititutions. It is almost certain that at some time in the future the
BPK will again uncover a range of misappropriations – a regrettable situation sadly repeating itself.
What is needed here is boldness on the part of President SBY to completely overhaul the current
budget policy formulation and management system. Following are some suggestions from Seknas
FITRA on how budget processes in 2011 might be improved.
1. Review Strategies for Bureaucratic Reform: Place Moratoriums on Additional
Remuneration and Civil Service Recruitment
The payment of extra remuneration to civil servants in order to reduce corruption and improve the performance of the civil service has been proven to be ineffective. In 2011 spending on the civil
service is project
ed to grow yet again to Rp 17.9 trillion. Annual salary increases for civil servants and recruitment
of aditional staff will place increasingly greater routine expenditure demands on the budget, thereby progressively reducing the scope for expenditure on development. Thus, the government
should give priority to terminating payments of extra remuneration to civil servants, placing a
freeze on recruitment and re-thinking its approach to bureaucratic reform.
2. Make Savings when Budgets are Being Formulated
To ensure that talk of budget savings is not just political rhetoric, savings must be identified when the budget is being formulated. As the State’s chief financial officer the Minister of Finance must
put in place a more more effective system for the evaluation of budgetary bids submitted by

Behind the Glitz of the 2010 Budget -11-
government institutions. The Ministry of Finance should also introduce standardized
nomenclature for budget line items in RKA-KLs, should weed out bids based on above standard prices and should issue regulations governing expenditure by public institutions on official travel
and advertising.
3. Institutionalizing Budget Transparency
Observance of the new law on freedom of access to public information (known as UU KIP) must become part and parcel of efforts to improve budget management processes. All public institutions
must immediately restructure to make it easier for the general public to gain access to budgetary
information. Documents such as RKA-KLs, DIPAs, government financial statements and reports of budget outcomes should all be placed on public institutions’ websites.
4. Overhauling Management of Public Welfare Funding There is no doubt that the central government is committed to spending more on public welfare. But, surely, the most important thing about public welfare spending is that it be spent to good
effect in reducing poverty. Public welfare programs must not be allowed to become catch-alls for
projects which have little to do with public welfare. Accordingly, agencies like the National Team
for Accelerating Poverty Reduction (TNP2K for short) should have a role in sifting through spending proposals from public institutions in areas of public welfare like poverty reduction,
education and health.
5. The DPR Should be an Agent for Change in Budget Management Systems
The DPR will earn the respect and support of the people if it closely examines budgets submitted
to it by the central government. But there is a proviso: the DPR has to become an agent for change in budget management systems. It should be open about the contents of draft budgets in order to
obtain inputs from the general public. It should also be open about its own in-house budget and cut
back on any items of expenditure which smack of wastefulness.
6. Revision of Law No. 33/2004 on Fiscal Transfers to Regions
Immediate steps should be taken to revise Law No. 33/2004 concerning Fiscal Balance between the Center and Regions to make the fiscal transfer system more fair for sub-national governments.
The decision to hand over 70% of all government activity to regional governments must be
accompanied by the provision of adequate fiscal resources to those governments. The central
government should abolish special funding for central government tasks delegated to or co-administered by regional governments, by simply handing over those tasks and funding to relevant
regional governments. And the importance of the fiscal transfer system for reducing inter-regional
fiscal imbalances should be front and centre in the revision of Law No. 33/2004.

Behind the Glitz of the 2010 Budget -12-
Budget 2011: Policy Projections
The management of the 2011 APBN will very likely be plagued by the same chronic problems, with a
repetition of wasteful practices, some extent of commodification of the budget to serve the interests of
the elite, slow rates of expenditure and continued incidence of misappropriation.
The government has decreed that the overall policy direction of the 2011 budget will be ―acceleration
of economic growth which is fair and supported by good management and synergy between central
and regional governments‖. President SBY’s speech before the DPR when presenting the
Government Financial Statement was not very different to his 2010 speech. He reported only the
good news about Indonesia’s situation. But budget policies implemented in 2010 bore little
resemblance to what the President said in his speech introducing the draft 2011 APBN into the DPR.
President SBY’s assurances about budgets savings (to support which he promised to issue new
presidential decisions to establish a team to evaluate possible budget savings) are in no way reflected
in the draft APBN for 2011.
The government claims that fiscal transfers to regions (dana perimbangan) have risen sharply
between 2005 and 2011. But in fact they have stagnated at around 30-31% of APBN expenditure.
The inclusion of School Operational Assistance (BOS) funding within fiscal transfers to regions
seems to a subterfuge on the part of the central government, given that regional governments merely
include BOS funding in their budgets without having any discretion on how it is spent.
The central government claims that, to stimulate economic growth in 2011, Rp 121.7 trillion will be
spent on capital items, but a look at overall projected expenditure by category reveals that spending on
capital items is not yet a true priority. Thus it fades away in comparison to subsidies (Rp 184.8
trillion), civil service costs (Rp 180.6) and spending on goods (Rp 131.5 trillion). Indeed, Budget and
Work Plans of Government Ministries and Agencies for 2011 (RKA K/L) provide evidence of capital
expenditure proposals which are basically designed to serve bureaucratic interests. The proposals
could result in wastage of funds and will in no way contribute to economic growth. Thus the 2011
budget will not be able to better the welfare of the people, as can be seen from the following points
emerging from Seknas FITRA’s examination of the RKA K/Ls for 2011.
The potential for corruption is still evident in the supply of official vehicles.
At least 4 041 official vehicles (with 2, 4 or 6 wheels) valued at Rp 371.52 billion are to be
purchased by 20 central government ministries or agencies. The supply of official vehicles is fertile ground for corrupt practices, because such vehicles can be purchased by placing a direct
order (as per President Regulation No. 54/2010 on the supply of goods and services). FITRA’s
research also has revealed that the cost of many of the proposed purchases exceeded standard costs
laid down in Minister of Finance regulation (PMK) No. 100 of 2010. Thus, for example, the Audit Board (BPK) intends to purchase 49 official vehicles at a cost of Rp 24.8 billion (or Rp 506.5m per
vehicle). That unit price is higher than that permitted for an ―echelon 1‖ public servant (whose
price ceiling is Rp 400m), as per PMK No. 100/2010 (see Table 1).
Computers at above market price.
It is proposed that 3 109 notebook and desktop computers be purchased for 7 public institutions at
a cost of Rp 32.5 billion. Our review of the RKA K/L of the Ministry of Transportation revealed a proposed purchase price for notebook computers of Rp 28m per unit, which is above market
prices—leaving the proposed purchase open to waste and corruption. Computers are assets whose
whereabouts can be difficult to verify, making such items particularly susceptible to misappropriation. (See tables 2 and 3).

Behind the Glitz of the 2010 Budget -13-
Wasted Money on Construction/Maintenance of Office Buildings.
As much Rp 6.1 trillion of the capital expenditure vote in the 2011 APBN is to be spent on the
provision and maintenance of offical office buildings. The supply of buildings such as new office space for House of Regional Representatives (DPD) members in provincial capital cities and a new
DPR building has no connection whatsoever with economic growth (Table 4).
Table 1
Expenditure on the Supply of Official Vehicles in the Draft 2011 APBN
Agency
Code Ministry/Agency Item
Budget
(Rp ´000)
4 Audit Board 49 24 826 809
5 Supreme Court 499 58 046 242
7 Ministry of the State Secretariat 106 14 199 675
10 Ministry of Home Affairs 545 17 935 684
15 Ministry of Finance 100 23 846 650
18 Ministry of Agriculture 312 9 231 280
19 Ministry of Industry 11 3 582 000
20 Ministry of Energy and Mineral Resources 37 8 572 000
22 Ministry of Transportation 140 38 095 045
23 Minstry of National Education* 604 25 383 280
24 Ministry of Health 114 22 407 300
25 Ministry of Religion 117 17 297 937
26 Ministry of Labor and Transmigration 257 16 635 000
27 Ministry of Social Services 142 30 182 600
29 Ministry of Forestry 906 35 859 996
33 Ministry of Public Works 9 1 700 000
34
Coordinating Minister of Political, Legal and Security
Affairs 26 3 848 165
42 Ministry of State for Research and Technology 5 4 225 000
66 National Narcotics Board 46 11 850 000
90 Ministry of Trade 16 3 799 805

Behind the Glitz of the 2010 Budget -14-
Total 4041 371 524 468
Remarks: Data from a collection of RKA K/Ls for 2011, processed by Seknas FITRA
* Includes the cost of vehicle maintenance of Rp 20 m/year for 92 units, and Rp 47 juta/year for 220 units.
Table 2
Supply of Notebooks/Computers in Seven Ministries/Agencies
Code Ministry/Agency Item Budget
(Rp ´000)
National Council for Food Security 9 151 000
22 Ministry of Transportation 192 3 839 251
23 Ministry of National Education 2 041 16 812 496
25 Ministry of Religion 99 2 056 736
29 Ministry of Forestry 674 8 735 359
33 Ministry of Public Works 50 500 000
90 Minstry of Trade 44 478 000
Total 3109 32 572 842
Remarks: Data put together by Seknas FITRA from a collection of RKA K/Ls for 2011
Table 3
Potential Waste on Supply of Computers/Notebooks in the Ministry of Transportation
Code Name of Item
No.
of
Items
Unit Budget
(Rp ´000)
Price per
item
(Rp ´000)
1932.17 Notebook 3 Units 75 000 25 000
1932.18 Computer 8 Units 120 000 15 000
1934.02 Laptop (notebook) 15 Units 300 000 20 000
1934.05 Computer 5 Units 75 000 15 000
1935.05 Notebook 5 Units 100 000 20 000
1937.23 Notebook 15 Units 420 000 28 000
1937.40 Computer 15 Units 150 000 10 000
1940.10 Notebook 4 Units 71 000 17 750
1942.03 Computer 44 Units 671751 15 267

Behind the Glitz of the 2010 Budget -15-
1942.56 Notebook 26 Units 509 000 19 577
1953.02 Computer 15 Units 225 000 15 000
1953.03 Notebook 15 Units 375 000 25 000
1953.67 Computer 5 Units 62 500 12 500
1961.38 Printer and the like 17 Units 685 000 40 294
- Total 192 Units 3 839 251 -
Remarks: Data put together by Seknas FITRA from a collection of RKA K/Ls for 2011
Table 4
Supply/Maintenance of Buildings/Land in Draft 2011 APBN
Code Ministry/Agency Item Budget
(Rp ´000)
2 Secretary-General, DPR 832 925 370
4 State Audit Board 49 633 514 978 860
5 Supreme Court 318 523 616 061 480
6 Attorney-General’s 170 592 371 415 923
7 Ministry of the State Secretariat 99 840 88 073 005
10 Ministry of Home Affairs 33 090 630 131 219
11 Ministy of Foreign Affairs 154 792 046
12 Ministry of Defence 14 277 160 665 899
15 Ministry of Finance 206 483 619 436 423
18 Ministry of Agriculture 24 340 43 967 310
19 Ministry of Industry 36 032 6 293 306
20 Ministry of Energy and Mineral Resources 84 645 38 384 528
22 Ministry of Transportation 30 021 137 906 193
23 Ministry of National Education 19 267 50 890 102
24 Ministry of Health 15 003 118 123 681
25 Ministry of Religion 127 879 162 659 144
26 Ministry of Labor and Transmigration 8 875 10 165 136

Behind the Glitz of the 2010 Budget -16-
27 Ministry of Social Welfare 7 545 16 682 277
29 Ministry of Forestry 41 084 73 438 372
32 Ministry of Marine and Fisheries 4 units 1 220 800
34
Coordinating Minister of Political, Legal and
Security Affairs 5 387 28 007 345
54 Central Bureau of Statistics 500 units 216 741 378
56 National Defense Council 3 000 304 325 837
66 National Narcotics Board 18 775 244 108 000
88 National Civil Service Agency 35 752 29 497 145
90 Ministry of Trade 24 units 76 422 601
95 The House of Regional Representatives (DPD) 565 938 729
Total 1 350 043 6 113 252 109
Remarks: Data from a collection of RKA K/Ls for 2011, processed by Seknas FITRA

Behind the Glitz of the 2010 Budget -17-
Resolving Budget Management Issues
National budgets must fulfill Constitutional mandates. For that to happen, Seknas FITRA feels and
experience shows, that many aspects of the framework for managing national budgets need to be
improved. The key players in that process have to the President and the national parliament, who are
the political representatives of the people in whom national sovereignty resides.
Revamping Strategies for Bureaucratic Reform
One of the government’s prioritis in promoting development has to be reform of the bureaucracy.
This is of course already on the government’s agenda. But to ensure that bureaucratic reform does not
lose its way the government needs to overhaul current strategies. In FITRA’s view, a revamped
bureaucractic reform plan should be based on the ―reversal of the burden of proof‖ principle. That
would would mean that officials would have to furnish evidence of their achievements before
receiving extra remuneration or being penalized. In particular, civil servants who possess an
unreasonable level of material wealth would have to clarify their situation. The overall aim of this
approach would be to clean up public insititutions from top to bottom.
The case of Gayus Tambunan—a ―dealer in taxes‖ from among the ranks of subordinate officials
receiving extra remuneration—was an object lesson for the bureaucratic reform process. The budget
process, from start (revenue collection) to finish (expenditure), is replete with opportunities for
corruption. The practice of corruption among officials, ranging from those who manage the budget
(the Ministry of Finance has oversight of both revenue and expenditure) to those who spend it
(ministries and agencies implementing programs), will never be able to be stopped by the payment of
extra remuneration. Corruption has now taken root. The client-patron model that characterizes the
relationship between superiors and subordinates in the bureaucracy will see to it that new civil service
recruits become entrapped in the cycle of corruption. Which is why bureaucratic reform should
incorporate the ―reversal of the burden of proof‖ principle. Officials possessing unreasonable levels
of wealth because of their official positions should be able to be identified.
Salary increases will never be able to dampen the zest for corruption. It cannot be denied that what
might be termed ―corruption by the needy‖ can be committed by poorly paid civil servants. But, when
it occurs at the highest levels, e.g. among government ministers, it is not need that drives corruption
but rather unbridled desire, greed and power.
Reversal of Burden of Proof & Cleaning up
Cut Links Binding Policy Makers with Power Elite
Simple Structures Rich in Functions; Efficient
Bureaucracy Remuneration and Penalties
Bureaucratic Reform
Behind the Glitz of the 2010 Budget -18-
Up to now bureaucratic reform has not addressed the real issues involved. One of those is the client-
patron relationship that exists between policy making elites and their subordinates. If anything,
attempts to reform the bureaucracy so far have worked against the creation of an efficient and
purposeful civil service. The so far half-baked approach to bureaucratic reform has simply served to
add to the government’s budgetary burden and has whittled away funding for development and pro-
poor budgeting. In 2011 civil service spending will again reach Rp 17.9 trillion. Annual civil service
salary increases and recruitment drives will impose ever greater routine administrative burdens on the
nation’s budgets. And there will be a corresponding reduction in flexibility to spend money on
development. Thus, for the time being, the government should stop paying extra remuneration and
freeze civil service recruitment. It should also have a hard look at its bureaucratic reform strategies
against the yardstick of creating an efficient and purposeful civil service which does not burden the
nation’s budget. The creation of such a civil service must be the guiding principle of any reform
strategy.
Saving Money when Framing the Budget
As the country’s financial managers, the Ministry of Finance should put in place a system for sifting
through the budgetary bids put forward by public institutions particularly in their budget and work
plans (RKA K/Ls). The main purposes of that sifting process would be to identify bids that are
overpriced or that smack of being support programs which do not directly contribute to economic
growth or enhanced community welfare. In the search for savings, the prime targets should be money
spent on the bureaucracy for such items as official travel, advertising, the supply of official vehicles
and the provision and maintenance of official buildings.
The RKA K/Ls of public institutions should be produced in accordance with clearly set out standards
as to format and detailed content. An examination of RKA K/Ls reveals that the RKA K/L of one
institution varies from that of another in terms of nomenclature and detail on types of expenditure
included. For example, one institution will include a separate rupiah figure for its bid for the purchase
of 4-wheeled vehicles, while another will provide a consolidated bid for the purchase and
maintenance of 2, 4 and 6 wheeled vehicles. This situation makes it difficult for the House of
Representatives (DPR) and the Ministry of Finance to effectively sift through the bids contained in
RKA K/Ls. In light of all this, the Ministry of Finance should put systems in place which guard
against wasteful spending proposals being included in RKA K/Ls, with bids in excess of standard
permissible prices being automatically deleted. In the past, BPK audits have identified cases of
expenditure on items purchased at prices above permissible standards. Such expenditure should be
countenanced no more.
Institutionalizing Budget Transparency
The Constitution mandates that national budgets shall be implemented in an open manner. This means that
every citizen has a right to access information on the budget which is after all public information. Accordingly,
respect for the people’s right to freedom of information, enshrined in legislation in Law No. 14/2008
(known as UU KIP), should become standard procedure in public institutions charged with
management of budgets. Full acceptance of the need for budget transparency by public institutions is
not in essence just a matter of their observing UU KIP. More fundamentally it calls for a change of
institutional ways of thinking which up to now have regarded budgets as state secrets.
Transparency should characterize both budgetary processes and budget documents. Thus the whole
budgetary cycle—planning, formulation, implemention and public accountability—should be

Behind the Glitz of the 2010 Budget -19-
transparent. At the planning stage—at the time of the National Development Planning Conference
(known as musrenbangnas)—the central government should throw the process open to the widest
possible degree of public participation. The musrenbangnas should become the citzenry’s annual
show—a forum for synthesizing the needs of ordinary people. At the institutional level, the budget
planning process should involve consultation with target groups. All draft government work plans
(RKP) should be brought to the attention of the public. And public institutions should be held
accountable for the extent to which their RKPs take account of inputs from the general public.
The processess leading to finalization of the APBN within the DPR should also allow for
consultations with the public. This would apply to processes within both the DPR’s Budget
Committee (known as Banggar) and the DPR’s standing committees during their discussions with
counterpart government officials. Indeed, before meetings are held within the DPR to discuss the
budget bids of public institutions, the DPR should hold public hearings on the issues involved with
relevant groups from the general public.
Diagrammatic of Process of Institutionalizing Budget Transparency
At the budget implementation stage, public institutions should place their DIPAs on their websites
along with any related contracts concluded with third parties. Details of budget outcomes—whether
they be completed or still subject to tender—for all public institutions should also be available online
to the general public. The website of the Ministry of Public Works (www.pu.go.id) could be used as a
model for how to effectively publicize budget outcomes. Such a transparent budget implementation
process would encourage the general public to become involved and thereby help the government to
prevent wastage of public money.
BPK reports, which up to now have been presented in summary form on www.bpk.go.id, should be
published in full for all public institutions both national and sub-national. All public institutions
should also provide reports on the implementation of their budgets on a monthly basis as well as at the
end of the budget year.
Adherence to the freedom of information provisions contained in UU KIP should become an integral
part of efforts to improve budget management processes. Public institutions should immediately
• Budget Implementation Check List (DIPA)
• Budget Realization Report Semester I
• Contracts
• Audit reports
• Ministry/Agency Budget Realization Reports
• Central Govt. Financial Report
• Ministry/Agency Work & Budget Plans (RKA-K/L)
• Draft APBN
• Draft Govt. Work Plan (RKP)
• RKP
Planning Formulation
Implementation Accountability

Behind the Glitz of the 2010 Budget -20-
restructure to facilitate access to budgetary information by the general public. Budget documents such
as RKA K/Ls, DIPAs and budget implementation reports should be published on each and every
governmental website.
Streamlining Management of Public Welfare Budgets
There is no doubt that government is committed to spending more on public welfare. But, surely, the
most important thing about public welfare spending is that it should be spent to good effect in
reducing poverty. The central government claims that every year it increases funding for programs to
address poverty and public welfare in areas such as education and health. The problem is, however,
that funds earmarked for education and the reduction of poverty tend to be used for activities which
have little to with poverty alleviation. And actual budget figures for education and poverty relief show
that to be the case. One recent example of this was the inclusion in the education budget of funds to
be spent on the South East Asian Games. Another was the inclusion in the health budget of money to
be spent on overseas trips to care for the health of pilgrims to Mecca.
Streamlining management of community welfare budgets should include clarification of its various
categories of expenditure and their purposes; and the sifting through of expenditure proposals to
ensure that they acccord with their intended purposes. In the current system there is overlap between
the purposes for which various categories of funds are expended. For example, spending under the
School Operational Assistance (bantuan) (BOS) program is placed in the ―social welfare assistance
(bantuan)‖ category of expenditure (because it has ―bantuan‖ in its title). This categorization should
be amended to ensure that the proposed expenditure accords with its purpose and that it is capable of
achieving that purpose. The DPR should be selective in its approach, sifting through expenditure bids
submitted by public institutions and sidelining bids which do not accord with enhancement of public
welfare. Over and above that, the government should accord priority in budget policy to increasing
funding for community welfare and to establishing a comprehensive social security system.
The bulk of funding for community welfare programs should take the form of fiscal transfers to
regions. It is, after all, sub-national governments in the regions that are frontline providers of public
services; and they should be provided with the fiscal resources they need to find innovative ways to
provide those services to their communities. Indeed, the central government should establish a stream
of fiscal transfers to regions (dana perimbangan) specifically aimed at poverty reduction.
The DPR: Agent for Change in Budget Management Processes
As the institution representing the people and encapsulating the public interest and popular
aspirations, the House of Representatives (DPR) should play a key role in the reform of budget management processes. In view of its Constitutional mandate to consider and discuss draft State
budgets, it should take the lead role in efforts to streamline budget management processes. By doing
that the DPR will earn the respect and support of the people.
The DPR should also streamline its own budgetary processes, inter alia by being transparent about its
own in-house budget’s content and the processes used to frame it. The DPR should have the courage
to place its in-house budget plans on public view and invite public input on them. It should also,
every three months, publicize progress made in impementing its budget. Were it to do that, it would
win public respect and would be regarded publicly as an open and forward-looking institution. In
addition, it must not resile from axing wasteful expenditure on such items as the construction of new
buildings and other bids likely to cause public offence.

Behind the Glitz of the 2010 Budget -21-
The DPR needs to strengthen its budget support systems by establishing a ―parliamentary budget
office‖. The backdrop to this proposal is that the DPR’s membership turns over at each election and
consists predominantly of new members with various educational backgrounds. It stands to reason
that the budgetary knowledge of DPR members cannot compete with that of civil servants who have
better support systems. By providing members with technical budgetary support such as independent,
non-partisan budget analysis, a parliamentary budget office would facilitate the DPR’s consideration
of government budgets. The office would be independent—that is not subordinate to the DPR—and
would have independent professionally recruited staff. Its main role would be to service the
parliament (especially the DPR and the House of Regional Representatives (DPD)), but would also be
open to approaches from the general public.
Revising Dana Perimbangan Legislation
Law No. 33/2004 concerning Fiscal Balance between the Center and the Regions is judged to be out
of step with the current course of decentralization and other legislative developments. The principle
that ―money follows functions‖ is not evident in Indonesia because fiscal balance has not kept pace
with the dividing up of responsibilities. The central government has now handed over about 70% of
government responsibilities to sub-national governments but has not followed that up with the
necessary level of fiscal decentralization. Fiscal transfers to the regions (dana perimbangan) are still
hovering at around 30% of national expenditure. The central government should also abolish separate
funding for central government tasks which continue to be carried in the regions either by way of
delegation (a process termed ―dekonsentrasi”) or as co-administered tasks (called ―tugas
pembantuan”). These functions should simply be handed over to the regions. In addition, funds
currently being transferred to the regions which do not accord with dana perimbangan principles
should be immediately brought under the dana perimbangan umbrella to prevent political
manipulation of out-of-control fiscal transfers. The key role that dana perimbangan is meant to play
in eliminating fiscal imbalance among sub-national government areas must be front and center in the
revision of the law governing such transfers.

Behind the Glitz of the 2010 Budget -22-
Additional Remuneration: Masquerade of Bureaucratic Reform
It was assumed that payment of additional remuneration to civil servants would improve the
bureaucracy's performance and reduce corruption. But in fact the policy, aimed at reform though it
was, has had the opposite effect. Indeed it has turned out to be a real dead-end policy for President
SBY’s government.
The first trialing of the policy took place in 2008 within three government institutions: the Ministry of
Finance (MoF), the Audit Board (BPK) and the Supreme Court. But, in the case of all three, the
payment of additional remuneration did nothing to improve performance. Nor did it rein in a
predilection for corruption.
ERROR No.1: Payment of additional remuneration did not reduce bureaucrats’ hunger for
money.
Indeed, despite such payments, junior civil servants of the rank of Gayus Tambunan turned into tax
brokers. This lowly office worker in the Surabaya Tax Office was even able to manipulate taxation
processing. Furthermore, the unreasonably high level of wealth of Justice Bahasyim, the judge who
passed judgment on the Gayus Tambunan case, caught the public eye. Unreasonable levels of wealth
have also been in evidence in the case of other MoF staff. All this is evidence that the payment of
additional remuneration does not negate civil servants' predilection for corruption.
ERROR No. 2: Additional remuneration has not improved performance.
Extra spending of Rp 34.9 trillion on the civil service in 2010 (an increase of 27% on the 2009 figure)
did not see progressive
improvement in the
standard of service
provided by the
bureaucracy. That is
proof enough that
addtional remuneration
did not enhance civil
service performance.
The logic involved here
has to be inverted:
instead of using
remuneration as a yard-
stick of performance,
performance has to be the yardstick for levels of remuneration. That means that the bureaucracy has to
demonstrate improved performance and only then should extra remuneration be paid.
ERROR No. 3: Payments of additional remuneration did not have a clear basis in law.
In the MoF’s case the payments were authorized by Minister of Finance decisions Nos.
289/KMK.01/2007 and 290/KMK.01/2007. These stipulated that directors-general at the top of their
pay grade should receive additional remuneration of Rp 46.9 million per month. At first, these
developments were criticized by the BPK, but shortly thereafter the BPK itself decided—by way of
-
20,0
40,0
60,0
80,0
100,0
120,0
140,0
160,0
180,0
2005 2006 2007 2008 2009 2010
Tri
lyu
n
Trend Peningkatan Belanja Pegawai Trends in Expenditure on Civil Servants
Rp
Tri
llio
ns
Behind the Glitz of the 2010 Budget -23-
decisions taken in-house—that its officials too should receive additional remuneration. Subsequently,
presidential regulation No. 19/2008 approved additional remuneration for the Supreme Court, with the
Chief Justice for example receiving extra Rp 50 million per month. Even though the salary increases
were within the ambit of these three institutions' policies aimed at promoting bureaucratic reform,
their basis in law was not clear-cut, given that they had been put in place by internal decisions.
ERROR No. 4: This largesse at the expense of the public purse was a burden on the State
budget.
FITRA has discovered that payments of additional remuneration in the MoF, the BPK and the
Supreme Court in 2008 led to huge increases in civil service costs in all three institutions— 270% in
the MoF, 230% in the Supreme Court and 163% in the BPK—and soaked up as much as Rp 9.5
trillion. In 2010, in the mid-year revised State budget (APBN-P), the government appropriated Rp
13.9 trillion for the payment of additional remuneration in several public institutions—increasing the
original APBN allocation (Rp 10.6 trillion) by Rp 3.3 trillion.
ERROR No. 5: Payments of additional remuneration within selected public institutions made
other civil servants envious.
In truth there was no good reason why the MoF, the BPK and the Supreme Court should have been
singled out as playing more important roles than other institutions. Despite being keeper of the public
purse, it was inappropriate for MoF to immediately grant its own staff a pay increase on the basis of a
decision taken in-house. So too with the BPK and the Supreme Court, even though the former’s role is
to vet the finances of other institutions and the latter is the highest administrator of justice in the
country. Given that payments of additional remuneration benefitted only top bureaucrats, they always
ran the risk of making the rest of the bureaucracy envious.
ERROR No. 6: The Presidential Palace has overseen a blow-out of the civil service.
The President took maximum advantage of Law No. 39/2008 concerning Ministries and Agencies to
accommodate the political interests of his coalition partners in the formation of his government. His
new government comprised 39 ministries and agencies plus 10 deputy ministers. But the role of these
deputy ministers and the division of responsibilities between them, their ministers and echelon 1 civil
servants have not so far not been clarified. The President also planned to increase the salaries of
ministers and their officials during 2010. Thus, the Presidential Palace, supposedly a driving force
behind civil service reform, turned out to be a poor role model of bureaucratic efficiency. Instead, its
own bureaucratic structures became more bloated and convoluted. The palace spawned special staff,
private staff, spokespersons, work units, the Presidential Advisory Council, the Legal Mafia Unit, and
the so-called (now disbanded) ―Team 8‖. No evaluation has ever been made of the purpose and
output of any of these groups. This excessive expansion of Palace staff placed extra burdens on the
State budget. In the 2010 APBN the line item termed ―Presidential Work Units‖ accounted for Rp
17.1 billion and, separately, Rp 34.5 was appropriated to the Presidential Advisory Council.
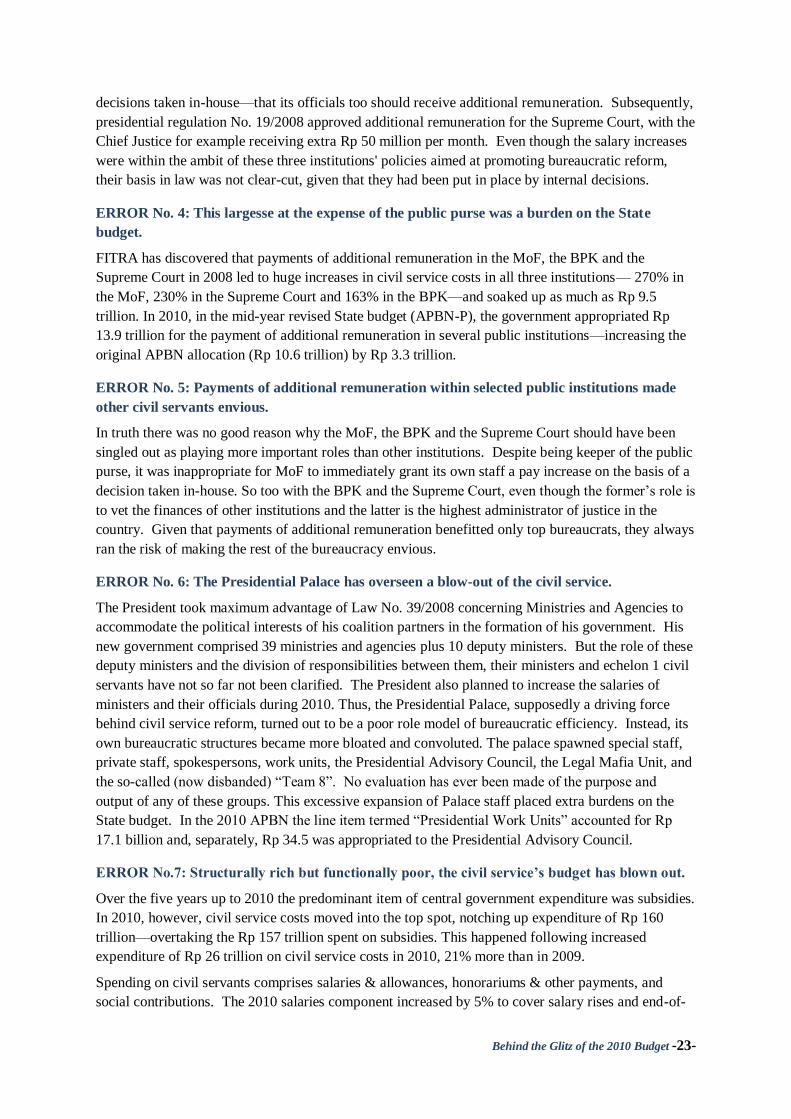
ERROR No.7: Structurally rich but functionally poor, the civil service’s budget has blown out.
Over the five years up to 2010 the predominant item of central government expenditure was subsidies.
In 2010, however, civil service costs moved into the top spot, notching up expenditure of Rp 160
trillion—overtaking the Rp 157 trillion spent on subsidies. This happened following increased
expenditure of Rp 26 trillion on civil service costs in 2010, 21% more than in 2009.
Spending on civil servants comprises salaries & allowances, honorariums & other payments, and
social contributions. The 2010 salaries component increased by 5% to cover salary rises and end-of-

Behind the Glitz of the 2010 Budget -24-
year bonuses. The honorariums & other payments component—covering salary increases for the
President & ministers and additional remuneration in 10 other ministries and agencies—increased by
Rp 11 trillion from Rp 13.9 in the 2009 revised budget (APBN-P) to Rp 25.43 trillion in the 2010
APBN.
These increased civil service costs were at the expense of programs directly affecting the welfare of
the poor. Expenditure on subsidies in 2010 fell overall by Rp 297 billion. And it was precisely in
areas of greatest importance to the poor—non-energy items—where the cuts were deepest (Rp 6.8
trillion). By contrast, energy items attracted additional subsidies of Rp 6.5 trillion. Cuts to non-energy
subsidies included: Rp 1.5 trillion (for food items), Rp 3.7 trillion (fertilizer), Rp 56 billion
(seeds/seedlings) and Rp 350 billion (generic medications). In addition, the social welfare budget was
also cut by Rp 8.3 trillion, inter alia affecting school operational assistance (BOS); health insurance
for the poor (jamkesmas); development of courses and institutions (PKK); and the National
Community Empowerment Program (PNPM).
In light of the errors made in implementing the additional remuneration policy, it is recommended that
the central government adopt the following measures:
1. Place a moratorium on additional remuneration payments: the government should take this step because such payments have been shown to be unable to stem corruption or improve
efficiency. Indeed their effect has been quite the opposite: they have placed extra demands on
the budget and have the potential to stir up feelings of envy within the civil service. The DPR should remove any provision for additional remuneration from the revised 2010 budget
(APBN-P).
2. Utilize the “reverse burden of proof” principle: civil service reform should be underpinned by the use of this principle so that money-hungry bureaucrats, unduly rich because of abuse of
their official positions, can be identified.
3. Ridding the bureaucracy of would-be capitalists: steps should be taken to rid the civil service of any modus operandi motivated by the desire for monetary gain. As long as such a
culture permeates the civil service, new recruits will be contaminated by it, only to become
new agents of a money-hungry bureaucracy.
4. Restoring the public welfare component of the APBN in accordance with Article 23 of
the 1945 Constitution: the State budget must fulfill the mandates of the Constitution. Thus
the Rp 13.9 trillion appropriated in the 2010 APBN for additional remuneration should be re-allocated for expenditure on health insurance for the poor and other poverty alleviation
programs.

Behind the Glitz of the 2010 Budget -25-
Funding for Travel: Pocket Money for Beauty Parlors
At times when budgets are being framed the President always calls on ministries and agencies to save
money inter alia by economizing on official travel and on workshop/seminar type activities. The
Minister of Finance reiterates the President’s call in every regulation issued to set upper spending
limits on ministries' and agencies' annual budgets. But no one takes any notice of either the President
or the Minister of Finance. Indeed, over the past three years, spending on official travel has increased
by a whopping Rp 4 trillion every year—showing that talk of saving money on travel is nothing more
than political rhetoric.
Generally, appropriation levels for official travel are increased in the mid-year revised budget
(APBN-P)—when both the President and the public are not paying attention to the processes
involved. Thus the 2009 APBN set expenditure on official travel at Rp 2.9 trillion, but in APBN-P the
figure blew out to Rp 12.7 trillion. And, by the end of 2009, the realized budget (APBN-R) recorded
that Rp 15.2 trillion had in fact been spent on official travel that fiscal year. A similar thing happened
in 2010: the APBN appropriated Rp 16.2 trillion for official travel, but the figure jumped to Rp 19.5
trillion in the APBN-P.
Unlike spending which is subject to a tender process, expenditure on official travel is fair game for
misappropriation. Travel votes are, without fail, always fully expended. And, in practice, money
spent on travel tickets and accommodation does not always observe spending ceilings. The Ministry
of Finance's "standard pricings" for travel already factor in potential price increases. That makes it
highly likely that money will be left over after transactions on travel.
As a source of additional income, travel votes offer the bureaucracy rich pickings. BPK audit reports
for the first semester of 2010 reveal that official travel votes were misappropriated more than any
other area of funding. At least 35 ministries or agencies were found to have misappropriated travel
8,9 9,0
11,1
15,2
19,6
-
5,0
10,0
15,0
20,0
25,0
2006 2007 2008 2009 2010
Trili
yun
Trend Belanja Perjalanan Trends in Expenditure on Travel
Rp
Tri
llio
ns

Behind the Glitz of the 2010 Budget -26-
funds to the tune of Rp 73.6 billion. Favourite tricks were imaginary trips, bogus tickets and multiple
payments. It is highly likely—indeed it is a certainty—that the incidence of misappropriation is much
greater than revealed by the BPK's findings because its audits are done on a selective basis.
Table 1
Abuses of Official Travel by Ministries and Agencies during 2009
No Ministry/
Agency Total (Rp) No Ministry/ Agency
Total (Rp)
1 People’s
Consultative
Assembly 497 190 000
18 National Defense
Council
435 378 400
2 Supreme Court
4 790 000 000
19 Communication &
Informatics 2 249 481 105
3 Attorney General’s 12 000 000 20 National Police 179 340 950
4 State Secretariat
1 598 027 410
21 National Narcotics
Board 71 393 000
5 Home Affairs
8 995 577 417
22 Development of
Disadvantaged
Regions 271 752 000
6 Agriculture
32 861 900
23 National Family
Planning Agency 43 720 000
7 National Education
3 604 746 621
24 Human Rights
Commission 141,436,900
8 Health
36 642 345 538
25 Bureau of
Meteorolgy 2 714 966 132
9 Labor &
Transmigration
755 775 800
26 Center for Financial
Transaction Reports
& Analysis 77 234 240
10 Social Affaris
10 033 000
27 National Institute of
Sciences 77 870 000
11 People’s Welfare
188 350800
28 Atomic Energy
Agency 5 240 000
12 Culture & Tourism
975 695 928
29 Agency for
Assessment &
Application of
Technology 5 058 700
13 State Owned 166 632 450 30 Aeronautics &
Space 183 000 000

Behind the Glitz of the 2010 Budget -27-
Enterprises Administration
Agency
14 Cooperatives and
Small & Medium
Enterprises 36 830 000
31 Agency for Surveys
& Mapping
108 690 000
15 Empowerment of
Women
20 437 700
32 Board of Finance &
Development
Supervision 3 140 530 000
16 Administrative &
Bureaucratic Reform 1 030 061 240
33 Ministry of Public
Housing 4 012 924 450
17 State Planning
Agency
403 878 624
34 Disaster
Management
Agency 49 215 700
35 Placement &
Protection of
Overseas Workers 30 630 000
TOTAL 73 558 306 005
Remarks: National Audit Board (BPK) data, first semester of 2010, processed by Seknas FITRA
The entire bureaucracy is infected with the overseas travel bug and institutions seemingly compete
with each other in a race to spend travel funds. An examination of 2010 DIPAs for 19 ministries and
agencies indicates that the Office of the President spent most on official travel (Rp 179 billion) in
2010, with the DPR running second. Presidential trips abroad are expensive because charter planes
are used and large delegations always accompany the President. But the fact is that the Presidency
and the DPR do not set a good example for other public institutions to follow. And it is no wonder
that no one takes any notice of the Head of State's admonitions on the need to economize by saving
money on official travel.
In third place on the list of biggest spenders on travel was the Ministry of Health. But nowhere to be
seen was evidence of why so much overseas travel was so urgent. The size of the ministry's travel
vote for 2010 was set at Rp 145 billion. And that happened at a time when the obligatory expenditure
level of 5% of the total budget on health could not be met; when millennium development goals
(MDGs) were not being achieved; when birthing mothers and babies continued to die in numbers; and
when malnutrition and infectious diseases were still rife.

Behind the Glitz of the 2010 Budget -28-
Table 2
Budget for Overseas Jaunts by Ministries and Agencies, 2010
No. Ministry/Agency Overseas Travel Vote
1 President 179.034.756.000
2 House of Representatives (DPR) 170.351.584.000
3 Ministry of Health 145.302.273.000
4 Ministry of Culture and Tourism 60.806.180.000
5 Ministry of Transportation 59.080.443.000
6 Ministry of State for Youth and Sport 38.574.175.000
7 House of Regional Representatives (DPD) 35.863.471.000
8 Ministry of Marine and Fisheries 13.839.606.000
9 People’s Consultative Assembly (MPR) 12.668.150.000
10 Ministry of National Education 12.232.071.000
11 Ministry of Agriculture 9.053.614000
12 Ministry of Home Affairs 8.726.583.000
13 Ministry of Forestry 7.247.450.000
14 Corruption Eradication Commission 5.785.160.000
15
Agency for the Assessment and Application of
Technology 2.408.025.000
16
Center for Financial Transaction Reports &
Analysis 2.260.862.000
17 Central Bureau of Statistics 1.267.368.000
18 National Archives 782.400.000
19 Ministry of Public Works 767.216.000
Remarks: Data from 19 ministry/agency DIPAs for 2010, processed by Seknas FITRA
Such largesse on offical overseas travel reflects poorly upon the level of concern the national ruling
elite (government and national parliament) have for the lot of ordinary people. On one hand the
public purse is being squandered on official jaunts, while on the other borrowed money—to the tune
of Rp 7.4 trillion—is being used to fund other budget programs such as schools operational assistance
(BOS) and poverty-reduction schemes like the National Community Empowerment Program (PNPM).
And the burden of those borrowings will weigh down future generations of Indonesians. In 2010 total
expenditure on official travel (including trips abroad) was Rp 19.5 trillion. That was four times more
than the amount spent on medical insurance for the poor (Jamkesmas)—a mere Rp 4.5 trillion. The

Behind the Glitz of the 2010 Budget -29-
government and the DPR are failing to observe the mandate of the Constitution contained in Article
23 paragraph (1): that the APBN shall be implemented in order to best attain the prosperity of the
people.
The DPR should be discharging its budgetary responsibiltiy by reining in the amounts spent on
overseas travel, thereby effecting budget savings. But in fact the DPR itself has jumped on to the
bandwagon of official jaunts. Accordingly, Seknas FITRA asks the DPR to immediately break this
bad habit and to exercise control over the amounts which ministries and agencies waste on roaming
around the world without any tangible benefit.
Seknas FITRA also requests the President not to merely talk about saving money. He should forthwith
cancel the plan to purchase a presidential aircraft. When making official trips, the President should
use commercial flights.

Behind the Glitz of the 2010 Budget -30-
Public Welfare Budget: Government Window Dressing
Domestic taxation is the single biggest contributor to State budget (APBN) revenue. It should go
without saying that this contribution by taxpayers to the APBN should be returned to them in the form
of promotion of the public interest and, more particularly, betterment of public welfare. However, a
number of the policies that emerged in the 2010 budget not only did nothing to improve people’s
welfare, they even added to the burden already being borne by the Indonesian populace.
Policies impoverishing the people
In 2010 the government again increased the size of the nation’s debt. Debt-related expenditure—both
repayments of capital and interest—reached Rp 159.7 trillion in 2010 (or 15% of total State
expenditure). That total exceeded the amount budgeted for community welfare programs including
most especially health (Rp 31.6 trillion) and management of natural disasters (Rp 6.4 trillion) (Graph
below).
The government also entered into new overseas loans for projects and programs totaling Rp 70.8
trillion. Most of these loans were for the benefit for the banking sector (Rp 45.4 trillion) or for non-
bank financing of privatization, government securities or restructuring of state-owned enterprises (Rp
87 trillion in all).
Government’s Half-Hearted Commitment to Resolving Public Health Issues
In each APBN from 2001 through to
2010 the amount appropriated to health
has remained at around 2% of the total
budget. That suggests that the
government’s approach to development
during that period has in some ways
worked against the achievement of
Indonesia’s millennium development
goals (MDGs). This was evident in the
funding of policies and programs that
failed even to address existing problems.
The poor of our society are subject to
people trafficking, sexual exploitation
and malnutrition among infants and
children to the point of being in danger of dying from oedema. But government policy seems to be
unresponsive to the basic rights of poor people.
Table 1
Health Budget of the 2010 Revised State Budget (APBN-P)
No. Item Total (Rp)
1 Health (APBN-P line item) 19 801 500 000
2
Special Allocation Fund (DAK), Health Allocations
2010 2 829 760 000

Behind the Glitz of the 2010 Budget -31-
3 Fund to Strengthen Local Infrastructure and Public
Facilities (DPIPD) Health Funding 575 935 500
4
Fund to Strengthen Fiscal Decentralization to Speed
up Regional Development (PDFPPD) Health
Funding 794 890 798
Total 2010 APDN-P Health Budget 24 002 086 298
Total 2010 APBN-P Expenditure 1 126 146 476 312
Health Budget as Percent of whole APBN-P for
2010 2.13%
Remarks: data from a collection of 2010 APBN DIPAs, processed by Seknas FITRA
The Global Hunger Index places Indonesia in the ―very serious‖ category in its index of situations of
hunger and malnutrition. This is very worrying. Ministry of Health figures indicate that 4.1 million
children under five suffer from either malnutrition or under-nourishment. But that figure includes
detected cases only. It can be assumed that the actual number is higher.
In 2010, Community Nutrition Program funding amounted to just Rp 449.8 billion. The money was
used for the provision of multivitamins, for a supplementary food program for children under five &
expectant mothers, and
for the control of
anemia. To assist local
governments to
implement these
programs the central
government provided
regions with only Rp
164.2 billion from the
Community Nutrition
Program vote. The
money was transferred
to regions in the form
of ―dana dekonsent-
rasi‖─funds transferred
to regions to help them
carry out tasks under
delegation from the
central government.
If the Community
Nutrition Program budget (Rp 449.8 billion) is divided by the estimated number of malnourished
children under five (4.1 million), the resulting number is Rp 109 000. That is the amount of money
per malnourished child available for the year to overcome malnutrition. Divided up further, the
amount becomes Rp 9 083 per month or Rp 303 per day. It is clearly impossible to overcome
malnutrition by spending just Rp 303 per affected child per day.
0
100
200
300
400
500
600
700
2005 2006 2007 2008 2009 2010
175
694,5
600
600 600
449,8
Rp Billions
Budget for Improved Nutrition

Behind the Glitz of the 2010 Budget -32-
Minuscule Disaster Relief Funding
In the APBN-P 2010 the government appropriated a total of Rp 6.43 trillion for the management of
natural disasters to be distributed across 8 ministries and agencies. That amount was just 0.53% of the
combined expenditure of all regional governments. It is clearly an insufficient amount, given the
extensive damage and misery natural disasters have recently caused.
This minuscule appropriation for disaster relief illustrates the government’s lack of preparedness to
confront the disasters which occur regularly in Indonesia. It amounts to no more than a token
measure in response to public pressure around the issue of natural disasters—always a hot public issue
in this country.
In the 2010 budget the following specific disaster management funding was provided: Rp 137.85
billion to the Bureau of Metereology, Climatology and Geophysics for programs aimed at preventing
natural disasters—in particular, development of early warning systems for tsunamis, the weather and
the climate in general; Rp 42.27 billion to the National Disaster Management Agency (BNPB) and the
National Mapping and Survey Agency (Bakosurtanal) for development of a national disaster
management system and the identification of disaster-prone areas both on land and at sea; Rp 666.12
billion to Armed Forces Headquaters, the Ministry of Public Works, the Ministry of Social Affairs,
BNPB and Bakosurtanal for provision of emergency responses to natural disasters; Rp 6.89 billion for
the control of volcanic lava flows; and Rp 1.5 trillion for the prevention of floods in the form of flood
control infrastructure and public facilities put in place by the Ministry of Public Works.
The government’s accumulated experience of natural disaster situations should be reflected in the
level of funding it allocates for disaster management. The emergency response to the tsunami in
Aceh, on it own, cost Rp 1.25 trillion. Given the large number of disaster-prone areas in Indonesia,
the government should at the very least allocate around 1% of the State budget specifically for
disaster management programs. That would have amounted to Rp 12 trillion in the 2010 budget. Let
us take as an example the damage caused to Central Java and the Special District of Yogyakarta by
the eruption of Gunung Merapi in October/November 2010. That disaster displaced 280 613 local
residents. Just providing that number of people with food cost Rp 4.34 billion every single day. And
that’s taking no account of funding needed to respond to other disasters.
Table 2
Fragmentation of Disaster Management Budget across 8 Ministries/Agencies
No. Ministry/Agency/Program Funding
(Rp billion)
1 MINISTRY OF HOME AFFAIRS─Directorate-General of General
Government
Program of capacity building for regional governments in the mitigation of
natural disasters and other dangers
13.75
2 MINISTRY OF DEFENSE─Armed Forces Headquarters

Behind the Glitz of the 2010 Budget -33-
Management of natural disasters/emergency responses 2.50
3 MINISTRY OF PUBLIC WORKS─Directorate-General of Water
Resources
Management of natural disasters/emergency responses 17.81
Program to develop flood control infrastructure and public facilities 1 475.00
Program to develop infrastructure and public facilities to control lava flows 116.79
Rehabilitation of flood control infrastructure and public facilities 130.76
Rehabilitation of infrastructure and public facilities to control lava flows 6.89
Program to maintain flood control public facilities 103.76
4 MINISTRY OF SOCIAL AFFAIRS─Directorate-General of Aid and
Social Welfare
Conduct of the search for survivors of national disasters and other
catastrophes
290.36
Provision of social welfare in the search for survivors of disasters 7.05
5 BUREAU OF METEREOLOGY, CLIMATOLOGY & GEOPHYSICS
Development of a tsunami early warning system 84.60
Development of a weather early warning system 43.85
Development of a climate early warning system 9.40
6 NATIONAL SURVEY AND MAPPING AGENCY
Determination of natural disaster prone areas both on land and at sea 3.70
Provision of framework of geodetic data on natural disasters 2.00
7 NATIONAL DISASTER MANAGEMENT AGENCY
Development of a national disaster management system 38.57
Development of a national management system for post-natural disaster and 60.36

Behind the Glitz of the 2010 Budget -34-
post-civil disturbance situations
Monitoring implementation of rehabilitation and reconstruction 20.32
8 NATIONAL SEARCH AND RESCUE AGENCY
Provision of infrastructure and public facilities supporting search and rescue
operations
348.40
9 MINISTRY OF EDUCATION
Provision of special disaster-related support to teachers in isolated and
underdeveloped areas
25 032 304.00
Total 2.640.00
Remarks: Data from a collection of Budget Implementation Checklists (DIPAs) for 2010, processed by Selnas
FITRA
The National Community Empowerment Program (PNPM) Has not Reduced Poverty Levels
The goverment regards the PNPM as the cure-all for poverty. In 2007 it allocated Rp 3.9 trillion for
PNPM and by 2010 the funding figure had risen to Rp 11.8 trillion. To be able to provide such
funding the government borrowed US$ 774 million (Rp 7.4 trillion) from the World Bank. While
funding for the PNPM has trended upwards each year, the program has not measurably reduced the
number of poor in
Indonesia. There is also
something awry with the
PNPM program—it
smacks of politicisation.
Thus in 2009, a general
election year, there was
a significant increase in
funding for the PNPM
compared to 2008—in
fact a jump of no less
than Rp 4.2 trillion.
Whereas in 2008 PNPM
funding theoretically
available for reducing
the number of poor by
one person was Rp 543 000, in 2009 the per person amount available rose to Rp 2.8 million. There
was suspicion that this hike in expenditure to reduce poverty levels was the result of policies put in
place in the lead up to the general election.
Furthermore, regional governments were forced to make use of what are termed Regional Funding for
Joint Activities (DDUB) to meet their PNPM co-funding obligations that amounted to between 20%
and 40% of APBN appropriations to PNPM. None of this PNPM funding was classified as regional
37
35
33
31
26
28
30
32
34
36
38
0
2.000.000
4.000.000
6.000.000
8.000.000
10.000.000
12.000.000
14.000.000
2007 2008 2009 2010
An
gka
Kem
iski
nan
Da
lam
JJu
ta
An
ggar
an P
NP
M D
ala
m J
uta
PNPM Pedesaan PPNPM Perkotaan
PNPM Daerah Tertinggal PNPM Infrastruktur Sosek
PNPM Infrastruktur Pedesaan Angka Kemiskinan
Bu
dg
et f
or
PN
PM
(R
p m
illi
on
s)
Nu
mb
er o
f P
oo
r (m
illi
on
s)
PNPM (Villages)
PNPM (Less Developed
Areas) PNPM (Village Infrastructure)
PNPM (Cities)
PNPM (Socio-economic
Infrastructure)
Number of Poor

Behind the Glitz of the 2010 Budget -35-
fiscal transfers (dana perimbingan). Nor was it equated with ―dana dekonsentrasi‖ or ―dana tugas
pembantuan‖—funds transferred to regions to enable them to carry out tasks on behalf of the central
government. All of which means that central government funding of the PNPM has been violating the
spirit of Law No. 33/2004 which regulates transfers of funds from the central government to regions.
Table 3
Budget for National Community Empowerment Program (PNPM) and Poverty Numbers,
2007-10 APBNs
Activity 2007 (Rp) 2008 (Rp) 2009 (Rp) 2010 (Rp)
PNPM (Villages) 1 957 050 000 000 4 309 349 000 000 6 348 850 000 000 9 685 750 000 000
PNPM (Cities) 1 946 100 000 000 1 974 460 000 1 849 404 000.000 1 356 425 000 000
PNPM
(Undeveloped
Areas) 283 900 000 119 750 000 000 11 375 500 000
PNPM (Socio-
economic
Infrastructure) 707 516 000 000 810 500 000 000 425 500 000 000
PNPM (Village
Infrastructure) 205 500 000 000 355 500 000 000 355 500 000 000
Total PNPM 3 903 150 002 007 5 224 623 362 008 9 484 004 002 009 11 834 550 502 010
Poverty Level 16.58% 15.42% 14.15% 13.33%
Number of Poor 37 168 300 34 963 300 32 530 000 31 020 000
Total Increase
PNPM Spending 1 321 473 360.001 4 259 380 640 001 2 350 546 500 001
Total Decline in
Number of Poor 2 205 000 2 433 300 1 510 000
Cost of Poverty Reduction per Person 543 079 2 820 782
Remarks: Data from a collection of DIPAs for 2007-10 budget years, processed by Seknas FITRA
Education Budget: Ever Larger, Ever Less Accounted for
The achievement of the target of spending 20% of the APBN on education within five years of the
passage of the consitutional amendment mandating that target is in fact not something to rejoice
about. Firstly, a judicial review of Law No. 20/2003 concerning the National Education System
resulted in the salaries of teachers being included in the 20%. Second, achievement of the 20% target
became very politicised in the lead up to the 2009 general election. And, finally, the central
government and regions do not yet agree on how the 20% should be calculated. They are both
claiming that education funding transferred via the General Allocation Fund (DAU), the Special

Behind the Glitz of the 2010 Budget -36-
Allocation Fund (DAK) and the Revenue Sharing Fund (DBH) should be counted as part of the 20%
share of their respective budgets to be spent on education. So the question remains: does 20% mean
20% of the APBN and each APBD separately, or is it meant to be 20% of APBN+APBDs?
Expenditure of such a large amount of money in the achievement of the 20% expenditure target
should have produced tangible outcomes in the form of broader access to quality education. But,
unfortunately, despite meeting the 20% target for two years in a row, there is no sign at all of such
outcomes. School buildings continue to be in poor condition, large numbers of children are dropping
out of school and an increasing number of questions are being asked about the quality of national
examinations—all going to show that the education sector is still in a parlous state. Thus, an ever
larger education budget has, despite all, failed to produce a situation where greater access to quality
education is guaranteed. This has come about, as is argued below, because of low levels of
accountability for education funds.
Firstly, most recent BPK (Audit Board) reports show that it was precisely the biggest recipients of
education funding (the Ministry of National Education and the Ministry of Religion) that received
―disclaimer‖ (or not offering an opinion) audit reports. To give an example: audit reports covering the
first semester of 2009 revealed 24 cases of infringements of the law by the Ministry of Education
costing the public purse Rp 2.2 trillion. In the case of the Ministry of Religion 39 such cases were
identified, resulting in misappropriation of a further Rp 2.2 trillion. These findings show that neither
of these ministries is ready to manage such large budgets.
Second, the huge education budget continues to be regarded as something akin to prject funding—
money to be divided up in shares. For example, in 2009, the education budget was divided up among
16 ministries and agencies, some directly involved in education and others not (Table 4).
Table 4
Distribution of Central Government Education Budget, 2009
No Budget Line Total Percentage
Share
1 Ministry of National Education 61 525 476 815 000 68.7
2 Ministry of Religion 23 275 218 223 000 26.0
3 Ministry of Public Works 42 377 950 000 0.0
4 Ministry of Culture and Tourism 67 228 388 000 0.1
5 National Library 259 951 730 000 0.3
6 Ministry of Finance 64 700 000 000 0.1
7 Ministry of Agriculturre 75 000 000 000 0.1
8 Ministry of Industry 100 000 000 000 0.1
9 Ministry of Energy and Natural
Resources
23 100 000 000 0.0
10 Ministry of Transportation 800 000 000 000 0.9

Behind the Glitz of the 2010 Budget -37-
11 Ministry of Health 1 300 000 000 000 1.5
12 Ministry of Forestry 14 900 000 000 0.0
13 Ministry of Marine & Fisheries 250 000 000 000 0.3
14 National Defense Council 24 500 000 000 0.0
15 Bureau of Metereology 16 000 000 000 0.0
16 National Atomic Energy Agency 7 400 000 000 0.0
17 Expenditure of code 69 ministries
and agencies
1 705 000 000 000 1.9
Total 89 550 853 106 000 100.0
Remarks: Data from a collection of DIPAs for 2009 APBN, processed by Seknas FITRA
Third, the government does not have an overall plan or blueprint for the provision of cheap, high
quality education. In the draft 2010 APBN the government increased the education budget by Rp 11.7
trillion, bringing total allocations to Rp. 221.4 trillion. But its reason for doing so was not that it
accorded with a grand plan of education needs. It was due rather to an overall increase in government
expenditure. The extra money was distributed among ministries as follows: Rp 6.3 trillion (Ministry
of National Education), Rp 2 trillion (Ministry of Religion), Rp 600 billion (Ministry of
Transportation) and Rp 300 billion (Ministry of Health, for health related scholarships).
Fourth, larger amounts of education funding in regions was accompanied by an ever increasing level
of misappropriation of funds. BPK audits of regional government financial reports for the semester of
2009 showed that 80 regions were guilty of misappropriating education funding to the tune of Rp
900.7 billion. Implicated as players in these cases of abuse were heads of local departments of
education and school principals. Sadly, an education funding framework which is not held
accountable has extended the web of corruption to our schools.
Fifth, the policies of regional governments on the allocation of educational funding are not effective.
Research by Seknas FITRA in 41 regional government areas (kabupatens and cities) has shown that,
in general, regions are meeting the consititutional mandate to spend 20% of their budgets on
education. But there is a problem: most of the 20% is being consumed by ―indirect‖ (routine)
expenditure. It has been allocations received via the Special Allocation Fund (DAK)—which have
risen consistently between 2007 and 2009—which have financed a lot of ―direct‖ (development)
expenditure. In 2007 DAK allocations, on average, financed 33% of regions direct expenditure in
their educations sectors, with the proportion rising to 38% in 2008 and 50% in 2009. This situation
underlines the ineffectiveness of current education policies at the regional level and the extent to
which regions continue to depend on the central government in this area.

Behind the Glitz of the 2010 Budget -38-
Graphic: Regional Governments’ Allocation of Educational Funds
Remarks: “kota”in the above graph means “city government”. The absence of “kota” indicates a Kabupaten
government.
Lack of clarity about the objectives of educational funding opens the door for it to be politicized. A
big budget, on its own, cannot sustain high quality education. As long as that budget is not used well,
it will not be effective and will leave the door open for corruption to spread in the education sector.
26
64
70
87
95
116
116
116
121
125
133
147
151
152
164
180
184
197
203
205
211
244
271
272
285
287
306
307
314
331
350
356
409
410
470
546
552
0 100 200 300 400 500 600
Kota Banjar
Kota Padang Panjang
Sumbawa Barat
Kota Blitar
Kota Parepare
Wajo
Aceh Barat
Kota Pekalongan
Kota Gorontalo
Bone
Sidrap
Dompu
Kota Palu
Polewali M andar
Kota Palangkaraya
Lombok Barat
Aceh Besar
Serdang Bedagai
Kota Pontianak
Situbondo
Bondowoso
Kota Surakarta
Lombok Timur
Kendal
Kota Bandar Lampung
Semarang
Bojonegoro
Aceh Utara
Pasuruan
Sumedang
Kota Padang
Boyolali
Cilacap
Kota Semarang
M alang
Garut
Kota Surabaya
R p M ilyar
Belanja Tidak Langsung
Belanja LangsungDirect Expenditure
Indirect Expenditure
Rp Billions

Behind the Glitz of the 2010 Budget -39-
Secretive despite Obligation to be Accessible
The extent to which public institutions have implemented the provisions of Law No. 14/2008
concerning Freedom of Access to Public Information (known as UU KIP) since its enactment in 2008
has fallen well short of what the law demands. On one hand the Central Information Commission has
been established along with a number of provincial level information commissions. And UU KIP’s
enabling regulation, PP No. 61/2010 has been issued. But on the other hand, public institutions—the
executive, the legislature, the judiciary, non-ministry government agencies and other public
agencies—are still not open about the budget information under their authority. A trial run undertaken
by Seknas FITRA to gain access to Budget Implementation Checklists (DIPAs) of 69 public
institutions has shown that the predisposition to be secretive persists.
DIPAs Still Regarded as Confidential
Most public institutions still regard the
budget information in their DIPAs as being
state secrets. Of the 69 institutions Seknas
FITRA asked to make their DIPAs
available, 54 did not hand them over. Of
that 54, 13 proffered various excuses for not
obliging, while 41 others gave no response
at all. FITRA managed to obtain DIPAs
from just 15 of the institutions approached.
Public institutions not making their DIPAs
available generally gave the excuse that they
were checking first with the Ministry of
Finance or the national Audit Board. But, alas, even these two institutions did not make their DIPAs
available, even though they should set an example for other agencies by granting public access to
budgetary information. This exercise shows that the Constitution’s mandate that budgets should be
managed in an open way is, as of 2010, not being observed (see Attachment).
Bureaucracy not yet Ready to Implement UU KIP
Public institutions are overall not yet
ready to implement freedom of
information practices. Of the 15
institutions that provided copies of their
DIPAs to Seknas FITRA, 8 handed them
over only after a follow-up letter of
complaint was sent to them. Four others
(the Ministry of Culture and Tourism, the
National Electoral Commission, the
Corruption Eradication Commission, and
the General Election Supervisory
Agency) made their DIPAs available
within 1-17 working days of the receipt of a letter of request. Two others (the State Secretariat and
House of Regional Representatives (DPD)) provided access to the documents only after 17 working
8
1
4
2
Time Taken to Provide DIPA memberi DIPA setelahdiajukan keberatan
memberi DIPA pada 1-10 hari setelah suratpermintaan
memberi DIPA pada11-17 hari setelahsurat permintaan
memberi DIPA padalebih dari 17 harisetelah suratpermintaan
Provided after
complaint letter
Provided within 11
& 17 days
Provided after
more than 17 days
Provided within 1-
10 days
15
13 41
merespon danmemberikan DIPA
merespon tetapitidak memberikanDIPA
diam sajaNo response
Responded and
provided DIPA
Responded but
did not provide
DIPA

Behind the Glitz of the 2010 Budget -40-
days (i.e after the prescribed deadline). Only one institution (the Ministry of Transportation)
responded immediately to FITRA’s letter of request.
Only One of the Public Judicial Institutions Approached Provided Information
Given their responsibility for law enforcement, public judicial institutions should be role models for
other public institutions in the observance of the provisions of UU KIP. But, in fact, only one of
them—the Corruption Eradication Commission—responded without prompting to FITRA’s letter of
request for copies of their DIPAs. The others simply said nothing at all. It would be entirely
reasonable for the public to take a dim view of the judiciary because of this turn of events. And that
in turn could lead to a loss of public confidence in judicial institutions.
Table 1
Responses of Public Judicial Institutions to Requests to Make DIPAs available
No Institution
Response Availability of DIPAs
Responded
without
prompting
Responded
after receipt of
a letter of
complaint
Did not
respond
Made DIPA
available
Did not make
DIPA
available
1 Supreme Court V V
2 Constitutional Court V V
3 Attorney General’s V V
4 National Police V V
5
Corruption
Eradication
Commission V V
TOTAL 1 4 1 4
Within the Legislature Only the House of Regional Representatives (DPD) Responded
There is no basis to the claims of the House of Representatives (DPR) and of the People’s
Consultative Assembly (MPR) that they are houses of the people with open doors and that they
welcome criticism of their management of budgets. The DPR is our national legislature—it even
enacted UU KIP back in 2008—but it could not see its way clear to repond to FITRA’s request and
provide a copy of its DIPA. The same goes for the MPR. By contrast, the DPD, which has only
limited public policy responsibilities, was more reponsive and provided a copy of its DIPA (albeit 24
days after it received FITRA’s letter of request).

Behind the Glitz of the 2010 Budget -41-
Table 2
Responses of Legislature to Request to Make DIPAs Available
No Institution
Response Availability of DIPAs
Responded
without
prompting
Responded after
receipt of a letter of
complaint
Did not
respond
Made
DIPA
available
Did not make
DIPA available
1 MPR V V
2 DPR V V
3 DPD V V
TOTAL 1 0 2 1 2
Not all information in DIPAs is made public
Not all DIPAs made available to FITRA were what
was asked for. Five of the fifteen DIPAs received
were incomplete. Important pages in the DIPAs of the State Secretariat, the Agency for the
Assessment & Application of Technology (BPPT)
and the National Narcotics Board (BNN) seem to
have been deliberately withheld. Pages 3-4 of the State Secretariat document were missing,
seemingly torn out. It could be deduced that the
missing pages dealt with the supply of motor vehicles. In the BPPT’s document there were no
page II-11 or II-12, containing budgetary
information on proposed expansion of the agency.
In the case of BNN’s DIPA page 4 was missing.
Two further DIPAs were incomplete: those of General Election Supervisory Agency and the National
Standardization Board (BSN). The former’s did not provide details of expenditure by catergory but included all spending under the heading ―Other Expenditure‖. As for the BSN, its DIPA did not
include attachments II, III and IV which contained details of expenditure on overseas offical travel.
On the basis of its research findings outlined above, FITRA believes that public institutions are
reluctant to be provide public access to budgetary information. But one of the aims of UU KIP is to
increase the level participation of society at large in the life of the nation. Accordingly, Seknas
FITRA recommends that:
1. Public institutions should be open about public information on budgets. They should remember
that they are only the managers of public funds. The source of those funds is the people and the
people have the right to know how those funds are being managed.
2. Public institutions should immediately establish offices for the management of information and
doucmentation (freedom of information offices). They should also publicize the existence of these
offices to make the general public aware of the freedoem of information mechanisms available to
them.
10
5
Completeness of Information
in DIPA
lengkap
tidak lengkap
complete
incomplete

Behind the Glitz of the 2010 Budget -42-
3. They should define more clearly the categories of documents which are exempt from public
release following an assessment of the potential consequences of their release as laid down in
government regulation PP No. 61/2010 and Central Information Commission regulation No.
1/2010.

Behind the Glitz of the 2010 Budget -43-
Attachment
Public Institutions Responding and Making DIPAs Available
Executive 1. Ministry of State Secretariat
2. Ministry of Industry
3. Ministry of Agriculture 4. Ministry of Transport
5. Ministry of Culture and Tourism
Legislature 1. House of Regional Representatives (DPD)
Judiciary 1. Corruption Eradication Commission
Non-ministry government agencies 1. National Archives
2. Central Bureau of Statistics
3. National Electoral Commission
Other public bodies 1. General Election Supervisory Agency
2. National Narcotics Board 3. Center for Financial Transaction Reports and
Analysis
4. Agency for the Assessment and Application of Technology
5. National Standardization Board
Public Institutions Responding but Not Making DIPAs Available No Public Institution Excuses for not providing DIPA
1 Minstry of Foreign Affairs Consulting with Audit Board and Board of Finance
and Development Supervision.
DIPA could be abused by a third party.
2 Ministry of Defense DIPA not held in Ministry. Approach should be re-
directed to Ministry of Finance.
3 Ministry of Home Affairs Promised to provide, but did not do so.
4 Ministry of Public Works Felt it was already shared on Ministry’s website.
5 Ministry of Communication and
Informatics
Only provided with DIPA software, without a
password.
6 Ministry of Research and Technology Awaiting outcome of consultations with Ministry of
Finance.
7 Ministry of Female Empowerment DIPA was in process of being revised.
8 Board of Finance and Development Supervision
Invited to collect the document at agency’s office, but when they went there FITRA staff were given the
run around and received nothing. 9 National Nuclear Energy Agency
10 Nuclear Energy Regulation Agency Invited us to look on the website of the Ministry of Finance, but nothing was found there.
11 National Defense Council Claimed letter of request not yet received; could not
provide information (after a follow up letter of complaint was sent to them) 12 National Library

Behind the Glitz of the 2010 Budget -44-
13 Ministry of Maritime Affairs and
Fisheries
Public Institutions not Responding at all
Executive
1 Coordinating Ministry of Political, Legal and Security Affairs
2 Coordinating Ministry for the Economy
3 Coordinating Ministry of People’s Welfare
4 Ministry of Law and Human Rights
5 Ministry of Finance
6 Ministry of Energy and Mineral Resources
7 Minstry of Trade
8 Ministry of Forestry
9 Ministry of Labor and Transmigration
10 Ministry of Health
11 Ministry of National Education
12 Ministry of Social Service
13 Ministry of Religion
14 Ministry of Cooperatives and Small and Medium Enterprises
15 Ministry of the Environment
16 Ministry of Administrative and Bureaucratic Reform
17 Ministry of the Development of Disadvantaged Regions
18 Ministry of National Development Planning
19 Ministry of State Owned Enterprises
20 Ministry of Public Housing
21 Ministry of Youth and Sport
Legislature
1 People’s Consultative Assembly (MPR)
2 House of Representatives (DPR)

Behind the Glitz of the 2010 Budget -45-
Judiciary and Law Enforcement Agencies
1 Supreme Court
2 Constitutional Court
3 Attorney General’s
4 National Police
Non-ministry Public Agencies
1 State Intelligence Agency
2 National Civil Service Agency
3 National Bureau of Meteorology and
Geophysics
4 National Agency of Drug and Food Control
5 National Land Agency
6 Logistics Bureau
7 National Aeronautics and Space Administration Agency
8 National Investment Coordinating Board
9 Audit Board
10 Bank Indonesia
11 Indonesian Institute of Sciences
Other Public Agencies
1 Judicial Commission
2 National Commission for Human Rights
3 National Ombudsman

Behind the Glitz of the 2010 Budget -46-
Annual Ritual of Audit Reports: Ending the Masquerade
After giving the government a ―disclaimer‖ (not offering an opinion) report for five years in a row,
the national Audit Board (BPK) issued a ―qualified opinion‖ on the 2009 Central Government’s
Financial Report (LKPP). But the audit showed that the number of ―cases‖ and the extent of losses to
the public purse actually rose in 2009 compared to 2008.
The audit in question was conducted in the first semester of 2010. In its report on the 2008 LKPP the
BPK had identified 378 cases of abuse involving misappropriation of Rp 3.73 trillion. In the 2009
LKPP audit the number of identified infringements of the law rose to 650 with total misappropriations
reaching Rp. 4.98 trillion (Graphic below).
The real issue here is not the BPK’s slightly more favorable overall opinion on the 2009 LKPP. Nor
is it the increased number of misappropriation or the greater losses sustained by the public purse in 2009. The real issue is that BPK audit reports amount to little more than a yearly ritual. Few BPK
findings are followed up. Moreover, the findings of audit reports tend to be open to negotiation.
When findings of audit reports come before the DPR for consideration, the discussions around them
are not as serious as when the draft APBN is examined. Nor does the DPR’s National Finances Accountability Committee yet play a meaningful role here, as it is still a new part in the DPR’s
establishment.
Table 1
Categories of Loss in Audit Board (BPK) Findings on Ministries and Agencies, 2009
No Category of Loss No. of
Cases Value (Rp millions)
Infringements of legislative provisions causing:
1. State Losses 172 80 469.88
2. Potential State Losses 59 2 316 709.01
3. Losses of Revenue* 112 2 256 123.64
4. Administration 245 -
Trends in Audit Board (BPK) Findings
Number of Findings Cases
Rp Trillion

Behind the Glitz of the 2010 Budget -47-
5. Failure to Economize/Wastage of
Funds 26 7 305.22
6. Ineffectiveness* 36 320 250.53
Total 650 4 980 858.30
* Included in ―Losses of Revenue‖ and ―Ineffectiveness‖ are values for foreign exchange
transactions converted at Bank of Indonesia median exchange rates as at 30 June 2010.
As can be seen in Table 1, cases involving infringements of legislative provisions caused losses in
five of the six categories listed, with ―Administration‖ being the exception. Of the five categories of abuse, ―Potential State Losses‖ and ―Losses of Revenue‖ contributed 46.5% and 45.3% respectively
to total losses to the public purse. The contributions of the other 3 categories were: ―State losses‖
(6.4%), ―Ineffectiveness‖ (1.6%) and ―Failure to Economize/Wastage of Funds (0.2%).
The sub-category on ―funding for loan transfers‖ recorded the greatest potential losses to the public
purse: Rp 1.65 trillion or 33% of all losses. Next was the Ministry of Public Works with
misappropriations totaling Rp 1.32 trillion or 27% of total losses.
Other offenders were: at 11% of total losses: the Ministry of Home Affairs (Rp 557.6 billion); at 5%:
both the Ministry of Health (Rp 264.6 billion) and the Ministry of Foreign Affairs (Rp 245.8 billion). Included among 73 other offending public institutions were: the Ministry of Social Welfare (Rp 202.1
billion or 4% of overall losses), the Ministry of National Education (Rp 153.9 or 3%), the National
Police (Rp 121.5 billion or 2%), the Ministry of Communication and Informatics ((Rp 62 billion or 1%) and the Ministry of Forestry (Rp 51 billion or 1%).
Losses of State revenue usually occur because of the following:
The supply of imaginary goods and services
Regular suppliers of goods and services not completing jobs
Shortfalls in amount of work done
Overpayments
Fixing prices in excess of set standard prices
Multiple payments of honorariums and official travel costs
Acceptance of goods and services not in accord with contracted specifications
Costings not in accord with or in excess of stipulated levels etc.
Potential losses of State revenue take the following form:
Assets falling under the control of outside parties
The purchase of disputed assets
Fixed assets whose whereabouts are unknown
Government credit, loans or revolving funds which could potentially not be repaid etc.
The BPK uncovered several ways, all on the revenue side of the budget ledger, of spending State
funding outside the budget process. One widely used practice in ministries and agencies is to spend non-tax revenue without due budgetary process. On the expenditure side of the ledger, the techniques
are to make overpayments or delay the crediting of fines to consolidated State revenue. In respect of
State-owned assets or goods, poor internal oversight often means that clear evidence of government
ownership of such assets and goods does not exist.
The BPK has discovered that within the Ministry of Public Works non-tax revenue amounting to Rp
12.5 billion, originating from the Public Service Agency (BLU)-Indonesian Toll Road Authority

Behind the Glitz of the 2010 Budget -48-
(BPJT), has not been credited to consolidated State revenue. Furthermore, poor quality contracts
between the BLU-BPJT and toll road corporations (BUJT) had led to the failure of five BUJTs to meet their value added payment obligations and to pay fines amounting to Rp 14.46 billion.
The BPK has also found that the Ministry of Health has imposed levies totaling Rp 15.66 billion on its
Health Services Polytechnics in Jakarta (Nos. I, II and III), Manado, Denpasar and Makassar as well as on its Port Health Office (Class I) in Makassar. No legal basis exists for such levies most of which
(Rp 10.96 billion) have been spent outside the APBN budgetary framework.
In the Attorney-General’s department it has been found that Rp 4.45 billion—representing cash
proceeds from crimes subject to final and binding judgments, traffic fines and credits payable to the
State—have not yet been paid into consolidated State revenue. That original amount was in fact Rp 4.49 billion but of that amount Rp 43 million has been credited to the government’s coffers.
On the expenditure side of the ledger, several abuses have been identified within the Ministry of
Public Works: Rp 4.46 trillion in overpayments to third parties and Rp 25.99 million in late fees on 15 consultancy services and four programs of work in a total of 8 work units.
Losses have also been incurred in the supply of goods not in accord with specifications. In the Ministry of Home Affairs it has been found that work units within Directorate-General of Village and
Community Empowerment have been supplied computing equipment (external hard drives and
notebooks) not in accord with specifications, causing losses of State revenue amounting to Rp 55.72 million.
Another abuse which the BPK has identified is that State assets and State-owned goods (valued at Rp
1.28 trillion) are being used by outside parties in ways not in accord with their principal purposes and functions. In particular, land and buildings (valued at Rp 1.28 billion) and official motor vehicles
used by retirees (worth Rp 23.67 million) are being used by third parties. Furthermore, the Ministry
of National Education has fixed assets which so far have no certificates or other supporting evidence of legal ownership. This situation could give rise to legal problems if there were a future dispute and
ownership of the assets happened to be taken over by others. It shows that the security of State-owned
goods is not guaranteed and that the door is open for them to fall into the hands of others.
Sadly, these findings of BPK audits have not been followed with any alacrity by the ministries and
agencies involved. This is evident from an examination of follow-up action taken on audit reports
taken over the years by the central government. Up to mid-2010 85 ministries and agencies were found to have committed 11 673 infringements (involving State revenue of Rp 968.01 trillion) and a
number questionable foreign exchange transactions. Follow-up action on 4 195 of those cases has
been in accord with what was recommended. As for the other 4 782 cases (involving Rp 123.02 trillion of State revenue) and a number of foreign exchange transactions, there has been no follow-up
action whatsoever.

Behind the Glitz of the 2010 Budget -49-
The DPR’s Dysfunctional Budget: a Black Mark against Senayan
The House of Representatives (DPR) was in the spotlight for the whole of 2010. It was hoped that the
new DPR elected in the 2009 general election would bring a breath of fresh air to the way in which
the institution represented the people. But, when it set about discharging its budgetary role, it became apparent that the DPR was looking after own interests first. In the process, it was roundly criticized
by the community and its credentials began to be questioned. But the DPR was totally unmoved,
acting as if it were operating in a cocoon. Its performance throughout 2010, outlined below, is nothing
less than a black mark against the name of this Senayan-based institution.
1. A Luxury Rp 1.8 Trillion New DPR Building Equipped with Pool and Spa
The first mention of the plan to construct a new DPR building was on 15 January 2010 in a speech
to the DPR’s In-house Affairs Committee (known as BURT) by the Secretary-General of the DPR Dra. Nining Indra Shaleh M.Si. The speech was entitled ―Explanatory Notes of the DPR Secretary-
General on the Budget Performance Checklist (DIPA) of the DPR for 2010‖. According to that
DIPA, Rp 1.2 trillion was to be allocated for the DPR and Rp 734 million for the Secretariat-
General.
At the meeting on 15 January, the Secretary-General asked the members of BURT to endorse the
proposed construction of a new DPR building at a cost of Rp 1.6 trillion— a level of expenditure which had already been approved by the previous DPR which occupied Senayan from 2004-09. The
BURT membership readily signed off on the proposal.
When the proposal went before the DPR’s Budget Committee (called Banggar), the amount
allocated for the project rose to Rp 1.8 trillion. The increase was justified by the inclusion of
proposals to reinforce the structure of the Nusantara I building (Rp 67.8 billion) and to draw up a
master plan for the new DPR complex (Rp 133.3 billion) based on a multi-year program of work. This additional funding was included in the 2010 APBN-P (Table 1).
Table 1
Use of DPR Allocations in the 2010 Revised Budget (APBN-P)
No Program Details
DIPA for 2010 APBN-
P
Rp billions
1 Master plan 133.2
2 Renovation of MPs’ offices 4.5
3 Structural reinforcement of Nusantara I building 35.0
4
Construction of rooms for expert staff, legal drafters and
researchers 25.0
5 Replacement of guide rails and control mechanisms of elevators in Nusantara I Building 3.3
Total 201.1 Source: data on work unit of DPR Secretariat-General in 2010 APBN-P, processed by Seknas FITRA
The BURT’s endorsement of the DPR building plan and the additional funding for the plan put forward by Banggar were apparently not well thought through decisions. The recommendation of
the 2004-09 DPR was that the new DPR building could be developed in 2, 3, 4 or more years. In
other words, it was not an urgent project. But it now looked as if the construction of a new DPR building had become a project to keep the members of BURT busy.

Behind the Glitz of the 2010 Budget -50-
Interestingly enough, in response to public criticism, the proposed budget of Rp 1.6 trillion was cut
back to Rp 1.2 trillion. That served to heighten suspicion that something unsavory was going on within the legislature; and that skullduggery was involved in planning for the new grandiose DPR
building. But the DPR, acting as if it lived in a cocoon, persisted in the allocation of the proposed
Rp 200 billion in the APBN-P for 2010.
2. Budget Agents Masquerading as Promoters of Popular Aspirations
The demands of members of the DPR for so called ―aspiration funds”—funds to be spent on
meeting aspirations of constituents in DPR electorates—will continue to be funded in the 2011 APBN. Such funding first appeared during the mid-year revision of the 2010 APBN, when
standing Committee XI, proud of its augmentation of expected tax revenue, asked for a Rp 2
trillion share of the increased revenue for expenditure in DPR electorates. The demand was
reiterated by the Golkar parliamentary group in its comments on the government’s ―Macro-economic Framework and Principal Fiscal Policies for 2011‖. They asked for an allocation of Rp
15 billion per year per DPR constituency—imposing an annual demand of Rp 8.4 trillion on the
APBN. Golkar’s reasons for making this demand were that the provision of such funding was an obligation imposed on MPs (DPR members) when elected to the DPR; and that it would serve to
even out the spread of budget funding to areas which received little or no State funding. The
suggestion was supported by several other parliamentary political groups. But it is clear that the demand for this type of funding amounts to legalized pork-barreling. It should be refused for the
following ten reasons:
a. “Aspiration funds” will be fertile ground for undercover budget agents: Such funding
would turn MPs into legalized undercover budget agents for their own electorates. Regions would be competing with each to rush to Jakarta to lobby MPs in a bid to obtain a share of
such funding. The risk that MPs will also receive kickbacks is very high, as the funding could
easily be discounted to facilitate such payments. There could easily be a repeat of the case involving the Community Social Economic Management Program in East Java. In that case
some of the funds to be spent on community empowerment, as approved by the local
legislative assembly (DPRD), were siphoned off for kickbacks.
b. “Aspiration funds” will widen the poverty gap between regions: The argument that these
funds will serve to
even out the spread
of budgetary spending makes little
sense. The dividing
up of such funding on the basis of DPR
constituencies would
actually widen the
gap between rich and poor regions. The
reason for that is
quite simply that funding will be
concentrated in
highly populated areas—the basis on
which electoral boundaries are fixed. Thus the Special District of Jakarta (with the country’s
lowest poverty level of 3.62%) stands to receive ―aspiration funds‖ amounting to Rp 315
billion, whereas Maluku (with a poverty level of 28.3%) would receive just Rp 90 billion. Thus the program clearly hinders rather than helps the even spread of budgetary resources.
What should happen is that the poorer a region is, the greater its share of the budget should
0,005,0010,0015,0020,0025,0030,0035,0040,00
0200400600800
1.0001.2001.4001.600
DK
I Jak
arta
Kal
iman
tan
Sel
atan Bal
iK
alim
anta
n T
enga
hB
angk
a B
elit
un
gB
ante
nK
alim
anta
n T
imu
rK
epu
lau
an R
iau
Jam
biK
alim
anta
n B
arat
Ria
uSu
mB
arSu
law
esi U
tara
Mal
uku
Uta
raSU
MU
TJa
wa
Bar
atSu
law
esi S
elat
anSu
law
esi B
arat
Sum
Sel
Jaw
a Ti
mur
Yogy
akar
taJa
wa
Ten
gah
Ben
gku
luSu
law
esi T
engg
ara
Sula
wes
i Ten
gah
Lam
pu
ngN
AD
NTB
NTT
Go
ron
talo
Mal
uku
Pap
ua
Bar
atP
apu
a
Dana Aspirasi Vs Tingkat Kemiskinan
Total dana…
―Aspiration Funds‖ and Poverty Levels
―Aspiration funds‖ (Rp Billions)
Poverty levels (%)

Behind the Glitz of the 2010 Budget -51-
be. Nor would ―aspiration funds‖ address the problems of poverty and community welfare.
An area’s funding share would be highly dependent on its constituents’ lobbying power and their degree of access to DPR members.
c. “Aspiration funds” undermine budgetary planning and fiscal balance systems: The
building blocks for the national budget planning system are kabupatens & cities, provinces
and the central government. Statistics on such issues as poverty, economic growth and unemployment (which affect the level of central government funding to regions) are based on
governmental areas. By contrast ―aspiration funds‖ are based on electoral divisions which do
not coincide with the boundaries of regional governmental areas. Thus their impact on a local government area would be difficult to measure.
d. “Aspiration funds” are inconsistent with the principles of regional fiscal balance (dana
perimbangan): Such funding will become yet another entry on the list of not-properly-authorized fiscal transfers to regions. It would be outside the ambit of central government
transfers to regions provided for in Law No. 33/2004, namely fiscal transfers related to
decentralization, delegation of authority (dekonsentrasi) and co-administration (tugas
pembantuan). The DPR has no right to allocate ―aspiration funds‖ out of the blue without first amending Law No. 33/2004.
e. “Aspiration funds” are not consistent with performance-based budgeting: The enactment of Law No. 17/2003 concerning State Finances replaced Indonesia’s traditional inputs-based
budget system with one based on performance. Performance-based budgeting emphasizes the
achievement of outputs from the expenditure of budget allocations (inputs). In the case of ―aspiration funds‖ the DPR is clearly engaging in inputs-budgeting. The focus of the program
is on spending money equally divided among DPR constituencies rather than on performance
or outcomes to be achieved.
f. “Aspiration funds” would reduce budgetary efficiency: Such funding would give rise to fragmented budgets and reduce budget efficiency. Using DPR constituencies as a basis for
distributing ―aspiration funds‖ would mean that West Java (with 91 DPR seats) would receive
Rp 1.3 trillion. That would in theory be enough to eliminate West Java’s high death rate among birthing mothers. However, West Java’s 91 seats ―belong to‖ different political
parties. Allocating shares of ―aspiration funds‖ would lead to funding fragmentation and a
situation where a significant amount of money would be unable to address existing problems.
g. “Aspiration funds” have no basis in law: If appropriations for ―aspiration funds‖ are in fact
included in the 2011 APBN, they would be illegal, having no basis in law. Section 12
paragraph (2) of Law No. 17/2003 states that the State budget shall be drawn up on the basis
of government work plans. It makes no mention of DPR constituencies. The reason for that is that the DPR is not equipped to carry out economic planning, which is the preserve of the
government.
h. The DPR has no budgetary rights: The DPR has been misrepresenting itself by saying that it has budgetary rights. This is not the case. Neither the Constitution nor Law No. 27/2009
concerning Indonesia’s parliamentary institutions (the MPR, the DPR, the DPD and DPRDs)
accords any recognition to DPR budgetary rights. The DPR’s sole budgetary function is
clearly spelt out in Section 70 paragraph (2) of Law No. 27/2009: the DPR shall discuss and agree or not agree draft legislation brought before it by the President. Thus the DPR has no
right to demand a share of the State budget for use as ―aspiration funds‖. Its role is designed
to make sure that the State budget put before it by the President is consistent with promotion of the national interest.
i. “Aspiration funds” provide no political incentives for DPR members: The DPR cannot
actually spend ―aspiration funds‖. It relies on central or regional government agencies to do the spending. Thus it is difficult to see how these funds provide any sort of political incentive
for DPR members.

Behind the Glitz of the 2010 Budget -52-
j. “Aspiration funds” would tend to perpetuate the status quo: In the lead up to general
elections ―aspiration funds‖ would clearly be an effective form of pork barreling to gain support from would-be voters. That situation would occasion unhealthy political rivalry
among participants in elections. It would also favor incumbents and thus the maintenance of
the status quo.
3. DPR “Homes for Aspirations” Supposedly for Sounding out Popular Aspirations
DPR members are also piggybacking on popular aspirations to argue for the establishment of
―homes for aspirations‖ (rumah aspirasi) to be used by MPs as bases for sounding out aspirations
of their respective constituents—at a cost of Rp 112 billion, or Rp 200 million per MP p.a. The
establishment of such ―homes‖ would amount to paying twice for the same service, because MPs already receive funds and allowances for keeping in touch with constituents. Table 2 outlines
what the DPR receives for constituency work: Rp 57.15 billion for maintaining contact and
meeting with constituents; Rp 173 billion for 6 working visits to constituencies (in accordance with standing orders), 4 DPR recess visits and other individual member visits; and Rp 14 million
paid monthly to each MP as a ―communications allowance‖. Thus, even without having
―homes‖ for people’s aspirations, MPs each receive Rp 579 million p.a. to enable them to remain
in contact and hold meetings with their constituents. Up to now expenditure of these funds (including those provided during DPR recesses) has not been well accounted for. Nor has there
been any clear account of the extent to which recesses have been used to sound out popular
aspirations. Another consideration here is that the suggested ―homes for aspirations‖ underscore weaknesses in current political party mechanisms. Plainly, the machinery of political parties is
unable to accommodate and articulate popular aspirations. Political parties come to life once
every five years, in the lead up to general elections. But it is the proper role of political parties to act as channels for popular aspirations—and it is that role which should be more fully developed.
The rumah aspirasi proposal smacks of being a form of recompense from MPs for services
rendered by their support teams (plus their colleagues and friends) in their electorates. The same
sort of thinking is evident in the way MPs select their expert staff. They do not select professional experts but rather friends and political party colleagues. More broadly, the rumah
aspirasi idea is actually against the law. Law No. 27/2009 on the MPR, DPR, DPD and DPRDs
makes no provision for the DPR’s establishment of rumah aspirasi. By contrast, the same law specifically stipulates that the DPD (the House of Regional Representatives) should open local
offices in regions.
Table 2
Measures to Help the DPR to Stay in Touch with Popular Aspirations, 2010
No Measure Total Value
(Rp millions)
Comment
1 DPR regional offices 112 000 Rp 200 m per MP
2 Building close communication
links with the people and taking on board popular aspirations
57 150 - Speaker: Rp 10 m/month
- D/Speaker: Rp 9 m/month - MPs: Rp 8.5 m/month
Working visits; working visits by
individual MPs (domestic)
173 160 Standing Orders working visits
(6 p.a.); working visits during
recesses (4 p.a.); individual MP working visits (1 p.a.)
4 Official communications
allowance
94 370 Based on DPR pay slips
during 2009, Rp 12 m/ month
per MP
Total, excluding DPR ―homes for
aspirations‖
324 680 Rp 579 m/MP/year
Total, including DPR ―homes for 436 680 Rp 787 m/MP/year

Behind the Glitz of the 2010 Budget -53-
aspirations‖ Remarks: Data from DPR’s 2010 Budget Implementation Checklist (DIPA) processed by Seknas FITRA
4. Funding for Overseas Jaunts
The design of the DPR’s overseas travel vote gives the impression of a pot of money being shared
around to fund overseas jaunts. Every standing committee, every part of the DPR establishment and every level of leadership get their share. Moreover, discussion of any piece of legislation
brings with it money for travel amounting to Rp 1.7 billion. The DPR also gets its share of trips to
attend international conferences. Overseas travel is especially attractive because each person travelling receives a per diem for seven days of between Rp 20 and 30 million depending on the
country visited. And for each trip there is a representation allowance of Rp 20 million. Thus it is
no surprise that all parliamentary political parties have a ―no see, no hear‖ attitude when criticized by the public. Even when people are being struck down by natural disasters, overseas jaunts go on.
The DPR’s Honor Council, whose role is to protect the honorableness of the DPR, joined in the
defacement of the DPR’s image by going on a visit to Greece to study the ethics of democracy and
taking the opportunity to ―tour‖ Turkey.
Table 3
Distribution of Allocations for DPR Travel, 2010
No Activity
DIPA 2010 Funding
(Rp)
1 Working visits within Indonesia related to the finalization of draft legislation 17 852 550 000
2 Overseas working visits by DPR’s Legislation Office 2 067 947 000
3 Overseas visits related to discussion of DPR-initiated draft bills 26 778 825 000
4 Overseas working visits of DPR’s Stat/e Finances
Accountability Committee 940 640 000
5 Overseas working visits of 11 standing committees 14 987 610 000
6 Overseas working visits by the standing committee for specific cases 2 242 210 000
7 Overseas working visits of the DPR’s Budget
Committee 2 026 922 000
8 Delegations to International Parliamentary Organization activities 8 110 065 000
9 Delegations to activities of parliaments of the region 4 071 606 000
10
Technical visits to Australia, Qatar, Syria, China,
North Korea, Mexico and South Africa by the DPR’s
Inter-parliamentary Cooperation Committee 6 830 121 000
11 Overseas working visit of the DPR’s Honor Council 1 616 349 000
12 Comparative study of management of in-house parliamentary budgets 3 028 578 000
13 Overseas comparative study by leadership of DPR 15 505 053 000 Remarks: Data from 2010 DIPA processed by Seknas FITRA
By the end of 2010 the DPR’s travel vote had reached Rp 170 billion. The initial allocation (in
the APBN) had been Rp 122 billion (Table 4). The overseas jaunts financed by that money were
dressed up as goodwill visits, attendance at international conferences and study tours seeking inputs for legislation under consideration.

Behind the Glitz of the 2010 Budget -54-
Table 4
APBN Budget for Overseas Trips by DPR Members, 2010
No Visit
Budget
(Rp Thousands)
1 Visits by delegations 7 557 240
2 Bilateral visits 6 683 470
3
Working visits of standing committees and select
committees 103 712 036
4 Working visits to regional meetings 4 139 050
Total 122 091 796 Remarks: Data from 2010 DIPA processed by Seknas FITRA
In the mid-year revision of the APBN, the DPR authorized an additional Rp 48 billion for its 2010 travel vote (Table 5). The additional funding was justified as follows: The original
budget (APBN) set the DPR’s travel vote at Rp 122 billion. That amount was to cover travel
associated with 13 draft bills. For each bill visits to two countries were envisaged with the proviso that the visits occurred before discussion of a draft bill commenced. The revised
budget (APBN-P) was framed on the basis of visits to three countries per piece of legislation
at any time before the final adoption of a bill.
Table 5
Overseas DPR Working Visits in 2010 Revised APBN
No Visits Budget
1 Overseas working visits related to passage of draft legislation Rp 23.208.315.000
2 Standing Committee IV Rp 3.131.150.000
3 Standing Committee VI Rp 2.007.820.000
4
Standing Committee (Formulation of draft
legislation) Rp 4.888.883.000
5 Standing Committee VII Rp 2.833.730.000
6
Standing Committee VII (Discussion of draft
legislation) Rp 8.809.690.000
7
Overseas working visit of the DPR’s Bilateral
Cooperation Group Rp 3.380.200.000
Total Rp 48.259.788.000
Remarks: Data from DIPA for revised 2010 budget, processed by Seknas FITRA.
Table 6
Data on DPR Working Visits up to November 2010
No Institution/Standing Committee Country visited Timing Budget
1 DPR Budget Committee Jan-March 571.8
million
2 DPR Inter-parliamentary Cooperation Committee
- Jan-March 1.7 billion
3 Deputy Speaker for Political and
Security Affairs
Jan-March 844
million
4 Standing Committee III - Jan-March 995 million

Behind the Glitz of the 2010 Budget -55-
5 Special committee on draft bill on
money laundering
France, Australia June 1.7 billion
6 DPR’s In-house Affairs Committee (BURT)
Morocco, Germany, France July 3 billion
7 Special committee on draft bill on
protocol
France 11-17 July 1.7 billion
8 Working group on draft bill on national heritage
Turkey, the Netherlands July-August
1.7 billion
9 Working group on draft bill on
clemency
The Netherlands, New
Zealand
July 1.7 billion
10 Working group on draft bill on horticulture
The Netherlands, Norway 17-23 August
1.7 billion
11 Working group on draft bill on
scouting
South Africa, South Korea and
Japan
September 1.7 billion
12 Draft bill on immigration The United Kingdom, France Sept & Oct 1.7 billion
13 Draft bill on Indonesian currency Canada, Switzerland Sept-Oct 1.7 billion
14 Legislation committee Japan, the Philippines Oct 2 billion
15 Honor Council Greece Oct 1.6 billion
16 Draft bill on the financial services authority
Germany, the United Kingdom, South Korea, Japan
Oct-Nov 1.7 billion
17 Oversight of pilgrims to Mecca Saudi Arabia Nov 4.9 billion
Total 30.91
billion Remarks: Data from DPR’s budget realization report for first quarter and from elsewhere, processed by Seknas
FITRA
5. Something Amiss with Budget for MPs’ DPR-provided Housing in Kalibata
The 2009 APBN budgeted Rp 155.4 billion (more precisely Rp 155 400 151 685) for the
renovation of DPR-provided housing for MPs in Kalibata, South Jakarta. In the 2010 APBN the
figure rose to Rp 290 105 315 000, bringing the total for the two years to Rp 445 505 466 695. However, according to the contract between the DPR and PT Adhi Karya, the cost of the
renovation work was to be Rp 355.5 billion (more precisely Rp 355 544 100 000). The difference
between the two figures is Rp 89 961 366 685. Despite that difference, the 2010 revised APBN
increased allocations for the renovations yet again, by as much as Rp 89 964 500 000. That
additional appropriation infringed Section 37 paragraph (3) of Presidential decision No. 80/2003,
which states:
“Planning consultants who do not take due care and who cause losses
for the user of goods or services being provided shall have sanctions
imposed upon them in the form of a requirement to reformulate the plan in question at their own expense, and/or shall be required to pay
compensation.”
In addition, the DPR housing redevelopment program violated Section 32 paragraphs (3) and (4)
of the same presidential decision, which read:
Paragraph (3):
“Providers of goods or services shall be prohibited from transferring
responsibility for all of the main part of the work involved by subcontracting it to another party.”
And paragraph (4):

Behind the Glitz of the 2010 Budget -56-
“If a provider violates the prohibition outlined in subparagraph (3), a
sanction shall be imposed in the form of a fine the amount of which shall be in accord with the provisions of the contract.”.
―Contractor agreement‖ documents that have come to FITRA’s attention state that PT Adhi
Karya will sub-contract work to PT Pembangunan Perumahan which in turn will sub-contract
work to other companies.
The renovation work is, therefore, being divided up between the two companies. PT Adhi Karya
is to renovate Blocks A, B & C and construct 10 new houses. For its part, PT Pembangunan
Perumahan is to ―receive an order from‖—be subcontracted by—PT Adhi Karya to renovate Blocks D, E & F. The latter comprise 210 units which amount to 40% of the total number of
units to be renovated (495). Work of Blocks D, E & F is to be further subcontracted by Pt
Pembangunan Perumahan to other companies. Thus the renovation work will proceed as follows:
PT Pembangunan Perumahan will be allocated Rp 130 billion to cover the renovation of 210
units—at a cost of Rp 619 047 619 per unit. In its contracts with other subcontracting
companies, however, PT Pembangunan Perumahaan provides financing of Rp 152 500 000 per unit, bringing the total cost for 210 units to Rp 32 025 000 000. This outcome
represents a marked up price per unit amounting in total to Rp 97 075 000 000.
Clearly, the program of renovation of housing for DPR members in Kalibata infringes provisions
of Presidential decision No. 80/2003. For PT Adhi Karya has subcontracted work to PT
Pembangunan Perumahan which has in turn subcontracted work to other companies. The contracts between PT Pembangunan Perumahan and its sub-contractors show that work entrusted
to subcontractors (summarized below) represent part of the ―the main work involved‖.
a. Preparatory work – demolition of previous buildings b. Structural work such as excavation of foundation trenches, laying of river stone
foundations, reworking of landfill etc.
c. Architectural work d. Work on ceilings
e. Floor work
f. Work on steps/staircases
g. Roof work
h. And other work.

Behind the Glitz of the 2010 Budget -57-
Sub-national Finances: Paying Lip Service with Leftovers
In 2010 sub-national (regional) governments were facing bankruptcy because of increased civil
service salaries for two years in succession (up 10% in 2009 and a further 5% in 2010). The cost of
government bureaucracies was ballooning. In a situation where regional governments depended on
central government fiscal transfers (dana perimbangan) for 82% of their budgets, they found
themselves having to allocate 51% of their budgets to meet civil service costs. Thus in 2009 they
spent Rp 153 trillion on their civil services and even more in 2010 (Rp 168 trillion). It followed that
only 17% of their budgets were left over for capital expenditure on basic public services
infrastructure.
In fact, several issues have combined to make it difficult for regional governments to effectively
manage their budgets. Firstly, central government spending has been out of balance with that of
regional governments and has been progressively marginalizing regions, especially those not rich in
natural resources. Second, the discretion which regional governments have in managing their budgets
has been declining with each passing year because of rising civil service costs brought on by central
government policies. Third, mismanagement of regional budgets has continued to cost the public
purse dearly. And fourth, repeated wastage of public funds has progressively shrunk the budget
available for the provision of public services.
a. Fiscal Balance Funds: Never in Balance
A necessary concomitant of regional autonomy has been the institution of a system for transfers
of funding (dana perimbangan) to kabupatens and cities. As part of regional autonomy, the
central government handed over 16 government functions to regions. But the money it has been
transferring to regions has amounted to just 30% of the State purse ─ insufficient to enable them to discharge their new functions. The central government’s argument has been that, in addition to
transfers of dana perimbangan, it was spending a further 30% of national revenue at the sub-
national level. That spending included transfers to cover functions that had been delegated to regions (via a system called dekonsentrasi) or which were being co-administered by regions
(functions known as tugas pembantuan). In addition, the central government argued, it was
financing subsidies, ―vertical funding‖, and expenditure on such nationwide programs as the National Community Empowerment Program (PNPM), the Health Insurance for the Poor
(Jamkesmas) scheme and the Schools Operational Fund (BOS). But, against that, Section 108 of
Law No 33/2004 mandated that funding for delegated (dekonsentrasi) and co-administered
functions (tugas pembantuan) which belonged to regions should be gradually brought under the umbrella of the Special Allocation Fund (DAK). But the central government has been unwilling
to do that, as was evident in the tardy appearance (four years after the enactment of Law No.
33/2004) of government regulation PP No. 7/2008 concerning dekonsentrasi and tugas pembantuan funding. And the new regulation still provided only for gradual conversion of those
funds into DAK transfers to regions.

Behind the Glitz of the 2010 Budget -58-
Table 1
Summary of State Budget (APBN)/Central Government Financial Reports (LKPP), 2005-2010
(Rp billions)
Item LKPP
2005
LKPP
2006
LKPP 2007 APBN
2008
APBN 2009 Draft APBN
2010
National Revenue
and Grants
495 224.2 637 987.2 707 806.1 981 609.4 985 725.3 911 475.8
Domestic Revenue 493 919.4 636 153.1 706 108.3 979 305.4 984 786.5 910 054.3
Tax revenue 347 031.1 409 203.0 490 988.6 658 700.8 725 843.0 729 165.2
Non-tax Revenue 146 888.3 226 950.1 215 119.7 320 604.6 258 943.6 180 889.0
Grants 1 304.8 1 834.1 1 697.7 2 304.0 938.8 1 421.5
EXPENDITURE 509 632.4 667 128.7 757 649.9 985 730.7 1 037 067.3 1 009 485.7
Central
Government
Expenditure
361 155.2 440 032.0 504 623.3 693 355.9 716 376.3 699 688.1
Fiscal Transfers to
Regions (dana
perimbangan)
150 463.9 226 179.9 253 263.2 292 433.5 320 691.0 309 797.6
Remarks: Data from LKPPs for 2005-07, APBNs for 2008-09 and draft 2010 APBN, processed by Seknas FITRA
Table 1 shows that in nominal terms increases in central government expenditure considerably
outstripped the rate of growth in the level of fiscal transfers to regions. Indeed, between 2009 and
2010 the level of fiscal transfers to regions declined. Moreover, there was no significant re-
designation of funds for delegated and co-administered functions as DAK funding, as is required by
PP No.7/2008.
Graphic 1
Remarks: Data from LKPPs for 2005-07, APBNs for 2008-09 and the draft APBN for 2010, processed by
Seknas FITRA
Graphic 1 illustrates the extent to which expenditure in the 2010 APBN was dominated by the
central government. It accounted for 70% of expenditure whereas the other 30% had to be shared,
on a proportional basis, among 531 sub-national governments (provinces, kabupatens and cities).
These numbers leave no room for doubt about the lack of fiscal balance between the central
government and regions. Regions carry a heavy burden because they have to fund a large number
of development programs—in fact, in 16 distinct fields of activity, one of which is poverty
eradication.
FISCAL TRANSFERS TO REGIONS AS A PERCENTAGE OF DOMESTIC REVENUE
30.5% 35.6% 35.9%
29.9% 32.6% 34.0%
0.0% 5.0%
10.0% 15.0% 20.0% 25.0% 30.0% 35.0% 40.0%
2004 2005 2006 2007 2008 2009 2010 2011

Behind the Glitz of the 2010 Budget -59-
b. Out-of-control Transfers to Regions: Fertile Ground for Undercover Budget Agents
The revised State budget (APBN-P) for 2010 saw an increase of Rp 13.8 trillion in ―adjustment funding‖ (dana penyesuaian), bringing total funding for the 2010 fiscal year to Rp 21.1 trillion.
That was a significant increase — on a par with the DAK (Table 2).
At the outset, ―adjustment funding‖ was designed to recompense regions for shortfalls of dana
perimbangan funding in the preceding year. But right from 2008 it was also being used to cover
gaps resulting from the dropping of the ―hold harmless‖ principle as well as to fund ad hoc
programs. In 2008 the ―adjustment‖ funding program was known as the Fund for Infrastructure and Public Facilities (DISP), but in 2009 it also became the Fund to Strengthen Fiscal
Decentralization to Speed up Regional Development (DPDF PPD). In 2010 two additional
components appeared: the Fund to Strengthen Local Infrastructure and Public Facilities (DPIPD) and the Fund to Speed up Development of Educational Infrastructure (DPIP). But these regional
infrastructure programs were set up in contravention of Law No. 33/2004 concerning Fiscal
Balance between the Center and Regions. That law recognized only the following forms of regional fiscal transfers (dana perimbangan): the General Allocation Fund (DAU), the Revenue
Sharing Fund (DBH), the Special Allocation Fund (DAK), funding for delegated functions
(dekonsentrasi) and funding for co-administered functions (tugas pembantuan). Thus the
process of choosing recipient areas for the DPDF PPD and DPIPD programs, which were not governed by clear guidelines, offered a great opportunity to DPR undercover budget agents and
government to ―sell‖ their authority to regions wanting to have a share of ―adjustment‖ funding.
The opportunity was there for lobbying power to be the determining factor in the distribution of funds to regions — a process which takes no account of priority areas of need.
Table 2
Additional “Adjustment Funding” Allocated in the Revised 2010 Budget (APBN-P)
Liable to Influence of Undercover Budget Agents
(Rp billion)
No “Adjustment Funding” APBN APBN-P Total
1 Additional salary for local civil service teachers
5 800.0 - -
2 Regional incentives funding 1 387.8 - -
3 Shortfalls in DAK funding 80.2 - -
4 Shortfalls in DISP funding 32.0 - -
5 DPDF-PPD - 7 100.0 7 100.0
6 DPIPD - 5 500.0 5 500,0
7 DPIP - 1 250.0 1 250.0
Total 7 300.0 13 850.0 21 150.0 Remarks: Data from DPR’s Budget Committee working group’s report of April 2010 on Transfers to
Regions, processed by Seknas FITRA
Table 3 shows that regions with high fiscal capacity indices and low poverty indices (in
comparison to the national average) (e.g. the kabupatens of Berau and Penajam Paser Utara in
East Kalimantan) nonetheless received higher levels of DPIPD funding than areas with low fiscal indices and high poverty indices (e.g. the kabupatens of Kupang and South Central Timor (TTS)
in East Nusa Tenggara). It was a similar story in the case of the DPF PPD which allocates
identical amounts to recipient governments. It is no surprise, therefore, that with patterns of
funding like these, the introduction of regional autonomy has been unable to enhance the welfare of the people across regions.

Behind the Glitz of the 2010 Budget -60-
Table 3
Comparison of “Adjustment Funding” Transferred to Rich and Poor Areas
(Rp billions)
No Region Fiscal
Index
Poverty
Index DPIPD DPF PPD
1 Kab. Berau 2.999 0.886 17 335 000 000 4 931 137 019
2
Kab. Penajam Paser
Utara 2.935 0.698 24 175 000 000 0
3
Kab. Timor Tengah
Selatan (TTS) 0.243 1.857 12 000 000 000 4 931 137 019
4 Kab. Kupang 0.271 1.46 4 835 000 000 0
Remarks: Data from various sources, processed by Seknas FITRA
c. Critical Lack of Fiscal Discretion and Creativity
Regional governments’ flexibility in managing their budgets shrank further in 2010, because of
central government policies of increasing civil service costs by 15% and recruiting more civil
servants. These developments imposed unavoidable demands on regional government budgets.
They also led to declines in levels of fiscal discretion in all but seven of Indonesia’s 33 provinces
(Graphics 2) as well as in fiscal space (Graphic 3).
Graphic 2
Trends in Kabupaten and City Fiscal Discretion by Province
Remarks: 2010 data from D-G of Fiscal Balance MoF, processed by Seknas FITRA
Declining levels of regional governments’ fiscal discretion hampered the provision of public
services. At the same time, declines in fiscal space meant that less money could be used freely by
regions to meet local needs. The result was that only ―residual‖ funding was available for
implementation of development programs on health, education, the betterment of people’s welfare
and poverty reduction. All these programs were dependent on funds left over from big budget
items (expenditure on civil servants and bureaucracies).
0%
10%
20%
30%
40%
50%
60%
70%
Pro
v. N
anggro
e A
ceh D
aru
ssala
m
Pro
v. S
um
ate
ra U
tara
Pro
v. S
um
ate
ra B
ara
t
Pro
v. R
iau
Pro
v. Jam
bi
Pro
v. S
um
ate
ra S
ela
tan
Pro
v. B
engkulu
Pro
v. Lam
pung
Pro
v. D
KI Jakart
a
Pro
v. Jaw
a B
ara
t
Pro
v. Jaw
a T
engah
Pro
v. D
I Y
ogyakart
a
Pro
v. Jaw
a T
imur
Pro
v. K
alim
anta
n B
ara
t
Pro
v. K
alim
anta
n T
engah
Pro
v. K
alim
anta
n S
ela
tan
Pro
v. K
alim
anta
n T
imur
Pro
v. S
ula
wesi U
tara
Pro
v. S
ula
wesi T
engah
Pro
v. S
ula
wesi S
ela
tan
Pro
v. S
ula
wesi T
enggara
Pro
v. B
ali
Pro
v. N
usa T
enggara
Bara
t
Pro
v. N
usa T
enggara
Tim
ur
Pro
v. M
alu
ku
Pro
v. P
apua
Pro
v. M
alu
ku U
tara
Pro
v. B
ante
n
Pro
v. B
angka B
elit
ung
Pro
v. G
oro
nta
lo
Pro
v. K
epula
uan R
iau
Pro
v. P
apua B
ara
t
Pro
v. S
ula
wesi B
ara
t
2009 2010

Behind the Glitz of the 2010 Budget -61-
Even though they were confronted with such threats to their budget authority and declining
amounts of money to spend as they wished, regional governments continued to give priority to
indirect (routine) expenditure. And most of that disappeared in meeting the needs of local
bureaucracies. In the process direct (development-related) expenditure on the provision of public
services was sacrificed.
Regional governments’ critical shortage of fiscal discretion should not have been used, as it was
by most, to explain away their failure to accelerate the pace of programs to meet fundamental
rights of poor people and on reducing poverty. On the contrary, they should have regarded such a
situation as an opportunity to redouble their efforts to increase, over time, levels of own source
local revenue (PAD). They could do that by increasing local taxes, fees and charges and by better
managing local assets, without imposing undue new burdens on their communities. But, as of
2010, PAD accounted for only 8% (on average across regions) of local government revenue. That
number shows that local governments are not reacting seriously or creatively to the fiscal
constraints they face.
d. Budget Mismanagement Costing the State Dearly
National Audit Board (BPK) reports released in the first semester of 2009 (covering realized
budgets for 2008) recorded that misappropriation of funds for the benefit of political elites in 104
regions resulted in losses to regional government budgets totaling more than Rp 112.5 billion
(Table 4). Recorded abuses included: inflated costs of official travel, housing allowances for local
legislative assembly (DPRD) members, payment of unearned honorariums to local government
heads, inflated prices for fuel for official vehicles and multiple payments under several headings
in official travel votes.
As Table 4 shows, the abuses also cost the State purse a total of Rp 306.6 billion (Table 4). That
represented an unbelievable rise of 173% over the 2008 figure.
Graphic 3
Trends in Fiscal Space 2007-2010
(Percentage)
Nationial Provinces Kabupatens/Cities
Source: 2010 data from D-G of Fiscal Balance MoF
(Percentage)

Behind the Glitz of the 2010 Budget -62-
Table 4
Total Actual and Potential Fiscal Losses of Provinces/Kabupatens/Cities by Province, 2009
No
Province
Regional level losses Potential regional level losses
Number
of
Cases
Amount Involved
(Rp Millions)
Number
of Cases
Amount Involved
(Rp Millions)
1 Aceh 27 22 706.81 9 24 229.61
2 North Sumatera 90 20 013.73 7 11 028.25
3 West Sumatera 50 7 064.59 21 49 422.54
4 Riau 32 11 237.51 7 973 334.66
5 Jambi 33 10 455.37 13 16 333.93
6 South Sumatera 52 9 496.03 10 5 995.14
7 Bengkulu 40 8 920.45 1 782.34
8 Lampung 34 8 153.04 10 228 485.68
9 Bangka Belitung 26 2 365.40 9 1 479.18
10 Riau 37 17 547.66 7 33 937.41
11 Special District of Jakarta 31 7 632.35 1 -
12 West Java 27 2 542.80 1 -
13 Central Java 35 2 691.50 18 20 433.75
14 Special District of Yogyakarta 12 2 307.85 - -
15 East Java 102 7 291.09 19 151 114.11
16 Banten 44 13 188.09 7 40 294.85
17 Bali 37 8 486.73 10 9 695.54
18 West Nusatenggara 23 1 280.40 5 3 549.33
18 East Nusatenggara 22 5 395.26 18 5 231.873
20 West Kalimantan 19 2 863.84 3 5 205.47
21 Central Kalimantan 94 18 581.26 15 7 049.41
22 South Kalimantan 32 5 426.16 13 22 963.56
23 East Kalimantan 19 9 117.01 4 460 500.38
24 Southeast Sulawesi 36 16 342.29 4 1 477.58
25 West Sulawesi 48 12 631.61 17 51 411.61
26 South Sulawesi 41 9 313.05 12 6 081.86

Behind the Glitz of the 2010 Budget -63-
27 Central Sulawesi 57 19 796.63 12 27 280.51
28 Gorontalo 36 5 695.31 5 30 338.84
29 North Sulawesi 43 8 817.80 6 23 885.38
30 Maluku 7 524.93 - -
31 Papua 39 12 982.21 11 8 971.13
32 West Papua 21 15 767.85 2 3562.90
TOTAL 1 246 306 637.34 277 2 254 145.97
Remarks: Data from the national Audit Board (BPK), processed by Seknas FITRA
e. Yet More Wastage
Ineffective use of regional government budgets reduced the overall effectiveness of budget
programs and meant that budget targets were not achieved. Budget line items especially
susceptible to wastage were social welfare, grants, the supply of goods and services and
honorariums (a civil service expenditure component of direct expenditure). But the level of
accountability of all this spending is very low and easily compromised. Despite that, local
governments consistently allocate quite sizeable amounts of funding for these areas and,
accordingly, reduce levels of funding available for the provision of basic public services.
Regional governments are also unable to keep control of other potentially wasteful areas of
expenditure such as official travel and operational expenses & allowances for DPRDs, local
government heads (HoG) and local work units/departments. Table 5 details the areas of waste
within ten local government areas which cost the national purse most dearly in 2009.
Table 5
Areas of Wastage within 10 Regional Governments (2009 Realized Budget)
Remarks: Data from the national Audit Board (BPK), processed by Seknas FITRA
Ineffective use of budget funds, in the main, applied to the supply of goods and services. In some
cases, goods or services supplied exceeded what was needed or required in terms of quantity or
quality; or they were not in accord with set standards; or they were overpriced. Table 6
summarizes 155 cases of ineffective use of funds in 2009 valued at Rp 71.26 billion.
Area of Expenditure
Social Welfare Grants Official Travel Allowances & Operational
Goods &
Services 1 Kab. Gayo Lues 311 500 000 2 876 430 000 2 City of Sorong 820 000 000 1 681 445 807 9 257 400 000 3 Kab. Natuna 4 City of Manado 6 924 535 510 5 Kab. Kerinci 44 917 560 4 500 000 000 745 815 000 6 Kab. Konawe Selatan 1 850 998 200 4 727 395 000 7 Kab. Asahan 1 762 350 000 33 700 000 198 680 000 1 075 900 000 8 Kab. Lingga 802 375 436 9 Kab. Kolaka 3 201 567 500 1 031 615 457
10 Kab. Ogan Komering Ulu 3 358 700 000 1 340 000 000 43 200 000
Region No

Behind the Glitz of the 2010 Budget -64-
Table 6
Causes of Lack of Economy in Use of Regional Budget Funds, 2009
Causes of Lack of Economy No of
Cases
Value
(Rp millions)
Goods and service exceeding needs 9 795.49
Decisions on quality & quality of goods/services 3 417.14
Wastage of money or excessive prices 143 70 050.00
Inefficient use of funds occurs because responsible officials are careless in the discharge of their
duties; because they do not abide by existing regulations; or because they are lax in their oversight
and control of processes. To overcome these problems local heads of government need to have the
courage to impose sanctions upon officials responsible for such aberrations.
Another cause of wastage is misdirection of funds into pointless activities or into less than fully
productive areas of an organization’s work. Such use of budget funds means that an
organization’s true purposes are not achieved.
An examination of 348 regional government financial reports (LKPD) for 2009 shows that 339
cases of ineffective use of regional government funds have resulted in fiscal losses to the State
amounting to Rp 420.45 billion (Table 7).
Table 7
Causes of Ineffective Use of Regional Budgets, 2009
Causes of Ineffective Use of budget No of
Cases
Amount
(Rp billions)
Misdirected use of funds 172 200.07
Use of goods or services not in accord with planning 11 16.68
Goods or services supplied not able to be used 90 79.50
Use of goods or services not contributing to achievement of
organization’s purposes 5 38.28
Implementation of activities delayed or prevented 42 70.36
Provision of below-standard services to the public 9 8.23
Organization’s functions and tasks not being carried out well 10 7.30
Remarks: Information from Report of Outcomes of Reviews by Audit Board (first semester 2010),
processed by Seknas FITRA.
Wastage of budget funding recurs every year and is increasing markedly year by year. As a
consequence, in 2010, only 20% of APBDs nationally was allocated for capital expenditure. This

Behind the Glitz of the 2010 Budget -65-
represented a significant decline from the 2007 level of 30%. To avoid a repeat of wastage of
funds to the detriment of the public interest, regional governments should re-allocate funds
appropriated to social welfare programs and grants into direct (development-related) expenditure
areas of their APBDs. And, to ensure that direct expenditure is as effective as it should be, tight
control should be exercise over spending on goods and services and on official travel; and the
amount spent on the payment of honorariums should be reduced and kept in proportion.
f. Hijacked budgets Betray the Public Interest
Despite the many and varied constraints shackling regional finances, local elites nonetheless
continue to highjack local budgets to serve their own purposes. This occurs especially in areas of
the budget which are not well accounted for and are thus more amenable to misappropriation
(Graphic 4).
Graphic 4
Budget Line Items Expenditure Liable to be Hijacked
1. “Dipping into the trough” of social welfare budgets: In local budget realization reports for
2009 one can find cases of misappropriation of social welfare budgets in 19 provinces
amounting to Rp 765.3 billion. Problems are evident at the level of process: allocations are
not based on needs expressed by people in a public communication forum and thus have no clear focus. So funds tend to be divided up by local ruling elites among their political
networks and followers. Inter alia, misappropriation takes the form of provision of
unrequested assistance; exceeding approved levels of assistance for particular organizations; unexplained reductions of levels of assistance; lack of accounting for how funds are used; and
funding for seemingly fictitious programs. Of late the social welfare budget has also become
fair game for local ruling elites (heads of local government and DPRDs) as a source of so
called ―dana aspirasi‖ (funds allocated for expenditure in DPRD constituencies).
2. Travelling grandly in the style of ruling elites: If we look carefully at the purpose of local
government, we must conclude that it is to provide public services to every level of the community. So local governments have to maintain very close contact with people to ensure
that they are meeting real needs and that development plans are effective. But research
conducted by FITRA shows that Rp 50.8 billion were spent by local ruling elites in 2010 on official travel. Much of the money was misappropriated on dreamt up trips which were not
held to account. And the travel undertaken served to supplement the income of the traveler.
3. Operational support funding: “legalized” theft of public money: Despite the fiscal crisis they find themselves in, local governments continue, year in year out, to ―steal‖ from the
public purse in the guise of spending to meet operational costs. And the allocations involved
are very considerable. Specifically it has come to light that Rp 58.4 billion have been
765.365
58.432 50.878 24.626
- 100.000 200.000 300.000 400.000 500.000 600.000 700.000 800.000
Social Welfare
Ops support for
OfficiaTravel Aid to Political Parties
Rp millions
Ops support for local
HoG & DPRD

Behind the Glitz of the 2010 Budget -66-
misappropriated with the most likely source being unauthorized operational support for local
heads of government and local governmental departments. Not to mention payments of communication allowances to DPRDs.
4. Abuse of aid to political parties: Misappropriation of Rp 24.6 billion occurred in the
provision of aid to political parties. Such aid is a new drain on regional government budgets and results in zero benefit for the people. The contributions are meant to promote political
awareness among the people by way of activities carried out by political parties. But, in fact,
political parties conduct no activities at the regional level and only swing into action at the beginning of general election campaigns. Of late a new law has increased the level of
funding political parties may receive from businesses to Rp 7.5 billion. But, given the low
level of accountability of aid to political parties provided by both the APBN and APBDs, it can be assumed that political party contributions from businesses will be ―tied funds‖ between
donor and recipient. And thus they will in no way help in enhancing public political
awareness.
Challenges for Regional Budgetary Policies for 2011
It is to be hoped that regional governments can adapt to these new challenges in their budget
discussion and decision processes and, in the process, adopt future policy approaches along the
following lines.
1. Law No. 28/2009 concerning Regional Taxes, Fees and Charges provides that taxes on land
and buildings and levies on the acquisition of rights over land and buildings should be under the authority of regional governments. Regions should plan positively to maximize the
benefits of these two principal sources of own-source local revenue (PAD) in an effort to
close the intra-regional fiscal gap resulting from General Allocation Fund (DAU) transfers. But regions should take care not to collect taxes, fees and charges outside the limits of the
―closed list‖ laid down in the law (No. 28/2009). Failure to do so would result in a
diminution of their DAU entitlement.
2. Minister of Home Affairs Regulation No. 54/2010 concerning Regional Development Planning (its Stages, Mode of Formulation, Controls and Evaluation) could potentially close
the door on public participation in regional policy development, if local governments feel
unduly constrained by its technical provisions. The concern is that the new regulation could become the new ―bible‖ on development planning, as was Minister of Home Affairs
Regulation No. 13/2006.
3. Making School Operational Funding (BOS) part of the regional fiscal transfers system could
open it up to potential abuse by local education department heads and school principals. That
would of course disadvantage the poor who are entitled to benefit from BOS funding.
Inclusion of BOS funds as a line item in APBDs is also likely to increase the level of BOS-related corruption in regions, extending from education officials to school principals.
To prevent the recurrence of mismanagement of regional budgets, central and local governments are
requested to put in place the following measures:
1. A fair regional fiscal transfers system by way of revamping the Law concerning Fiscal
Balance between the Center and Regions in order to give regions greater fiscal authority and
higher levels of funding.
2. Imposition of a freeze of local government civil service recruitment and revamped strategies
for the reform of local government bureaucracies. A review of the civil service should be

Behind the Glitz of the 2010 Budget -67-
conducted in every region. After all, civil service costs are placing an ever larger burden on
APBDs and reducing the amount of funds available for expenditure on public services.
3. Tighter regulations on expenditure of funding on social welfare, aid to political parties,
operational support costs and official travel.