measurementand scaling-10
TRANSCRIPT

MEASUREMENT AND SCALING Muhammad
Shafiq

Objectives
Introduction
Measurement and Scaling
Issues in Attitude Measurement
Levels of Measurement Scales
Types of Scaling Techniques Selection of an Appropriate Scaling Technique
sequence

objectiveThe Measurement & Scaling Technique helps us to : concepts of measurement and scaling,
four levels of measurement scales,
classify and discuss different scaling techniques, and
select an appropriate attitude measurement scale for our research problem.

INTRODUCTION
Data consist of quantitative variables, like price, income, sales etc., and qualitative variables like knowledge, performance , character etc. The qualitative information must be converted into numerical form for further analysis. This is possible through measurement and scaling techniques. A common feature of survey based research is to have respondent’s feelings, attitudes, opinions, etc. in some measurable form.

MEASUREMENT & SCALING
understand the following two terms: (a)Measurement, and (b)Scaling.

Measurement Measurement is the process of observing and recording the observations that are collected as part of research. The recording of the observations may be in terms of numbers or other symbols to characteristics of objects according to certain prescribed rules. The respondent’s, characteristics are feelings, attitudes, opinions etc.The most important aspect of measurement is the specification of rules for assigning numbers to characteristics. The rules for assigning numbers should be standardized and applied uniformly. This must not change over time or objects.

Scaling Scaling is the assignment of objects to numbers or semantics according to a rule. In scaling, the objects are text statements, usually statements of attitude, opinion, or feeling etc.

ISSUES IN ATTITUDE MEASUREMENT
When a researcher is interested in measuring the attitudes, feelings or opinions of respondents he/she should be clear about the following:
a) What is to be measured?
b) Who is to be measured?
c) The choices available in data collection techniques

LEVELS OF MEASUREMENT SCALES
The level of measurement refers to the relationship among the values that are assigned to the attributes, feelings or opinions for a variable.
Typically, there are four levels of measurement scales or methods of assigning numbers: (a) Nominal scale, (b) Ordinal scale, (c) Interval scale, and (d) Ratio scale.

Nominal Scalethe crudest among all measurement scales but it is also the simplest scale. In this scale the different scores on a measurement simply indicate different categories. The nominal scale does not express any values or relationships between variables.The nominal scale is often referred to as a categorical scale. The assigned numbers have no arithmetic properties and act only as labels. The only statistical operation that can be performed on nominal scales is a frequency count. We cannot determine an average except mode.For example: labeling men as ‘1’ and women as ‘2’ which is the most common way of labeling gender for data recording purpose does not mean women are ‘twice something or other’ than men. Nor it suggests that men are somehow ‘better’ than women.

Examples
Eye color: blue, brown, green, etc.
Biological characteristic (male or female)
Democrat, republican, etc.
Married, single, divorced, widowed
Country of Origin
1 = Pakistan 3 = Afghanistan
2 = China 4 = Other
(Here, the numbers do not have numeric implications; they are simply
convenient labels)

What Statistic Can I Apply?
OK to compute.... Nominal
Frequency Distribution and mode Yes
Median And Percentiles. No
Add Or Subtract. No
Mean, Standard Deviation, Standard Error Of
The Mean.No
Ratio, Or Coefficient Of Variation. No
Chi-square Yes

Ordinal ScaleIs the ranking of items along the continuum of the characteristic being scaled. In this scale, the items are classified according to whether they have more or less of a characteristic.The main characteristic of the ordinal scale is that the categories have a logical or ordered relationship. This type of scale permits the measurement of degrees of difference, (i.e. ‘more’ or ‘less’) but not the specific amount of differences (i.e. how much ‘more’ or ‘less’). This scale is very common in marketing, satisfaction and attitudinal research.Using ordinal scale data, we can perform statistical analysis like Median and Mode, but not the Mean.For example, a fast food home delivery shop may wish to ask its customers:How would you rate the service of our staff?(1) Excellent • (2) Very Good • (3) Good • (4) Poor • (5) Worst

Examples
Rank your food preference where 1 = favorite food and 4 = least
favorite:
____ Biriani ____ chines food
____ Afghani Palao ____ roasted meat
Final position of horses in a thoroughbred race is an ordinal
variable. The horses finish first, second, third, fourth, and so on.
The difference between first and second is not necessarily
equivalent to the difference between second and third, or between
third and fourth.

What Statistic Can I Apply?
OK To Compute.... Ordinal
Frequency Distribution. Yes
Median And Percentiles. Yes
Add Or Subtract. No
Mean, Standard Deviation, Standard Error Of The
Mean.No
Ratio, Or Coefficient Of Variation. No

Interval Scale

Interval Scale
scale in which the numbers are used to rank attributes such that numerically equal distances on the scale represent equal distance in the characteristic being measured. An interval scale contains all the information of an ordinal scale, but it also one allows to compare the difference/distance between attributes. Interval scales may be either in numeric or semantic formats.The interval scales allow the calculation of averages like Mean, Median and Mode and dispersion like Range and Standard Deviation.

Interval Scale
Classifies data into groups or categories
Determines the preferences between items
Zero point on the internal scale is arbitrary zero, it is not the true
zero point
Designates an equal-interval ordering.
The difference in temperature between 20 degrees f and 25 degrees
f is the same as the difference between 76 degrees f and 81 degrees
f.

For example, the difference between ‘1’ and ‘2’ is equal tothe difference between ‘3’ and ‘4’. Further, the difference between ‘2’ and ‘4’ is twice the difference between ‘1’ and ‘2’.Measuring temperature is an example of interval scale. But, we cannot say 40°C is twice as hot as 20°C.


Examples
Temperature in Fahrenheit is interval.
Celsius temperature is an interval variable. It is meaningful to
say that 25 degrees Celsius is 3 degrees hotter than 22 degrees
Celsius, and that 17 degrees Celsius is the same amount hotter
(3 degrees) than 14 degrees Celsius. Notice, however, that 0
degrees Celsius does not have a natural meaning. That is, 0
degrees Celsius does not mean the absence of heat!
Common IQ tests are assumed to use an interval metric.

Examples
Likert scale: How do you feel about Stats?
1 = I’m totally dreading this class!
2 = I’d rather not take this class.
3 = I feel neutral about this class.
4 = I’m interested in this class.
5 = I’m SO excited to take this class!

What Statistic Can I Apply?
OK To Compute.... Interval
Frequency Distribution. Yes
Median And Percentiles. Yes
Add Or Subtract. Yes
Mean, Standard Deviation, Correlation, Regression,Analysis Of Variance Yes
Ratio, Or Coefficient Of Variation. No

Ratio Scale highest level of measurement scales. This has the properties of an interval scale together with a fixed (absolute) zero point. The absolute zero point allows us to construct a meaningful ratio.Ratio scales permit the researcher to compare both differences in scores and relative magnitude of scores. Examples of ratio scales include weights, lengths and times.
For example, the number of customers of a bank’s ATM in the last three months is a ratio scale. This is because you can compare this with previous three months.For example, the difference between 10 and 15 minutes is the same as the difference between 25 and 30 minutes and 30 minutes is twice as long as 15 minutes

Ratio Scale
This is the highest level of measurement and has the
properties of an interval scale; coupled with fixed origin
or zero point.
It clearly defines the magnitude or value of difference
between two individual items or intervals in same group.
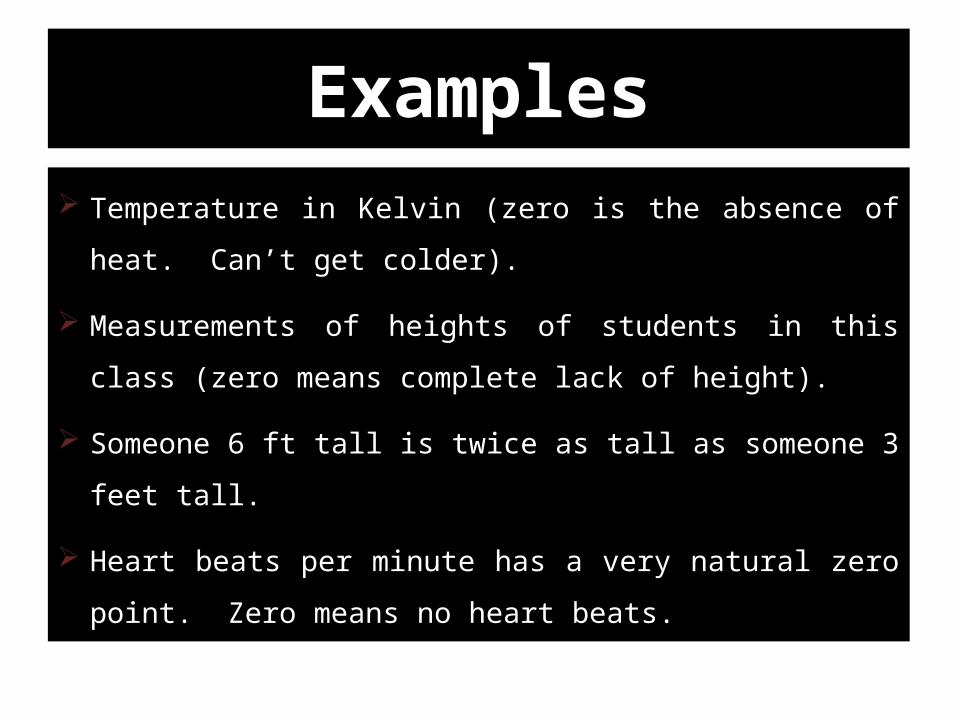
Examples
Temperature in Kelvin (zero is the absence of heat. Can’t get
colder).
Measurements of heights of students in this class (zero means
complete lack of height).
Someone 6 ft tall is twice as tall as someone 3 feet tall.
Heart beats per minute has a very natural zero point. Zero
means no heart beats.
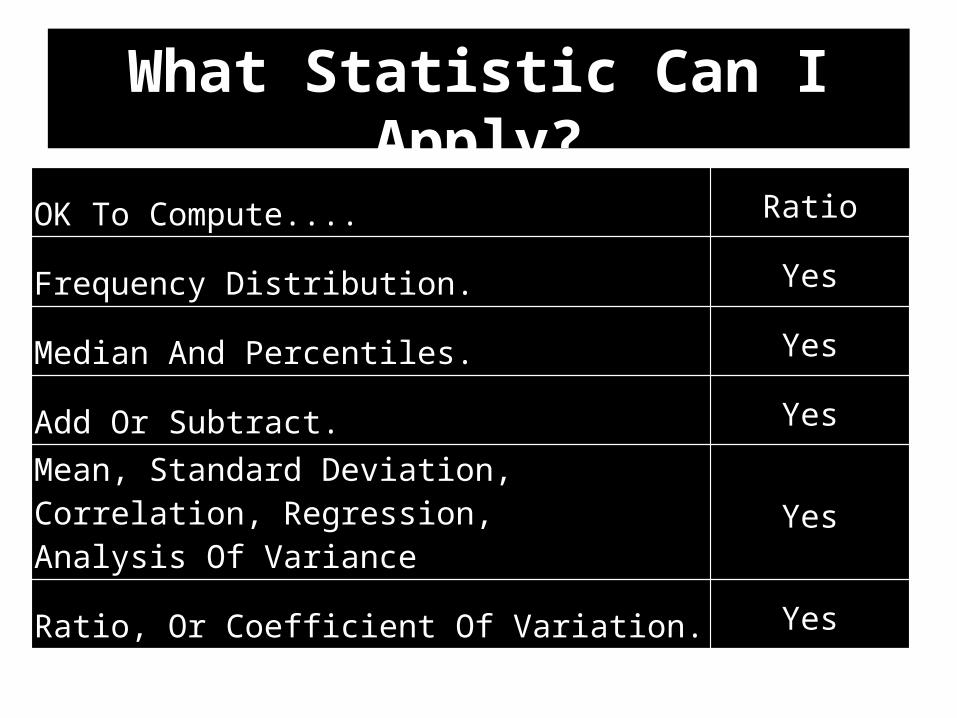
What Statistic Can I Apply?
OK To Compute.... Ratio
Frequency Distribution. Yes
Median And Percentiles. Yes
Add Or Subtract. Yes
Mean, Standard Deviation, Correlation, Regression,Analysis Of Variance Yes
Ratio, Or Coefficient Of Variation. Yes

Putting It Together


Summary of Levels of Measurement
Determine if one data value is a
multiple of another
Subtract data values
Arrange data in order
Put data in categories
Level of measurement
NoYesNominal
NoNoYesYesOrdinal
NoYesYesYesInterval
YesYesYesRatio
NoNo
Yes

Test Your Knowledge

A professor is interested in the relationship between the
number of times students are absent from class and the letter
grade that students receive on the final exam. He records the
number of absences for each student, as well as the letter grade
(A,B,C,D,F) each student earns on the final exam. In this
example, what is the measurement scale for number of
absences?
a) Nominal b) Ordinal c) Interval d) Ratio

In the previous example, what is the measurement scale of
letter grade on the final exam?
a) Nominal b) Ordinal c) Interval d) Ratio

TYPES OF SCALING TECHNIQUE

COMPARATIVE SCALES
In comparative scaling, the respondent is asked to compare one object with another.
The comparative scales can further be divided into the following four types of scaling techniques: (a)Paired Comparison Scale, (b)Rank Order Scale, (c)Constant Sum Scale, and (d) Q-sort Scale.

Paired Comparison Scale:
This is a comparative scaling technique in which a respondent is presented with two objects at a time and asked to select one object according to some criterion. The data obtained are ordinal in nature. For example, there are four types of cold drinks - Coke, Pepsi, Sprite, and Limca. The respondents can prefer Pepsi to Coke or Coke to Sprite, etc.

Rank Order Scale:
This is another type of comparative scaling technique in which respondents are presented with several items simultaneously and asked to rank them in the order of priority. This is an ordinal scale that describes the favoured and unfavoured objects, but does not reveal the distance between the objects. The resultant data in rank order is ordinal data. This yields better results when direct comparison are required between the given objects. The major disadvantage of this technique is that only ordinal data can be generated.


Constant Sum Scale:
In this scale, the respondents are asked to allocate a constant sum of units such as points, rupees, or chips among a set of stimulus objects with respect to some criterion. For example, you may wish to determine how important the attributes of price, fragrance, packaging, cleaning power, and lather of a detergent are to consumers. Respondents might be asked to divide a constant sum to indicate the relative importance of the attributes.The advantage of this technique is saving time. However, main disadvantages are the respondents mayallocate more or fewer points than those specified. The second problem is respondents might be confused.


Q-Sort Scale:
This is a comparative scale that uses a rank order procedure to sort objects based on similarity with respect to some criterion. The important characteristic of this methodology is that it is more important to make comparisons among different responses of a respondent than the responses between different respondents. Therefore, it is a comparative method of scaling rather than an absolute rating scale. In this method the respondent is givenstatements in a large number for describing the characteristics of a product or a large number of brands of a product.


NON-COMPARATIVE SCALES
In non-comparative scaling respondents need only evaluate a single object. Their evaluation is independent of the other object which the researcher is studying.
The non-comparative scaling techniques can be further divided into: (a)Continuous Rating Scale, and (b)Itemized Rating Scale.

Continuous Rating Scales :
It is very simple and highly useful. In continuous rating scale, the respondent’s rate the objects by placing a mark at the appropriate position on a continuous line that runs from one extreme of the criterion variable to the other.
Example :Question: How would you rate the TV advertisement as a guide for buying?


Itemized Rating Scales :Itemized rating scale is a scale having numbers or brief descriptions associated with each category. The categories are ordered in terms of scale position and the respondents are required to select one of the limited number of categoriesthat best describes the product, brand, company, or product attribute being rated. Itemized rating scales are widely used in marketing research.
Itemised rating scales is further divided into three parts, namely (a) Likert scale, (b) Semantic Differential Scale, and (c) Stapel Scale.

The itemised rating scales can be in the form of : (a) graphic, (b) verbal, or (c) numeric as shown below :


Likert Scale: Likert, is extremely popular for measuring attitudes, because, the method is simple to administer. With the Likert scale, the respondents indicate their own attitudes by checking how strongly they agree or disagree with carefully worded statements that range from very positive to very negative towards the attitudinalobject. Respondents generally choose from five alternatives (say strongly agree, agree, neither agree nor disagree, disagree, strongly disagree).A Likert scale may include a number of items or statements. Disadvantage of Likert Scale is that it takes longer time to complete than other itemised rating scales because respondents have to read each statement.Despite the above disadvantages, this scale has several advantages. It is easy to construct, administer and use.

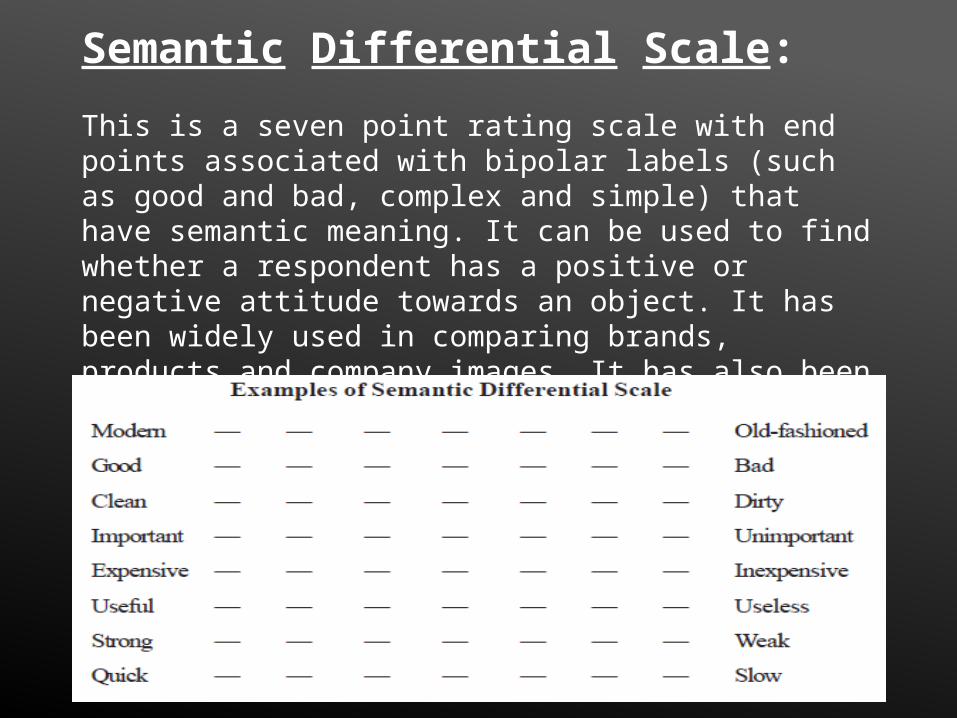
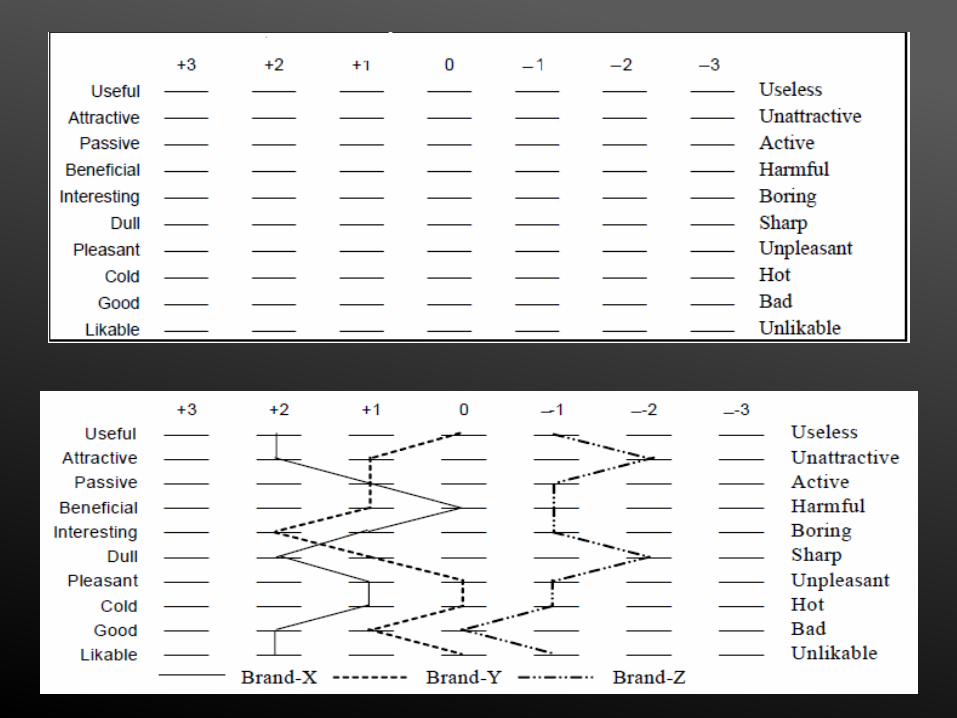
Semantic Differential Scale:
This is a seven point rating scale with end points associated with bipolar labels (such as good and bad, complex and simple) that have semantic meaning. It can be used to find whether a respondent has a positive or negative attitude towards an object. It has been widely used in comparing brands, products and company images. It has also been used to develop advertising and promotion strategies and in a new product development study.

Staple Scale:
The Stapel scale was originally developed to measure thedirection and intensity of an attitude simultaneously. Modern versions of the Stapel scale place a single adjective as a substitute for the Semantic differential when it is difficult to create pairs of bipolar adjectives. The modified Stapel scale places a single adjective in the centre of an even number of numerical Values.


SELECTION OF AN APPROPRIATE SCALING TECHNIQUE
A number of issues decide the choice of scaling technique. Some significant issues are:1) Problem Definition and Statistical Analysis,2) The Choice between Comparative and Non-
comparative Scales,3) Type of Category Labels,4) Number of Categories,5) Balanced versus Unbalanced Scale, and6) Forced versus Non-forced Categories

Thank you