measurement of the thickness of thin films by multiple-beam interferometry
TRANSCRIPT

Measurement of the Thickness of Thin Films by Multiple-Beam Interferometry
This article has been downloaded from IOPscience. Please scroll down to see the full text article.
1951 Proc. Phys. Soc. B 64 419
(http://iopscience.iop.org/0370-1301/64/5/307)
Download details:
IP Address: 170.140.26.180
The article was downloaded on 23/08/2013 at 14:30
Please note that terms and conditions apply.
View the table of contents for this issue, or go to the journal homepage for more
Home Search Collections Journals About Contact us My IOPscience
419
Measurement of the Thickness of Thin Films by Multiple-Beam Interferometry
BY 0. S. HEAVENS University of Reading
Communzcated by R. W Ditchburn; MS. received 15th November 1950, and an amended form 9th ranuary 1951
ABSTRACT. The method of measuring the thickness of thin films by multiple-beam Fizeau fringes has been studied in order to assess the accuracyattainable. In this connection the small-scale irregularities on the surfaces of optical flats and other optically worked
have been studied by multiple-beam methods. The effect of these irregularities on the accuracy of the thickness measurements IS shown and the conditions for optimum accuracy are discussed.
Thickness measurements have been made on films of silver and of lithium fluoride with several different metals as reflecting layers. The measurements cover the range 120 A. to 1 5 0 0 ~ . The results for the different reflecting layers show agreement to within the observational error provided that measurements are made within a short time of the preparation of the films. With silver as the reflecting layer an accuracy of 1 1 0 A. can be expected if suitable precautions are taken.
$1. INTRODUCTION H E method of measuring the thickness of thin films by multiple-beam interferometry as described by Tolansky (1948, p. 147) is now well T established. The film is deposited on a smooth substrate in such a way as
to possess a well-defined edge, and a highly reflecting opaque layer, usually of silver, is deposited over an area which includes the edge of the film. A wedge is then formed between the silvered film and a heavily silvered optical flat and the system IS examined by reflection with parallel monochromatic light. The wedge is adjusted so that the fringes of constant thickness (Fizeau fringes) cross the edge of the film at right angles. From the displacement of the fringes on crossing the step, the thickness of the film is easily deduced. This paper reports the results of an investigation on the accuracy to be expected by this method and of some factors influencing the precision attainable. Among these factors are (i) the effect on the fringe displacement of small irregularities in the surface of the supporting plate and of the optical flat and (ii) the accuracy of locating the centres of the fringes and hence the precision with which the displacements involved may be determined. Both these factors depend on the wedge angle between the test plate and the optical flat, that is, on the number of fringes per centimetre along the step. Errors due to these two causes vary in opposite directions as the wedge angle increases so that conditions for minimizing the combined error may be deduced.
The first part of the paper ($$Z and 3) is devoted to the application of a multiple-beam method to the examination of the small-scale irregularities on the
of the glass plates and flats used in the thickness determinations. A series of thickness measurements has been made on films of lithium fluoride
and of silver using five different metals as reflecting layers. Two experimental afrangements were used for the measurements; their respective merits are discussed,
2 D-2

420 0. S. Heavens
$2. E X A M I N A T I O N O F S U R F A C E I R R E G U L A R I T I E S The contours of the surfaces used were examined by the method employedby
Tolansky and Wilcock (1946) for the examination of crystal surfaces. The surface to be investigated is heavily silvered (reflection coefficient '-90%) and is placed close to and parallel to a similarly silvered optical flat. The intensity of
monochromatic light transmitted by the system depends on the separation of
the surfaces and passes through a very sharp maximum for separations ,42, where n is an integer. If the absorption in the silver film is neglected, the intensity I transmitted is related to the separation t by the relation
where I, is the maximum intensity, F=4R/( 1 -I?)', and R is the geometric mean of the reflection coefficients of the two silver layers. The variation of intensity with separation for two surfaces for which R =0*90 for the wavelength h=5461A, is shown in Figure 1. (Within the range f 1 o o A . of the value of for which the maximum intensity occurs, the approximation sin 2nt/h -2nt/h is valid to within 0.5 yo in this case.) In the neighbourhood of half the peak intensity the variation of intensity with separation is very rapid and from the slope of the (I , t ) curve it is seen that a variation of separation as small as 1 O A . produces an easily measurable change in the intensity transmitted. In practice, the separation is
I=I,/[l+ Fsin2 ( 2 4 A ) ] - * * . * * (1)
Separation o f Ptates, t ( A )
Figure 1. Variation of transmitted intensity with separation for two parallel plates with reflection coefficients 0.90.
adjusted until the maximum is obtained and a photograph taken. (Due to the relatively slow variation of intensity with separation at the maximum, this setting may be made visually.) The separation is then changed so that approximately half the peak intensity is obtained and a second photograph taken with double the exposure of the first. In this way the photographic densities of the two plates are approximately the same and accurate comparison of densities is possible, (Separate calibrations of each plate are made.) The variation of photographic density across any desired line of the plate is measured using a microphotometer, Variations of intensity are deduced from which the variation in separation Of
the two surfaces is obtained. The method yields the dzfJerence in the contoursoi the two plates rather than the actual contour of either.
$3 . T E S T S M A D E O N T H E O P T I C A L SURFACES The glass plates with which the subsequent thickness measurements *Iere
made were optical windows 2.2cm. x 1.1 cm. over which area they were flat within one or two wavelengths. The optical flat used was one of a pair for which the makers guaranteed flatness to within X/20 over a diameter of 6 cm.

Film Thickness Measurement 421
preliminary tests were made by matching the two optical flats one against the other and investigating the surface irregularities as described in 52. A
of 5-5 was used in making the Fizeau photographs and each record covered a section of the flats 4 mm. in diameter. The resolving power of the microphotometer enabled irregularities over distances along the surfaces of the order 30 microns to be detected. The overall magnification was approximately the same as that used for the subsequent thickness measurements. Thus
too small to be detected by this lateral magnification are likewise too small to introduce errors in the thickness determinations. At least two records were taken at each position on the flats, the separation being adjusted to give intensities slightly over and slightly under the half-maximum. I n this way, regions for which the sensitivity is low on one photograph fall on the high-sensitivity part of the second record.
The use of the Airy summation for the case of two plates with irregularities inthe surface is justified (a) provided that the plates are placed very close together and (6) so long as the residual angles between the two local surfaces, due to the irregularities, are not too large. These limitations have been investigated by Brossel (1947) who has derived expressions for the intensity distribution for a wedge. For separations between the surfaces of the order used in these experiments (<0.01 mm.) and for residual angles of the order found for these surfaces (< radian) the more exact expressions for the intensity distribution reduce to the Airy form within very close limits.
A typical result for the tests on the two optical flats is shown in Figure 2 (a). When the very high resolution involved is considered, the agreement between the two sets of figures is satisfactory. The plates appear to be flat locally to within very much less than the guaranteed 420. The surface contours of a number of the optical windows were examined by this method and a typical result is shown
I
L z
Distance along Plate (mm)
I I I I I I I
Figure 2 (a) Surface irregularities. Figure 2 (b). Surface irregularities. Optical windov TWO Zeiss optical flats. glass matched against a Zeiss flat.
1nFlgure 2(b). As might be expected, this shows larger irregularitles than those of the optical flats although in no case did the height of local irregularitles above the mean surface exceed h/150. Irregularities of this order are deduced, for
worked surfaces, from measurements using fringes of equal chromatic Order by Scott, McLauchlan and Sennett (1950).
$4. THE I N F L U E N C E OF SURFACE I R R E G U L A R I T I E S ON
The Fizeau fringes used for thickness determination occur at places at which the separation between the silvered surfaces is nX/2 (neglecting a very small correction due to the lack of exact phase agreement of the multiply reflected
T H I C K N E S S MEASUREMENT

0. S. Heavens 422
beams). Irregularities in the surfaces will thus give rise to a lateral displacement of the fringes and hence cause uncertainty in the thicknesses obtained. The extent of the error introduced will depend on the scale of the irregularities relative to the fringe displacements involved and also on the accuracy with which the positions of the fringes can be located. The latter factor depends on the wedge angle used in the thickness measurement and on the fringe width, A small wedge angle results in widely spaced fringes and the fringe displacements can be accurately measured. The errors arising from displacements of the fringes due to undulations in the surfaces of the type shown in Figure 2 increase lvith
decreasing wedge angle. There are also fewer steps to measure for a given length of film edge. For any pair of surfaces with given imperfections, an optimum value of fringe spacing therefore exists. This value depends on the thickness of film being measured. For the surfaces used in these experiments the optimum value ranges from about 10 fringes per centimetre for films 1 0 0 ~ . thick to about 50 fringes per centimetre for films of 2000 A., assuming an accuracy of 5 p in the displacement measurement. This is justified when silver or aluminium are used as reflecting layers ; only for metals of high reflectivity are the Fizeau fringes sufficiently fine for this precision to be attained.
8 5 T H I C K N E S S M E A S U R E M E N T S U S I N G D I F F E R E N T METALS AS R E F L E C T I N G LAYERS
(1) Preparation of Test SpeczmenJ The optical windows on which the test films were to be deposited, after a
prelimlnary examination for approximate flatness against an unsilvered optical flat, were cleaned by the process suggested by Colbert and Weinrich (1945). After chemical cleaning, a thin layer of lanoline is applied and then removed by successive applications of French chalk on virgin felt. The plates should show no breath figure after this treatment. A glow discharge at a pressure of 100 microns for 10 minutes completes the process.
In order that the displacement of the fringes at the edge of the test film can be easily measured, it is essential that the edges of the film be well defined, The plate was therefore supported on two inclined razor blades so that the extreme edges of the blades were in contact with the plate.
A strip of the test film 4". wide was evaporated down the middle ofthe plate from a source 8 mm. x 5 mm. at a distance of 40 cm. With this arrangement the thickness of the deposit can be expected to be uniform to within 045%.
An opaque layer of silver was next deposited over the whole of one edge of the test film. Measurements along this step confirmed the constancy of thickness of the film. The other metals used as reflecting surfaces were Al, NI, Cr and %and these were deposited as small squares on the other edge of the test film as shown in Figure 3. The target was shielded from the source during the first few seconds of the evaporation so as to minimize contamination ofthe film by impuritiesonthe surface of the source (due, for examp!e, to atmospheric oxidation). The rate deposition of the silver and aluminium films was approximately 20A. per second; that for nickel, chromium and tin was of the order 5 A. per second. The Pressure in the system, which was pumped by an 011 pump without trapping, was never allowed to rise above 10-5". Hg as measured by a Penning gauge SItuated
inside the evaporation chamber. Measurements were made on the films as as possible after preparation and in all cases on the same day.

Film Thickness Measurement 423 (ii) Measurements on the Fringes
The usual optical arrangement for illuminating the wedge system with parallel monochromatic light and viewing the reflected system at normal incidence \vas employed. T h e optical flat was silvered to give a reflectivity of about 90y0. The test plate and optical flat were mounted on a device for producing the necessary fine control of separation and tilt of the two plates; this has been described by the author elsewhere (Heavens 1950). The fringes were viewed with a low-power ( x55) microscope.
ci AI Sn N I Ag
Figure 3. Arrangement of reflecting deposits on test specimens.
Two methods were employed for making the actual fringe measurements. In the first method, readings were taken directly with a micrometer eyepiece. In the second, the fringes were photographed using the objective alone ( x 5.5) and the photographs measured using a travelling microscope. The micrometer eyepiece gave readings to 10 microns while the travelling microscope could be relied upon to within 2 microns. In the case of fringe systems with NI, Cr or Sn as the reflecting layers the fringes were so broad that the photographic method offered no advantage. While the photographic method involves additional processes, its chief advantage lies in the fact that, with suitable attention to the optical components the time of exposure may be made very short and effects of slow drifts (due, for example, to temperature changes) are eliminated. The use of a bloomed collimating lens and a 45" reflecting plate coated with a low-index-high-index quarter-wave pair to give enhanced reflection at an angle of Incidence of 45" for mercury green light enabled the exposure time to be reduced to 1 second. This type of selective reflector has been described by Turner (1950).
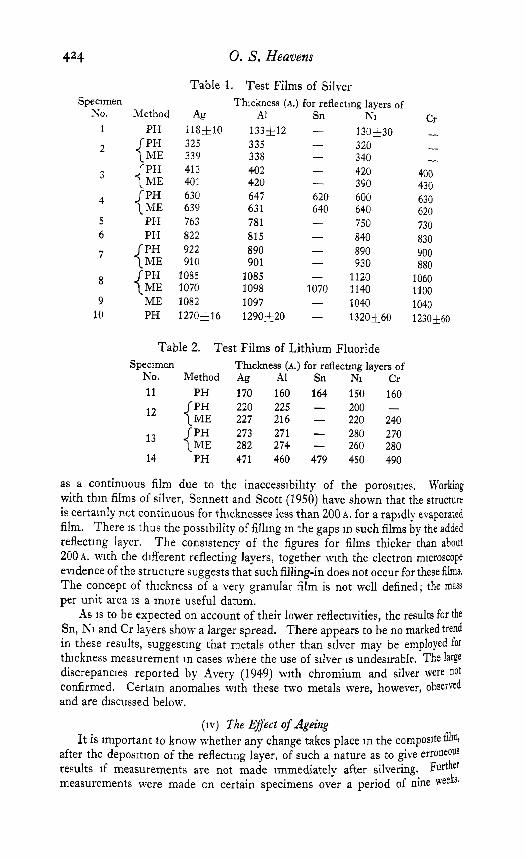
(iii) Results of the Measurements The results of the thickness measurements are collected in Tables 1 and 2 ;
PH indicates measurements made on the fringe photographs, ME shows the micrometer eyepiece figures. I t was observed that the internal consistency of the step measurements was better for the LiF films than for the Ag films. This difference is probably due to the nature of the films themselves. Electron microscope observations and refractive index determinations on evaporated films of lithium fluoride (Schultz 1949) suggest that the interiors of the films are porous but that the porosities are not accessible from outside the film. Working with thick films (>20,000 A . ) Schultz finds that such films contain both accessible and inaccessible voids but that the former type 1s absent for films less than 20,000~. thick. He finds that such thin layers have only Some 70% of the bulk density but that the layer does nevertheless behave
424 0. S. Heavens
Table 1. Test Films of Silver Specimen KO.
1
2
3
4
5 6
7
8
9 10
Method Ag
P H 118:hlO 325
J P H 413 {ME 401
630 {;% 639 P H 763 P H 822
922 {L? 910
{ Z 339
{E E ME 1082 PH 1270 j16
Thickness (A.) for reflecting layers of AI
1331.12 335 338 402 420 647 631 781 815 890 901
1085 1098 1097 1290+20
- Ni 130530 320 340 420 390 600 640 750 840 890 930
1120 1140 1040 1320&60
Cr - - -
400 430 630 620 730 830 900 880
1060 1100 1040 1230160
Table 2. Test Films of Lithium Fluoride Specimen Thickness (A.) for reflecting layers of
No. Method Ag A1 Sn NI Cr 11 PH 170 160 164 150 160
220 225 - 200 - l2 {L: 227 216 - 220 240
273 271 - 280 270 l3 {L? 282 274 - 260 280 14 P H 471 460 479 450 490
as a continuous film due to the inaccessibility of the porosities. Working with thin films of silver, Sennett and Scott (1950) have shown that the structure is certainly not continuous for thicknesses less than 200 A . for a rapidly evaporated film. There is thus the possibility of filling in the gaps in such films by the added reflecting layer. T h e consistency of the figures for films thicker than about 200 A. with the different reflecting layers, together with the electron microscope evidence of the structure suggests that such filling-in does not occur for these films. T h e concept of thickness of a very granular film is not well defined; the m a s per unit area is a more useful datum.
AS 1s to be expected on account of their lower reflectivities, the results for the Sn, h:l and Cr layers show a larger spread. There appears to be no marked trend in these results, suggesting that metals other than silver may be employed for thickness measurement in cases where the use of silver is undesirable. The large discrepancies reported by Avery (1949) with chromium and silver were not confirmed. Certain anomalies with these two metals were, however, observed and are discussed below.
(iv) The Eflect of Ageing It is Important to know whether any change takes place in the compos1tefilm,
after the deposition of the reflecting layer, of such a nature as to give erroneous results if measurements are not made immediately after silvering. Further measurements were made on certain specimens over a period of nine weeks’

Film Thickness Measurement 425 DificllltY was experienced with the chromium step on some specimens as the presence of chromium seems to accelerate the tarnishing action of the atmosphere on the silver layer below the chromium. The fringes crossing this part of the plate became broken up when the specimens were a week old and no further measurements were possible. The results of these tests are shown in Table 3 for Specimen 9.
Table 3 Age of Thickness (A.) from reflecting films of
specimen Ag A1 Ni Cr 4 hour 1082 1097 1040 1040 5 days 1084 1085 1120 1160
12 ,, 1075 1025 1050 1240 28 ,, 63 ,,
1089 1069 1061 - 1067 1081 1090 -
The accuracy of the second and third chromium figures is low due to the deterioration of the surface. The considerable oxidation does, however, show in the apparent increase in thickness. There appears to be no significant trend in the figures from the Ag, A1 or Ni layers.
6. C O N C L U S I O N S Examination of the surface contours of optically polished glass by means of
multiple-beam interference shows that the departure from the mean level due to local irregularities is not usually greater than h/150. The influence of these small-scale irregularities on the accuracy of film thickness measurements show that errors of the order 10-15~. may arise from this cause.
Thickness measurements made with five different metals as reflecting layers give concordant results within the accuracy to be expected provided that measurements are made on freshly prepared films. Errors may arise due to the oxidation of the layer, even when covered by a reflecting layer, and may amount to as much as 15-200/.
A C K N O W L E D G M E N T S The author wishes to thank Professor S. Tolansky and Dr. D. G. Avery for a
helpful discussion of the results of his work and Professor R. W. Ditchburn for hls interest and encouragement during the progress of the experiments. The bulk of the apparatus was obtained with a grant received from the Department of Scientific and Industrial Research.
R E F E R E N C E S AVERY, D. G., 1949, Nature, Lond., 163, 916. BROSSEL, J , 1947, PYOC. Phys SOC , 59, 224 COLBERT, H., AND WEINRICH, W. L., 1945, U S. Patent, 2, 383) 469 HEAOENS, 0 S., 1950, J Scz Instrum., 27, 172. SCHULTZ, L. G , 1949, J Chem Phys.&!153 SCOTT, G D., MCLAUCHLAN, T A , and SENNETT, R S., 1950, r. APPl. PhYS I 21, &3* SENNETT, R S., and SCOTT, G. D , 1950, J Opt. Soc Amey., 40, 203. TOLANSKY, S , 1948, Multzple Beam Interferometry (Oxford : University Press). TOLANSKY, S., and WILCOCK, W L., 1946, Nature, Lond., 157, 583. TURUER, A. F., 1950, J Phys Radzum, 11, NO 7, 449.