measurement and analysis of civil engineering vibrations
TRANSCRIPT

Missouri University of Science and Technology Missouri University of Science and Technology
Scholars' Mine Scholars' Mine
International Conference on Case Histories in Geotechnical Engineering
(1998) - Fourth International Conference on Case Histories in Geotechnical Engineering
08 Mar 1998 - 15 Mar 1998
Measurement and Analysis of Civil Engineering Vibrations Measurement and Analysis of Civil Engineering Vibrations
Jean-Lou Chameau Georgia Institute of Technology, Atlanta, Georgia
Glenn J. Rix Georgia Institute of Technology, Atlanta, Georgia
Laurel Empie Georgia Institute of Technology, Atlanta, Georgia
Follow this and additional works at: https://scholarsmine.mst.edu/icchge
Part of the Geotechnical Engineering Commons
Recommended Citation Recommended Citation Chameau, Jean-Lou; Rix, Glenn J.; and Empie, Laurel, "Measurement and Analysis of Civil Engineering Vibrations" (1998). International Conference on Case Histories in Geotechnical Engineering. 6. https://scholarsmine.mst.edu/icchge/4icchge/4icchge-session00/6
This work is licensed under a Creative Commons Attribution-Noncommercial-No Derivative Works 4.0 License.
This Article - Conference proceedings is brought to you for free and open access by Scholars' Mine. It has been accepted for inclusion in International Conference on Case Histories in Geotechnical Engineering by an authorized administrator of Scholars' Mine. This work is protected by U. S. Copyright Law. Unauthorized use including reproduction for redistribution requires the permission of the copyright holder. For more information, please contact [email protected].

96 Proceedings: Fourth International Conference on Case Histories in Geotechnical Engineering, St. l.ouis, Missouri, March 9-12, 1998.
Measurement and Analysis of Civil Engineering Vibrations
Jean-Lou Chameau Georgia Instihne of Technology Atlanta. Georgia. USA 30332
ABSTRACT
Glenn J. Rix Georgia Institute of Technology Atlanta, Georgia, USA 30332
Laurel Empie Georgia Institute ofT echnology Atlanta, Georgia, USA 30332
SOA-2
Man-made vibrations caused by construction activities, blasting, rail and vehicular traflic, and machinery can have an adverse impact on buildings and facilities, human occupants of buildings, and sensitive equipment housed within these facilities. Comparisons ben.vcen vibrations are often difficult because of different methods used to measure, analyze, and interpret vibration data. To facilitate these comparisons, standard methods of selecting and mounting transducers, processing vibration data, and interpreting test results are reviewed. Specific measurement and analysis techniques and maximum allowable vibration criteria used tOr evaluating the influence of vibrations on humans, the potential for cosmetic damage to structures, and the impact on vibration-sensitive equipment are also summarized.
KEYWORDS
Construction vibrations, blasting, traffic, pile driving, signal processing, vibration criteria
INTRODUCTION
Ground vibrations arising from man-made sources including construction activities. blasting, and vehicle and rail traffic may interfere with sunounding residential and commercial activities. Ground-home vibrations can also cause cosmetic and stmctural damage to nearby structures. The problems may occur as a result of large amplitude vibrations, from repeated occurrences of smaller amplitude vibrations, or from differenlial settlement induced by pa1iicle reanangement. Ground-borne vibrations are often accompanied by air-borne noise, annoying and heightening the sensitivity of humans. Their concerns often result in legal complaints alleging disruption with daily activities or damage to existing struch1res.
To assess the impact of ground-borne vibrations on humans and to ensure the safety of ex1sting structures, vibrations arising from construction activities, blasting, and vehicle and rail traffic are often monitored, especially in congested urban and suburban areas. Several state-of-the-art papers and books have sought to characterize and summarize available vibration data (Wiss. 1981; Skipp, 1984; Dowding, 1985; Massarch, 1993; Dowding, 1996). Each of these works. as well as numerous other articles in the literature, have focused on different aspects of vibrations including:
• Classifying types of vibrations and categorizing sources according to the type of vibration they generate.
• Discussing instrumentation available for monitoring and measuring vibrations.
• Establishing relationships between peak particle velocity, energy, and attenuation.
• Demonstrating the difference betw·een levels perceptible to humans and those that cause structural damage.
• Establishing limiting criteria for vibration amplitudes and comparing the limits set forth by governing bodies throughout the \vorld.
Upon reviewing the literature, it is difficult to make comparisons and draw conclusions from different sources of vibration data because of the lack of consistent methods of measuring, processing, and reporting the data. Civil engineers would benefit from the increased availability and adherence to standards that recommend proper procedures for measuring and analyzing this information. The purpose of this paper is to review existing standards and methodologies for measuring vibrations and assessing their impact on humans, structures of various types, and sensitive equipment.
Fourth International Conference on Case Histories in Geotechnical Engineering Missouri University of Science and Technology http://ICCHGE1984-2013.mst.edu

SOURCES AND TYPES OF VIBRATIONS
Vibrations resulting from construction activities, blasting, and vehicle and rail traffic can be classified as either continuous or transient based on the duration of the ground motion compared to the time constant describing the response of the structure of interest (ISO, 1990). The time constant is defmed as:
( 1 )
where ~' is the damping ratio associated with a particular mode of vibration and f,. is the resonant frequency of that mode. If the duration of the ground motion exceeds 5-rp the motion is regarded as continuous. Transient ground motions impinge on the structure for durations less than 5T,. Examples of continuous vibration sources include vibratory pile drivers and traffic. Blast-induced vibrations are typical of transient events. A third category, intermittent vibrations, is often defined to include repetitive, transient excitation such as that resulting from impact pile driving. The distinction between the types of excitation is important because it influences the choice of measurement and processing techniques.
The type of excitation and typical ffequency ranges are shown for several man-made vibration sources in Table 1.
Table I Typical Characteristics of Man-Made Vihration
Sources (after ISO, /990)
Source Type of Excitation 1
Traffic CIT Blasting T Pile Drivin2. T(])
Machinery C/T (outs1de) Machinery C/T (inside)
C = Contmuous, T ,- Transient, I = Intermittent
Frequency Range2
IHzl 1 to 80 1 to 300 1 to 100 1 to 300
1 to 100
Frequency range of building response
Dowding ( 1996) also provides a wealth of information on the characteristics of various man-made vibrations.
Another useful means of categorizing vibration data is the distinction between deterministic and random data (Fig. 1). The choice of signal processing methods often depends on whether the data may be considered stationary (i.e., has statistical properties which are independent of time). Bendat and Piersol ( 1989) describe tests used to determine if a signal is stationary.
97
u __ s= ,_;_,---L-1 -=-1 ~::_:_____] I
Fig. 1 Class~ficalion of Vibration Signals (from ISO, 1 990)
GENERAL MEASUREMENT AND ANALYSIS
TECHNIQUES
Measurement Techniques
Equipment selection is an important aspect of vibration measurement and analysis. Typically, a monitoring system consists of transducers (usually geophones or accelerometers), amplifiers, filters, and a recording system. The transducers produce a voltage output that is proportional to either particle velocity (geophones) or particle acceleration (accelerometers). Individual transducers measure vibrations in one of three orthogonal directions (usually vertical, transverse, and radial) It is collllllon to house tluee transducers in a case to permit measurements in all tluee directions simultaneously.
Each transducer has a ffequency response curve that determines the voltage output for a given particle motion (Fig. 2).
It is important to select a transducer with a frequency range corresponding to that of the expected ground or structural motion (Table 1 ). The frequency response function also describes the phase shift introduced by the transducer. In addition, the manner in which the transducer is coupled to the ground or mea~urement surface has an influence on the accuracy of the recorded motion as described later in this paper.
The frequency response curve may be used to convert the signal from volts to engineering units (e.g., em/sec). Farnfield (1996) has demonstrated that erroneous results can occur from using a single-valued calibration constant (approximately 13 volts/in./sec in Fig. 2) corresponding to the high-frequency portion of the frequency response curve. More accurate results are obtained if the frequency response curve is applied
Fourth International Conference on Case Histories in Geotechnical Engineering Missouri University of Science and Technology http://ICCHGE1984-2013.mst.edu

20
" " ~ 15
" ~ ~
0
g 10 LL
" 0
~ .0 5
" '-'
0.1 10
Frequency (Hz)
100
Fig. 2 Frequency Response Curve fOr a Vertical, 1-Hz
Natural Frequenc_v Geophone
directly to the measured signal in the frequency domain. Famfield noted that correcting only for the amplitude response of the transducer (and not the phase response) also leads to measurement errors.
Amplifiers and/or filters used as part of the measurement system also have an influence on the recorded motion. For example, low or high pass filters can be used to improve the signal-to-noise ratio, but can produce undesired changes in the amplitude and phase of the signal if not properly selected.
Analysis Techniques
The basic quantity used for analysis of civil engineering vibratiOns is either the particle acceleration, a(t), or particle velocity time history, v(t), corrected for the influence of the transducer and measurement system as described above. A variety of techniques are available for characterizing these signals including (ISO, 1992):
• • • •
peak values and duration for transient vibrations,
root~ mean-square (rms) values for continuous vibrations,
Fourier, power, octave, and one-third octave spectra, and
response spectra .
In this section, these basic signal processing and analysis techniques are reviewed. Teclmiques particular to assessing the impact of the vibrations on humans, structures, and equipment are described in later sections.
It is common to characteri:;.e vibration data by identifying the maximum absolute (peak) amplitude of the time history (e.g.,
98
Siskind ct al., 1980). This method has obvious value because it is simple and reflects the maximum response, but provides an mcomplcte description of the time history. An alternative is to determine the maximum sustained response defined for instance, as the third or fifth largest absolute amplitude contained in the time history (Nutth, 1979).
If particle motions are measured in three orthogonal directions simultaneously, it is possible to calculate the vector sum of the three components using:
(2)
The root-mean-square (nns) amplitude is more representative of the entire time history and is defined as:
(3)
The rms amplitude is strongly dependent on the duration of the record or portion of the record used in the calculation. This is particularly true for transient events in which the duration of the largest motions is small compared to the total length of the recording. One possible solution is to choose a minimum amplitude of interest and calculate the nns amplitude from the time that the minimum amplitude is exceeded for the first time to the time that the minimum amplitude is exceeded for the last time in the record (Bolt, 1969). The choice of minimum amplitude would depend on whether the impact on humans, structures, or sensitive equipment is of interest. A similar approach was used by Siskind et al. (1980) in calculating the velocrty exposure level (VEL):
( I T 2 ) VEL~ 10log10 ~jv (t)dt
lo o (4)
where t11 and T =- 1 second.
[n addition to measures of the amplitude of a vibration time history, the frequency content of the signal is also important in assessing its impact on humans, structures, and sensitive equipment. The simplest method of estimating the frequency content is to estimate the period by examining "zero crossings" of the time history. This method works reasonably well for simple, periodic signals, but is more difficult to use for complex, multiple-frequency signals and tends to underestimate the actual frequencies (Siskind, 1996).
A common method of estimating the frequency content (spectrum) of a signal is to calculate the Fourier transform of the signal:
Fourth International Conference on Case Histories in Geotechnical Engineering Missouri University of Science and Technology http://ICCHGE1984-2013.mst.edu

N-1 -i2:rrk~ X[k] ~ L: x[n]e N (5)
11-0
fork-0, 1.2 .. J\-1
Generally, plots of the magnitude of the complex-valued Fourier transform arc examined to identify peaks corresponding to dominant frequencies in the signaL A related quantity which is also widely used to estimate the frequency content of a signal is the power spectrum:
(6)
where X[k} denotes the complex conjugate of the Fourier
transform.
Despite its widespread usc, there are several limitations associated with the use of Fourier methods of estimating spectra. First, the usc of Fourier methods implicitly assumes that the signal is stationary. For transient signals such as impact pile dnving and blasting and for many conlinuous signals, this assumption is nol valid. For non-stationary signals, the Short Time Fourier Transform, Wavelet Transform, and Wigner-Villc Distribution are examples of techniques which may be used to estimate the instantaneous spectrum of the signal as a function of time (Gade and GramHansen, 1997).
Second, the Fourier-based power spectrum is an inconsistent estimate of the true spectrum of a signal (Kay, 1988). When applied to a single time history, the estimated mean value of the power spectrum approaches the true mean value as the length of the record increases. However, the standard deviation of the estimated value is equal to the mean. This may result in rapidly fluctuating power spectra from which it is difficult to reliably identify peaks corresponding to
Tahle 2 Spectral Estimation Methods (afier Kay, 1988)
Category Method
Fourier Pcriodo2:ram Blackman-Tukey
99
dominant frequencies. One possible solution is to average the power spectrum of several time histories if the vibration source is repetitive. The standard deviation of the averaged estimate decreases in proportion to the number of averages, but the mean value will be less accurate. Kay (1988) also describes other methods of spectral estimation which often provide superior results to Fourier-based methods (see Table 2).
If it is possible to measure the vibrations impinging on a structure or piece of equipment, the transfer function between the input and output can be determined using:
(7)
where G,y[k] is the cross power spectrum beh-veen the input, X[k], and the response of the system, Y[k]. The transfer function is useful for isolating the structure and determining its dynamic properties. A conunon application is to consider the vibrations recorded at the foundation level of a structure as the input motion and the motion recorded at a point within the strucnue as the response. The transfer function between these two points can be used to estimate the natural frequencies and damping of the structure.
A valuable method for estimating the response of a structure to an incoming ground motion is the response spectrum. The response spectrum is expressed as a pseudo-velocity or pseudo-acceleration versus the natural period (or frequency) of the structure which is modeled by a single-degree-offreedom (SDOF) system. It is widely used in earthquake engineering for designing earthquake resistant structures and has also been used to estimate the response of structures to blast vibrations (Medearis, 1976; Dowding, 1996). The response spectrum may be calculated using the convolution
Computational Complexity Low Low
Autoregressive Autocorrelation (Yule-Walker) Medium Covariance Medium Modified Covariance Medium Bur• Medium Recursive Maximum Likelihood Estimate Medium
Moving Average Durbin Medium Autoregressive Moving Average Akaike Maximum Likelihood Estimate High
Modified Yule-Walker Medium Least Sauares Modified Yule-Walker Medium Mavnc-Firoozan Medium
Minimum Variance Minimum Variance Medium Fourth International Conference on Case Histories in Geotechnical Engineering Missouri University of Science and Technology http://ICCHGE1984-2013.mst.edu

(Duhamel) integral;
(8)
where 0( t) is the relative displacement compared to the ground, wn is the circular natural frequency of the SDOF system, md is the damped circular natural frequency, J3 is the
fraction of critical damping, and ti( t) is the particle
acceleration of the ground surface. A similar expression can be used if the patiicle velocity is used as the input motion. The pseudo velocity is calculated using the maximum relative displacement, ()m"x' and the assumption of harmonic motion:
s\ =OJ no max (9)
Additional information on signal processing and analysis can be found in Bendat and Piersol (1989), Oppenheim and Schafer ( 1989), and San tamar ina and Fratta ( 1998).
HUMAN SENSITIVITY AND IMPACT
Several ISO standards (ISO 263I-l, 1997; ISO 2631-2, 1989; ISO 6897. 1984; ISO 10137, 1992) prescribe techniques for measurement, analysis, and interpretation of vibration data to assess the impact on human activity and health. The standards were developed to "simplify and standardize the reporting, comparison, and assessment of vibration conditions." The essential components of these techniques are summarized in the rollowing sections.
Measurement
Transducers used to measure the impact of vibrations on humans are to be placed "at the interface between the human body and the source of its vibration" (ISO 2631-1, 1997). In instances where the interface is a rigid surface, the transducer may be placed immediately adjacent to the human body. For non-rigid surfaces (e.g., a cushion), the transducer must be placed between the surface and the human body in such a way that the interaction between the two Is not significantly altered. Usually, this requires a mount which conforms to the human body. The transducer( s) should be oriented to coincide with the coordinate system shown in Fig. 3. Measurements of particle acceleration are preferred, but particle velocity time histories may also be recorded and differentiated to obtain acceleration.
Analysis
The impact of vibrations on humans may be evaluated using a weighted root-mean-square (rms) acceleration defined as:
100
Fig. 3 Coordinate System for Human Body (!SO, 1997)
a w (I 0)
where aw(t) is the weighted acceleration time history in rru'sec2
and T is the duration of the measurement in seconds. In practice, it is more convenient to calculate the weighted nns acceleration in the frequency domain using:
(II)
where wi is the weighting factor for the ith frequency band and a; is the magnitude of the rms acceleration of the ith frequency band. The frequency dependent weighting factors for measurements in the z direction are shown in Fig. 4. ISO ( 1997) defines weighting factors for other directions also.
10 ~------------------------~
0 iii' ::- -10 .'l :il -20 ~
~ -30
" ~ i -40
-50
-60 L...~~~~--~~-~~~
0.1 10 100 1000
Frequency (Hz)
Fig 4 Frequency Weighting Factors for Human Response
in z Direction
For transient vibrations, the weighted nns acceleration may be misleading because it will underestimate the severity of the vibrations. The crest factor is used as an indicator of this
Fourth International Conference on Case Histories in Geotechnical Engineering Missouri University of Science and Technology http://ICCHGE1984-2013.mst.edu

situation and is defined as the ratio of the peak value of the weighted acceleration time history to the weighted rms acceleration:
max( Ia w ( t ll) Crest factor = ---'"---'-'-= ( 12)
If the crest factor is less than or equal to 9, the use of the weighted m1s acceleration is sufficient. For crest factors which exceed 9, two alternatives are reconunended to more accurately characterize the vibrations. The first alternative is the running nns method in which the rms acceleration is integrated over a shorter time interval to better capture transient events:
1 to ~ - Ja~{t)dt ( 13) l to-'
where ~ is the time of observation and t is the integration time ( t ,- 1 sec is recommended). The maximum transient vibration value (MTVV) is determined as:
MTVV ~ max(aw(to))
ISO ( 1997) suggests that if
MTVV 1
_ > .)
( 14)
( 15)
then the transient portion of vibrations may control human response
The second alternative method to be used if the crest factor exceeds 9 is the fourth power vibration dose value:
T
VDV~4 ja~(t)dt ()
ISO ( 1997) !luther suggests that if:
VDV ;:; > 1.75
awT 4
( 16)
( 17)
then the transient portion of the vibrations may control human response.
Intemretation
ISO (1989) provides guidelines for assessing the impact of construction vibrations on occupants of nearby buildings based on the weighted rms acceleration. Figure 5 shows the
1 01
base curve which "represent magnitudes of approximately equal human response with respect to human annoyance and! or complaints about interference with activities."
Fig. 5 Vibration Criteria for Human Occupants of Buildings
- Combined Direction (from ISO, I 989)
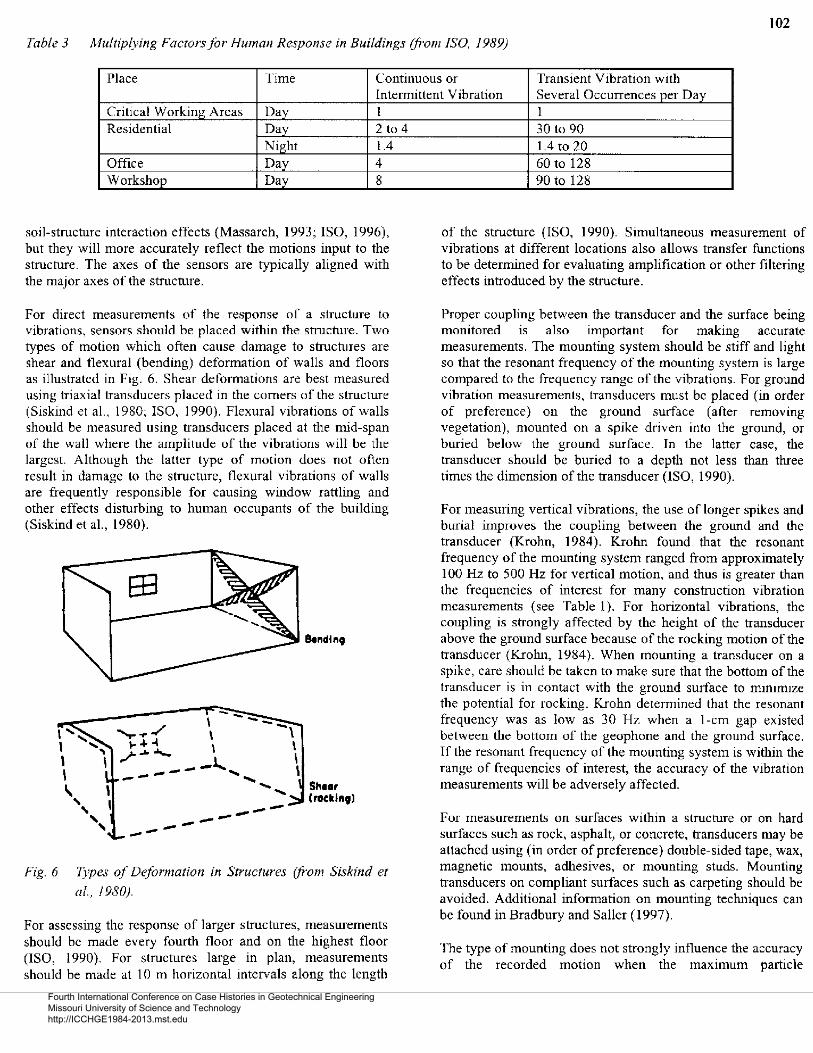
Por the specific locations shown in Table 3, the base curve is multiplied by the factor in the table. Curves corresponding to these multiples are also shown in Fig. 5. Interested readers should refer to ISO 2631-2 for additional details concerning the use of these factors.
Criteria involving the maximum transient vibration value (MTVV) and fourth power vibration dose value (VDV) are still under development. Finally, for low-frequency excitation less than I Hz, ISO 6897 ( 1994) provides criteria for maximum tolerable vibration levels for humans.
RUILDTNG DAMAGE
Measurement
The placement and coupling of sensors are key parameters that influence the accuracy and usefulness of the data used to assess the impact of vibrations on nearby structures. For measuring incoming ground vibrations the sensors should be placed as close to the foundation of the structure as practicaL A convenient, accessible point is often on a main, loadbearing wall at ground level (ISO, 1990, 1992). The motions recorded at these locations on or near the foundation of the structure will differ from free-field ground motions due to
Fourth International Conference on Case Histories in Geotechnical Engineering Missouri University of Science and Technology http://ICCHGE1984-2013.mst.edu
102
Table 3 Mulllplving Factors for Human Response in Buildings (from ISO. 1989)
Place Time Continuous or Transient Vibration with Intermittent Vibration Several Occurrences per Day
Critical Working Areas Day I Residential Day 2 to 4
Night 1.4 Office Day 4 Workshop Day 8
soil-structure interaction effects (Massarch, 1993; ISO, 1996), but they will more accurately reflect the motions input to the structure. The axes of the sensors are typically aligned with the major axes of the structure.
For direct measurements of the response of a structure to vibrations, sensors should be placed within the structure. Two types of motion which often cause damage to structures are shear and flexural (bending) defonnation of walls and t1oors as illustrated in Fig. 6. Shear deformations are best measured using triaxial transducers placed in the comers of the structure (Siskind et a!., 1980; ISO, 1990). Flexural vrbratwns of walls should be measured using transducers placed at the mid-span of the wall where the amplitude of the vibrations will be the largest. Although the latter type of motion does not often result in damage to the structure, flexural vibrations of wa11s are frequently responsible for causing window rattling and other effects disturbing to human occupants of the building (Siskind eta!., 1980).
....,_~/ .... ~ ,.;- .... ._
I I \
--- -, --1... -- .... -- .... ......
---------
I I I
s ..... , Craeklnvl
Fig. 6 Types of Deformation in Structures (from Siskind et
a/., /980).
For assessing the response of larger structures, measmements should be made every fourth floor and on the highest t1oor (ISO, 1990). For structures large in plan, measurements should be made at 1 0 m horizontal intervals along the length
I 30 to 90 1.4 to 20 60to 128 90 to 128
of the structure (ISO, 1990). Simultaneous measurement of vibrations at different locations also allows transfer functions to be determined for evaluating amplification or other filtering effects introduced by the structure.
Proper coupling between the transducer and the surface being monitored is also important for making accurate measmements. The mounting system should be stiff and light so that the resonant frequency of the mounting system is large compared to the frequency range of the vibrations. For ground vibration measurements, transducers must be placed (in order of preference) on the ground surface (after removing vegetation), mounted on a spike driven into the ground, or buried below the ground surface. In the latter case, the transducer should be buried to a depth not less than three times the dimension of the transducer (ISO, 1990).
For measuring vertical vibrations, the use of longer spikes and burial improves the coupling between the ground and the transducer (Krohn, 1984). Krohn found that the resonant frequency of the mounting system ranged from approximately I 00 Hz to 500 Hz for vertical motion, and thus is greater than the frequencies of interest for many construction vibration measurements (see Table 1 ). For horizontal vibrations, the coupling is strongly affected by the height of the transducer above the ground surface because of the rocking motion of the transducer (Krohn, 1984). When mounting a transducer on a spike, care should be taken to make sure that the bottom of the transducer is in contact with the ground surface to minimize the potential for rocking. Krohn determined that the resonant frequency was as low as 30 Hz when a 1-cm gap existed bel ween the bottom of the geophone and the ground surface. If the resonant frequency of the mounting system is within the range of frequencies of interest, the accuracy of the vibration measurements will be adversely affected.
For measurements on surfaces within a structure or on hard surfaces such as rock, asphalt, or concrete, transducers may be attached using (in order of preference) double-sided tape, wax, magnetic momlts, adhesives, or mounting studs. Mounting transducers on compliant surfaces such as carpeting should be avoided. Additional information on mounting techniques can be found in Bradbury and Saller (1997).
The type of mounting does not strongly influence the accuracy of the recorded motion when the maximum particle
Fourth International Conference on Case Histories in Geotechnical Engineering Missouri University of Science and Technology http://ICCHGE1984-2013.mst.edu

accelerations are less than 0.3 g (Dowding, 1996). \Vhen accelerations are between 0.3 g and 1.0 g, the transducer should be buried for ground vibration measurements or securely coupled to other measurement surfaces to obtain accurate measurements_ When accelerations exceed 1.0 g, the transducers must be buried or rigidly attached lo the structure. Siskind and Stagg ( 1985) suggest bolting, clamping, or burying transducers when ground accelerations arc expected to exceed 0.2g. ISO (1990) also recommends that transducers be buried if the acceleration exceeds approximately 0.2 g.
Analysis
The panicle velocity of either the ground surface outside of a snucture or structural components (e.g., walls, floors, etc.) within the structure is the kinematic parameter most often used to assess possible structural damage. The simplest analysis is to record the peak particle velocity on the ground surface and associate it with a frequency obtained from adjacent zero crossings, Fourier-based spectra, or response spectra. Siskind et al. (1980) recommend that the largest spectral peak and all others greater than one-half the magnitude of the largest peak be taken into account. Dowding { 1996) reconunends considering peaks that are within 0. 7 of the peak spectral amplitude. It is important to note that in this context, the response spectrum is used only as a means of identifying the predominant frequencies in a signal and not as an estimate of structural response.
If a more detailed analysis of the impact of vibrations on a structure is required, the response of the structure may be measured directly or estimated using a response spectrum. In the latter case, the natural frequencies and damping ratios of the structure should be measured using transfer functions be-rn ... een the foundation and other points within the structure. If transfer function measurements are not possible, Dowding ( 1996) and ISO ( 1990) provide gutdelines for estimating the natural frequency and damping of a variety of structure types.
For simple structural shapes such as a full section rectangular beam, the following expression can be used to estimate the maximum bending stress in the beam as a function of the maximum particle velocity measured on the beam (ISO, 1990):
crmax ~~E·r· 3~ ·k·Vmax Gbeam
(I 8)
where E = the Young's modulus, p is the mass density, G tutfG bearn is the ratio between the total distributed load on
the beam and the self weight of the beam (0101 ..,.,. Gbeam + Gother), k is a mode coefficient (1.0 < k < 1.33) which depends on the boundary conditions, and vmax is the maximum particle velocity measured on the beam.
Intemretation 103
ISO ( 1990) provides qualitative guidelines for determining
which types of structures are most susceptible to vibration
induced damage. The classification scheme is based on the
following four factors:
• Type of construction
• Type of foundation
• Type of soil
• Societal importance of the structure
These guidelines are useful in defining the scope of the vibration measurements for a particular structure.
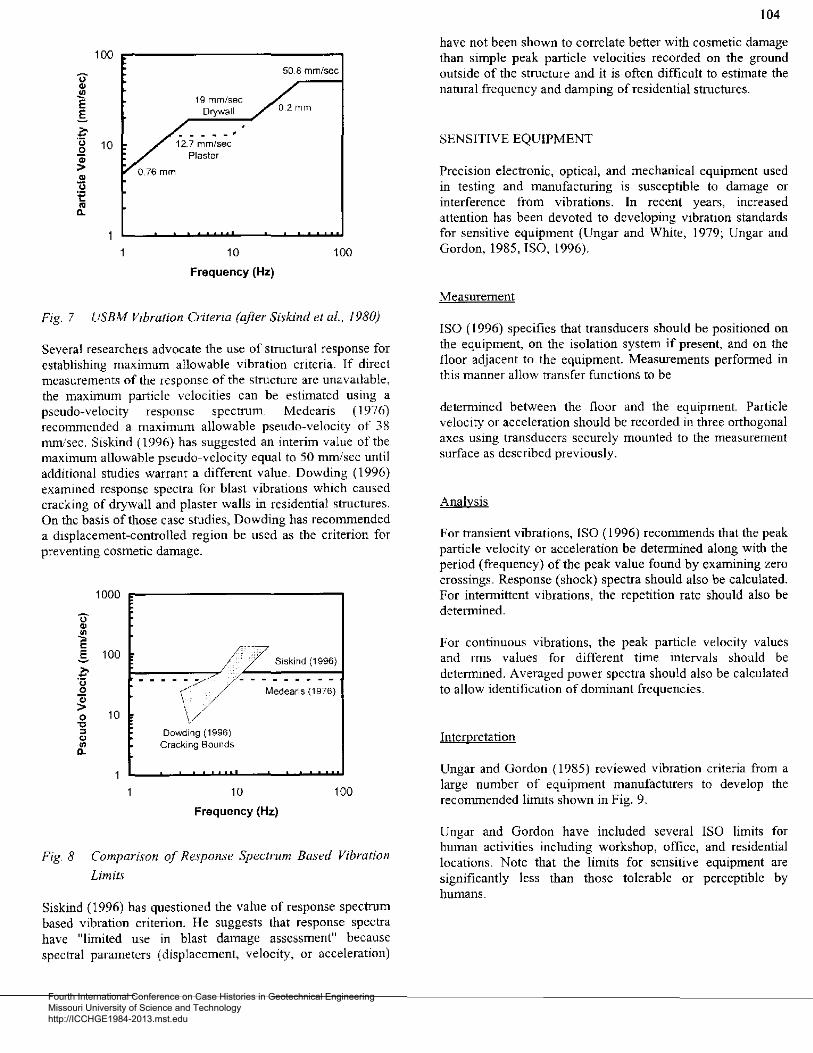
One popular vibration criterion is the frequency-dependent limits proposed by the U.S. Bureau of Mines (Siskind et al., 1980) based on an extensive study of damage to residential structures from surface mine blasting. Siskind et al. ( 1980) found that horizontal peak particle velocity measured on the ground outside of a structure correlated well with "threshold damage" defined as cosmetic damage (e.g. cracking) within the structure. Although other descriptors of the ground motion were considered, peak particle velocity was chosen for its effectiveness and simplicity (Siskind, 1996). The vibration criteria are presented in a simple form (Table 4) and in a more complex form (Fig. 7) with transitions betv.reen frequency range$. The lower limits at frequencies less than 40 Hz reflect the fact that the structural and mid-wall resonant frequencies are usually within this range for residential structures.
Table 4 Simplified USBM Vibration Criteria for Peak
Particle Velocity (from Siskind eta!., 1980)
Type of Ground Vibration Structure
Low Frequency ( < High Frequency 40 Hzl -(>40Hz)
Modem 0.75 in./sec 2.0 in./sec Homes
(Drywall)
Older 0.5 in./sec 2.0 in./sec Homes
(Plaster)
Both methods require an estimate of the dominant frequencies contained in the vibration time history. Siskind ( 1996) reviewed several methods of determining the frequency including those described above and found no significant differences among the methods.
Representative standards used in other countries are shown in Table 5.
Fourth International Conference on Case Histories in Geotechnical Engineering Missouri University of Science and Technology http://ICCHGE1984-2013.mst.edu
100 ~-----------------------
19 mm/sec Drywall
10
Frequency (Hz)
50.8 mm/sec
02mm
100
Fig. 7 USBM Vrbration Criteria (ajier Siskind eta/., /980)
Several researchers advocate the use of structural response for establishing maximum allowable vibration criteria. lf direct measurements of the response of the structure arc unavailable, the maximum particle velocities can be estimated using a pseudo-velocity response specuum. Medearis ( 1976) recommended a maximum allowable pseudo-velocity of 38 mmisec. Siskind ( 1996) has suggested an interim value of the maximum allowable pseudo-velocity equal to 50 mmiscc until additional studies warrant a different value. Dowding (1996) examined response spectra for blast vibrations which caused cracking of drywall and plaster walls in residential structure&. On the basis of those case studies, Dowding has recommended a displacement-controlled region be u&ed as the criterion for preventing cosmetic damage.
1000
~------,,./ • )7 S"klod (1996)
.. -\~/- - -M~d~a;, ;,~,;)
Dowding (1996) Cracking Bounds
10
Frequency (Hz)
100
Fig. 8 Comparison of Response Spectrum Based Vibration
Limits
Siskind ( 1996) has questioned the value of response spectrum based vibration criterion. He suggests lhat response spectra have "limited use in blast damage assessment" because spectral parameters (displacement, velocity, or acceleration)
104
have not been shown to correlate better with cosmetic damage than simple peak particle velocities recorded on the ground outside of the structure and it is often difficult to estimate the natural frequency and damping of residential structures.
SENSITIVE EQUIPMENT
Precision electronic, optical, and mechanical equipment used in testing and manufacturing is susceptible to damage or interference from vibrations. In recent years, increased attention has been devoted to developing vibration standards for sensitive equipment (Ungar and White, 1979; Ungar and Gordon, 1985, ISO, 1996).
Measurement
ISO ( l 996) specifics that transducers should be positioned on the equipment, on the isolation system if present, and on the floor adjacent to the equipment. Measurements performed in this manner allow transfer functions to be
determined between the floor and the equipment. Particle velocity or acceleration should be recorded in three orthogonal axes using transducers securely mounted to the measurement surface as described previously.
Analysis
For transient vibrations, ISO ( 1996) recommends that the peak particle velocity or acceleration be determined along with the period (frequency) of the peak value found by examining zero crossings. Response (shock) spectra should also be calculated. For intermittent vibrations, the repetition rate should also be detennined.
For continuous vibrations, the peak particle velocity values and rms values for different time intervals should be determined. Averaged power spectra should also be calculated to allow identification of dominant frequencies.
Interoretation
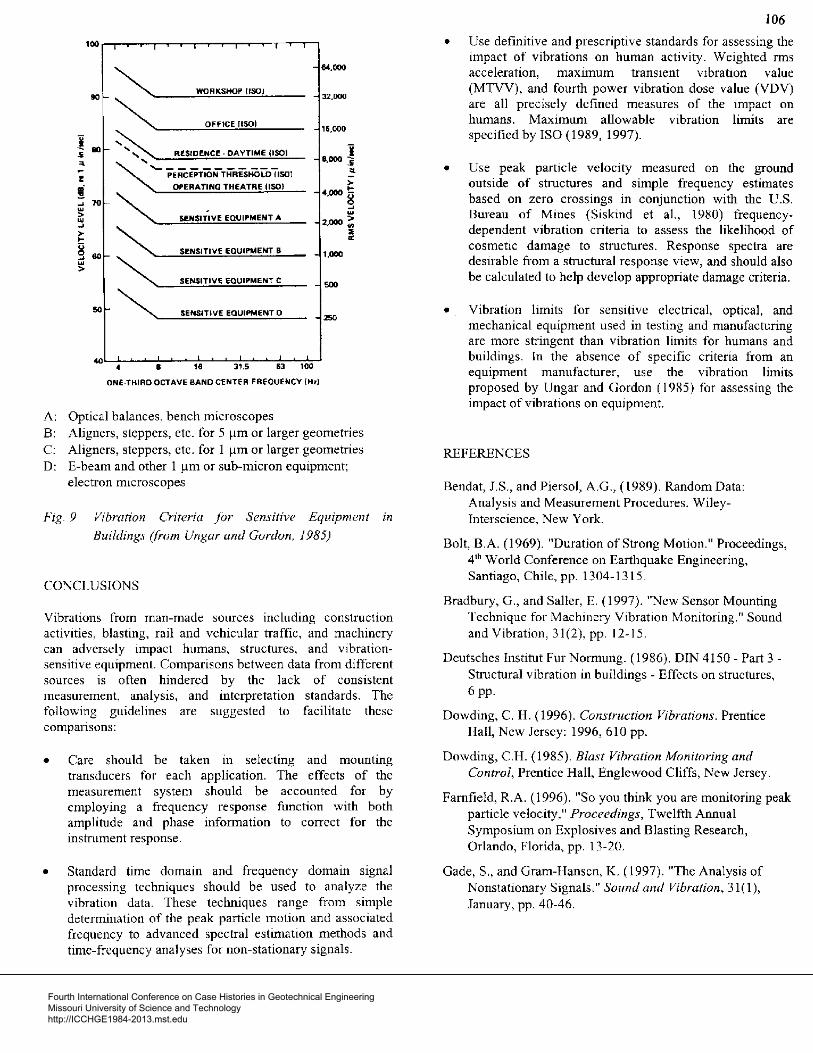
Ungar and Gordon ( 1985) reviewed vibration criteria from a large number of equipment manufacturers to develop the recommended limits shown in Fig. 9.
Ungar and Gordon have included several ISO limits for human activities including workshop, office, and residential locations. Note that the limits for sensitive equipment are significantly less than those tolerable or perceptible by humans.
Fourth International Conference on Case Histories in Geotechnical Engineering Missouri University of Science and Technology http://ICCHGE1984-2013.mst.edu

105
Tahle 5 Representative Vibratiorl Criteria from Other Countries (from New, 1992)
Standard Structure/Object Type Source of Frequency Peak Velocity Location of measurement Vibration (Hz) (mmlsec)
DIN4150 Offices and industrial premises <10 20 Foundation (Germany)
10-50 20-40 Foundation 50-100 40-50 Foundation all 40 Top story on wall at floor
level Domestic houses and similar <10 5 Foundation constructwn
10-50 5-15 Foundation 50-100 15-20 Foundation all 15 Top story on wall at floor
level Other buildings sensitive to <10 3 Foundation vibrations
10-50 3-18 Foundation 50-100 8-10 Foundation all 8 Top story on wall at floor
level
Switzerland Steel or reinforced concrete Blasting 10-60 30 structures such as factories, retaining walls, bridges, steels towers, open channels, underground tunnels and chambers
60-90 30-40 Traffic/ 10-30 1 2 machines
30-60 12-18 Buildings with foundation walls and Blasting 10-60 18 floors in concrete, walls in concrete or masonry, underground chambers and lunnels with masonry linings
60-90 18-25 Traffic/ 10-30 8 machines
30-60 8-12 Buildings with masonry walls and Blasting 10-60 12 wooden ceilings
60-90 12-18 Traffic/ 10-30 5 machines
30-60 5-8 Objects of historic interest or other Blasting 10-60 8 sensitive structures
60-90 8-12 Traffic/ 10-30 3 machines
30-60 3-5
Fourth International Conference on Case Histories in Geotechnical Engineering Missouri University of Science and Technology http://ICCHGE1984-2013.mst.edu
~ ... 000
WORKSHOP (ISO)
"·""" .. ~ OffiCE IISOI
16,000
! "' ~ i • RESIDENCE· DAYTIME !ISO!
' ' 8,000 5 ----------- = ' PERCEPTION THRESHOLD {ISO)
> ,; OPERATING THEATRE !ISO) 4.000 §
" ~ ~ "' . ~
> S£NSITIVE EQUIPMENT A .
• 2,000 ~ ~
~ > • • • g .. SENSITIVE EQUIPMENT B 1.000 ~
""' . >
SENSITIVE EQUIPMENT C 500
.. ~ SENSITIVE I:QUIPMENT 0
""
ONE-THIRD OCTAVE BAND CENTER FREQUENCY (Hz)
A: Optical balances, bench microscopes B: Aligners, sleppers, etc. for 5 11m or larger geometries C Aligners, steppers, etc. for 1 IJ.ffi or larger geometries D: E-bearn and other 1 11m or sub-micron equipment;
electron mtcroscopes
Fig_ 9 Vibration Criteria for Sensitive Equipment in
Buildings (from Ungar and Gordon, 1985)
CO'\CLUSIONS
Vibrations from man-made sources including construction activities, blasting, rail and vehicular traffic, and machinery can adversely impact humans, structures, and vibrationsensitive equipmenl. Comparisons between data from different sources is often hindered by the lack of consi!itcnt measurement, analysis, and interpretation standards. The following guidelines are suggested to facilitate these comparisons:
• Care should be taken in selecting and mounting transducers for each application. The effects of the measurement system should be accounted for by employing a frequency response function with both amplitude and phase information to correct for the mstrument response.
• Standard time domain and frequency domain signal processing techniques should be used to analyze the vibration data. These techniques range from simple determination of the peak particle motion and associated frequency to advanced spectral estimation methods and time-frequency analyses for non-stationary signals.
106
• Use definitive and prescriptive standards for assessing the impact of vibrations on human activity. Weighted rms acceleration, maxunum transient vibration value (MTVV), and fourth power vibration dose value (VDV) are all precisely defined measures of the impact on humans. Maximum allowable vibration limits are specified by ISO (1989, 1997).
• Use peak particle velocity measured on the ground outside of structures and simple frequency estimates based on zero crossings in conjunction with the V.S. Bureau of Mines (Siskind et al., 1980) frequencydependent vibration criteria to assess the likelihood of cosmetic damage to structures. Response spectra are desirable from a structural response view, and should also be calculated to help develop appropriate damage criteria.
• Vibration limits for sensitive electrical, optical, and mechanical equipment used in testing and manufacturing are more stringent than vibration limits for humans and buildings. In the absence of specific criteria from an equipment manufacturer, use the vibration limits proposed by Ungar and Gordon ( 19S5) for assessing the impact of vibrations on equipment.
REFERENCES
Benda!, J.S., and Piersol, A.G., (1989). Random Data: Analysis and Measurement Procedures. WiJeyInterscience, New York.
Bolt, B.A. (1969). "Duration of Strong Motion." Proceedings, 41
h World Conference on Earthquake Engineering, Santiago,Chile,pp.l304-1315.
Bradbury, G., and Saller, E. (1997). "~ew Sensor Mounting Technique for Machinery Vibration Monitoring." Sound and Vibration, 31(2). pp. 12-15.
Deutsches lnstitut Fur Normung. (1986). DIN 4150- Part 3-Structural vibration in buildings - Effects on structures, 6 pp.
Dowding, C. H. (1996). Construction Vibrations. Prentice Ilall, New Jersey: 1996, 610 pp.
Dowding, C. H. (1985). Blast Vihration Monitoring and Control, Prentice Hall, Englewood Cliffs, New Jersey.
Famfield, R.A. (1996). "So you think you are monitoring peak particle velocity," Proceedings, Twelfth Annual Symposium on Explosives and Blasting Research, Orlando, Florida, pp. 13-20.
Gade, S., and Gram-Hansen, K. (1997). "The Analysis of Nonstationary Signals." Sound and Vibration, 31(1), January, pp. 40-46.
Fourth International Conference on Case Histories in Geotechnical Engineering Missouri University of Science and Technology http://ICCHGE1984-2013.mst.edu

International Organization for Standardization. ( 1984). ISO 6897 - Guidelines for the evaluation of the response of occupants of fixed structures, especially buildings and off-shore structures, to low-frequency horizontal motion (0.063 to 1 Hz). 8 pp.
International Organization for Standardization. ( 1986). ISO 8002 - Mechamcal vibrations - Land vehicles - Method for reportmg measured data. 10 pp.
International Organization for Standardization. ( 1989). ISO 2631-2- Evaluation of human exposure to whole-body vibration- Continuous and shock-induced vibration m buildings. 18 pp.
International Organization for Standardization. ( 1990). ISO 4866- :\tlcchanical vibration and shock- Vibration of buildmgs - Guidelines for the measurement of vibrations and evaluation of their effects on buildings. 16 pp.
International Organization for Standardization. ( 1992 ). ISO 10137- Bases for design of structures- Serviceability of buildings against vibration. 32 pp.
International Organization for Standardization. (1994). ISO 4H66 - Amendment I - Mechanical vibration and shock -Vibration of buildings- Guidelines for the measurement of vibrations and evaluation of their effects on buildings. 7 pp.
International Orgamzation for Standardization. ( 1996). ISO 4866- Amendment 2- Mechanical vibration and shockVibration of buildings- Guidelines for the measurement of vihratiom; and evaluation of their effects on buildings. 8pp.
International OrgamL:ation for Standardization. ( 1996 ). ISO 8569- Mechanical vibration and shock- Measurement and evaluation of shock and vibration effects on sensitive equipment in buildings. 9 pp.
International Organization for Standardization. ( 1997). ISO 2631-1- Mechanical vibration and shock- Evaluation of human response to whole-body vibration. 31 pp.
Kay, S.M. ( 1988). Modern Spectral Estimation: Theory and Application. Prentice-Hall, New Jersey, 543 pp.
Krohn, CL (1984). "Geophone Ground Coupling." Geophy>ics, 49( 6 ), pp. 722-731.
:\1assarsch, K. R. (1993). "Man-made vibrations and solutions." Proceedings, Third International Conference on Case Ihstories in Geotechnical Engineering, St. Louis, Missouri, June, pp. 1393-1405.
Medearis, K. ( 1976). "The Development of Rational Damage Criteria for Low-Rise Structures Subjected to Blasting Vibrations." Report to the National Crushed Stone Association, Washington, D.C.
107
New, B. M. (1986). "Ground vibration caused by civil engineering works." Transport and Road Research Laboratory, Research Report 53, 19 pp.
Nuttli, O.W. (1979). "The Relation of Sustained Maximum Ground Acceleration and Velocity to Earthquake Intensity and Magnitude." Miscellaneous Paper S-73-1, Report 16, U.S. Army Corps of Engineers Waterways Experiment Station, Vicksburg, MS, 74 pp.
Oppenheim, A.V., and Schafer, R.W. (1989). Discrete-Time Signal Processing. Prentice-Hall, New Jersey.
Santamarina, J.C., and Fratta, D. (1998). Introduction to Signal Processing and Inverse Problems in Civil Engineering, ASCE Press.
Siskind, D. E. (1996). "Frequency analysis and the use of response spectra for blast vibration assessment in mining." Proceedings, Twelfth Annual Symposium on Explosives and Blasting Research, Orlando, Florida, pp. 1-1 L
Siskind, D. E., and Stagg, M. S. {1985). "Blast vibration measurements near and on structure foundations." U.S. Bureau of Mines RI 8969, 20 pp.
Siskind, D. E,; Stagg, M.S.; Kopp, J. W.; and Dowding, C. H. ( 1980). "Structure response and damage produced by ground vibration from surface mine blasting." U.S. Bureau of Mines RI 8507, 74 pp.
Skipp, B. 0. (1984). "Dynamic ground movements- manmade vibrations." in Ground Movements and Their Effects on Structures. Attewell, P.B., and Taylor, R.K., Eds., Chapman and Hall, New York, pp. 381-431.
Ungar, E.E., and Gordon, C. G. (1985). "Cost effective design of practically vibration free high technology facilities." Noise and Vibration Measurement: Prediction and Mitigation, Special Technical Publication, ASCE, New York, pp. 121-130.
Ungar, E.E., and White, R.W. (1979). "Footfall-induced vibrations of Ooors ~mpporting sensitive equipment." Sound and Vibration, 13(10), pp. 10-13.
Wiss, J. F. ( 1981 ). "Construction vibrations: State-of-the-art." Journal of the Geotechnical Engineering Division, 107(2), pp. 167-181.
Fourth International Conference on Case Histories in Geotechnical Engineering Missouri University of Science and Technology http://ICCHGE1984-2013.mst.edu