mbraun glovebox - mcclmccl.chem.ufl.edu/sec/manual/user_manual_mccl_am1.5... · web viewthe code...
TRANSCRIPT
Ver. 1.0Nathan Heston
AM1.5 Solar SimulatorUser Guide
Newport Oriel: (800)714-5393Overview
The power conversion efficiencies (PCE) of most solar cells are heavily dependent the light source. Sunlight varies in intensity and spectral distribution depending on the many factors such as location on the earth and time of day and year. To account for these factors standard irradiance spectra have been adopted by the research community. Measurements under these standard conditions should allow for accurate PCEs comparisons throughout the field. However, accurate simulation of the solar spectrum is difficult and often improper simulation can introduce large errors in reporting solar cell performances. For this reason, great care should be taken when making these measurements.
The acronym AM1.5 stands for air mass 1.5. It represents the typical spectrum that would be expected after sunlight travels through one and a half “typical” Earth atmospheres. A power conversion efficiency measurement under AM1.5 conditions involves measuring the I-V response of the solar cell under illumination from AM1.5 radiation. Analysis of a cell’s I-V curve can be done to determine the cell’s maximum power output and thus the PCE can be calculated.
Sunlight
Sunlight is essentially the radiation spectrum of a 5800K blackbody, with differences due to spectral lines and both reflection and absorption by the atmosphere. Solar radiation varies depending on a number of factors including location and time. To provide a standard set of conditions under which to measure solar cells, researchers have adopted two common irradiance spectra, known as Air Mass 0 and Air Mass 1.5. These spectra reflect the typical conditions under which a solar cell might be used. The first of these two spectra is referred to as AM0, and it represents the radiation seen outside the Earth’s atmosphere. Solar cells that are developed for space applications use this reference. The second, and most common, reference spectrum is AM1.5. AM0 and AM1.5 indicate the amount of “typical” atmosphere through which the radiation passes (AM0 passes through zero atmospheres and AM1.5 represents sun light that travels through approximately one and a half Earth atmospheres). Sometimes a third reference spectrum (AM1) is used which represents the solar radiation that would be received if sunlight were directly overhead, but this reference is becoming less common. Figure 1 illustrates the difference between the three.
Caution: This instrument is generates UV light and if proper precautions are not taken you can damage your eyes. Do not look directly into the beam and use eye protection.
1

Figure 1. AM0, AM1, and AM1.5 are differentiated by the amount of atmosphere that
they pass through.
The AM0 and AM1.5 reference irradiance data are plotted in Figure 2. The curves represent the total power per unit area that is received within an incremental wavelength range. If the total amount of energy is summed over the frequency range the intensity of light outside the Earth’s atmosphere is about 1350 W/m2. A similar sum for AM1.5 radiation received at Earth’s surface results in about 890 W/m2. This is the typical amount of radiation received on a clear sunny day in the United States, and it includes contributions from both direct sunlight and scattered light. On a clear sunny day in Florida the total power of the sun is often ~1000 W/m2 (100mW/cm2). This has become the standard intensity at which the efficiencies of solar cells are reported and is often referred to as 1 Sun conditions.
Figure 2. AM0 and AM1.5 are irradiance spectra. AM0 is the spectrum of solar light
that would be seen just outside the Earth’s atmosphere. AM1.5 is the spectrum seen after sunlight passes at a slant through 1.5 atmospheres.
The energy spectrum shown in Figure 2 shows the peak energy density occurs at ~500 nm. However, in all but the most advanced designs, each photon that is absorbed by a solar cell can only generate one electron which provides the same energy (Ee=
2

eVoperating) regardless of the frequency of the photon. This means that when considering the absorption spectrum of a material for use in solar cells the important quantity to consider is the number of photons (per unit area, per unit time, per wavelength increment) and not the energy. For this reason, it is more common to plot the photon flux density which tells the number of photons per unit area, per unit time, that are received within an incremental wavelength range. The AM1.5 solar flux density is plotted in Figure 3. Integration of the AM1.5 photon flux shows that 50% of the photons occur below 900 nm and 75% occur below 1350 nm.
Figure 3. Normalized AM1.5 photon flux spectrum illustrating the variation in solar photon flux with wavelength, where the black trace indicates the photon flux, and the red trace represents the totals percentage of solar photons below the given wavelength as obtained by integrating the photon flux.
Solar Simulation
Simulating the solar spectrum is difficult because generating a 5800K blackbody source is not possible with solid state materials. To simulate the solar spectrum most solar simulators utilize a Xe arc lamp and modify the output with filters. In a Xe arc lamp the light is generated as high energy electrons pass through Xe gas forming a small cloud of plasma. The light emitted from this plasma has a very similar irradiance spectrum to sunlight, but because the plasma is still in gaseous form even high pressure Xe lamps have strong emission lines, especially in the region from 850-900 nm.
The AM1.5 solar simulators of the MCCL laboratories are Newport Oriel 66907 power supplies with Newport Oriel 66902 simulator lamp housings (see Figure 4). The lamp housings use150 Xe arc lamps with collimating lenses. The collimating lens of the lamp housing modifies the output of the lamp to produce a beam of nearly uniform energy distribution, however perfect collimation is not possible and care should still be
3

taken to properly align solar cells so that they are positioned in the same location as the power meter. Similar to measuring with the MCCL IPCE it is a good idea to design a mask of the same size and shape of the active area “pixel” for the most accurate measurement of the lamp power. The spectral mismatch of the lamp Xe arc lamp is corrected by use of filters.
Figure 4. MCCL AM1.5 solar simulator setup. 1. Newport 66907 Power Supply. 2. Newport 66902 lamp housing. 3. Collimating Lens and Filter Holder. 4. Thermopile Power meter Head Unit. 5. Thermopile Control Unit
The MCCL laboratories have two different sets of filters that can be used. The first set of filters is a three-filter stack(AM0/AM-D/AM1.5). This stack is designed to reduce the Xe output to an AM1.5 distribution. The second filter is a 2” x 2” square filter that is known as a AM1.5G filter. This filter is designed to reduce the 150W Xe spectrum to a replicate the AM1.5 spectrum up to ~900nm. It should be noted that no set of filters can perfectly remove the spectral lines of the lamp. When reporting high efficiency cells spectral mismatch factors should be used (which can be obtained from Newport) or cells should be sent to NREL for certified measurements. The three filter stack is designed to replicate the solar spectrum over the full range. The transmittance spectrum for the filter sets is plotted in Figure 5.
4

Figure 5. Transmittance spectra of the MCCL solar simulator filters. Black trace is for the AM1.5G square filter and red trace is the three filter stack. Both produce similar modification to the Xe spectrum up to ~900nm. Beyond 900 nm the AM1.5G does not mimic the solar spectrum. As can be seen from the differences between the two filters, both from Oriel, the resulting spectra will not be identical, even below 900 nm.
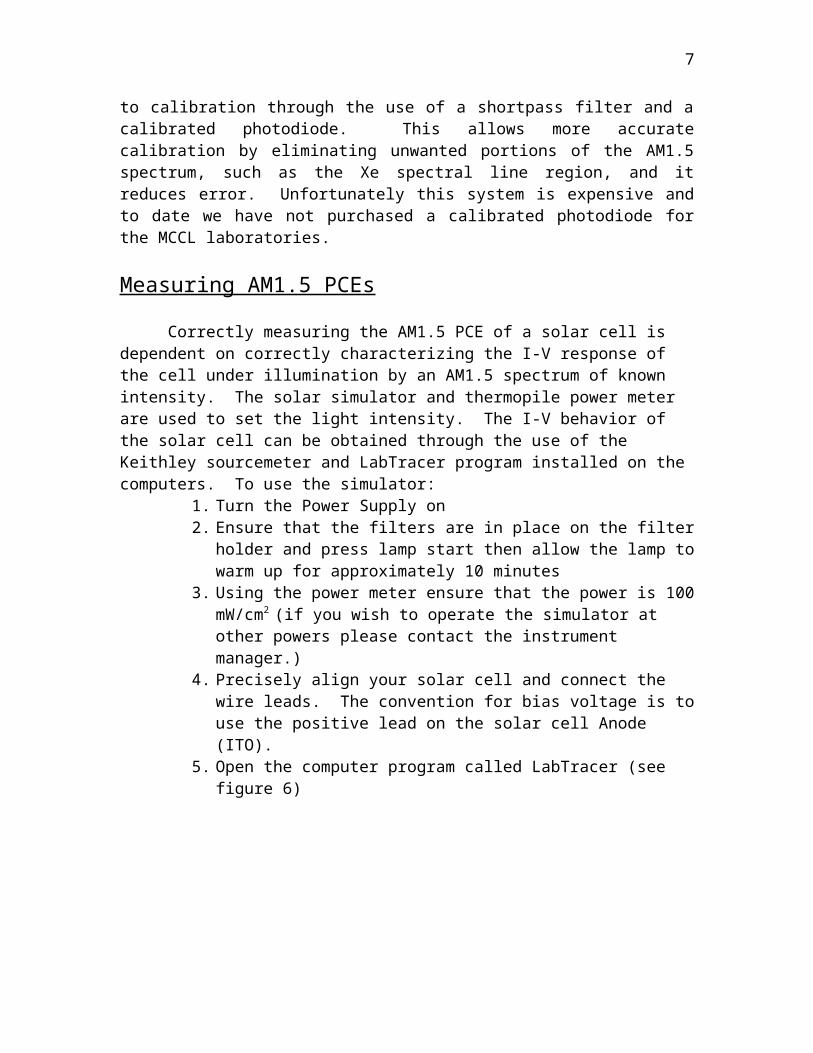
The largest source of errors when reporting solar cell efficiencies likely comes from under, or overestimating the incident intensity of the AM1.5 spectrum. As mentioned earlier the standard PCE measurement condition is a 100 mW/cm2 AM1.5 spectrum. When using the three filter stack of the MCCL laboratories the total spectral power can be measured with a broadband power meter such as either of the two Newport 70260 thermopile detectors. These detectors have a nearly flat response from 200 to 3000nm. Due to the imperfect simulated AM1.5 spectrum produced by the filters and the imperfect technique of measuring using a thermopile detector, the industry standard has changed in recent years to calibration through the use of a shortpass filter and a calibrated photodiode. This allows more accurate calibration by eliminating unwanted portions of the AM1.5 spectrum, such as the Xe spectral line region, and it reduces error. Unfortunately this system is expensive and to date we have not purchased a calibrated photodiode for the MCCL laboratories.
Measuring AM1.5 PCEs
Correctly measuring the AM1.5 PCE of a solar cell is dependent on correctly characterizing the I-V response of the cell under illumination by an AM1.5 spectrum of known intensity. The solar simulator and thermopile power meter are used to set the light intensity. The I-V behavior of the solar cell can be obtained through the use of the Keithley sourcemeter and LabTracer program installed on the computers. To use the simulator:
1. Turn the Power Supply on2. Ensure that the filters are in place on the filter holder and press lamp start
then allow the lamp to warm up for approximately 10 minutes
5

3. Using the power meter ensure that the power is 100 mW/cm2 (if you wish
to operate the simulator at other powers please contact the instrument manager.)
4. Precisely align your solar cell and connect the wire leads. The convention for bias voltage is to use the positive lead on the solar cell Anode (ITO).
5. Open the computer program called LabTracer (see figure 6)
Figure 6. LabTrace Program Home Screen
6. Click on Setup and select the source tab and adjust the voltage sweep to run from -1 to +1, and select 100 points (other numbers and ranges can be used, but you will need to adjust the Excel template linked below.)
7. Once you have the program set up simply click run test. 8. Save the data in a text file. (You can display a graph in LabTracer by
clicking on the graph tab and then define the x-y coordinates of the graph.)9. Open the data using Microsoft Excel and press Ctrl+A to select the entire
range. Then click Ctrl+C to copy all the data.10. Use the paste special feature of Excel to paste the data into the template
available here:Blank Template: http://www.mccl.chem.ufl.edu/Secure/AM1.5-Template.xls
11. The code written in the Template should automatically calculate all the relevant values such as: Open Circuit Voltage, Short Circuit Current, Short Circuit Current Density, Fill Factor, and PCE. Make sure that the value on the template for active area is correct for your cells (the default is 0.25cm2).
12. Before you are familiar with the template you should calculate each of the values directly from the data to ensure that you are using the template properly. The relations needed are given in the next section.
13. Another template that I made and you might find useful summarizes the data from different cells by pulling the data directly off the xls templates. This template is available here and instructions are in the template file:Summary Template: http://www.mccl.chem.ufl.edu/Secure/AM1.5-Summary.zip
6
Solar Cell Calculations
Calculations for the characteristics of a solar cell are straight forward. An example of a I-V trace is shown in Figure 7A and a summary of the relations are listed in Figure 7b.
A B
Figure 7. Solar Cell Characterisitics. A. Illuminated I-V trace of a solar cell showing the short circuit current, the open circuit voltage and the maximum power point on the curve. B. List of the relations used in describing solar cell I-V traces.
Solar Simulator Maintenance
The solar simulator should require very little maintenance. The most likely tasks that will need to be performed are changing the Xe bulb, and calibrating the power meter. Instructions for changing the Xe bulb can be found in the manual sent from Newport. It is very important not to touch the bulbs with bare hands because the oil can severely limit their lifetime. It is also important that the Xe bulbs are operated at 150W-170W range. Below this range the bulb may not light and the spectrum will be deficient. Above this range produces a risk of the bulbs exploding. Calibration of the power meter needs to be done by sending the unit in to Newport. They recommend this is done every 12 months. It is a costly procedure (~$500).
7