maximizing hardness and toughness in 8620 steel - … · · 2015-12-01maximizing hardness and...
TRANSCRIPT

Maximizing Hardness and Toughness in 8620 Steel
Emily Anderson, Rachel Freer, Josh Kubiak, Allison Perna, Katie Sullivan
1

2Totten, G., Funatani, K., Xie, L. Handbook of Metallurgical Process Design. Technology & Engineering, 2004, 460.
Introduction

Introduction● Tempering forms ferrite
and carbide, increases toughness
● Higher temperatures increase toughness, decrease hardness
● Rapid quenching increases surface hardness
3
http://cml.postech.ac.kr/2008/Steel_Microstructure/Picture1.pngmartensite
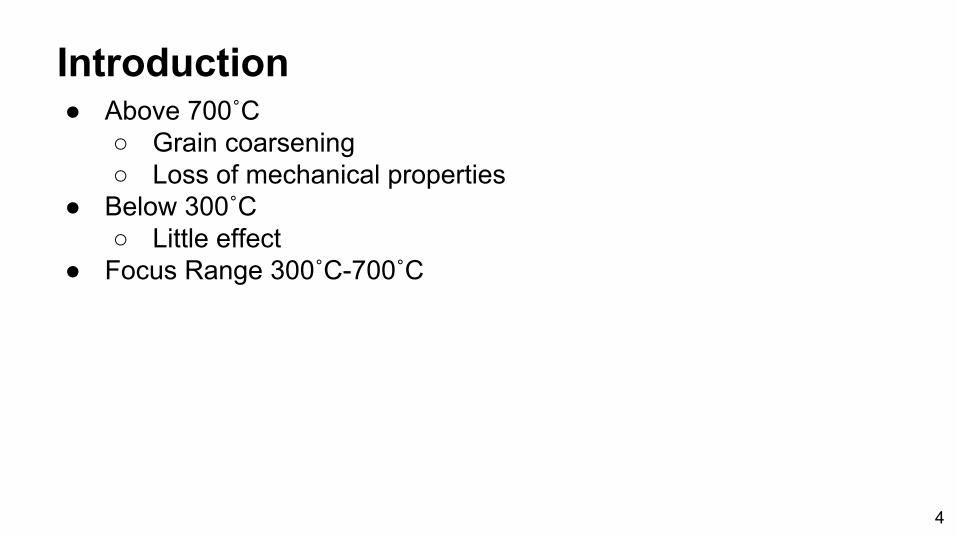
Introduction● Above 700˚C
○ Grain coarsening○ Loss of mechanical properties
● Below 300˚C○ Little effect
● Focus Range 300˚C-700˚C
4
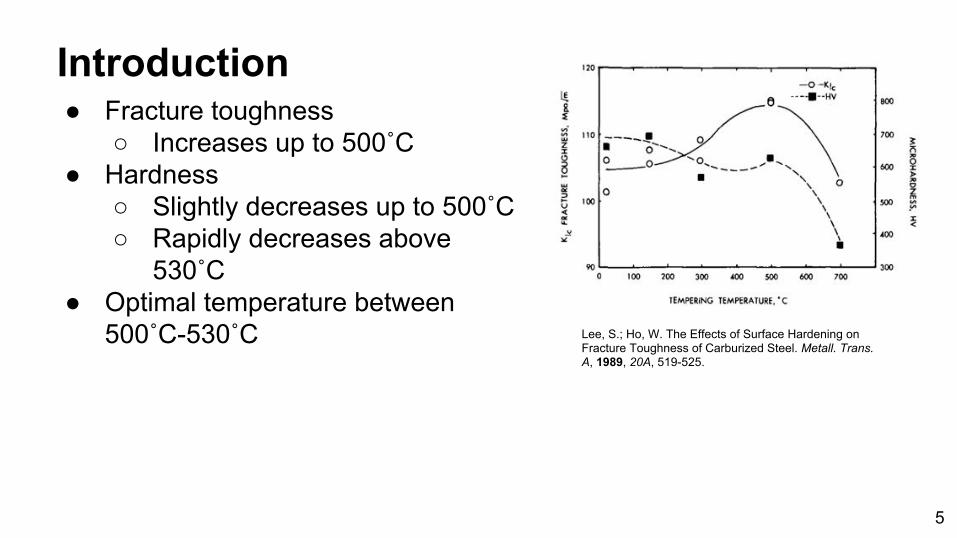
Introduction● Fracture toughness
○ Increases up to 500˚C● Hardness
○ Slightly decreases up to 500˚C○ Rapidly decreases above
530˚C● Optimal temperature between
500˚C-530˚C
5
Lee, S.; Ho, W. The Effects of Surface Hardening on Fracture Toughness of Carburized Steel. Metall. Trans. A, 1989, 20A, 519-525.

Experimental Procedure: Overview
6

Experimental Procedure● Austenitized all Charpy and tensile bars at 926˚C for 1 hour● Heat treatment of 3 Charpy bars for 1 hour at each temperature:
400˚C, 450˚C, 500˚C, 550˚C, 600˚C● Slow cool in furnace and water quench from 926˚C for 3 Charpy
bars each● Analyze microhardness after polishing (120 grit for about 5mm to
0.3 alumina slurry) and etching (5% nital for 30 seconds) to determine optimized temperatures
● Temper tensile bars and additional 3 Charpy bars at 550˚C and 575˚C
● Optical microscopy on cross section and SEM of fractured Charpy bars using ASPEX Explorer with secondary electron (SE) detector
7
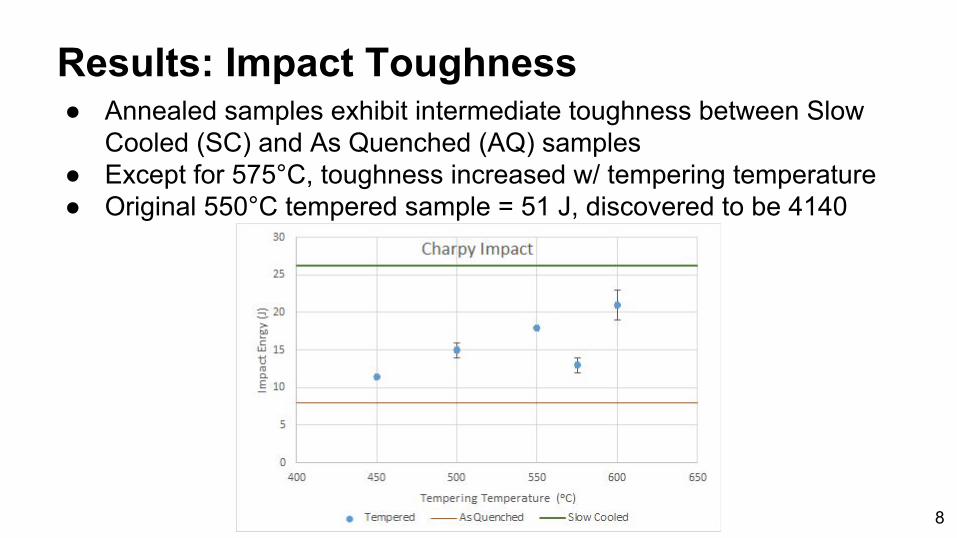
● Annealed samples exhibit intermediate toughness between Slow Cooled (SC) and As Quenched (AQ) samples
● Except for 575°C, toughness increased w/ tempering temperature● Original 550°C tempered sample = 51 J, discovered to be 4140
Results: Impact Toughness
8

● 250x, deformed surfaces in SC and tempered samples.
450°C 550°C (4140)
600°C575°C
500°C
550°C
9
AQ
SC
Results: Fracture

10
Results: Fracture
4140SC 8620

● Tempered samples have hardness between SC and AQ samples● Hardness decreased with increasing tempered temperature● Little variation with specimen depth due to slow quenching
Results: Microhardness (Strength)
AQ
SC
4140
11

● Toughness from Charpy test ● Microhardness is average of 1mm, 3mm, and 5mm from surface● Increases with temperature except for 575°C● Original 550°C sample=186,000(106 N2/m), discovered to be 4140
Results: Preliminary Material Index
12
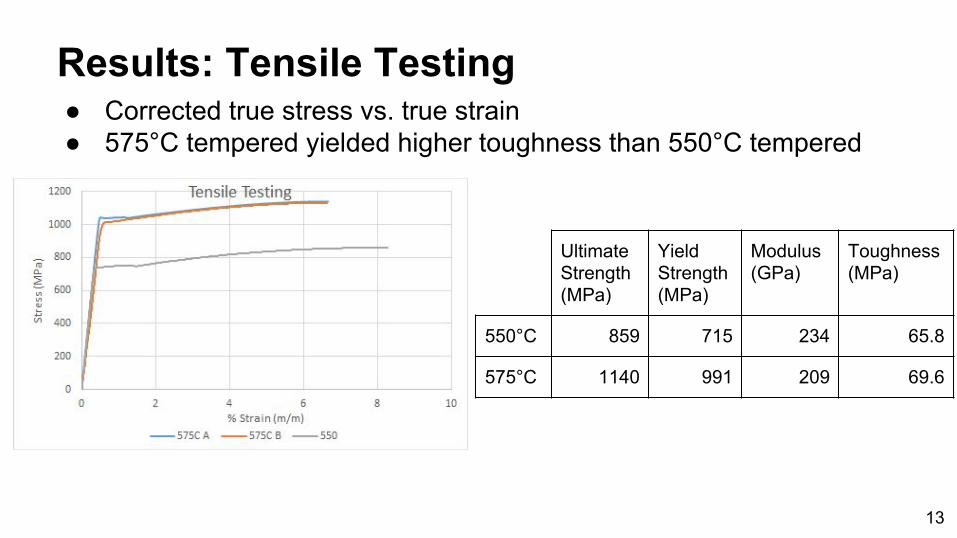
● Corrected true stress vs. true strain● 575°C tempered yielded higher toughness than 550°C tempered
Results: Tensile Testing
Ultimate Strength (MPa)
Yield Strength (MPa)
Modulus (GPa)
Toughness (MPa)
550°C 859 715 234 65.8
575°C 1140 991 209 69.6
13

Results: Final Material Index
Tempering Temp. (°C)
Tensile Toughness (MPa)
Charpy Toughness (J)
Hardness (MPa)
Material Index -Tensile((MPa)2)
Material Index -Charpy(N2/m *106)
550 65.8 18.0 2929 193,000 52,700
575 69.6 13 3288 229,000 43,000
600 -- 21 2848 -- 60,000
SC -- 26.3 2279 -- 59,900
14

Discussion: Types of Microstructures
Martensite● Formed by quenching austenite● Hard, brittle, low toughness ● Carbon is trapped
Cementite (Iron Carbide)● Precipitated carbon● Hard and brittle
15
Bramfitt, B. L. Structure/Property Relationships in Irons and Steels. Materials Selection and Design. 1997, 20, 357-382.

Ferrite● Low carbon● High toughness
Pearlite● Cementite and ferrite in lamellar structure● High strength and hardness ● Poor ductility and toughness
16
Discussion: Types of Microstructures
University of California, Santa Barbara. Carbon Applications. http://research.mrl.ucsb.edu/~barton/materials.html (accessed Dec 1, 2014).

Slow CooledAs Quenched
Extensive regions of ferrite (white) with regions of pearlite (black).
Largely martensitic (black) with regions of ferrite and/or carbide (white). 17
Discussion: Experimental Microstructures
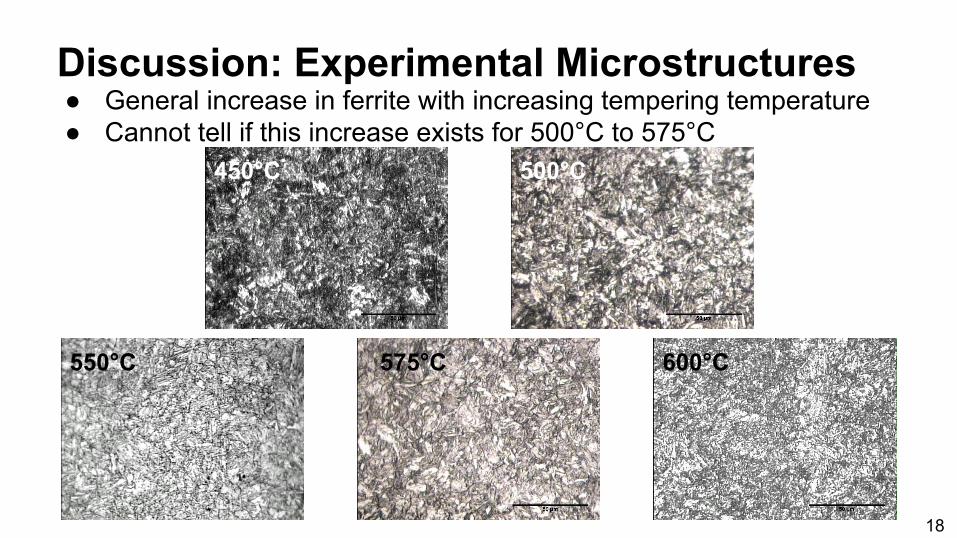
● General increase in ferrite with increasing tempering temperature● Cannot tell if this increase exists for 500°C to 575°C
450°C
600°C575°C
500°C
550°C
18
Discussion: Experimental Microstructures

● Microstructure approximately follows expected trend for tempered martensite
19
Discussion: Tempered Martensite
Gowelding. The Metallurgy of Carbon Steel. http://www.gowelding.com/met/carbon.htm (accessed Nov 28, 2014).
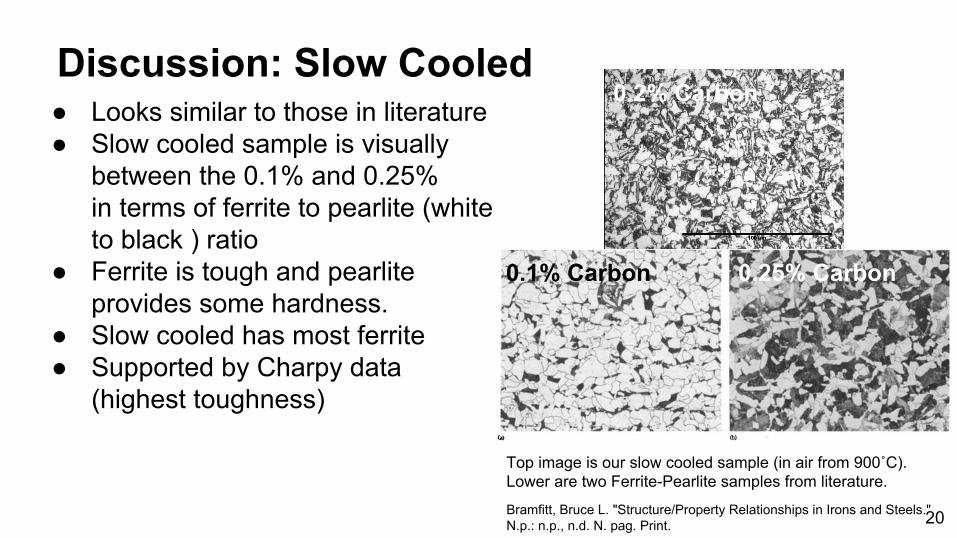
Discussion: Slow Cooled● Looks similar to those in literature ● Slow cooled sample is visually
between the 0.1% and 0.25%in terms of ferrite to pearlite (white to black ) ratio
● Ferrite is tough and pearlite provides some hardness.
● Slow cooled has most ferrite● Supported by Charpy data
(highest toughness)
20
0.2% Carbon
0.1% Carbon 0.25% Carbon
Top image is our slow cooled sample (in air from 900˚C).Lower are two Ferrite-Pearlite samples from literature.
Bramfitt, Bruce L. "Structure/Property Relationships in Irons and Steels." N.p.: n.p., n.d. N. pag. Print.

● Expect highest toughness for smallest grains and most ferrite.
● Grain size increases 600 → 550 → 575 ~ 500● Cannot conclude which has most ferrite.● Conclusion: 550˚C sample’s microstructure
indicates higher toughness than 575˚C’s and 500˚C’s, and data matches.
● Uneven furnace temperature may have caused the 575˚C discrepancy
575°C500°C
21
550°C 600°C
Discussion: Toughness

22
● Hardness in a higher carbon steel decreased then increased after tempering temperature of 500˚C.
● This is caused by combined effects of Molybdenum and Chromium on hardness.
● Microhardness data has similar trend shifted by ~75˚C.
● Conclusion: This is a potential reason for our sudden increase in hardness for the 575˚C sample
Discussion: Hardness Trend
Lee, S.; Ho, W. The Effects of Surface Hardening on Fracture Toughness of Carburized Steel. Metall. Trans. A, 1989, 20A, 519-525.

● As-quenched shows martensite phase● Increasing amounts of ferrite as tempering temperature increased● Higher material index under low strain rate for 575˚C than 550˚C● Highest material index for 600˚C and slow cooled based on Charpy● Toughness generally increases with tempering temperature● Hardness generally decreases with tempering temperature
23
Conclusions

● Use a higher range of temperatures● Use a statistically relevant number of samples● Be more careful and constantly check samples● Ensure doors of furnace remain closed during heating● Have more consistent quenching process
24
Future Recommendations

We would like to acknowledge Professor Marc DeGraef, Bill Pingitore, and the lab TAs for their support and help throughout the laboratory experiments.
25
Acknowledgements

26

References● The Tempering of Martensite: Part One. Key to Metals. http://steel.keytometals.
com/Articles/Art127.htm (accessed Dec 2, 2014).● Three Planes. Martensite. http://www.threeplanes.net/martensite.html (accessed
Nov 30, 2014).● University of Portland. Steel Microstructure. http://faculty.up.
edu/lulay/egr221/steelmicrostruct.pdf (accessed Nov 30, 2014).● DeGraef, M.; Rollet, A. Experiment No. 2A: Optimizing Microstructure-Sensitive
Mechanical Properties in Steel. Carnegie Mellon University, Pittsburgh, PA, 2014.● Lee, S.; Ho, W. The Effects of Surface Hardening on Fracture Toughness of
Carburized Steel. Metall. Trans. A, 1989, 20A, 519-525.● Penha, R.; Canale, L.; Vatavuk, J.; Lampman, S. Tempering of Steels, Steel Heat
Treating Fundamentals and Processes. ASM Handbook, 2013, 4A, 327–351.● Hong, S.; Lin, H.; Yang, C.; Tseng, L.; Lin, K. Effect of Heat Treatment and
Composition Modification on SAE 8620 Steels. Mater. Sci. Form. 2007, 539, 4452-4457.
27

Supplemental Slides
28
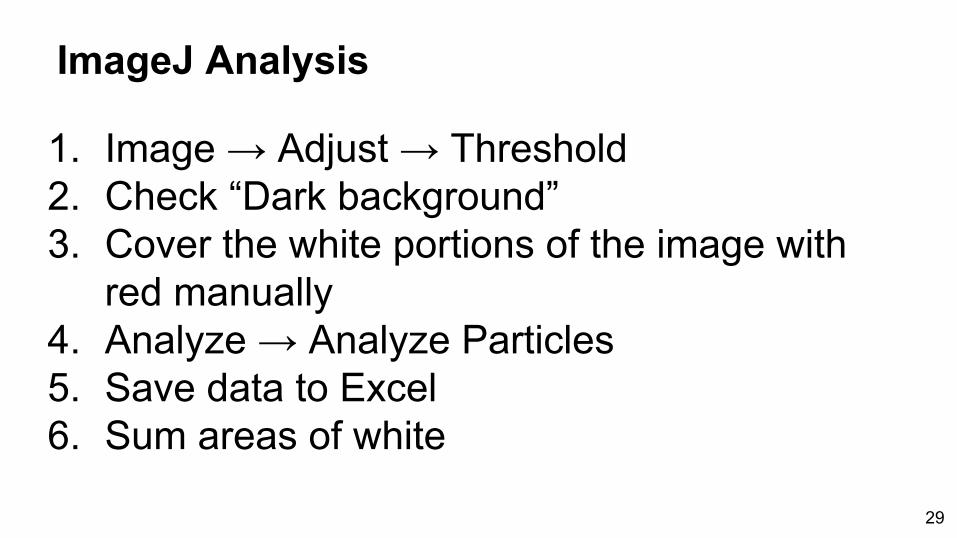
ImageJ Analysis
1. Image → Adjust → Threshold2. Check “Dark background” 3. Cover the white portions of the image with
red manually4. Analyze → Analyze Particles5. Save data to Excel6. Sum areas of white
29

Charpy Data
Treatment SampleCharpy Toughness
(J)Average
(J)Stand. Dev.
(J)550°C Tempered Repeat
1 17.9 18.0 0.12 183 18.1
575°C Tempered
1 13.8 13 12 12.13 14
600°C Tempered
1 20.0 21 22 20.03 24.0
Slow Cooled 1 26 26.3 0.62 273 26
Treatment SampleCharpy Toughness
(J)Average
(J)Stand. Dev.
(J)As Quenched
1 6.4 8 32 11.23 6.8
450°C Tempered
1 11.5 11.5 --2 11.43 --
500°C Tempered
1 14.0 15 12 16.73 14.4
550°C Tempered(4140)
1 55.0 51 52 46.13 52.4
30

Microhardness Data
Treatment
Microhardness (MPa)1mm from
surface3mm from
surface5mm from
surface AverageAs Quenched 5010 5291 5597 5300450°C Tempered 3738 3806 3711 3752500°C Tempered 2989 3169 3344 3167550°C Tempered (4140) 3608 3792 3557 3652550°C Tempered Repeat 2914 2859 3008 2927575°C Tempered 3332 3321 3212 3288600°C Tempered 2798 2877 2869 2848Slow Cooled 2239 2342 2258 2279
31

*550 Sample B, was originally tested is "fast" mode on the frame resulting in failure of the test. The sample was then re-evaluated at the proper strain rate, but the sample may have been plastically deformed during the first test.
Instron Data
Sample
Ultimate Strength
(MPa)
Yield Strength
(MPa)
Modulus
(GPa)
Toughness
(MPa)
550°C Tempered A 859.1 714.9 234.3 65.77
550°C Tempered B* 712.0 531.4 204.2 53.25
550°C Average* 785.6 623.1 219.2 59.51
575°C Tempered A 1139 1025 229.3 70.33
575°C Tempered B 1132 956.1 188.9 68.83
575°C Average 1135 990.6 209.1 69.58
32

Bainite
33Bramfitt, B. L. Structure/Property Relationships in Irons and Steels. Materials Selection and Design. 1997, 20, 357-382.

34