maximising the hydrogen evolution activity in organic ... · 1 maximising the hydrogen evolution...
TRANSCRIPT
1
Maximising the Hydrogen Evolution Activity in Organic Photocatalysts by Co-Polymerisation Reiner Sebastian Sprick,a Catherine M. Aitchison,a Enrico Berardo,b Lukas Turcani,b Liam Wilbraham,c Ben M. Alston,a,d Kim E. Jelfs,b Martijn A. Zwijnenburg,c,* and Andrew I. Cooper a,*
a. Department of Chemistry and Materials Innovation Factory, University of Liverpool, Crown Street, Liverpool, L69 7ZD, U.K. E-mail: [email protected] b. Department of Chemistry, Imperial College London, South Kensington, London, SW7 2AZ, U.K. c. Department of Chemistry, University College London, 20 Gordon Street, London, WC1H 0AJ, U.K. E-mail: [email protected] d. The Leverhulme Research Centre for Functional Materials Design, University of Liverpool, Crown Street, Liverpool, L69 7ZD, U.K.
Electronic Supplementary Material (ESI) for Journal of Materials Chemistry A.This journal is © The Royal Society of Chemistry 2018
2
1. Instrumentation / General methods
All reagents were obtained from Sigma-Aldrich, ABCR, or Fluorochem and used as received.
Water for the hydrogen evolution experiments was purified using an ELGA LabWater system
with a Purelab Option S filtration and ion exchange column (ρ = 15 MΩ cm) without pH level
adjustment. Reactions were carried out under nitrogen atmosphere using standard Schlenk
techniques. 1H and 13C NMR spectra were recorded on Bruker Avance 400 MHz NMR in
CHCl3 at 25 ºC. 13C{1H} NMR Spectra were recorded at 100 MHz in CHCl3 at 25 ºC. All
spectra are reported in ppm and are referenced to the residual solvent peak. Mass
spectroscopy was performed using an Agilent QTOF 7200 Spectrometer. CHN Analysis was
performed on a Thermo EA1112 Flash CHNS-O Analyzer using standard microanalytical
procedures. High resolution mass spectrometry (HR-MS) was performed on an Agilent
Technologies 6530B accurate-mass QTOF mixed ESI/APCI mass spectrometer (capillary
voltage 4000 V, fragmentor 225 V) in positive-ion detection mode. Melting points were
measured on a Stuart SMP10 Melting Point Apparatus and are uncorrected. Transmission FT-
IR spectra were recorded on a Bruker Tensor 27 at room temperature; samples were prepared
as pressed KBr pellets. Thermogravimetric analysis was performed on an EXSTAR6000 by
heating samples at 10 °C min-1 under air in open aluminium pans from room temperature to
600 °C and holding at 600 °C for 30 minutes. The UV-visible absorption spectra of the
polymer networks were recorded on a Shimadzu UV-2550 UV-Vis spectrometer as powders
in the solid state. The band-gap of the polymers was calculated via E (eV) = 1243.125/λg (nm).
Imaging of the polymer morphology was achieved on a Hitachi S4800 Cold Field Emission
SEM, with secondary electron, backscatter and transmission detectors. EDX measurements
were performed on an Oxford Instruments INCA ENERGY 250 M/X. PXRD measurements
were performed on a PANalytical X’Pert PRO MPD, with a Cu X-ray source, used in high
throughput transmission mode with Kα focusing mirror and PIXCEL 1D detector. TCSPC
experiments were performed on an Edinburgh Instruments LS980-D2S2-STM spectrometer
equipped with picosecond pulsed LED excitation sources and a R928 detector, with a stop
count rate below 5%. An EPL-375 diode (λ = 370.5 nm, instrument response 100 ps fwhm)
with a 450 nm high pass filter for emission detection was used. Suspensions were prepared by
ultrasonicating the polymer in water. The instrument response was measured with colloidal
silica (LUDOX® HS-40, Sigma-Aldrich) at the excitation wavelength without filter and
decay times were fitted in Fluoracle software. Nitrogen sorption isotherms were measured
using Micromeritics 2420 volumetric adsorption analyzer. Surface areas were calculated in
3
the relative pressure (P/P0) range from 0.01 to 0.10 of the adsorption branch. Matrix-assisted
laser desorption/ionisation time-of-flight mass spectrometry (MALDI-TOF MS) was
performed on a Bruker Autoflex Speed MALDI ToF Mass Spectrometer (λ = 355 nm laser) in
linear (positive) mode, referencing against CsI cluster ions. Samples (2 mg) were suspended
in tetrahydrofuran (2 mL, 2,6-di-tert-butyl-4-methylphenol free) by ultrasonication and 10 µL
of the suspension was mixed with 10 µL of a solution of silver trifluoromethanesulfonate (2
mg mL-1), and 10 µL of a solution of 1,8-dihydroxy-9,10-dihydroanthracene-9-one (10 mg
mL-1) in tetrahydrofuran. The suspension was homogenised by ultrasonication for 30 seconds
followed by shaking on a lab shaker for 30 seconds. The mixture (0.5 µL) was then spotted
onto a target plate and a further 0.5 µL of the polymer suspension was spotted on the dried
spot again. The MALDI plate was allowed to dry for 2 min at room temperature before the
measurement. Static light scattering measurements were performed on a Malvern Mastersizer
3000 Particle Sizer, polymers were dispersed in water/methanol/triethylamine (1:1:1) mixture
by 10 minutes of ultrasonication and the resultant suspensions were injected into a stirred
Hydro SV quartz cell, containing more of the water/methanol/triethylamine (1:1:1) mixture, to
give a laser obscuration of 6 – 13%. Particle sizes were fitted according to Mie theory, using
the Malvern ‘General Purpose’ analysis model, for non-spherical particles with fine powder
mode turned on. A polymer refractive index of 1.59, polymer absorbance of 0.1 and solvent
refractive index of 1.37 were used for fitting. Sauter mean diameters (D[3,2]) were calculated
using the following equation:[1,2]
The 13C NMR MAS spectra were recorded on a Bruker AVIII 400 WB spectrometer at
100 MHz with MAS double resonance technique and a spinning frequency of 10 kHz. The
13C{1H} cross polarisation magic angle spinning (CP MAS) spectra were measured with a
contact time of 2 seconds and referenced to adamantine.

4
2. Synthesis
Synthesis of 2,2'-[1,1':4',1''-terphenyl]-4,4''-diylbis[4,4,5,5-tetramethyl-1,3,2-
dioxaborolane]: Potassium acetate (1.14 g, 11.6 mmol) was flame dried under reduced
pressure in a flask before adding 4,4''-dibromoterphenyl, bis(pinacolato)diboron (2.94 g,
11.6 mmol) and [1,1'-bis(diphenylphosphino)ferrocene]palladium(II) dichloride (120 mg,
4.2 mol %), and 1,4-dioxane (50 mL, anhydrous). The reaction mixture was degassed for
30 min before heating under reflux overnight. After cooling to room temperature water
(100 mL) was added and the crude product was extracted with dichloromethane (3 × 75 mL).
The combined organic phases were dried over MgSO4, filtered, and the solvents were
removed under reduced pressure. The crude product was purified via column chromatography
(SiO2, n-hexane : ethyl acetate 95%:5% to 70%:30%) followed by recrystallisation from
acetone. The product was obtained as white fibres (0.756 g, 41%). Anal. Calcd for
C30H36B2O4: C, 74.72; H, 7.52%; Found C, 74.60; H, 7.55%. 1H NMR (400 MHz, CDCl3) δ
7.90 (d, J = 8.0 Hz, 4H), 7.71 (s, 4H), 7.66 (d, J = 8.0 Hz, 4H), 1.37 (s, 24H). 13C{1H} NMR
(100 MHz, CDCl3) δ 143.3, 140.2, 135.3, 127.6, 126.4, 83.9, 24.9 (Note: The quaternary
carbon next to the boron is not observed because of low intensity due to quadruple resonance
between 11B and 13C nucleus). HR-MS Calcd for [C30H36B2O4+H]+: m/z = 483.2878; found:
m/z = 483.2882. m. p.: 284 °C.
Synthesis of 1,4-di(thiophen-2-yls)benzene: (Caution: Stannyl compounds are toxic
and care should be taken when handling them and their waste products).
2-(Tri-n-butylstannyl)thiophene (6.99 mL, 22.0 mmol), 1,4-dibromobenzene (2.36 g,
10.0 mmol) and bis(triphenylphosphine)palladium(II) dichloride (0.140 g, 2 mol%) were
dissolved in N,N-dimethylformamide (50 mL, anhydrous). The reaction mixture was degassed
for 30 minutes before hearting the reaction to 80 °C. After 2 days the reaction was cooled to
room temperature and filtered. The solids were dissolved in dichloromethane and filtered
through a 1 cm silica plug. The plug was thoroughly washed with dichloromethane and the
combined organic phases evaporated to dryness. The produced was washed with a small
amount of n-hexane and dried at 60 °C under reduced pressure. The product was obtained as a
light green-yellow solid (1.21 g, 50%). Anal. Calcd for C14H10S2: C, 69.38; H, 4.16%; Found
C, 69.32; H, 4.08%.1H NMR (400 MHz, CDCl3) δ 7.63 (s, 4H), 7.34 (dd, J = 3.5, 1.0 Hz, 2H),
5
7.29 (dd, J = 5.0, 1.0 Hz, 2H), 7.10 (m, 2H). 13C{1H} NMR (100 MHz, CDCl3) δ 144.1, 133.6,
128.3, 126.4, 125.1, 123.3. HR-MS Calcd for [C14H10S2+H]+: m/z = 243.0297; found:
m/z = 243.0302. m. p.: 208-209 °C (Lit.: 210 °C[3]).
Synthesis of P13St via Stille polycondensation: (Caution: Stannyl compounds are
toxic and care should be taken when handling them and their waste products).
1,4-Dibromobenzene (0.472 g, 2.0 mmol), N,N-dimethylformamide (20 mL) and toluene
(20 mL) were loaded into a nitrogen purged flask. The solution was degassed by nitrogen
bubbling for 30 minutes before addition of 2,5-bis(tributylstannyl)thiophene (1.32 g,
2.0 mmol, 1.12 mL) and tetrakis(triphenylphosphine) palladium(0) (116 mg, 0.1 mmol). The
mixture was degassed for a further 10 minutes before heating to 140 °C for 2 days. The
mixture was cooled to room temperature before precipitating into methanol (200 mL). The
solid was collecting by filtration and washed with water (50 mL) and methanol (50 mL)
before Soxhlet extraction with methanol and chloroform respectively. The polymer was
obtained as a yellow powder (314 mg, 99%). Anal. Calcd for (C10H6S)n: C, 75.91; H, 3.82; S,
20.27%; Found C, 67.16; H, 3.95; S, 14.95%.
Synthesis of P13St random via Stille polycondensation: (Caution: Stannyl
compounds are toxic and care should be taken when handling them and their
waste products). 1,4-Dibromobenzene (0.236 g, 1.0 mmol), 2,5-dibromothiophene (0.242 g,
1.0 mmol, 0.113 mL), N,N-dimethylformamide (20 mL) and toluene (20 mL) were loaded
into a nitrogen purged flask. The solution was degassed by nitrogen bubbling for 30 minutes
before addition of 1,4-bis(tributylstannyl)benzene (0.656 g, 1.0 mmol, 0.572 mL), 2,5-
bis(tributylstannyl)thiophene (0.662 g, 1.0 mmol, 0.551 mL) and tetrakis(triphenylphosphine)
palladium(0) (116 mg, 0.1 mmol). The mixture was degassed for a further 10 minutes before
heating to 140 °C for 2 days. The mixture was allowed to cool before precipitating into
methanol (200 mL). The solid was collecting by filtration and washed with water (50 mL) and
methanol (50 mL) before Soxhlet exraction with methanol and chloroform respectively. The
polymer was obtained as a red powder (299 mg, 95%). Anal. Calcd for (C10H6S)n: C, 75.91; H,
3.82; S, 20.27%; Found C, 59.49; H, 3.54; S, 19.39%.
Synthesis of P14St via Stille polycondensation: (Caution: Stannyl compounds are
toxic and care should be taken when handling them and their waste products).
6
4,4’-Dibromobiphenyl (312 mg, 1.0 mmol), N,N-dimethylformamide (20 mL) and toluene
(20 mL) were loaded into a nitrogen purged flask. The solution was degassed by nitrogen
bubbling for 30 minutes before addition of 5,5’-bis(tributylstannyl)-2,2’-bithiophene (0.744 g,
1.0 mmol) and tetrakis(triphenylphosphine) palladium(0) (116 mg, 0.1 mmol). The mixture
was degassed for a further 10 minutes before heating to 140 °C for 2 days. The mixture was
allowed to cool before precipitating into methanol (200 mL). The solid was collecting by
filtration and washed with water (50 mL) and methanol (50 mL) before Soxhlet extraction
with methanol and chloroform respectively. The polymer was obtained as an orange powder
(213 mg, 67%). Anal. Calcd for (C10H6S)n: C, 75.91; H, 3.82; S, 20.27%; Found C, 67.31; H,
4.46; S, 15.38%.
Synthesis of P15Ox via oxidative coupling: 1,4-Di(thiophen-2-yl)benzene (0.150 g,
0.62 mmol) was dissolved in chloroform (20 mL, anhydrous), and stirred at room temperature
for 30 minutes. Ferric chloride (0.300 g, 1.9 mmol, anhydrous) was added in one portion and
the mixture was stirred for 5 hours. The resulting product was separated by filtration, and
washed with anhydrous methanol. The solid was then immersed in 50/50 vo.l%/vol.%
hydrazine hydrate-water (50 mL) for 2 hours. Finally, the solid was washed with HCl (1 M,
250 mL) and water (250 mL). After drying the product was obtained as a red powder (121 mg,
81%). Anal. Calcd for (C14H8S2)n: C, 69.96; H, 3.35; S, 26.68%; Found C, 59.66; H, 3.53; S,
18.19%.
Synthesis of P17Ox via oxidative coupling: Thiophene (2.62 g, 31.2 mmol, 2.5 mL) was
added to acetonitrile (150 mL, anhydrous), and stirred at room temperature for 30 minutes.
Ferric chloride (5.0 g, 30.8 mmol, anhydrous) was added in one portion and the mixture was
stirred for 5 hours. The resulting product was separated by filtration, and washed with
anhydrous methanol. The solid was then immersed in 50/50 vol.% /vol.% hydrazine hydrate-
water (100 mL) for 2 hours. Finally, the solid was washed with HCl (1 M, 250 mL) and water
(250 mL). After drying the product was obtained as a dark red powder (300 mg, 12%). Anal.
Calcd for (C4H2S)n: C, 58.50; H, 2.45; S, 39.04%; Found C, 53.89; H, 2.09; S, 35.05%.
Synthesis of P18 (‘pseudo-random’ analogue of P12) via Suzuki-Miyaura-type
polycondensation: A flask was charged with 2,5-dibromothiophene (242 mg, 1.0 mmol), 1,4-
dibromobenzene (118 mg, 0.5 mmol), 1,4-benzenediboronic acid bis(pinacol)ester (495 mg,
1.5 mmol), N,N-dimethylformamide (40 mL), and an aqueous solution of K2CO3 (2 M). The
7
mixture was degassed by bubbling with N2 for 30 minutes before tetrakis(triphenylphosphine)
palladium(0) (20 mg, 1.15 mol %) was added, and the mixture heated with stirring to 150 °C
for 2 days. The mixture was cooled to room temperature and poured into water. The
precipitate was collected by filtration and washed with H2O and methanol. Further
purification of the polymers was carried out by Soxhlet extraction with chloroform to remove
any low-molecular weight by-products and the product was dried under reduced pressure.
After work-up and Soxhlet extraction, the product was obtained as a dark yellow powder (256
mg, 73%) Anal. Calcd for (C16H10S)n: C, 82.02; H, 4.30; S, 13.68%; Found C, 75.75; H, 4.06;
S, 12.66%
Synthesis of P19 (‘pseudo-random’ analogue of P12) via Suzuki-Miyaura-type
polycondensation: A flask was charged with 5,5′-dibromo-2,2′-bithiophene (194 mg, 0.6
mmol), 1,4-dibromobenzene (212 mg, 0.9 mmol), 1,4-benzenediboronic acid bis(pinacol)ester
(495 mg, 1.5 mmol), N,N-dimethylformamide (40 mL), and an aqueous solution of K2CO3 (2
M). The mixture was degassed by bubbling with N2 for 30 minutes before
tetrakis(triphenylphosphine) palladium(0) (20 mg, 1.15 mol %) was added, and the mixture
heated with stirring to 150 °C for 2 days. The mixture was cooled to room temperature and
poured into water. The precipitate was collected by filtration and washed with H2O and
methanol. Further purification of the polymers was carried out by Soxhlet extraction with
chloroform to remove any low-molecular weight by-products and the product was dried under
reduced pressure. After work-up and Soxhlet extraction, the product was obtained as an
orange powder (385 mg, 81%) Anal. Calcd for (C16H10S)n: C, 82.02; H, 4.30; S, 13.68%;
Found C, 77.63; H, 4.22; S, 13.41%
Synthesis of P20 (‘pseudo-random’ analogue of P12) via Suzuki-Miyaura-type
polycondensation: A flask was charged with 5,5′′-dibromo-2,2′:5′,2′′-terthiophene (174 mg,
0.43 mmol), 1,4-dibromobenzene (253 mg, 1.07 mmol), 1,4-benzenediboronic acid
bis(pinacol)ester (495 mg, 1.5 mmol), N,N-dimethylformamide (40 mL), and an aqueous
solution of K2CO3 (2 M). The mixture was degassed by bubbling with N2 for 30 minutes
before tetrakis(triphenylphosphine) palladium(0) (20 mg, 1.15 mol %) was added, and the
mixture heated with stirring to 150 °C for 2 days. The mixture was cooled to room
temperature and poured into water. The precipitate was collected by filtration and washed
with H2O and methanol. Further purification of the polymers was carried out by Soxhlet
extraction with chloroform to remove any low-molecular weight by-products and the product
8
was dried under reduced pressure. After work-up and Soxhlet extraction, the product was
obtained as a red powder (297 mg, 85%) Anal. Calcd for (C16H10S)n: C, 82.02; H, 4.30; S,
13.68%; Found C, 75.01; H, 3.94; S, 13.37%
Synthesis of P21 (‘pseudo-random’ analogue of P12) via Suzuki-Miyaura-type
polycondensation: A flask was charged with 2,5-dibromothiophene (93 mg, 0.38 mmol),
5,5′-dibromo-2,2′-bithiophene (62 mg, 0.19 mmol) 5,5′′-dibromo-2,2′:5′,2′′-terthiophene
(52 mg, 0.13 mmol), 1,4-dibromobenzene (188 mg, 0.80 mmol), 1,4-benzenediboronic acid
bis(pinacol)ester (495 mg, 1.5 mmol), N,N-dimethylformamide (40 mL), and an aqueous
solution of K2CO3 (2 M). The mixture was degassed by bubbling with N2 for 30 minutes
before tetrakis(triphenylphosphine) palladium(0) (20 mg, 1.15 mol %) was added, and the
mixture heated with stirring to 150 °C for 2 days. The mixture was cooled to room
temperature and poured into water. The precipitate was collected by filtration and washed
with H2O and methanol. Further purification of the polymers was carried out by Soxhlet
extraction with chloroform to remove any low-molecular weight by-products and the product
was dried under reduced pressure. After work-up and Soxhlet extraction, the product was
obtained as a dark orange powder (219 mg, 62%) Anal. Calcd for (C16H10S)n: C, 82.02; H,
4.30; S, 13.68%; Found C, 78.16; H, 4.21; S, 13.60%
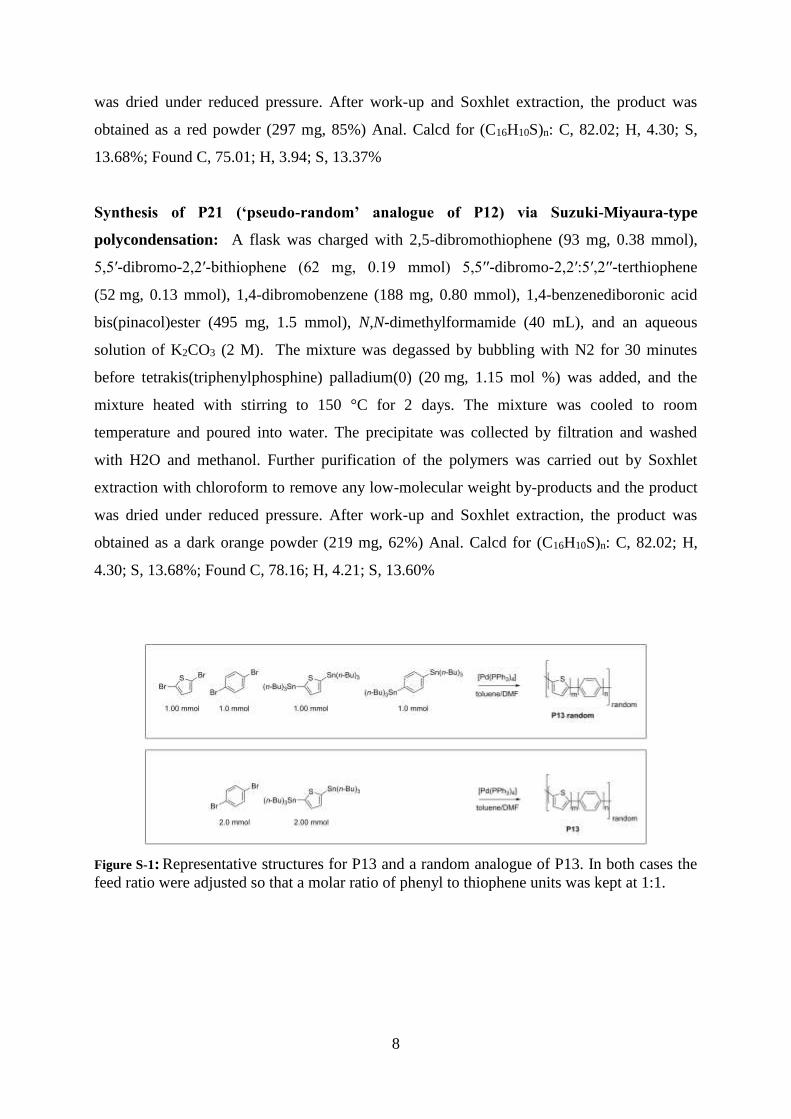
Figure S-1: Representative structures for P13 and a random analogue of P13. In both cases the
feed ratio were adjusted so that a molar ratio of phenyl to thiophene units was kept at 1:1.
9
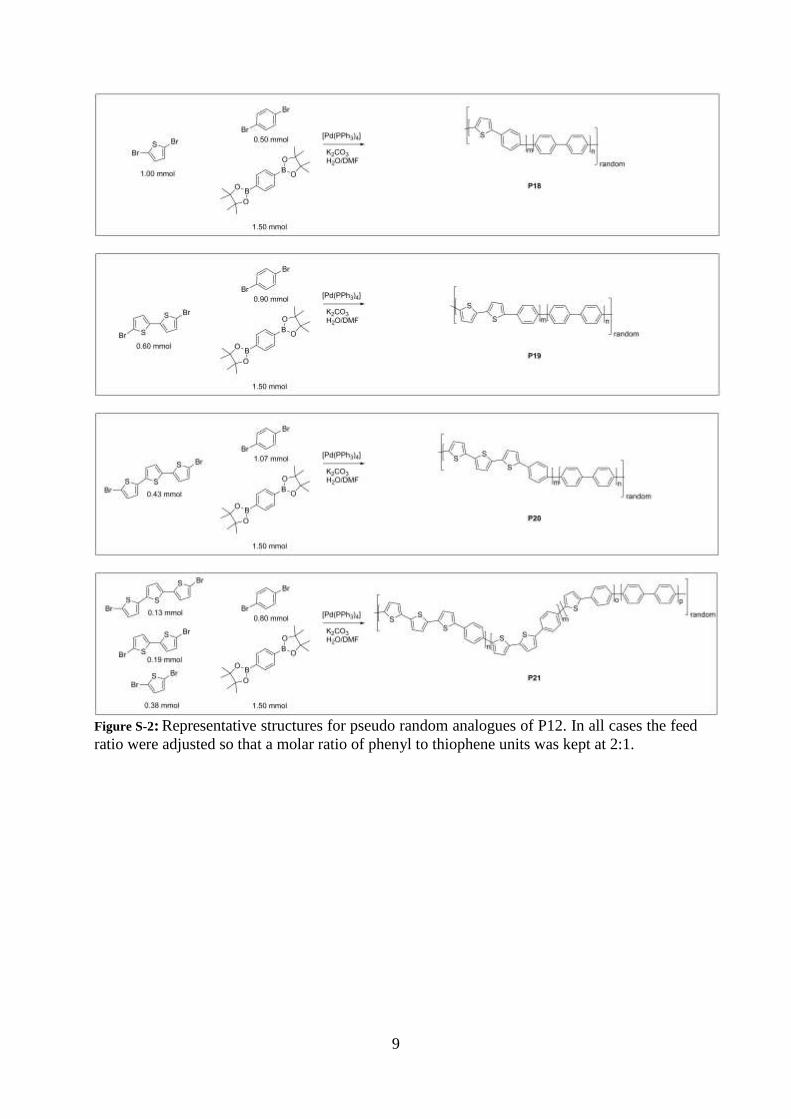
Figure S-2: Representative structures for pseudo random analogues of P12. In all cases the feed
ratio were adjusted so that a molar ratio of phenyl to thiophene units was kept at 2:1.
10
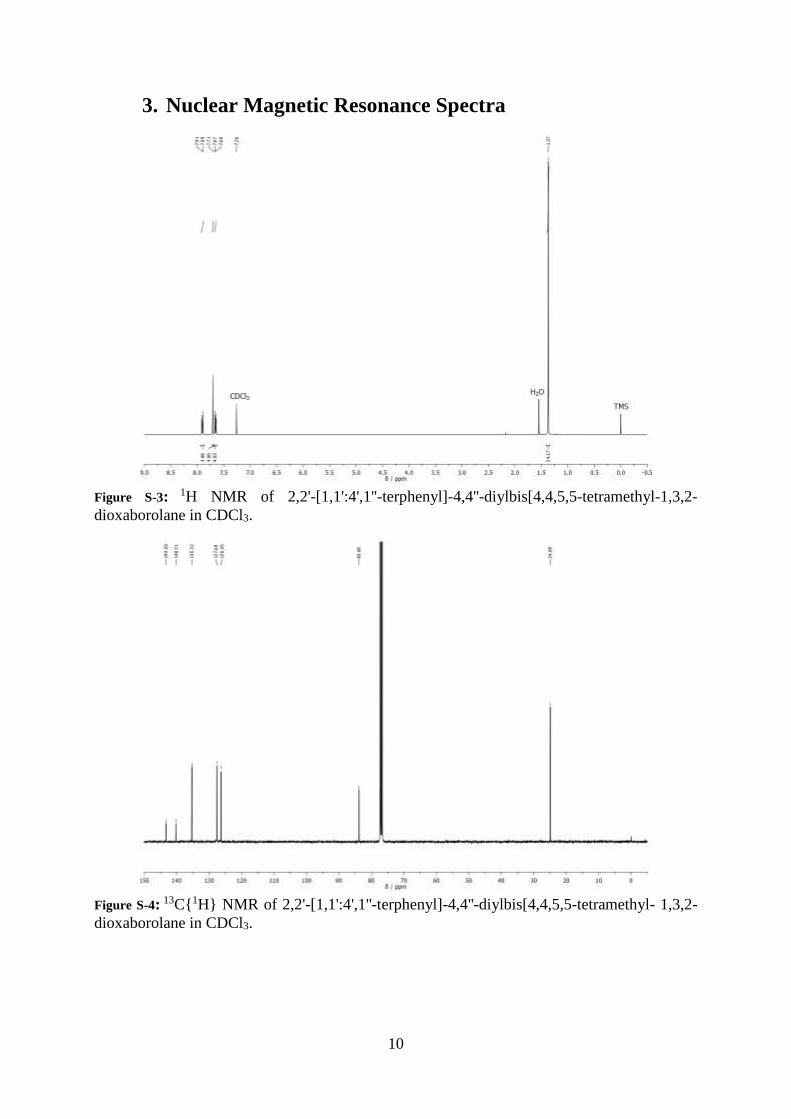
3. Nuclear Magnetic Resonance Spectra
Figure S-3: 1H NMR of 2,2'-[1,1':4',1''-terphenyl]-4,4''-diylbis[4,4,5,5-tetramethyl-1,3,2-
dioxaborolane in CDCl3.
Figure S-4: 13C{1H} NMR of 2,2'-[1,1':4',1''-terphenyl]-4,4''-diylbis[4,4,5,5-tetramethyl- 1,3,2-
dioxaborolane in CDCl3.
11
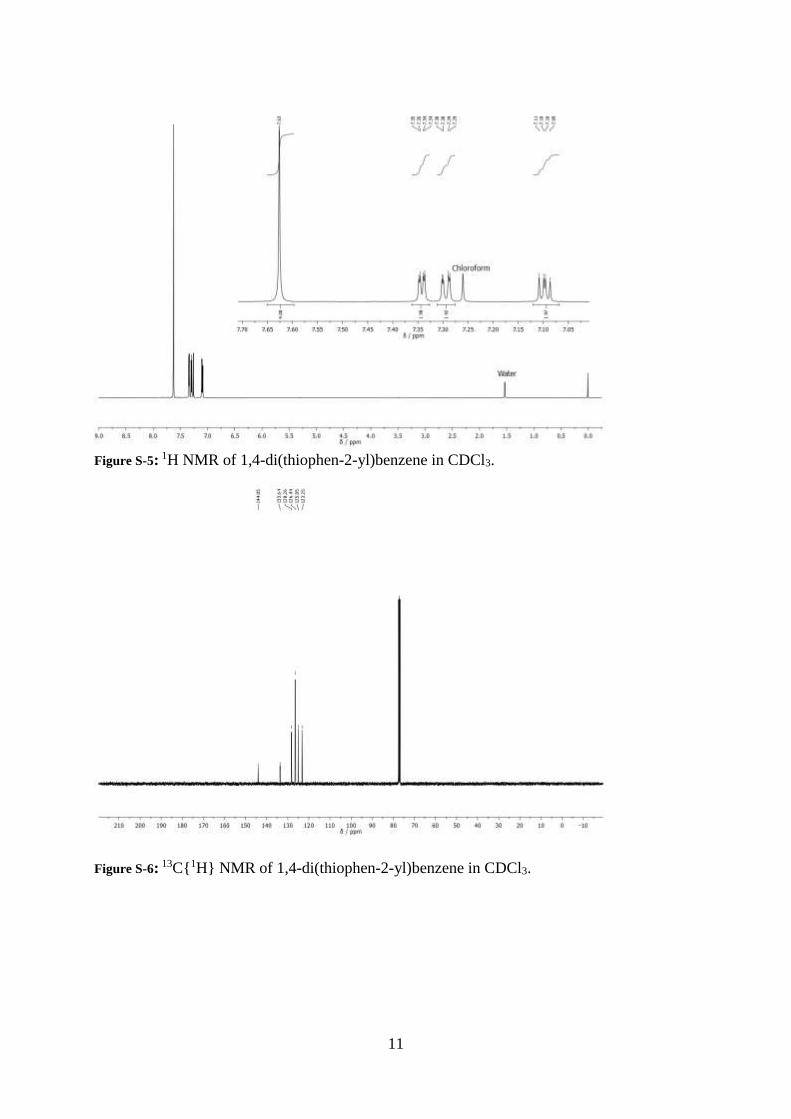
Figure S-5: 1H NMR of 1,4-di(thiophen-2-yl)benzene in CDCl3.
Figure S-6: 13C{1H} NMR of 1,4-di(thiophen-2-yl)benzene in CDCl3.
12
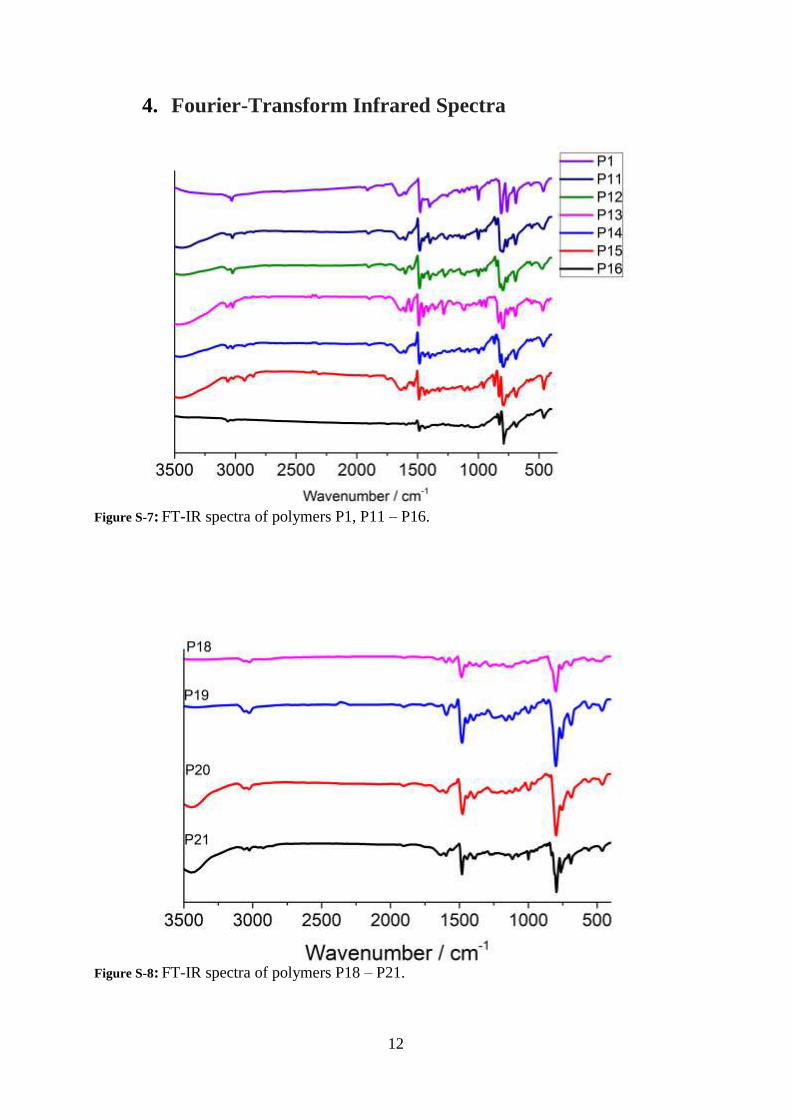
4. Fourier-Transform Infrared Spectra
Figure S-7: FT-IR spectra of polymers P1, P11 – P16.
Figure S-8: FT-IR spectra of polymers P18 – P21.

13
Figure S-9: FT-IR spectra of polymers made via Stille or oxidative coupling.
5. MALDI-TOF MS
Figure S-10: MALDI-TOF MS spectrum of P1. P = 1,4-benzene. The highest mass that can be
identified is around 1800 g mol-1 which equals approximately 24 repeat units. Note: The
polymer was cationised with NaI instead of AgOTf.

14
Figure S-11: MALDI-TOF MS spectrum of P11. P = 1,4-benzene, T = 2,5-thiophene. The
highest mass that can be identified is around 2200 g mol-1 which equals approximately 7
repeat units.
Figure S-12: MALDI-TOF MS spectrum of P12. P = 1,4-benzene, T = 2,5-thiophene. The
highest mass that can be identified is around 1600 g mol-1 which equals approximately 7
repeat units.
15
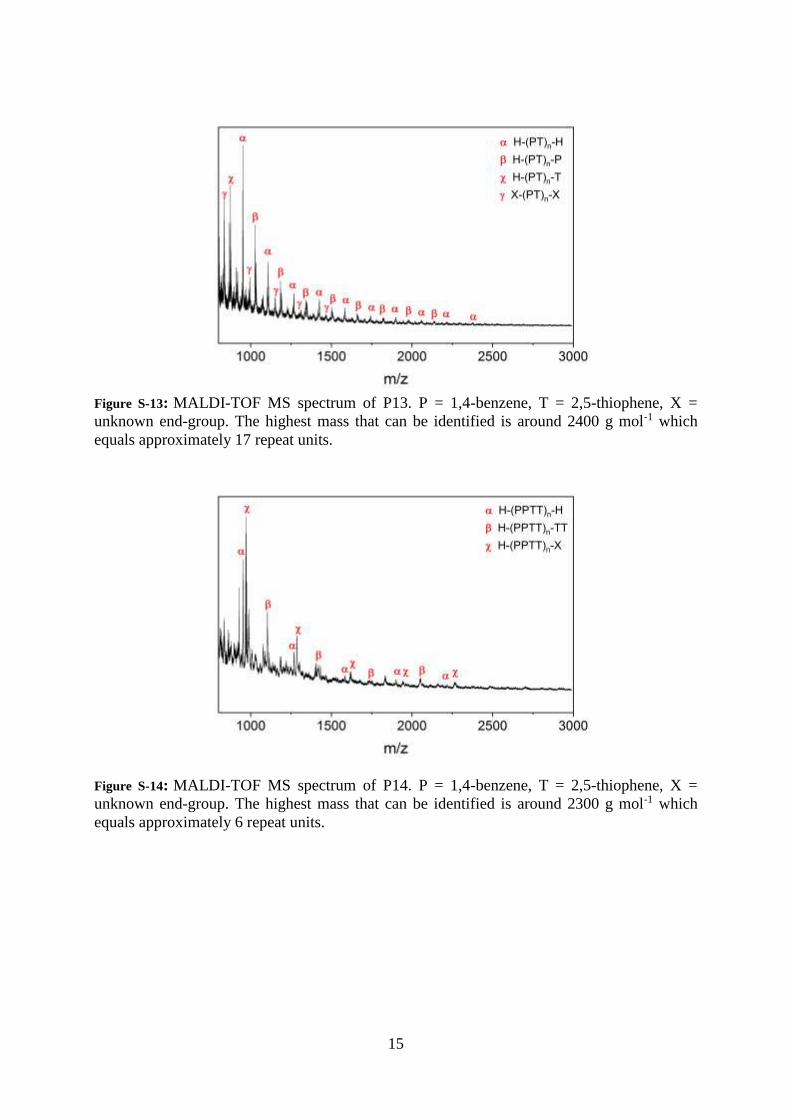
Figure S-13: MALDI-TOF MS spectrum of P13. P = 1,4-benzene, T = 2,5-thiophene, X =
unknown end-group. The highest mass that can be identified is around 2400 g mol-1 which
equals approximately 17 repeat units.
Figure S-14: MALDI-TOF MS spectrum of P14. P = 1,4-benzene, T = 2,5-thiophene, X =
unknown end-group. The highest mass that can be identified is around 2300 g mol-1 which
equals approximately 6 repeat units.

16
Figure S-15: MALDI-TOF MS spectrum of P15. P = 1,4-benzene, T = 2,5-thiophene, X =
unknown end-group. The highest mass that can be identified is around 1900 g mol-1 which
equals approximately 8 repeat units.
Figure S-16: MALDI-TOF MS spectrum of P16. P = 1,4-benzene, T = 2,5-thiophene, X =
unknown end-group. The highest mass that can be identified is around 1900 g mol-1 which
equals approximately 6 repeat units.

17
Figure S-17: MALDI-TOF MS spectrum of P17St made via Stille coupling. T = 2,5-thiophene.
The highest mass that can be identified is around 1900 g mol-1 which equals approximately 25
repeat units.
Figure S-18: MALDI-TOF MS spectrum of P15Ox made via oxidative coupling. T = thiophene,
X = unknown end-group. The highest mass that can be identified is around 2600 g mol-1
which equals approximately 11 repeat units.

18
Figure S-19: MALDI-TOF MS spectrum of P17Ox made via oxidative coupling. T = thiophene,
X = unknown end-group. The highest mass that can be identified is around 1300 g mol-1
which equals approximately 16 repeat units, however, in no series end-groups could be
assigned unambiguously (mass spacing of 82 g mol-1 was identified in several series which
correlates with a thiophene repeat unit).
Figure S-20: MALDI-TOF MS spectrum of P18. Mass spacing correlating to 1,4-benzene (P),
biphenyl (PP), terphenyl (PPP), and 2,5-thiophene (T) could be identified. Insert: Assigned
mass spacing in the range of 840 to 1200 m/z.
19
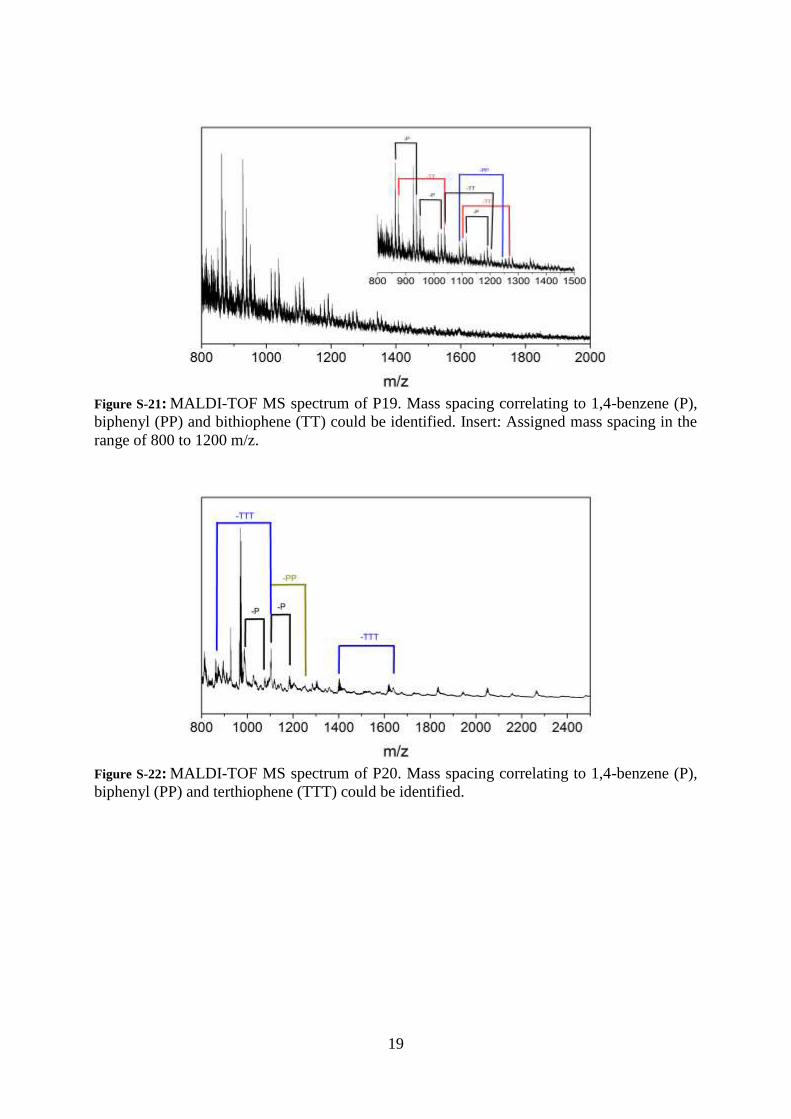
Figure S-21: MALDI-TOF MS spectrum of P19. Mass spacing correlating to 1,4-benzene (P),
biphenyl (PP) and bithiophene (TT) could be identified. Insert: Assigned mass spacing in the
range of 800 to 1200 m/z.
Figure S-22: MALDI-TOF MS spectrum of P20. Mass spacing correlating to 1,4-benzene (P),
biphenyl (PP) and terthiophene (TTT) could be identified.
20
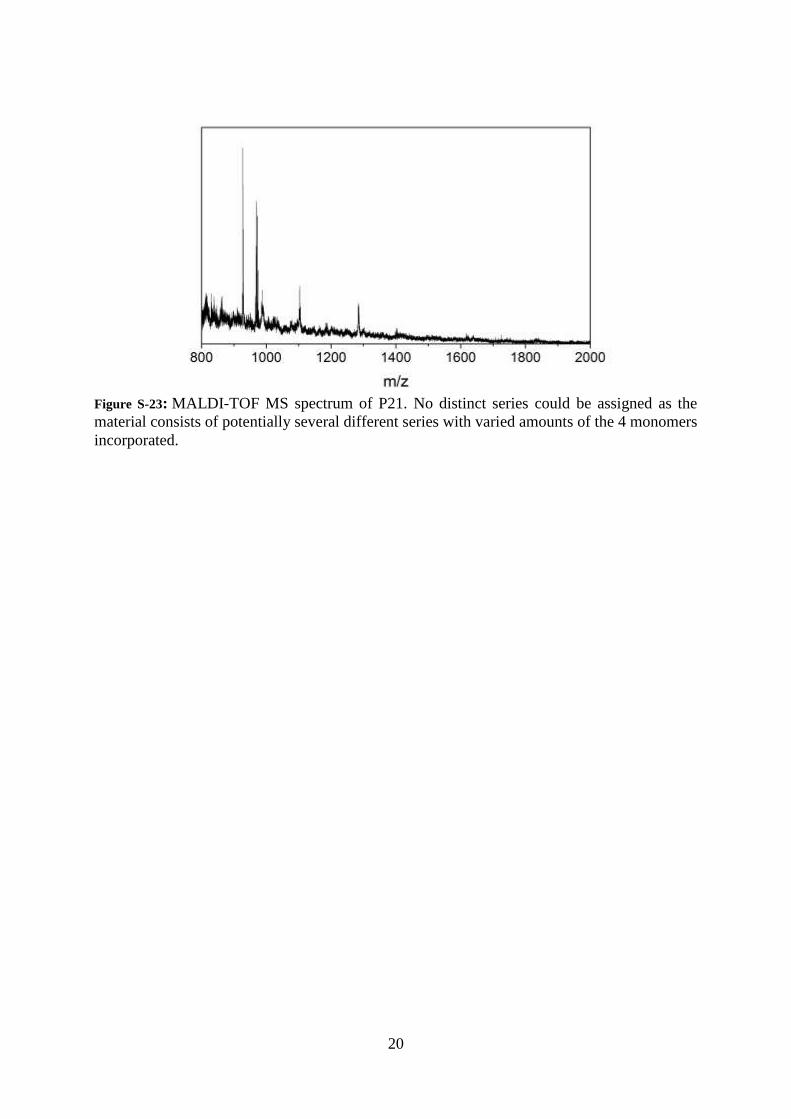
Figure S-23: MALDI-TOF MS spectrum of P21. No distinct series could be assigned as the
material consists of potentially several different series with varied amounts of the 4 monomers
incorporated.
21
6. Solid-State NMR
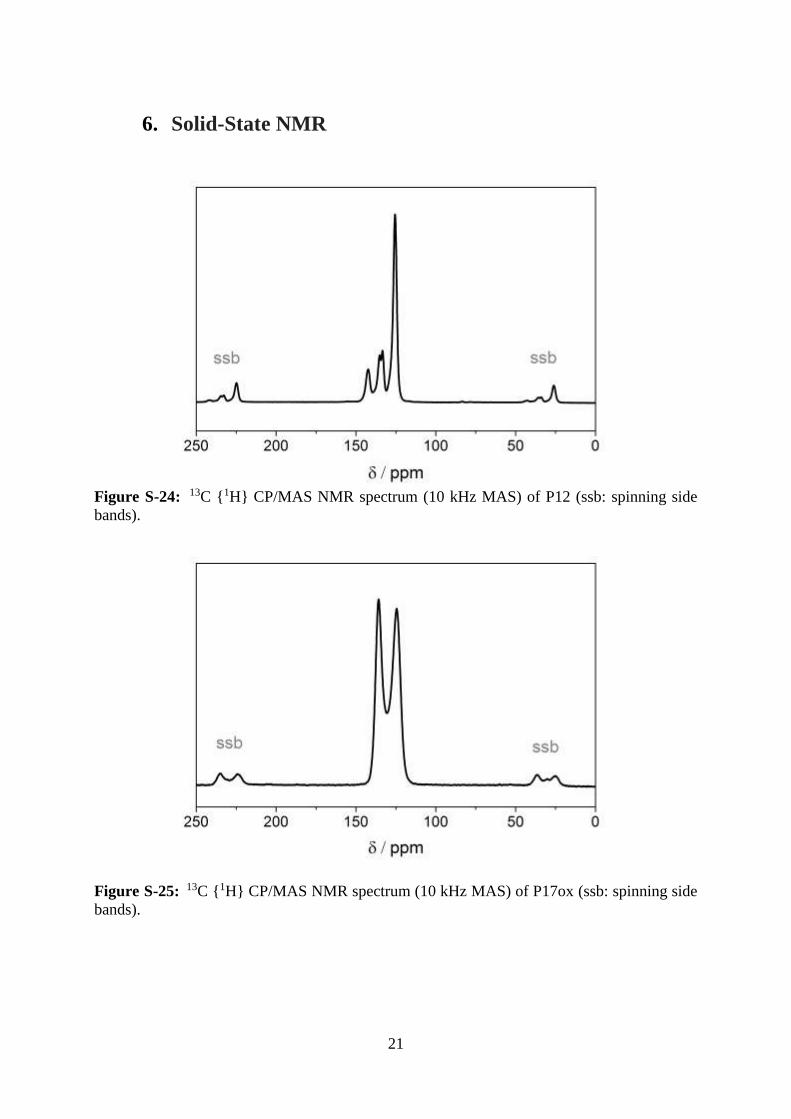
Figure S-24: 13C {1H} CP/MAS NMR spectrum (10 kHz MAS) of P12 (ssb: spinning side
bands).
Figure S-25: 13C {1H} CP/MAS NMR spectrum (10 kHz MAS) of P17ox (ssb: spinning side
bands).
22
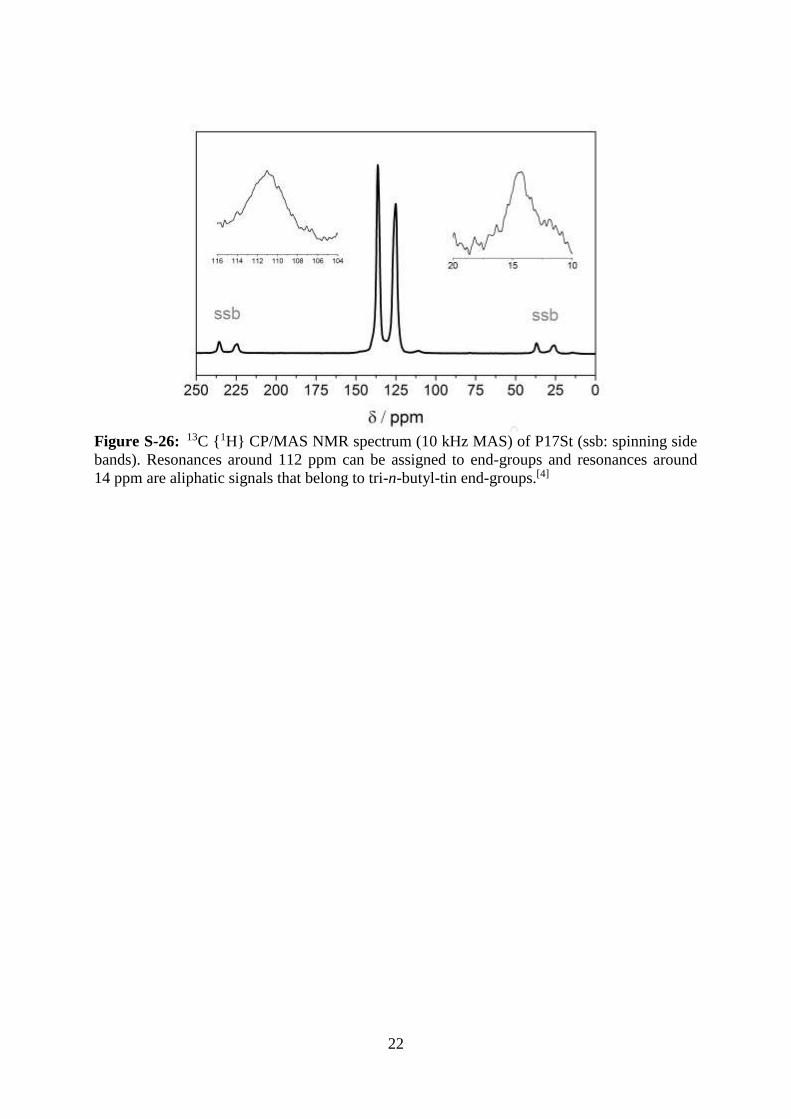
Figure S-26: 13C {1H} CP/MAS NMR spectrum (10 kHz MAS) of P17St (ssb: spinning side
bands). Resonances around 112 ppm can be assigned to end-groups and resonances around
14 ppm are aliphatic signals that belong to tri-n-butyl-tin end-groups.[4]
23
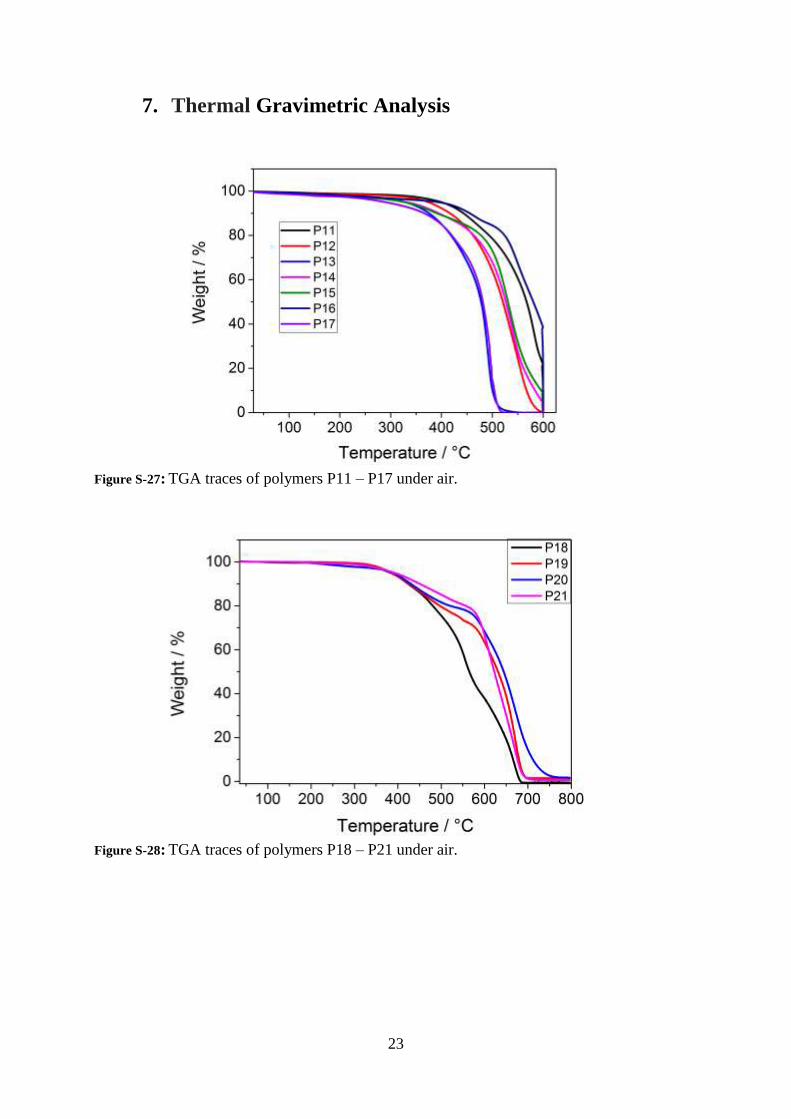
7. Thermal Gravimetric Analysis
Figure S-27: TGA traces of polymers P11 – P17 under air.
Figure S-28: TGA traces of polymers P18 – P21 under air.
24
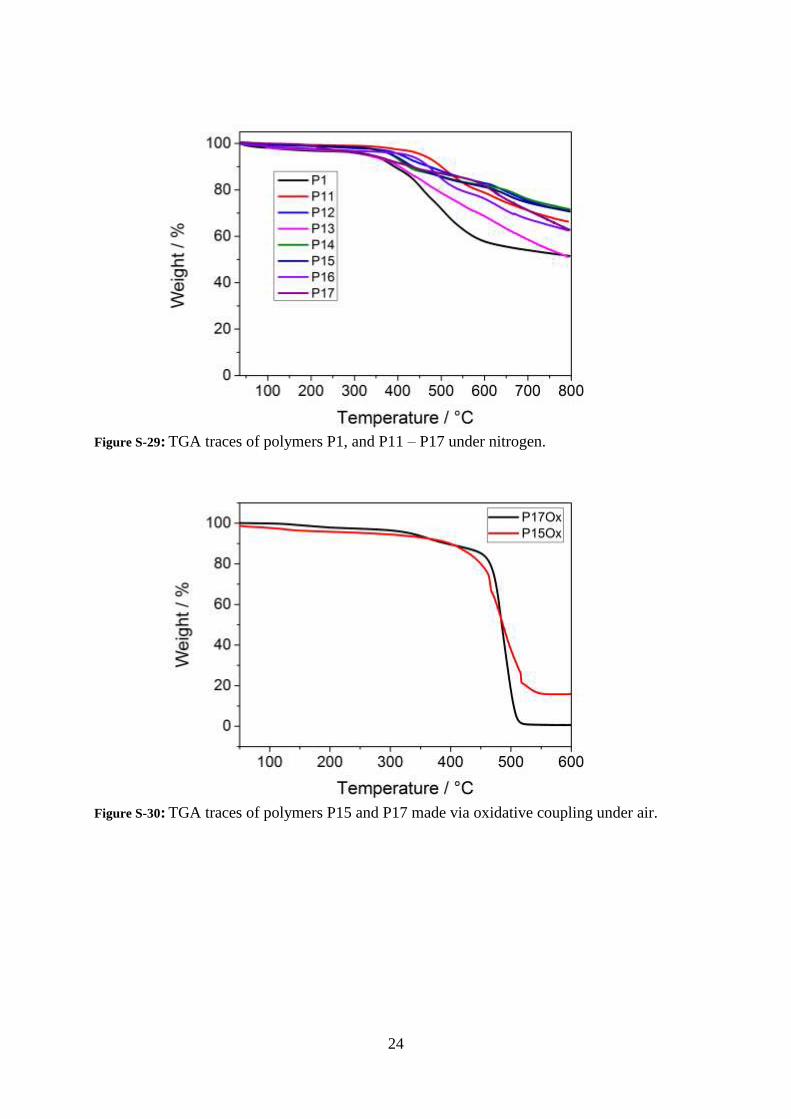
Figure S-29: TGA traces of polymers P1, and P11 – P17 under nitrogen.
Figure S-30: TGA traces of polymers P15 and P17 made via oxidative coupling under air.
25
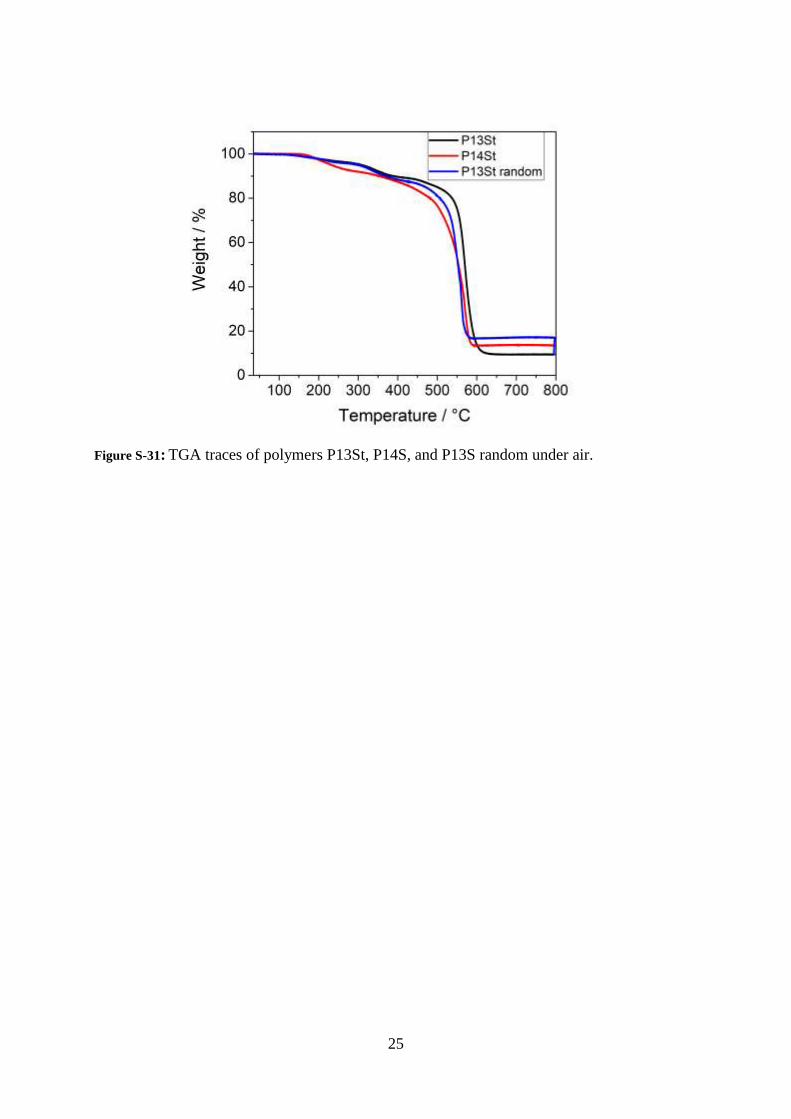
Figure S-31: TGA traces of polymers P13St, P14S, and P13S random under air.
26
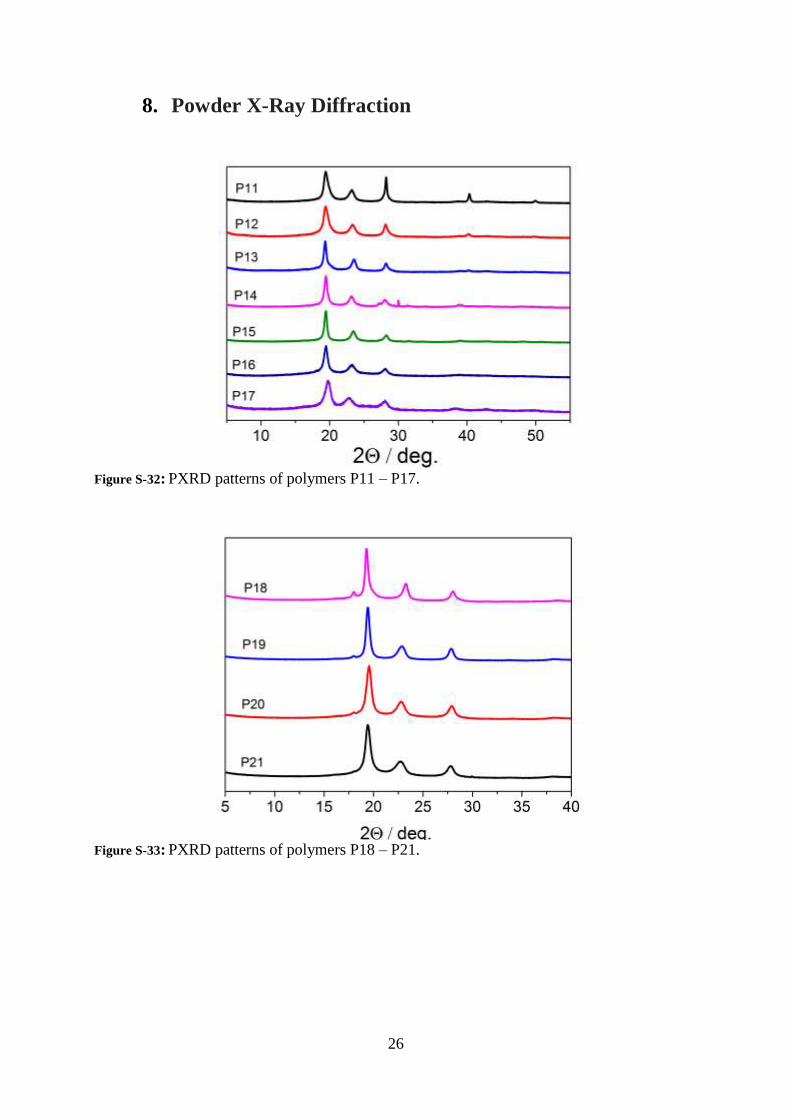
8. Powder X-Ray Diffraction
Figure S-32: PXRD patterns of polymers P11 – P17.
Figure S-33: PXRD patterns of polymers P18 – P21.
27
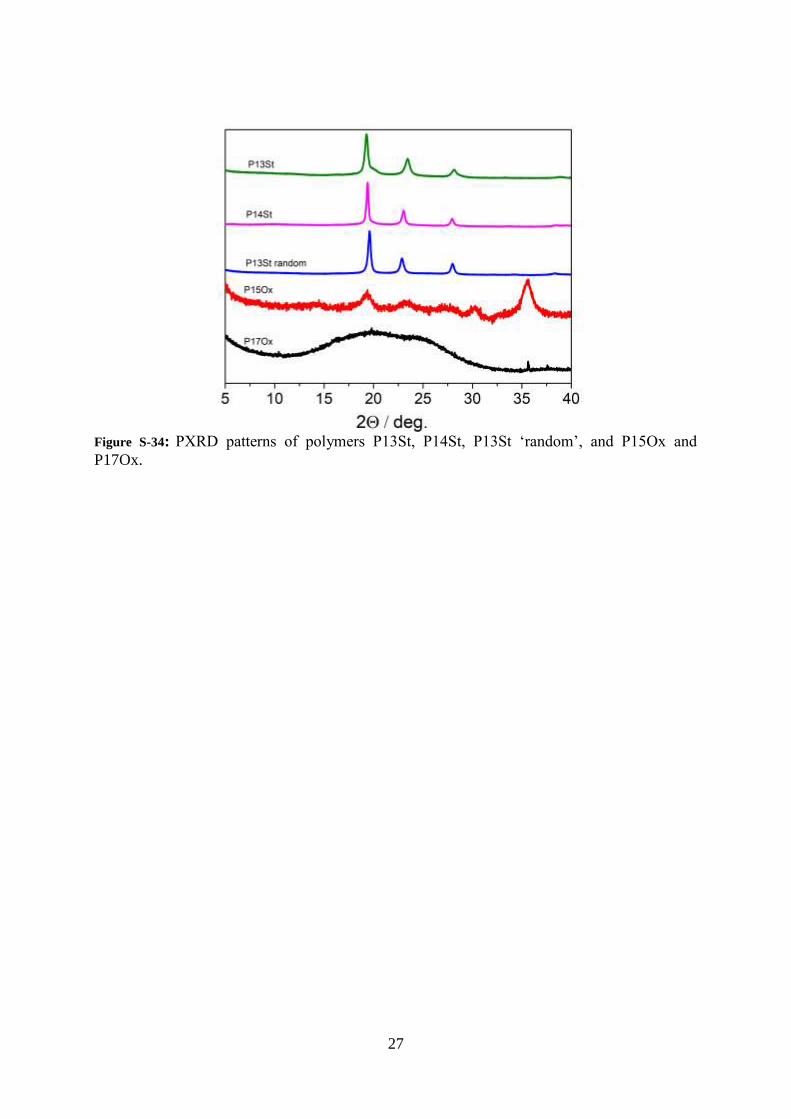
Figure S-34: PXRD patterns of polymers P13St, P14St, P13St ‘random’, and P15Ox and
P17Ox.

28
9. Gas sorption isotherms
Figure S-35: Nitrogen sorption isotherm for polymer P1 measured at 77.3 K and up to 1 bar
(desorption curves shown as open symbols).
Figure S-36: Nitrogen sorption isotherm for polymer P11 measured at 77.3 K and up to 1 bar
(desorption curves shown as open symbols).
29
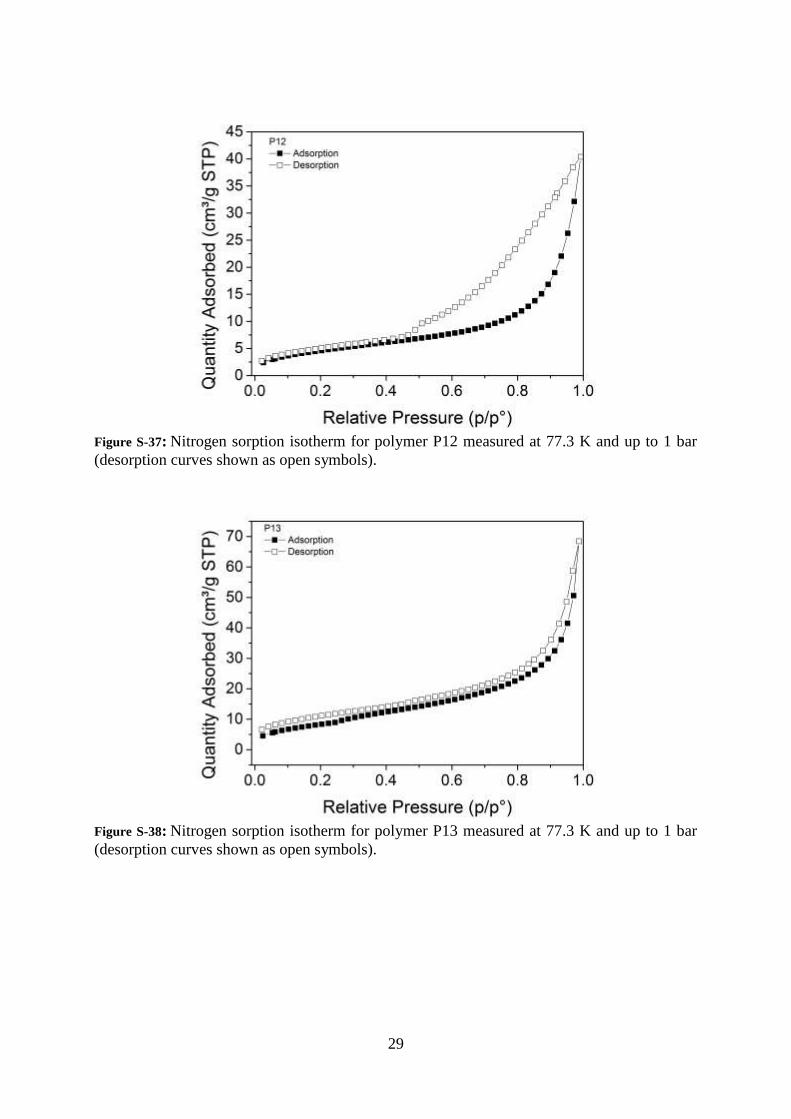
Figure S-37: Nitrogen sorption isotherm for polymer P12 measured at 77.3 K and up to 1 bar
(desorption curves shown as open symbols).
Figure S-38: Nitrogen sorption isotherm for polymer P13 measured at 77.3 K and up to 1 bar
(desorption curves shown as open symbols).
30
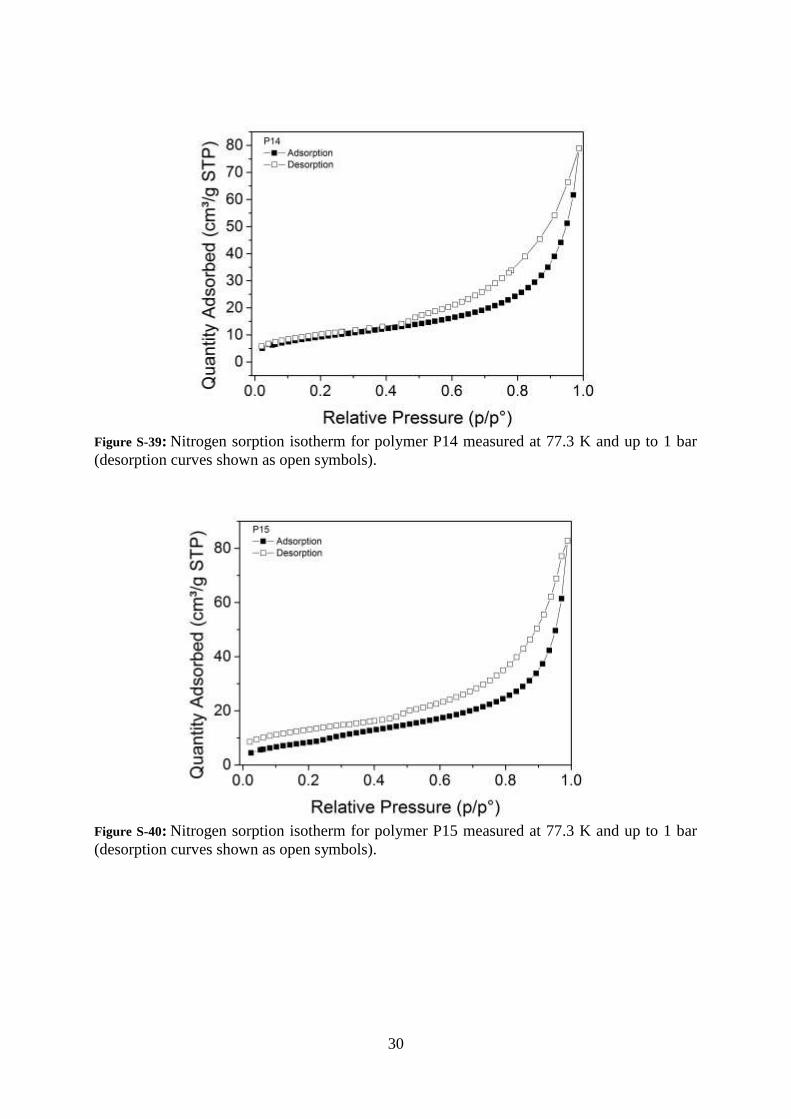
Figure S-39: Nitrogen sorption isotherm for polymer P14 measured at 77.3 K and up to 1 bar
(desorption curves shown as open symbols).
Figure S-40: Nitrogen sorption isotherm for polymer P15 measured at 77.3 K and up to 1 bar
(desorption curves shown as open symbols).

31
Figure S-41: Nitrogen sorption isotherm for polymer P16 measured at 77.3 K and up to 1 bar
(desorption curves shown as open symbols).
Figure S-42: Nitrogen sorption isotherm for polymer P17 made via Stille coupling measured at
77.3 K and up to 1 bar (desorption curves shown as open symbols).
32
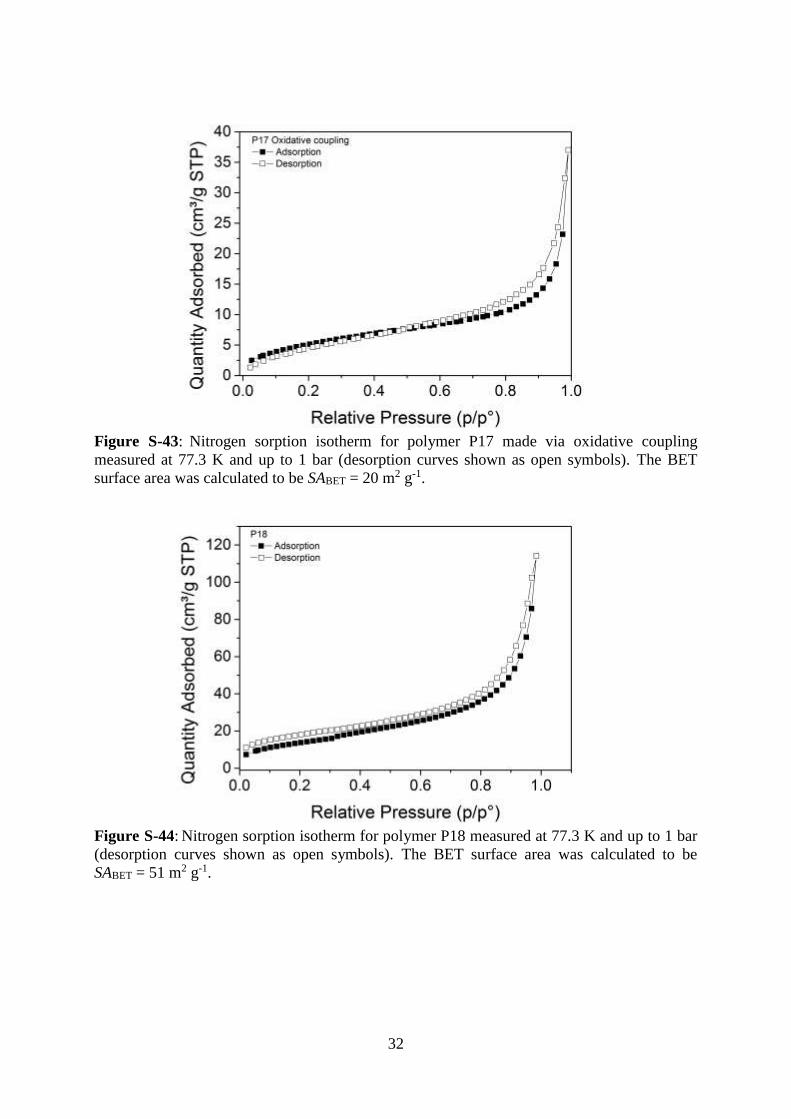
Figure S-43: Nitrogen sorption isotherm for polymer P17 made via oxidative coupling
measured at 77.3 K and up to 1 bar (desorption curves shown as open symbols). The BET
surface area was calculated to be SABET = 20 m2 g-1.
Figure S-44: Nitrogen sorption isotherm for polymer P18 measured at 77.3 K and up to 1 bar
(desorption curves shown as open symbols). The BET surface area was calculated to be
SABET = 51 m2 g-1.

33
Figure S-45: Nitrogen sorption isotherm for polymer P19 measured at 77.3 K and up to 1 bar
(desorption curves shown as open symbols). The BET surface area was calculated to be
SABET = 31 m2 g-1.
Figure S-46: Nitrogen sorption isotherm for polymer P20 measured at 77.3 K and up to 1 bar
(desorption curves shown as open symbols). The BET surface area was calculated to be
SABET = 2 m2 g-1.
34
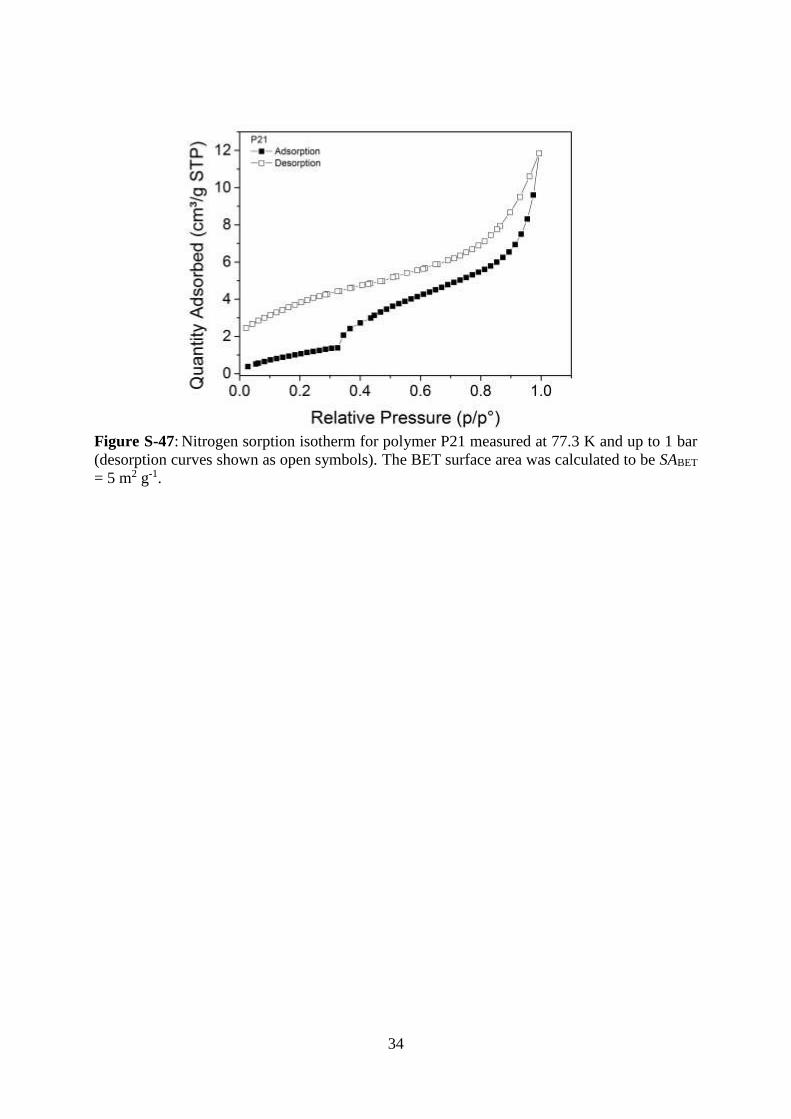
Figure S-47: Nitrogen sorption isotherm for polymer P21 measured at 77.3 K and up to 1 bar
(desorption curves shown as open symbols). The BET surface area was calculated to be SABET
= 5 m2 g-1.
35
10. Scanning Electron Microscope
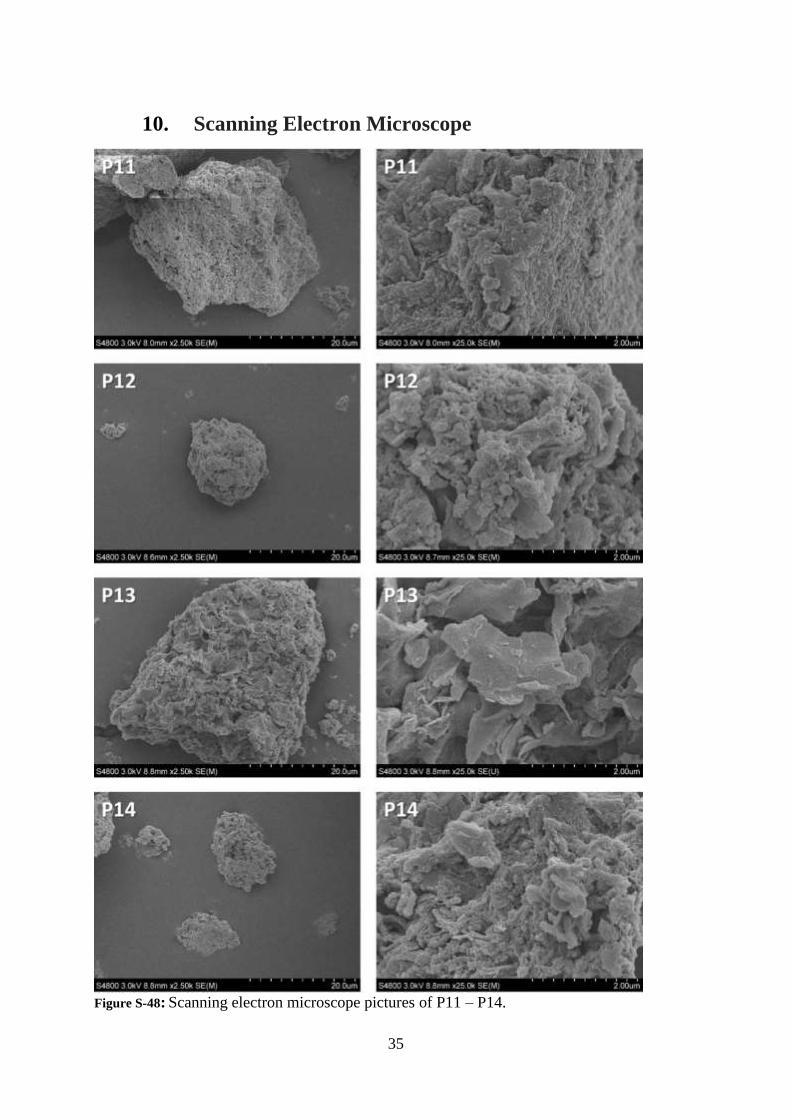
Figure S-48: Scanning electron microscope pictures of P11 – P14.
36
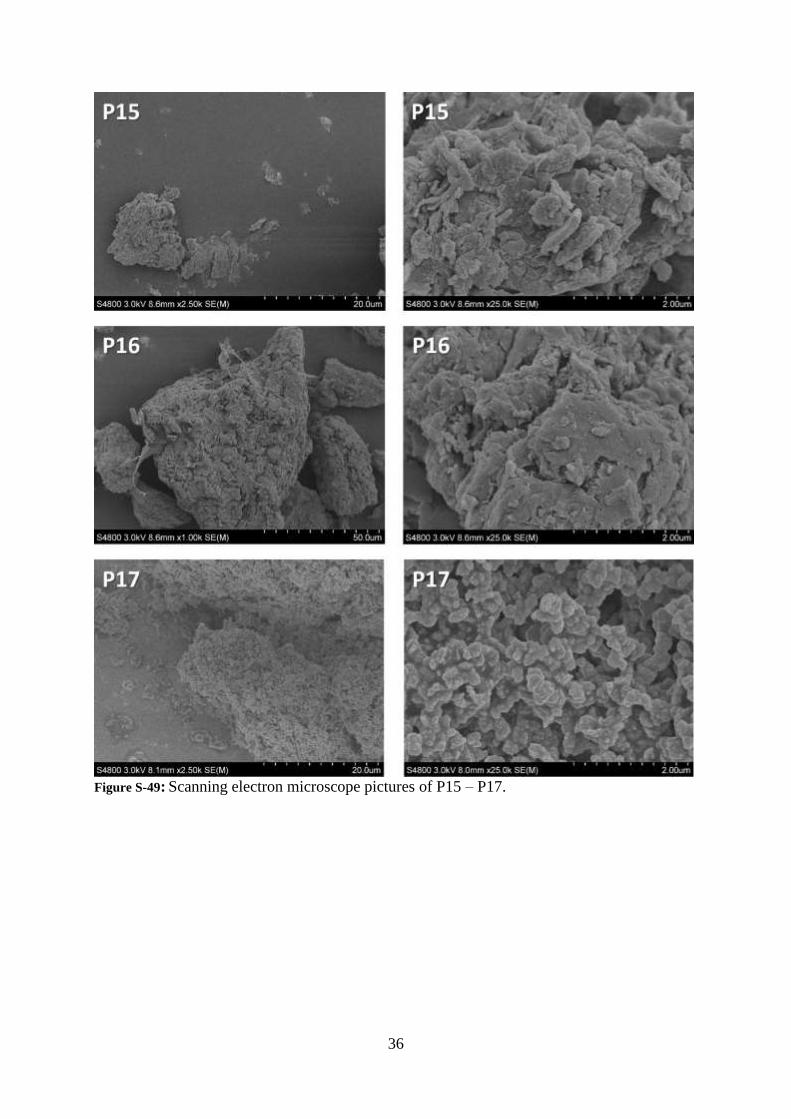
Figure S-49: Scanning electron microscope pictures of P15 – P17.
37
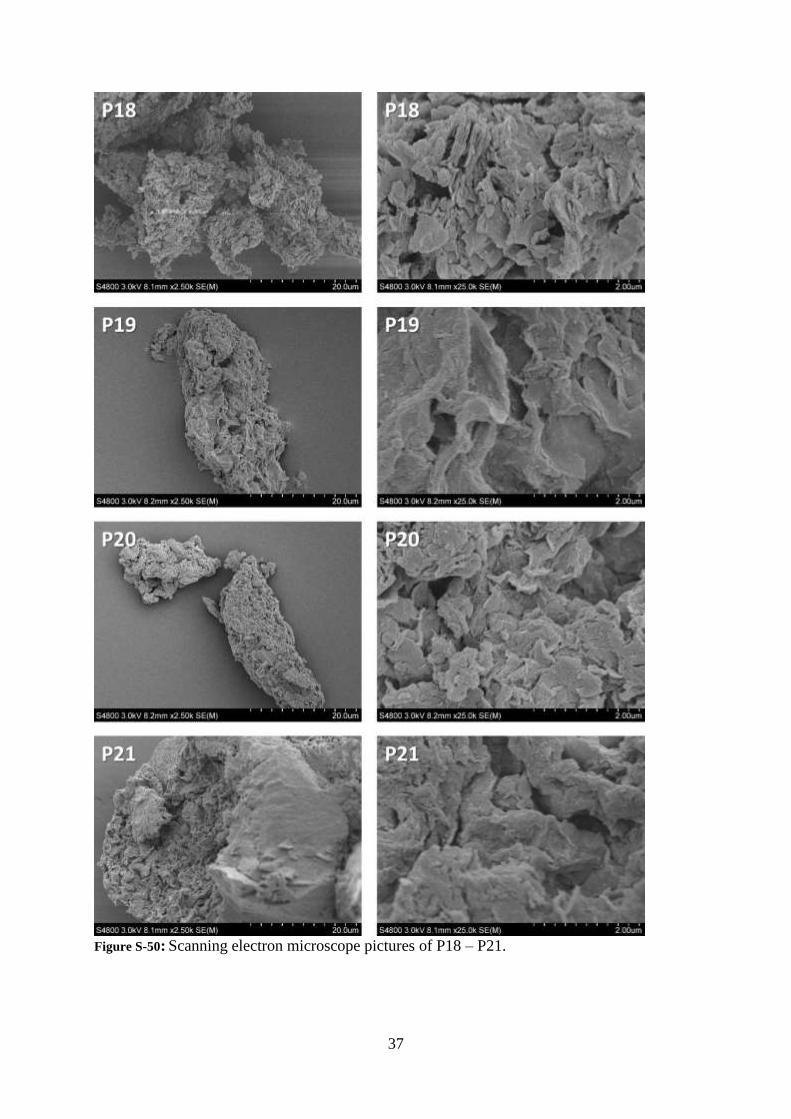
Figure S-50: Scanning electron microscope pictures of P18 – P21.
38
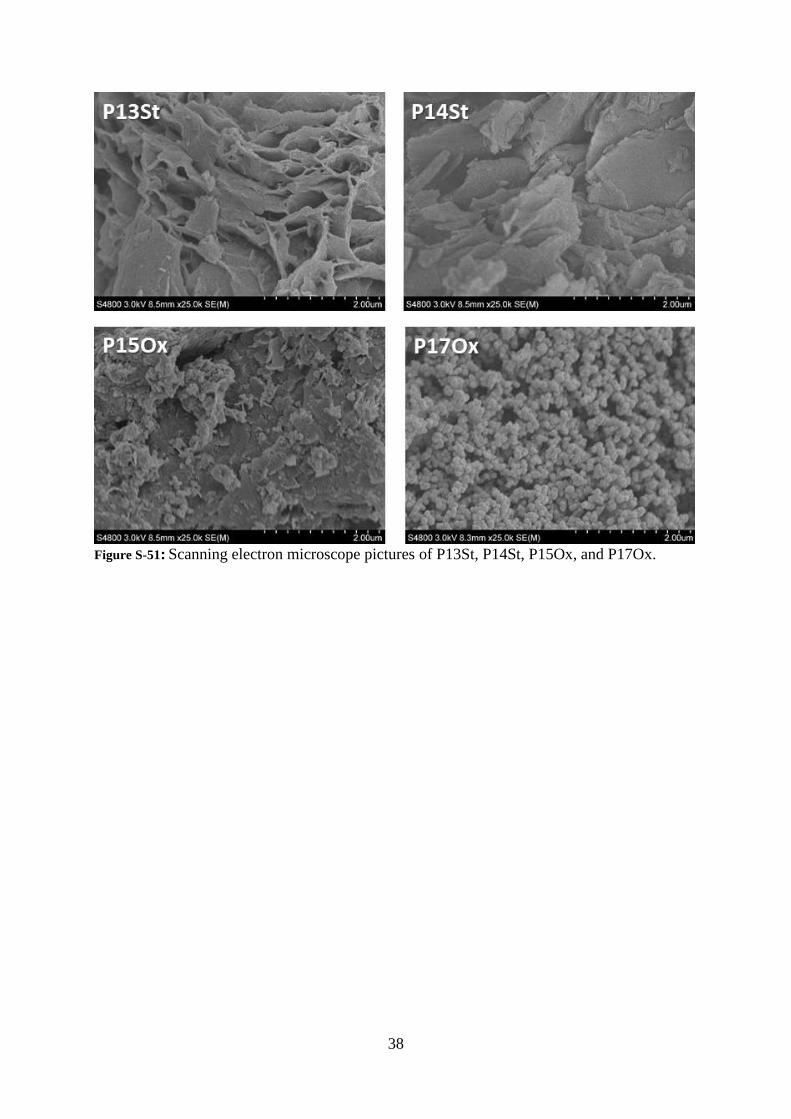
Figure S-51: Scanning electron microscope pictures of P13St, P14St, P15Ox, and P17Ox.
39
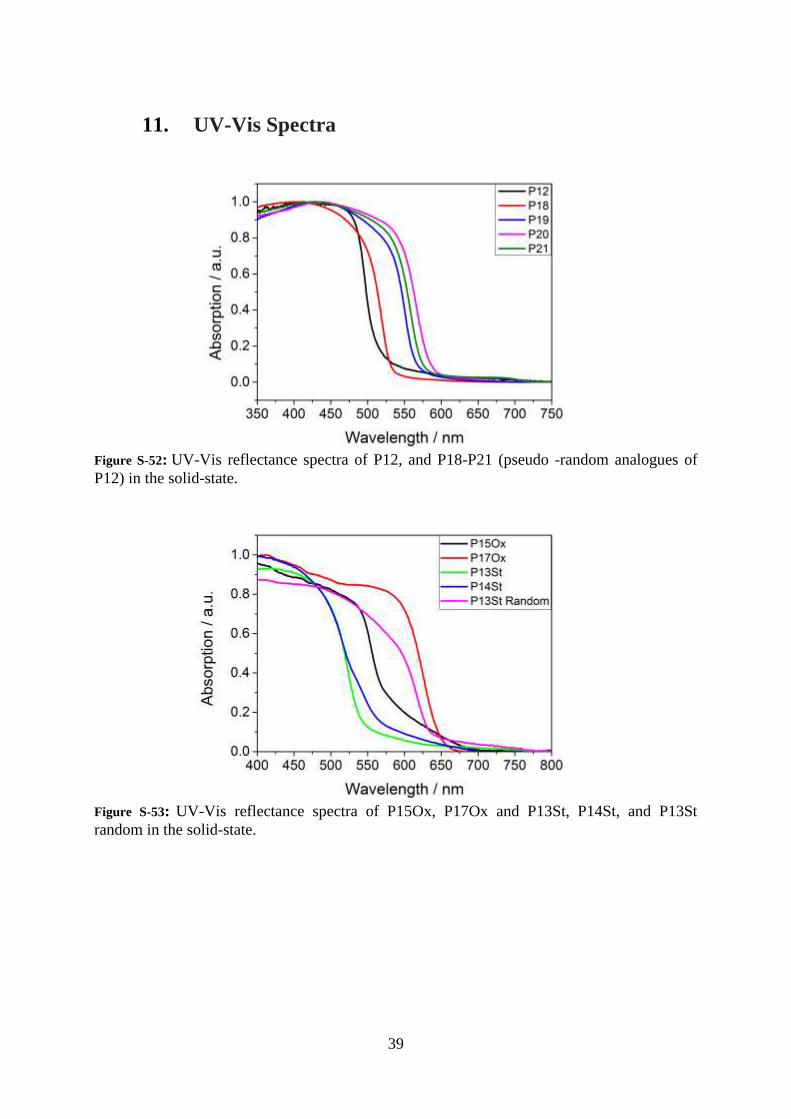
11. UV-Vis Spectra
Figure S-52: UV-Vis reflectance spectra of P12, and P18-P21 (pseudo -random analogues of
P12) in the solid-state.
Figure S-53: UV-Vis reflectance spectra of P15Ox, P17Ox and P13St, P14St, and P13St
random in the solid-state.
40
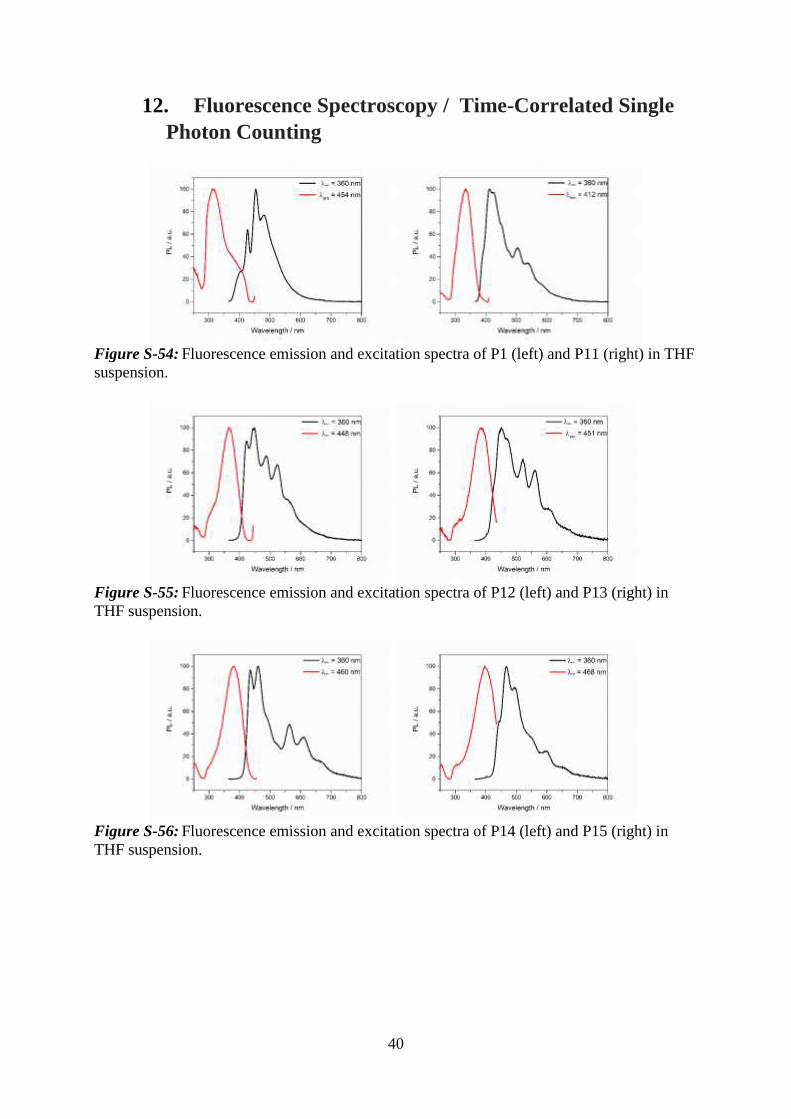
12. Fluorescence Spectroscopy / Time-Correlated Single
Photon Counting
Figure S-54: Fluorescence emission and excitation spectra of P1 (left) and P11 (right) in THF
suspension.
Figure S-55: Fluorescence emission and excitation spectra of P12 (left) and P13 (right) in
THF suspension.
Figure S-56: Fluorescence emission and excitation spectra of P14 (left) and P15 (right) in
THF suspension.
41
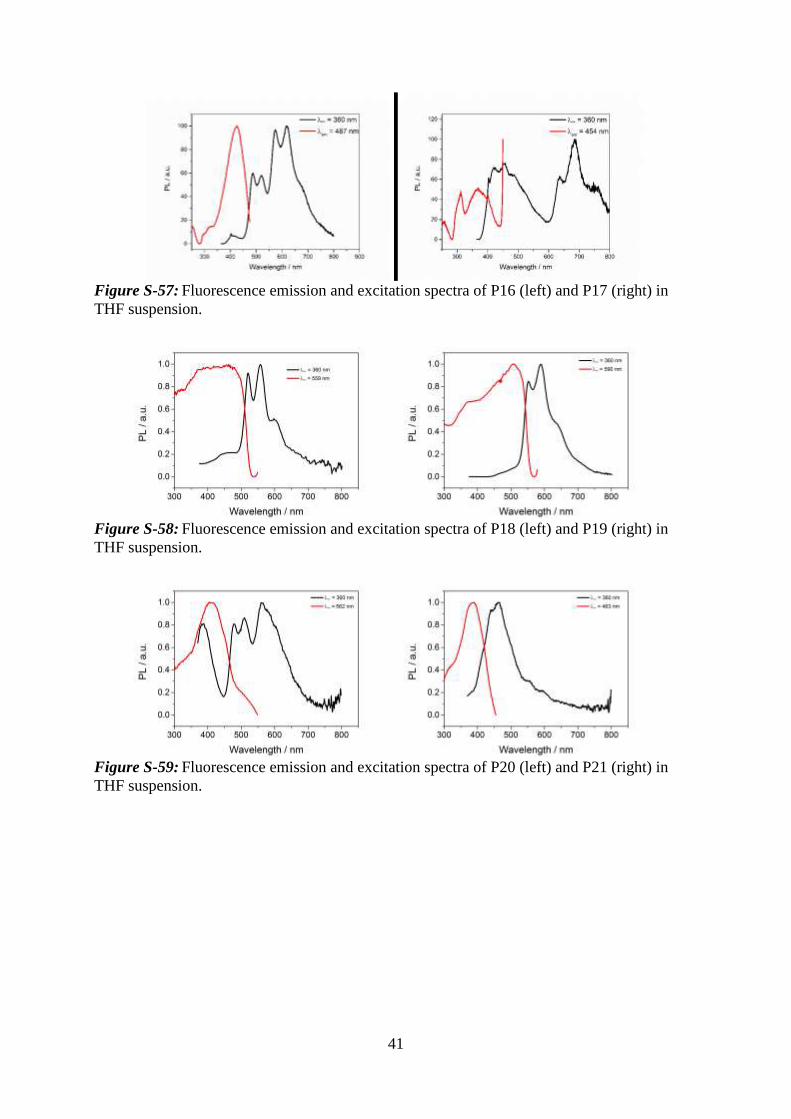
Figure S-57: Fluorescence emission and excitation spectra of P16 (left) and P17 (right) in
THF suspension.
Figure S-58: Fluorescence emission and excitation spectra of P18 (left) and P19 (right) in
THF suspension.
Figure S-59: Fluorescence emission and excitation spectra of P20 (left) and P21 (right) in
THF suspension.

42
Figure S-60: Fluorescence emission and excitation spectra of P13St (left) and P14St (right) in
THF suspension.
Figure S-61: Fluorescence emission and excitation spectra of P15Ox (left) and P17Ox (right)
in THF suspension.
43
Figure S-62: Fluorescence life-time decays of P1, P11, and P12 in THF suspension.
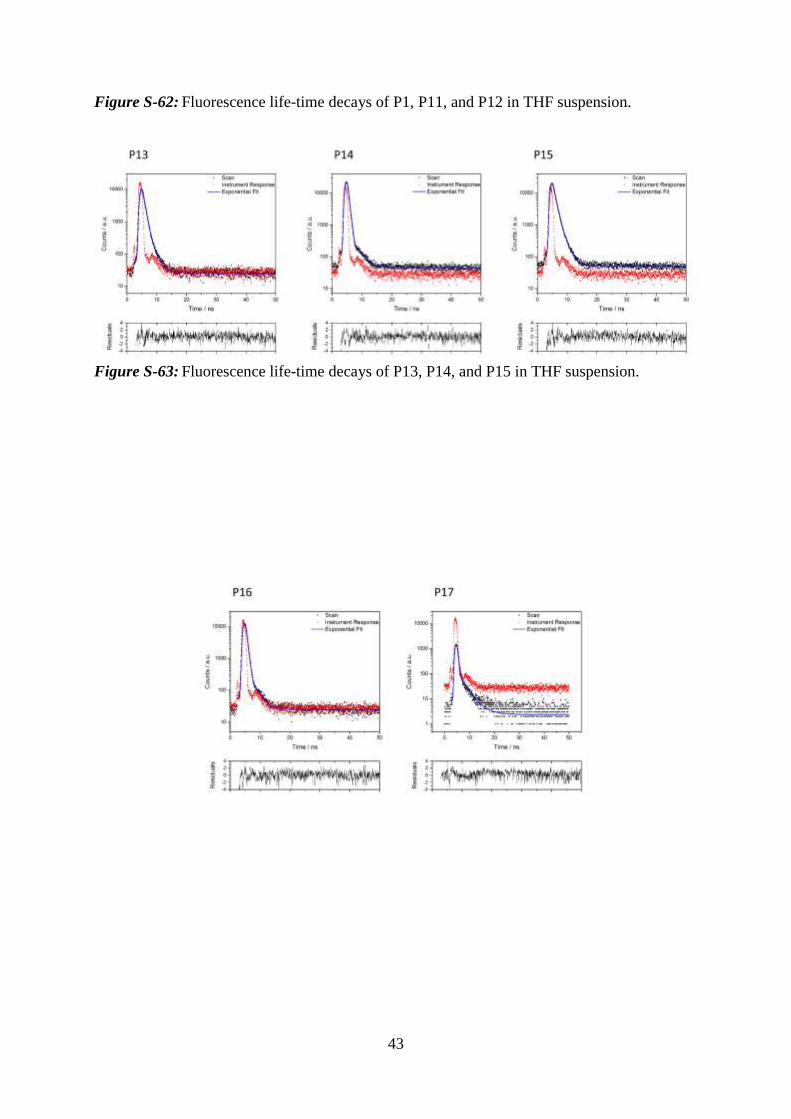
Figure S-63: Fluorescence life-time decays of P13, P14, and P15 in THF suspension.
44
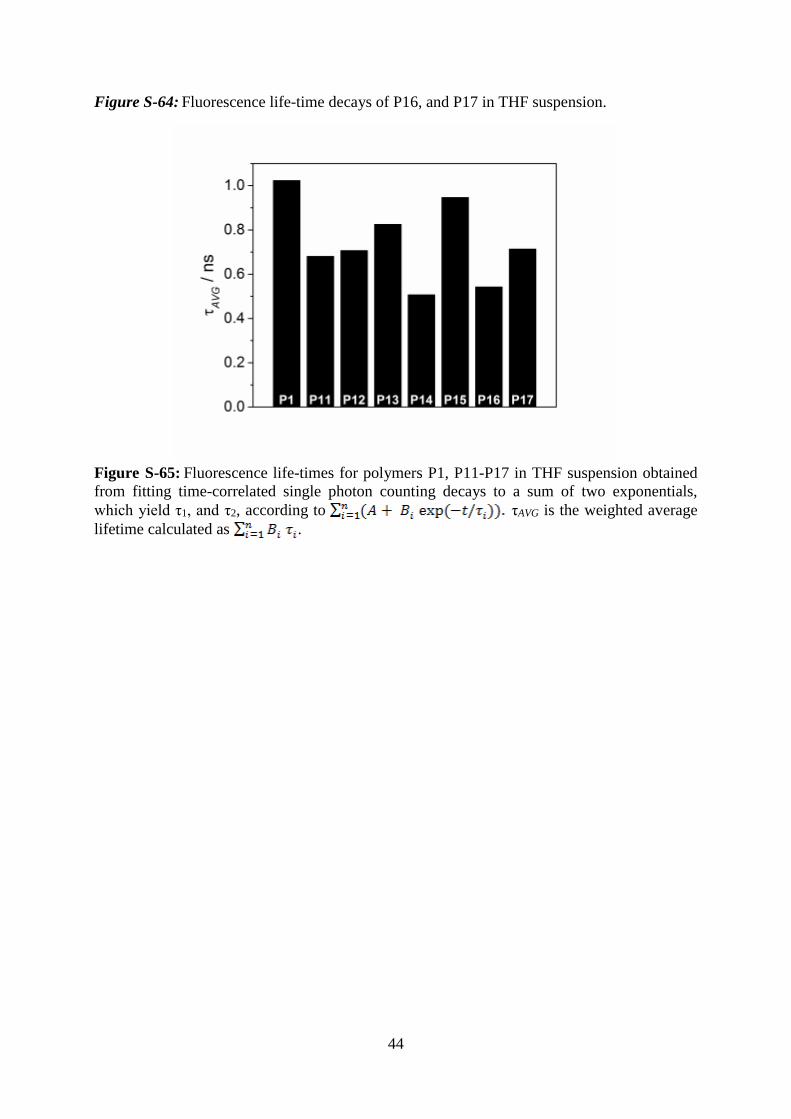
Figure S-64: Fluorescence life-time decays of P16, and P17 in THF suspension.
Figure S-65: Fluorescence life-times for polymers P1, P11-P17 in THF suspension obtained
from fitting time-correlated single photon counting decays to a sum of two exponentials,
which yield τ1, and τ2, according to τAVG is the weighted average
lifetime calculated as .
45
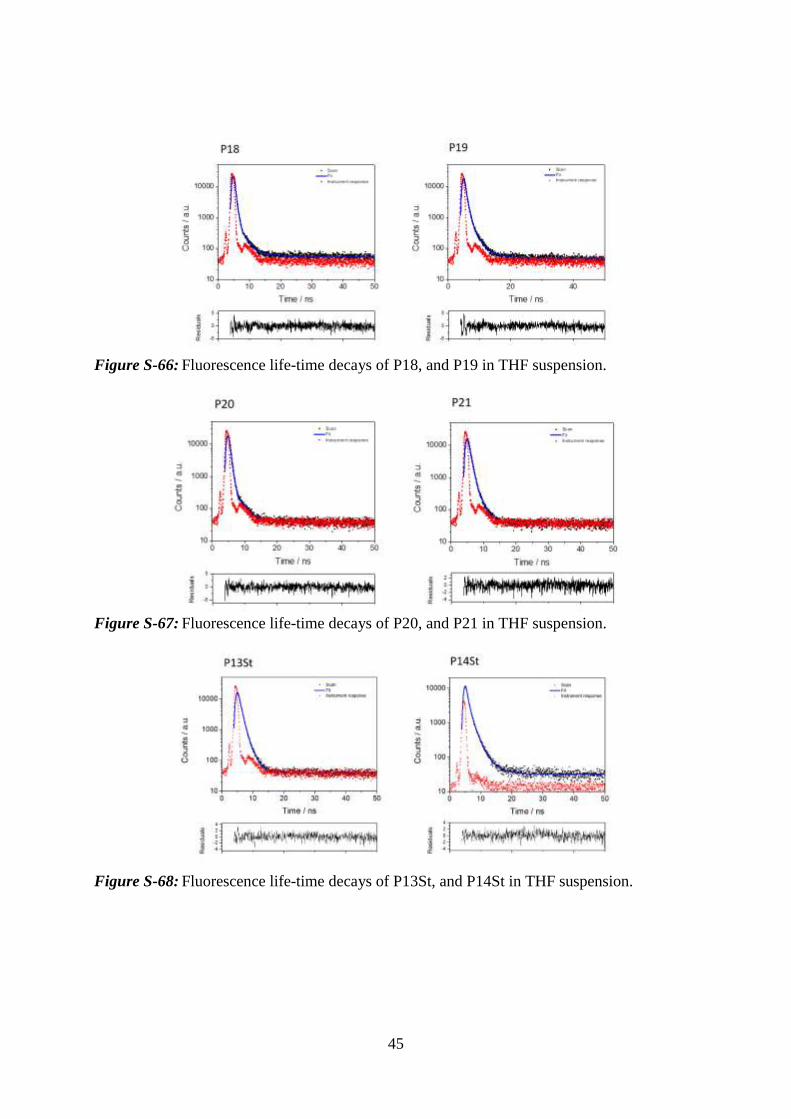
Figure S-66: Fluorescence life-time decays of P18, and P19 in THF suspension.
Figure S-67: Fluorescence life-time decays of P20, and P21 in THF suspension.
Figure S-68: Fluorescence life-time decays of P13St, and P14St in THF suspension.
46
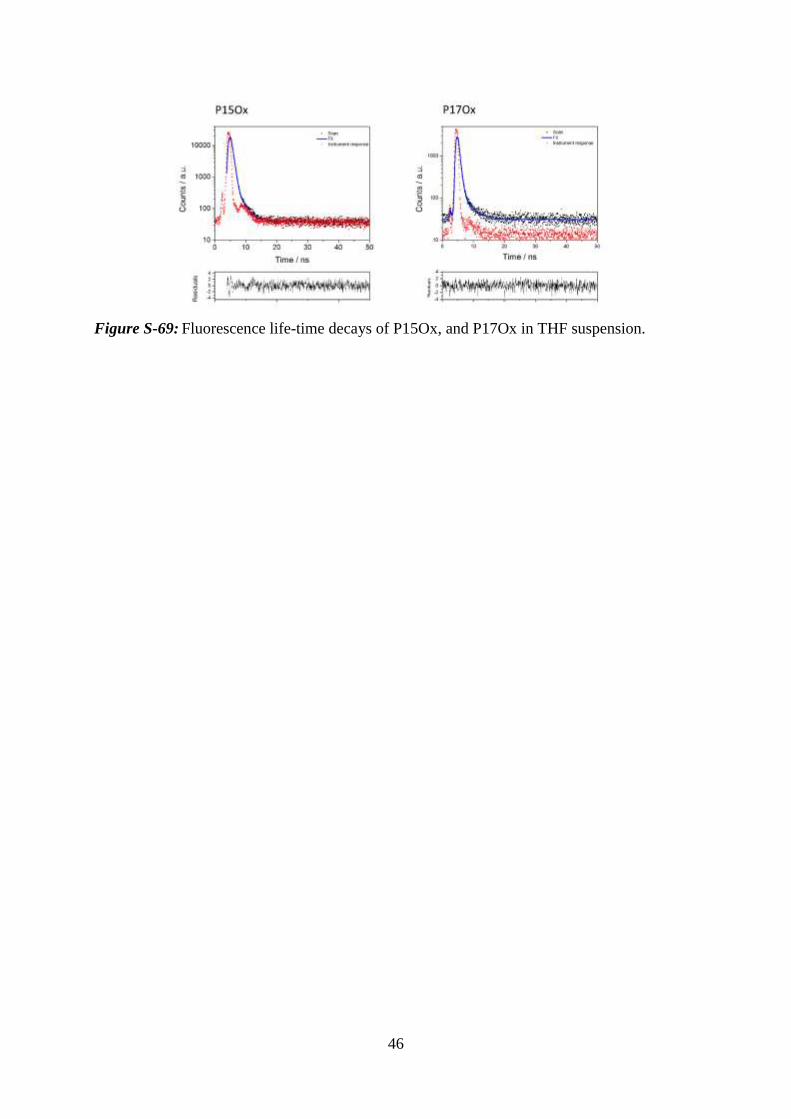
Figure S-69: Fluorescence life-time decays of P15Ox, and P17Ox in THF suspension.
47
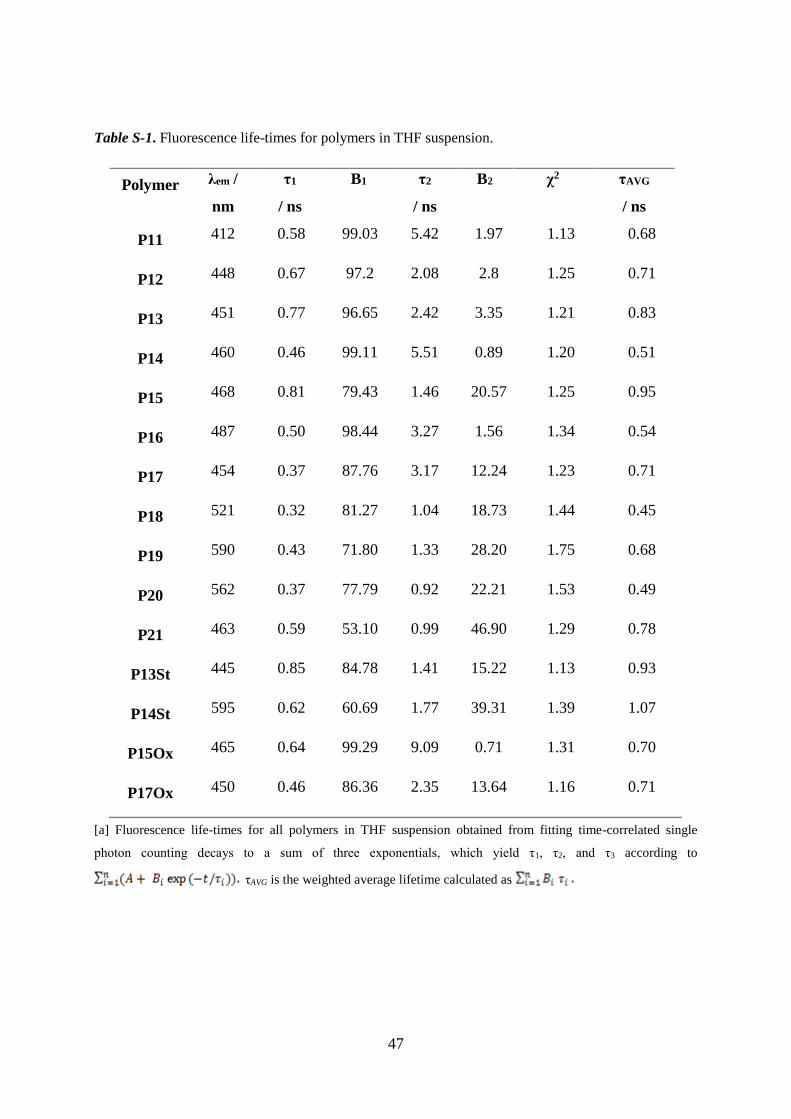
Table S-1. Fluorescence life-times for polymers in THF suspension.
Polymer λem /
nm
τ1
/ ns
B1
τ2
/ ns
B2
χ2 τAVG
/ ns
P11 412 0.58 99.03 5.42 1.97 1.13 0.68
P12 448 0.67 97.2 2.08 2.8 1.25 0.71
P13 451 0.77 96.65 2.42 3.35 1.21 0.83
P14 460 0.46 99.11 5.51 0.89 1.20 0.51
P15 468 0.81 79.43 1.46 20.57 1.25 0.95
P16 487 0.50 98.44 3.27 1.56 1.34 0.54
P17 454 0.37 87.76 3.17 12.24 1.23 0.71
P18 521 0.32 81.27 1.04 18.73 1.44 0.45
P19 590 0.43 71.80 1.33 28.20 1.75 0.68
P20 562 0.37 77.79 0.92 22.21 1.53 0.49
P21 463 0.59 53.10 0.99 46.90 1.29 0.78
P13St 445 0.85 84.78 1.41 15.22 1.13 0.93
P14St 595 0.62 60.69 1.77 39.31 1.39 1.07
P15Ox 465 0.64 99.29 9.09 0.71 1.31 0.70
P17Ox 450 0.46 86.36 2.35 13.64 1.16 0.71
[a] Fluorescence life-times for all polymers in THF suspension obtained from fitting time-correlated single
photon counting decays to a sum of three exponentials, which yield τ1, τ2, and τ3 according to
τAVG is the weighted average lifetime calculated as
48
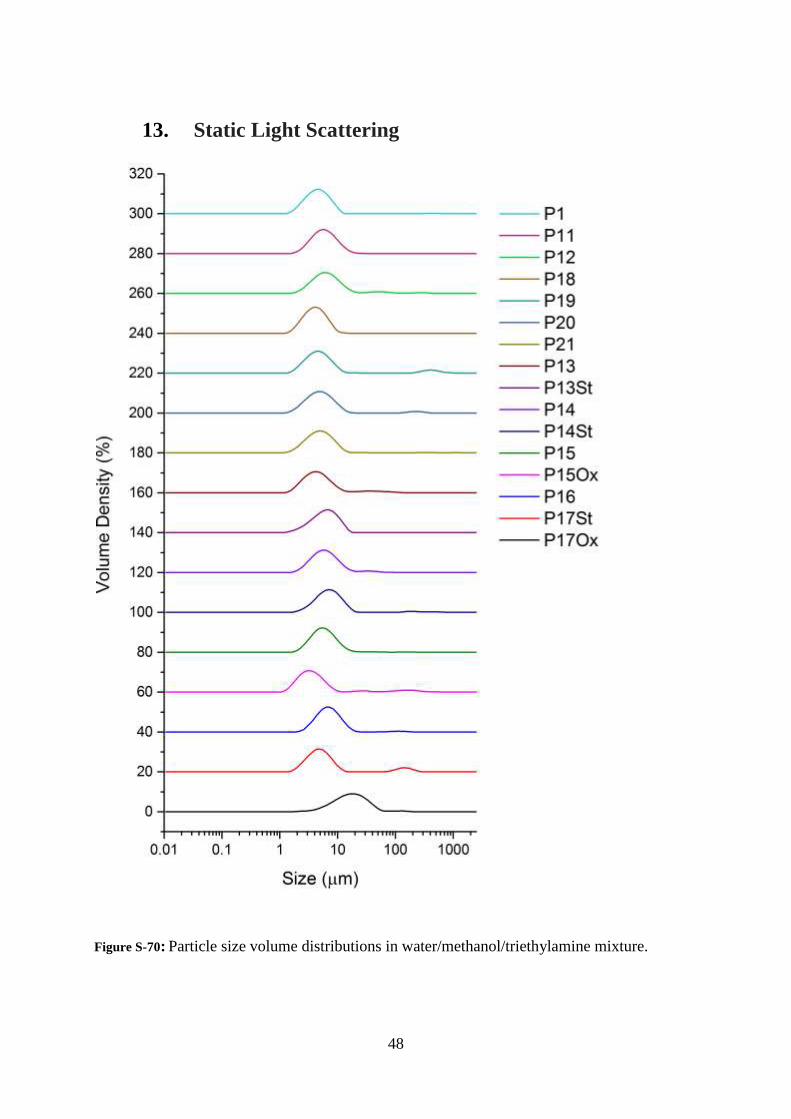
13. Static Light Scattering
Figure S-70: Particle size volume distributions in water/methanol/triethylamine mixture.

49
Table S-2. Surface area weighted mean diameters of particles in water/methanol/triethylamine
mixture.
Polymer Sauter mean diameter
/ µm
P1 4.02
P11 5.16
P12 5.83
P18 3.66
P19 4.52
P20 4.42
P21 4.33
P13 4.15
P13St 5.03
P14 5.37
P14St 6.23
P15 5.15
P15Ox 3.43
P16 6.28
P17 4.77
P17Ox 12.80 [a] Sauter mean diameter, (D[3,2])

50
14. Energy-Dispersive X-Ray Spectroscopy
Table S-3. Energy-dispersive X-ray spectroscopy of P11 to P17.
Polymer Element / wt. %a
C S Br Pd P Sn Fe Cl
P11 88.01
(±2.72)
6.42
(±0.93)
0.99
(±0.49)
0.26
(±0.07)
- - - -
P12 82.35
(±4.80)
9.54
(±3.28)
2.11
(±1.24)
0.25
(±0.13)
- - - -
P13 80.49
(±3.02)
9.98
(±2.93)
0.57
(±0.15)
0.27
(±0.11)
- - - -
P14 82.27
(±1.73)
14.91
(±1.77)
0.56
(±0.06)
0.54
(±0.05)
- - - -
P15 80.82
(±2.87)
14.90
(±3.13)
0.95
(±0.51)
0.24
(±0.06)
- - - -
P16 77.86
(±2.09)
19.89
(±1.74)
0.34
(±0.03)
0.47
(±0.07)
- - - -
P17 76.66
(±7.33)
16.12
(±5.15)
1.93
(±0.80)
1.14
(±0.48)
ND 2.15
(±0.83)
- -
P13St 86.96
(±2.33)
6.07
(±1.39)
1.75
(±0.53)
1.01
(±0.23)
0.46
(±0.32)
0.97
(±0.26)
- -
P14St 83.13
(±7.10)
9.44
(±3.60)
1.31
(±0.66)
1.35
(±0.69)
0.65
(±0.32)
2.87
(±1.53)
- -
P15Ox 72.72
(±4.97)
3.85
(±0.60) - - - -
3.45
(±1.43)
0.22
(±0.17)
P17Ox 75.59
(±6.44)
19.89
(±7.30) - - - -
0.33
(±0.17)
1.94
(±0.80)
[a] Average apparent composition of the sample determined via energy-dispersive X-ray spectroscopy in at least
three points of the sample.
51
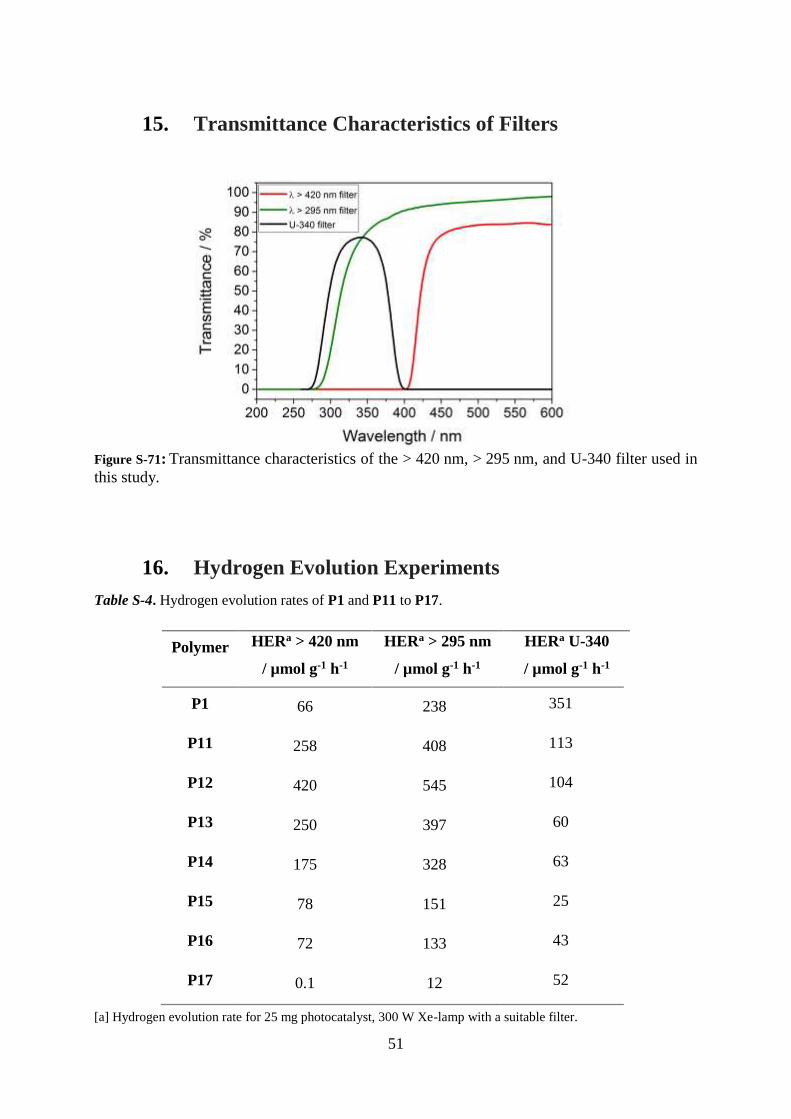
15. Transmittance Characteristics of Filters
Figure S-71: Transmittance characteristics of the > 420 nm, > 295 nm, and U-340 filter used in
this study.
16. Hydrogen Evolution Experiments
Table S-4. Hydrogen evolution rates of P1 and P11 to P17.
Polymer HERa > 420 nm
/ µmol g-1 h-1
HERa > 295 nm
/ µmol g-1 h-1
HERa U-340
/ µmol g-1 h-1
P1 66 238 351
P11 258 408 113
P12 420 545 104
P13 250 397 60
P14 175 328 63
P15 78 151 25
P16 72 133 43
P17 0.1 12 52
[a] Hydrogen evolution rate for 25 mg photocatalyst, 300 W Xe-lamp with a suitable filter.
52
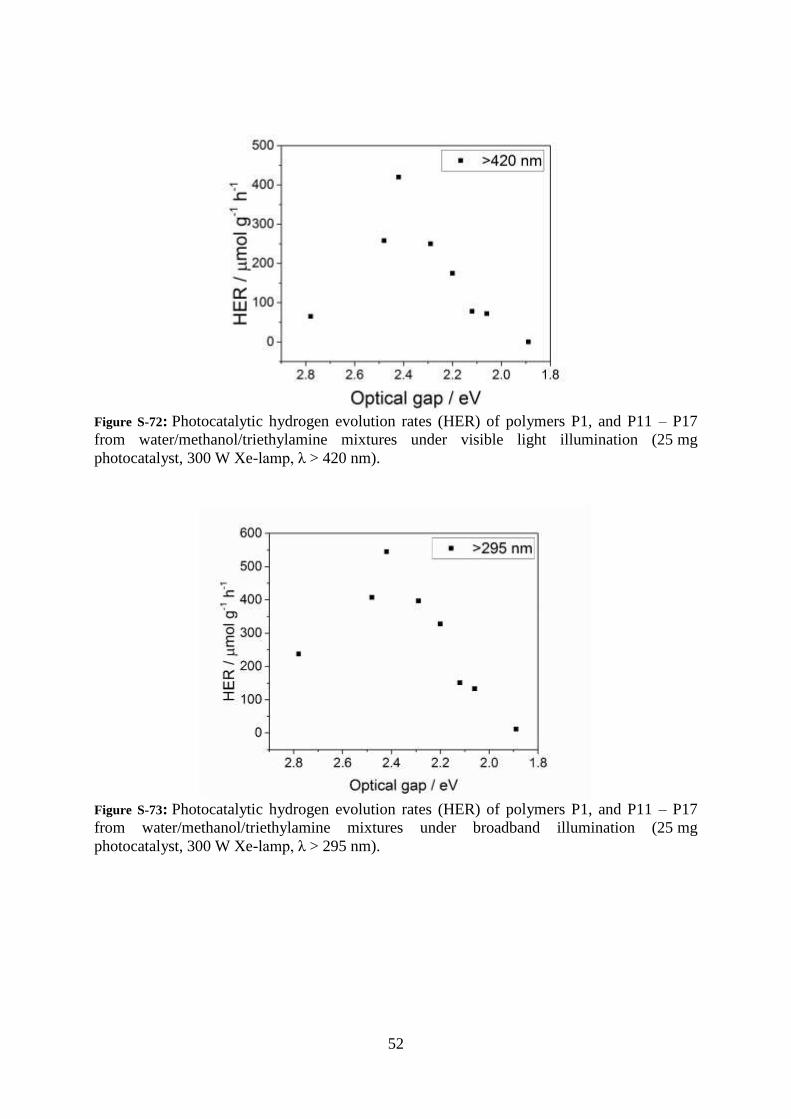
Figure S-72: Photocatalytic hydrogen evolution rates (HER) of polymers P1, and P11 – P17
from water/methanol/triethylamine mixtures under visible light illumination (25 mg
photocatalyst, 300 W Xe-lamp, λ > 420 nm).
Figure S-73: Photocatalytic hydrogen evolution rates (HER) of polymers P1, and P11 – P17
from water/methanol/triethylamine mixtures under broadband illumination (25 mg
photocatalyst, 300 W Xe-lamp, λ > 295 nm).

53
Figure S-74: Photocatalytic hydrogen evolution rates (HER) of polymers P1, and P11 – P17
from water/methanol/triethylamine mixtures under UV light using a U-340 band-pass filter
(25 mg photocatalyst, 300 W Xe-lamp, λ = 270 – 400 nm).
Figure S-75: Transmittance profiles of the band-pass filters used measured with an Oceanoptics
USB2+H15416 spectrometer.
54
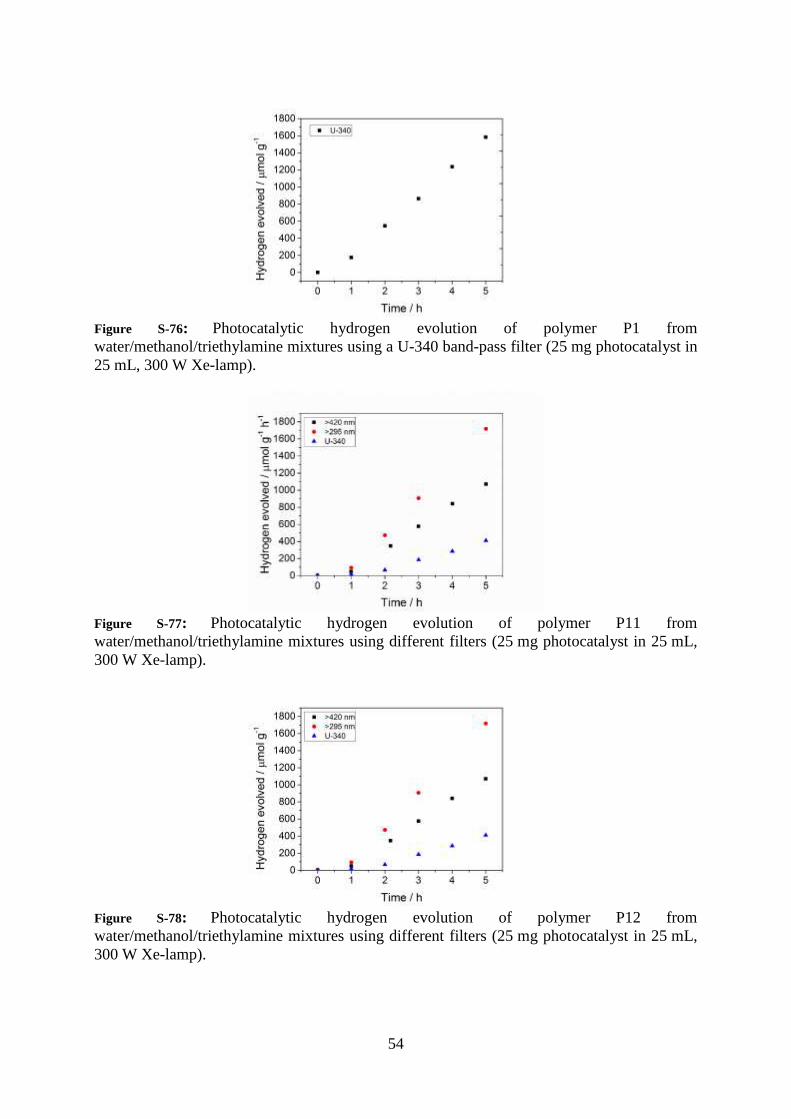
Figure S-76: Photocatalytic hydrogen evolution of polymer P1 from
water/methanol/triethylamine mixtures using a U-340 band-pass filter (25 mg photocatalyst in
25 mL, 300 W Xe-lamp).
Figure S-77: Photocatalytic hydrogen evolution of polymer P11 from
water/methanol/triethylamine mixtures using different filters (25 mg photocatalyst in 25 mL,
300 W Xe-lamp).
Figure S-78: Photocatalytic hydrogen evolution of polymer P12 from
water/methanol/triethylamine mixtures using different filters (25 mg photocatalyst in 25 mL,
300 W Xe-lamp).
55
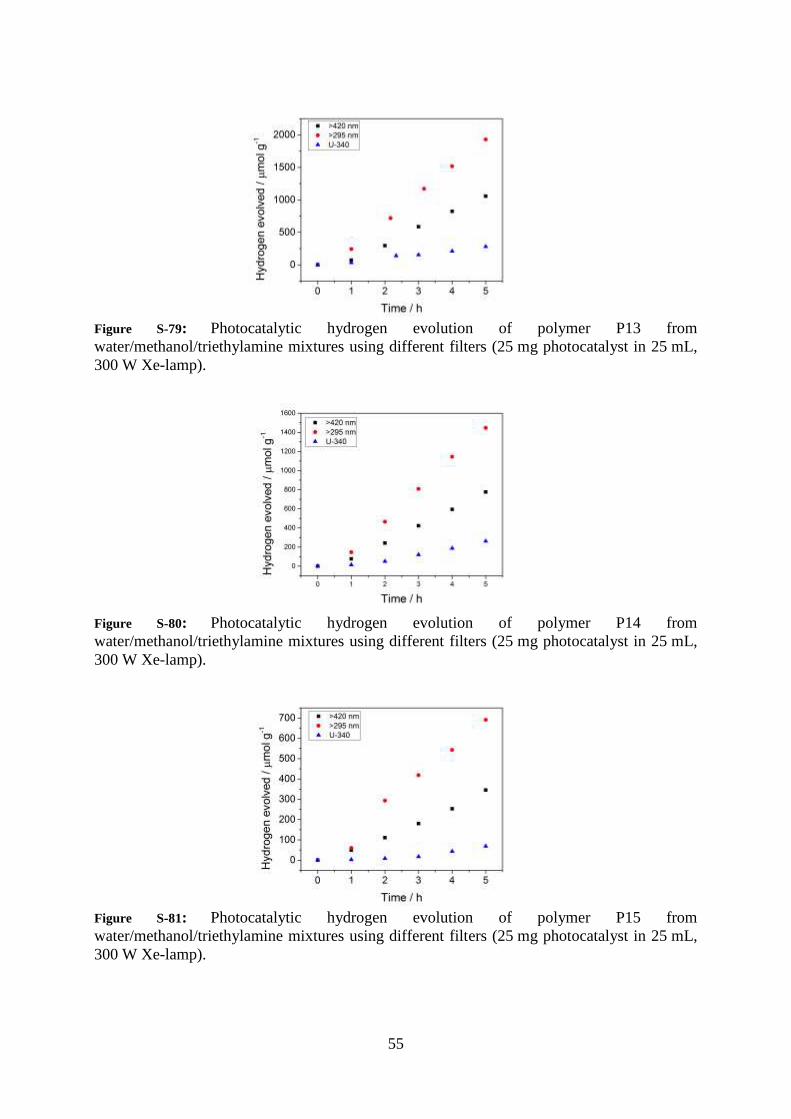
Figure S-79: Photocatalytic hydrogen evolution of polymer P13 from
water/methanol/triethylamine mixtures using different filters (25 mg photocatalyst in 25 mL,
300 W Xe-lamp).
Figure S-80: Photocatalytic hydrogen evolution of polymer P14 from
water/methanol/triethylamine mixtures using different filters (25 mg photocatalyst in 25 mL,
300 W Xe-lamp).
Figure S-81: Photocatalytic hydrogen evolution of polymer P15 from
water/methanol/triethylamine mixtures using different filters (25 mg photocatalyst in 25 mL,
300 W Xe-lamp).
56
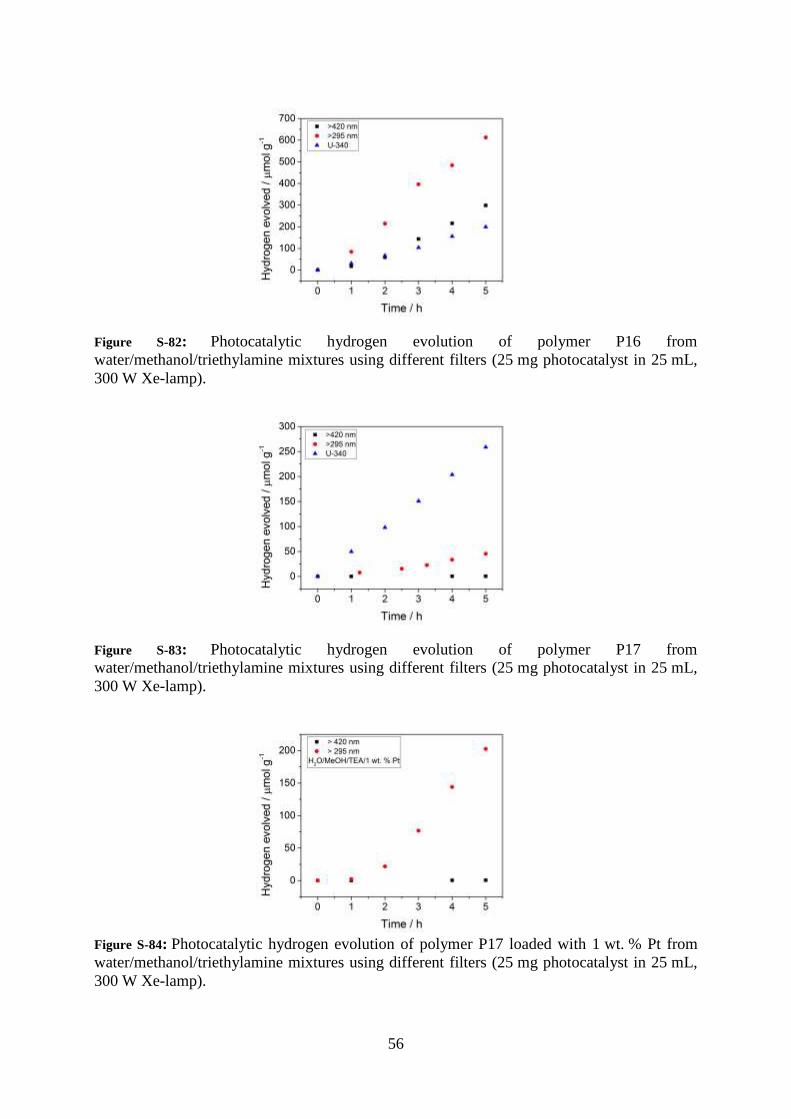
Figure S-82: Photocatalytic hydrogen evolution of polymer P16 from
water/methanol/triethylamine mixtures using different filters (25 mg photocatalyst in 25 mL,
300 W Xe-lamp).
Figure S-83: Photocatalytic hydrogen evolution of polymer P17 from
water/methanol/triethylamine mixtures using different filters (25 mg photocatalyst in 25 mL,
300 W Xe-lamp).
Figure S-84: Photocatalytic hydrogen evolution of polymer P17 loaded with 1 wt. % Pt from
water/methanol/triethylamine mixtures using different filters (25 mg photocatalyst in 25 mL,
300 W Xe-lamp).
57
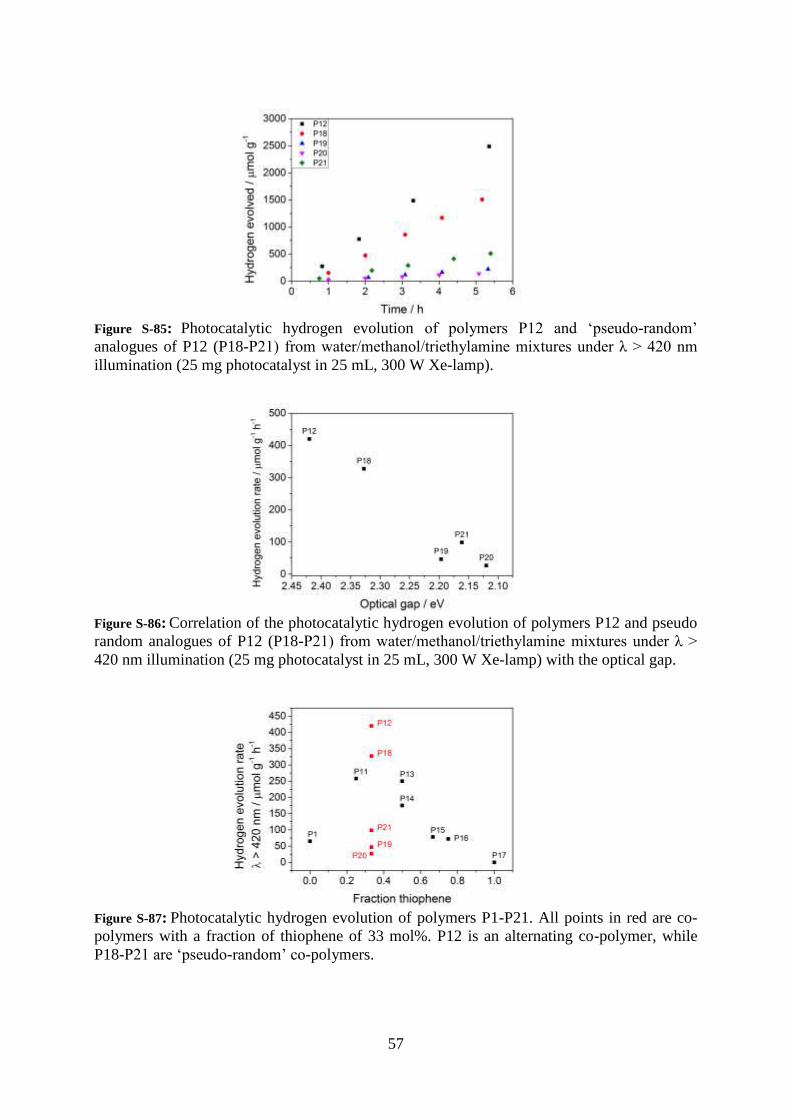
Figure S-85: Photocatalytic hydrogen evolution of polymers P12 and ‘pseudo-random’
analogues of P12 (P18-P21) from water/methanol/triethylamine mixtures under λ > 420 nm
illumination (25 mg photocatalyst in 25 mL, 300 W Xe-lamp).
Figure S-86: Correlation of the photocatalytic hydrogen evolution of polymers P12 and pseudo
random analogues of P12 (P18-P21) from water/methanol/triethylamine mixtures under λ >
420 nm illumination (25 mg photocatalyst in 25 mL, 300 W Xe-lamp) with the optical gap.
Figure S-87: Photocatalytic hydrogen evolution of polymers P1-P21. All points in red are co-
polymers with a fraction of thiophene of 33 mol%. P12 is an alternating co-polymer, while
P18-P21 are ‘pseudo-random’ co-polymers.
58
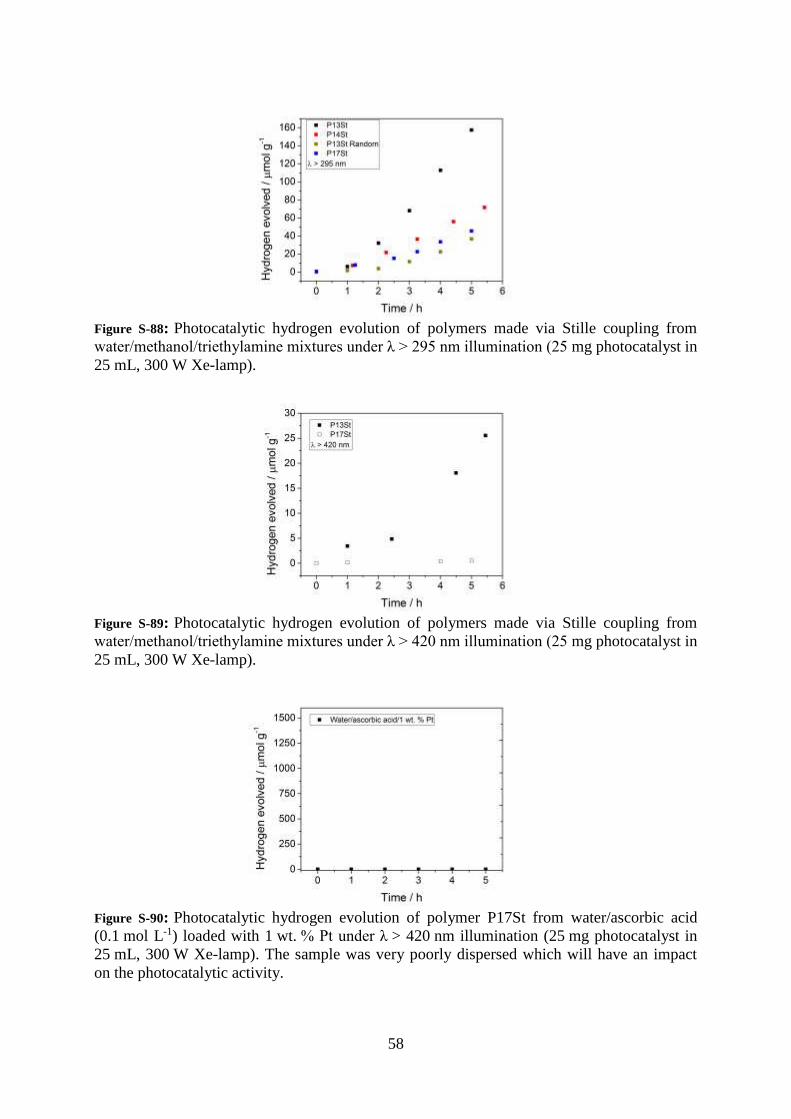
Figure S-88: Photocatalytic hydrogen evolution of polymers made via Stille coupling from
water/methanol/triethylamine mixtures under λ > 295 nm illumination (25 mg photocatalyst in
25 mL, 300 W Xe-lamp).
Figure S-89: Photocatalytic hydrogen evolution of polymers made via Stille coupling from
water/methanol/triethylamine mixtures under λ > 420 nm illumination (25 mg photocatalyst in
25 mL, 300 W Xe-lamp).
Figure S-90: Photocatalytic hydrogen evolution of polymer P17St from water/ascorbic acid
(0.1 mol L-1) loaded with 1 wt. % Pt under λ > 420 nm illumination (25 mg photocatalyst in
25 mL, 300 W Xe-lamp). The sample was very poorly dispersed which will have an impact
on the photocatalytic activity.
59
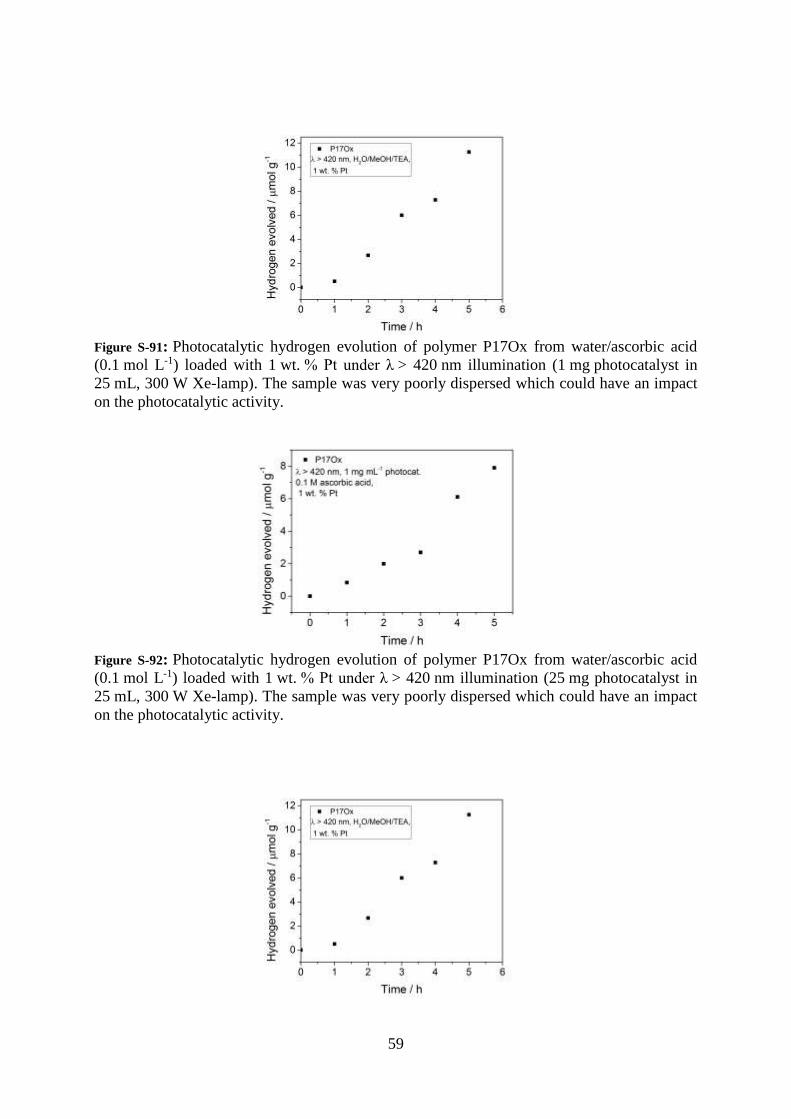
Figure S-91: Photocatalytic hydrogen evolution of polymer P17Ox from water/ascorbic acid
(0.1 mol L-1) loaded with 1 wt. % Pt under λ > 420 nm illumination (1 mg photocatalyst in
25 mL, 300 W Xe-lamp). The sample was very poorly dispersed which could have an impact
on the photocatalytic activity.
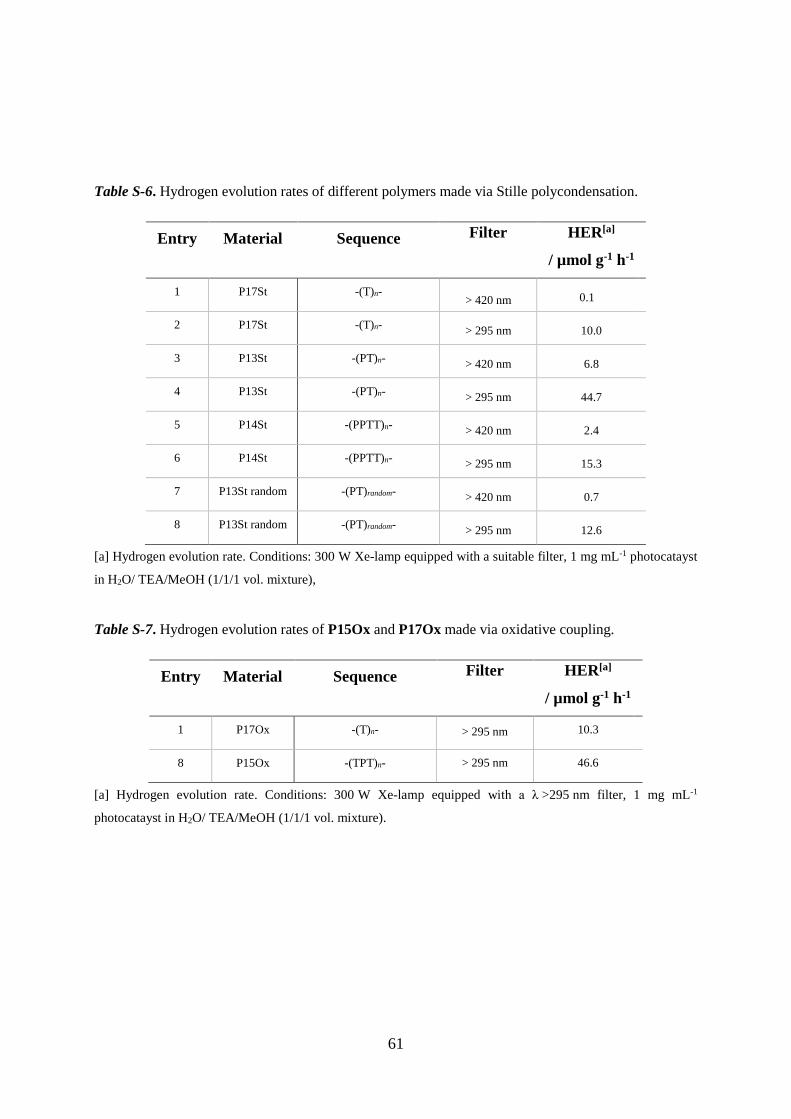
Figure S-92: Photocatalytic hydrogen evolution of polymer P17Ox from water/ascorbic acid
(0.1 mol L-1) loaded with 1 wt. % Pt under λ > 420 nm illumination (25 mg photocatalyst in
25 mL, 300 W Xe-lamp). The sample was very poorly dispersed which could have an impact
on the photocatalytic activity.
60
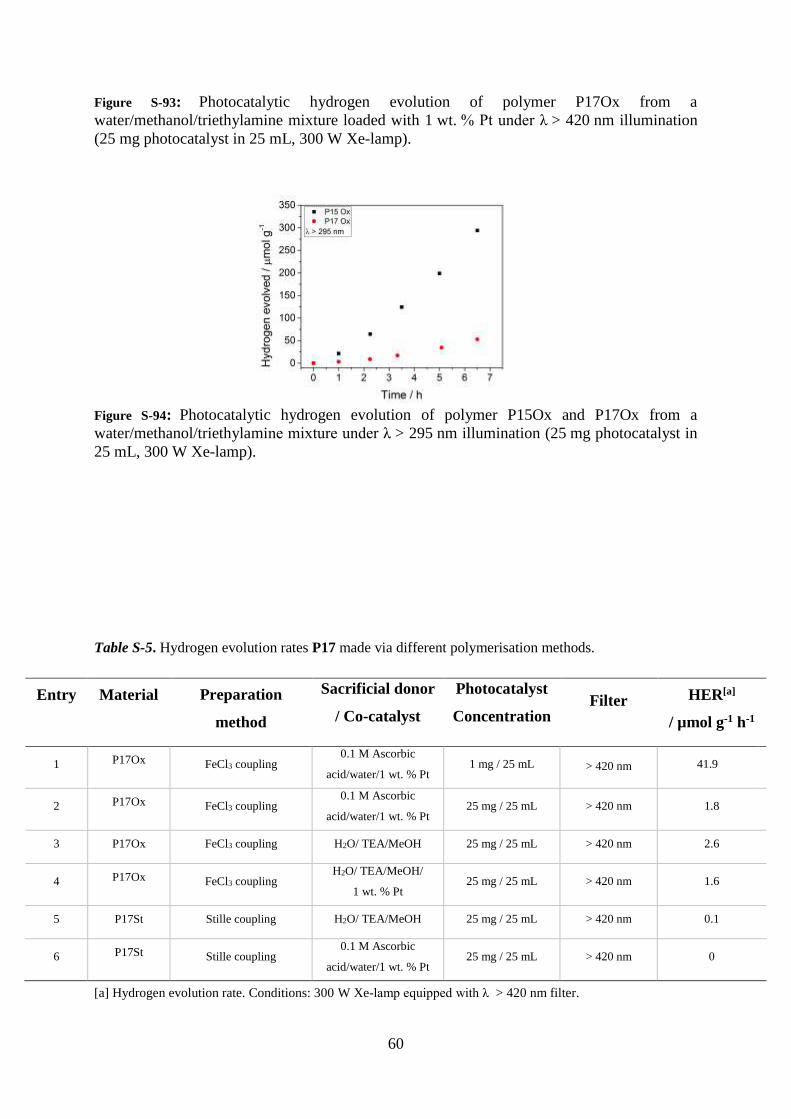
Figure S-93: Photocatalytic hydrogen evolution of polymer P17Ox from a
water/methanol/triethylamine mixture loaded with 1 wt. % Pt under λ > 420 nm illumination
(25 mg photocatalyst in 25 mL, 300 W Xe-lamp).
Figure S-94: Photocatalytic hydrogen evolution of polymer P15Ox and P17Ox from a
water/methanol/triethylamine mixture under λ > 295 nm illumination (25 mg photocatalyst in
25 mL, 300 W Xe-lamp).
Table S-5. Hydrogen evolution rates P17 made via different polymerisation methods.
Entry Material Preparation
method
Sacrificial donor
/ Co-catalyst
Photocatalyst
Concentration Filter
HER[a]
/ µmol g-1 h-1
1 P17Ox FeCl3 coupling 0.1 M Ascorbic
acid/water/1 wt. % Pt 1 mg / 25 mL > 420 nm 41.9
2 P17Ox FeCl3 coupling 0.1 M Ascorbic
acid/water/1 wt. % Pt 25 mg / 25 mL > 420 nm 1.8
3 P17Ox FeCl3 coupling H2O/ TEA/MeOH 25 mg / 25 mL > 420 nm 2.6
4 P17Ox FeCl3 coupling H2O/ TEA/MeOH/
1 wt. % Pt 25 mg / 25 mL > 420 nm 1.6
5 P17St Stille coupling H2O/ TEA/MeOH 25 mg / 25 mL > 420 nm 0.1
6 P17St Stille coupling 0.1 M Ascorbic
acid/water/1 wt. % Pt 25 mg / 25 mL > 420 nm 0
[a] Hydrogen evolution rate. Conditions: 300 W Xe-lamp equipped with λ > 420 nm filter.
61
Table S-6. Hydrogen evolution rates of different polymers made via Stille polycondensation.
Entry Material Sequence Filter
HER[a]
/ µmol g-1 h-1
1 P17St -(T)n- > 420 nm 0.1
2 P17St -(T)n- > 295 nm 10.0
3 P13St -(PT)n- > 420 nm 6.8
4 P13St -(PT)n- > 295 nm 44.7
5 P14St -(PPTT)n- > 420 nm 2.4
6 P14St -(PPTT)n- > 295 nm 15.3
7 P13St random -(PT)random- > 420 nm 0.7
8 P13St random -(PT)random- > 295 nm 12.6
[a] Hydrogen evolution rate. Conditions: 300 W Xe-lamp equipped with a suitable filter, 1 mg mL-1 photocatayst
in H2O/ TEA/MeOH (1/1/1 vol. mixture),
Table S-7. Hydrogen evolution rates of P15Ox and P17Ox made via oxidative coupling.
Entry Material Sequence Filter
HER[a]
/ µmol g-1 h-1
1 P17Ox -(T)n- > 295 nm 10.3
8 P15Ox -(TPT)n- > 295 nm 46.6
[a] Hydrogen evolution rate. Conditions: 300 W Xe-lamp equipped with a λ >295 nm filter, 1 mg mL-1
photocatayst in H2O/ TEA/MeOH (1/1/1 vol. mixture).
62
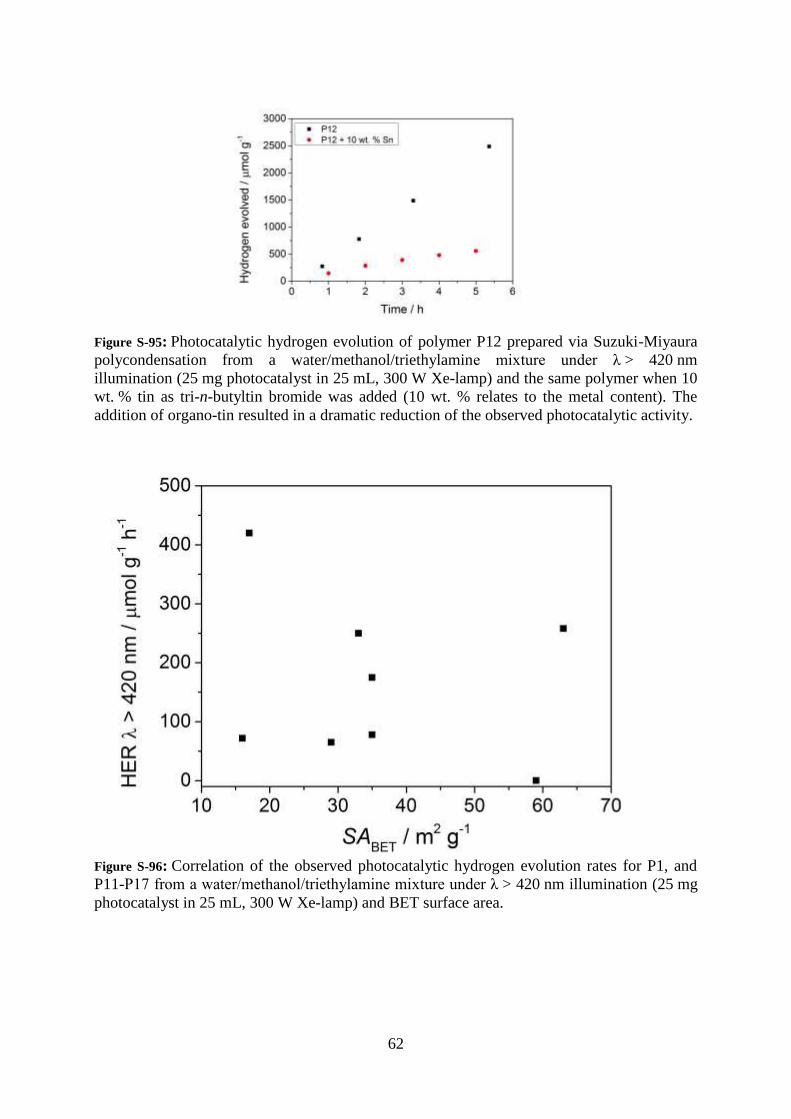
Figure S-95: Photocatalytic hydrogen evolution of polymer P12 prepared via Suzuki-Miyaura
polycondensation from a water/methanol/triethylamine mixture under λ > 420 nm
illumination (25 mg photocatalyst in 25 mL, 300 W Xe-lamp) and the same polymer when 10
wt. % tin as tri-n-butyltin bromide was added (10 wt. % relates to the metal content). The
addition of organo-tin resulted in a dramatic reduction of the observed photocatalytic activity.
Figure S-96: Correlation of the observed photocatalytic hydrogen evolution rates for P1, and
P11-P17 from a water/methanol/triethylamine mixture under λ > 420 nm illumination (25 mg
photocatalyst in 25 mL, 300 W Xe-lamp) and BET surface area.
63
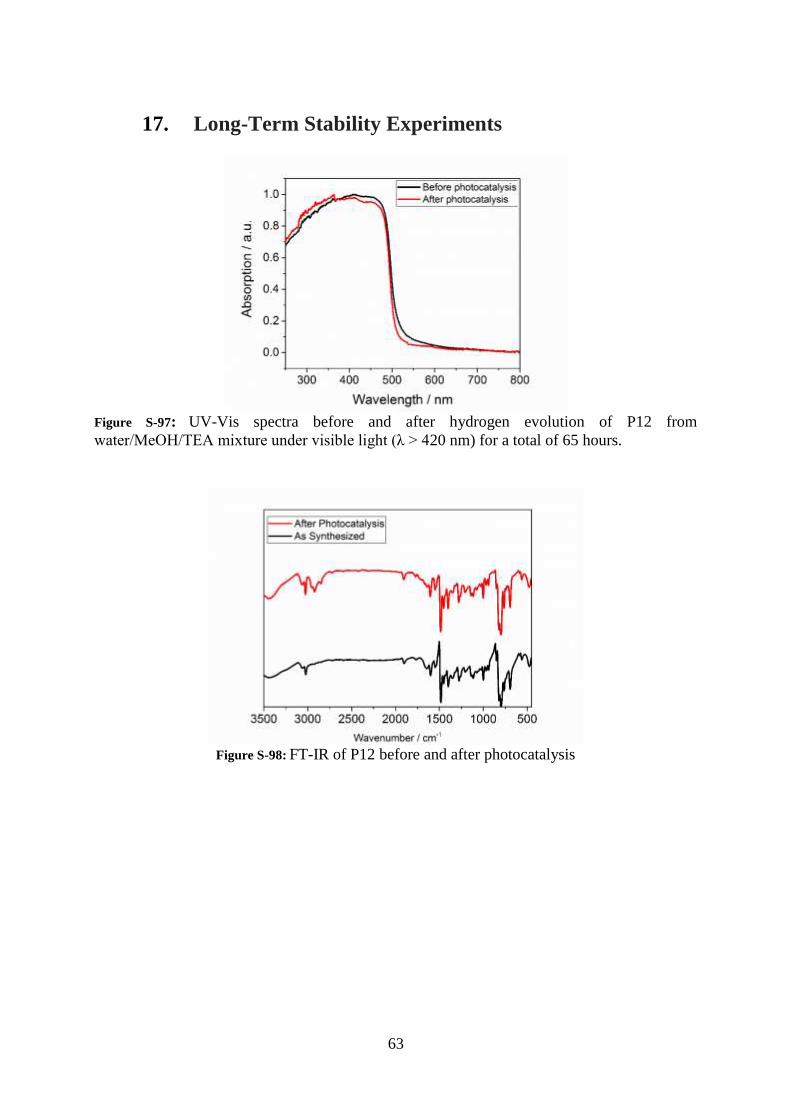
17. Long-Term Stability Experiments
Figure S-97: UV-Vis spectra before and after hydrogen evolution of P12 from
water/MeOH/TEA mixture under visible light (λ > 420 nm) for a total of 65 hours.
Figure S-98: FT-IR of P12 before and after photocatalysis
64
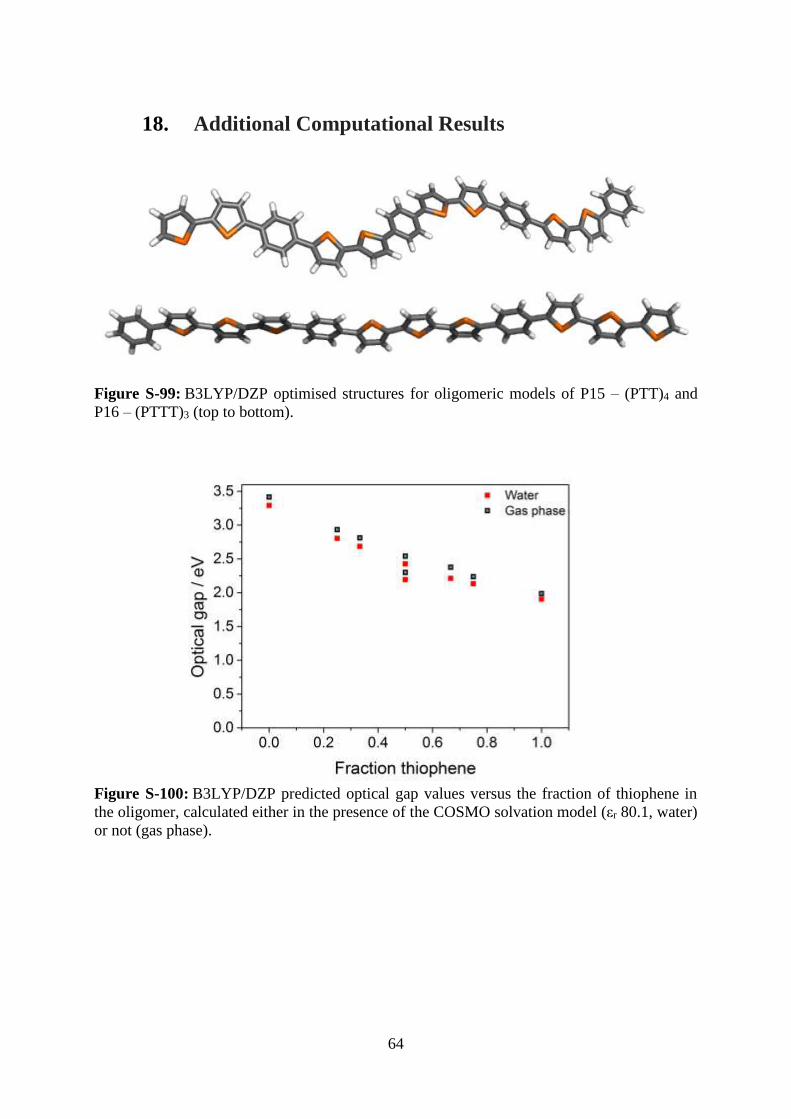
18. Additional Computational Results
Figure S-99: B3LYP/DZP optimised structures for oligomeric models of P15 – (PTT)4 and
P16 – (PTTT)3 (top to bottom).
Figure S-100: B3LYP/DZP predicted optical gap values versus the fraction of thiophene in
the oligomer, calculated either in the presence of the COSMO solvation model (εr 80.1, water)
or not (gas phase).

65
Figure S-101: TD-B3LYP/DZP predicted spectra of P13, modelled as (PT)6 oligomer,
calculated either in the presence of the COSMO solvation model (εr 80.1, water) or not (gas
phase).
(Solution) potentials: We calculate the adiabatic IP, EA, IP*, and EA* potentials of the
oligomer model P containing twelve phenylene equivalent units (e.g. P12, T12 and (PT)6) from
the Gibbs free energy difference (ΔGr) of the following four redox half-reactions, written, in
line with convention, as reductions:
P+ + e- -> P (1)
P + e- -> P- (2)
P+ + e- -> P* (3)
P* + e- -> P- (4)
where P-, P+, and P* are the polymer with an excess electron, hole and (singlet) exciton,
respectively. The corresponding half-reactions for the solution reactions can be found in table
S-7 below.
These calculated ΔGr values are converted to reduction potentials E via:
ΔGr = -nFE (5)
Here F is the Faraday constant and n the number of electrons taking part in the half-reaction.
In our calculations on oligomers, we furthermore equate ΔGr to the total energy difference,
neglecting the vibrational, translational and rotational contribution to the free energy. In
previous work[5] on oligomers of P1, this was found to be a generally good approximation
because of the relative similarity of the structures of P+, P−, P*, and P. For the solution half-
reactions in contrast all contributions to the free energy are explicitly taken into account.
The calculated potential values are converted from the vacuum scale to that corresponding to
the standard hydrogen electrode (SHE) by shifting them by the experimentally obtained value
of the SHE absolute potential (SHEAP). A range of experimental SHEAP values have been
proposed in the literature, something that is partly related to different possible choices for
thermodynamic standard states ansd partly due to extra-thermodynamic assumptions. Here we
use, in line with our previous work, the original IUPAC proposed value of 4.44 V.[6] The
66
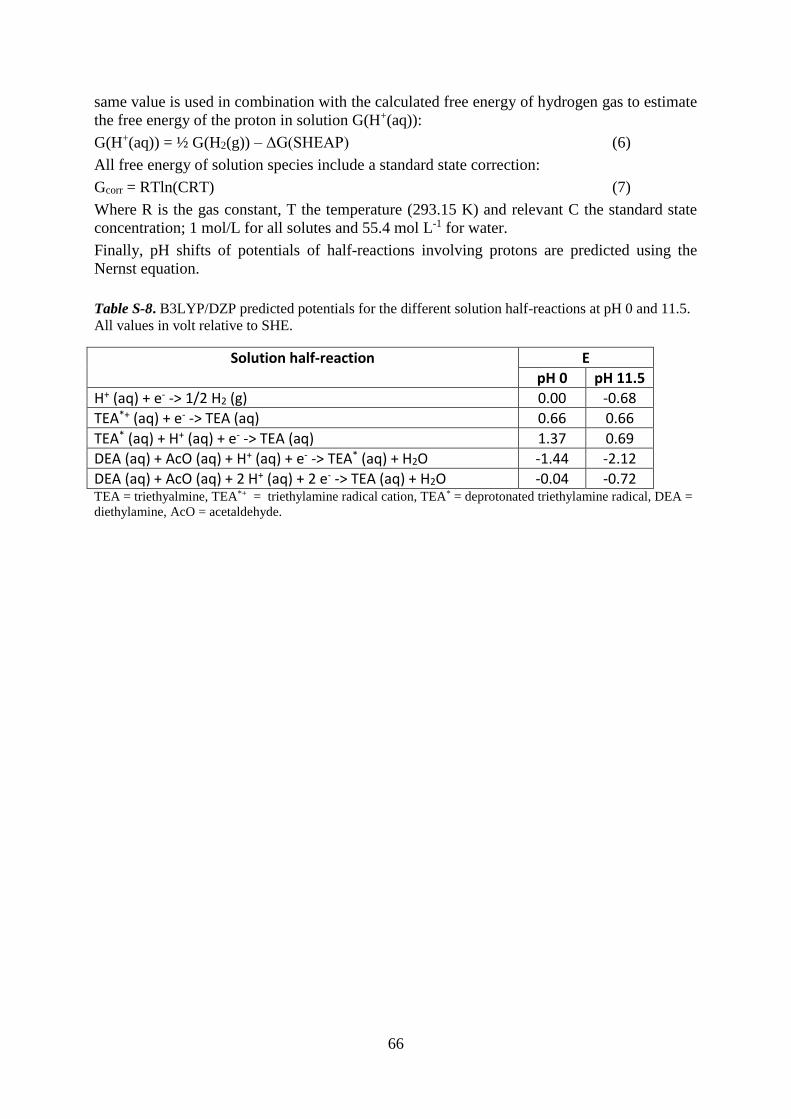
same value is used in combination with the calculated free energy of hydrogen gas to estimate
the free energy of the proton in solution G(H+(aq)):
G(H+(aq)) = ½ G(H2(g)) – ΔG(SHEAP) (6)
All free energy of solution species include a standard state correction:
Gcorr = RTln(CRT) (7)
Where R is the gas constant, T the temperature (293.15 K) and relevant C the standard state
concentration; 1 mol/L for all solutes and 55.4 mol L-1 for water.
Finally, pH shifts of potentials of half-reactions involving protons are predicted using the
Nernst equation.
Table S-8. B3LYP/DZP predicted potentials for the different solution half-reactions at pH 0 and 11.5.
All values in volt relative to SHE.
Solution half-reaction E
pH 0 pH 11.5
H+ (aq) + e- -> 1/2 H2 (g) 0.00 -0.68
TEA*+ (aq) + e- -> TEA (aq) 0.66 0.66
TEA* (aq) + H+ (aq) + e- -> TEA (aq) 1.37 0.69
DEA (aq) + AcO (aq) + H+ (aq) + e- -> TEA* (aq) + H2O -1.44 -2.12
DEA (aq) + AcO (aq) + 2 H+ (aq) + 2 e- -> TEA (aq) + H2O -0.04 -0.72 TEA = triethyalmine, TEA*+ = triethylamine radical cation, TEA* = deprotonated triethylamine radical, DEA =
diethylamine, AcO = acetaldehyde.
67
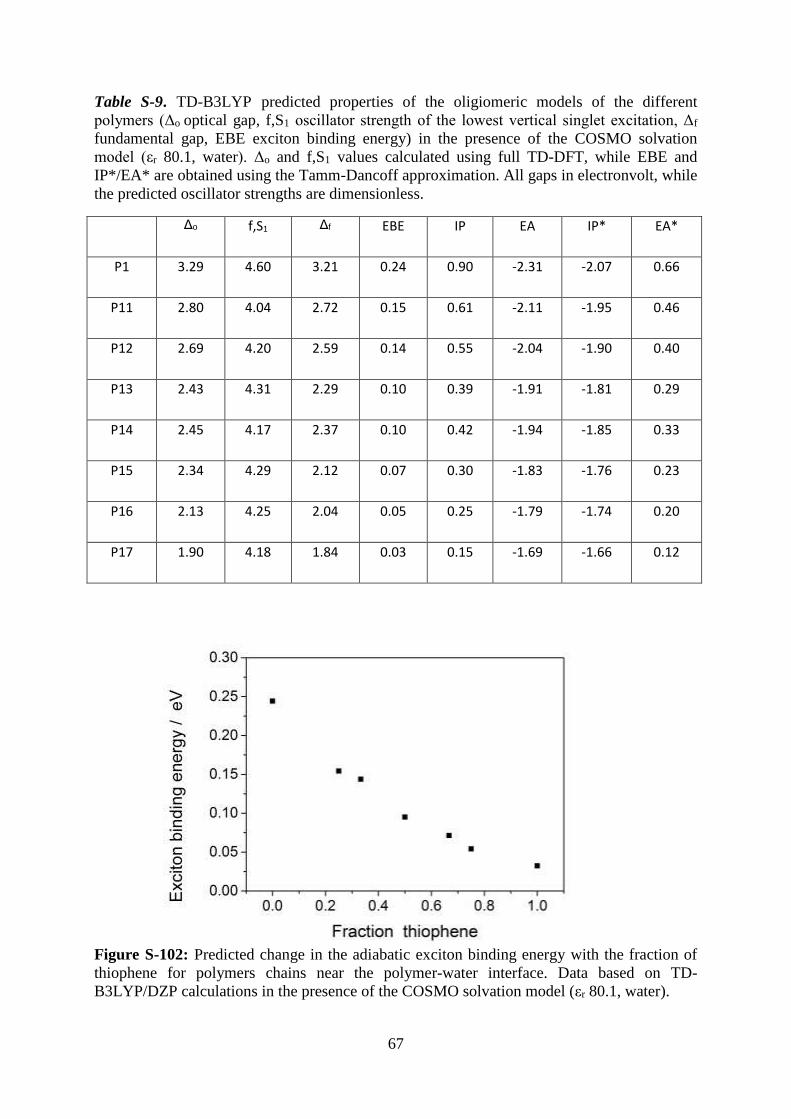
Table S-9. TD-B3LYP predicted properties of the oligiomeric models of the different
polymers (Δo optical gap, f,S1 oscillator strength of the lowest vertical singlet excitation, Δf
fundamental gap, EBE exciton binding energy) in the presence of the COSMO solvation
model (εr 80.1, water). Δo and f,S1 values calculated using full TD-DFT, while EBE and
IP*/EA* are obtained using the Tamm-Dancoff approximation. All gaps in electronvolt, while
the predicted oscillator strengths are dimensionless.
Δo f,S1 Δf EBE IP EA IP* EA*
P1 3.29 4.60 3.21 0.24 0.90 -2.31 -2.07 0.66
P11 2.80 4.04 2.72 0.15 0.61 -2.11 -1.95 0.46
P12 2.69 4.20 2.59 0.14 0.55 -2.04 -1.90 0.40
P13 2.43 4.31 2.29 0.10 0.39 -1.91 -1.81 0.29
P14 2.45 4.17 2.37 0.10 0.42 -1.94 -1.85 0.33
P15 2.34 4.29 2.12 0.07 0.30 -1.83 -1.76 0.23
P16 2.13 4.25 2.04 0.05 0.25 -1.79 -1.74 0.20
P17 1.90 4.18 1.84 0.03 0.15 -1.69 -1.66 0.12
Figure S-102: Predicted change in the adiabatic exciton binding energy with the fraction of
thiophene for polymers chains near the polymer-water interface. Data based on TD-
B3LYP/DZP calculations in the presence of the COSMO solvation model (εr 80.1, water).
68
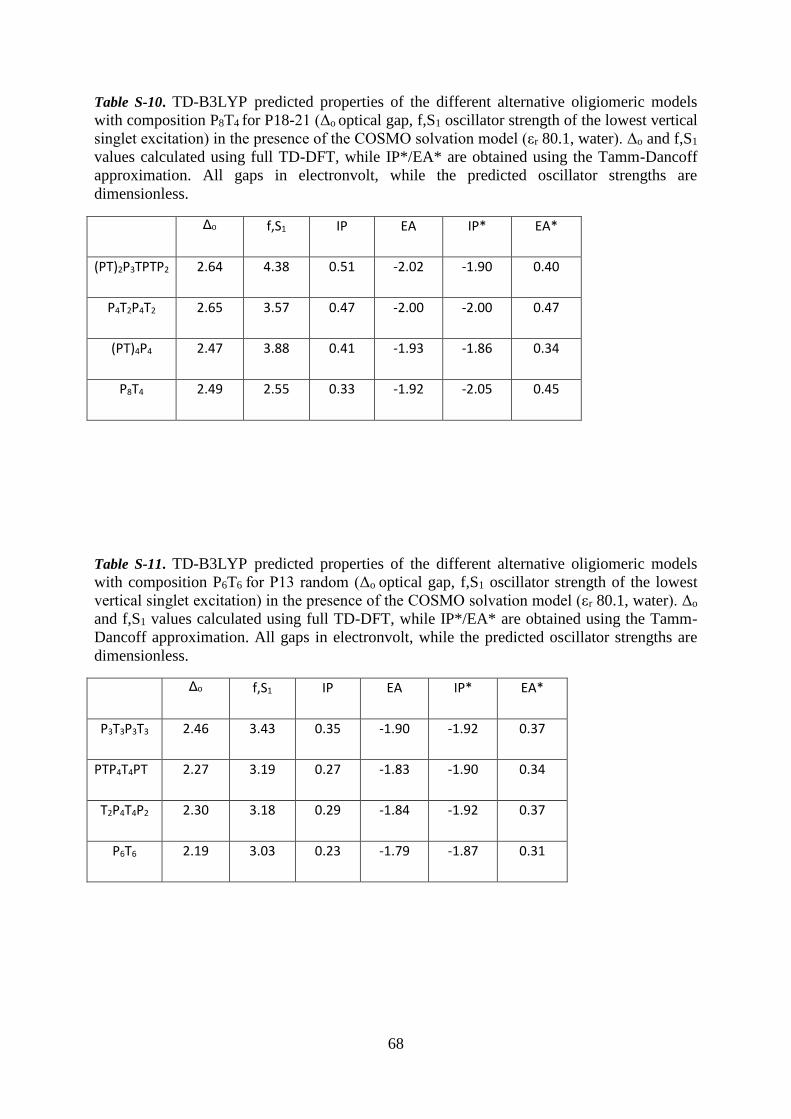
Table S-10. TD-B3LYP predicted properties of the different alternative oligiomeric models
with composition P8T4 for P18-21 (Δo optical gap, f,S1 oscillator strength of the lowest vertical
singlet excitation) in the presence of the COSMO solvation model (εr 80.1, water). Δo and f,S1
values calculated using full TD-DFT, while IP*/EA* are obtained using the Tamm-Dancoff
approximation. All gaps in electronvolt, while the predicted oscillator strengths are
dimensionless.
Δo f,S1 IP EA IP* EA*
(PT)2P3TPTP2 2.64 4.38 0.51 -2.02 -1.90 0.40
P4T2P4T2 2.65 3.57 0.47 -2.00 -2.00 0.47
(PT)4P4 2.47 3.88 0.41 -1.93 -1.86 0.34
P8T4 2.49 2.55 0.33 -1.92 -2.05 0.45
Table S-11. TD-B3LYP predicted properties of the different alternative oligiomeric models
with composition P6T6 for P13 random (Δo optical gap, f,S1 oscillator strength of the lowest
vertical singlet excitation) in the presence of the COSMO solvation model (εr 80.1, water). Δo
and f,S1 values calculated using full TD-DFT, while IP*/EA* are obtained using the Tamm-
Dancoff approximation. All gaps in electronvolt, while the predicted oscillator strengths are
dimensionless.
Δo f,S1 IP EA IP* EA*
P3T3P3T3 2.46 3.43 0.35 -1.90 -1.92 0.37
PTP4T4PT 2.27 3.19 0.27 -1.83 -1.90 0.34
T2P4T4P2 2.30 3.18 0.29 -1.84 -1.92 0.37
P6T6 2.19 3.03 0.23 -1.79 -1.87 0.31
69
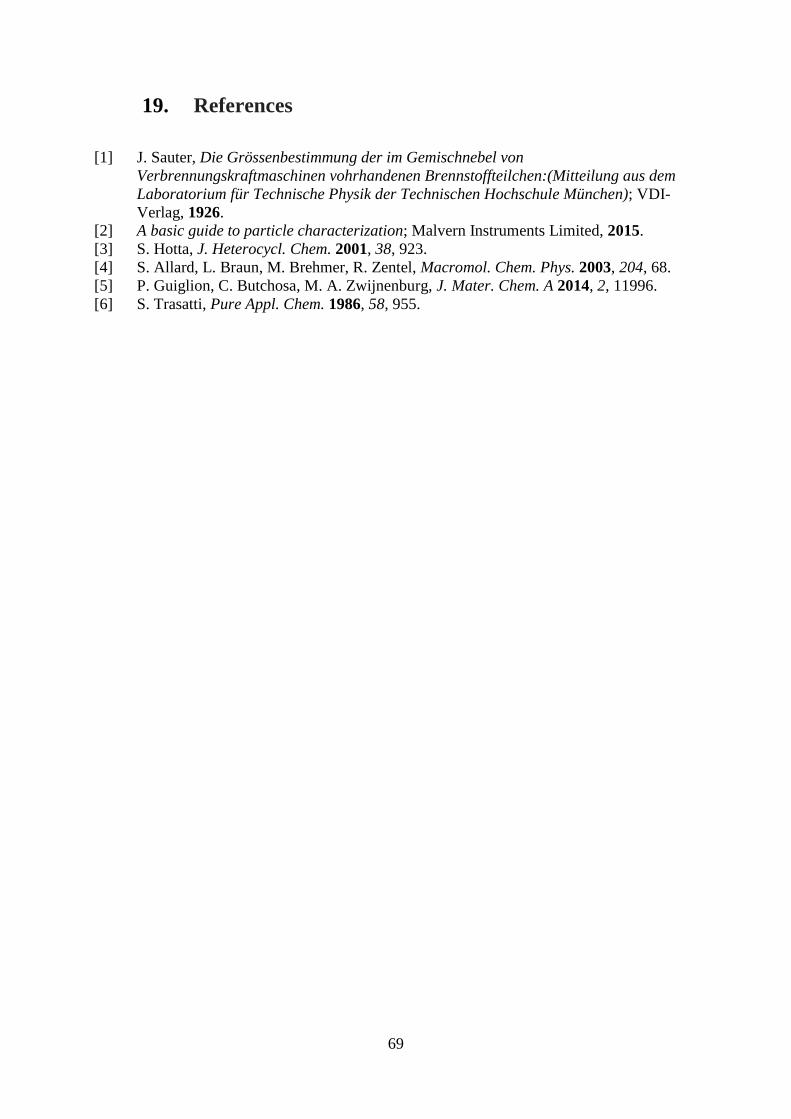
19. References
[1] J. Sauter, Die Grössenbestimmung der im Gemischnebel von
Verbrennungskraftmaschinen vohrhandenen Brennstoffteilchen:(Mitteilung aus dem
Laboratorium für Technische Physik der Technischen Hochschule München); VDI-
Verlag, 1926.
[2] A basic guide to particle characterization; Malvern Instruments Limited, 2015.
[3] S. Hotta, J. Heterocycl. Chem. 2001, 38, 923.
[4] S. Allard, L. Braun, M. Brehmer, R. Zentel, Macromol. Chem. Phys. 2003, 204, 68.
[5] P. Guiglion, C. Butchosa, M. A. Zwijnenburg, J. Mater. Chem. A 2014, 2, 11996.
[6] S. Trasatti, Pure Appl. Chem. 1986, 58, 955.