porphyrin-based metal-organic frameworks: hydrogen protonation induced q … · 2019-06-03 · 1...
TRANSCRIPT

1
Porphyrin-Based Metal-Organic Frameworks: Hydrogen
Protonation Induced Q band Absorption
Yuewu Zhao,a Xue Cai,a,c Ye Zhang,a Changchong Chen,a Jine Wang,*,a and Renjun
Pei*,a,b
aCAS Key Laboratory of Nano-Bio Interface, Suzhou Institute of Nano-Tech and Nano-Bionics,
Chinese Academy of Sciences, Suzhou, 215123, China.
bSchool of Nano Technology and Nano Bionics, University of Science and Technology of China,
Hefei, 230026, China.
cDepartment of Obstetrics and Gynecology, The Second Affiliated Hospital of Soochow
University, Suzhou, 215004, China.
E-mail: [email protected]; [email protected]; Tel: +86-512-62872776.
Electronic Supplementary Material (ESI) for Nanoscale.This journal is © The Royal Society of Chemistry 2019

2
Figure S1. (a) FT-IR, (b) XRD, (c) N2 adsorption-desorption isotherms, and (d) pore
size distribution of the prepared Gd-TCPP MOFs nanosheets. The Gd-TCPP shows an
approximate type I Langmuir isotherms with a Brunauer-Emmett-Teller surface area
of 646.4 m2 g-1.
3
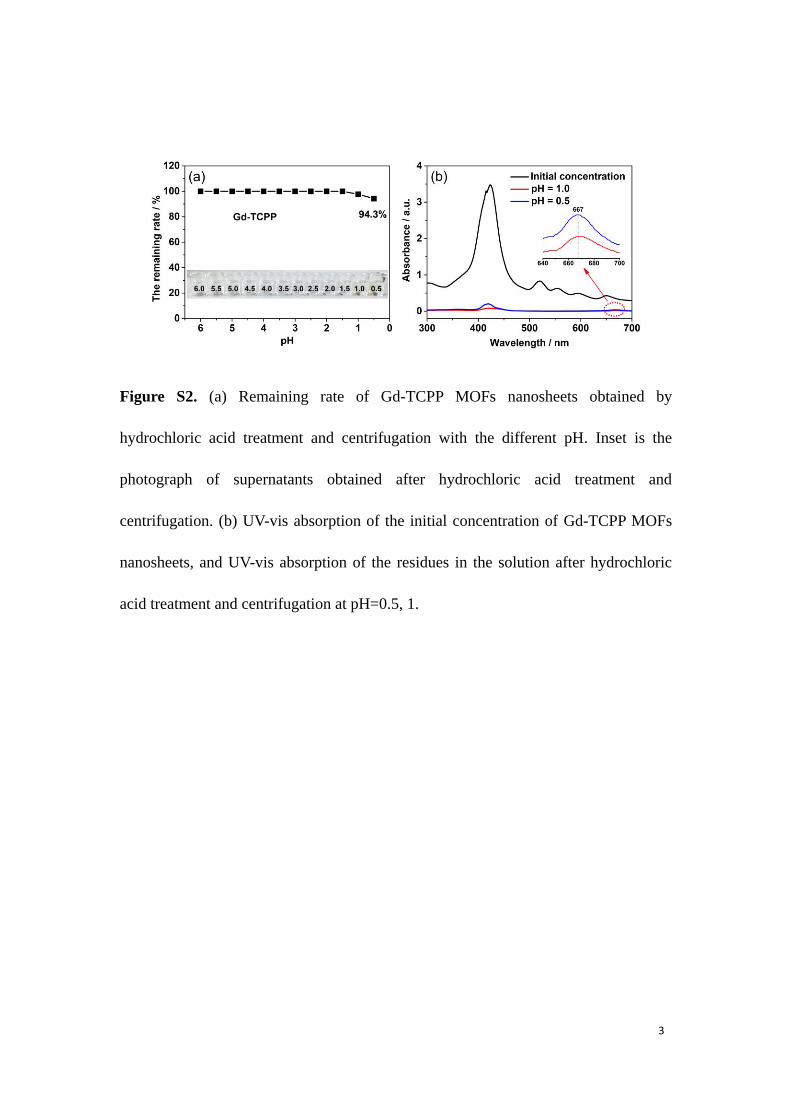
Figure S2. (a) Remaining rate of Gd-TCPP MOFs nanosheets obtained by
hydrochloric acid treatment and centrifugation with the different pH. Inset is the
photograph of supernatants obtained after hydrochloric acid treatment and
centrifugation. (b) UV-vis absorption of the initial concentration of Gd-TCPP MOFs
nanosheets, and UV-vis absorption of the residues in the solution after hydrochloric
acid treatment and centrifugation at pH=0.5, 1.

4
Figure S3. (a) FT-IR, (b) XRD, (c) N2 adsorption-desorption isotherms, and (d) pore
size distribution of the Gd-(H2TCPP)2+. The Gd-(H2TCPP)2+ showed an approximate
type II Langmuir isotherms with a Brunauer-Emmett-Teller (BET) surface area of
169.96 m2 g-1.

5
Figure S4. UV-vis absorption of (a) Zn-TCPP MOFs nanosheets and (b) acid-treated
Zn-TCPP MOFs nanosheets.

6
Figure S5. UV-vis absorption of (a) TPPS and (b) acid-treated TPPS.

7
Figure S6. UV-vis absorption and photograph of the acid-treated and recovered
TCPP.

8
Figure S7. UV-vis absorption of TCPP, CuTCPP, and acid-treated CuTCPP (pH=1.0).
The CuTCPP was prepared by reacting TCPP with copper acetate.

9
Figure S8. TEM and EDS images of (a) Gd-TCPP/MnO, (b) Gd-TCPP/MgO, (c)
Gd-TCPP/Fe2O3, and (d) Gd-TCPP/CuO nanohybrids.

10
Figure S9. XRD patterns of the Gd-TCPP/MnO, Gd-TCPP/MgO, Gd-TCPP/Fe2O3,
Gd-ZnTCPP/ZnO, and Gd-TCPP/CuO nanohybrids.
11
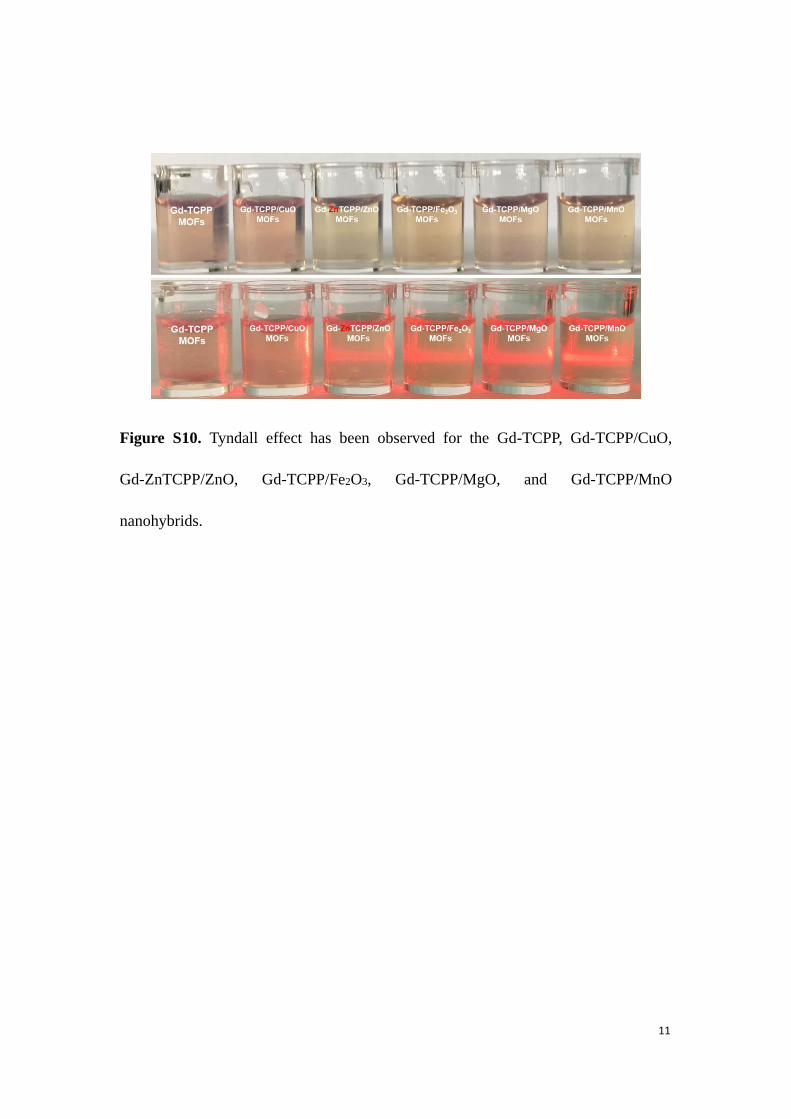
Figure S10. Tyndall effect has been observed for the Gd-TCPP, Gd-TCPP/CuO,
Gd-ZnTCPP/ZnO, Gd-TCPP/Fe2O3, Gd-TCPP/MgO, and Gd-TCPP/MnO
nanohybrids.

12
Figure S11. FT-IR of the (a) Gd-ZnTCPP/ZnO and (b) Gd-TCPP/MgO nanohybrids.

13
Figure S12. (a) N2 adsorption-desorption isotherms and (b) pore size distribution of
the Gd-TCPP/MgO nanohybrids. The Gd-TCPP/MgO shows an approximate type I
Langmuir isotherms with a Brunauer-Emmett-Teller surface area of 608.6 m2 g-1.
14
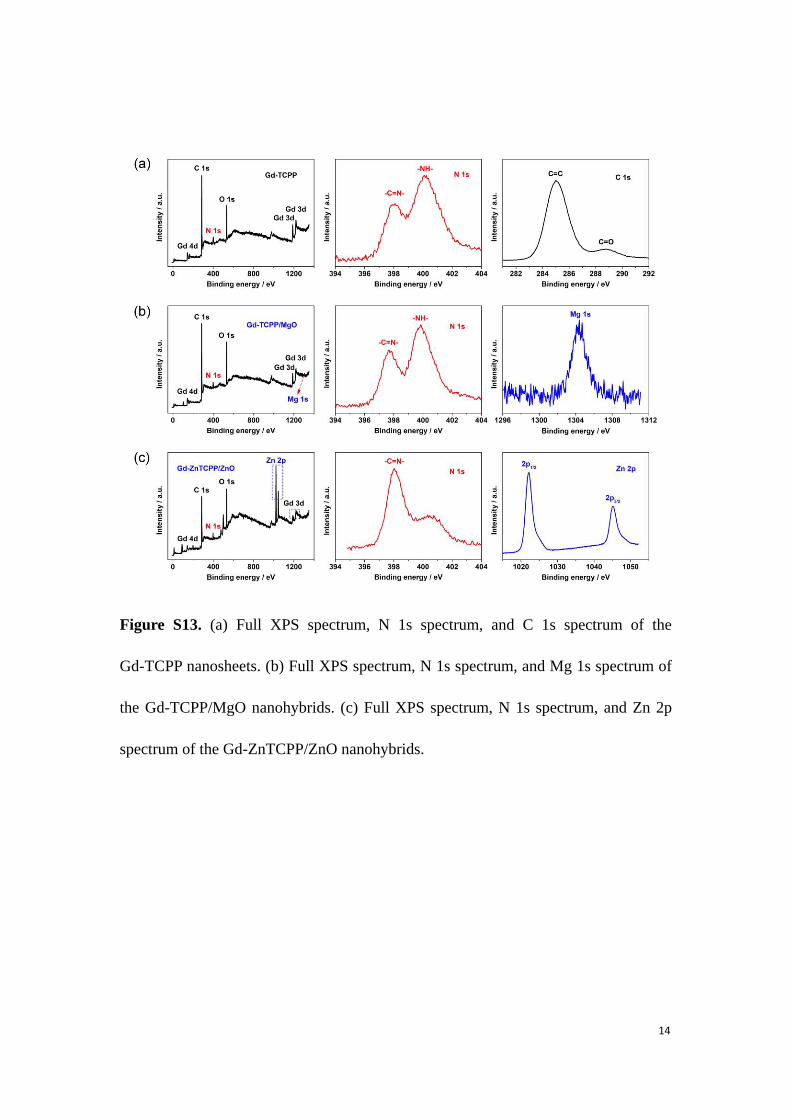
Figure S13. (a) Full XPS spectrum, N 1s spectrum, and C 1s spectrum of the
Gd-TCPP nanosheets. (b) Full XPS spectrum, N 1s spectrum, and Mg 1s spectrum of
the Gd-TCPP/MgO nanohybrids. (c) Full XPS spectrum, N 1s spectrum, and Zn 2p
spectrum of the Gd-ZnTCPP/ZnO nanohybrids.

15
Figure S14. TEM image of the acid-treated Gd-TCPP/Fe2O3 nanohybrids.

16
Figure S15. TEM images of the acid-treated Gd-ZnTCPP/ZnO nanohybrids.

17
MOFs Porphyrin Porphyrin
core
SBET (m2 g-1) Q-band
number
Ref
COF-366-Co Co(TAP) Co 1360 2 S1
Co-TCPP(Fe) TCPP(Fe) Fe - 2 S2
M-UiO H2DBP-Pt Pt - 2 S3
Zn-TCPP(BP) TCPP Zn 483 2 S4
{CuL-[AlOH]2}n H6L Cu - 2 S5
Ru-TBP-Zn H4TBP Zn 422 2 S6
Ru-TBP H4TBP None 441 4 S6
DBP-UiO H2DBP None 558 4 S7
PCN-222 H2TCPP None 1728 4 S8
Gd-TCPP TCPP None 646.4 4 This work
Gd-TCPP/MgO TCPP None 608.6 4 This work
Gd-(H2TCPP)2+ TCPP H 169.96 1 This work
Table S1. Summary of the different porphyrin-based MOFs materials.

18
Figure S16. (a) Schematic diagram of the layered Gd-TCPP nanosheets. (b, c) TEM
and (d) SEM images of the acid-treated Gd-TCPP nanosheets.

19
Figure S17. SEM images of the Gd-TCPP with the acid-treated at (a) pH=3.0 and (b)
pH=0.5.
20
References
S1. S. Lin, C. S. Diercks, Y. B. Zhang, N. Kornienko, E. M. Nichols, Y. Zhao, A. R.
Paris, D. Kim, P. Yang, O. M. Yaghi and C. J. Chang, Science, 2015, 349, 1208–
1213.
S2. Y. Wang, M. Zhao, J. Ping, B. Chen, X. Cao, Y. Huang, C. Tan, Q. Ma, S. Wu, Y.
Yu, Q. Lu, J. Chen, W. Zhao, Y. Ying and H. Zhang, Adv. Mater. 2016, 28, 4149–
4155.
S3. R. Xu, Y. Wang, X. Duan, K. Lu, D. Micheroni, A. Hu and W. Lin, J. Am. Chem.
Soc., 2016, 138, 2158−2161.
S4. Y. Zhao, L. Jiang, L. Shangguan, L. Mi, A. Liu and S. Liu, J. Mater. Chem. A,
2018, 6, 2828–2833.
S5. W. Zhang, J. Lu, X. Gao, P. Li, W. Zhang, Y. Ma, H. Wang and B. Tang, Angew.
Chem. Int. Ed., 2018, 57, 1–6.
S6. G. Lan, Y. Y. Zhu, S. S. Veroneau, Z. Xu, D. Micheroni and W. Lin, J. Am. Chem.
Soc., 2018, 140, 5326−5329.
S7. K. Lu, C. He and W. Lin, J. Am. Chem. Soc., 2014, 136, 16712–16715.
S8. H. Q. Xu, J. Hu, D. Wang, Z. Li, Q. Zhang, Y. Luo, S. H. Yu and H. L. Jiang, J.
Am. Chem. Soc., 2015, 137, 13440−13443.