master of science (geography)
TRANSCRIPT
Intra-storm attributes and climatology of extreme erosive events on
Mauritius, 2004 to 2008
by
Alexia Hauptfleisch
Submitted in partial fulfilment of the requirements for the degree
MASTER OF SCIENCE (GEOGRAPHY)
July 2016
© University of Pretoria
i
DECLARATION
I,_______________________________________, declare that this dissertation
entitled Intra-storm attributes and climatology of extreme erosive events
on Mauritius, 2004 to 2008, which is hereby submit for the degree Master of
Science (Geography) at the University of Pretoria, is my own work and has
not previously been submitted by me for a degree at this or any other tertiary
institution.
___________________________ ___________________________
SIGNATURE DATE
© University of Pretoria

ii
Intra-storm attributes and climatology of extreme erosive events on
Mauritius, 2004 to 2008
Alexia Hauptfleisch
Promoters:
Professor Paul Sumner (University of Pretoria)
&
Professor Werner Nel (University of Fort Hare)
Department: Geography, Geoinformatics and Meteorology
Faculty: Natural and Agricultural Sciences
University: University of Pretoria
Degree: Master of Science (Geography)
Abstract
Topographic complexity and island-scale weather systems on Mauritius result in
highly variable spatial and temporal rainfall distribution. This, in combination with the intense
agricultural activity, predisposes the island to a high risk of rainfall induced soil erosion. Thus
it is important to investigate intra-storm attributes of erosive events, as these events are most
likely to cause significant degradation and reduced productivity of the soils on the island.
Intra-storm analysis allows for the identification of critical intensity peaks in rainfall events
that potentially impact the severity of erosion. Six Mauritius Meteorological Services
automated weather stations (measuring rainfall at 6 minute intervals) located on the west
© University of Pretoria
iii
coast and in the interior providing rainfall data over a 5 year period (2004 to 2008), enabled
the first detailed intra-storm analysis on the island to occur. For the purpose of this study,
erosive events were defined as a total rainfall exceeding 12.5 mm and a maximum 6-minute
intensity exceeding 30 mm/h. The analysis found that there were 444 erosive events during
the study period which are responsible for generating the bulk of the rainfall erosivity. A total
of 120 erosive events (the top twenty erosive events for each weather station with the
highest ‘total kinetic energy generated’) were analysed to investigate the intra-storm
distribution of rainfall depth, extreme rainfall intensity and cumulative kinetic energy. General
climatological characteristics and weather circulation patterns were also determined.
Erosive events were found to vary both in rainfall depth and duration, but all the
stations indicate a clear exponential distribution of cumulative kinetic energy generated over
the duration of the rainfall events. Extreme rainfall intensities display noticeable temporal
differences between the stations in different climatic regions on the island. All the stations
received more than 80% of the potential kinetic energy content generated by the storms
within the first 2500 minutes of the storm, as well as 80% of the cumulative rainfall available.
Investigating the distribution of the extreme rainfall intensity (above 30 mm/h) as a function of
storm duration, reveals that 57% of the erosive events generate peak intensities within the
first half of the storm duration. Erosive events were not restricted to tropical cyclones, but
include other weather systems such as cold fronts.
The elevated centre of Mauritius, which is responsible for a high rainfall gradient
across the island, influenced the spatial and temporal variability in erosive events. Results
indicate that the intra-storm attributes of rainfall events are strongly dependent on the
geographic features within the immediate surroundings of the weather stations, and distance
between weather stations did not always lead to predictable differences in intra-storm
attributes. Although the erosive events on Mauritius share common characteristics, the
within-storm distribution shows that no two events are similar and no two stations show
comparable event pattern distributions. However, the intra-storm analysis of the erosive
events suggests that, despite the spatial differentiation in the structure and nature of the
erosive rainfall generalisations can be made regarding the erosion experienced in the coastal
and interior regions of the island. The inclusion of more automated weather stations is
warranted as this will provide a better representation of rainfall characteristics across the
remaining regions of the island. Further research is necessary to determine the relationship
between event structure and synoptic conditions experienced on the island.
© University of Pretoria

iv
Acknowledgements
I would like to thank both my supervisors, Professor Paul Sumner, Department of
Geography, Geoinformatics and Meteorology, University of Pretoria (UP) and Professor
Werner Nel, Department of Geography and Environmental Sciences, University of Fort Hare,
for their professional guidance, support and enthusiasm towards my project. Your guidance,
insight and patience are much appreciated and I feel fortunate that you allowed me the
freedom to work at my own pace and explore my ideas. Thank you also for providing me the
remarkable opportunity of being able to travel to Mauritius through funding from the
University of Pretoria and University of Fort Hare.
The data I received from The Mauritius Meteorological Service (MMS) through my
supervisors is hugely appreciated. I would also like to thank Professor Ravindra Boojhawon
and Professor Soonil Rughooputh from the University of Mauritius for their assistance and
insightful knowledge of the island.
My sincerest thanks is also expressed to both my parents, Renee and George Hauptfleisch,
for their tireless love, emotional support and generous financial support throughout my study
career and allowing me the privilege of continuing with my studies. My parents have always
believed in me and pushed me to achieve more than I thought I could and without their
support and encouragement throughout my life I do not know where I would be today. I
would also like to thank my brother, my boyfriend and friends, especially Monica Leitner, for
all the support and keeping me sane throughout the duration of this project. Their support
and care helped me overcome setbacks and stay focused on my thesis. I greatly value their
friendship and I deeply appreciate their belief in me.
The academic support and friendship from my fellow colleagues and students in the
Department of Geography, Geoinformatics and Meteorology is also greatly appreciated. I
would also like to thank, Barend van der Merwe, Michael Loubser and Ryan Anderson for
their willingness to help, and always having an open door to chat.
© University of Pretoria
v
Table of Contents
Abstract ..................................................................................................................... ii
Acknowledgements ................................................................................................. iv
List of Figures ......................................................................................................... vii
List of Tables ........................................................................................................... ix
Chapter 1 : Introduction ........................................................................................... 1
1.1. Rainfall induced soil erosion ....................................................................................... 2
1.2. Soil loss modelling ...................................................................................................... 4
1.3. Rainfall erosivity (R-factor) ......................................................................................... 8
1.4. The rainfall intensity and rainfall kinetic energy relationship ...................................... 12
1.5. The orographic effect on rainfall distribution and erosivity......................................... 15
1.6. Importance of ‘event profiles’ on infiltration, runoff and soil erosion .......................... 18
1.7. Aim and Objectives................................................................................................... 20
1.7.1. Aim .................................................................................................................... 20
1.7.2. Objectives .......................................................................................................... 20
1.8. Project Outline .......................................................................................................... 20
Chapter 2 : Study Area ........................................................................................... 21
2.1. Geology .................................................................................................................... 23
2.2. Topography and hydrology ....................................................................................... 24
2.3. Pedology (soils) ........................................................................................................ 28
2.4. Climate and weather ................................................................................................. 30
2.4.1. Weather systems in Mauritius ............................................................................ 31
2.4.2. Rainfall ............................................................................................................... 35
2.4.3. Climate classification.......................................................................................... 38
2.5. Land use and vegetation .......................................................................................... 39
Chapter 3 : Station Data and Methodology .......................................................... 42
3.1. Station data .............................................................................................................. 42
3.2. Research instruments ............................................................................................... 45
3.3. Missing, unreliable and incomplete data ................................................................... 46
3.4. Objective One: Identification of the top twenty events ............................................... 47
© University of Pretoria
vi
3.4.1. Identifying an erosive event................................................................................ 47
3.4.2. Determining rainfall event kinetic energy ............................................................ 47
3.5. Objective Two: General rainfall, climatological characteristics and weather circulation
patterns associated with the top twenty erosive events ................................................... 49
3.6. Objective Three: Intra-storm analysis of each event ................................................. 50
3.6.1. Intra-storm distribution of rainfall depth .............................................................. 51
3.6.2. Intra-storm distribution of extreme and peak rainfall intensity ............................. 51
3.7. Objective Four: Contrast of spatial and temporal differences between the automated
weather stations .............................................................................................................. 52
Chapter 4 : Results ................................................................................................. 54
4.1. General storm and rainfall data and general climatological characteristics ............... 54
4.2. Intra-storm distribution of rainfall depth ..................................................................... 64
4.2.1. Storm rainfall depth and cumulative rainfall generated over time by the extreme
events .......................................................................................................................... 64
4.2.2. Storm rainfall depth as a function of storm duration ........................................... 69
4.3. Intra-storm distribution of extreme and peak intensity ............................................... 69
4.3.1. Timing of extreme (above 30mm/h) rainfall intensity generated by the erosive
events .......................................................................................................................... 69
4.3.2. Extreme rainfall intensity (above 30mm/h) as a function of storm duration ......... 72
4.4. Climatic drivers and temporal analysis of extreme events......................................... 75
Chapter 5 : Discussion........................................................................................... 79
5.1. Identification of the erosive events ............................................................................ 79
5.2. Spatial and temporal variations of the erosive events ............................................... 80
5.3. The influence of elevation on the erosive events at the respective stations .............. 82
5.4. The potential implication of the erosive events on soil erosion risk ........................... 85
Chapter 6 : Conclusion .......................................................................................... 89
6.1. Seasonality and spatial distribution of the erosive events ......................................... 89
6.2. Elevation and the erosive events .............................................................................. 90
6.3. Potential erosion risk of the erosive events ............................................................... 91
6.4. Research needs and recommendations ................................................................... 92
References: ............................................................................................................. 94
© University of Pretoria
vii
List of Figures
Figure 2-1: Location map of Mauritius (after Saddul, 1995)………………………………..21
Figure 2-2: Locality and elevation map with the location of the capital Port Louis, SSR
International Airport and Curepipe, a major population centre (Anderson,
2012)……………………….…………………………….....................................22
Figure 2-3: Island profiles from SSW to NNE, and NNW to SSE (after Saddul, 1996;
taken from Le Roux, 2005)…………………………………………………….....25
Figure 2-4: Main geomorphological domains on Mauritius (after Saddul, 1995; taken from
Anderson, 2012)…..……………………………………………………………….26
Figure 2-5: Catchment boundaries, major rivers and water bodies on Mauritius
(WRU, 2007; taken from Anderson, 2012) ……………………………………..27
Figure 2-6: Classification of Soils in Mauritius (Proag, 1995)………………………………28
Figure 2-7: Soil map of Mauritius from DOS and MSIRI (1962), taken from Nigel
(2011)…………………………………………………………………………….....30
Figure 2-8: Trajectories of most severe tropical cyclones affecting Mauritius from 1892-
2005, with 2004-2008 cyclones presented in the text (MMS, 2014d)….…....33
Figure 2-9: Mean rainfall (1961 - 1990) and mean annual rainfall amount (Nigel,
2011)………………………………………………………………………………..36
Figure 2-10: The effect of relief on rainfall with annual rainfall along a 40km ESE-WNW
line at selected sites (Padya, 1989)……………………………………………..37
Figure 2-11: Landscape near the station at Albion (Photo taken 28 June 2010) ………...40
Figure 2-12: Landscape near Trou aux Cerfs (Photo taken 28 June 2010)………………..41
Figure 3-1: Location of automated weather stations………………………………………...43
Figure 3-2: Example of the automatic rainfall bucket used by the Mauritius Meteorological
Service (MMS) to record rainfall data. Also see Anderson (2012) and Mongwa
(2012)…………………………………………………………………………….....45
Figure 4-1: Mean rainfall depth and duration of the 120 erosive events analysed
in this study…………………………………………………………………………56
Figure 4-2: Cumulative kinetic energy generated over time by the erosive events at the
respective stations in Mauritius…………………………………………………..65
Figure 4-3: Rainfall depth and cumulative rainfall generated over time by the erosive
events measured at the respective stations on Mauritius: (A) Albion (B) Beaux
Songes……………………………………………………………………………...66
© University of Pretoria

viii
Figure 4-4: Rainfall depth and cumulative rainfall generated over time by the erosive
events measured at the respective stations on Mauritius: (C) Arnaud (D)
Monbois…………………………………………………………………………….67
Figure 4-5: Rainfall depth and cumulative rainfall generated over time by the erosive
events measured at the respective stations on Mauritius: (E) Grand Bassin
(F) Trou aux Cerfs…………………………………………………………………68
Figure 4-6: Rainfall depth as a function of event duration at the respective stations in
Mauritius. (A) Albion; (B) Beaux Songes; (C) Arnaud; (D) Monbois; (E) Grand
Bassin; (F) Trou aux Cerfs………………………………………………………..70
Figure 4-7: Timing of extreme rainfall intensity (above 30mm/h) generated by the
erosive events at the respective stations (each individual event is presented
by a different symbol). (A) Albion; (B) Beaux Songes; (C) Arnaud; (D)
Monbois; (E) Grand Bassin; (F) Trou aux Cerfs……………………………….73
Figure 4-8: Timing of extreme rainfall intensity (above 30mm/h) as a function of rainfall
duration at the respective stations (each individual event is presented by a
different symbol). (A) Albion; (B) Beaux Songes; (C) Arnaud; (D) Monbois (E)
Grand Bassin; (F)Trou aux Cerfs………………………………………………...74
© University of Pretoria
ix
List of Tables
Table 3-1: Location, altitude and climatic information of the automatic weather station
(also see Anderson, 2012; Mongwe, 2012; Nel et al.,
2012)………………………………………………………………………………..44
Table 3-2: Weather Systems in Mauritius (Fowdur et al., 2014) as representative
variables applied to the extreme events………………………………………...50
Table 4-1: Total intra-storm attributes at the six automated weather stations…………...56
Table 4-2: The top twenty erosive event attributes for Albion (12m.a.s.l) from
2004 to 2008……………………………………………………………………….58
Table 4-3: The top twenty erosive event attributes for Beaux Songes (225m.a.s.l)
from 2004 to 2008…………………………………………………………………59
Table 4-4: The top twenty erosive event attributes for Arnaud (576m.a.s.l) from 2004 to
2008…………………………………………………………………………………60
Table 4-5: The top twenty erosive event attributes for Monbois (590m.a.s.l)
from 2004 to 2008…………………………………………………………………61
Table 4-6: The top twenty erosive event attributes for Grand Bassin (605m.a.s.l)
from 2004 to 2008………………………………………………………...............62
Table 4-7: The top twenty erosive event attributes for Trou aux Cerfs
(614m.a.s.l) from 2004 to 2008…………………………………………………..63
© University of Pretoria
1
Chapter 1 : Introduction
Mauritius is a Small Island Developing State (SIDS) in the Indian Ocean and is
particularly prone to erosion from intense rainfall events (Nel et al., 2012). On tropical islands
erosive rainfall is capable of detaching and transporting large amounts of sediments
(Calhoun & Fletcher, 1996) and is associated with rainfall amount, topography and altitude
(Nigel & Rughooputh, 2010a). Mauritius, like many tropical volcanic islands, has a distinct
elevated interior which acts as an orographic barrier, influencing the rainfall gradient across
the island. Different regions of the island consequently receive varying amounts of rainfall as
a result of island’s topographic features (Dhurmea et al., 2009). Soil erosion has long been
regarded as an important land denudation process on tropical islands (Cooley & Williams,
1985) and as a consequence of the climate, topography, altitude and the subsequent intense
rainfall, the interior of Mauritius is particularly prone to high levels of erosion (Nigel &
Rughooputh, 2010a; Nel et al., 2012).
Globally changing rainfall patterns are aggravating the risk of soil erosion and this is
most evident in counties with highly variable rainfall and strong erosive events (Sanchez-
Moreno et al., 2014). On tropical islands, the potential soil loss and erosion risk is not
necessarily only dependent upon the amount of rainfall received but rather the physical
characteristic of the event, such as rainfall duration, amount, drop-size distribution, terminal
velocity, wind speed and inclination (Nel et al., 2013). Rainfall patterns on Mauritius are
multi-faceted and complex due to the spatial variability of the topography. Peak rainfall
intensities, which influence infiltration and runoff rates, can therefore occur at any point
during the rainfall event. This is important factor to consider as rainfall event patterns (i.e.
when peak intensity occurs) have differing effects regarding the type of material eroded from
different soil types (Parsons & Stone, 2006). Therefore, recognising the intra-storm attributes
of erosive events is critical when attempting to understanding the rainfall erosivity and
potential soil erosion risks of the events.
The tropical island of Mauritius was selected for this project because it forms part of a
larger project on rainfall which stemmed from the earlier work by Le Roux (2005). Le Roux
(2005) modelled the potential soil loss in a southern catchment on Mauritius to investigate
the extent to which soil erosion is affected by different land use. The results showed that land
use change to pineapples and vegetables crops will have a drastic influence on soil erosion.
Upon conclusion of the study by Le Roux (2005), it was realised that there was not
© University of Pretoria

2
sufficiently detailed rainfall data to accurately quantify erosivity. Therefore, the new high
resolution 6-minute rainfall data received from the Mauritius Meteorological Services afforded
the opportunity to conduct studies on storm kinetic energy, erosivity and soil erosion risk of
rainfall in Mauritius (Le Roux, 2005; Le Roux et al., 2005; Nigel & Rughooputh, 2010a, b; Nel
et al., 2012; 2013).
However, despite the aforementioned studies very little is known about intra-storm
rainfall attributes and the associated weather systems responsible for the distribution of
rainfall parameters. The purpose of this research is thus to investigate the intra-storm
attributes of the erosive events on Mauritius. This includes identifying and describing the
within-storm distribution of rainfall depth, extreme rainfall intensity, cumulative kinetic
energies and general climatological characteristics associated with these events and the
potential erosion risk for assisting conservation planning.
1.1. Rainfall induced soil erosion
Soil erosion is the detachment of individual particles from the soil surface by an
erosive agent and the subsequent transport of the soil particles to another location (Fornis et
al., 2005; Hoyos et al., 2005). Soil erosion is connected to a wider concept termed soil
degradation. The loss of topsoil is considered as only one of the major soil degradation
problems threatening agriculture throughout the world and involves physical, chemical and
biological deterioration (Dardis et al., 1988). Soil degradation includes loss of organic matter,
decline in soil fertility, the breakdown of soil structure and changes in salinity and acidity
(Haynes, 1997). The leading forces to soil degradation include deforestation, intense
cultivation and overgrazing of vulnerable land, pollution, as well as poor soil and water
management and all of them reduce the productive capacity of the soils (Le Roux, 2005).
The process of soil erosion is one accomplished through ‘work’, and is achieved in a
three-stage process that derives energy from numerous physical sources such as wind, ice
and water, gravity, chemical reactions and anthropogenic influences (Lal, 2001). It is the
source of energy such as snow, wind or water that controls the type of erosion process. The
rate and magnitude of energy providing such forces determines the severity of the erosion
process. The three stages of erosion are: (1) detachment of soil, (2) transport, and (3) the
deposition of soil (Lal, 2001). Water, predominately through rainfall, is believed to be the
foremost agent of soil erosion and includes processes such as runoff, rainsplash, rill and
© University of Pretoria
3
gully development (Chapman, 2005; Hoyos et al., 2005). Other erosion agents such as wind,
ice and streams are referred to as aeolian erosion, glacial erosion and fluvial erosion
respectively (Morgan, 1995). Despite the common perception that soil erosion is a solely
natural process, human activities, such as land cover change and the disturbance of soil
structure through cultivation, can also cause and greatly aggravate natural process of
erosion (Yang et al., 2003).
Rainfall and its consecutive overland runoff is generally regarded a major driving
force of most hydrological and erosional processes through which soil particles are detached
and surface runoff is created (Moore, 1979; Nyssen et al., 2005; Nel, 2007). Bergsma et al.
(1996: 117) define rainfall erosion as: “The rate of soil loss expected in the near future, due
to rain erosion, depending on the combined and interactive effects of all erosion hazard
factors: climate, relief, soil profile, present erosion, land use and vegetation and cultivation
system.” Processes of soil erosion are highly dependent upon rainfall energy, which, in turn
relates to intensity and amount of rainfall as well as the size of the raindrops (Jayawardena &
Rezaur, 2000). The combination of rainfall intensity and raindrop fall velocity influences soil
splash rate (Nel, 2007), therefore, erosion is more intense when runoff and runoff velocity is
high (i.e. when hydraulic roughness is low) (Torri et al., 1999).
The soil erosion process is complex in nature as it results from interactions between
the soil itself, climate, relief, surface cover and land use practices (Hoyos et al., 2005). The
total soil loss for any time period is regarded as a function of two attributes: the resistance of
the surface cover and soil factors that change daily and the distribution of rainfall events for
the time period (Nearing et al., 1990). For example, heavy rain falling on bare soil might
cause more erosion than rain falling on well vegetated soil, hence the timing and intensity the
erosive rains with respect to soil cover is important (Moore, 1979). Therefore, soil erosion is
most accurately understood and predicted using knowledge of how the key soil and plant
parameters vary over time and how these changes influence soil erosion (Le Roux, 2005).
While some studies have shown that land cover serves as a protective layer between
the rainfall and the soil (e.g. Lal, 2001; Toy et al., 2002; Morgan, 2005; Nigel, 2011), land
cover can aggravate erosion depending on the above- and below-ground components
present at the land surface (Morgan, 2005; Nigel, 2011). Above-ground components of
vegetation (leaves and stems) intercept falling raindrops and running water, therefore
reducing the amount of energy available to detach soil particles (Morgan, 2005). Below-
ground vegetative components (roots) enhance the mechanical strength of the soils and offer
© University of Pretoria

4
resistance against the detachment and transportation by surface runoff (Morgan, 2005).
Different types of vegetation cover provide differing degrees of protection and thus, human
influence on the land use can alter the rate of erosion to a large extent (Nigel, 2011).
The commencement of agricultural practices led to soil erosion becoming a serious
problem globally (Renschler et al., 1999) by causing a reduction in arable land, increased
landslide activity and contaminant diffusion by the inflow of sediment to river and ecosystem
disturbance (Lee & Heo, 2011). Environmental problems caused by soil erosion exacerbate
on-site land degradation as well as increase the sediments and pollutants that adversely
affect off-site aquatic ecosystems. Therefore, it is essential to implement conservation
measures which successfully reduce the impact of both on- and off-site effects of soil erosion
(Nigel & Rughooputh, 2010b). Lal (2001) emphasised that erosion cannot necessarily be
prevented but the adoption of soil conservation measures can allow the effects to be reduced
to an appropriate level. Hence, the universal aim of soil conservation is a reduction in erosion
levels that allow for a sustainable level of agricultural production and grazing (Morgan, 2005).
On Mauritius the hydrological and erosional process at a regional scale are controlled
by soil type, climate patterns in relation to topography and land use (Nigel & Rughooputh,
2010b). As a result of the rainfall variability and characteristics Mauritius is particularly
sensitive to erosion risks (Nigel & Rughooputh, 2010a). The island’s dependence on its
agricultural sector renders it vital to estimate and evaluate the amount of soil erosion through
soil loss modelling to allow for effective soil conservation, disaster control and water
management (Lee & Heo, 2011).
1.2. Soil loss modelling
The estimation and quantification of soil loss has been the subject of studies since
the 1940’s (Wischmeier & Smith, 1978; Lee & Heo, 2011). Numerous models have
subsequently been developed and placed in practise in an effort to quantify soil loss. These
include the European Soil Erosion model (EUROSEM) (Morgan et al., 1998), Water Erosion
Prediction Project (WEPP) (Flanagan & Nearing, 1995), Mediterranean Rainfall Erosivity
Model (MEDrem) (Diodato & Bellocchi, 2010), the Soil Loss Estimation Model for Southern
Africa (SLEMSA) (Elwell, 1976) and in the Mauritian context, the Mauritius Soil Erosion Risk
Mapping (MauSERM) (Nigel & Rughooputh, 2010a). Each of these models considers a
variety of factors and have their own limitations and/or advantages.
© University of Pretoria
5
The Universal Soil Loss Equation (Wischmeier & Smith, 1978) as well as its reviewed
format, the Revised Universal Soil Loss Equation (Renard et al., 1997), is one of the most
widely used models in quantifying soil loss. The Universal Soil Loss Equation (USLE) is
considered as the first attempt in evaluating and qualifying human’s impact on soil erosion
through land use changes or using new cultivation techniques (Renschler et al., 1999). It was
initially developed between 1940 and 1956 to quantify soil loss in the ‘corn belt’, situated in
the Midwestern region of the United States of America, where corn is the primary crop of
cultivation. After being altered on numerous occasions, the formula was published in its
existing arrangement in the National Runoff and Soil Loss Data Centre under the title
‘Predicting rainfall erosion losses- A guide to conservation planning’ (Wischmeier & Smith,
1978). Subsequently, all factors of the original formula were re-examined, modified and
improved resulting in the creation of the Revised Universal Soil Loss Equation (RUSLE)
(Renard & Freimund, 1994) which has been extensively as tools in the prediction of soil
erosion in many parts of the world (Renschler et al., 1999). For example, it has been used by
Kremer (2000); Le Roux (2005); Seeruttun et al. (2007) and Nigel (2011) in Mauritius;
Onyando et al. (2005) in Kenya, Irvem et al. (2007) and Erdogan et al. (2007) in Turkey and
Schiettecatte et al. (2008) in Cuba.
(R)USLE erosion model was designed to predict the long-term average annual soil
loss carried by runoff from field slopes in specified cropping and management systems
including rangelands (Renard & Freimund, 1994; Wang et al., 2002). Thus the (R)USLE
equation quantifies soils erosion as a product of six factors representing rainfall and runoff
erosivity in (R), soil erodibility (K), slope length (L), slope steepness (S), crop type and
management practices (C), and supporting conservation practices (P). The equation is
(Renard & Freimund, 1994):
A = R x K x L x S x C x P
where A is the rate of soil loss per unit of area (t ha-1 year-1) and is expressed in the
units selected for K and the period selected for R. The rainfall and runoff erosivity factor (R)
and soil erodibility factor (K) are the only two factors in the equation with definable units
(Renard & Freimund, 1994). Rainfall and runoff erosivity (R) will be discussed in more detail
as it is acknowledged as one of the best parameters for predicting the erosive potential of
raindrop impact, and in turn of the potential of transport capabilities of runoff generated by
erosive storms (De Santos Loureiro & De Azevedo Coutinho, 2001).
The use of the (R)USLE model is advantageous because it has been widely applied
and tested over many years due to this its validity and well-known limitations (Renard et al.,
© University of Pretoria

6
1997). These limitations are as a result of being developed from data limited to the Midwest
of the United States of America. This subsequently necessitated major adjustments to the
key factors of the equation in order for the algorithms of the models to be applicable in other
areas (Shamshad et al., 2008). Renard & Freimund (1994) acknowledge that (R)USLE are
empirical relationships that are only deemed valid within the range of experimental conditions
from which they were derived. However, since (R)USLE represents the major factors
affecting erosion, transferring it to locations throughout the world only requires the
determination of appropriate values for the different factors for the region in question (Renard
& Freimund, 1994). Thus, the use of (R)USLE is applicable in the Mauritian context.
Mauritius’ topography, where nearly 31% of the island has slopes >8%, creates areas
that are considerably more susceptible to experiencing potentially severe erosion risk (Nigel,
2011). In spite of this only a few erosion risk assessments have been completed probably
due to the absence of local legislation concerning soil erosion research, control and
conservation and the lack of assessment methodologies (Nigel & Rughooputh, 2010a).
Advantages of soil erosion risk mapping include its ability to depict the temporal variations in
erosion patterns, to define and priorities focal areas for conservation measures and the
promotion of better land use management, agricultural practices and conservation planning
(Nigel & Rughooputh, 2010b). The predominant focus of soil erosion risk mapping on
Mauritius is on cultivated lands, more specifically sugarcane canopy cover.
The most noteworthy of the soil assessment studies on Mauritius include: Kremer,
(2000); Le Roux et al., (2005); Seeruttun et al., (2007) and Nigel & Rughooputh, (2010a, b).
Kremer (2000) mapped erosion risk for the island by utilising three scenarios of sugarcane
canopy cover, those of 0-10, 30 and >70%, using land cover, slope, soil and rainfall data.
Kremer’s (2000) results indicated that in general erosion risk is low for canopy cover of >70%
and vice versa (Nigel & Rughooputh, 2010a). Le Roux et al. (2005) used the (R)USLE and
SLEMSA models within a GIS environment to estimate the soil loss for a river basin with
steep slopes. To obtain the rainfall erosivity (R value), Le Roux (2005) utilised monthly and
annual rainfall as inputs into a Modified Fournier Index (MFI) developed by the FAO
(Arnoldus, 1980) and concluded that erosion rates are generally highest on steep slopes
(>20%) in areas with a high annual rainfall (2400mm). Results also predicted that soil loss
has a strong inverse relationship with vegetation cover, where infrequently disturbed land
use type such as natural vegetation, tea and banana plantations experience low soil loss
values (1 to 4 t.ha-1.yr-1). In contrast, the frequently disturbed land use types such as
intercropped cane and vegetables experience moderate (13 t.ha-1.yr-1) to very high (80 t.ha-
1.yr-1) soil loss rates (Le Roux, 2005). The study, which was done within the context of
© University of Pretoria
7
changing land use, confirms that soils erosion within sugarcane is less than that modelled
under other crop types. Findings show that the most vulnerable time for erosion is in the
early part of the wet season when there is high rainfall but the vegetation has not fully
developed (Le Roux et al., 2005). Hence, certain crops should be confined to low slope angle
and be supported by soil management practices (Le Roux et al., 2005). The SLEMSA model
provided much higher values of soil loss than the (R)USLE model, due to the high sensitivity
that SLEMSA had to rainfall energy (Le Roux, 2005; Anderson, 2012).
In another soil risk assessment study, Seeruttun et al. (2007) attempted to measure
soil loss using five field sites over four consecutive years in Mauritius. Each site had two
plots, one bare and one planted with sugarcane, in order to quantify the impact which
sugarcane has on soil loss in Mauritius. The study found that soil loss on bare plots ranges
between 0.5-37.6 ha-1.yr-1 depending on the soil type and in general, sugarcane reduced soil
loss by 80-99%. Seeruttun et al. (2007) also found that between 48% and 68% of the soil
erosion was associated with cyclonic activity. This study was, however, conducted only on
plots containing linear slopes <9% isolated from upslope contributing areas (Nigel &
Rughooputh, 2010b).
More recent soil erosion risk assessments on Mauritius (Nigel & Rughooputh, 2010a;
2010b) have indicated that soil erosion on the island is a problem. Nigel and Rughooputh
(2010a; b) developed and utilised the Mauritius Soil Erosion Risk Mapping (MauSERM)
model to investigate the variability of erosion patterns on Mauritius to establish conservation
efforts for the high erosion risk sites and priority action areas. Over half of the area of
Mauritius is under intensive cultivation, typically sugarcane plantations, which were found to
experience moderate sheet erosion (Atawoo & Heerasing, 1997). The rugged topography,
intensive cultivation (predominantly sugarcane) and its tropical climate are the main factors
responsible for making Mauritius vulnerable to soil erosion (Nigel & Rughooputh, 2010a).
Mean monthly rainfall and annual data were used as inputs into the Modified Fournier
Index (MFI) to determine the erosivity of the island (Nigel & Rughooputh, 2010a). In this case
the MFI provides better correlation with the observed erosivity patterns (Nigel & Rughooputh,
2010b). According to Nigel & Rughooputh (2010a), January and February have the highest
erosion risk as a result of torrential rains endured during these months, followed by
December and March, with the remainder of the year being dominated by low to very low
erosion risk. The western portion of the island had low erosivity, which is in accordance with
the low annual rainfall that the region observed. The central and eastern parts of the island
sustain the highest erosivity on an annual basis, with the majority of the erosivity experienced
during the wet season (Anderson, 2012). During the months of high erosivity, sugarcane
© University of Pretoria
8
cultivation found on the steep slopes does not offer much protection against soil erosion from
rainfall (Mongwa, 2012).
The studies mentioned above utilised the Modified Fournier Index (MFI) when
calculation rainfall erosivity used in the soil erosion calculations, which is dependent on
monthly and annual totals (Anderson, 2012). The main reason for using total rainfall in
erosion risk assessment is the lack of high resolution data on an island scale (Mongwa,
2012). However, despite numerous studies that have been done on soil erosion risk mapping
(Le Roux, 2005; Nigel & Rughooputh, 2010a; b) and erosivity (Nel et al., 2012; 2013) on the
island, very little is known about the intra-storm attributes of the rainfall. No other study has
identified the erosive rainfall event characteristics and intra-storm attributes from the high
resolution rainfall data available. As the implication of the erosive events on the potential
erosion risk on the tropical island of Mauritius is unknown, a comprehensive intra-storm
analysis at an event scale is required to understand the impact that intra-storm dynamics
have on potential soil erosion risk.
1.3. Rainfall erosivity (R-factor)
Rainfall is regarded as a crucial factor for erosion processes (Petan et al., 2010) as it
can potentially detach and transport soil particles through the impact of raindrops striking the
soil surface and/or surface runoff generated during a storm (Lal & Elliot 1994; Le Roux,
2005). Rainfall owing to its erosivity is the agent for soil erosion as a result rainfall with higher
erosivity causes higher erosion (Nigel, 2011). Rainfall erosivity, unlike some other natural
factors such as relief or soil characteristics, is not responsive to human modification.
Consequently, it represents a natural environmental constraint that limits and conditions land
use and management (Angulo-Martínez & Beguería, 2009). Rainfall erosivity is defined as
the ability of rainfall and runoff to cause erosion through the detachment and transportation
of soil particles (Lal & Elliot, 1994; Obi & Salako, 1995). It is determined mainly through
rainfall kinetic energy, a parameter easily related to the rate or total amount (energy) of
rainfall, and other physical rainfall characteristics such as duration, intensity, drop-size
distribution, terminal velocity and extraneous factors such as wind velocity and slope angle
(Obi & Salako, 1995; Nyssen et al., 2005).
Erosivity is generally expressed in terms of rainfall amount and intensity since both
determine the potential of rainfall event to be erosive (Hoyos et al., 2005). Rainfall kinetic
energy is considered the most suitable expression of rain erosivity as it influences sediment
© University of Pretoria
9
transportation and acts as a major factor in initiating soil detachment (Lal & Elliot, 1994;
Morgan, 1995). The quantification of rainfall erosivity, through the kinetic energy of a rainfall
event, is therefore central to the assessment of soil erosion risk. It is a commonly held theory
that a large proportion of soil erosion and sediment delivery takes place during several
intense rainfall events (of high kinetic energy) which produce the bulk of soil loss from an
island (Rydgren, 1996; Angulo-Martínez & Beguería, 2009). Alternatively, the cumulative
influence of more frequent yet lower magnitude events (of lower kinetic energy) might
overshadow the effect of the less frequent high-intensity events (Boardman & Favis-Mortlock,
1993; Trustrum et al., 1999). Page et al. (1994) argue that while rainfall event magnitude and
frequency can be analysed from rainfall records, the cumulative effects of rainfall-induced
erosion are more difficult to quantify, particularly in tropical areas where rain events tend to
be more intense (Nyssen et al., 2005). Intense rainfall in tropical areas, such as Mauritius,
has a particularly high erosive potential, and is influenced by the event type and rainfall
characteristics which might vary with altitude and topography (Nel et al., 2013). The temporal
and spatial variability of rainfall erosivity is therefore important to consider in tropical regions,
especially due to the existence and interactions of numerous factors, such as the Inter
Tropical Convergence Zone (ITCZ), topography (hills) and the ocean, on rainfall variability
(Salako, 2008).
Rainfall erosivity can also be dependent on vegetation cover and how it varies over
seasons (Jackson, 1972; Moore, 1979). For example, if heavy rainfall events occur at the
onset of the wet season when the vegetation cover is sparse and the soil is not well
protected, considerably higher levels of runoff and erosion are experienced. Towards the end
of the rainy season, vegetation cover provides more protection to the soil, resulting in
potentially less runoff and rainsplash occurring. In Mauritius, the soil is considered most
vulnerable during the early part of the wet season when the rainfall is at its highest, but the
vegetation growth does not yet provide sufficient protection to the soil (Nigel & Rughooputh,
2010b). Therefore, rainfall intensities, storm duration, frequency and seasonal occurrence of
rainfall all influence the amount of rainfall erosion potentially experienced by an area
(Jackson, 1972).
An interaction also prevails between vegetation cover and slope in influencing the
magnitude of rainfall erosion experienced by an area. Even though the influence of slope on
soil loss is secondary to that of vegetation cover, Snyman (1999) highlights that as
vegetation basal cover lessens, during dry periods or overgrazing, the influence of slope on
rainfall erosion increases. Long steep slopes such as those found in the upper catchment
and mountainous areas of Mauritius thus render the land extremely susceptible to erosion
© University of Pretoria
10
once the vegetation cover is degraded (Le Roux, 2005). Furthermore, slope steepness can
also be increased by the effect of other erosion factors, such as raindrop impact leading to a
possible decrease in infiltration, more overland flow and further erosion (Smith et al., 2000).
Total soil loss cannot, however, be explained purely by the variation in slope length, slope
angle and vegetation cover because of the existence of complex interrelationships between
the microtopography, rainfall energy, plant cover and soil properties (Le Roux, 2005).
Rainfall erosivity is one of the six factors in the Universal Soil Loss Equation (USLE)
(Wischmeier & Smith, 1978), as well as the Revised Universal Soil Loss Equation (RUSLE)
(Renard et al., 1997) for erosion prediction, and is the most precisely defined factor of both
these equations (Yu et al., 1998). Erosive power of precipitation is accounted for by a rainfall-
runoff erosivity factor R, therefore combining the effects of the magnitude, duration and
intensity of each rainfall event (Bonilla & Vidal, 2011). Rainfall erosivity is both a numerical
description and quantifier of the potential of rainfall to cause soil loss at a hillslope scale (Yin
et al., 2007; Lee & Heo, 2011). It is commonly accepted that rainfall and runoff lead to soil
loss and subsequently, if all other parameters of the formula are kept constant, soil loss is
directly proportional to the rainfall erosivity (Wang et al., 2002). According to van Dijk et al.
(2002) the amount of soil detached by a particular depth of rain is related to the intensity at
which the rain falls. Rainfall erosivity (R or R-factor) is regarded as a dependent of splash
detachment and is reliant on the kinetic energy (KE) of the rainfall which varies with drop
mass as well as rainfall intensity (Brooks & Spencer, 1995).
In rainfall erosivity studies, the Rainfall erosivity (R or R-factor) is derived by
calculating the mean annual sum of individual erosive event erosion index values (EI30). This
is determined by the value of the total kinetic energy (KE) and maximum 30 minute rainfall
intensity (I30) (Renard et al., 1997; Shamshad et al., 2008; Lee & Heo, 2011). The EI30 term is
the abbreviation for the (KE) multiplied by I30 (Renard & Freimund, 1994) and was found to
produce the best correlation with soil loss from a rainfall event (Wischmeier & Smith, 1958).
EI30 calculations make use of breakpoint rainfall intensity data derived from automated
rainfall gauges. These data are often manually read from graphical charts from continuously
recording rain gauges, which record pairs of values representing time and cumulative depth
of rainfall as measured from the charts. Time intervals between these recorded pairs is
assumed to represent portions of the storms that demonstrate constant or near constant
rainfall intensities (Yin et al., 2007). As a result, the recorded points indicate times of
apparent “breaks” or variations in the rainfall intensity of the storm (Yin et al., 2007). As
breakpoint data are rarely available, EI30 is often calculated by using fixed interval rainfall
data from yearly, monthly and daily rainfall data. Breakpoint rainfall information is, however,
© University of Pretoria
11
becoming more widely available with the development of automatic weather stations (Yin et
al., 2007). Rainfall data at automatic weather stations that is recorded in fixed time intervals,
such as 60 minutes, 15 minutes and even higher time resolution provides the ideal
substitution of breakpoint records. Furthermore, the use of high resolution rainfall data is
encouraged to determine the maximum 30 minute rainfall intensities for individual storms and
heavy storm events (Lee & Heo, 2011), as such information will allow for the thorough
evaluation of rainfall erosivity (Bonilla & Vidal, 2011).
Accurate calculation of each storm’s rainfall erosivity requires high resolution rainfall
data measurements (Wischmeier & Smith, 1978; De Santos Loureiro & De Azevedo
Coutinho, 2001). However, these data are not always readily available to calculate the R
value (De Santos Loureiro & De Azevedo Coutinho, 2001). Several other methods were
established to calculate the rainfall erosivity index (R). Examples include the Fournier Index
(Fournier, 1960), Morais et al. (1991) modified form of the Fournier index (known as the
MMFI), the Grimm-Jones-Rusco-Montanarella (GJRM) model (2003) and the Diodato-
Bellocchi Rainfall-Erosivity Model (REMDB) (2007) (Diodato & Bellocchi, 2007). Another
approach is to integrate climatic and geographical characteristics, which are not difficult to
record and capture variability at both a regional and sub-regional scale, for example monthly
average rainfall and geographical characteristics that can be incorporated into an erosivity
model (Diodato & Bellocchi, 2007). In a tropical island context, most rainfall erosivity is
calculated through annual and monthly rainfall depth in the absence of detailed intensity data
(see Nel et al., 2013).
The Fournier Index was designed for the west coast of Africa (Fournier, 1960) and
has been widely used where only monthly data are available. The Modified Fournier Index
(MFI) was developed by Arnoldus (1980) after correlating the Fournier index with R in
Morocco and finding poor correlations in general, but higher (R) values when utilising the
monthly average as an alternative to the maximum monthly rainfall (Sanchez–Moreno et al.,
2014). It was suggested by Renard & Freimund (1994) that the Modified Fournier Index be
used in areas where long-term data are not available or in the absence of reliable EI30
calculations. Consequently, the Modified Fournier Index has been used to map erosivity and
parameterise soil erosion risk as either a single factor, or correlated with R, in several
countries, including Spain (Angulo-Martínez & Beguería, 2009) and Mauritius (Le Roux,
2005; Nigel & Rughooputh, 2010a; b). In the Mauritian context, Nel et al. (2013) argue that
despite coarser time intervals producing less accurate results, the MFI still remain useful in
determining the relative spatial relationships of erosivity.
© University of Pretoria

12
Rainfall erosivity appears to be higher in tropical regions compared to that of
temperate regions of the world (Salako et al., 1995; Lal, 1998; Nyssen et al., 2005;
Anderson, 2012) as tropical rains are considered more intense and are more concentrated in
time than other climates (Lal, 1998; Nyssen et al., 2005). As tropical areas experiences
higher amounts and frequency of intense erosive events, the average EI30 values in tropical
areas are generally higher than those in temperate regions (Hoyos et al., 2005).
Subsequently, rainfall induced soil erosion particularly effects tropical island environments,
such as Mauritius, due to the intense rainfall experienced there (Hoyos et al., 2005). It has
been noted that the erosive nature of rainfall on volcanic islands is closely related to rainfall
depth and intensity, such that a few extreme rainfall events with high rainfall intensity can
generate the bulk of the cumulative erosivity, as opposed to frequent events of low intensity
(Nel et al., 2013). It is therefore imperative to understand and quantify rainfall erosivity in
these environments as this process plays an important role in shaping the island’s
landscape.
1.4. The rainfall intensity and rainfall kinetic energy relationship
Rainfall kinetic energy (KE) results from the kinetic energy of each individual raindrop
striking the ground and represents the total energy available for the detachment and
transportation of soil particles (Salles et al., 2002; van Dijk et al., 2002; Salako, 2007).
Rainfall kinetic energy is expressed as either rainfall energy expended per volume of rain or
kinetic energy rate. The KE (the product of mass and fall velocity squared) of raindrops
weakens the bonding effects within the soil and provides the energy required to transport the
detached particles away from the site of impact (Wang et al., 2014). As rainfall intensity
contributes to runoff and sediment generation, the amount of soil detached by a particular
amount of rain is related to the intensity because rainfall striking the surface could potentially
detach more soil particles when falling at higher intensity (van Dijk et al., 2002; van Dijk et
al., 2005; Wang et al., 2014). Wang et al. (2014) expresses that though the role of rainfall
intensity could be considered as ambiguous when the infiltration capacity of the soil is
surpassed during short-duration, high-intensity storms likewise during long-duration, low-
intensity storms, both of which may possibly lead to the onset of erosion. Given the right
conditions, higher rainfall intensities could cause higher infiltration excess runoff rates thus
retaining more sediment in transport as well as actively entraining soil particles (van Dijk et
al., 2005). The usage of energy parameters, such as rainfall intensity and rainfall kinetic
© University of Pretoria

13
energy indirectly, are generally accepted as better predictors of rainfall erosivity over a wide
range of conditions (Stocking & Elwell, 1976; Wang et al., 2014).
As rainfall kinetic energy (KE) is regarded as an indicator of rainfall erosivity (van Dijk
et al., 2002) many empirical and process-based soil erosion models make use of KE as the
rain erosivity index (Salles et al., 2002; Fornis et al., 2005). For example, rainfall kinetic
energy (KE) is used in splash erosion modelling such as used by Poesen (1985) and in
modelling sheet and rill erosion, such as SLEMSA (Elwell, 1976), in EUROSEM (Morgan et
al., 1998) or in RUSLE (Renard et al., 1997) as an indicator of rainfall erosivity (Salles et al.,
2002). There are two formulas of rainfall kinetic energy which can be used in relation to
rainfall intensity. One is kinetic energy per unit time that is often called the rate of kinetic
energy expenditure and designated as KER (J m-2 h-1). The other form is the kinetic energy
per unit area per unit depth also termed kinetic energy content and designated as KE (J m -2
mm-1) (Fornis et al., 2005). Hence, kinetic energy content is one of the many variants of
kinetic energy. Kinetic energy content is the volume-specific KE or kinetic energy ‘content’ (J
m-2 mm-1) encountered by 1m2 surface area per unit depth of rainfall. Other published
symbolisations for this variant are KEB, EB and KEmm (Brodie & Rosewell, 2007).
Fornis et al. (2005) established that there are three mathematical models which are
most commonly used to relate kinetic energy content to rainfall intensity, namely the
exponential model, the Hudson (1965) model, and the logarithmic model. The respective
forms of these models are presented as follows (Fornis et al., 2005):
The logarithmic model:
KE= u + w log I
The Hudson (1965) model:
KE= b – cI-1
The exponential model:
KE= z[1 – p exp(-hI)]
Where u, w, b, c, z, p, and h are empirical constraints.
As the exponential model has one parameter more than the logarithmic model it
offers more adaptability in tailoring the model to data sets (Fornis et al., 2005). Kinnell (1981)
suggests that the exponential model describes the KE – I relationship better than the
logarithmic form because the exponential model indicates that there is an upper limit to the
© University of Pretoria

14
kinetic energy content of rainfall. The inclusion of a threshold value, or upper limit, for kinetic
energy reduces the overestimation of the rainfall erosivity of low intensity rainfall events and
thereby facilitates the calculation of gross erosion as well as accounting for differences in
rainfall characteristics inherent to the geographic location of the measuring site (van Dijk et
al., 2002). The exponential model allows both forms of KE to be determined precisely from
any rainfall event using the KE – I relationship because rain intensity data is widely available
and straight-forward to obtain in comparison to KE (Salles et al., 2002). The exponential
equation is commonly utilised in tropical areas (van Dijk et al., 2002).
Although van Dijk et al. (2002) cites a study by Rose (1960) who originally concluded
that rainfall momentum is marginally better as a predictor of soil detachment than kinetic
energy, it was demonstrated in a study by Hudson (1971) that momentum and kinetic energy
display favourable comparable relationships with intensity for natural rainfall. While it is
largely accepted that insight on the kinetic energy of rainfall is important in soil erosion
studies, its computation by direct measurements is not as common as the measurement of
intensity (Fornis et al., 2005). Direct measurements of rainfall kinetic energy are very
uncommon because they require both sophisticated and costly instruments (Petan et al.,
2010). Thus, the alternative approach is to estimate kinetic energy from rainfall intensity as it
can be more conveniently measured and is commonly available in most countries (Fornis et
al., 2005).
Rainfall kinetic energy is thus often derived through rainfall intensity (I) data which are
widely available by implementing the empirical kinetic energy–intensity (KE – I) relationship
(Petan et al., 2010). The KE – I relationship was developed by Wischmeier & Smith (1958)
as a linear-log equation and has subsequently inspired many later works (Petan et al., 2010).
The empirical kinetic energy–intensity (KE – I) relationship was established from rainfall
kinetic energy and has been formulated from raindrop size distribution (DSD) measurements
performed at certain locations with specific climatic conditions (Petan et al., 2010).
Information provided by the drop-size distribution (DSD) measurements in conjunction with
the fall velocity measurements or the empirical laws that link terminal fall velocity (Vt) and
drop diameter (D), allows for the calculation of rain kinetic energy (Salles et al., 2002). The
empirical relationship is effective for a limited range of rainfall intensity, hence before making
use of any KE – I relationship in climatically different environment, one should justify its
formulation before its implementation (Petan et al., 2010).
As rainfall kinetic energy represents the total energy available for detachment and
transport by rainsplash, the empirical relationship between rainfall intensity and kinetic
energy is vital for the prediction of erosion hazards (van Dijk et al., 2002). Data on the KE of
© University of Pretoria
15
rainstorms are thus essential in developing and verifying models of soil detachment by
raindrop impact on interrill areas (Wang et al., 2014). Relating KE to easily measured rainfall
parameters would therefore be a more practical and convenient way to estimate the
erosiveness of rainstorms (Wang et al., 2014). Rainfall events with intensities greater than
25mm/h are more likely to be erosive and the amount of rain falling at higher intensities may
also be important in contributing to higher levels of soil erosion (Elwell & Stocking, 1973;
Moore, 1979). Moore (1979) found that in tropical regions, which frequently experience high
intensity rainfall events, as kinetic energy increases so does rainfall intensity up to about
75mm/h and believes that this relationship could underestimate the kinetic energy of tropical
storms by as much as 10 per cent (Salako, 2007). The effect of events with different rainfall
intensities on soil erosion risk in sugarcane fields was studied by the Mauritius Sugar
Industry Research Institute (MSIRI) (Le Roux, 2005; Nigel, 2011). On bare sugarcane
interrows the soil loss rate averaged low values between 0.2 and 5 t.ha -1.yr-1 at a rainfall
intensity of 90mm.h-1. According to the MSIRI study a threshold rainfall of about 60mm-1 is
present above which erosion starts to occur. While the MSIRI research provides valuable
information, it was only conducted on a few sugarcane fields on two soils types (Low Humic
Latosols and Dark Magnesium Clay) with slopes ranging from 7 to 13% and therefore it has
limited application to other parts of the topographically complex island (Le Roux, 2005).
1.5. The orographic effect on rainfall distribution and erosivity
The classical depiction of orographic precipitation is a mountain range in the
midlatitudes whose axis lies perpendicular to the prevailing wind direction (Roe, 2005).
Orography is the influence of mountain topography on subaerial weather conditions, creating
spatial and temporal variation of rainfall (Terry & Wotling, 2011). It is well established that
topography plays a major role in the development of cloud and rainfall through orographic
lifting (Terry & Wotling, 2011; Tobin et al., 2011). The best known relationship of the
orographic effect is rainfall increasing with elevation (Prudhomme & Reed, 1998). Orography
occurs when air lifts as it flows over mountains triggers convective instability and enhances
the chance of rainfall, consequently more precipitation falls on the windward compared to
leeward slopes (Terry & Wotling, 2011). Accordingly, in the leeward side of major mountain
barriers that occupy latitudes with consistent prevailing winds, the familiar ‘rain-shadow’
effect is observed (Terry & Wotling, 2011).
© University of Pretoria
16
In regions characterised by complex orography and precipitation gradients, such as
often found on volcanic islands, topographic forms can trigger rain storms by extracting
atmospheric moisture through orographic precipitation mechanisms (Johansson & Chen,
2003; Boni et al., 2004). Orographic precipitation is particularly evident on mountainous
islands, such as Mauritius, where maritime winds in predominant direction and high-elevation
topography cause adiabatic cooling through forced uplift. This creates a greater possibility for
rain production by producing a cloudy environment that reduces evapotranspiration losses
(Custrodio et al., 1991; Terry & Wotling, 2011). Depending on the size of the topographical
feature and efficiency of the rainfall release processes the windward side will experience an
increased in precipitation because the forced lifting of the approaching air masses causes
the discharge of rainfall and a potential increase in precipitation with elevation (Johansson &
Chen, 2003). Accompanying this is the ‘rain shadow’ effect on the leeward side (Nel et al.,
2012). A proportion of the heavy rainfall experienced on Mauritius appears to be induced by
the elevated central plateau (Nel et al., 2012). Such orographic influences on the spatial and
temporal distribution of rainfall and moisture gradient also have important implications for
water resource availability and provision (Terry & Wotling, 2011). In places where a major
topographic barrier interacts intensely with narrow zones of mesoscale convective systems
then unusually heavy rainfall and the generation of significant flood events may occur (Terry
& Wotling, 2011).
Topography, from a small hill to a large-scale mountain range, influences all scales of
atmospheric motion (Bender et al., 1985). In the case of a landfalling tropical cyclone, the
topography of the specific terrain being transversed has a vital impact on certain aspects of
the rainfall event’s behaviour such as the event’s movement, rate of decay and rainfall
distribution. Strong relationships have been proven between the total rainfall associated with
landfalling tropical cyclones and the local distributions of orography. Therefore the maximum
hourly rainfall is generally higher in the mountain upslope regions (Bender et al., 1985).
On a global scale numerous studies have been conducted in different climatic
environments, including Alpine and Tropical regions, on the impact that topographical
features have on rainfall distribution. In the tropical regions, namely Tropical South Pacific
(TSP) and the volcanic island of Tahiti, a strong orographic influence is apparent, resulting in
considerable variation in yearly precipitation that corresponds to substantial changes in the
natural vegetation patterns (Terry & Wotling, 2011). In both regions topography is recognised
as being the major influence on the spatial distribution of precipitation. Wotling et al. (2000)
speculated that topographical relief is directly proportional to rainfall intensity and hence the
steeper the relief, the higher the rainfall intensity. To prove this some deterministic modelling
© University of Pretoria
17
at event-scale was carried out in order to help predict the variations in space of rainfall
intensities (Wotling et al., 2000). Notwithstanding this study, Diodato (2005) noted that the
very little is known about precipitation pattern in mountainous areas of tropical region
because of the complex topography.
Studies conducted in the Alpine regions of Sweden (Johansson & Chen, 2003) and
the Himalayan Mountains (Bookhagen & Burbank, 2006) found that precipitation distribution
is as strongly influenced by topography as in tropical regions. Topography and relief not only
cause high rainfall bands over mountains but also directly influence the rainfall
characteristics (Bookhagen & Burbank, 2006). Nyssen et al. (2005) noted that topographical
aspects such as steep overall slope gradient and valley aspects control the spatial
distribution of annual rain depth. The development of high intensity rainfall events as a
product of topography plays a fundamental role in the type and depth of rainfall and
subsequently the rainfall erosivity within a region.
An increase in rainfall and rainfall erosivity with altitude is, however, not always
evident. The anticipated increase in rainfall with altitude was not apparent when comparing
rainfall totals measured at different stations, covering an altitudinal range of 1060m to 3165
m.a.s.l, in the KwaZulu-Natal Drakensberg, South Africa (Nel & Sumner, 2007) where an
inverse relationship was found between altitude and the associated maximum rainfall
intensity. Though the mean kinetic energy produced during individual events was similar
throughout the area, the high altitude stations in the Drakensberg recorded lower maximum
rainfall intensities and fewer high intensity events than the lower altitudes stations (Nel &
Sumner, 2007). Individual events at all altitudes in the Drakensberg could potentially detach
soil, however, at higher altitudes on the escarpment a lower percentage of rain falls as
erosive events producing lower cumulative kinetic energy and total rainfall erosivity than at
stations on the foothills. Nel & Sumner (2007) explain that the altitudinal differences in
cumulative kinetic energy and cumulative erosivity is due to the lack of erosive rainfall events
during early and late summer at the high altitude stations on the escarpment, while lower
altitudes experience considerably more erosive rainfall events during this period.
Other studies conducted in mountainous areas display similar results to those found
by Nel & Sumner (2007). Hoyos et al. (2005) found that rainfall intensity in the Columbian
Andes appears to be affected by elevation, with consistently lower rainfall intensity (I30)
values at the rainfall stations with the highest altitude. A similar relationship was found in
Honduras, Costa Rica and Sri Lanka and in all cases there is an inverse relationship
between rainfall erosivity and elevation, with the latter increasing to approximately 1750m,
followed by a decrease to lower values at the highest elevation (2120m) (Hoyos et al., 2005).
© University of Pretoria
18
This is attributed to fewer large raindrops being formed by accretion and coalescence at
higher elevations (Hoyos et al., 2005).
Since many tropical volcanic islands have an environment where there is an
altitudinal and temporal difference in rainfall due to the nature of the topography and its
orographic effects, a few extreme rainfall events with high rainfall intensity can generate the
bulk of the cumulative erosivity (Nel et al., 2013). The stage at which the erosive events
experience the high rainfall intensity also affects the amount of sediment eroded, total soil
loss, type and particle size distribution of soil that is eroded. It is therefore necessary to
identify and understand the impact of rainfall event profiles on the severity of the erosion
experienced in tropical island environments such as Mauritius.
1.6. Importance of ‘event profiles’ on infiltration, runoff and soil erosion
As rain falls onto unsaturated soil, a certain amount of the total rainfall infiltrates into
the soil, at the same time the deficit (total rainfall minus total infiltration) will run-off the
surface (Xue & Gavin, 2008). Water percolating into the slope increases the water content of
the soil and reduces the in-site suction, thus decreasing the infiltration rate of the soil (Xue &
Gavin, 2008). Rainfall intensity is a fundamental control of interrill runoff and erosion
(Parsons & Stone, 2006). Although it is generally assumed that runoff is inversely related to
infiltration, and the influence of rainfall intensity can be understood through its effect on
infiltration (Xue & Gavin, 2008), this assumption is too generalised. First, spatial
heterogeneity of infiltration characteristics vary with soil type, such that of the soil surface
may experience increased infiltration with increased rainfall. Second, increased rainfall
intensity may lead to the formation of soil crusts thereby reducing infiltration. The influence of
soil permeability is also important to infiltration and runoff generation (Parsons & Stone,
2006).
Nonetheless the proportion of the total rainfall resulting in infiltration and run-off varies
continuously during a rainfall event (Xue & Gavin, 2008). Rainfall events commonly
demonstrate repeated fluctuations in intensity, such that peak rainfall rates in an event can
exceed the mean event rate by an order of magnitude (Dunkerley, 2008). The occurrence of
peak intensity can be at any instant during a rainfall event, and these events can be
classified according to where the peak falls within the event duration (Dunkerley, 2008).
Commonly accepted terminology includes describing the rainfall event by its leading quartile,
such as first quartile events, fourth quartile event- similar to that developed by Huff (1967) or
© University of Pretoria
19
using uniform intensity, advanced peak, intermediate peak and delayed-peak distributions
according to Zhang et al. (1997).
An ‘event profile’, as a general description, is used to refer to the pattern of temporal
fluctuations in intensity during a rainfall event (Dunkerley, 2008). Distinct rainfall intensity
fluctuations are neglected by the majority of published studies on soil hydraulic properties
such as infiltrabillity and soil erosion processes (Dunkerley, 2012). Event profiles are critical
as the stage in which an event receives its peak intensity impacts on the severity of the
erosion experienced and the amount of sediment eroded, the total soil loss and the particle
size distribution of the eroded sediment (Parsons & Stone, 2006). Subsequently, intra-storm
attributes of the rainfall events become vital in identifying the influence the ‘event profile’ has
on the rainfall erosivity and the potential soil erosion risk which an event causes. Xue &
Gavin (2008) emphasise that the depth of infiltration and runoff is sensitive to the rainfall
event profiles, as event profiles showing an early peak generate more infiltration and less
runoff than events with late peaks in duration. This leads to higher runoff rates, soil loss and
larger particle sizes being eroded (Parsons & Stone, 2006). Therefore, in some cases the
rainfall event profile and not the mean rain rate most noticeably control the relative
magnitudes of infiltration and runoff in a real event (Dunkerley, 2012).
An intra-storm analysis on extreme erosive events was conducted in the KwaZulu-
Natal Drakensberg by Nel (2007) who determined that although the extreme events exhibit
temporal variability in rainfall depth, more than 80% of rainfall generated by extreme events
was received within the first 300minutes of the events. Rainfall intensity received from the
extreme events also exhibits temporal variability and none of the extreme events displayed
constant intensity over time (Nel, 2007). This is significant as Parsons & Stone (2006)
indicated that rainfall events with constant-intensities yield lower soil loss than the events
with varying-intensities. The ‘event profile’ in relation to the rainfall event intensity also
influences the clay-content of the eroded materials (Parsons & Stone, 2006). A study by
(Stocking & Elwell, 1976) indicated that the magnitude of the peak intensities within the
‘event profile’ is most critical to the erosional process and sediment transport peaks in
response to intense rainfall (Nel, 2007). Though it is generally accepted that the erosivity of a
rainfall event is affected by the intra-storm distribution of the rainfall intensity, it has only
recently been incorporated into soil-erosion models (Parsons & Stone, 2006).
Despite previous studies investigating storm kinetic energy and erosivity on Mauritius,
no studies have investigated the intra-storm distribution and the general climatology of
rainfall parameters in tropical island environments. Therefore, the general aim of this study is
© University of Pretoria

20
to investigate the within-storm distribution of rainfall depth, extreme rainfall intensity and
cumulative kinetic energies on the tropical island of Mauritius in the Indian Ocean.
1.7. Aim and Objectives
1.7.1. Aim
The aim of this research project is to conduct an intra-storm analysis of the rainfall
characteristics and general climatology of erosive events on Mauritius. To achieve the above,
the following objectives have been set out:
1.7.2. Objectives
i. To identify the top twenty erosive events (based on the ‘total kinetic energy
generated’) between 2004 to 2008 at six automated weather stations situated in the
western and central regions of the island.
ii. To describe the general rainfall and climatological characteristics of the top twenty
erosive events at each automated weather station;
iii. To provide a comprehensive intra-storm analysis of each event;
iv. To contrast the spatial and temporal differences between the automated weather
stations.
1.8. Project Outline
This research project is divided into six chapters. In this chapter an introduction and
literature review on the concept of rainfall induced soil erosion, rainfall erosivity and the
relationship between rainfall intensity and kinetic energy within the context of a tropical island
environment with an elevated central interior was presented. Chapter 2 provides information
pertaining to the study area and the background to the geographic location and extent of the
island, the geological history, geomorphology, climate as well as the pedology and land use
of the island. Chapter 3 outlines the methodology followed and used in the analyses of the
data used in this project. Chapter 4 presents the results produced following the described
methodology, followed by a detailed discussion and interpretation of the results in Chapter 5.
Finally, Chapter 6 highlights the main conclusions drawn from this project as well as the
recommendations and suggestions for future studies.
© University of Pretoria
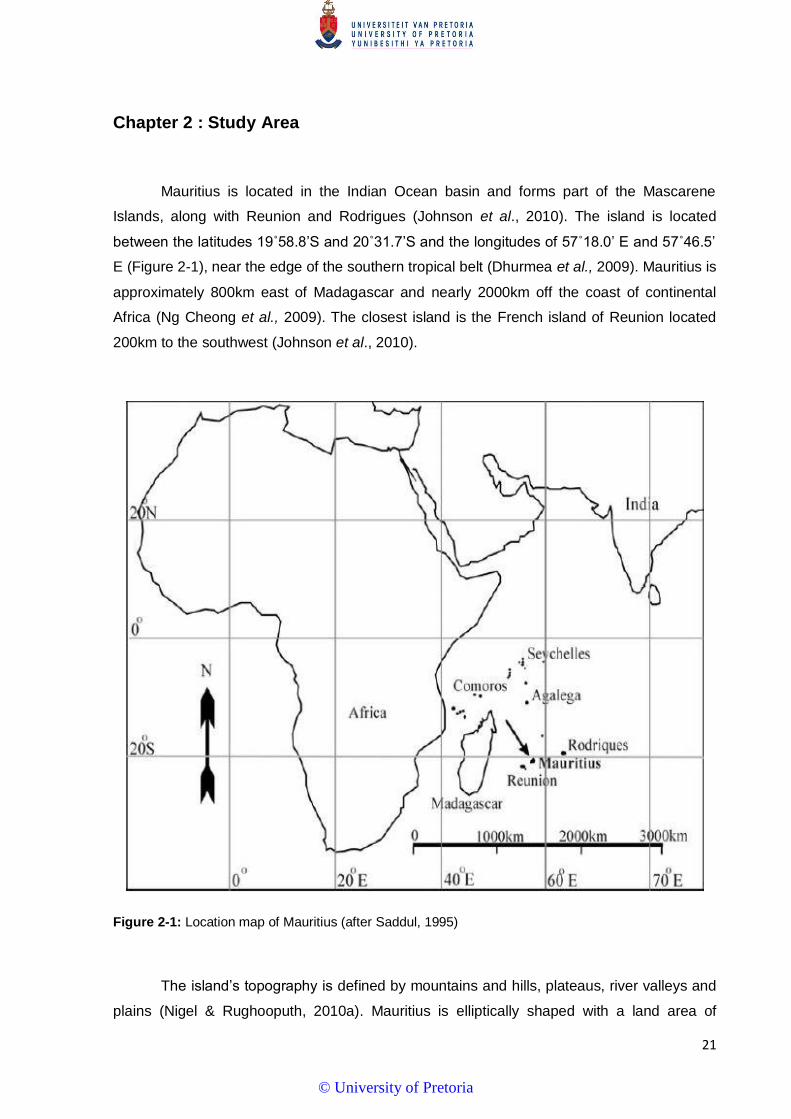
21
Chapter 2 : Study Area
Mauritius is located in the Indian Ocean basin and forms part of the Mascarene
Islands, along with Reunion and Rodrigues (Johnson et al., 2010). The island is located
between the latitudes 19˚58.8’S and 20˚31.7’S and the longitudes of 57˚18.0’ E and 57˚46.5’
E (Figure 2-1), near the edge of the southern tropical belt (Dhurmea et al., 2009). Mauritius is
approximately 800km east of Madagascar and nearly 2000km off the coast of continental
Africa (Ng Cheong et al., 2009). The closest island is the French island of Reunion located
200km to the southwest (Johnson et al., 2010).
Figure 2-1: Location map of Mauritius (after Saddul, 1995)
The island’s topography is defined by mountains and hills, plateaus, river valleys and
plains (Nigel & Rughooputh, 2010a). Mauritius is elliptically shaped with a land area of
© University of Pretoria
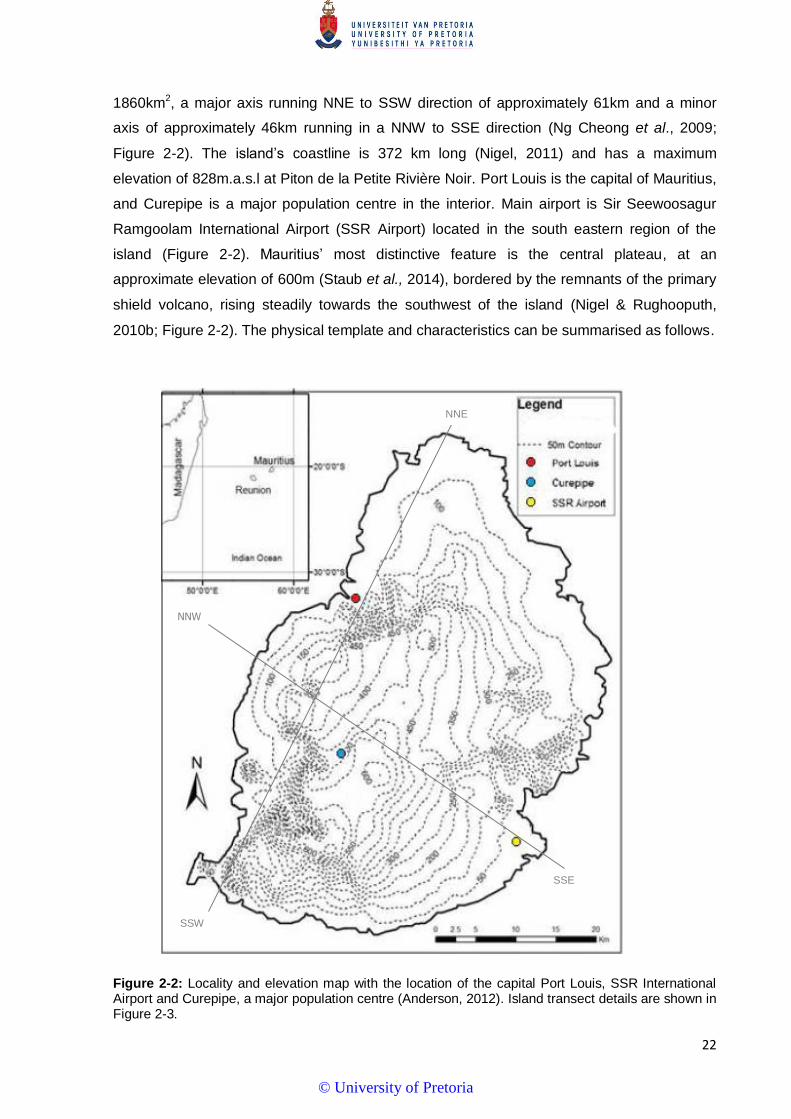
22
1860km2, a major axis running NNE to SSW direction of approximately 61km and a minor
axis of approximately 46km running in a NNW to SSE direction (Ng Cheong et al., 2009;
Figure 2-2). The island’s coastline is 372 km long (Nigel, 2011) and has a maximum
elevation of 828m.a.s.l at Piton de la Petite Rivière Noir. Port Louis is the capital of Mauritius,
and Curepipe is a major population centre in the interior. Main airport is Sir Seewoosagur
Ramgoolam International Airport (SSR Airport) located in the south eastern region of the
island (Figure 2-2). Mauritius’ most distinctive feature is the central plateau, at an
approximate elevation of 600m (Staub et al., 2014), bordered by the remnants of the primary
shield volcano, rising steadily towards the southwest of the island (Nigel & Rughooputh,
2010b; Figure 2-2). The physical template and characteristics can be summarised as follows.
Figure 2-2: Locality and elevation map with the location of the capital Port Louis, SSR International Airport and Curepipe, a major population centre (Anderson, 2012). Island transect details are shown in Figure 2-3.
SSW
SSE
NNW
NNE
© University of Pretoria

23
2.1. Geology
All of the Mascarene Islands are the summits of great volcanic cones that emerged
out of the ocean floor. Mauritius is composed from remnants of a massive shield volcano
covered by younger volcanic rocks. The geology can be described as being entirely of
volcanic origin and is composed of basaltic rock with differing densities due to the intricate
nature of its formation, except for the beaches, coral formations of the reefs, the alluvial
deposits at the coast and the limited extents of alluvium (e.g. estuary of Black River) (Proag,
1995; Le Roux, 2005; Newsome & Johnson, 2013). The brief volcanic chronology of
Mauritius, described by Proag (1995), is the result of two major activity periods separated by
a gap of 5.5 million years:
― Emergence and Older Series : 10 to 5 million years ago giving rise to the old lavas
― Intermediate and Younger Series : 3.5 million years to 25,000 years
Hence, according to Proag (1995) the formation of the island should be considered in
four volcanic phases:
1. The Breccia Series or Emergence Period of the island 10 to 6.7 Million Years (MY)
Before Present (B.P.)
2. The Old Series – Old Lavas (6.2 to 5million years)
3. The Intermediate Series – Early Lavas (1.5 million years)
4. The Younger Volcanic Series – Late Lavas (700,000 to 25,000 years)
Emergence period of the island, 10 to 6.7 million years ago, started as a rift in the
ocean floor that acted as an eruptive fissure emitting volcanic product such as tuff, boulders
and breccia flows, hence this brecciated series corresponds to the first phase of the old
series (old lavas). The original foundation of the island, characterised by a bulge in the
structure, was made up of pillow lava. Subsequently, a 500,000 year period of relative calm
followed, causing subsidence to occur in the centre of the island as the underlying magma
decreased in pressure (Proag, 1995).
During the second phase or Old Lavas, 6.2 to 5 million years ago, the island
developed a circular, shield shape characterised by a single volcano. The established part of
the big strato-volcano is a vast dome of 40km diameter; 900m high elevation emerged out of
the ocean. Poorly developed minor structures of 5-30m thick compact basalts were radially
emitted from the strato-volcano and covered most of the lava from the Emergence Period
(Proag, 1995). While this period was marked by occasional periods of lava flow (50-100m
© University of Pretoria
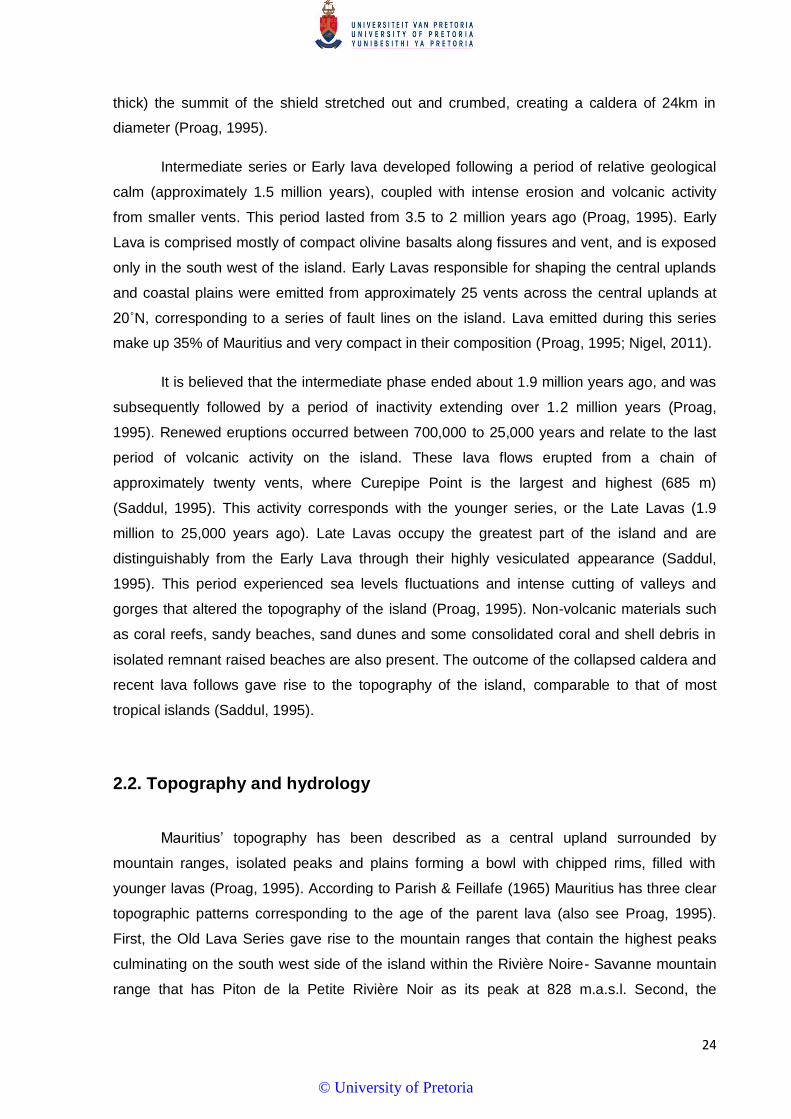
24
thick) the summit of the shield stretched out and crumbed, creating a caldera of 24km in
diameter (Proag, 1995).
Intermediate series or Early lava developed following a period of relative geological
calm (approximately 1.5 million years), coupled with intense erosion and volcanic activity
from smaller vents. This period lasted from 3.5 to 2 million years ago (Proag, 1995). Early
Lava is comprised mostly of compact olivine basalts along fissures and vent, and is exposed
only in the south west of the island. Early Lavas responsible for shaping the central uplands
and coastal plains were emitted from approximately 25 vents across the central uplands at
20˚N, corresponding to a series of fault lines on the island. Lava emitted during this series
make up 35% of Mauritius and very compact in their composition (Proag, 1995; Nigel, 2011).
It is believed that the intermediate phase ended about 1.9 million years ago, and was
subsequently followed by a period of inactivity extending over 1.2 million years (Proag,
1995). Renewed eruptions occurred between 700,000 to 25,000 years and relate to the last
period of volcanic activity on the island. These lava flows erupted from a chain of
approximately twenty vents, where Curepipe Point is the largest and highest (685 m)
(Saddul, 1995). This activity corresponds with the younger series, or the Late Lavas (1.9
million to 25,000 years ago). Late Lavas occupy the greatest part of the island and are
distinguishably from the Early Lava through their highly vesiculated appearance (Saddul,
1995). This period experienced sea levels fluctuations and intense cutting of valleys and
gorges that altered the topography of the island (Proag, 1995). Non-volcanic materials such
as coral reefs, sandy beaches, sand dunes and some consolidated coral and shell debris in
isolated remnant raised beaches are also present. The outcome of the collapsed caldera and
recent lava follows gave rise to the topography of the island, comparable to that of most
tropical islands (Saddul, 1995).
2.2. Topography and hydrology
Mauritius’ topography has been described as a central upland surrounded by
mountain ranges, isolated peaks and plains forming a bowl with chipped rims, filled with
younger lavas (Proag, 1995). According to Parish & Feillafe (1965) Mauritius has three clear
topographic patterns corresponding to the age of the parent lava (also see Proag, 1995).
First, the Old Lava Series gave rise to the mountain ranges that contain the highest peaks
culminating on the south west side of the island within the Rivière Noire- Savanne mountain
range that has Piton de la Petite Rivière Noir as its peak at 828 m.a.s.l. Second, the
© University of Pretoria
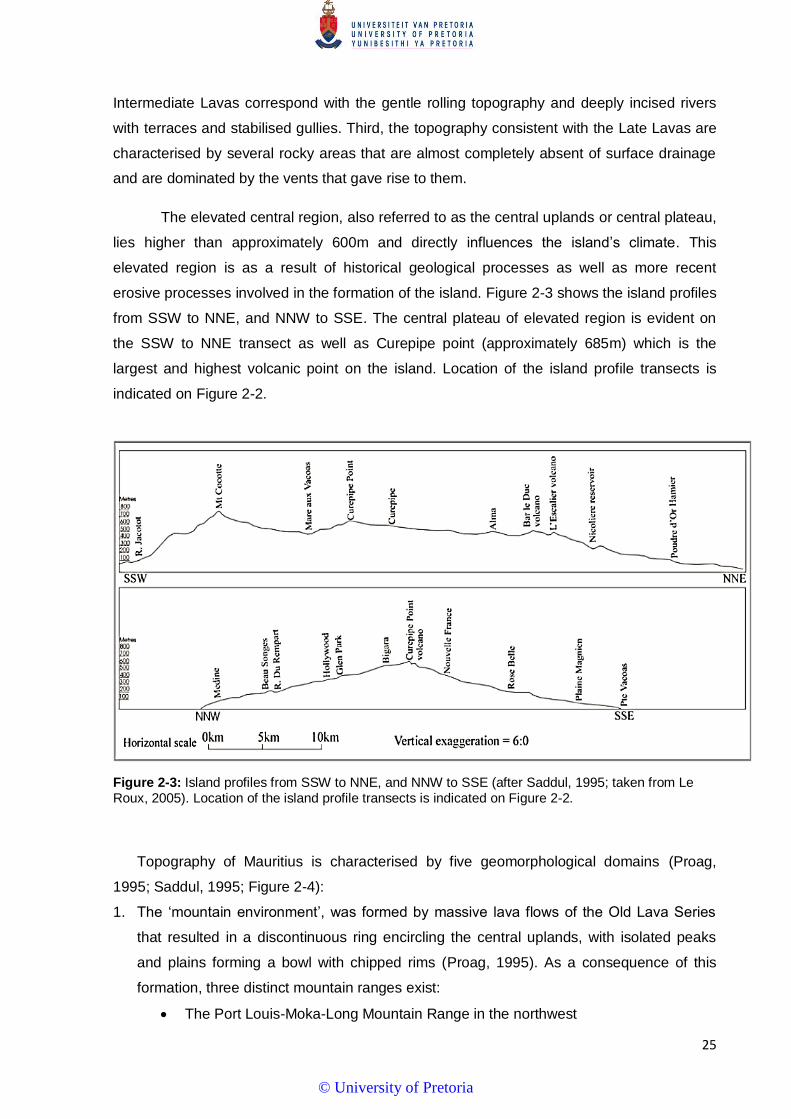
25
Intermediate Lavas correspond with the gentle rolling topography and deeply incised rivers
with terraces and stabilised gullies. Third, the topography consistent with the Late Lavas are
characterised by several rocky areas that are almost completely absent of surface drainage
and are dominated by the vents that gave rise to them.
The elevated central region, also referred to as the central uplands or central plateau,
lies higher than approximately 600m and directly influences the island’s climate. This
elevated region is as a result of historical geological processes as well as more recent
erosive processes involved in the formation of the island. Figure 2-3 shows the island profiles
from SSW to NNE, and NNW to SSE. The central plateau of elevated region is evident on
the SSW to NNE transect as well as Curepipe point (approximately 685m) which is the
largest and highest volcanic point on the island. Location of the island profile transects is
indicated on Figure 2-2.
Figure 2-3: Island profiles from SSW to NNE, and NNW to SSE (after Saddul, 1995; taken from Le Roux, 2005). Location of the island profile transects is indicated on Figure 2-2.
Topography of Mauritius is characterised by five geomorphological domains (Proag,
1995; Saddul, 1995; Figure 2-4):
1. The ‘mountain environment’, was formed by massive lava flows of the Old Lava Series
that resulted in a discontinuous ring encircling the central uplands, with isolated peaks
and plains forming a bowl with chipped rims (Proag, 1995). As a consequence of this
formation, three distinct mountain ranges exist:
The Port Louis-Moka-Long Mountain Range in the northwest
© University of Pretoria
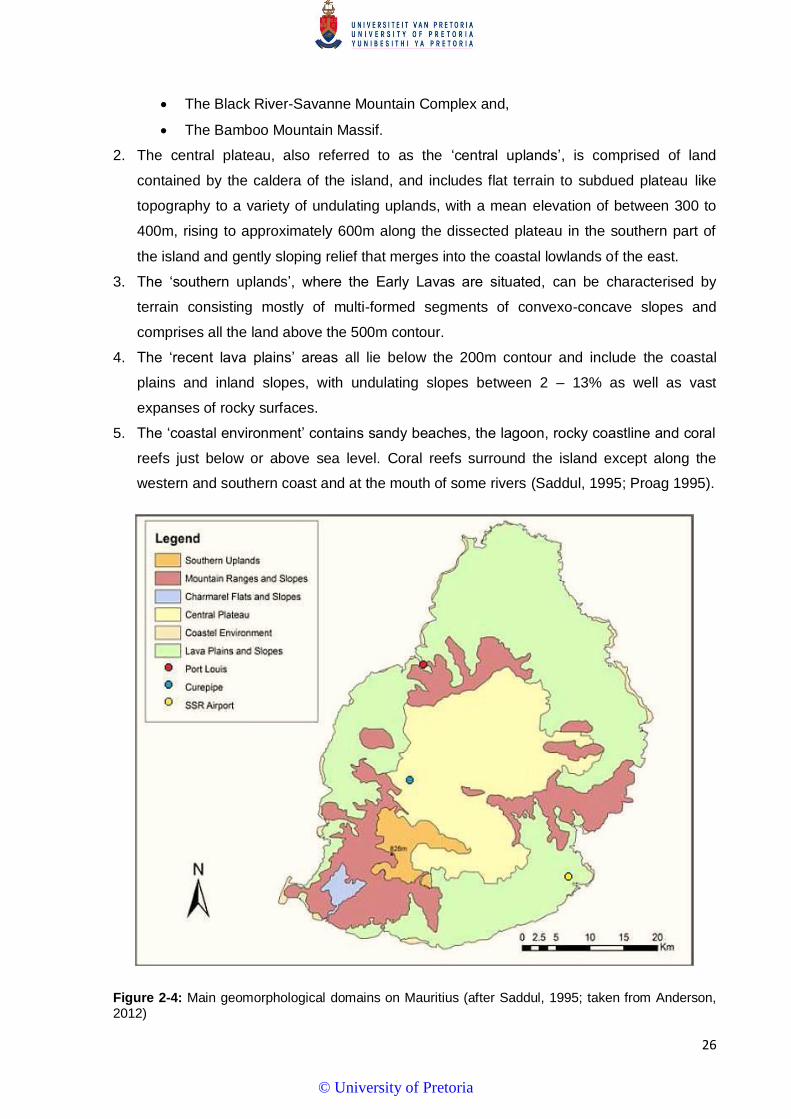
26
The Black River-Savanne Mountain Complex and,
The Bamboo Mountain Massif.
2. The central plateau, also referred to as the ‘central uplands’, is comprised of land
contained by the caldera of the island, and includes flat terrain to subdued plateau like
topography to a variety of undulating uplands, with a mean elevation of between 300 to
400m, rising to approximately 600m along the dissected plateau in the southern part of
the island and gently sloping relief that merges into the coastal lowlands of the east.
3. The ‘southern uplands’, where the Early Lavas are situated, can be characterised by
terrain consisting mostly of multi-formed segments of convexo-concave slopes and
comprises all the land above the 500m contour.
4. The ‘recent lava plains’ areas all lie below the 200m contour and include the coastal
plains and inland slopes, with undulating slopes between 2 – 13% as well as vast
expanses of rocky surfaces.
5. The ‘coastal environment’ contains sandy beaches, the lagoon, rocky coastline and coral
reefs just below or above sea level. Coral reefs surround the island except along the
western and southern coast and at the mouth of some rivers (Saddul, 1995; Proag 1995).
Figure 2-4: Main geomorphological domains on Mauritius (after Saddul, 1995; taken from Anderson, 2012)
© University of Pretoria
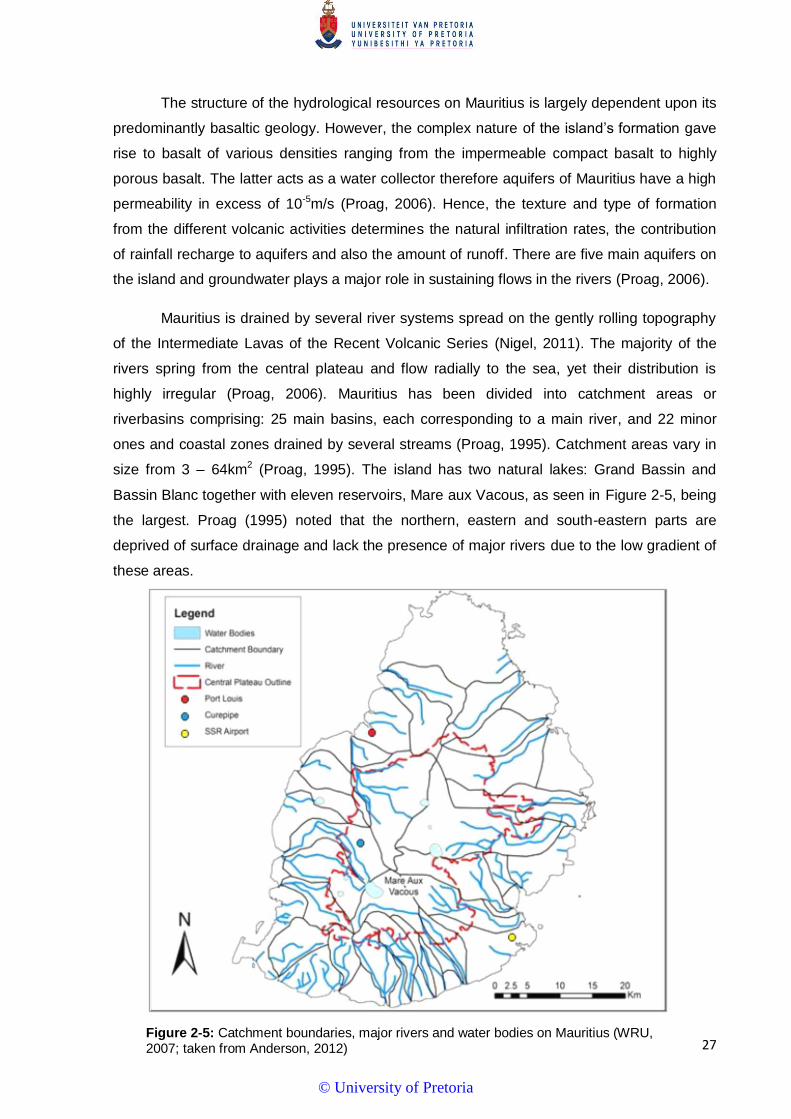
27
The structure of the hydrological resources on Mauritius is largely dependent upon its
predominantly basaltic geology. However, the complex nature of the island’s formation gave
rise to basalt of various densities ranging from the impermeable compact basalt to highly
porous basalt. The latter acts as a water collector therefore aquifers of Mauritius have a high
permeability in excess of 10-5m/s (Proag, 2006). Hence, the texture and type of formation
from the different volcanic activities determines the natural infiltration rates, the contribution
of rainfall recharge to aquifers and also the amount of runoff. There are five main aquifers on
the island and groundwater plays a major role in sustaining flows in the rivers (Proag, 2006).
Mauritius is drained by several river systems spread on the gently rolling topography
of the Intermediate Lavas of the Recent Volcanic Series (Nigel, 2011). The majority of the
rivers spring from the central plateau and flow radially to the sea, yet their distribution is
highly irregular (Proag, 2006). Mauritius has been divided into catchment areas or
riverbasins comprising: 25 main basins, each corresponding to a main river, and 22 minor
ones and coastal zones drained by several streams (Proag, 1995). Catchment areas vary in
size from 3 – 64km2 (Proag, 1995). The island has two natural lakes: Grand Bassin and
Bassin Blanc together with eleven reservoirs, Mare aux Vacous, as seen in Figure 2-5, being
the largest. Proag (1995) noted that the northern, eastern and south-eastern parts are
deprived of surface drainage and lack the presence of major rivers due to the low gradient of
these areas.
Figure 2-5: Catchment boundaries, major rivers and water bodies on Mauritius (WRU, 2007; taken from Anderson, 2012)
© University of Pretoria

28
2.3. Pedology (soils)
Remarkably similar geology, climate, soils and cropping characteristics between
Mauritius and some parts of the Hawaiian Islands led to the acceptance of a classification
system used for soil survey of the territory of Hawaii for the island of Mauritius (Parish &
Feillafe, 1965; Arlidge & Wong You Cheong, 1975; Williame, 1984; Proag, 1995; Le Roux
2005; Nigel, 2011; Anderson, 2012). The classification of soil types are based on Great Soil
Groups with subdivisions and Families based on differences in rainfall or parent materials
portrays the soil types of Mauritius in relation to their age or development stage (Pears, 1985
cited in Proag, 1995: 21; Le Roux, 2005; Figure 2-6).
Boundaries between soil groups are diffuse, and are differentiated by chemical rather
than morphological criteria. Mauritian soils developed virtually exclusively on olivine basaltic
lavas or highly vesiculated basaltic lava (Proag, 1995). As a result of the basaltic origin of the
Figure 2-6: Classification of Soils in Mauritius (Proag, 1995)
© University of Pretoria
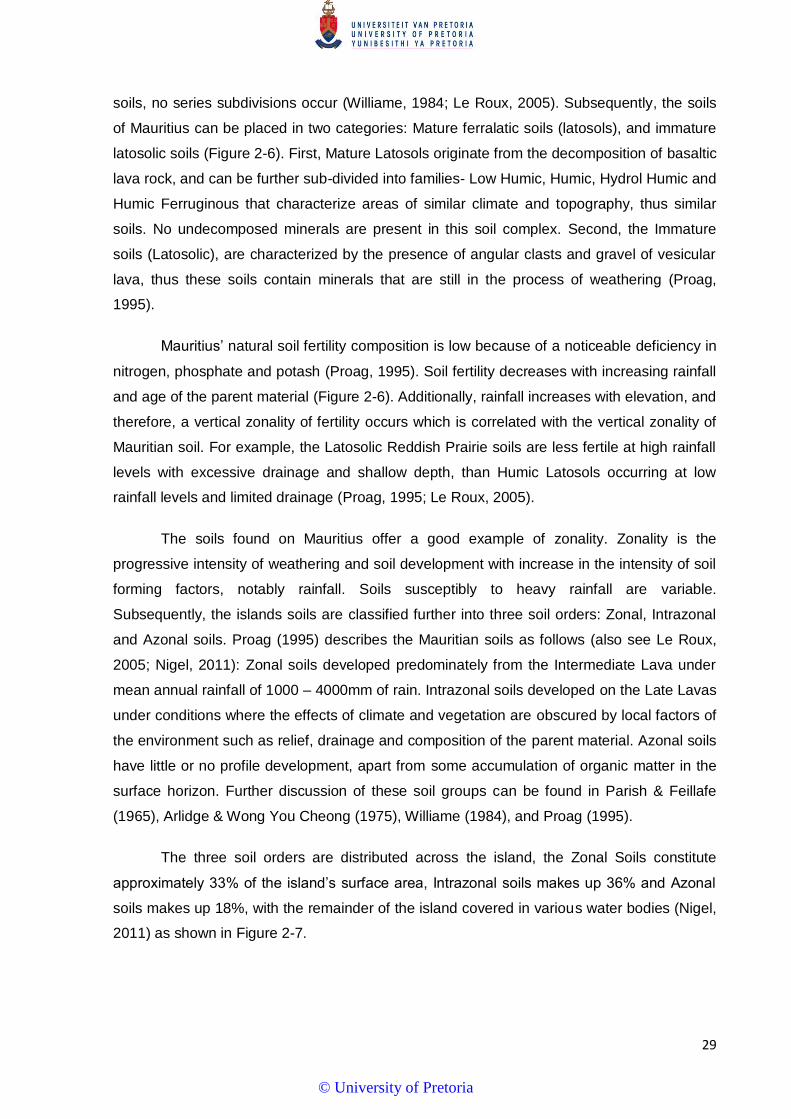
29
soils, no series subdivisions occur (Williame, 1984; Le Roux, 2005). Subsequently, the soils
of Mauritius can be placed in two categories: Mature ferralatic soils (latosols), and immature
latosolic soils (Figure 2-6). First, Mature Latosols originate from the decomposition of basaltic
lava rock, and can be further sub-divided into families- Low Humic, Humic, Hydrol Humic and
Humic Ferruginous that characterize areas of similar climate and topography, thus similar
soils. No undecomposed minerals are present in this soil complex. Second, the Immature
soils (Latosolic), are characterized by the presence of angular clasts and gravel of vesicular
lava, thus these soils contain minerals that are still in the process of weathering (Proag,
1995).
Mauritius’ natural soil fertility composition is low because of a noticeable deficiency in
nitrogen, phosphate and potash (Proag, 1995). Soil fertility decreases with increasing rainfall
and age of the parent material (Figure 2-6). Additionally, rainfall increases with elevation, and
therefore, a vertical zonality of fertility occurs which is correlated with the vertical zonality of
Mauritian soil. For example, the Latosolic Reddish Prairie soils are less fertile at high rainfall
levels with excessive drainage and shallow depth, than Humic Latosols occurring at low
rainfall levels and limited drainage (Proag, 1995; Le Roux, 2005).
The soils found on Mauritius offer a good example of zonality. Zonality is the
progressive intensity of weathering and soil development with increase in the intensity of soil
forming factors, notably rainfall. Soils susceptibly to heavy rainfall are variable.
Subsequently, the islands soils are classified further into three soil orders: Zonal, Intrazonal
and Azonal soils. Proag (1995) describes the Mauritian soils as follows (also see Le Roux,
2005; Nigel, 2011): Zonal soils developed predominately from the Intermediate Lava under
mean annual rainfall of 1000 – 4000mm of rain. Intrazonal soils developed on the Late Lavas
under conditions where the effects of climate and vegetation are obscured by local factors of
the environment such as relief, drainage and composition of the parent material. Azonal soils
have little or no profile development, apart from some accumulation of organic matter in the
surface horizon. Further discussion of these soil groups can be found in Parish & Feillafe
(1965), Arlidge & Wong You Cheong (1975), Williame (1984), and Proag (1995).
The three soil orders are distributed across the island, the Zonal Soils constitute
approximately 33% of the island’s surface area, Intrazonal soils makes up 36% and Azonal
soils makes up 18%, with the remainder of the island covered in various water bodies (Nigel,
2011) as shown in Figure 2-7.
© University of Pretoria
30
Figure 2-7: Soil map of Mauritius from DOS and MSIRI (1962), taken from Nigel (2011)
2.4. Climate and weather
Mauritius has a tropical maritime climate that is influenced by the surrounding Indian
Ocean (Saddul, 1995). The island is under the influence of atmospheric circulation,
developing from the two primary zones: a low pressure zone in the north and a high pressure
zone in the south (Williame, 1984; Nigel, 2011). Substantial variations in rainfall and other
climatic characteristics are due prominently to differences in elevation, distance from the
coast, windward-leeward locations, cold fronts, the position of the Inter Tropical Convergence
Zone (ITCZ), occasional convective storms and seasonality (Fowdur et al., 2014). The
average annual temperature is 22˚C: July being the coolest month with temperatures ranging
from 16˚C in the central uplands to 22˚C in the coastal areas (Proag, 1995). February is the
warmest month with temperatures varying from 20˚C (central uplands) to 28˚C (coastal).
© University of Pretoria

31
Average sunshine per day varies between 7 and 8 hours depending on the season (Padya,
1989).
For the majority of the year, Mauritius lies within the South East Trade Winds but
throughout the warm and rainy summer months (November to May) the most important
climatological features are tropical cyclones and depressions associated with the seasonal
movement of the ITCZ (Dennett, 1978). However, during the comparatively dry winter period,
(April to October) the South East Trade Winds dominate and are accompanied with few
rainfall events, which are associated with frontal systems (Nigel, 2011).
Another importance influence on weather patterns of Mauritius is the spatial and
temporal distributions of mean Sea Surface Temperature (SST). Typically, the mean SST is
higher on the western part of the tropical and subtropical Indian Ocean, and is largely related
to the warm westward-flowing south equatorial current. The SST near Mauritius varies from
22˚C in September to 27˚C in March. Even though intra-annual variations in SST are small,
they indicate seasonal changes such as summer being the hot and wet season, and the
winter is warm and dry. Inter-annual variations in the mean SST are also reasonably small
(Padya, 1989; Nigel, 2011).
2.4.1. Weather systems in Mauritius
Eight weather systems prevailing over Mauritius during a typical year have been
identified by Fowdur et al. (2014). These are windfields over Mauritius, cyclonic activity,
ITCZ, cold fronts, anticyclones, sea breezes, easterly wave perturbations in the lower
troposphere, and cloud masses derived from upper level winds. Particular focus has been
given to cyclones, due to their destructive nature and high kinetic energy and subsequent
erosive nature. The weather systems are described below:
2.4.1.1. Windfields over Mauritius
Mauritius is located at the edge of the tropics, within the belt of trade winds. Winds on
the island are influenced by two main regimes, The South East Trade Winds (easterlies) and
the North West Monsoon Winds (westerlies). Westerlies occur predominately in the summer
months when the ITCZ lies over the south of Mauritius. The months April to May are
dominated largely by easterlies (Fowdur et al., 2014). Padya (1989) identified that by the end
of June, the easterlies show an expansion southwards. South east trade winds (easterlies)
supply the dominant moisture advection and combined with topographic uplift and sea-
breezes are responsible for the steep rainfall gradient and the west coast rain-shadow effect
© University of Pretoria
32
which impacts upon erosion risk and rainfall erosivity distribution (Fowdur et al., 2014; Staub
et al., 2014).
2.4.1.2. Cyclonic activity
Mauritius typically experiences storms ranging in intensity from tropical depressions
to tropical cyclones in any single cyclone season, yet intense or very intense tropical
cyclones are relatively rare (Parker, 1999). Cyclonic events are considered erosive in nature
and are a climatic factor of substantial importance to agricultural production in Mauritius
(Proag, 1995). There are, on average, 11 atmospheric depressions each summer that
develop in the south western part of the tropical cyclone belt in the Indian Ocean (Padya,
1989). Due to the island’s position in the Indian Ocean, cyclones most commonly form
northwest of Mauritius and follow relatively erratic paths in a south-westerly direction (Figure
2-8) (Padya, 1989). The incidence of intense or very intense tropical cyclones aligning on the
main island of Mauritius is estimated at between 1:8 and 1:15 years (Parker, 1999).
The cyclonic period traditionally extends from November to March. Average rainfall
during these tropical cyclones is 245mm, but variations are largely dependent on the nature
and intensity of the cyclone and on the distance of the cyclone while passing the island (Le
Roux, 2005; Nigel, 2011). Typically, rainfall amount is highest (>300mm/day) when the
tropical cyclone passes close enough for the island to fall under the influence of the inner
convection band and when the passing is not so close, the rainfall amount is moderate but
substantial (Padya, 1989; Nigel, 2011). From 20-22 January 2002, Mauritius was hit by the
most recent very intense cyclone (Dina) and saw 488mm of rain being recorded at Vacoas
during the event with wind gusts of 209km/h. As is evident in Figure 2-8 each of the major
cyclone events has a specific trajectory.
During the study period, 2004 – 2008, numerous tropical cyclones passed within the
vicinity of Mauritius (Météo-France, 2015). Four of the most noteworthy cyclonic events
included Darius (classified as a ‘Severe Tropical Storm’ or Class I cyclone) from 31
December 2003- 03 January 2004. The second most noteworthy event during this period
was Hennie (classified as a ‘Severe Tropical Storm’ or Class I cyclone) in March 2005 (22-
24th). Hennie passed 60km South East of the island and had maximum wind speeds of
112km/h. Third was Diwa (also classified as a ‘Severe Tropical storm’ or Class I cyclone) in
March 2006 (3-4th) and passed 220km North North West of the island with winds as high as
126km/h. The fourth was Tropical Cyclone Gamede during February 2007 (22-25th), which
passed 230km North West of the island with windspeeds as high as 158km/h (MMS, 2014d).
© University of Pretoria
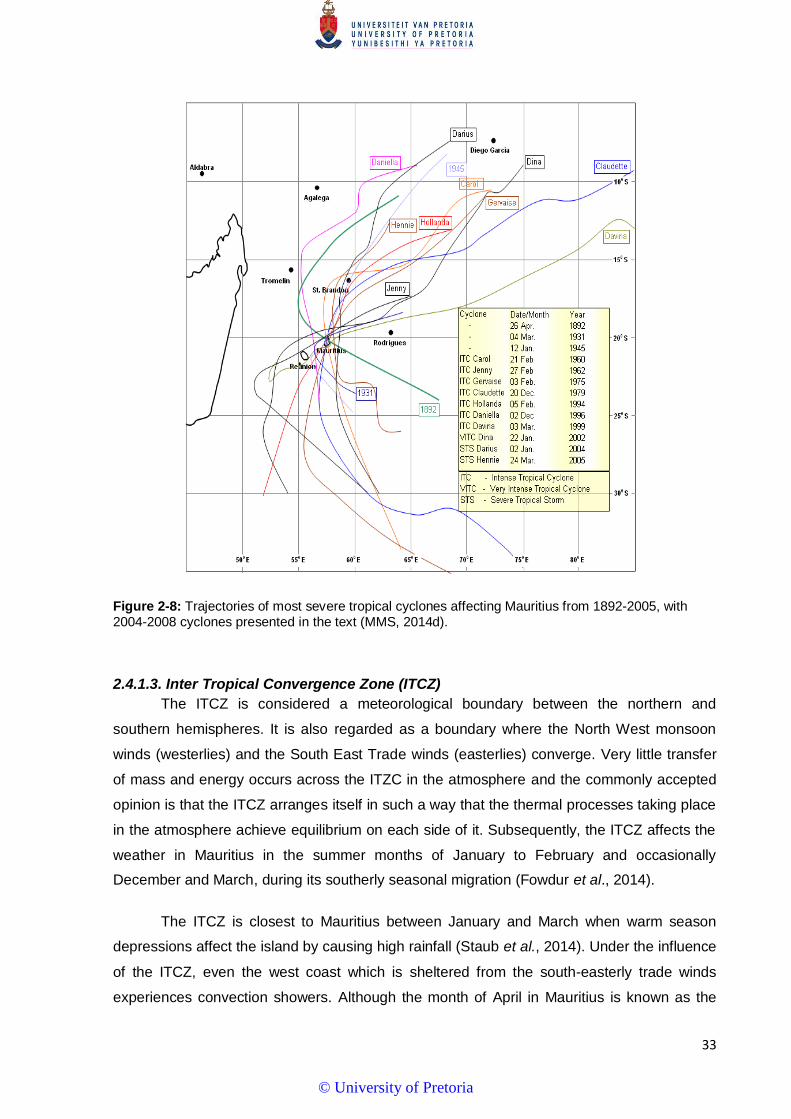
33
Figure 2-8: Trajectories of most severe tropical cyclones affecting Mauritius from 1892-2005, with 2004-2008 cyclones presented in the text (MMS, 2014d).
2.4.1.3. Inter Tropical Convergence Zone (ITCZ)
The ITCZ is considered a meteorological boundary between the northern and
southern hemispheres. It is also regarded as a boundary where the North West monsoon
winds (westerlies) and the South East Trade winds (easterlies) converge. Very little transfer
of mass and energy occurs across the ITZC in the atmosphere and the commonly accepted
opinion is that the ITCZ arranges itself in such a way that the thermal processes taking place
in the atmosphere achieve equilibrium on each side of it. Subsequently, the ITCZ affects the
weather in Mauritius in the summer months of January to February and occasionally
December and March, during its southerly seasonal migration (Fowdur et al., 2014).
The ITCZ is closest to Mauritius between January and March when warm season
depressions affect the island by causing high rainfall (Staub et al., 2014). Under the influence
of the ITCZ, even the west coast which is sheltered from the south-easterly trade winds
experiences convection showers. Although the month of April in Mauritius is known as the
© University of Pretoria
34
transitional month at the end summer, wet-season conditions and higher rainfall persist on
the elevated central plateau and the eastern mountains (Padya, 1989; Staub et al., 2014).
The winter months, May to October, are drier than the summer months as the ITCZ is
located north of the equator.
2.4.1.4. Cold fronts
Two air-masses have been recognised in the southern Indian Ocean: the Maritime
Tropical air mass to the north over the warmer seas and the Maritime Polar air mass over the
cooler waters to the south of the Oceanic convergence. Each air mass has distinct
characteristics from the source region and the boundary between the two distinct air masses
is constantly moving. An active advancing cold front is when a general northward movement
of the boundary between the maritime polar and maritime tropical air masses occurs. Such
occurrences of colder air originating in the far south often reach Mauritius, except during the
warmer parts of summer, namely January and February (Fowdur et al., 2014). Throughout
the winter months (May to October), the passage of cold fronts is generally associated with
an increase in convective activity and subsequent rainfall over Mauritius, particularly in areas
with orographic characteristics (Padya, 1989).
2.4.1.5. Anti-cyclones
At the longitude on which Mauritius is found, the sub-tropical belts of anticyclones are
situated near 30˚S in the winter, retracting pole-ward to about 35˚S in the summer. The
strongest anticyclones occurring in winter have a central pressure exceeding 1040 HPa
(Fowdur et al., 2014). During the winter period the majority of the rainfall is caused by the
resultant advection from orographic uplift due to the presence of anticyclones (Padya, 1989).
2.4.1.6. Sea breezes
Sea-breezes occur when the land heats a layer of air close to the ground surface
causing the warm air to rise. As this process continues, a deeper and warmer layer develops
over the land surface. Eventually, the temperature of the surface layer has risen sufficiently
to produce a significantly lower pressure over the land than over the sea which experiences
a relatively higher pressure. The subsequent pressure difference initiates a breeze from the
sea to the land. Fowdur et al. (2014) explain that as a rule, in Mauritius, a ‘prevailing’ east-
south-east wind is subject to its own synoptic space and time variation. Therefore, over the
east and south coastal area, the sea breeze will help to accelerate the low-level trades and
will affect their direction. On the eastern side of the country, the winds produced by sea-
breeze can be felt strengthening during the mid-morning and continues blowing as long as
the land is kept warmer than the sea by insolation. Occasionally, the whole stretch of sloping
land in the south and south-east, continuing three to four kilometres inland, is shaded by
clouds the entire day and precipitation can be experienced (Fowdur et al., 2014).
© University of Pretoria
35
2.4.1.7. Easterly waves perturbations in the lower troposphere
Perturbations of the lower troposphere, give rise to heavy rainfall over parts of
Mauritius during the summer months, regardless of the depth of the surface easterlies.
Perturbations of this nature, even when characterised as shallow, have a distinct wave-like
character and are commonly encountered in the south-west Indian Ocean, between 70˚E
and 50˚E. Winds related with these perturbations range in the order of 5-8ms-1 The
thunderstorms develop from the perturbations generally cause considerable amount of
rainfall (Fowdur et al., 2014).
2.4.1.8. Cloud masses and upper level lows
Frequently, Mauritius and its neighbouring islands also experience cloudy and rainy
conditions without an identifiable synoptic system being detected. In such cases, satellite
imagery depict the cloud system as either small clouds patches (2 degrees or so in diameter)
in a line with an almost meridional (north-south) orientation or large masses (ten degrees in
width). These air masses have varying degrees of activity. On occasion heavy rainfall and
active thunderstorms take place during these synoptically unexplained weather systems
(Fowdur et al., 2014).
2.4.2. Rainfall
2.4.2.1. Mean annual rainfall depth and spatial variations
Rainfall on the island is seasonal and spatially variable with a wet season from
November to April and a dry season from May to October. Annual mean rainfall for the island
is approximately 2112mm, with 70-79% being recorded in the rainy summer season (Le
Roux, 2005; Nigel & Rughooputh, 2010b). The long-term mean annual rainfall indicates that
the eastern side of the island receives approximately 1200mm rainfall, with the elevated
central receiving up to 4000mm, and only 600mm on the western coast (WRU, 2007). Figure
2-9, taken from Nigel (2011) below shows a rainfall map for Mauritius produced by Seul
(1999) using data consisting of the mean annual rainfall over a period of 30 years (1961-
1990) for 194 gauging stations. It should be noted that the number of rainfall stations on
Mauritius has since increased to in excess of 256 stations (MMS, 2014a).
Mauritius as a land mass enhances rainfall averages across the island. The raised
interior of the island is responsible for the noticeable spatial difference in rainfall from east to
west on the island.
© University of Pretoria
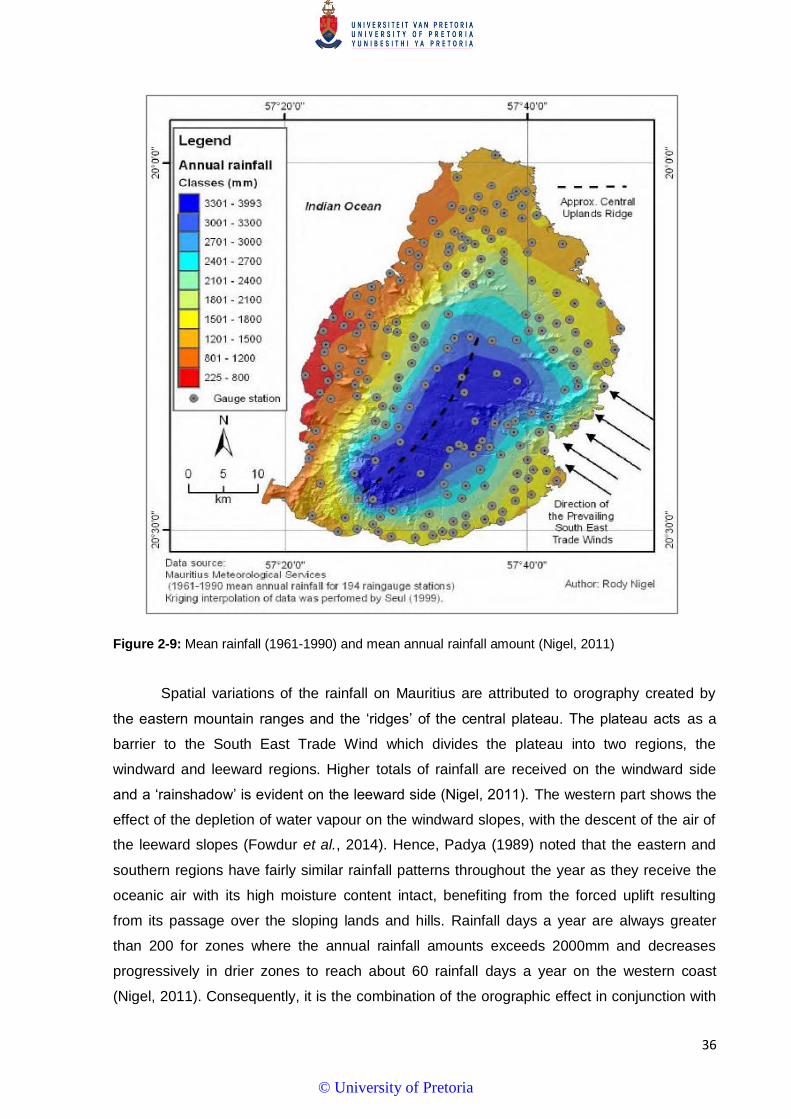
36
Figure 2-9: Mean rainfall (1961-1990) and mean annual rainfall amount (Nigel, 2011)
Spatial variations of the rainfall on Mauritius are attributed to orography created by
the eastern mountain ranges and the ‘ridges’ of the central plateau. The plateau acts as a
barrier to the South East Trade Wind which divides the plateau into two regions, the
windward and leeward regions. Higher totals of rainfall are received on the windward side
and a ‘rainshadow’ is evident on the leeward side (Nigel, 2011). The western part shows the
effect of the depletion of water vapour on the windward slopes, with the descent of the air of
the leeward slopes (Fowdur et al., 2014). Hence, Padya (1989) noted that the eastern and
southern regions have fairly similar rainfall patterns throughout the year as they receive the
oceanic air with its high moisture content intact, benefiting from the forced uplift resulting
from its passage over the sloping lands and hills. Rainfall days a year are always greater
than 200 for zones where the annual rainfall amounts exceeds 2000mm and decreases
progressively in drier zones to reach about 60 rainfall days a year on the western coast
(Nigel, 2011). Consequently, it is the combination of the orographic effect in conjunction with
© University of Pretoria

37
the frictional effect of air movements that is responsible for the local rainfall on the island
(Padya, 1989).
The effect of relief on the spatial distribution of rainfall across Mauritius is shown in
Figure 2-10, where an exaggerated vertical scale section is made on a cross-section from
Beau Vallon on the south-east coast to Medine in the west. This reveals the striking effect
that relief has on the spatial rainfall distribution; with the transect lying roughly in the direction
of the prevailing south-easterly trade winds. The curve shows that the annual rainfall is about
1200mm on the south-east coast and increasing to over 4000mm ahead of the highest
ground of the Central Plateau, then slowly decreases to around 600mm at Medine in the
west making the asymmetry of the rainfall distribution across the island strongly apparent
(Rughooputh, 1997). Therefore, rainfall significantly increases from the coast to the interior.
This rainfall gradient is due to the orographic effects caused by the south-eastern mountain
range and the central uplands (Fowdur et al., 2006).
Figure 2-10: The effect of relief on rainfall with annual rainfall along a 40km ESE-WNW line at selected sites (Padya, 1989)
© University of Pretoria
38
2.4.2.2. Inter- and intra-annual variations in rainfall
Rainfall on the island is of great importance as it is the only source of water for rivers,
agriculture and human needs as water from the ocean is not exploited for the population. The
inter-annual variations in rainfall amount are substantial due to the passage of cyclones,
which could increase the “normal” monthly rainfall amount received by 2-3 times (Willaime,
1984; Padya 1989, Nigel 2011).
Annually, the wet season occurs between November until the end of April, with
February being both the hottest and wettest month, and the dry season from May to October,
with October being the driest month (Proag, 1995; Nigel & Rughooputh, 2010b).
Approximately 60-70% of the mean annual rainfall is received during summer, and 30% of
the mean annual rainfall is received during winter thus rainfall is seasonal (Nigel &
Rughooputh, 2010b). Nearly 40% of the annual total rainfall falls between January and
March, coinciding with the southward migration of the inter-tropical convergence zones
towards the subtropical latitudes and the occurrence of tropical cyclones (Staub et al., 2014).
Rainfall on the island most commonly comes from the orographic lifting of the moisture found
around the circulation of weather systems that move over the island as well as the
occasional cyclones and depressions (Dhurmea et al., 2009).
In addition to these seasonal movements, the summer period is also influenced by
tropical cyclones, most of which do not make landfall (Padya, 1989). The winter season is
subjected to the south easterly trade winds and frontal systems (Padya, 1989). Potential soil
erosion is highest during the early part of the wet season when there is high rainfall present
and the vegetation cover is not yet adequate to protect the soil from erosion (Morgan, 2005).
Drought conditions can be experienced if the island lies outside the path of these tropical
depressions (Proag, 1995).
2.4.3. Climate classification
Mauritius’ climate is described by Proag (1995) and Saddul (1995) as humid,
subtropical and maritime as a result of its location at 20˚S latitude, small size, lack of extreme
elevations and distance to continents. Owing to variations in diurnal exposure, elevation and
distance from the sea, a succession of island scale climatic regions or microclimates exist
(Nigel, 2011). Notwithstanding the small size of the island, Padya (1989) identified at least 27
microclimates caused by substantial variations in the climatic characteristics of Mauritius.
Hence, the raised topography of the island results in orographic lifting occurring, contributing
to the creation of several micro-climates (Nigel & Rughooputh, 2010a). Utilising the variations
© University of Pretoria

39
in temperatures and rainfall from one region to another allows for climatic subdivisions of the
island into three general zones: subhumid, humid and superhumid. The subhumid zone is
restricted to low altitudes on the western coast and the northern plains and receives less
than 1250mm per annum. The humid region receives precipitation between 1250mm and
2000mm per annum and characterises the intermediate altitudes in the west and north as
well as the low altitudes in the east and south, and the superhumid region which prevails
above approximately 400m (450m in the west) where rainfall exceeds 2000mm per annum.
Humid regions have a rainfall evaporation balance, while evapotranspiration exceeds
precipitation in the subhumid regions (Le Roux et al., 2005).
The microclimate zones are attributable to orographic lifting: the central uplands are
super humid (46% of the total area), east and south are humid regions (19%), and a small
area in the west is defined as semi-arid (Fowdur et al., 2006; Nigel & Rughooputh, 2010a).
On average, the humidity across the island is 80% which remains constant throughout the
year. Humidity is higher in the southern central regions, which consists of the central plateau,
the highlands and lowest near the coast. The microclimatic zones and humidity influences
the indigenous vegetation within regions (Anderson, 2012).
2.5. Land use and vegetation
Mauritius was described by 17th century travellers as an island with tropical forests
and jungle from mountain tops to the sea (Parish & Feillafe, 1965). The present land use and
vegetation has been heavily influenced by people (Nigel, 2011). Prior to colonization in 1638,
the island was completely covered by wet and dry evergreen forests, shrub and plain
savanna. However, subsequent to human colonization approximately 95% of the native
vegetation area has been removed, including the complete destruction of the native palm
savannah. There are 6 forest-living native passerines remaining on the island that are
protected by legislation. The main vegetation remaining on the mountain slopes in the south-
western and central-eastern is the moist montante tropical evergreen forest, as well as dry
forests which dominate the rain shadow regions (Safford, 1997). Due to inadequate
regeneration of the native vegetation in conjunction with the high invasion rate of the exotic
vegetation and urbanisation has left the native vegetation is a stressed state (Lorence &
Sussman, 1986) evident in the tiny isolated fragments of vegetation remaining today. A study
done by Saddul (2002) indicated that 55% of the island’s land was classified as cultivated,
27% was forest, 11% was scrub, 6% was urbanized and the remaining 1% accounting for
miscellaneous land uses.
© University of Pretoria

40
Vast amounts of Mauritius’s indigenous vegetation, such as ebony forests, bois d’
olive and aloes have been removed to accommodate the extensive cultivations which occur
on the island, including sugarcane, tea, vegetables and fruit plantations (Nigel &
Rughooputh, 2010b). In 2012, 85% of the arable land (approximately 69000ha) was used for
sugarcane cultivation (Soobadar & Kwong, 2012), despite the Mauritian government
promoting a policy of agricultural diversification (Le Roux, 2005). The Mauritian economy is
heavily dependent upon the export of sugarcane and its bye-products, hence the high
percentage of cultivation. Soil loss under sugarcane is, however, relatively low compared to
other vegetables as the soil under the sugarcane is not disturbed during harvest and a dense
cover is provided within less than two months after regrowth or planting (Le Roux et al.,
2005). Good land management is vital as erosion hazard maps show that potential soil
erosion increases greatly when the canopy cover of sugarcane decreases (Kremer, 2000).
The two regions under investigation in this project have noticeably different types and
densities of vegetation cover due to the different rainfall regimes they are subjected to. The
western region (receiving approximately 600mm annually) where the automatic weather
stations of Albion and Beaux Songes are situated is comprised of shrub-like, grassy and
sparse vegetation. The central interior (receiving approximately 4000mm annually) where
Arnaud, Monbois, Grand Bassin and Trou aux Cerfs are situated has discernibly denser and
lusher vegetation. The difference in vegetation cover and density is evident from Figure 2-11
and Figure 2-12. These photographs were taken on the same day in June 2010.
©R. Anderson (2010)
Figure 2-11: Landscape near the station at Albion (Photo taken 28 June 2010)
© University of Pretoria

41
Figure 2-12: Landscape near Trou aux Cerfs (Photo taken 28 June 2010)
This chapter has provided background information for this study, including information
on the geological history, geomorphology and topography of the island. The vegetation and
land use occurring on the island was also presented. A description of the climate and
weather affecting the island has been included, with particular emphasis on the rainfall and
the eight weather systems prevailing over the island as identified by Fowdur et al. (2014).
The unique pedology and hydrology of the island was also briefly discussed to provide the
context in which the next chapter will continue. To summarise, Mauritius is a diverse island in
terms of a number of factors including topography, climate and weather as well as location,
resulting in the development of several microclimates. These microclimatic areas are
reflected in the diversity of the natural vegetation across the island. The next chapter will
provide the methods and station data used in this project.
© R. Anderson (2010)
© University of Pretoria
42
Chapter 3 : Station Data and Methodology
The purpose of this chapter is to outline the methods and materials used for this
project. It describes the research design followed in the analysis of the data, as well as
highlighting some of the limitations incurred in the methodology. In addition, this chapter
presents the equipment used in obtaining the data used in this project, and lastly the
analyses that were undertaken. As presented in chapter one, the objectives that were set out
are to:
Identify the top twenty erosive events (based on the ‘total kinetic energy
generated’) between 2004 to 2008 at six automated weather stations situated
in the western and central regions of the island.
Describe the general rainfall and climatological characteristics of the top
twenty erosive events at each automated weather station;
Provide a comprehensive intra-storm analysis of each event;
Contrast the spatial and temporal differences between the automated weather
stations.
3.1. Station data
Mauritius has in excess of 256 weather stations spread across the island, covering a
total area of 1860km2 (Proag, 1995). Monitoring the climate variables on Mauritius is done
using three different types of weather stations; namely agro-meteorological stations,
climatological stations and synoptic stations. Agro-meteorological stations monitor and
record standard climatological data which relates to agriculture, livestock breeding and
forestry. Synoptic stations make meteorological weather observations including all
meteorological parameters at fixed time intervals and their recorded observations are
exchanged at the Global Telecommunication System of the World Meteorological
Organisations. The ordinary climatological stations (approximately 30 automatic weather
stations) record rainfall and well as other climatic parameters such as evaporation, humidity,
sunshine duration, temperature and wind are measured by these stations (MMS, 2014a).
To investigate the intra-storm attributes of the erosive events at the respective
stations on Mauritius, high resolution automatic rainfall data from six stations for the period
01/01/2004 to 31/12/2008 (5 years) were provided by the Mauritius Meteorological Services
(MMS) (Figure 3-1). The area of interest for this project includes the central interior and the
© University of Pretoria
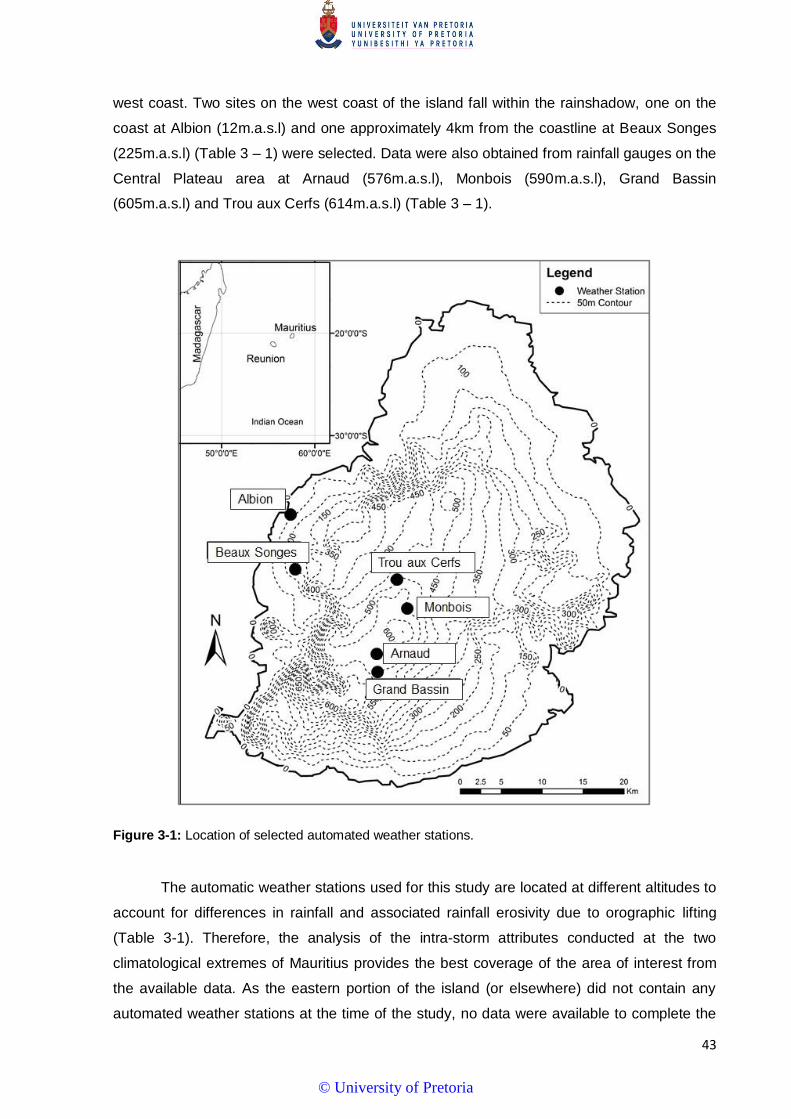
43
west coast. Two sites on the west coast of the island fall within the rainshadow, one on the
coast at Albion (12m.a.s.l) and one approximately 4km from the coastline at Beaux Songes
(225m.a.s.l) (Table 3 – 1) were selected. Data were also obtained from rainfall gauges on the
Central Plateau area at Arnaud (576m.a.s.l), Monbois (590m.a.s.l), Grand Bassin
(605m.a.s.l) and Trou aux Cerfs (614m.a.s.l) (Table 3 – 1).
Figure 3-1: Location of selected automated weather stations.
The automatic weather stations used for this study are located at different altitudes to
account for differences in rainfall and associated rainfall erosivity due to orographic lifting
(Table 3-1). Therefore, the analysis of the intra-storm attributes conducted at the two
climatological extremes of Mauritius provides the best coverage of the area of interest from
the available data. As the eastern portion of the island (or elsewhere) did not contain any
automated weather stations at the time of the study, no data were available to complete the
© University of Pretoria

44
altitudinal cross-section. However, the data that were made available sufficiently covered the
driest and wettest rainfall regions of the island.
Table 3-1: Location, altitude and climatic information of the automatic weather stations (also see Anderson, 2012; Mongwa, 2012; Nel et al., 2012)
Two previous rainfall studies were undertaken on Mauritius using the data sets.
Anderson (2012) found a difference in rainfall erosivity experienced on the interior and rain-
shadowed west coast and reported that stations on the west coast recorded 25% of the
erosivity experienced by the stations in the elevated central interior. Large differences in the
number of erosive events, rainfall depth, erosive rainfall totals, seasonality and annual
erosivity total were noted (Anderson, 2012). The study by Anderson (2012) concluded that
the changes in erosivity occurred with changes in rainfall intensities caused by the
orographic effect of the interior. The other study was undertaken by Mongwa (2012) who
found that erosive events on the west coast and central plateau are remarkably different with
regards to frequency, total rainfall generated, duration, total kinetic energy and total erosivity
of individual events. Yet the mean kinetic energy, mean and maximum rainfall erosivity (El30)
and maximum intensities (I30) from the individual erosive events do not show this distinct
differentiation. Both studies (Anderson, 2012; Mongwa, 2012) speculated on the influence
that the elevated central interior has on the spatial and temporal distribution of rainfall across
the island. Thus, by incorporating another rainfall station and analysing the intra-storm
attributes of the erosive events, this study attempts to highlight and also explain the
anomalies identified in the previous studies.
Station Location Latitude Longitude Altitude
(above sea level)
Rainfall Region
Albion West Coast 20˚12.75’ S 57˚24.0’ E 12m Semi-arid
Beaux Songes
West Coast 20˚16.68’ S 57˚24.48’ E 225m Semi-arid
Arnaud Central Plateau 20˚22.8’ S 57˚29.52’ E 576m Super-humid
Monbois Central Plateau 20˚19.8’ S 57˚31.68’ E 590m Humid
Grand Bassin Central Plateau 20˚24.0’ S 57˚29.52’ E 605m Super-humid
Trou aux Cerfs
Central Plateau 20˚17.82’ S 57˚31.02’ E 614m Super-humid
© University of Pretoria
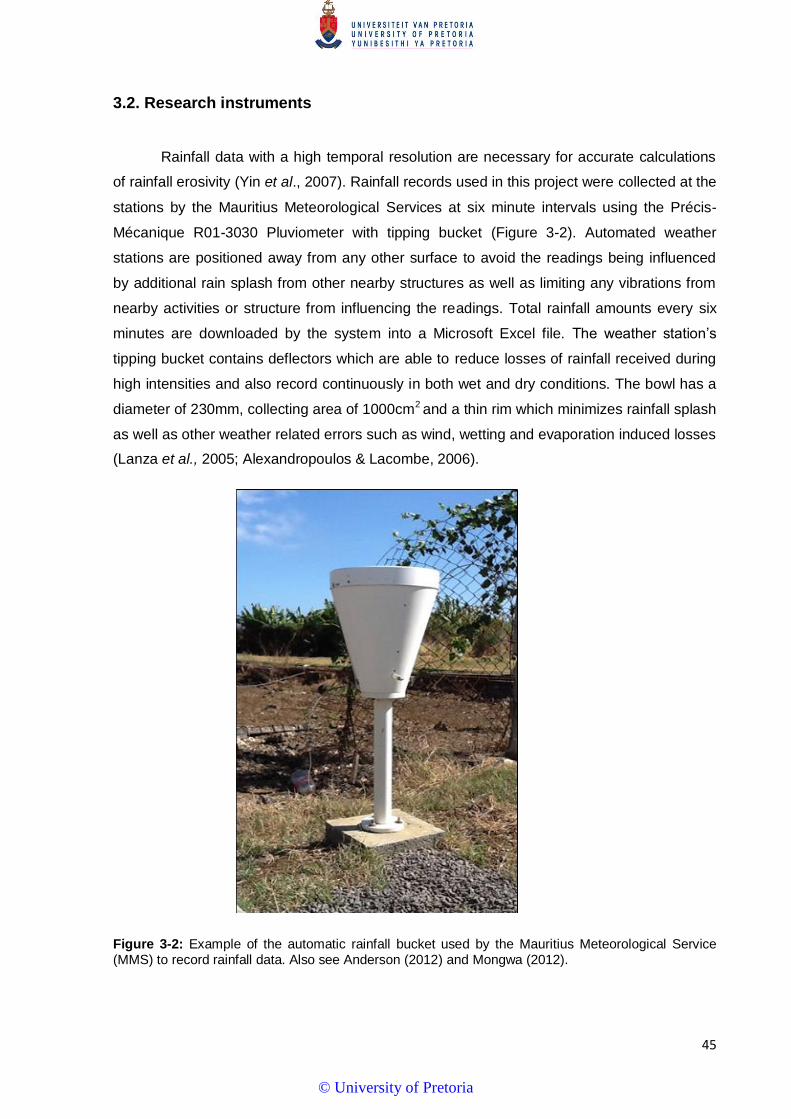
45
3.2. Research instruments
Rainfall data with a high temporal resolution are necessary for accurate calculations
of rainfall erosivity (Yin et al., 2007). Rainfall records used in this project were collected at the
stations by the Mauritius Meteorological Services at six minute intervals using the Précis-
Mécanique R01-3030 Pluviometer with tipping bucket (Figure 3-2). Automated weather
stations are positioned away from any other surface to avoid the readings being influenced
by additional rain splash from other nearby structures as well as limiting any vibrations from
nearby activities or structure from influencing the readings. Total rainfall amounts every six
minutes are downloaded by the system into a Microsoft Excel file. The weather station’s
tipping bucket contains deflectors which are able to reduce losses of rainfall received during
high intensities and also record continuously in both wet and dry conditions. The bowl has a
diameter of 230mm, collecting area of 1000cm2 and a thin rim which minimizes rainfall splash
as well as other weather related errors such as wind, wetting and evaporation induced losses
(Lanza et al., 2005; Alexandropoulos & Lacombe, 2006).
Figure 3-2: Example of the automatic rainfall bucket used by the Mauritius Meteorological Service (MMS) to record rainfall data. Also see Anderson (2012) and Mongwa (2012).
© University of Pretoria

46
Each separate weather station recorded information at the site including rainfall
totals, rainfall intensity (rainfall received every 6minutes), temperature, wind speed and
pressure as a separate Microsoft Excel file on a daily basis. Individual files were
subsequently “stitched” together so that all the months for a single station are consolidated
into a single Microsoft Excel spreadsheet, and all the years for each station is placed into a
single Microsoft Excel file for convenience (Nel, pers comm). Rainfall and non-rainfall days
were separated and non-rainfall days were then removed from the data set. For this project,
a rainfall day was fixed as a day which received ≥1mm of rainfall during a 24 hour period.
For calculation purposes, erosive rainfall events were separated from non-erosive
events the latter which are subsequently omitted. This is routinely done as it enormously
eases the calculation of rainfall erosivity, particularly in terms of reading and digitising rainfall
charts (Xie et al., 2002). Wischmeier & Smith (1978) suggested that rains of less than
12.5mm should be omitted in erosion index computations (these parameters will be
discussed later in further detail). Although natural intensity variations are present from one
event to another, consensus prevails between various studies (Stocking & Elwell, 1976;
Renard & Freimund, 1994; Xie et al., 2002) that a maximum intensity of 25mm/h can be used
as a practical threshold for separating erosive and non-erosive rains. If non-erosive events
are counted, the rainfall erosivity could be either over- or under- estimated (Xie et al., 2002).
Hence, the objective of determining a practical threshold is to omit non-erosive rains to
reduce calculation requirements while obtaining the most accurate possible value for
erosivity (Xie et al., 2002).
3.3. Missing, unreliable and incomplete data
The following records were incomplete at all the stations records; June and July
records from 2004, November and December from 2006, and January, February and March
2007. However, as these records were unavailable from all the stations, direct inter-station
comparisons could still be made as those data do not affect the scope of this project (also
see Anderson, 2012; Mongwa, 2012).
As rainfall and its intensity is natural highly variable, no statistical extrapolation
methods were used to fill gaps created by missing data. Extrapolating the rainfall data could
lead to inaccurate results by over-estimating the number of erosive rainfall events and thus
decreasing the accuracy of the results presented in the next chapter. Additionally, several
rainfall events were excluded from the data as the rainfall recorded during the event was
extraordinarily high and can be attributed to errors in the equipment used to collect the data.
These particular events were considered as anomalous as triple digit rainfall totals were
© University of Pretoria

47
recorded within a 6-minute period with no other rainfall recorded within several hours before
or after the event (see also Anderson, 2012; Mongwa, 2012; Nel et al., 2012; 2013).
3.4. Objective One: Identification of the top twenty events
3.4.1. Identifying an erosive event
Rainfall data in this project were separated into erosive events to calculate rainfall
erosivity (see also Anderson, 2012; Mongwa, 2012; Nel et al., 2012; 2013). The definition of
an erosive event has been well recognized within the literature. Parameters were established
for this project in order to determine an erosive event. Wischmeier & Smith (1958) specified
that for substantial amounts of soil erosion to occur rainfall intensities larger than 25mm/h are
required. Stocking & Elwell (1976) categorised a distinct erosive event when the total rainfall
exceeds 12.5mm within a 30 minute period, with a maximum 5-minute intensity exceeding
25mm/h and the event isolated by a 2 hour rain free period between erosive events. This
definition was used by Nel (2007), Nel & Sumner (2007) and Nel et al. (2010) to identify
erosive events in the KwaZulu Natal, Drakensberg of South Africa.
As rainfall on Mauritius is logged every 6 minutes the definition by Stocking & Elwell
(1976) was adjusted so that rainfall events are considered to have the potential to erode soil
on Mauritius when the total rainfall exceeds 12.5mm within a 30 minute period, maximum 6-
minute intensity exceeding 30mm/h and is isolated by at least a 2 hour rain free period (see
also Nel et al, 2012; 2013). An event was also classified as being erosive if 6.3mm of rain
occurred within 15 minutes (Wischmeier & Smith, 1978; Diodato, 2005; Angulo-Martínez &
Beguería, 2009). The definitions have also been used in numerous studies including Nel et
al. (2012), Anderson (2012); Mongwa (2012) and Nel et al. (2013) to identify erosive events
in Mauritius. After applying this definition, the data series from the 6 automated weather
stations used in this study, over the five year period, contained 444 erosive rainfall events.
3.4.2. Determining rainfall event kinetic energy
Rainfall intensity can be measured directly, however measurements of kinetic energy
and raindrop sizes are often unavailable, hence the reliance on the empirical relationships
between rainfall intensity and kinetic energy (Nel & Sumner, 2007). A number of equations
have been established to calculate kinetic energy from rainfall intensity (van Dijk et al., 2002;
Nel et al., 2012; Nel et al., 2013). Wischmeier & Smith (1958) used measurements of drop
size characteristics as well as terminal velocity to derive the relationship between rainfall
© University of Pretoria
48
intensity and kinetic energy. The relationship suggested by Wischmeier & Smith is a
logarithmic function in the form:
𝐾𝐸 = 11.87 + 8.73𝐿𝑜𝑔10𝑅 where the intensity is in mm/h. (1)
Studies in Zimbabwe done by Elwell & Stocking (1973) have shown that for
subtropical climates the kinetic energy of rainfall can be predicted by the following equation:
𝐾𝐸 = (29.82 − 127.51/𝐼) in J m-2 m-1 where the intensity is in mm/h. (2)
This equation was also used in the SLEMSA (Soil Loss Estimation for Southern
Africa). Following a critical appraisal of the literature established on the relationship rainfall
intensity-kinetic energy (R – KE), based on average parameter values which were derived
from the best datasets, van Dijk et al. (2002) provided the following equation to predict storm
kinetic energy content from rainfall intensity data:
𝐾𝐸 = 28.3[1 – 0.52 𝑒𝑥𝑝 ( − .042 𝑅) where the intensity R is in mm/h. (3)
Consequently, for comparison with other studies on Mauritius, either of the
abovementioned equations would be sufficient for estimating the kinetic energy contents. In
order to provide for consistency with global studies, the equation (3) by van Dijk et al. (2002)
was used here to assess the 6-minute incremental kinetic energy content derived from
rainfall intensity.
A uniform drop size distribution is assumed during the analysis of kinetic energy. In
order to calculate the total event kinetic energy (KE) produced during each individual erosive
rainfall event (J m-2), the 6-minute kinetic energy content, multiplied by the quantity of rain
(mm) falling in that specific 6 minutes to give the 6-minute kinetic energy. Each of the 6-
minute kinetic energy values generated during the event is then summed to give the total
kinetic energy during each individual event (Nel, 2007; Nel et al., 2013). Wischmeier & Smith
(1978) determined that erosivity can be determined by the product (EI30) of the total kinetic
energy (KE) of the storm multiplied by its maximum 30-minute intensity (I30). This equation
has been used both globally and in the Mauritian context as part of the Revised Universal
Soil Loss Equation (RUSLE) to assess the spatial distribution of erosivity (see also Le Roux,
2005; Le Roux et al., 2005; Nigel, 2011; Nel et al., 2012; 2013). To ensure consistency with
previous erosivity studies in Mauritius, the rainfall erosivity potential was determined by the
product (EI30) of each erosive event (J mm m-2 h-1).
© University of Pretoria
49
To investigate the intra-storm changes in rainfall attributed received from an erosive
rainfall event, the 20 events with the highest ‘total kinetic energy generated’ at each station
were used for analysis, hence a total of 120 events are analysed in detail.
3.5. Objective Two: General rainfall, climatological characteristics and
weather circulation patterns associated with the top twenty erosive
events
The six automated weather stations can be placed into two broad groups based upon
their general rainfall and other climatological characteristics. In the first group are Albion and
Beaux Songes, and in the second group, are Arnaud, Trou aux Cerfs, Grand Bassin and
Monbois. In an attempt to discover the role that an elevated topography has on the intra-
storm attributes of the events, comparisons were made between the two groups. Additionally,
comparisons between the stations within in the two groups were investigated. The following
characteristics were identified for each of the top twenty erosive events at each station and
utilised to analyse the data:
― Rainfall depth (mm),
― Rainfall event duration (minutes),
― Seasonality and date of event
― Maximum Rainfall Intensity (I6) and (I30)
― Erosivity (J mm m-2 h-1)
― Kinetic Energy Content (J m-2)
― Means including storm depth, storm duration, kinetic energy content and
erosivity
There are several weather systems of varying scales and amplitudes that affect the
island’s weather due to its location and topography (Fowdur et al., 2014; Staub et al., 2014).
Unfortunately, in the absence of detailed synoptic data it was not possible to link the erosive
events directly to the exact synoptic weather systems occurring during the time of the event.
However, some assumptions could be made using the climatological information available
from the Mauritius Meteorological Services Monthly Bulletins of Climatological Summaries,
Mauritius Meteorological Services website (MMS, 2014a) as well as the Météo-France
Réunion (Météo-France, 2015) website. The table below (Table 3-2) provides a summary of
the synoptic circulations or weather systems in Mauritius according to Fowdur et al. (2014). A
representative symbol is used for each weather system or synoptic circulations. Using
© University of Pretoria
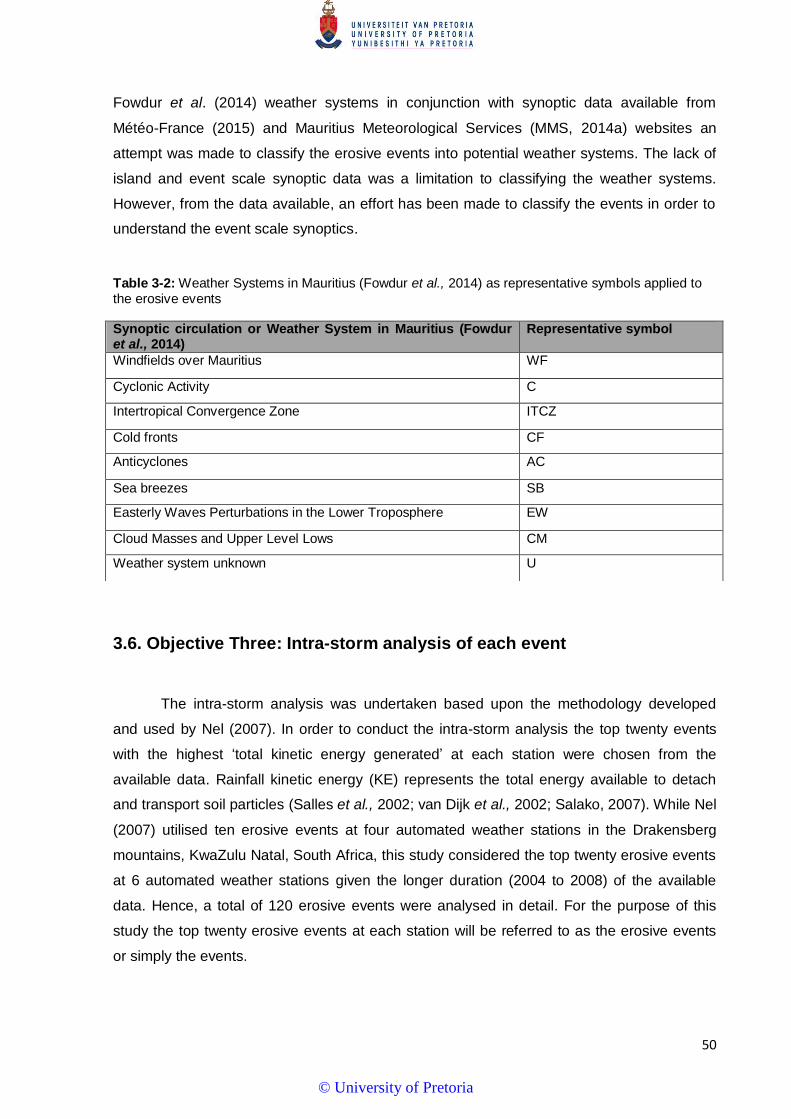
50
Fowdur et al. (2014) weather systems in conjunction with synoptic data available from
Météo-France (2015) and Mauritius Meteorological Services (MMS, 2014a) websites an
attempt was made to classify the erosive events into potential weather systems. The lack of
island and event scale synoptic data was a limitation to classifying the weather systems.
However, from the data available, an effort has been made to classify the events in order to
understand the event scale synoptics.
Table 3-2: Weather Systems in Mauritius (Fowdur et al., 2014) as representative symbols applied to the erosive events
3.6. Objective Three: Intra-storm analysis of each event
The intra-storm analysis was undertaken based upon the methodology developed
and used by Nel (2007). In order to conduct the intra-storm analysis the top twenty events
with the highest ‘total kinetic energy generated’ at each station were chosen from the
available data. Rainfall kinetic energy (KE) represents the total energy available to detach
and transport soil particles (Salles et al., 2002; van Dijk et al., 2002; Salako, 2007). While Nel
(2007) utilised ten erosive events at four automated weather stations in the Drakensberg
mountains, KwaZulu Natal, South Africa, this study considered the top twenty erosive events
at 6 automated weather stations given the longer duration (2004 to 2008) of the available
data. Hence, a total of 120 erosive events were analysed in detail. For the purpose of this
study the top twenty erosive events at each station will be referred to as the erosive events
or simply the events.
Synoptic circulation or Weather System in Mauritius (Fowdur et al., 2014)
Representative symbol
Windfields over Mauritius WF
Cyclonic Activity C
Intertropical Convergence Zone ITCZ
Cold fronts CF
Anticyclones AC
Sea breezes SB
Easterly Waves Perturbations in the Lower Troposphere EW
Cloud Masses and Upper Level Lows CM
Weather system unknown U
© University of Pretoria
51
3.6.1. Intra-storm distribution of rainfall depth
3.6.1.1. Storm rainfall depth and cumulative rainfall generated over time by the erosive
events
Following the equation by van Dijk et al. (2002), the above formula (3), the six-minute
kinetic energy content (KE) of each individual event at each station was calculated and the
cumulative kinetic energy as a percentage was plotted. This was done in order to identify the
distribution pattern of the cumulative total kinetic content of the rainfall over time. Following
the method established by Nel (2007), a well-defined distribution of cumulative total kinetic
content of rainfall over time was anticipated. The graph was subsequently be used to identify
the time in minutes at which the stations would have received approximately 80% of all the
potential kinetic energy content generated by the storm. This represented the maximum
(duration) threshold over which all the extreme events would be analysed in further detail.
Once that point has been identified, the six-minute increment rainfall depth of each individual
storm measured at each station was plotted for the analysis of the intra-event temporal
distribution of the rainfall and further comparative reasons.
3.6.1.2. Storm rainfall depth as a function of storm duration
To test for rainfall generation as a function of rainfall duration, the six-minute rainfall
depth of each individual event measured at each station was plotted as a percentage of
rainfall duration. Each erosive event was divided into quartiles namely: First Quartile (Q1),
Second Quartile (Q2), Third Quartile (Q3) and Fourth Quartile (Q4). Due to the high
variability in event duration, all the storms were plotted as a percentage of the rainfall
duration in order to conduct a comparative analysis between the quartiles and identify the
point during the storm when the peak rainfall was generated. The rainfall variability of each
event was also highlighted in this process.
3.6.2. Intra-storm distribution of extreme and peak rainfall intensity
3.6.2.1. Timing of the extreme rainfall intensity generated by the erosive events
Following the modifed definition of an erosive event by Stocking & Elwell (1976),
rainfall events on Mauritius have the potential to erode soil when the total rainfall exceeds
12.5mm within a 30 minute period with a maximum 6-minute intensity exceeding 30mm/h
and a 2 hour rain free interval. Thus, the 120 erosive events analysed have a maximum six-
© University of Pretoria
52
minute intensity exceeding 30mm/h. To test at what stage within an erosive event the rainfall
intensity has the potential to exceed the infiltration rates and become erosive, the intra-storm
variations of the six-minute intensity exceeding 30mm/h were considered (adapted from
Stocking & Elwell, 1976).
3.6.2.2. Timing of extreme rainfall intensity as a function of storm duration
To test for the timing of the extreme rainfall intensities (above 30mm/h) as a function
of rainfall duration, all the extreme intensities of each individual event measured at each
station were plotted as a percentage of rainfall duration. Each event is divided into quartiles,
Q1 through Q4 as explained above. This was done to identify when peak rainfall intensity
was recorded. The point was considered important as Parsons & Stone (2006) established
that a constant-intensity erosive event yields lower soil loss than the varying-intensity events,
and sediment eroded from the constant-intensity event had lower clay content than that from
the varying-intensity erosive events. Moore (1979) indicated that under natural event
conditions the peak sediment transportation coincides with the peaks in rainfall intensities.
Stocking & Elwell (1976) also found that the magnitude of peak intensities is most critical to
the erosion process. A study by Parsons & Stone (2006) found that events which had their
peak intensities towards the end of the event duration had the highest peaks in runoff rates,
soil loss and displaced the largest particle size in the eroded soil and therefore linear
relationship between rainfall intensity and runoff is generally assumed.
3.7. Objective Four: Contrast of spatial and temporal differences between
the automated weather stations
As a result of the topography of Mauritius, well-defined spatial trends in relation to
rainfall across Mauritius are acknowledged in previous studies (Dhurmea et al., 2009; Nel et
al., 2012; 2013; Staub et al., 2014). Associated with the topographic uplift and other factors is
the steep rainfall gradient and distinct west coast rainshadow effect, thus influencing the
spatial and temporal rainfall variability present on the island. The six automated weather
stations used in the project have been placed into two broad groups based upon their
general rainfall, erosive and other climatological characteristics identified in objective two. In
the first group are Albion and Beaux Songes within the low altitude region, and in the second
group, are Arnaud, Monbois, Grand Bassin and Trou aux Cerfs within the high altitude
region. While no other station data were available, these automated weather stations
© University of Pretoria

53
represent the regions of the island which receive the highest and lowest rainfall totals. To
discover the role that an elevated topography has on the intra-storm attributes of the erosive
events, an attempt will be made to contrast the spatial and temporal differences between the
automated rainfall stations of the two groups. Concurrent events identified in objective two
will also be discussed.
In summary, this chapter presented the methodology followed when analysing the
high resolution automatic rainfall data provided by the Mauritius Meteorological Service along
with the instrumentation utilised in the collection of the data for this project. The procedures
undertaken in calculating and analysing the information to reach each objective set out in the
beginning of this project were also discussed. The formulae necessary for this project was
also provided and explained. The results of the data analysis will be presented in the next
chapter.
© University of Pretoria

54
Chapter 4 : Results
The following chapter presents the results from the data analysis performed. The
results component is comprised of four main sections, first the general storm and rainfall data
as well as the general climatological characteristics of the top twenty erosive events (based on
‘total kinetic energy generated’) at each automated weather station are presented. Second, the
intra-storm distribution of rainfall depth was analysed by identifying the storm depth generated
over time by the erosive events as well as the storm rainfall depth as a function of storm
duration at the respective station in Mauritius. Third, the intra-storm distribution of the extreme
and peak rainfall intensity was analysed through the timing of the extreme rainfall intensity
(above 30mm/h) generated by the erosive events. The timing of the extreme rainfall intensity
(above 30mm/h) as a function of storm duration at the respective stations is also analysed.
Finally, the climatic drivers and temporal analysis of the events are presented.
4.1. General storm and rainfall data and general climatological characteristics
As rainfall data used in this project are logged every 6-minutes, the definition by
Stocking & Elwell (1976) was adjusted accordingly, so that erosive events have a total rainfall
exceeding 12.5mm within a 30 minute period with a maximum 6-minute intensity exceeding
30mm/h and a 2 hour rain free interval (see also Nel et al., 2012; 2013) or if 6.3mm of rain
occurred within 15 minutes (Wischmeier & Smith, 1978; Diodato, 2005; Angulo-Martínez &
Beguería, 2009). After applying this definition, the data series from the six automated weather
stations, over the five year period, contained a total of 444 erosive rainfall events. Of the 444
total erosive events, the low altitude west coast station recorded 42 events at Albion
(12m.a.s.l), and 46 events at Beaux Songes (225m.a.s.l). Whilst on the central plateau, 116
events at Arnaud (576m.a.s.l), 77 events were identified at Monbois (590m.a.s.l), 104 events
at Grand Bassin (605m.a.s.l) and 59 events at Trou aux Cerfs (614m.a.s.l), noticeably fewer
than the other high altitude stations on the Central Plateau.
The events (ranked highest to lowest ‘total kinetic energy generated’) at the west coast
stations of Albion and Beaux Songes represent 48% and 43% of the total erosive events that
took place at these stations respectively. Therefore, approximately half of all the events
measured at these low altitude stations are erosive in nature. However, the top twenty erosive
events at the Arnaud and Grand Bassin stations only account for 17% and 19% of the total
© University of Pretoria
55
erosive events respectively. Consequently, a higher proportion of the rain at the coast stations
is considered highly erosive and only a correspondingly smaller percentage at the high altitude
stations situated on the elevated central plateau of Mauritius.
Although Nel (2007) used ten erosive events at four automated weather stations in the
Drakensberg, KwaZulu Natal, South Africa to perform the intra-storm analysis, this study
considered the twenty erosive events at each automated weather station given the longer
duration (2004 to 2008) of the available data. The twenty events with the highest ‘total kinetic
energy generated’ at each station were selected to conduct the intra-storm analysis, therefore
a total of 120 erosive events were analysed in detail (Table 4-1). For the purpose of this study
the top twenty erosive events at the six automated weather stations, referred to as the erosive
events or simply the events, are ranked according to highest ‘total kinetic energy generated’
(highest to lowest total kinetic energy generated) see Table 4-2 to Table 4-7.
The 120 erosive events (Figure 4-1) analysed in this study had an average duration of
1451 minutes (24 hours and 18 minutes) with the longest event of 4932 minutes (82 hours)
happening at the Monbois automated weather station (Table 4-5; event no. 8) and the shortest
event of 36 minutes occurring at Trou aux Cerfs (Table 4-7; event no. 11). The mean rainfall
depth of the events is 117.04mm, with the lowest rainfall depth totalling 27.2mm at Albion
(Table 4-2; event no. 20) and the highest rainfall depth equalling 615mm at Trou aux Cerfs
(Table 4-7; event no. 1).
In Figure 4-1, 87.5% of the 120 events have a total storm duration of less than 3000
minutes and 95% of the events have a rainfall depth of less than 300mm. The outlying events
in Figure 4-1 can be attributed to cyclonic activity, with the exception of the outlying point with
the high rainfall depth and very short rainfall duration which corresponds to event no. 1 at the
Trou aux Cerfs automated weather station. The total rainfall depth (Table 4-1) generated by
the 120 events was 14045.2mm, with the automated weather station of Grand Bassin (Table 4-
6) contributing the most erosive rainfall 3222.2mm (23%), followed by the automated weather
station at Arnaud (Table 4-4) that contributed 3006.8mm (21.5%), then Trou aux Cerfs weather
station 2808mm (20%), followed by the weather station at Monbois 2304.6mm (16.5%), and
lastly the coastal stations of Albion 1406.4mm (10%) and Beaux Songes 1297.2mm (9%)
(Table 4-3).
© University of Pretoria
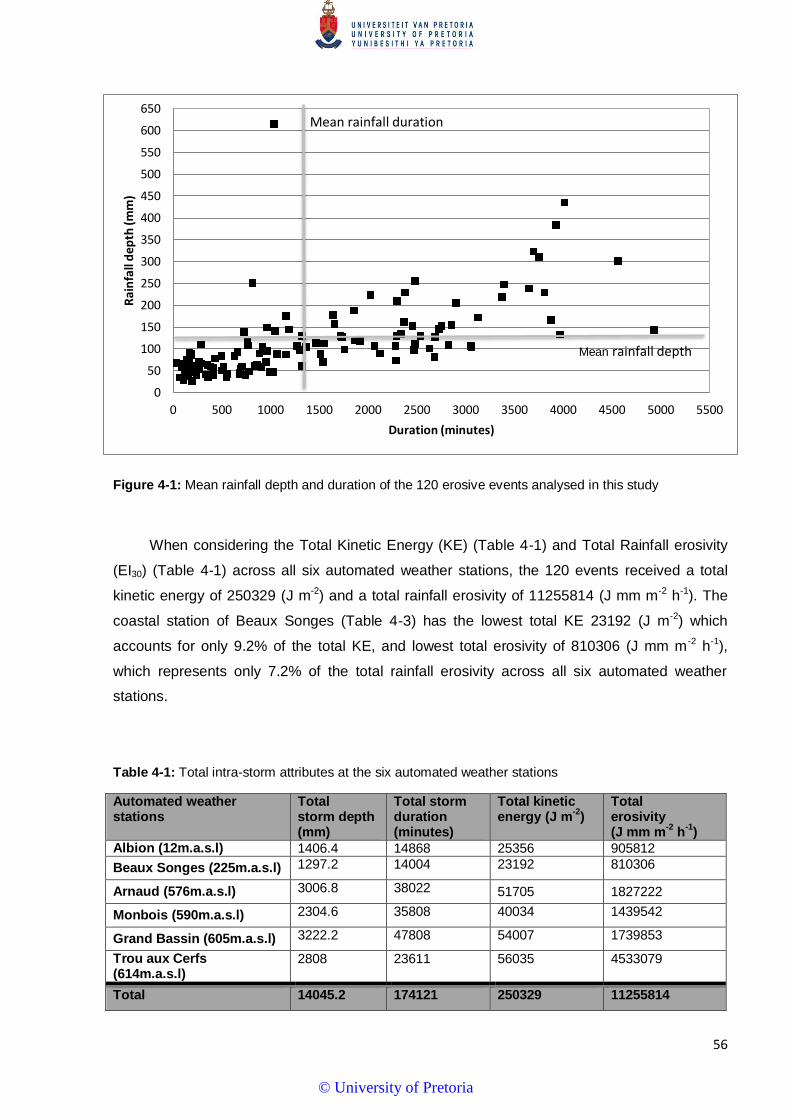
56
Figure 4-1: Mean rainfall depth and duration of the 120 erosive events analysed in this study
When considering the Total Kinetic Energy (KE) (Table 4-1) and Total Rainfall erosivity
(EI30) (Table 4-1) across all six automated weather stations, the 120 events received a total
kinetic energy of 250329 (J m-2) and a total rainfall erosivity of 11255814 (J mm m-2 h-1). The
coastal station of Beaux Songes (Table 4-3) has the lowest total KE 23192 (J m-2) which
accounts for only 9.2% of the total KE, and lowest total erosivity of 810306 (J mm m -2 h-1),
which represents only 7.2% of the total rainfall erosivity across all six automated weather
stations.
Table 4-1: Total intra-storm attributes at the six automated weather stations
Automated weather stations
Total storm depth (mm)
Total storm duration (minutes)
Total kinetic energy (J m
-2)
Total erosivity (J mm m
-2 h
-1)
Albion (12m.a.s.l) 1406.4 14868 25356 905812
Beaux Songes (225m.a.s.l) 1297.2 14004 23192 810306
Arnaud (576m.a.s.l) 3006.8 38022 51705 1827222
Monbois (590m.a.s.l) 2304.6 35808 40034 1439542
Grand Bassin (605m.a.s.l) 3222.2 47808 54007 1739853
Trou aux Cerfs (614m.a.s.l)
2808 23611 56035 4533079
Total 14045.2 174121 250329 11255814
0
50
100
150
200
250
300
350
400
450
500
550
600
650
0 500 1000 1500 2000 2500 3000 3500 4000 4500 5000 5500
Rai
nfa
ll d
ep
th (m
m)
Duration (minutes)
Mean rainfall depth
Mean rainfall duration
© University of Pretoria
57
The events at the Albion (Table 4-2) automated weather station account for 8% of the total
rainfall erosivity and 10.1% of the total KE across all six stations. Although the automated
weather station at Trou aux Cerfs receives noticeably fewer total erosive events than any of
the other stations on the central plateau, the top twenty events at this weather station have the
highest ‘total kinetic energy content’ generated 56035 (J m-2), representing 22.4% of the total
KE across all 6 six automated weather stations- with event no. 1 at Trou aux Cerfs contributing
more than 26% of the total KE (Table 4-7).
At Albion, Beaux Songes and Grand Bassin (Table 4-6) the corresponding event no. 1
contributes at each station represents 11.9%, 11.5% and 11.7% respectively. The high altitude
station of Trou aux Cerfs also has highest total erosivity 4533079 (J mm m-2 h-1) (Table 4-1) of
all six automated weather stations, and represents 40.3% of the total rainfall erosivity across
all six stations. Event no. 1 at Trou aux Cerfs is responsible for 49% of the total rainfall
erosivity at this automated weather station. This is more than double the rainfall erosivity
received at any other station during their corresponding events no. 1. For example, at the low
altitude station of Albion and the inland station of Monbois, the comparable event no. 1 (at
each corresponding station) is responsible for only 8% of the rainfall erosivity at these stations.
While, the rainfall erosivity received during the event no. 1 at the automated weather station of
Beaux Songes is 19%.
The maximum six-minute rainfall intensity (I6) of the events measured at the six
automated weather stations ranged from 26 to 198mm/h. Highest maximum six-minute rainfall
intensity (I6) of 198 mm/h was measured at two automated weather stations, namely Trou aux
Cerfs (Table 4-7) and Monbois (Table 4-5). The maximum (I6) values measured were 116
mm/h at Albion (Table 4-2) and Beaux Songes (Table 4-3) and 102mm/h at Arnaud (Table 4-
4). The lowest maximum six-minute rainfall intensity (I6) of 26mm/h was measured at Grand
Bassin (Table 4-6). The maximum 30-minute rainfall intensity (I30) ranged from 13.2 to
152mm/h. The maximum I30 value was recorded at Trou aux Cerfs (the highest station).
© University of Pretoria

58
Table 4-2: The top twenty erosive event attributes for Albion (12m.a.s.l) from 2004 to 2008
Event number
Date
and
Time
Start
Date
and
Time
End
Storm
Depth
(mm)
Storm
Duration
(minutes)
Max
Intensity
(I6)
(mm/h)
Max
Intensit
y
(I30)
(mm/h)
Total
Kinetic
Energy
(J m-2
)
Erosivity
(J mm m-2
h-1
)
Synoptic
circulation
or Weather
System
1 16/09/08 (17:18)
17/09/08 (20:30)
177.6 1638 42 24 3015 72350 U
2 04/03/05 (19:24)
05/03/05 (07:30)
117.4 762 88 46 2127 97852 U
3 03/03/06 (22:30)
05/03/06 (05:54)
119.0 1866 26 17 1857 31945 C
4 09/06/07 (10:18)
10/06/07 (02:18)
96.0 966 50 30 1667 50683 U
5 30/11/08
(10:24)
30/11/08
(13:12) 74.2 138 48 46 1599 73543 U
6 23/01/06
(22:18)
24/01/06
(06:24) 83.2 498 66 40 1584 63994 U
7 25/03/08
(13:24)
26/03/08
(10:54) 97.8 1302 30 20 1548 30954 C
8 08/03/04
(07:24)
08/03/04
(09:18) 59.0 90 116 92 1425 131136 U
9 22/03/05
(18:30)
24/03/05
(14:24) 81.0 2682 54 18 1245 22918 C
10 02/01/06
(03:06)
02/01/06
(08:24) 63.8 354 70 38 1178 44764 C
11 16/02/06
(17:18)
17/02/06
(07:54) 63.6 858 38 32 1111 35557 C
12 02/03/05
(14:12)
02/03/05
(17:30) 50.6 204 82 46 1049 48674 U
13 13/12/04
(18:48)
14/12/04
(03:24) 59.6 516 42 24 989 23746 U
14 20/03/05
(19:12)
21/03/05
(07:06) 55.6 690 26 16 906 14853 C
15 23/04/05
(11:30)
23/04/05
(12:30) 34.0 66 100 65 818 52979 U
16 22/02/08
(14:24)
23/02/08
(07:24) 46.6 1026 38 23 756 17239 C
17 14/05/08
(08:42)
14/05/08
(14:36) 34.8 360 80 50 727 36058 CF
18 22/10/07
(06:42)
22/10/07
(15:42) 36.0 546 92 38 673 25292 SB
19 12/01/04
(13:30)
12/01/04
(15:18) 29.4 108 46 28 581 16503 U
20 13/01/04
(13:24)
13/01/04
(16:42) 27.2 198 54 30 499 14769 U
TOTAL 1406.4 14868 TOTAL 25356 905812
MEAN 70.3 743 MEAN 1268 45291
WF= Windfields over Mauritius, C= Cyclonic Activity, ITCZ=Intertropical Convergence Zone, CF= Cold fronts, AC= Anticyclones, SB= Sea breezes, EW=
Easterly Waves Perturbations in the Lower Troposphere, CM= Cloud Masses and Upper Level Lows, U= Weather system unknown. See Table 3-3.
© University of Pretoria

59
Table 4-3: The top twenty erosive event attributes for Beaux Songes (225 m.a.s.l) from 2004 to 2008
Event
number
Date
and
Time
Start
Date
and
Time
End
Storm
Depth
(mm)
Storm
Duration
(minutes)
Max
Intensity
(I6)
(mm/h)
Max
Intensity
(I30)
(mm/h)
Total
Kinetic
Energy
(J m-2
)
Erosivity
(J mm m-2
h-1
)
Synoptic
circulation
or Weather
System
1 04/03/05
(19:24)
05/03/05
(07:24) 138.0 726 94 57 2673 151849 U
2 25/03/08
(13:24)
26/03/08
(11:06) 130.4 1320 50 39 2230 87417 C
3 23/01/06
(17:54)
24/01/06
(06:42) 108.2 768 60 36 1957 70450 U
4 16/02/06
(17:18)
17/02/06
(07:54) 89.8 888 58 43 1693 73130 C
5 03/03/06
(22:12)
04/03/06
(20:42) 103.6 1362 40 14 1634 22220 C
6 15/03/08
(03:30)
15/03/08
(06:42) 57.8 192 86 51 1240 63482 C
7 22/03/05
(18:42)
24/03/05
(08:42) 74.0 2286 30 14 1108 15063 C
8 01/02/04
(08:18)
01/02/04
(12:36) 54.8 270 54 36 1030 37506 C
9 09/06/07
(09:30)
09/06/07
(23:30) 61.6 840 32 16 988 15814 U
10 04/02/05
(11:24)
04/02/05
(14:42) 47.4 198 116 52 985 51215 C
11 12/01/04
(12:36)
12/01/04
(15:12) 48.4 150 64 34 968 33291 U
12 27/01/04
(08:24)
27/01/04
(10:30) 38.4 132 102 59 861 50622 C
13 04/03/04
(11:24)
05/03/04
(04:24) 47.2 990 62 23 799 18221 C
14 14/02/04
(07:24)
14/02/04
(11:12) 39.4 240 66 36 776 27951 U
15 15/02/05
(20:48)
16/02/05
(02:30) 41.4 342 42 29 750 21615 C
16 22/01/05
(15:06)
23/01/05
(02:24) 42.6 684 48 22 738 16236 C
17 22/10/07
(07:06)
22/10/07
(13:42) 40.2 408 80 28 719 20409 SB
18 20/03/05
19:42)
21/03/05
(07:12) 44.6 684 34 15 703 10960 C
19 19/09/05
07:24)
19/09/05
(19:36) 48.2 780 32 18 698 12839 U
20 22/02/08
(14:18)
23/02/08
(02:36) 41.2 744 42 16 642 10015 C
TOTAL 1297.2 14004 TOTAL 23192 810306
MEAN 64.86 700 MEAN 1160 40515
WF= Windfields over Mauritius, C= Cyclonic Activity, ITCZ=Intertropical Convergence Zone, CF= Cold fronts, AC= Anticyclones, SB= Sea breezes, EW=
Easterly Waves Perturbations in the Lower Troposphere, CM= Cloud Masses and Upper Level Lows, U= Weather system unknown. See Table 3-3.
© University of Pretoria

60
Table 4-4: The top twenty event attributes for Arnaud (576 m.a.s.l) from 2004 to 2008
Event
number
Date
and
Time
Start
Date
and
Time
End
Storm
Depth
(mm)
Storm
Duration
(minutes)
Max
Intensity
(I6)
(mm/h)
Max
Intensity
(I30)
(mm/h)
Total
Kinetic
Energy
(J m-2
)
Erosivity
(J mm m-2
h-1
)
Synoptic
circulation
or Weather
System
1 22/03/05
(08:48)
25/03/05
(04:06) 435.8 4014 68 24 7293 177954 C
2 02/03/06
(18:24)
05/03/06
(22:48) 301.2 4560 44 23 4808 111543 C
3 16/05/08
(04:30)
17/05/08
(21:42) 255.4 2478 84 53 4469 235963 CF
4 24/03/08
(23:36)
26/03/08
(15:36) 299.8 2376 70 42 4108 170877 C
5 18/03/05
(02:06)
19/03/05
(11:42) 223.0 2022 80 44 4020 178501 C
6 23/01/06
(16:12)
24/01/06
(09:30) 141.0 1044 56 25 2422 60059 U
7 30/04/04
(16:42)
02/05/04
(16:12) 154.2 2856 30 17 2338 39274 U
8 04/03/05
(15:00)
05/03/05
(19:54) 128.0 1734 82 45 2213 100005 U
9 01/01/04
(16:54)
03/01/04
(07:06) 129.4 2292 38 13 1994 26319 C
10 16/02/06
(13:42)
17/02/06
(04:48) 103.8 918 66 33 1966 65274 C
11 09/04/04
(08:30)
10/04/04
(10:12) 112.2 1548 74 40 1904 75401 U
12 28/11/08
(20:06)
01/12/08
(04:06) 109.4 2826 60 29 1767 50883 U
13 20/03/05
(20:36)
22/03/05
(06:52) 106.2 2064 58 32 1714 55540 C
14
26/02/04
(05:30)
26/02/04
(15:54) 84.0 630 82 54 1702 92596 C
15 31/01/04
(12:24)
01/02/04
(13:18) 88.2 1512 64 40 1561 63051 C
16 01/01/06
(11:18)
03/01/06
(04:18) 98.0 2472 56 19 1555 29858 C
17 20/03/04
(00:24)
21/03/04
(19:42) 86.6 1158 94 46 1529 70952 U
18 12/01/04
(10:36)
12/01/04
(15:00) 69.8 270 92 54 1474 79619 U
19 22/02/08
(13:00)
23/02/08
(06:36) 89.0 1068 40 19 1460 28026 C
20 16/03/08
(10:18)
16/03/08
(13:12) 61.6 180 102 82 1409 115529 C
TOTAL 3006.8 38022 TOTAL 51705 1827222
MEAN 150.3 1901 MEAN 2585 91361
WF= Windfields over Mauritius, C= Cyclonic Activity, ITCZ=Intertropical Convergence Zone, CF= Cold fronts, AC= Anticyclones, SB= Sea breezes, EW=
Easterly Waves Perturbations in the Lower Troposphere, CM= Cloud Masses and Upper Level Lows, U= Weather system unknown. See Table 3-3.
© University of Pretoria
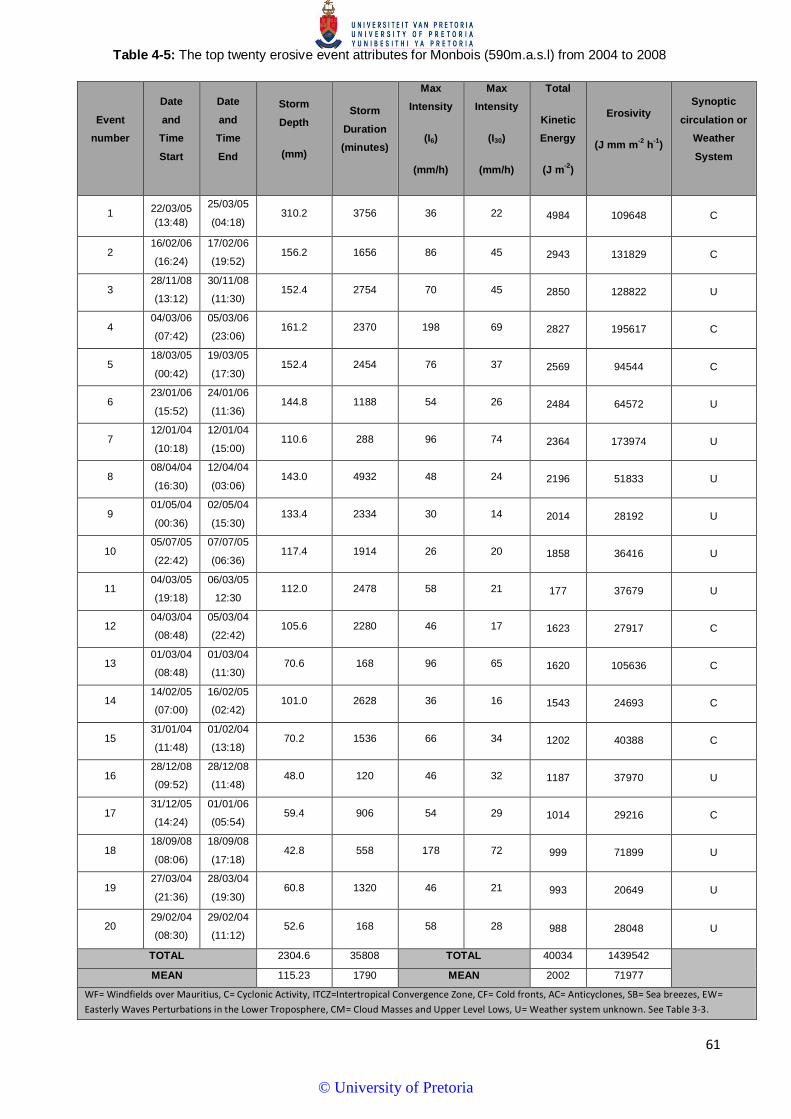
61
Table 4-5: The top twenty erosive event attributes for Monbois (590m.a.s.l) from 2004 to 2008
Event
number
Date
and
Time
Start
Date
and
Time
End
Storm
Depth
(mm)
Storm
Duration
(minutes)
Max
Intensity
(I6)
(mm/h)
Max
Intensity
(I30)
(mm/h)
Total
Kinetic
Energy
(J m-2
)
Erosivity
(J mm m-2
h-1
)
Synoptic
circulation or
Weather
System
1 22/03/05
(13:48)
25/03/05
(04:18) 310.2 3756 36 22 4984 109648 C
2 16/02/06
(16:24)
17/02/06
(19:52) 156.2 1656 86 45 2943 131829 C
3 28/11/08
(13:12)
30/11/08
(11:30) 152.4 2754 70 45 2850 128822 U
4 04/03/06
(07:42)
05/03/06
(23:06) 161.2 2370 198 69 2827 195617 C
5 18/03/05
(00:42)
19/03/05
(17:30) 152.4 2454 76 37 2569 94544 C
6 23/01/06
(15:52)
24/01/06
(11:36) 144.8 1188 54 26 2484 64572 U
7 12/01/04
(10:18)
12/01/04
(15:00) 110.6 288 96 74 2364 173974 U
8 08/04/04
(16:30)
12/04/04
(03:06) 143.0 4932 48 24 2196 51833 U
9 01/05/04
(00:36)
02/05/04
(15:30) 133.4 2334 30 14 2014 28192 U
10 05/07/05
(22:42)
07/07/05
(06:36) 117.4 1914 26 20 1858 36416 U
11 04/03/05
(19:18)
06/03/05
12:30 112.0 2478 58 21 177 37679 U
12 04/03/04
(08:48)
05/03/04
(22:42) 105.6 2280 46 17 1623 27917 C
13 01/03/04
(08:48)
01/03/04
(11:30) 70.6 168 96 65 1620 105636 C
14 14/02/05
(07:00)
16/02/05
(02:42) 101.0 2628 36 16 1543 24693 C
15 31/01/04
(11:48)
01/02/04
(13:18) 70.2 1536 66 34 1202 40388 C
16 28/12/08
(09:52)
28/12/08
(11:48) 48.0 120 46 32 1187 37970 U
17 31/12/05
(14:24)
01/01/06
(05:54) 59.4 906 54 29 1014 29216 C
18 18/09/08
(08:06)
18/09/08
(17:18) 42.8 558 178 72 999 71899 U
19 27/03/04
(21:36)
28/03/04
(19:30) 60.8 1320 46 21 993 20649 U
20 29/02/04
(08:30)
29/02/04
(11:12) 52.6 168 58 28 988 28048 U
TOTAL 2304.6 35808 TOTAL 40034 1439542
MEAN 115.23 1790 MEAN 2002 71977
WF= Windfields over Mauritius, C= Cyclonic Activity, ITCZ=Intertropical Convergence Zone, CF= Cold fronts, AC= Anticyclones, SB= Sea breezes, EW=
Easterly Waves Perturbations in the Lower Troposphere, CM= Cloud Masses and Upper Level Lows, U= Weather system unknown. See Table 3-3.
© University of Pretoria

62
Table 4-6: The top twenty erosive event attributes for Grand Bassin (605m.a.s.l) from 2004 to 2008
Event
number
Date
and
Time
Start
Date
and
Time
End
Storm
Depth
(mm)
Storm
Duration
(minutes)
Max
Intensity
(I6)
(mm/h)
Max
Intensity
(I30)
(mm/h)
Total
Kinetic
Energy
(J m-2
)
Erosivity
(J mm m-2
h-1
)
Synoptic
circulation
or Weather
System
1 22/03/05
(09:24)
25/03/05
(02:42) 384.8 3924 52 31 6334 197612 C
2 18/03/05
(02:00)
20/03/05
(10:24) 247.6 3390 68 36 4138 147300 C
3 16/05/08
(07:00)
17/05/08
(20:48) 209.2 2298 120 52 3657 188688 CF
4 15/09/08
(18:30)
18/09/08
(10:00) 229.4 3810 28 14 3509 49126 U
5 24/03/08
(08:12)
26/03/08
(15:18) 218.4 3372 42 26 3479 90454 C
6 30/04/04
(15:30)
02/05/04
(15:48) 204.8 2904 38 14 3172 44415 U
7 05/07/05
(00:24)
07/07/05
(07:12) 187.6 1854 28 18 3056 53784 U
8 03/03/06
(19:24)
05/03/06
(22:42) 171.4 3126 42 22 2713 58605 C
9 23/01/06
(17:42)
24/01/06
(09:42) 148.8 966 86 39 2599 100833 U
10 09/04/04
(09:06)
11/04/04
(06:24) 145.2 2724 58 35 2539 89374 U
11 14/02/08
(11:42)
17/02/08
(04:12) 165.6 3876 34 16 2511 37165 C
12 14/03/08
(10:30)
15/03/08
(07:30) 106.2 1272 102 58 2188 127757 C
13 04/03/05
(15:12)
06/03/05
(11:48) 127.0 2688 118 82 2125 175135 U
14 01/01/04
(15:12)
03/01/04
(08:52) 129.4 2538 56 31 2099 64640 C
15 26/02/04
(06:12)
26/02/04
(17:30) 93.8 660 48 18 1974 34735 U
16 22/01/05
(09:58)
23/01/05
(15:12) 98.4 1758 54 26 1619 41443 C
17 29/11/08
(00:18)
01/12/08
(03:36) 105.6 3054 36 19 1601 30106 U
18 09/04/05
(15:30)
11/04/05
(18:30) 103.8 3060 26 19 1573 30202 C
19 08/01/05
(07:36)
08/01/05
(14:42) 78.4 432 74 46 1566 72679 U
20 16/03/08
(10:18)
16/03/08
(11:48) 66.8 102 122 68 1556 105802 C
TOTAL 3222.2 47808 TOTAL 54007 1739853
MEAN 161.11 2390 MEAN 2700 86993
WF= Windfields over Mauritius, C= Cyclonic Activity, ITCZ=Intertropical Convergence Zone, CF= Cold fronts, AC= Anticyclones, SB= Sea breezes, EW=
Easterly Waves Perturbations in the Lower Troposphere, CM= Cloud Masses and Upper Level Lows, U= Weather system unknown. See Table 3-3.
© University of Pretoria

63
Table 4-7: The top twenty erosive events attributes for Trou aux Cerfs (614m.a.s.l) from 2004 to 2008
Event
number
Date
and
Time
Start
Date
and
Time
End
Storm
Depth
(mm)
Storm
Duration
(minutes)
Max
Intensity
(I6)
(mm/h)
Max
Intensity
(I30)
(mm/h)
Total
Kinetic
Energy
(J m-2
)
Erosivity
(J mm m-2
h-1
)
Synoptic
circulation or
Weather
System
1 28/05/06
(10:18)
29/05/06
(03:30) 615.0 1038 198 152 14738 2240158 U
2 26/05/06
(22:12)
27/05/06
(11:36) 250.6 816 198 138 5896 816062 U
3 22/03/05
(14:48)
25/03/05
(04:24) 322.8 3696 56 30 5362 158710 C
4 02/03/06
(17:30)
05/03/06
(06:18) 238.4 3645 34 20 3756 73618 C
5 23/01/06
(16:12)
24/01/06
(11:24) 175.0 1158 74 38 3165 121544 U
6 09/04/04
(09:06)
12/04/04
(04:24) 133.2 3972 50 28 2178 60980 U
7 25/01/04
(13:58)
25/01/04
(16:42) 90.4 168 118 78 2139 167729 C
8 04/03/04
(08:54)
05/03/04
(13:30) 129.0 1716 82 28 2076 57303 C
9 18/03/05
(04:54)
19/03/05
(05:18) 113.8 1464 92 42 2066 86770 C
10 02/03/04
(08:58)
02/03/04
(11:06) 90.0 186 102 53 1973 104178 C
11 03/01/06
(06:58)
03/01/06
(07:30) 68.0 36 198 133 1845 245782 C
12 29/02/04
(08:30)
29/02/04
(11:36) 85.2 186 102 53 1843 97301 U
13 01/01/04
(16:24)
03/01/04
(03:42) 89.6 2124 46 15 1342 19864 C
14 28/05/06
(01:24)
28/05/06
(06:06) 66.4 288 198 46 1328 61636 U
15 31/01/04
(20:42)
01/02/04
(12:36) 70.6 954 76 32 1294 41919 C
16 19/02/05
(07:54)
19/02/05
(14:42) 60.2 384 58 37 1153 42881 U
17 13/01/04
(09:00)
13/01/04
(15:48) 56.4 414 68 39 1069 41893 U
18 13/12/04
(18:06)
14/12/04
(05:42) 60.0 708 40 19 980 18816 U
19 13/04/04
(11:24)
13/04/04
(13:48) 43.0 150 98 52 921 48260 U
20 03/02/08
(14:00)
03/02/08
(22:00) 50.4 498 64 30 910 27676 C
TOTAL 2808 23611 TOTAL 56035 4533079
MEAN 140.4 1181 MEAN 2802 226654
WF= Windfields over Mauritius, C= Cyclonic Activity, ITCZ=Intertropical Convergence Zone, CF= Cold fronts, AC= Anticyclones, SB= Sea breezes, EW=
Easterly Waves Perturbations in the Lower Troposphere, CM= Cloud Masses and Upper Level Lows, U= Weather system unknown. See Table 3-3.
© University of Pretoria
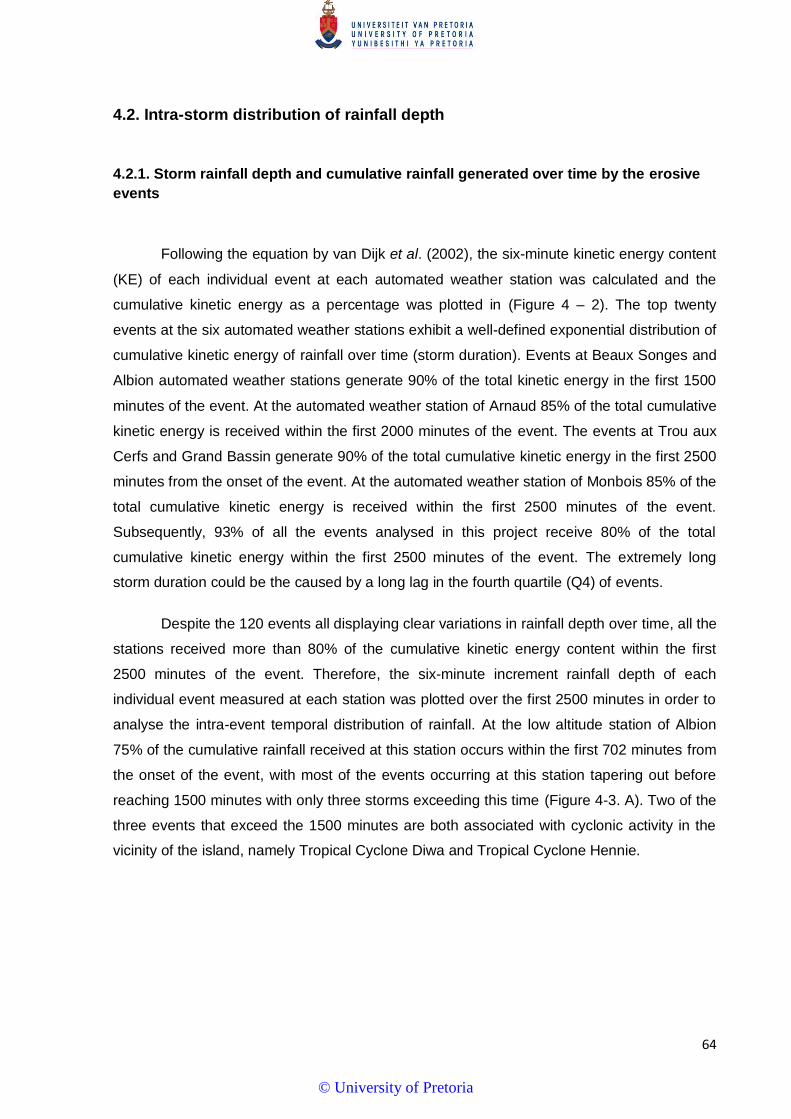
64
4.2. Intra-storm distribution of rainfall depth
4.2.1. Storm rainfall depth and cumulative rainfall generated over time by the erosive
events
Following the equation by van Dijk et al. (2002), the six-minute kinetic energy content
(KE) of each individual event at each automated weather station was calculated and the
cumulative kinetic energy as a percentage was plotted in (Figure 4 – 2). The top twenty
events at the six automated weather stations exhibit a well-defined exponential distribution of
cumulative kinetic energy of rainfall over time (storm duration). Events at Beaux Songes and
Albion automated weather stations generate 90% of the total kinetic energy in the first 1500
minutes of the event. At the automated weather station of Arnaud 85% of the total cumulative
kinetic energy is received within the first 2000 minutes of the event. The events at Trou aux
Cerfs and Grand Bassin generate 90% of the total cumulative kinetic energy in the first 2500
minutes from the onset of the event. At the automated weather station of Monbois 85% of the
total cumulative kinetic energy is received within the first 2500 minutes of the event.
Subsequently, 93% of all the events analysed in this project receive 80% of the total
cumulative kinetic energy within the first 2500 minutes of the event. The extremely long
storm duration could be the caused by a long lag in the fourth quartile (Q4) of events.
Despite the 120 events all displaying clear variations in rainfall depth over time, all the
stations received more than 80% of the cumulative kinetic energy content within the first
2500 minutes of the event. Therefore, the six-minute increment rainfall depth of each
individual event measured at each station was plotted over the first 2500 minutes in order to
analyse the intra-event temporal distribution of rainfall. At the low altitude station of Albion
75% of the cumulative rainfall received at this station occurs within the first 702 minutes from
the onset of the event, with most of the events occurring at this station tapering out before
reaching 1500 minutes with only three storms exceeding this time (Figure 4-3. A). Two of the
three events that exceed the 1500 minutes are both associated with cyclonic activity in the
vicinity of the island, namely Tropical Cyclone Diwa and Tropical Cyclone Hennie.
© University of Pretoria

65
At the low altitude station of Beaux Songes 75% of the cumulative rainfall occurs
within the first 600 minutes from the onset of the event. From Figure 4-3. B it is evident that
most of the events taper out before 1500 minutes with only one event exceeding this
duration. The events at automated weather station of Beaux Songes (event no. 7; Table 4-3)
that exceeded 1500minutes were associated with rainfall received from Cyclone Hennie. At
the inland automated weather station of Arnaud (Figure 4-4. C) and the high altitude station
of Grand Bassin (Figure 4-5. E) 65% of the cumulative rainfall is received within the first 1704
and 1920 minutes respectively. While at the automated weather station of Monbois (Figure
4-4. D) and high altitude station of Trou aux Cerfs (Figure 4-5. F) 70% of the cumulative
rainfall is received within the first 1548 and 984 minutes. The events at Trou aux Cerfs
started tapering out after 1500 minutes. Evidently, visible tapering off of the events occur at
most of the stations, excluding Grand Bassin, where despite longer events occurring, 80% of
the cumulative rainfall is received within the first 2500 minutes from the onset of the event.
0
10
20
30
40
50
60
70
80
90
100
0 500 1000 1500 2000 2500 3000 3500 4000 4500
Cu
mu
lati
ve K
inet
ic E
ner
gy (%
)
Time (minutes)
A: Albion (Coastal)
B: Beaux Songes(Coastal)
C: Arnaud (CentralPlateau)
D: Monbois (CentralPlateau)
E: Grand Bassin(Central Plateau)
F: Trou aux Cerfs(Central Plateau)
E
C
D
F A
B
Figure 4-2: Cumulative kinetic energy generated over time by the erosive events at the respective automated weather stations on Mauritius
© University of Pretoria

66
0
5
10
15
20
25
0 500 1000 1500 2000 2500
Rai
nfa
ll d
epth
(m
m)
Time (minutes )
A
0
20
40
60
80
100
0 500 1000 1500 2000 2500
Cu
mu
lati
ve r
ain
fall
(%)
Time (minutes)
0
5
10
15
20
25
0 500 1000 1500 2000 2500
Rai
nfa
ll d
epth
(mm
)
Time (minutes)
0
20
40
60
80
100
0 500 1000 1500 2000 2500
Cu
mu
lati
ve r
ain
fall
(%)
Time (minutes)
B
Figure 4-3: Rainfall depth and cumulative rainfall generated over time by the events measured at the respective stations on Mauritius: (A) Albion and (B) Beaux Songes
66
© University of Pretoria
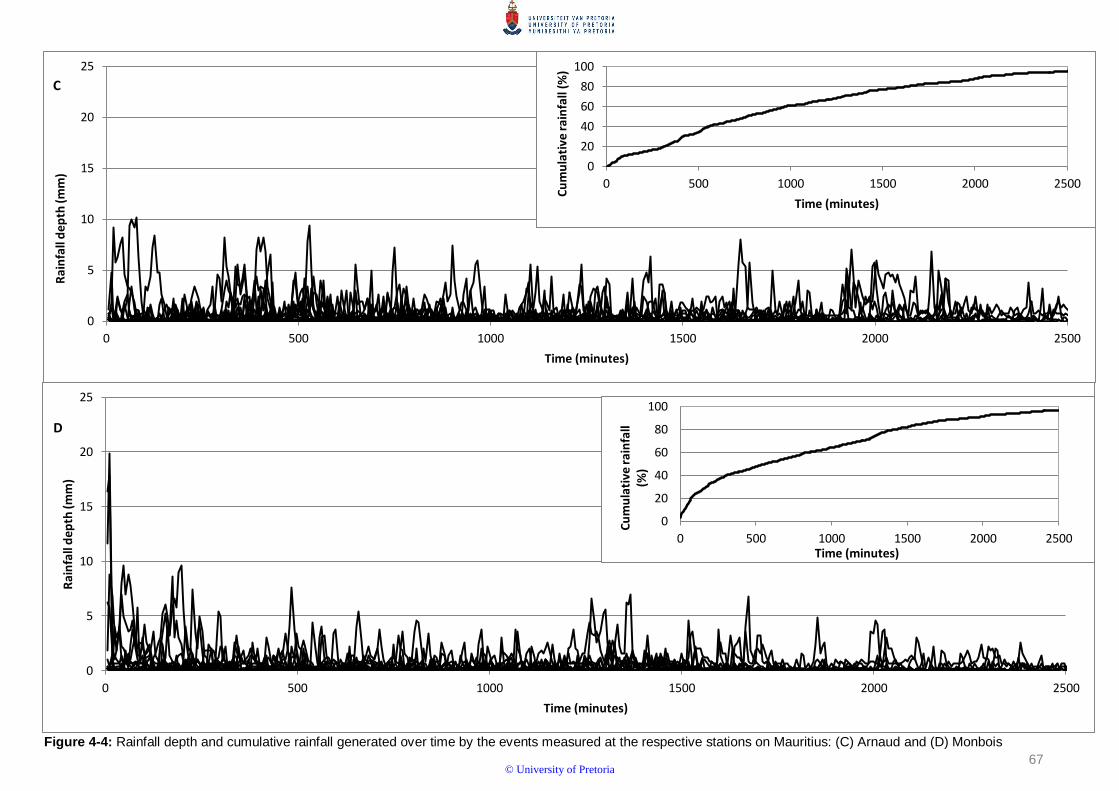
67
0
5
10
15
20
25
0 500 1000 1500 2000 2500
Rai
nfa
ll d
ep
th (m
m)
Time (minutes)
0
20
40
60
80
100
0 500 1000 1500 2000 2500
Cu
mu
lati
ve r
ain
fall
(%)
Time (minutes)
0
5
10
15
20
25
0 500 1000 1500 2000 2500
Rai
nfa
ll d
epth
(mm
)
Time (minutes)
0
20
40
60
80
100
0 500 1000 1500 2000 2500
Cu
mu
lati
ve r
ain
fall
(%)
Time (minutes)
C
D
Figure 4-4: Rainfall depth and cumulative rainfall generated over time by the events measured at the respective stations on Mauritius: (C) Arnaud and (D) Monbois
67
© University of Pretoria

68
0
5
10
15
20
25
0 500 1000 1500 2000 2500
Rai
nfa
ll d
ep
th (m
m)
Time (minutes)
0
20
40
60
80
100
0 500 1000 1500 2000 2500Cu
mu
lati
ve r
ain
fall
(%)
Time (minutes)
0
5
10
15
20
25
0 500 1000 1500 2000 2500
Rai
nfa
ll d
epth
(mm
)
Time (minutes)
0
50
100
0 500 1000 1500 2000 2500
Cu
mu
lati
ve
rain
fall
(%)
Time (minutes)
Figure 4-5: Rainfall depth and cumulative rainfall generated over time by the events measured at the respective stations on Mauritius: (E) Grand Bassin and (F) Trou aux Cerfs
F
E
68
© University of Pretoria
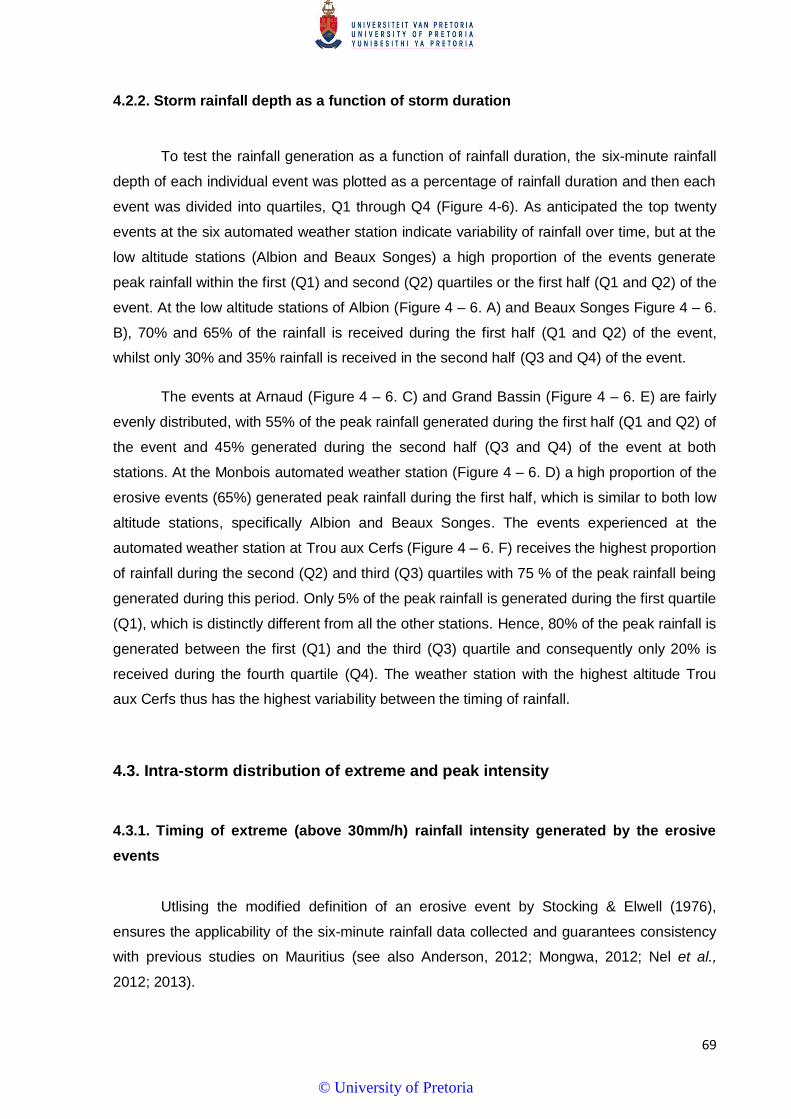
69
4.2.2. Storm rainfall depth as a function of storm duration
To test the rainfall generation as a function of rainfall duration, the six-minute rainfall
depth of each individual event was plotted as a percentage of rainfall duration and then each
event was divided into quartiles, Q1 through Q4 (Figure 4-6). As anticipated the top twenty
events at the six automated weather station indicate variability of rainfall over time, but at the
low altitude stations (Albion and Beaux Songes) a high proportion of the events generate
peak rainfall within the first (Q1) and second (Q2) quartiles or the first half (Q1 and Q2) of the
event. At the low altitude stations of Albion (Figure 4 – 6. A) and Beaux Songes Figure 4 – 6.
B), 70% and 65% of the rainfall is received during the first half (Q1 and Q2) of the event,
whilst only 30% and 35% rainfall is received in the second half (Q3 and Q4) of the event.
The events at Arnaud (Figure 4 – 6. C) and Grand Bassin (Figure 4 – 6. E) are fairly
evenly distributed, with 55% of the peak rainfall generated during the first half (Q1 and Q2) of
the event and 45% generated during the second half (Q3 and Q4) of the event at both
stations. At the Monbois automated weather station (Figure 4 – 6. D) a high proportion of the
erosive events (65%) generated peak rainfall during the first half, which is similar to both low
altitude stations, specifically Albion and Beaux Songes. The events experienced at the
automated weather station at Trou aux Cerfs (Figure 4 – 6. F) receives the highest proportion
of rainfall during the second (Q2) and third (Q3) quartiles with 75 % of the peak rainfall being
generated during this period. Only 5% of the peak rainfall is generated during the first quartile
(Q1), which is distinctly different from all the other stations. Hence, 80% of the peak rainfall is
generated between the first (Q1) and the third (Q3) quartile and consequently only 20% is
received during the fourth quartile (Q4). The weather station with the highest altitude Trou
aux Cerfs thus has the highest variability between the timing of rainfall.
4.3. Intra-storm distribution of extreme and peak intensity
4.3.1. Timing of extreme (above 30mm/h) rainfall intensity generated by the erosive
events
Utlising the modified definition of an erosive event by Stocking & Elwell (1976),
ensures the applicability of the six-minute rainfall data collected and guarantees consistency
with previous studies on Mauritius (see also Anderson, 2012; Mongwa, 2012; Nel et al.,
2012; 2013).
© University of Pretoria
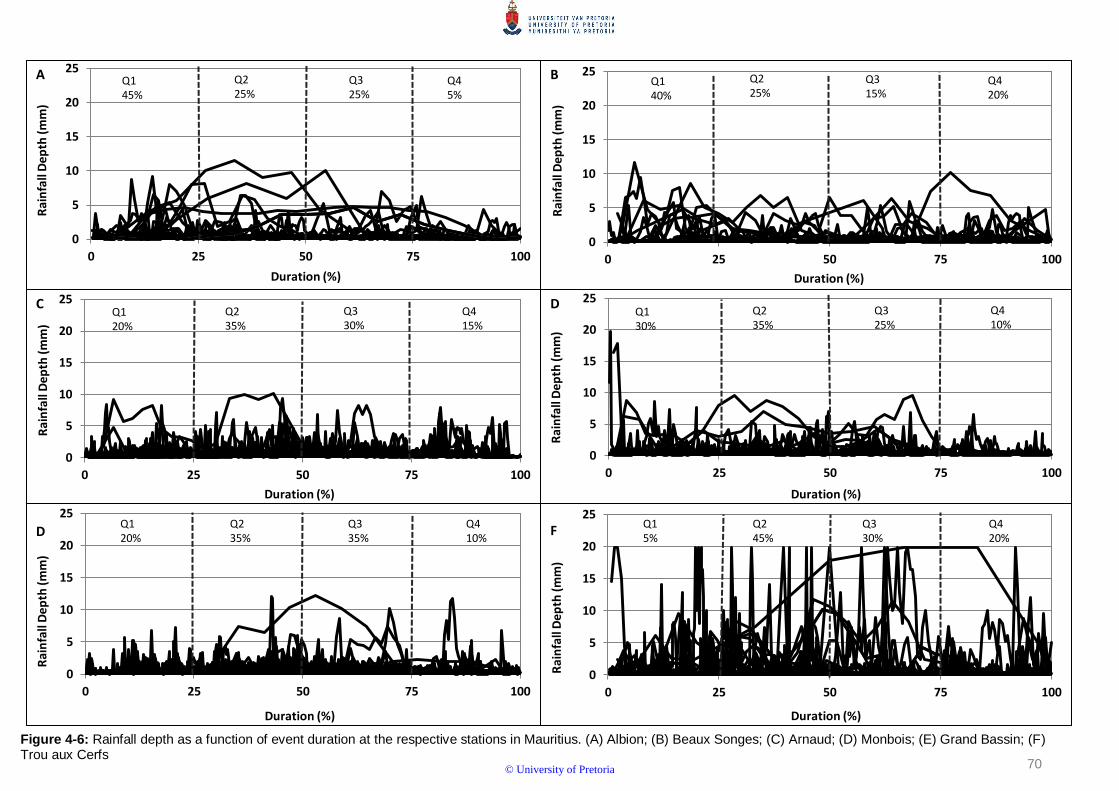
70
Figure 4-6: Rainfall depth as a function of event duration at the respective stations in Mauritius. (A) Albion; (B) Beaux Songes; (C) Arnaud; (D) Monbois; (E) Grand Bassin; (F) Trou aux Cerfs
0
5
10
15
20
25
0 25 50 75 100
Rai
nfa
ll D
ep
th (
mm
)
Duration (%)
Q1 45%
Q2 25%
Q3 25%
Q4 5%
A
0
5
10
15
20
25
0 25 50 75 100
Rai
nfa
ll D
ep
th (
mm
)
Duration (%)
Q4 20%
Q3 15%
Q2 25%
Q1 40%
B
0
5
10
15
20
25
0 25 50 75 100
Rai
nfa
ll D
epth
(m
m)
Duration (%)
Q4 15%
Q3 30%
Q2 35%
Q1 20%
C
0
5
10
15
20
25
0 25 50 75 100
Rai
nfa
ll D
epth
(m
m)
Duration (%)
Q1 30%
Q2 35%
Q3 25%
Q4 10%
D
0
5
10
15
20
25
0 25 50 75 100
Rai
nfa
ll D
epth
(m
m)
Duration (%)
Q4 10%
Q3 35%
Q2 35%
Q1 20% D
0
5
10
15
20
25
0 25 50 75 100
Rai
nfa
ll D
epth
(m
m)
Duration (%)
Q1 5%
Q3 30%
Q2 45%
Q4 20%
F
70
© University of Pretoria
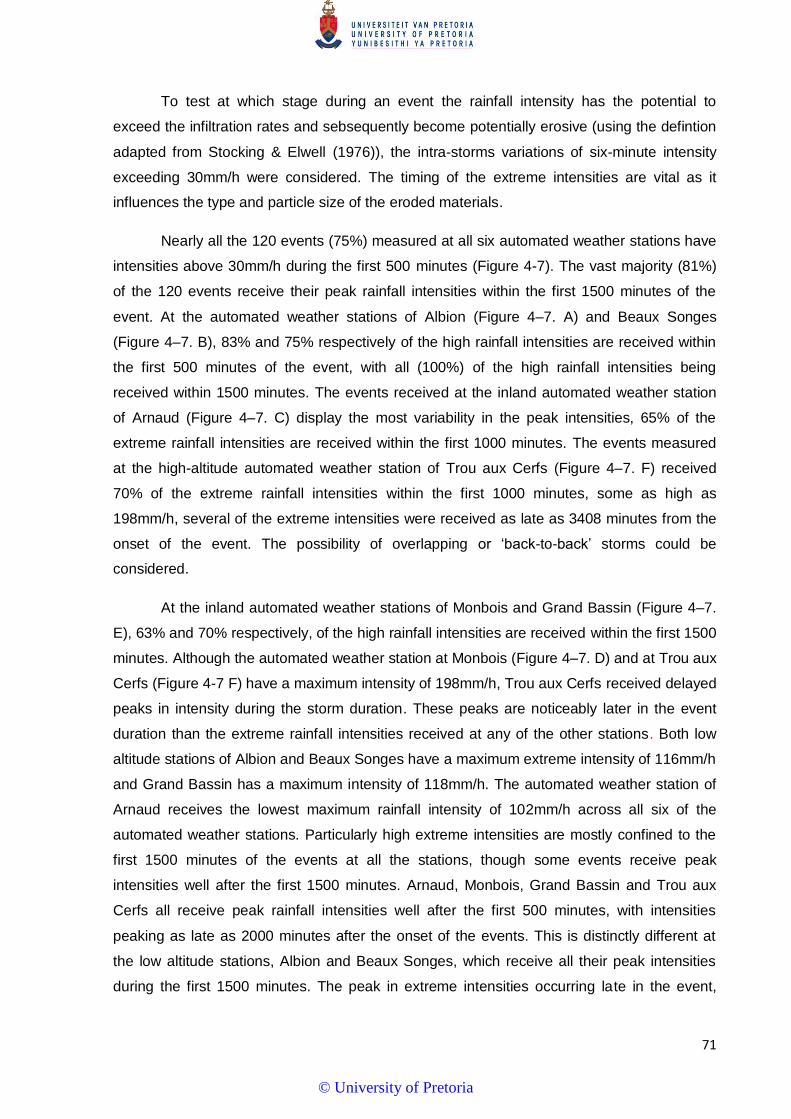
71
To test at which stage during an event the rainfall intensity has the potential to
exceed the infiltration rates and sebsequently become potentially erosive (using the defintion
adapted from Stocking & Elwell (1976)), the intra-storms variations of six-minute intensity
exceeding 30mm/h were considered. The timing of the extreme intensities are vital as it
influences the type and particle size of the eroded materials.
Nearly all the 120 events (75%) measured at all six automated weather stations have
intensities above 30mm/h during the first 500 minutes (Figure 4-7). The vast majority (81%)
of the 120 events receive their peak rainfall intensities within the first 1500 minutes of the
event. At the automated weather stations of Albion (Figure 4–7. A) and Beaux Songes
(Figure 4–7. B), 83% and 75% respectively of the high rainfall intensities are received within
the first 500 minutes of the event, with all (100%) of the high rainfall intensities being
received within 1500 minutes. The events received at the inland automated weather station
of Arnaud (Figure 4–7. C) display the most variability in the peak intensities, 65% of the
extreme rainfall intensities are received within the first 1000 minutes. The events measured
at the high-altitude automated weather station of Trou aux Cerfs (Figure 4–7. F) received
70% of the extreme rainfall intensities within the first 1000 minutes, some as high as
198mm/h, several of the extreme intensities were received as late as 3408 minutes from the
onset of the event. The possibility of overlapping or ‘back-to-back’ storms could be
considered.
At the inland automated weather stations of Monbois and Grand Bassin (Figure 4–7.
E), 63% and 70% respectively, of the high rainfall intensities are received within the first 1500
minutes. Although the automated weather station at Monbois (Figure 4–7. D) and at Trou aux
Cerfs (Figure 4-7 F) have a maximum intensity of 198mm/h, Trou aux Cerfs received delayed
peaks in intensity during the storm duration. These peaks are noticeably later in the event
duration than the extreme rainfall intensities received at any of the other stations. Both low
altitude stations of Albion and Beaux Songes have a maximum extreme intensity of 116mm/h
and Grand Bassin has a maximum intensity of 118mm/h. The automated weather station of
Arnaud receives the lowest maximum rainfall intensity of 102mm/h across all six of the
automated weather stations. Particularly high extreme intensities are mostly confined to the
first 1500 minutes of the events at all the stations, though some events receive peak
intensities well after the first 1500 minutes. Arnaud, Monbois, Grand Bassin and Trou aux
Cerfs all receive peak rainfall intensities well after the first 500 minutes, with intensities
peaking as late as 2000 minutes after the onset of the events. This is distinctly different at
the low altitude stations, Albion and Beaux Songes, which receive all their peak intensities
during the first 1500 minutes. The peak in extreme intensities occurring late in the event,
© University of Pretoria

72
such as at the high altitude stations, could have a significant impact on the potential rainfall
erosivity experienced at these stations.
4.3.2. Extreme rainfall intensity (above 30mm/h) as a function of storm duration
When considering the distribution of the high intensity rainfall as a function of rainfall
duration, just over half (57%) of the 120 events have their high intensities within the first
(Q1) and second (Q2) quartile of rainfall duration (Figure 4-8). At both Albion (Figure 4-8. A)
and Beaux Songes (Figure 4–8. B) 40% and 45% of the events respectively, received their
rainfall intensities during the first quartile (Q1) and 68% and 65% of the peak intensity are
received during the first half of the event (Q1 and Q2). At Albion only 4% of the peak
intensities occur during the fourth quartile (Q4) whilst Beaux Songes receives only 10% of
the peak intensities during the third quartile (Q3). At the automated weather stations of
Albion and Beaux Songes only 32% and 35%, respectively, of the peak intensities occur
during the second half of the event (Q3 and Q4). The inland automated weathers of Arnaud
(Figure 4–8. C) and Monbois (Figure 4–8. D) display a similar pattern, with 60% and 61%,
respectively, occurring during the first half of the event (Q1 and (Q2).
The automated weather station at Grand Bassin displays the least amount of
variability of extreme rainfall intensity distribution, with 53% being received during the first
half (Q1 and Q2) and 48% during second half (Q3 and Q4) of the event (Figure 4–8. E).
Trou aux Cerfs (Figure 4–8. F) displays a similar pattern to the other automated weather
stations, where the majority (65%) of the peak intensity are received during the first half (Q1
and Q2) of the event, and only 35% being received during the second half (Q3 and Q4).
However, automated weather station at Trou aux Cerfs is the only rainfall station that
receives extreme high rainfall intensities (198mm/h) during the third and fourth quartiles (Q3
and Q4). This is noteworthy as it does not take place at any other automated weather
stations, where the extreme high rainfall intensities are typically confined to the first (Q1)
and second (Q2) quartiles. These peak intensities occurring so late into the event could
have major implications for the erosivity at this automated weather station.
© University of Pretoria
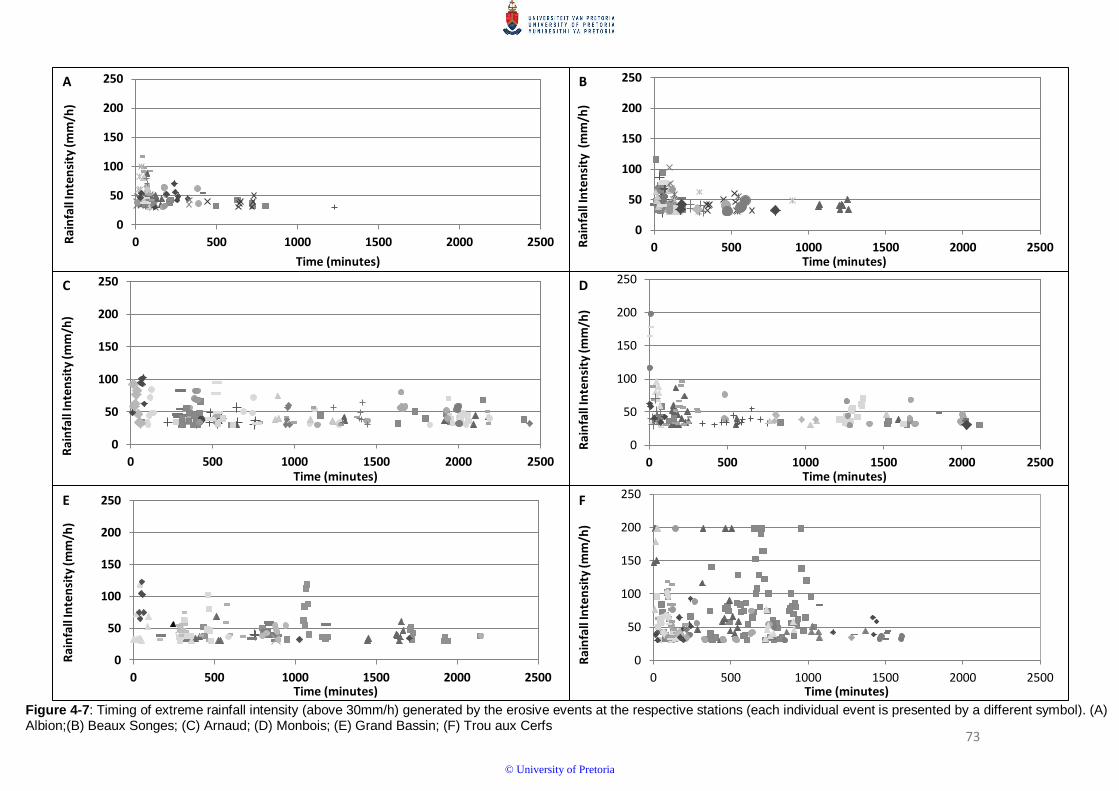
73
Figure 4-7: Timing of extreme rainfall intensity (above 30mm/h) generated by the erosive events at the respective stations (each individual event is presented by a different symbol). (A) Albion;(B) Beaux Songes; (C) Arnaud; (D) Monbois; (E) Grand Bassin; (F) Trou aux Cerfs
0
50
100
150
200
250
0 500 1000 1500 2000 2500Rai
nfa
ll In
ten
sity
(mm
/h)
Time (minutes)
A
0
50
100
150
200
250
0 500 1000 1500 2000 2500Rai
nfa
ll In
ten
sity
(m
m/h
)
Time (minutes)
B
0
50
100
150
200
250
0 500 1000 1500 2000 2500
Rai
nfa
ll In
ten
sity
(mm
/h)
Time (minutes)
C
0
50
100
150
200
250
0 500 1000 1500 2000 2500
Ra
infa
ll In
ten
sity
(mm
/h)
Time (minutes)
D
0
50
100
150
200
250
0 500 1000 1500 2000 2500
Rai
nfa
ll In
ten
sity
(mm
/h)
Time (minutes)
E
0
50
100
150
200
250
0 500 1000 1500 2000 2500
Rai
nfa
ll In
ten
sity
(mm
/h)
Time (minutes)
F
73
© University of Pretoria
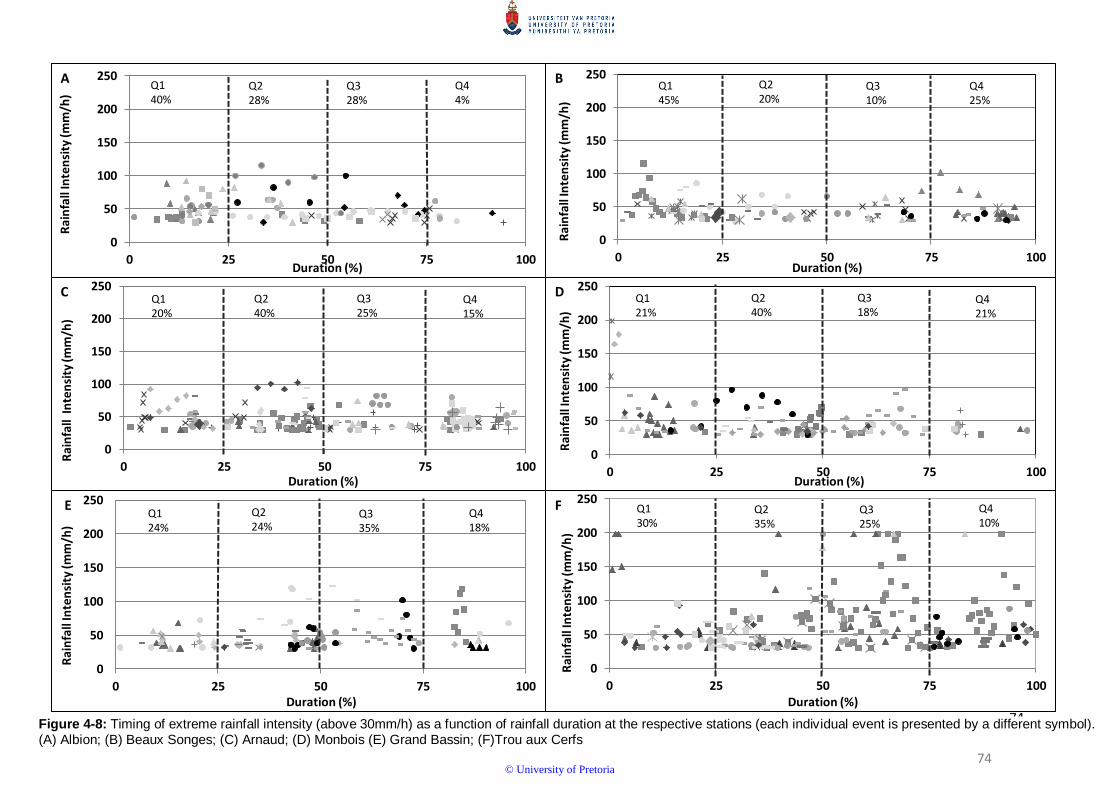
74
Figure 4-8: Timing of extreme rainfall intensity (above 30mm/h) as a function of rainfall duration at the respective stations (each individual event is presented by a different symbol). (A) Albion; (B) Beaux Songes; (C) Arnaud; (D) Monbois (E) Grand Bassin; (F)Trou aux Cerfs
0
50
100
150
200
250
0 25 50 75 100
Rai
nfa
ll In
ten
sity
(mm
/h)
Duration (%)
A Q1 40%
Q2 28%
Q3 28%
Q4 4%
0
50
100
150
200
250
0 25 50 75 100
Rai
nfa
ll In
ten
sity
(mm
/h)
Duration (%)
B Q1 45%
Q2 20%
Q3 10%
Q4 25%
0
50
100
150
200
250
0 25 50 75 100
Rai
nfa
ll In
ten
sity
(mm
/h)
Duration (%)
Q1 20%
Q2 40%
Q3 25%
Q4 15%
C
0
50
100
150
200
250
0 25 50 75 100
Rai
nfa
ll In
ten
sity
(mm
/h)
Duration (%)
D Q1 21%
Q2 40%
Q3 18%
Q4 21%
0
50
100
150
200
250
0 25 50 75 100
Rai
nfa
ll In
ten
sity
(mm
/h)
Duration (%)
E Q4 18%
Q3 35%
Q2 24%
Q1 24%
0
50
100
150
200
250
0 25 50 75 100
Rai
nfa
ll In
ten
sity
(mm
/h)
Duration (%)
F Q4 10%
Q3 25%
Q2 35%
Q1 30%
74
© University of Pretoria

75
4.4. Climatic drivers and temporal analysis of erosive events
The eight weather systems prevailing over Mauritius as identified by Fowdur et al.
(2014) (see Table 3-3) were each given representative symbols which were applied to the
120 events. These symbols were utilised in an attempt to classify the events into the
appropriate weather systems from synoptic data available from the Mauritius Meteorological
Services Monthly Bulletins of Climatological Summaries, Mauritius Meteorological Services
website (MMS, 2014a) as well as the Météo-France Réunion (Météo-France, 2015) website.
Although the lack of synoptic data at the event scale was a limitation to organising the events
into the appropriate weather systems from the available data, an attempt has been made to
classify the events accordingly.
More than half 63 (53%) of the total events analysed for this project are related to
cyclonic activity within the vicinity of the island. Only 5 (4%) of the total events are related to
non-cyclonic events, and have been identified as frontal mesoscale rainfall caused by cold
fronts (MMS, 2008). Due to the lack of available synoptic data, 53 (44%) of the total events
have unknown weather systems. During the study period, a few tropical cyclones were within
the vicinity of the island. Upon considering the dates that each of the 120 events occurred, a
number of dates coincide with rainfall caused by cyclonic activity occurring around the island.
Numerous cyclonic events occurred concurrently at all six stations. The most important dates
during which concurrent events occurred include; 20-26 March 2005 and 02-04 March 2006.
The period from 22 to 26 March 2005 is remarkable as it coincides with cyclone
Hennie that was classed as a Severe Tropical Depression (MMS, 2014c). Noticeable pre-
cyclonic rainfall also occurred at all six automated weather stations from 18 to 21 March
2005 (Météo-France., 2015). Hence, cyclone Hennie represents rainfall from multiple events
at all of the automated weather stations. As a result cyclone Hennie represents at least two
of the events at each of the six automated weather stations. While the rainfall from events
associated with Cyclone Hennie occur on the same day, the events rank differently at each
station based on the ranking of the total kinetic energy content generated of the respective
event. At the inland station of Arnaud, rainfall from cyclone Hennie corresponds to three of
top twenty events. At the coastal stations of Albion and Beaux Songes rainfall from cyclone
Hennie is event no. 9 and event no. 7 respectively. The rainfall depth, duration and erosivity
for the event recorded at the Albion station is much higher than the rainfall depth, duration
and erosivity at Beaux Songes. Rainfall from cyclone Hennie is represented by event no. 1
at Arnaud, Monbois and Grand Bassin. Despite the station at Grand Bassin has the highest
erosivity of these three stations, the station at Arnaud has the highest storm duration, depth
© University of Pretoria

76
and Total Kinetic energy. Even though rainfall from event no. 3 at Trou aux Cerfs represents
cyclone Hennie it has higher rainfall erosivity than the rainfall from the event at Monbois,
where cyclonic Hennie is no. 1.
The start time of rainfall from Cyclone Hennie is also variable. Rainfall is first
recorded at Arnaud at (08:48) on the 22 March 2005, then 36 minutes later at Grand Bassin,
followed by Monbois a further 4 hours and 24 minutes later, then 1 hour later it is recorded
at Trou aux Cerfs, then a further 3 hours and 42 minutes later at Albion. Finally the rainfall
from the event commences at Beaux Songes 12 minutes after Albion. Rainfall from this
cyclonic event ends on the 24 March 2005 at both low altitude stations but continues until
the 25 March 2005 at all the other automated weather stations.
Another important period is 02 March 2006 to 04 March 2006 which coincides with
Cyclone Diwa (MMS, 2014c). Even though the rainfall from Diwa represents an event at all
six stations, the events rank differently (due to kinetic energy content). Cyclone Diwa
represents event no. 3 at Albion, whilst it is event no. 4 at both Monbois and Trou aux Cerfs
and at Beaux Songes it corresponds to event no. 5. At Arnaud it is event no. 2 and event
no. 8 at the Grand Bassin rainfall station. The rainfall received from Cyclone Diwa started a
day earlier at Arnaud and Trou aux Cerfs than at the four other automated weather stations.
The rainfall from the events at Arnaud and Trou aux Cerfs commenced within an hour of
each other, 18:24 at Arnaud and 17:24 at Trou aux Cerfs. Four of the six events associated
with rainfall from Cyclone Diwa extended one day past the date on which the tropical
cyclone officially ended. The event at Beaux Songes is the shortest, and only occurs from
03 March 2006 (22:12) to 04 March 2006 (20:42).
Even though the two concurrent events discussed above represent cyclonic events
some of the other concurrent events coincide with non-cyclonic rainfall, namely cold fronts,
sea breezes induced rainfall and thunderstorms. Frontal mesoscale rainfall was caused by
two cold fronts crossing the island on the 16 and 19 of May 2008 (MMS, 2008). These two
cold fronts were followed by easterly waves causing a very unstable atmosphere (MMS,
2008). These cold fronts caused heavy rain and thunderstorms across the entire island
(MMS, 2008). Despite, this cold front bringing widespread rainfall to the island- it is only
recorded as erosive events at the automated weather stations at Arnaud and Grand Bassin.
Though frontal mesoscale rainfall from this cold front represents event no. 3 at both Arnaud
and Grand Bassin, the erosivity of this event is noticeably higher at Arnaud than it is at
Grand Bassin. Pre-cold frontal uplift was recorded on the 14 May 2008 at the coastal station
of Albion (event no. 17) (MMS, 2008).
© University of Pretoria

77
Another noteworthy event occurred at Albion on the 8 March 2004 (Nel et al., 2012).
This is represented by event no. 8. During the 90 minute rainfall event, 59 mm of rainfall was
received and no rainfall was recorded at any of the other rainfall stations. Hence, it is
assumed that it was non-cyclonic in nature and was potentially due to a localised convective
rainfall event associated with thunderstorms at a storm scale.
The seasonal distribution of the erosive events is noteworthy. Mauritius has two
predominant annual weather seasons; a warm, wet summer from November to April and a
cool dry winter from May to October (Padya, 1989). Therefore, the seasonal distribution of
the 120 events was done according to this classification. Events occurring during the
summer months account for 102 (85%) of all 120 events, while those occurring during the
winter months only account for 18 (15%). The total rainfall depth (mm) received from all 120
events was 14045.2 mm, and 81% was received during the summer months and 19% was
received during the winter months of May to October. Granted the automated weather station
at Albion had the highest number of events during the winter months (20%), this winter
rainfall only accounted for 24% of the rainfall received at this station. Rainfall received at
Arnaud during the summer months is 92% of the total rainfall received at this station. At
Monbois, 87% of the rainfall received at this station was during the summer months. Trou
aux Cerfs (the station with the highest altitude) received 67% of the rainfall during the
summer months and 33% during the winter months. Event no. 1 and 2 at Trou aux Cerfs
occur during the winter months. This event at Trou aux Cerfs (event no.1) is responsible for
26% of the total KE and 49% of the rainfall erosivity received at this station, hence this event
has the potential to be deemed as highly erosive. It is highly likely that cold fronts were
responsible for these events as the passage of cold fronts throughout the winter months is
generally associated with an increase in convective activity and subsequent rainfall over
Mauritius, particularly in areas with distinct orographic characteristics (Padya, 1989) such as
those surrounding the automated weather station at Trou aux Cerfs. The annual distribution
of the events are substantial, 108 (90%) of 120 of the events occur during the first half of the
year from January to June, with January to March receiving the vast majority of the events
(87 of 108 events). In contrast, only 12 of the 120 events occurred during the second half of
the year.
In summary, Chapter 4 has presented the results of the objectives set out following
the methodology discussed in the previous chapter. The most important findings and
observations have been highlighted and will be discussed in the next chapter, Chapter 5.
Although, all the events exhibited temporal variability in rainfall depth and rainfall intensity,
© University of Pretoria

78
some common intra-storm characteristics are present amongst all the events. In all cases,
the influence of the orography on the spatial and temporal variation of the events is apparent.
Events were not restricted to tropical cyclones, but also included other weather systems such
as cold fronts, sea breezes induced rainfall and thunderstorms. The intra-storm attributes of
the events have potential implications on soil erosion risk. These will be discussed in depth in
the following chapter.
© University of Pretoria

79
Chapter 5 : Discussion
The tropical environment of Mauritius is attributed to its size, location, topography,
local island-scale weather systems and maritime climate. This consequently allowed the
intra-storm investigation of erosive events (based on the ‘total kinetic energy generated’) to
be contextualised within a tropical island environment. Six automated weather stations
provided the opportunity to investigate how elevation can influence the intra-storm attributes
of rainfall parameters. Although no other weather station data were available at the time of
the study, the automated weather stations utilised for this project represent rainfall totals at
two geographical extremes of the island (low and high totals). Considering the results from
the previous chapter, this chapter discusses the identification of the erosive events from the
data provided by the Mauritius Meteorological Services (MMS), followed by the role of
Mauritius’ physiography on spatial and temporal differences to the within-storm distribution of
rainfall depth, extreme rainfall intensity and cumulative kinetic energies. Then the influence of
elevation, associated with orographic lifting, has on the erosive events at the geographical
extremes of the island will be discussed. The chapter concludes in a discussion of the
potential implications of the erosive events on soil erosion risk.
5.1. Identification of the erosive events
Only one other study (Nel, 2007) has identified and analysed intra-storm attributes of
rainfall parameters. The current study has attempted to analysis double the number of
erosive events utilised in the initial study by Nel (2007) as well as increased the time period
(duration) in order to provide a greater intra-storm analysis in an attempt to include more
weather event types. A climatological analysis of the erosive events, not done by Nel (2007),
was also undertaken in this study. An attempt was made to classify the erosive events into
the appropriate synoptic weather systems. However, the absence of synoptic descriptions of
the daily weather patterns and the lack of synoptic data at the event scale was a limitation to
organising the events. However, some assumptions were made using the information
available from the Mauritius Meteorological Services Monthly Bulletins of Climatological
Summaries, Mauritius Meteorological Services website (MMS, 2014a) as well as the Météo-
France Réunion (Météo-France, 2015) website.
While a few months of the data acquired from the MMS were missing or incomplete,
the synchronicity of the data allowed for the direct inter-station comparisons. Subsequently,
© University of Pretoria

80
the events utilised in this intra-storm analysis may possibly not have been the actual top
twenty events at each automated weather station, but were the top measured events at each
station. These events were also not defined in the context of extreme events, they were
simply taken as the twenty events with the highest total kinetic energy producing events from
an erosivity perspective at the six automated weather stations.
5.2. Spatial and temporal variations of erosive events
Temporal and spatial variability of erosive events and the associated rainfall erosivity
is important in tropical areas, as rainfall erosivity is affected by storm type and varies with
topography and altitude (Salako, 2007). On Mauritius, spatial and temporal variability is
evident in the characteristics of the erosive rainfall recorded at the stations. Although
temporal variability with regard to rainfall depth is demonstrated by the 120 events, a
common characteristic amongst all the events is that more than 80% of the rainfall generated
is within the first 2500 minutes of the event. Therefore, visible tapering off of the storm
duration occurs after 2500 minutes at the majority of the stations analysed for this project.
However, the events at Grand Bassin are the exception, where despite noticeably longer
storms occurring, 80% of the cumulative rainfall is received within the first 2500 minutes from
the onset on the event. The location of this rainfall station, on the southern, leeward side on
the island could have a significant impact on the duration of the erosive events.
Mauritius experiences two distinct seasons, a rainy summer season from November
to April, and drier winter season from May to October (Padya, 1989; Nigel & Rughooputh;
2010a; Nel et al., 2012; Staub et al., 2014). The seasonality is predominately due to the
migration of the Inter Tropical Convergence Zone (ITCZ) (Fowdur et al., 2014). The ITCZ is
closest to Mauritius from January to March, subsequently warm season depressions affect
the island, resulting in high rainfall and markedly more erosive events. This is evident from
the 120 events, with 73% of the events occurring from January to March during the
southward migration of the ITCZ towards the subtropical latitudes and the occurrence of
tropical cyclones (Staub et al., 2014). During the winter months, the ITCZ is located north of
the equator causing anticyclonic conditions with the interruption of the occasional cold front
that are associated with an increase in convective activity over the island (Staub et al., 2014).
While only 15% of the 120 events occurred during the winter, large percentages of winter
rainfall events on Mauritius have been deemed as erosive and is rainfall associated with non-
tropical cyclones that posed substantial soil erosion risk (Nigel & Rughooputh, 2010b; Nel et
al., 2012).
© University of Pretoria
81
At the inland automated weather stations of Arnaud and Monbois, 92% and 87%
respectively, of the rainfall associated with the events is received during the summer months
when the erosion risk is most significant. At the automated weather station of Trou aux Cerfs,
67% of the erosive rainfall is received during the summer months, and 33% during the winter
months, which is similar to findings made by Anderson (2012); Mongwa (2012) and Nel et al.
(2012). Therefore the seasonal distribution of erosive rainfall received at this station is better
than at the other automated weather stations, indicating that this station receives more
erosive rainfall during winter than any other station. Event no. 1 and no. 2 at Trou aux Cerfs
are assumed to be cold fronts. The passage of cold fronts throughout the winter months is
generally associated with an increase in convective activity and subsequent rainfall over
Mauritius, particularly in areas with distinct orographic characteristics (Padya, 1989) such as
those surrounding the automated weather station at Trou aux Cerfs. Event no. 1 at Trou aux
Cerfs is responsible for 49% of the rainfall erosivity received and accounts for the highest
total rainfall depth received from the 120 events. Thus, these two non-tropical cyclonic
events pose huge erosional risks at this station. Elevation is responsible for Trou aux Cerfs
receiving fewer total events than the other stations located on the central interior (Anderson,
2012; Nel et al., 2012).
Mauritius, similar to other tropical islands, has a noticeable spatial difference in
rainfall across the island (Bender et al., 1985; Barcelo et al., 1997; Yen & Chen, 2000;
Fowdur et al., 2006). Flatter, lower coastal areas generally remain drier than the central
plateau throughout the year, except in January and February when the mean annual rainfall
is high even on the west coast, or the leeward side of the island due to the southeasterly
tradewinds (Staub et al., 2014). Rainfall variability of the erosive events is comparable to the
mean annual rainfall which varies longitudinally across the island from 1400 mm in the
eastern coastal lowlands, to 4000 mm on the uplands and 800 mm along the western coastal
lowlands (Rughooputh, 1997; Dhurmea et al., 2006; WRU, 2007). This spatial differentiation
is evident in the characteristics of the erosive rainfall at the stations, with a noticeable
increase in all intra-storm variables measured at the coastal versus the interior stations (Nel
et al., 2012). Rainfall received from the events at the west coast station (Albion and Beaux
Songes) is noticeably less than the erosive rainfall of the uplands station (Arnaud, Monbois,
Grand Bassin and Trou aux Cerfs).
© University of Pretoria
82
5.3. The influence of elevation on the erosive events at the respective
stations
Orography is the influence of mountain topography on subaerial conditions and the
most striking orographic effect is on the distribution of rainfall across an area (Terry &
Wotling, 2011). Places characterised by complex topography, such as Mauritius, typically
receive rainstorms because topographic forms drawing out atmospheric moisture through
orographic precipitation mechanisms (Barstad & Smith, 2004). The best known relationship
of the orographic effect- rainfall increases with elevation (Prudhomme & Reed, 1998).
Mauritius’ rainfall gradient is due the orographic effects of the South Easterly trade winds
interacting with the south-eastern mountain range and the central uplands (Fowdur et al.,
2006). Therefore, distribution of rainfall is highly dependent on an island’s topography (Hoyos
et al., 2005; Dhurmea et al., 2009; Senapathi et al., 2010). However, the results from this
project contradict the general relationship that rainfall increases with elevation and better
align themselves with findings made by Hoyos et al. (2005), who found that in the tropical
mountainous areas of the Colombian Andes, seasonal rainfall increases to a certain
elevation then decreases. Even though the change in elevation on Mauritius is less than the
change in elevation noted by Hoyos et al. (2005), the events at Trou aux Cerfs (614m.a.s.l;
the station with the highest altitude), had a lower total rainfall depth than the other stations on
the elevated central plateau, namely Arnaud (576m.a.s.l), Monbois (590m.a.s.l) and Grand
Bassin (605m.a.s.l). Hence, the importance of elevation, surrounding geographic features
and microclimates on the rainfall distribution and characteristics that an area experiences.
Owing to variations in diurnal exposure, elevation and distance from the sea, a
succession of island scale climatic regions or microclimates exist (Nigel & Rughooputh,
2010a). Twenty seven microclimates have been identified by Padya (1989), despite the small
size of the island. The substantial variations in the microclimatic characteristics of Mauritius
are derived from the climate (Rughooputh, 1997). Subsequently, the geographic features and
microclimates of the landscape surrounding of the weather stations influence the rainfall
distribution, erosivity and rainfall intensity of the erosive events. Even with both Albion and
Beaux Songes being situated on the west coast, Albion (12 m.a.s.l) receives more rainfall
than Beaux Songes (225 m.a.s.l) thus highlighting the influence which the rain-shadow and
surrounding geographic features has on Beaux Songes and the influence the Indian ocean
potentially has on rainfall received at Albion.
The westward or leeward orientation of the orographic barrier is also important when
associating rainfall and elevation (Staub et al., 2014). The diverse microclimates on the
© University of Pretoria
83
island could be used to explain and interpret the intra-storm differences between the stations
on the interior of the island. Despite the automated weather stations of Arnaud, Monbois,
Grand Bassin and Trou aux Cerfs are all located on the elevated interior, the distinction
should be made to exactly where on the elevated interior each station is found. Arnaud and
Trou aux Cerfs stations are located within the same microclimatic zone on the leeward side
of the central plateau and the Monbois station is located on the westward side of the central
plateau. The southern and east coasts of Mauritius received higher rainfall than the west and
north coast due to the prevailing southeasterly trade winds (Fowdur et al., 2014; Staub et al.,
2014).
As the Grand Bassin station is located on the boundary between the central plateau
and the south uplands, it is speculated that the uplands located near this station could affect
the development of erosive events, and in turn affect the local climate around the station
(Anderson, 2012). Influences of the southeasterly trade winds could be more apparent at
Grand Bassin due to the geographic features and microclimate of the landscape surrounding
the weather station. The unique location of Grand Bassin is responsible for this station
receiving the highest rainfall depth of all six stations (Anderson, 2012). Thus results indicate
that the intra-storm attributes of rainfall events are strongly dependent on the geographic
features within the immediate surroundings of the weather stations, and distance between
weather stations did not always lead to predictable differences in intra-storm attributes
Rainfall intensity and erosivity increases with elevation; with the station at Trou aux
Cerfs recording the both the highest maximum intensity (I30) and the highest rainfall erosivity.
This is dissimilar to the Nel et al. (2007) study in the Drakensberg that covered an altitudinal
range (1060m to 3165 m.a.s.l), where the lower altitude stations recorded the higher
maximum intensities and erosivities than those at higher altitudes. Differences between the
temperate (Drakensberg) and tropical (Mauritius) could be attributed to the differences in
dominant rainfall generating mechanisms occurring in each region and altitudinal range (∆H),
influencing the amount of precipitation received as well as the intensity and kinetic energy of
the rainfall. The main rainfall generating mechanism in most tropical region are
predominately convection and cyclonic, and as a result the tropics receive more rain at
higher intensities than the temperate regions whose rainfall is dominated by mid-latitude
cyclones and consequently larger EI30 values are observed in the tropics (Hoyos et al.,
2005). Since, the erosive power of the precipitation is accounted for by the rainfall-erosivity
factor R, the individual stations all experience different erosivity because of the combined
effect of magnitude, duration and intensity of each rainfall event (Bonilla & Vidal, 2011).
Hence, if all other parameters are kept constant, soil loss is directly proportional to the rainfall
© University of Pretoria
84
erosivity (Wang et al., 2002) Trou aux Cerfs would consequently have the highest rates of
potential soil loss.
Regardless of knowing that rainfall erosivity of an event is influenced by the intra-
storm distribution of rainfall intensity, it is only recently that such variability has been
incorporated into soil-erosion modelling (Parsons & Stone, 2006). Rainfall intensity is
regarded as a fundamental control of interrill runoff and erosion because rainfall intensity can
have an effect on the size distribution of the detached sediment as well as the total amount
of detached sediment (Parsons & Stone, 2006). Since runoff is inversely related to infiltration
the effect of rainfall intensity on runoff can be understood through its effects on infiltrat ion
(Parsons & Stone, 2006). Timing of the peak rainfall depth and peak extreme intensity is
paramount to the infiltration as well as the potential runoff and erosion experienced at each
station.
Although the events display variability in both rainfall depth and rainfall intensity,
similarities in the timing of the peaks are present. In general, the peak rainfall depth
corresponds almost directly to the peak rainfall intensities experienced. Peak rainfall depth
and peak rainfall intensities are received during the first half of the event at both low altitude
stations (Albion and Beaux Songes) as well as Monbois on the windward side of the central
plateau. At the Grand Bassin and Arnaud automated weather stations the peak rainfall is
more variable, but it still corresponds to the peak intensities occurring during the first half of
the event. The automated weather station at Trou aux Cerfs is the exception, where the peak
rainfall and intensities are received during the middle part (Q2 and Q3) of the event. Events
peaking towards the end of the event could have detrimental effects on peak runoff rates,
potential soil loss and the overall erosivity. Elevation might be responsible for the majority of
the events at Trou aux Cerfs having their peak rainfalls and intensity during the second half
of the event. It should be emphasised that despite this, the erosive events show high
temporal variability with no event showing constant intensity over time. The timing of the
peak rainfall depth and peak intensities as well as the specific storm pattern have important
implications for the amount of soil loss and the size of the particle being eroded. Rainfall
intensity is a key measure of rainfall erosivity, for example a region with higher rainfall
intensities could have more or similar erosivity when related with a region with higher rainfall
amount and more frequent rainfall (Salako, 2008).
Erosive events peaking in intensity towards the end in conjunction with varying-
intensity events have the highest peak runoff rates and soil loss (Nel, 2007). The highest
potential soil erosion risk is anticipated to occur at Trou aux Cerfs as this station received the
most consistently high rainfall intensity of any station. Parsons & Stone (2006) emphasise
© University of Pretoria
85
that events with higher rainfall intensity, are responsible for higher percentages of coarser
particles and a higher clay content being found in the eroded sediment because of the
breakdown of the cohesion between the particles. Under natural rainfall conditions the peak
sediment transportation coincides with the peaks in rainfall intensities (Moore, 1979).
Consequently, the erosivity of the erosive rainfall in Mauritius is strongly influenced by both
the timing of peak intensity and the specific event pattern.
A similar intra-storm study conducted in the Drakensberg by Nel (2007) found 70% of
the erosive events measured have intensities above the 25mm/h during the first 100minutes
of event duration and all the stations receive a high proportion of peak rainfall intensity within
the first half of the event, then the erosivity of erosive rainfall in the Drakensberg could be
moderated by the within-storm distribution of rainfall intensity. The Drakensberg study shows
that despite common tendencies of rainfall event structure between events and between
stations can be distinguished, the within-storm distribution indicated that no two events are
precisely similar and no two stations in this region show similar distribution of event patterns.
The study by Nel (2007) implies that the structure of erosive rain is both site and event
specific, and due to the many spatial disparities exist for intra-storm rainfall distribution which
exist between the small number of stations measure in this study, it is not possible to
extrapolate the study by Nel (2007) for the Drakensberg region as a whole. However, the
events experienced on Mauritius share some common characteristics between events and
stations. The intra-storm analysis suggests despite the spatial differentiation in the structure
and nature of the erosive rainfall, generalisations can be made regarding the potential
erosion experienced in the coastal and interior regions of the island.
5.4. The potential implication of the erosive events on soil erosion risk
Soil erosion risk, like rainfall, on Mauritius varies seasonally (Le Roux, 2005; Nigel &
Rughooputh, 2010b). Considerable soil erosion risk in summer is as a result of tropical
cyclones, thunderstorms and orographically-induced rainfall (Le Roux, 2005; Seerutten et al.,
2007). Just over half (52%) of the 120 events are related to cyclonic activity and posed high
erosion risk, as between 48% and 68% of the soil erosion on the island is associated with
cyclonic activity (Seerutten et al., 2007). Furthermore, the erosion risk maps by Nigel &
Rughooputh (2010b) show that all land cover and cultivation types on Mauritius are at risk of
severe erosion, particularly during intense cyclonic events during January and February.
While the events support these notions, it also highlights the importance of considering non-
tropical cyclones which were also shown to pose substantial erosion risk.
© University of Pretoria
86
The greatest risk of soil erosion on Mauritius typically occurs from December to April
each year, and is linked to the severe tropical cyclones and accompanying torrential rainfall
experienced during this period (Nigel & Rughooputh, 2010b; Nigel, 2011). Furthermore, the
lack of vegetation in December results in this month posing the highest erosion hazard (Nigel
& Rughooputh, 2010b). The humid and super-humid climates of the central interior (Arnaud,
Monbois, Grand Bassin and Trou aux Cerfs) are inclined to experience greater erosion than
the sub-humid coastal regions of the island (Albion and Beaux Songes) (Nigel, 2011). Soil
erosion risk then decreases to moderate levels during March to April and is very low during
May to October (Nigel, 2011).
Erosion risk patterns closely, and inversely, follow patterns of vegetation cover on the
island. Vegetation cover is at its greatest during March, following on from the peak rainfall
depth received during February, and consequently provides the most protection from erosion
during this time. As rainfall decreases from April to November so does the vegetation cover,
causing an increase in the erosion hazard of rainfall (Nigel & Rughooputh, 2010b).
Consequently, the potential soil erosion risk is highest during the earliest part of the wet
season (December) when the majority of the rainfall occurs and vegetation cover is at its
lowest and does not yet provide adequate protection to the soil (Morgan, 2005; Nigel &
Rughooputh, 2010b). The erosive events in this study follow the same seasonal rainfall
pattern, thus exacerbating the soil erosion when the erosion risk is at its highest.
On Mauritius, areas with flat terrain and lowly erodible soils, like those found at
Albion, have low erosion susceptibility (Nigel, 2011). Furthermore, areas with undulating
terrain, similar to the terrain at Beaux Songes, exhibit moderate erosion susceptibility.
Mountainous areas and valley sides, comparable to the terrain at Arnaud, Monbois, Grand
Bassin and Trou aux Cerfs have very high levels of erosion susceptibility. The central
elevated plateau, the mountain environment and the southern and eastern regions also have
the highest soil risk (Nigel & Rughooputh, 2010). Additionally these regions also correspond
to the areas with the highest annual rainfall. However, the land cover in the mountainous
regions and valley sides provides some protection against soil erosion, especially due to the
existence of forests and other natural dense vegetation (Nigel, 2011).
Natural vegetation cover is also strongly influenced by orographic effects, which
promote high levels of variability in rainfall, and result in stark differences in natural
vegetation between the wet windward and the drier leeward sides of the island (Terry &
Wotling, 2011). The sparse shrub-like natural vegetation in conjunction with the extensive
sugarcane cultivation in the drier, leeward, west coast region could result in the soils here
being more vulnerable to erosion than in the central region of the island which has denser
© University of Pretoria

87
vegetation, known to cope with a higher rainfall intensity and therefore be more resistant to
erosion by direct rainfall (Le Roux, 2005).
On the contrary, the extensive sugarcane cultivation on the west coast could aid in
decreasing soil erosion, as the soil under the sugarcane is not disturbed during harvest and a
dense protective cover is provided within less than two months after regrowth or planting (Le
Roux et al., 2005). However, good land management is vital as the potential for soil erosion
increases substantially when the sugarcane’s canopy cover decreases during harvests
(Kremer, 2000). The importance of vegetation cover for reducing the erosion susceptibility of
soils is further emphasized by the high erosivity values and erosion susceptibility of the upper
catchment areas. These regions have erosivity values four to five times higher than coastal
areas and results in a much higher erosion risk, particularly on any poorly vegetated, steep
slopes (Le Roux, 2005) and vegetation therefore plays a critical role in reducing the erosion
susceptibility of the soils and erosion risk in the mountainous areas on the central plateau.
Daily, monthly or annual rainfall totals are used as an indication of rainfall erosivity in
all soil risk models and assessments on Mauritius (Kremer, 2000; Le Roux et al., 2005; Nigel
& Rughooputh, 2010a, b). But previous studies (Le Roux, 2005; Anderson, 2012; Mongwa,
2012) have shown that the erosive events generate a large amount of the erosivity and
therefore simply using the annual or monthly rainfall measurements could potentially
underestimate the erosion risk at an island scale. Therefore, in order to increase the
effectiveness of soil risk assessments in a tropical maritime environment, such as Mauritius,
the temporal time scale of the data used should be adjusted to adapt with the storm to
synoptic scale systems that dominate the risk for soil erosion (Mongwa, 2012).
There is general consensus that dramatic changes in the hydrological cycle stemming
from global climatic changes will cause more erosive events in the future (Nearing et al.,
2004). While this is an important consideration warranting further attention, the limited
duration (5 years) of the data used in this study prevented such long-term predictions
regarding the intra-storm attributes of erosive events from being undertaken. Findings from
Senapathi et al. (2010) do however indicate that rainfall frequency, at an island scale, is
expected to increase and subsequently alter the temporal distribution and intensity of the
rainfall and culminate in potentially increasing the erosivity of Mauritius (MMS, 2014a).
Future increases in rainfall intensity could therefore be associated with higher erosivity
values across all stations on the island (Anderson, 2012). Increased rainfall frequency and
erosivity is particularly relevant from a meteorological and an agricultural perspective, as
climate change will certainly have implications for the agricultural practices and ecological
systems in Mauritius (Senapathi et al., 2010). The effects of climate change on the intra-
© University of Pretoria

88
storm attributes of erosive rainfall on Mauritius should therefore be investigated in future
work as it potentially poses substantial changes to soil erosion risk. Soil erosion risk
assessments and modelling will become critical to understanding the current soil erosion
risks as well as future trends in establishing suitable and dynamic soil conservation
management plans and strategies.
Chapter 5 presented a discussion based on the results that were found in Chapter 4.
The importance of the geographic location of the stations and climatic zones of the
differences between the intra-storms attributes experienced in different regions was
addressed. Additionally, the orographic influence of the elevated central plateau on rainfall
and erosivity was highlighted. Seasonality of the erosive events and vegetation cover was
found to pose a substantial threat to soil erosion risk. The project concludes in the following
chapter by highlighting the most significant findings made during this study.
© University of Pretoria
89
Chapter 6 : Conclusion
The tropical volcanic island of Mauritius has a distinct elevated central plateau which
rises more than 550 m.a.s.l and interacts with the island’s predominantly tropical weather
systems and south-easterly trade winds (Fowdur et al., 2014; Staub et al., 2014). This study
made use of two weather stations on the west coast (Albion and Beaux Songes) and four
stations on the Central Plateau (Arnaud and Trou aux Cerfs on the leeward side, Monbois on
the windward side and Grand Bassin on the southern side) that provided high resolution
rainfall data which enabled the first intra-storm analysis on the island. Although previous
studies have been undertaken on storm kinetic energy, erosivity and soil erosion risk of
rainfall in Mauritius (Le Roux, 2005; Nigel & Rughooputh, 2010a, b; Nel et al., 2012; 2013),
very little is known regarding the intra-storm attributes and general climatology of rainfall
parameters in tropical island environments. This project therefore aimed to present findings
on the intra-storm attributes and climatological characteristics of erosive events at two
physiographic extremes on Mauritius: the west coast and the elevated central plateau. The
within-storm distribution of rainfall depth, extreme rainfall intensity, cumulative kinetic
energies and general climatological characteristics of the dry west coast were compared to
those of the higher altitude stations situated in the central region which received the highest
rainfall. A number of conclusions are presented on the intra-storm attributes of the erosive
events on a tropical island with an elevated central plateau:
6.1. Seasonality and spatial distribution of the erosive events
Rainfall seasonality on Mauritius is predominately owing to the migration of the Inter
Tropical Convergence Zone (ITCZ) (Fowdur et al., 2014), which results in noticeably higher
rainfall and more erosive events during the summer months when the ITCZ is closest to the
island (Fowdur et al., 2014; Staub et al., 2014). Although this study found that only a small
number of events occurred during the winter months, a large proportion of these have been
deemed erosive and were associated with non-tropical cyclonic events (Nel et al., 2012). The
events were, therefore, not restricted to tropical cyclones and this study has highlighted the
need to consider other weather systems such as frontal mesoscale rainfall from cold fronts
(MMS, 2008) which also posed substantial soil erosion risk.
Mauritius, like other tropical islands, shows noticeable spatial variation in rainfall
(Bender et al., 1985; Barcelo et al., 1997; Yen & Chen, 2000; Fowdur et al., 2006) which is
© University of Pretoria
90
also evident when considering the intra-storm characteristics of erosive events at the
automated weather stations across the island. This study found a noticeable increase in all
intra-storm variables measured at the coastal weather stations compared to those in the
interior. The amount of rainfall during events at the west coast stations (Albion and Beaux
Songes) was noticeably less compared to that of uplands stations (e.g. Arnaud, Monbois,
Grand Bassin and Trou aux Cerfs). Rainfall intensity and erosivity increased with elevation
and spatial differences in erosivity were related to the total number of erosive events along
with the frequency of these events at each station. Differences in erosivity between the coast
and the elevated interior are not only related to absolute rainfall depth, but also the nature of
the events.
6.2. Elevation and the erosive events
Elevation is a key factor influencing the intra-storm attributes of the erosive events on
Mauritius. This study confirmed findings from other studies which highlight the importance of
the elevated interior as a topographical feature primarily responsible for the high rainfall
gradient present across the island (Anderson, 2012; Mongwa, 2012; Nel et al., 2012).
Differences in the occurrence of erosive events across the island were documented by
Anderson (2012); Mongwa (2012); Nel et al. (2012) which reinforced the idea of a ‘rain-
shadow’ effect created by the interaction between the elevated central interior and the south-
easterly tradewinds with other local weather systems (Fowdur et al., 2014; Staub et al.,
2014). Definite regions were apparent across the island which displayed marked differences
in rainfall intensity, intra-storm attributes, erosivity and total kinetic content. The west coast
region experienced lower rainfall depth, intensity, erosivity and total kinetic content compared
to the elevated central plateau region. This again highlights the influence of the elevated
interior on the general rainfall characteristics of the events.
The analysis of intra-storm attributes revealed that the assumption of a positive
association between rainfall and altitude is inadequate, as mean rainfall depth and kinetic
energy content produced by the events measured during this study did not simply increase
with increasing altitude. Rainfall received from the events at the automated weather stations
indicated that rainfall increased with elevation up to a point and then decreases. This study
has demonstrated that the spatial distribution of rainfall amount, intensity and erosivity stems
from complex interactions between the elevation, geographic features (i.e. the remnants of
the shield volcano and central plateau) and microclimates of the landscapes surrounding the
© University of Pretoria

91
weather stations, and that simply considering the distance between automated weather
stations does not always lead to predictable differences in intra-storm attributes.
While the erosive events display variability in both rainfall depth and rainfall intensity,
similarities in the timing of the peaks are present. Peak rainfall depth almost always
corresponded to the peak rainfall intensities experienced, with the exception of Trou aux
Cerfs where the events tended to peak towards the end. Such behaviour could have an
increasing effect on peak runoff rates, potential soil loss and the overall erosivity of the
storms. Events generally showed high temporal variability as no event had a constant
intensity over time. The timing of the peak rainfall depth and peak intensities as well as the
individual event characteristics are all vital to consider and may perhaps have important
implications for the amount of soil loss and potential soil erosion experienced at any given
location on the island.
6.3. Potential erosion risk of the erosive events
Soil erosion risk on Mauritius varies seasonally (Le Roux, 2005; Nigel & Rughooputh,
2010b). The potential for soil erosion is greatest during the earliest part of the wet season
when the majority of the erosive events occur and vegetation cover does not yet provide
sufficient protection to the soil (Morgan, 2005; Nigel & Rughooputh, 2010b). Erosive rainfall
in combination with the amount, density and type of vegetation cover is therefore considered
to be responsible for determining the potential erosion risk over the entire island. Natural
vegetation on the western side of the island is sparse, shrub-like and grassy, which could
potentially make the soil more vulnerable to erosion from erosive rainfall. Conversely, areas
in the interior are considered less vulnerable to the effect of erosive rainfall, as natural
vegetation is denser and therefore provides greater protection to the soil during these erosive
events (Le Roux, 2005). However, the extensive sugarcane cultivation on the west coast
decreases potential soil erosion risk. Good land management is essential in this regard as
potential soil erosion increases greatly when the canopy cover of sugarcane decreases
during harvests (Kremer, 2000).
An area’s terrain and the erodibility of the soils greatly influence its erosion
susceptibility. Flat and undulating terrain, such as found at the west coast stations of Albion
and Beaux Songes, has a lower erosion susceptibility than mountainous areas and valley
sides, such as that around the stations on the elevated central plateau (Arnaud, Monbois,
Grand Bassin and Trou aux Cerfs). Despite the dense natural vegetation of the central
© University of Pretoria
92
plateau acting to protect the soils against erosion, this region is actually considered to be
most at risk. This is as a result of the steep terrain and soil type causing a high level of
erosion susceptibility in addition to the large amount of erosive rainfall and high rainfall
erosivity received (Nigel, 2011). The intra-storm distribution of rainfall in this area also
worsens the situation as the rainfall generated from the erosive events has the ability to
generate high peak runoff rates in the latter parts of the storms thereby enhancing the
amount of soil loss experienced.
Despite the longstanding recognition that the rainfall erosivity of an event is
influenced by the intra-storm distribution of rainfall intensity, such variables have only
recently been incorporated into soil-erosion modelling (Parsons & Stone, 2006). Daily,
monthly or annual rainfall totals are frequently used as an indication of rainfall erosivity in all
soil risk models and assessments on Mauritius (Kremer, 2000; Le Roux et al., 2005; Nigel &
Rughooputh, 2010a, b). But previous studies (Le Roux, 2005; Anderson, 2012; Mongwa,
2012) have shown that event scale rainfall generate a large amount of the erosivity
experienced and therefore simply using annual or monthly rainfall measurements may
underestimate the erosion risk at an island scale. Therefore, in order to increase the
effectiveness of soil risk assessments in tropical maritime environments, such as Mauritius,
the temporal scale of the data used should be adjusted to adapt with the storm (event scale)
to synoptic scale systems that dominate the risk for soil erosion (Mongwa, 2012). The
highest possible resolution of rainfall data should also be utilised to ensure more accurate
soil risk assessments and greatly assist Mauritian authorities in defining and prioritising key
areas for soil conservation measures, promote better land use management, agricultural
practices and conservation planning to maximise the limited land resources on the island.
Erosion risk models and assessments generally assume that erosive rain falls at a
constant intensity yet the intra-storm analysis of this study demonstrates that constant
intensity erosive events are non-existent on Mauritius and presumably not in any other
tropical island environment. This project has therefore shown that intra-storm rainfall
characteristics have important implications for soil erosion risk, especially in the elevated
central plateau of Mauritius, and that a certain complexity is evident regarding the
characteristics of the erosive events measured at specific stations.
6.4. Research needs and recommendations
Although the erosive events on Mauritius share common characteristics between
events and stations, the within-storm distribution indicated that no two events are identical
and no two stations show comparable rainfall event pattern distributions. However, the intra-
© University of Pretoria
93
storm analysis of the erosive events suggests despite the spatial differentiation in the
structure and nature of the erosive rainfall generalisations can be made regarding the
potential erosion experienced in the coastal and interior regions of the island. Furthermore,
the inclusion of more automated weather stations is warranted as this will provide a better
representation of rainfall characteristics across the island. Researchers are encouraged to
determine the possible erosional relationships between different event structures and
synoptic conditions on the island. Should more data become available at the sufficient
synoptic scale, it is suggested that erosive events with similar synoptic conditions are
grouped and the intra-storm attributes associated of each synoptic condition be established.
This will aid greatly in determining the potential erosional impact associated with each
synoptic condition relative to its intra-storm attributes and provide further the accuracy in
erosion risk assessments on the island of Mauritius. Lastly, the findings from this study are
directly applicable to the well-known and frequently applied (R)USLE model. However, the
results, specifically the within-storm distribution of rainfall depth, extreme rainfall intensity and
general climatological characteristics of the erosive events, found in this study also have the
potential to improve not only the future (R)USLE erosion models, but also other more
sophisticated non-(R)USLE modelling efforts, including modelling the sediment yield similar
the advanced event-based models described by van Rompaey et al. (2005) including the
WEPP (Nearing et al. 1989), LISEM (De Roo, 1996), EUROSEM (Morgan et al., 1998),
EROSION-3D (Schmidt et al., 1999). Spatially-distributed sediment delivery models that
assess the sediment yield usually have higher data demands, especially with regards to
rainfall and the description thereof to ensure the accurate estimations of sediment yield.
© University of Pretoria
94
References:
Alexandropoulos, C. & Lacombe, M., 2006: The laboratory rain gauges intercomparison: Results and
operation network applications. Accessed: 09/09/2013
http://www.wmo.int/pages/prog/www/IMOP/publications/IOM-94-
TECO2006/P3(10)_Alexandropoulos_France.pdf.
Arlidge, E.Z. & Wong You Cheong, Y., 1975: Notes on the land resources and agricultural suitability
map of Mauritius 1: 50,000. MSIRI Occasional Paper, 29, 1-137.
Anderson, R.L., 2012: Rainfall erosivity attributes on central and western Mauritius. Unpublished MSc
dissertation, University of Pretoria.
Angulo-Martínez, M. & Beguería. S., 2009: Estimating rainfall erosivity from daily precipitation
records: A comparison among methods using data from the Ebro Basin (NE Spain). Journal
of Hydrology, 379, 111-121.
Arnoldus, H.M.J., 1980: An approximation of the rainfall factor in the Universal Soil Loss Equation.
In M. De Boodt & D. Gabriels. (eds), Assessment of Erosion. England: John Wiley & Sons
Ltd, 127-132.
Atawoo, M.A. & Heerasing, J.M., 1997: Estimation of soil erodibility and erosivity of rainfall patterns in
Mauritius. In Lalouette, J.A., Bachraz, D.Y., Sukurdeep, N. & Seebaluck. B.D. (eds),
Proceedings of the second annual meeting of agricultural scientists, Réduit, Mauritius, 12-13
August 1997, Réduit. Mauritius Food and Agricultural Research Council, 219-223.
Barcelo, A., Robert, R. & Coudray, J., 1997: A major rainfall event: The 27 February-5 March 1993
rains on the south-eastern slope of Piton de la Fournaise Massif (Réunion Island, southwest
Indian Ocean). Monthly Weather Review, 125, 3341-3346.
Barstad, I. & Smith, R.B., 2004: A linear theory of orographic precipitation. Journal of the Atmospheric
Sciences, 61, 1377-1391.
Bergsma, E., Charman, P., Gibbons, F., Hurni, H., Moldenhauer, W.C. & Panichapong, S., 1996:
Terminology for soil erosion and conservation, International Society of Soil Science,
International Institute for Aerospace Survey and Earth Sciences, International Soil Reference
and Information Centre.
Bender, M. A., Tuleya, R.E. & Kurihara, Y., 1985: Numerical study of the effect of a mountain range
on a landfalling tropical cyclone. Monthly Weather Review, 113, 567-582.
Boardman, J. & Favis-Mortlock, D.T., 1993: Climate Change and soil erosion in Britain. The
Geographical Journal, 159, 179-183.
Boni, G., Parodi, A. & Rudari, R., 2004: Extreme rainfall events: Learning from rain gauge time series.
Journal of Hydrology, 327, 304-314.
Bonilla, C.A. & Vidal K.L., 2011: Rainfall erosivity in Central Chile. Journal of Hydrology, 410, 126-
133.
© University of Pretoria

95
Bookhagen, B. & Burbank, D.W., 2006: Topography, relief, and TRMM-derived rainfall variations
along the Himalaya. Geophysical Research Letters, 33, 1-5.
Brodie, I. & Rosewell, C., 2007: Theoretical relationships between rainfall intensity and kinetic energy
variants associated with stormwater particle washoff. Journal of Hydrology, 340, 40-47.
Brooks, S.M. & Spencer, T., 1995: Vegetation modification of rainfall characteristics: Implications for
rainfall erosivity following logging in Sabah, Malaysia. Journal of Tropical Science, 7, 435-446.
Calhoun, R.S. & Fletcher, C.H., 1996: Late Holocene coastal plain stratigraphy and sea-level
history at Hanalei, Kauai, Hawaiian Islands. Quaternary Research, 45, 47-58.
Chapman, P.J., 2005: Soil and the environment. In: Holden, J. (ed.), An Introduction to Physical
Geography and the Environment. Pearson Education Limited, Edinburgh Gate, 143-174.
Cooley, K.R. & Williams, J.R., 1985: Applicability of the universal soil loss equation USLE and the
modified USLE to Hawaii. In El-Swaify, S.A., Moldenhauer, W.C. & Lo, A. (eds), International
Conference on Soil Erosion and Conservation, ‘Malama Aina 83’. Soil Conservation Society
of America, University of Hawaii, Department of Agronomy and Soil Science, Honolulu, HI,
509-522.
Custodio, E., Diaz Arenas, A. & Falkland. A., 1991: Conditions for freshwater occurrence in small
island. In: Falkland, A. (ed.) Hydrology and Water Resources of Small Islands: A practical
guide. UNESCO, Paris, France, 10-43.
Dardis, G.F., Beckedahl, H.R., Bowyer-Bower, T.A.S. & Hanvey, P.M., 1988: Soil erosion forms in
Southern Africa, In Dardis G.F. & Moon, B.P. (eds), Geomorphological studies in southern
Africa. Balkema, Rotterdam, 187-213
Dairaku, K., Emori, S. & Oki,T., 2004: Rainfall amount, intensity, duration and frequency relationships
in the Mae Chaem Watershed in Southeast Asia. Journal of Hydrometeorology, 5, 458-470.
Dennett, M.D., 1978: Variations of rainfall and seasonal forecasting in Mauritius. Archiv Für
Meteorologie Geophysik und Bioklimatologie, 25, 359-370.
De Santos Loureiro, N. & de Azevedo Coutinho, M., 1995: Rainfall changes and rainfall erosivity
increase in the Algarve (Portugal). Catena, 24, 55-67.
De Santos Loureiro, N. & de Azevedo Coutinho, M., 2001: A new procedure to estimate the RUSLE
EI30 index, based on monthly rainfall data and applied to the Algarve region, Portugal. Journal
of Hydrology, 250, 12-18.
Dhurmea, K. R., Boojhawon, R. & Rughooputh, S.D.D.V., 2009: Geostatistical approaches for
estimating rainfall over Mauritius. Research Week, University of Mauritius, Réduit, Mauritius.
Retrieved from:
http://vcampus.uom.ac.mu/researchweek/conference2009/uploads/paper1049595.pdf.
Diodato, N., 2005: The influence of topographic co-variables on the spatial variability of precipitation
over small regions of complex terrain. International Journal of Climatology, 25, 351-363.
Diodato, N., & Bellocchi, G., 2007: Estimating monthly (R)USLE climate input in a Mediterranean
region using limited data. Journal of Hydrology, 345, 224-236.
© University of Pretoria

96
Diodato, N. & Bellocchi, G., 2010: MedREM, a rainfall erosivity model for the Mediterranean region.
Journal of Hydrology, 387, 119-127.
Dunkerley, D., 2008: Rain events properties in nature and in rainfall simulation experiments: A
comparative review with recommendations for increasingly systematic study and reporting.
Hydrological Processes, 22, 4415-4435.
Dunkerley, D., 2012: Effects of rainfall intensity fluctuations on infiltration and runoff: Rainfall
simulation on dryland soils, Fowlers Gap, Australia. Hydrological Processes, 26, 2211-2224.
Elwell, H.A., 1976: Natal Agricultural Research Bulletin No. 7, Soil Loss Estimator for Southern Africa.
Department of Agricultural Technical Services, Natal.
Elwell, H.A. & Stocking, M.A., 1973: Rainfall parameters for soil loss estimation in a subtropical
climate. Journal of Agricultural Engineering Research, 18, 169-177.
Erdogan, E.H., Erpul, G. & Bayramin, I., 2007: Use of USLE/GIS methodology for predicting soil loss
in a semi-arid agricultural watershed. Environmental Monitoring and Assessment, 131, 153-
161.
Flanagan, D.C. & Nearing, M.A., 1995: USDA water erosion predication project: Hillslope profile and
watershed model documentation. NSERL Report No. 10. USDA-ARS National Soil Erosion
Research Laboratory, West Lafayette, IN 47907-1194.
Fournier, F., 1960: Climat et erosion. Presses Universitaires de France, Paris.
Fowdur, S. C., Virasami, S., Cheeneenbash, J., Boojhawon, R. & Rughooputh, S.D.D.V., 2006:
Evidence for topography-enhanced precipitation over Mauritius. Proc. 21 Colloquium on
African Geology. Mozambique, Maputo, July, 2006.
Fowdur, S.C., Rughooputh, S.D.D.V., Cheeneebash, J., Boojhawon, R. & Gopaul, A., 2014: Rainfall
analysis over Mauritius using Principal Component Analysis. Environmental Management
and Sustainable Development, 3, 94-108.
Fornis, R.L., Vermeulen, H.R. & Nieuwenhuis, J.D., 2005: Kinetic energy-rainfall intensity relationship
for Central Cebu, Philippines for soil erosion studies. Journal of Hydrology, 300, 20-32.
Haynes. R.J., 1997: The concept of soil quality and its applicability to sugarcane production.
Proceedings of the South African Sugar Technologists Association, 71, 9-14.
Hoyos, N., Waylen, P.R. & Jaramillo, A., 2005: Seasonal and spatial patterns of erosivity in a tropical
watershed of the Colombian Andes. Journal of Hydrology, 314, 177-191.
Hudson, N.W., 1965: The influence of rainfall mechanics of soil erosion. MSc Thesis, University of
Cape Town, South Africa.
Hudson, N.W., 1971: Soil conservation. Batsford Ltd, London, pp 388
Huff, F.A., 1967: Time distribution of rainfall in heavy storms. Water Resources Research, 3, 1007-
1019.
Intergovernmental Panel on Climate Change (IPCC)., 2007: Summary for Policymakers. In: Parry,
M.L., Canziani, J.P., van Der Linden, P.J. & Hanson, C.E. (eds). Climate Change 2007:
Impacts, adaptation and vulnerability. Contribution of Working Group ‖ to the Fourth
© University of Pretoria
97
Assessment Report of the Intergovermental Panel on Climate Change. Cambridge (UK):
Cambridge University Press, 7-22.
Irvem, A., Topaloğlu, F. & Uygur, V., 2007: Estimating spatial distribution of soil loss over Seyhan
River Basin in Turkey. Journal of Hydrology, 336, 30-37.
Jackson, I.J., 1972: Mean daily rainfall intensity and number of rain days over Tanzania. Geografiska
Annaler Series A, Physical Geography, 54, 369-375.
Jayawardena, A.W. & Rezaur, R. B., 2000: Drop size distribution and kinetic energy load of
rainstorms in Hong Kong. Hydrological Processes, 14, 1069-1082.
Johansson, B. & Chen, D., 2003: The influence of wind and topography on precipitation distribution in
Sweden: Statistical analysis and modelling. International Journal of Climatology, 23, 1523-
1535.
Johnson, C.P., Sheth, H.C. & Ollier, C.D., 2010: Geological attractions for tourists in Mauritius.
Global Geotourism Perspectives. Goodfellow Publishers Limited, Woodeaton, Oxford.
Kinnell, P.I.A., 1981: Rainfall Intensity – Kinetic Energy relationship for soil loss prediction. Soil
Science Society of America Journal, 45, 153-155.
Kinnell, P.I.A., 2005: Raindrop-impact-induced erosion processes and prediction: A review.
Hydrological Processes, 19, 2815-2844.
Kremer, M., 2000. Aspekte der Bodenerosion in Mauritius- Analysis verschiedener einfluBfaktoren an
ausgewahten Standorten mit hilfe Geographischer Informations-systeme (GIS). Thesis
(Diplomarbeit). Philips University Marburg.
Lanza, L., Leroy, M., Alexandropoulos, C. & Wauben, W., 2005: WMO laboratory intercomparison of
rainfall intensity gauges, accessed 09/09/2013.
http://www.wmo.int/pages/prog/www/IMOP/reports/2003-2007/RI-IC_Final_Report.pdf
Lal, R., 1998: Soil erosion impact on agronomic productivity and environmental quality. Critical
Reviews in Plant Sciences, 17, 319-464.
Lal, R., 2001: Soil degradation by erosion. Land Degradation and Development, 12, 519-539.
Lal, M., Harasawa, H. & Takahashi, K., 2002: Future climate change and its impacts over small island
states. Climate Research, 19, 179-192.
Lal, R. & Elliot, W., 1994: Erodibility and erosivity. In Lal, R. (ed.), Soil Erosion Research Methods. St
Lucie Press, Delray Beach, Florida, 181-207.
Lee, J.H. & Heo, J.H., 2011: Evaluation of estimation methods for rainfall erosivity based on annual
precipitation in Korea. Journal of Hydrology, 409, 30-48.
Le Roux, J.J., 2005: Soil erosion prediction under changing land use on Mauritius. Unpublished MSc
dissertation, University of Pretoria.
Le Roux, J.J., Sumner, P.D. & Rughooputh, S.D.D.V., 2005: Erosion modelling and soil loss
prediction under changing land use for a catchment on Mauritius. South African Geographical
Journal, 87, 129-140.
© University of Pretoria
98
Lorence, D.H. & Sussman, R.W., 1986: Exotic species invasion into Mauritius wet forest remnants.
Journal of Tropical Ecology, 2, 147-162.
Mannaerts, C.M. & Gabriels, D., 2000: Rainfall erosivity in Cape Verde. Soil & Tillage Research, 55,
207-212.
Météo-France., 2015: Cyclone information for Reunion.
http://www.meteo.fr/temps/domtom/La_Reunion/TGPR/saison20042005B/
Mills, W.B. & Handock, K., 2005: Small island states in Indian and Atlantic Oceans: vulnerability to
climate change and strategies for adaption. Impacts of Global Climate Change, 1-12.
Retrieved from http://ascelibrary.org/doi/abs/10.1061/40792(173)507.
Mongwa, T., 2012: Rainfall intensity, kinetic energy and erosivity of individual rainfall events on the
island of Mauritius. Unpublished MSc, University of Fort Hare.
MMS (Mauritius Meteorological Service), 2008: Meteorological Services Monthly Bulletin of
Climatological Summaries. http://metservice.intnet.mu/publication.php
MMS (Mauritius Meteorological Service), 2014a: Meteorological Stations, Mauritius Meteorological
Service Website, Mauritius. http://metservice.intnet.mu/?page_id=644
MMS (Mauritius Meteorological Services), 2014b: Climate of Mauritius, Mauritius Meteorological
Service Website, Mauritius. http://metservice.intnet.mu/?page_id=644
MMS (Mauritius Meteorological Service), 2014c: List of Historical Cyclones, Mauritius Meteorological
Service Website, Mauritius. http://metservice.intnet.mu/?cat=28
MMS (Mauritius Meteorological Service), 2014d: Trajectories of historical cyclones, Mauritius
Meteorological Service Website, Mauritius.
http://metservice.intnet.mu/wp-content/uploads/2008/11/mru_cyclone_tracks.gif
Moore, T.R., 1979: Rainfall erosivity in East Africa. Geografiska Annaler, Series A, Physical
Geography, 61,147-156.
Morgan, R.P.C., 1995: Soil erosion and conservation, 2nd
edition. Longman Group Limited,
London.
Morgan, R.P.C., 2005: Soil erosion and conservation, 3rd
edition. Oxford. Blackwell Publishing.
Morgan, R.P.C., Quinton, J.N., Smith, R.E., Govers, G., Poesen, J.W.A., Auerswald, K. & Chisci, G.,
1998: The European Soil Erosion Model (EUROSEM): A dynamic approach for predicting
sediment transport from field and small catchments. Earth Surface Processes and Landforms,
23, 527-544.
Nearing, M.A., Lane, L.J., Alberts, E.E. & Laflen, J.M., 1990: Prediction technology for soil erosion by
water: Status and research needs. Soil Science Society of America Journal, 54, 1702-1711.
Nearing, M.A., 2001: Potential changes in rainfall erosivity in the U.S. with climate change during the
21st century. Journal of Soil and Water Conservation, 56, 229-232.
Nearing, M.A., Pruski, F.F. & O’Neal, M.R., 2004: Expected climate change impacts on soil erosion
rates: A review. Conservation Implications of Climate Change, 59, 43-50.
© University of Pretoria
99
Nel, W., 2007: Intra-storm attributes of extreme storm events in the Drakensberg, South Africa,
Physical Geography, 28, 158-169.
Nel, W. & Sumner, P.D., 2007: Intensity, energy and erosivity attributes of rainstorms in the
KwaZulu-Natal Drakensberg, South Africa. South African Journal of Science, 103, 398-402.
Nel, W., Reynhardt, D.A. & Sumner, P.D., 2010: Effect of altitude on erosive characteristics of
concurrent rainfall events in the northern KwaZulu-Natal Drakensberg. Water South Africa
(Short communication), 36, 509-512.
Nel, W., Mongwa, T., Sumner, P.D., Anderson, R.l., Dhurmea, K.R., Boodhoo, Y., Boojhawon, R. &
Rughooputh, S.D.D.V., 2012: The nature of erosive rainfall on a tropical volcanic island with
an elevated interior. Physical Geography, 33, 269-284.
Nel, W., Anderson, R. L., Sumner, P.D., Boojhawon, R., Rughooputh, S.D.D.V. & Dunputh, B.H.J.,
2013: Temporal sensitivity analysis of erosivity estimations in a high rainfall tropical island
environment. Geografiska Annaler: Series A, Physical Geography, 95, 337-343.
Newsome, D. & Johnson, C.P., 2013: Potential geotourism and the prospect of raising awareness
about geoheritage and environment on Mauritius. Geoheritage, 5, 1-9.
Ng Cheong, L.R., Ng Kee Kwong, K.F. & Du Preez, C.C., 2009: Effects of sugar cane (Saccharum
hybrid sp.) cropping on soil acidity and exchangeable base status in Mauritius. South African
Journal of Plant Soil, 26, 9-17.
Nicholson, S.E., 1996: A review of climate dynamics and climate variability in East Africa. In
Johnson T.C., Odada E.O. (eds), The limnology, climatology and paleo-climatology of the East
African Lakes. Amsterdam: Gordon and Breah Publishers.
Nigel, R., 2011: GIS mapping of soil erosion risk on Mauritius. Thesis (PhD.), University of Mauritius,
Mauritius.
Nigel, R. & Rughooputh, S.D.D.V., 2010a: Mapping of monthly soil erosion risk of Mauritius and its
aggregation with delineated basins. Geomorphology, 114, 101-114.
Nigel, R. & Rughooputh, S.D.D.V., 2010b: Soil erosion risk mapping with new datasets: An
improved identification and prioritisation of high erosion risk areas. Catena, 82, 191-205.
Nowbuth, M.D. & Daugnette, A., 2010: Assessing climate variability using extreme rainfall and
temperature indices. University of Mauritius Research Journal, 16, 196-206.
Nyssen, J., Vandenrey, H., Poesen, J., Moeyersons, J., Deckers, J., Haile, M., Salles, C. & Gover, G.,
2005: Rainfall erosivity and variability in the northern Ethiopian Highlands. Journal of
Hydrology, 311, 172-187.
Obi, M.E. & Salako, F.K., 1995: Rainfall parameters influencing erosivity in southeastern Nigeria.
Catena, 24, 275-287.
O’Neal, M.R., Nearing, M.A., Vining, R.C., Southworth, J. & Pfeifer, R. A., 2005: Climate change
impacts on soil erosion in Midwest United States with changes in crop management. Catena,
61, 165-184.
Onyando, J.O., Kisoyan, P. & Chemelil, M.C., 2005: Estimation of potential soil erosion for River
Perkerra Catchment in Kenya. Water Resources Management, 19, 133-143.
© University of Pretoria

100
Padya, B.M., 1989: The weather and climate of Mauritius. Moka, Mauritius, The Mahatma Ghandi
Institute Press, Réduit, Mauritius.
Page, M.J., Trustrum, N.A. & DeRose, R.C., 1994: A high resolution record of storm-induced erosion
from lake sediments, New Zealand. Journal of Paleolimnology, 11, 333-348.
Parish, D, H. & Feillafe, S.M., 1965: Notes on the 1:100 000 Soil Map of Mauritius. MSIRI Occasional
Paper, 22, 1-43.
Parker, D., 1999: Criteria for evaluating the condition of a Tropical Cyclone Warning System.
Disasters, 23, 193-216.
Parsons, A. J. & Stone, P.M., 2006: Effects of intra-storm variations in rainfall intensity on interrill
runoff and erosion. Catena, 67, 68-78.
Petan, S., Rusjan, S., Vidmar, A. & Mikoš, M., 2010: The rainfall kinetic energy-intensity relationship
for rainfall erosivity estimation in the Mediterranean part of Slovenia. Journal of Hydrology,
391, 314-321.
Proag, V., 1995: Geology and water resources of Mauritius. Mahatma Ghandi Institute, Moka, pp
938.
Proag, V., 2006: Water resources management in Mauritius. European Water, 15/16, 45-57.
Prudhomme, C. & Reed, D. W., 1998: Relationship between extreme daily precipitation and
topography in a mountainous region: A case study in Scotland. International Journal of
Climatology, 18, 1439-1453.
Renard, K. G. & Freimund, J. R., 1994: Using monthly precipitation data to estimate the R-factor in
the revised USLE. Journal of Hydrology, 157, 287-306.
Renard, K.G., Foster, G.R., Weesies, G.A., McCool, D.K. & Yoder D.C., 1997: Prediction of soil
erosion by water: A guide to conservation planning with the revised universal soil loss
equation (RUSLE). Agricultural Handbook 703, USDA, Washington, DC.
Renschler, C.S., Mannaerts, C. & Diekkrüger, B., 1999: Evaluating spatial and temporal variability in
soil erosion risk-rainfall erosivity and soil loss ratios in Andalusia, Spain. Catena, 34, 209-225.
Roe, G.H., 2005: Orographic precipitation. Annual Review of Earth and Planetary Science, 33, 645
-671.
Rose, C.W., 1960: Soil detachment caused by rainfall. Soil Science, 89, 28-35.
Rydgren, B., 1996: Soil erosion: Its measurements, effect, and prediction. Case study from the
southern Lesotho lowlands. Zeitschrift für Geomorphologie, 40, 429-445.
Rughooputh, S.D.D.V., 1997: Climate Change and Agriculture: Microclimatic considerations. AMAS
1997. Food and Agricultural Research Council, Réduit, Mauritius.
Siakeu, J. & Oguchi, T., 2000: Soil erosion analysis and modelling: A review. Transactions of the
Japanese Geomorphological Union, 21, 413-429.
Saddul, P., 1995: Mauritius- A Geomorphological Analysis. The Mahatma Ghandi Institute Press,
Mauritius.
Saddul, P., 2002: Atlas of Mauritius (2nd
Edition, Revised), Edition de l’Ocean Indien and George
Philips Ltd, Mauritius.
© University of Pretoria
101
Safford, R.J., 1997: A survey of the occurrence of native vegetation remnants on Mauritius in 1993.
Biological Conservation, 80, 181-188.
Salako, F.K., 2008: Rainfall variability and kinetic energy in Southern Nigeria. Climate Change, 86,
151-164.
Salako, F.K., Ghurman, B.S. & Lal, R., 1995: Rainfall erosivity in south-central Nigeria. Soil
Technology, 2, 279-290.
Salles, C., Poesen, J. & Sempere-Torres, D., 2002: Kinetic energy of rain and its functional
relationship with intensity. Journal of Hydrology, 257, 256-270.
Sanchez-Moreno, J. F., Mannaerts, C.H. & Jetten, V., 2014: Rainfall erosivity mapping for Santiago
Island, Cape Verde. Geoderma, 74-82.
Sauerborn, P., Klein, A., Botschek, J. & Skowronek, A., 1999: Future rainfall erosivity derived from
large-scale climate model-methods and scenarios for a humid region. Geoderma, 93, 269-
276.
Schiettecatte, W., D’hondt, L., Cornelis, W.M., Acosta, M.L., Leal, Z., Lauwers, N., Almoza, Y., Alonso,
G.R., Díaz, J., Ruíz, M. & Gabriels, D., 2008: Influence of landuse on soil erosion risk in the
Cuyaguateje watershed (Cuba). Catena, 74, 1-12.
Seeruttun, S., Ah Koon, D., Ismael, F.M. & Ng Cheong, R., 2007: Sugarcane reduces soil erosion by
more than 80% in five major soil groups of Mauritius. Proceedings of the 26th Congress of the
International Society of Sugar Cane Technologist (ISSCT), 29th July to 2
nd August.
International Convention Centre, Durban, South Africa, ISSCT, 384-387.
Senapathi, D., Underwood, F., Black, E., Nicoll, M.A.C. & Norris, K., 2010: Evidence for long-term
regional changes in precipitation on the East Coast Mountains in Mauritius. International
Journal of Climatology, 30, 1164-1177.
Shamshad, A., Azhari, M.N., Isa, M.H., Wan Hussin, W. M. A. & Parida, B.P., 2008: Development of
an appropriate procedure for estimation of RUSLE EI30 index and preparation of erosivity
maps for Pulau Penang in Peninsular Malaysia. Catena, 72, 423-432.
Smith, H.J., van Zyl, A.J., Claasens, A.S., Schoeman, J.L. & Laker, M.C., 2000: Soil loss modelling in
the Lesotho Highlands Water Project catchment areas. South African Geographical Journal,
82, 64-69.
Snyman, H.A., 1999: Soil erosion and conservation, In Tainton N.M. (ed.): Veld management in South
Africa. University of Natal Press, Scottsville, South Africa, 355-380.
Soobadar, A. & Kwong, K.F.R.N.K., 2012: Impact of high rates of Vinasse on some pertinent soil
characteristics and on sugarcane yield in Mauritius. Journal of Sustainable Agriculture, 36, 36-
53.
Staub, C.G., Stevens, F.R. & Waylen, P.R., 2014: The geography of rainfall in Mauritius: Modelling the
relationship between annual and monthly rainfall and landscape characteristics on a small
volcanic island. Applied Geography, 54, 222-234.
Stocking, M.A. & Elwell, H.A., 1976: Rainfall erosivity over Rhodesia. Institute of British Geographers
Transactions, 1, 231-245.
Sukhanovski, Y.P., Ollesch, G., Khan, K. Y. & Meiber, R., 2002: A new index for rainfall erosivity on a
physical basis. Journal of Plant Nutrition Soil Science, 165, 51-57.
© University of Pretoria
102
Terry, J.P. & Wotling, G., 2011: Rain-shadow hydrology: Influences on river flows and flood
magnitudes across the central massif divide of La Grande Terre Island, New Caledonia.
Journal of Hydrology, 404, 77-86.
Tobin, C., Nicotina, L., Parlange, M.B., Berne, A. & Rinaldo, A., 2011: Improved interpolation of
meteorological forcings for hydrologic application in a Swiss Alpine region. Journal of
Hydrology, 401, 77-89.
Torri, D., Regüés, D., Pellegrini, S. & Bazzoffi, P., 1999: Within-storm soil surface dynamics and
erosive effects of rainstorms. Catena, 38, 131-150.
Toy, T.J., Foster, G.R. & Renard, K.G., 2002: Soil erosion: Processes, predictions, measurement and
control. New York: Wiley.
Trustrum, T.N.A., Gomez. B., Page, M.J., Reid, L.M. & Hicks, D.M., 1999: Sediment production,
storage and output: The relative role of large magnitude events in steepland catchments.
Zeitschrift fur Geomorphology, 115, 71-86.
van Dijk, A.I.J.M., Bruijnzeel, L.A. & Rosewell, C.J., 2002: Rainfall intensity – kinetic energy
relationships: A critical literature appraisal. Journal of Hydrology, 261, 1-23.
van Dijk, A.I.J.M., Meesters, A.G.C.A., Schellenkens, J. & Bruijnzeel, L.A., 2005: A two-parameter
exponential rainfall depth-intensity distribution applied to runoff and erosion modelling.
Journal of Hydrology, 300, 155-171.
van Rompaey, A., Bazzoffi, P., Jones, R.J.A. & Montanarella, L., 2005: Modelling sediment yields in
Italian catchments. Geomorphology, 65, 157-169.
Wang, G., Gertner, G., Singh, V., Shinkareva, S., Parysow, P. & Anderson, A., 2002: Spatial and
temporal prediction and uncertainty of soil loss using the Revised Universal Soil Loss
Equation: A case study of the rainfall-runoff erosivity R factor. Ecological Modelling, 153, 143-
155.
Wang, L., Shi, Z.H., Wang, J., Fang, N.F., Wu, G.L. & Zhang, H.Y., 2014: Rainfall kinetic energy
controlling erosion processes and sediment sorting on steep hillslopes: A case study of clay
loam soil from the Loess Plateau, China. Journal of Hydrology, 512, 168-176.
Williame, P., 1984: Carte pedologique de l’ile Maurice. MSIRI Occasional Paper, 33, 1-19.
Wischmeier, W. H. & Smith, D.D., 1958: Rainfall energy and its relation to soil loss. Transaction of the
American Geophysical Union, 39, 285-291.
Wischmeier, W. H. & Smith, D.D., 1978: Predicting rainfall erosion losses: A guide to conservation
planning. Washington: USDA, Sciences and Education Administration, Agricultural Research,
Agriculture Handbook No. 537, 58.
Wotling, G., Bouvier, C., Danlous, J. & Fritsch, J. M., 2000: Regionalisation of extreme precipitation
distribution using the principle components of the topographical environment. Journal of
Hydrology, 233, 86-101.
WRU (Water Resources Unit., 2007: Hydrology Data Book for the Period 2000-2005. Water
Resources Unit, Rose-hill, Mauritius.
Xie, Y., Liu, B. & Nearing, M.A., 2002: Practical Thresholds for separating erosive and non-erosive
storms. American Society of Agricultural Engineers, 45, 1843-1847.
© University of Pretoria

103
Xue, J. & Gavin, K., 2008: Effect of rainfall intensity on infiltration into partly saturated slopes.
Geotechnical and Geological Engineering, 26, 199-209.
Yang, D., Kanae, S., Oki, T. & Musiake., 2003: Global potential soil erosion with reference to land use
and climate changes. Hydrological Processes, 17, 2913-2928.
Yen, M. & Chen, T., 2000: Seasonal variation of the rainfall over Taiwan. International Journal of
Climatology, 20, 803-809.
Yin, S., Xie, Y., Nearing, M.A. & Wang, C., 2007: Estimation of rainfall erosivity using 5- to 60-minute
fixed-interval rainfall data from China. Catena, 70, 306-312.
Yu, B., Cakurs, C. & Rose, C.W., 1998: An assessment of the methods for estimating runoff rates at
the plot scale. Transactions of the American Society of Agricultural and Biological Engineers,
41, 653-661.
Zhang, X.C., Norton, L.D. & Hickman, M., 1997: Rain pattern and soil moisture content effects on
Atrazine and Metolachlor losses in runoff. Journal of Environmental Quality, 26, 1539-1547.
Zhang, Y.G., Nearing, M.A., Zhang, C.X., Xie, Y. & Wei, H., 2010: Projected rainfall erosivity changes
under climate change from multimodel and multiscenario projections in Northeast China.
Journal of Hydrology, 384, 97-106.
© University of Pretoria