massachusetts general hospital annual report on equity...
TRANSCRIPT
Massachusetts General hospital
annual report on equity in health care quality 2015
MGH/MGPO Edward P. LawrEncE cEntEr fOr QuaLity and SafEtyElizabEth a. Mort, MD, MPh
SyrEnE rEilly, Mba
anDrEa t. tull, PhD
robErt J. Malin, Mha
MaSSacHuSEttS GEnEraL HOSPitaL diSParitiES SOLutiOnS cEntEr JoSEPh r. bEtancourt, MD, MPh
aSwita tan-McGrory, Mba, MSPh
KarEy S. KEnSt, MPh
acKnowlEDGEMEntS
The MGH/MGPO wishes to acknowledge and thank the following individuals for their contributions to the development of this report:
additional collaborators Bijay Acharya, MD, Quality & Safety Fellow, Center for Quality and Safety
Alexy Arauz-Boudreau, MD, Pediatric Medical Services (MGHfC)
Steven J. Atlas, MD, MPH, Primary Care, Department of Medicine
Miriam Bloomberg, Project Specialist, Department of Pediatrics
Stephen Buonopane, Senior Business Manager, Admitting & Registration
Jeffrey Ecker, MD, Department of Obstetrics and Gynecology
Peter T. Greenspan, MD, Pediatric Medical Services (MGHfC)
Wei He, MS, Senior Systems Analyst, General Medicine
Adriana Lopera, Research Assistant, Disparities Solutions Center
Andrea Madu, Research Assistant, Disparities Solutions Center
Allison Bryant Mantha, MD, MPH, Department of Obstetrics and Gynecology
Frank Melanson, Senior Manager of Market Research and Planning, Marketing
Jennifer Michaels, Project Coordinator, Center for Quality and Safety
Mariam Naqvi, MD, Clinical Research Fellow, Department of Obstetrics and Gynecology
Anabela Nunes, MBA, Director of Medical Interpreters, MGH Interpreter Services
Liza Nyeko, Program Manager, Center for Quality & Safety
Benjamin Orcutt, Director, Admitting & Registration
Joan Quinlan, MPA, Vice President for Community Health
Steele Valenzuela, Intern, Center for Quality & Safety
contents
1. ExEcutivE Summary . . . . . . . . . . . . . . . . . . . . . . . . . . . . . . . . . . . . . . . . . . . . . . . 1
2. DEmographic profilE of mgh patiEntS . . . . . . . . . . . . . . . . . . . . . . 5
3. nEw arEaS of Exploration: rEaDmiSSion . . . . . . . . . . . . . . . . . . 83.1 Background on Disparities in Readmission Rates . . . . . . . . . . . . . . . . . . . . . . . . . . . . . . . . . . . . . . . . . . 8
3.2 Summary of Analyses Conducted and Key Findings . . . . . . . . . . . . . . . . . . . . . . . . . . . . . . . . . . . . . . . . 9Readmission Rates by Race and Ethnicity . . . . . . . . . . . . . . . . . . . . . . . . . . . . . . . . . . . . . . . . . . . . . . . . . . . . 10Readmission Rates by Primary Language . . . . . . . . . . . . . . . . . . . . . . . . . . . . . . . . . . . . . . . . . . . . . . . . . . . . . 10Directions for Future Readmission Analysis . . . . . . . . . . . . . . . . . . . . . . . . . . . . . . . . . . . . . . . . . . . . . . . . . 12
4. improvEmEnt initiativES: patiEntS with limitED EngliSh proficiEncy . . . . . . . . . . . . . . . . . . . . . . . . . . . . . . . . . . . . . . . 134.1 Communicating with Our Patients . . . . . . . . . . . . . . . . . . . . . . . . . . . . . . . . . . . . . . . . . . . . . . . . . . . . . . . . . 134.2 Improving Care for Patients with Limited English Proficiency . . . . . . . . . . . . . . . . . . . . . . . . . . 14
5. DEpartmEnt-SpEcific Quality mEaSurES . . . . . . . . . . . . . . . . . . . .165.1 Obstetrics: Inpatient Measures . . . . . . . . . . . . . . . . . . . . . . . . . . . . . . . . . . . . . . . . . . . . . . . . . . . . . . . . . . . . . 16
Group B Streptococcus . . . . . . . . . . . . . . . . . . . . . . . . . . . . . . . . . . . . . . . . . . . . . . . . . . . . . . . . . . . . . . . . . . . . . . . . 16Early Elective Deliveries . . . . . . . . . . . . . . . . . . . . . . . . . . . . . . . . . . . . . . . . . . . . . . . . . . . . . . . . . . . . . . . . . . . . . . . 17NTSV Cesarean Deliveries . . . . . . . . . . . . . . . . . . . . . . . . . . . . . . . . . . . . . . . . . . . . . . . . . . . . . . . . . . . . . . . . . . . . 18
5.2 Pediatrics: Outpatient Pediatric Asthma Measures . . . . . . . . . . . . . . . . . . . . . . . . . . . . . . . . . . . . . . . 19
6. racial anD Ethnic DiSparitiES: StanDarD rEporting mEaSurES . . . . . . . . . . . . . . . . . . . . . . . . . . . . . . 226.1 Inpatient Clinical Quality Indicators . . . . . . . . . . . . . . . . . . . . . . . . . . . . . . . . . . . . . . . . . . . . . . . . . . . . . . . 22
National Hospital Quality Measures . . . . . . . . . . . . . . . . . . . . . . . . . . . . . . . . . . . . . . . . . . . . . . . . . . . . . . . . . . 22Influenza Vaccination . . . . . . . . . . . . . . . . . . . . . . . . . . . . . . . . . . . . . . . . . . . . . . . . . . . . . . . . . . . . . . . . . . . . . . . . . 24
6.2 Outpatient Clinical Quality Indicators . . . . . . . . . . . . . . . . . . . . . . . . . . . . . . . . . . . . . . . . . . . . . . . . . . . . . 25Linking Patients to Primary Care Physicians . . . . . . . . . . . . . . . . . . . . . . . . . . . . . . . . . . . . . . . . . . . . . . . . . 25HEDIS Measures by Linkage Category . . . . . . . . . . . . . . . . . . . . . . . . . . . . . . . . . . . . . . . . . . . . . . . . . . . . . . . 26
6.3 Patient Experiences of Care . . . . . . . . . . . . . . . . . . . . . . . . . . . . . . . . . . . . . . . . . . . . . . . . . . . . . . . . . . . . . . . . . 28Analysis of HCAHPS and C/G-CAHPS . . . . . . . . . . . . . . . . . . . . . . . . . . . . . . . . . . . . . . . . . . . . . . . . . . . . . . . 28Pediatric Patient Experience . . . . . . . . . . . . . . . . . . . . . . . . . . . . . . . . . . . . . . . . . . . . . . . . . . . . . . . . . . . . . . . . . . 31
rEfErEncES . . . . . . . . . . . . . . . . . . . . . . . . . . . . . . . . . . . . . . . . . . . . . . . . . . . . . . . . . . . 32
appEnDix a: mEthoDS anD Data collEction . . . . . . . . . . . . . . . . . . 35
appEnDix B: Data SourcES for 2015 rEport . . . . . . . . . . . . . . . . . . . 37

1MGH AnnuAl RepoRt on equity in HeAltH CARe quAlity 2015
1 executive summaryThis eighth edition of the MGH Annual Report on Equity in Health Care Quality (AREHQ) monitors quality of care by race, ethnicity, and language to identify disparities among racial and ethnic minorities and patients with limited English proficiency. It was developed in response to the Institute of Medicine (IOM) Report, Crossing the Quality Chasm, which identifies equity—the principle that quality of care should not vary by race, ethnicity, or gender—as one of six pillars of quality.1
Massachusetts General Hospital (MGH) has been responsive to the recommendations of the Chasm report, as well as another important IOM report entitled Unequal Treatment, which highlighted that minorities, even those with health insurance, often receive lower quality care than their white counterparts . Unequal Treatment defines disparities as “racial or ethnic differences in the quality of healthcare that are not due to access-related factors or clinical needs, preferences, and appropriateness of intervention .”2 In some cases, it can be challenging to tease out the root causes of differences identified in the data . For example, some differences may be due to variation in clinical appropriateness or cultural preference, while some may reflect a true disparity in
the quality of care provided due to structural factors, cultural competency of providers, communication barriers, and a host of other factors .
This report provides an analysis of key quality measures stratified by patient race, ethnicity, and language . It also identifies areas for quality improvement and reports on the progress of initiatives currently addressing disparities at MGH . The report includes standard process of care and patient experience measures required by the Joint Commission and Centers for Medicare/Medicaid Services, stratified by race, ethnicity, and primary language . White and English-speaking groups are used as the reference group for statistical analyses throughout the report .
2 MGH AnnuAl RepoRt on equity in HeAltH CARe quAlity 2015
Not only does this report allow us to measure the equity of the care provided, but given that it was the first of its kind in the nation, it establishes MGH as a national leader in monitoring and addressing disparities and promoting high quality care for all patients regardless of race, ethnicity, culture, socioeconomic status, or language proficiency . Several hospitals around the country have followed MGH’s efforts in this arena and have gained expertise through the Disparities Leadership Program to develop similar reports for their organizations . In 2014 MGH was selected out of 200 applicants nationwide to receive the American Hospital Association’s inaugural Equity of Care award for this work . MGH also received the Association of American Medical Colleges 2014 Learning Health System Challenge award for its equity and quality improvement efforts .
What’s NeW?
This year’s report includes a new focus on readmissions, a prominent measure of quality and efficiency . Reducing unnecessary readmissions is an important goal for MGH . This report explores opportunities for readmission reduction among patients with limited English proficiency (LEP), a vulnerable population particularly with regard to care transitions affecting the likelihood of readmission . Readmission rates were stratified by language, race, ethnicity, primary payer, and other factors with the goal of seeking out and addressing any disparities . Recommendations for further study in this area are included .
The report also includes new measures for Pediatrics and OB/GYN, two service lines where MGH sees a high proportion of minority patients . Working closely with clinicians and quality leaders in these departments, we examined areas where anecdotal evidence and/or evidence in the national literature suggest disparities exist for minority patients .
MGH is committed to sharing this important work and sharing data publicly . This report is shared on the Disparities Solutions Center and MGH Quality and Safety websites .
BackgrouNd: demographic profile of mgh patieNts
In calendar year 2014, as in previous years, the racial and ethnic composition of MGH’s patient population roughly mirrored the catchment area of Eastern Massachusetts .
A greater proportion of African American and Hispanic patients are seen in the Emergency Department, compared to inpatient services . There is also variation in the distribution among racial and ethnic minority patients within inpatient services .
Pediatrics, Obstetrics, and Burns have the highest proportion of patients belonging to racial and ethnic minority groups . Orthopedics, Urology, and Neurosurgery have the lowest proportion of minority patients .
MGH’s health centers (Chelsea, Charlestown, and Revere) and primary care locations see a large proportion of minority patients, compared to outpatient specialty care practices . Hispanic representation in the health centers is higher than any other area of the hospital system (25 .4% in health centers vs . 8% at MGH main campus and satellite practices) .
mghdisparitiessolutions.org/the-annual-report-on-equity-in-healthcare-quality/
qualityandsafety.massgeneral.org/measures/equitable.aspx?id=4
3MGH AnnuAl RepoRt on equity in HeAltH CARe quAlity 2015
highlights of fiNdiNgs
Readmissions
We found no evidence of a disparity in readmission rates between racial and ethnic minority groups and white patients .
We found no evidence of a disparity in overall readmission rates between patients with English as their primary language and patients speaking other languages .
Further analysis revealed that readmission rates were higher for patients with limited English proficiency age 65 or older compared with their English-speaking counterparts . Additionally, Asian patients with LEP had higher readmission rates compared with Asians with English as a primary language .
Further study to explore the effect of interpreter services, particularly in the discharge process, is recommended .
Obstetrics
No disparities were found between racial/ethnic and primary language groupings in the timing and selection of antibiotic for Cesarean Section or elective delivery between 37 and 39 weeks . There was evidence of a disparity in this area in the past, but that disparity was eliminated in 2013 and sustained over time .
We explored Cesarean Section rates for first time pregnancies and found MGH’s rates are generally lower than national averages . The racial/ethnic profile of patients having C-Sections is similar to the rest of the nation, with the highest rates among Black women, followed by white, Asian, and Hispanic women . The OB leadership will continue to raise awareness among our patients and providers about differences in Cesarean delivery rates and appropriate indications for Cesarean birth .
Pediatrics
No disparities were found by race or language for Influenza vaccination, use of controller medication, or total asthma action plan documentation for children with chronic asthma .
National Hospital Quality Measures (NHQM)
Rates of evidence-based inpatient clinical care, as measured by the NHQMs were equitable across racial and ethnic groups for all measures related to heart failure, heart attack, surgical care, and Influenza vaccination .
There were no disparities in clinical process of care by primary language for heart failure, heart attack, pneumonia, or Influenza vaccination .
There was evidence of a disparity among racial/ethnic minorities for antibiotic selection for pneumonia patients, as well as a disparity by language for selection of antibiotics for surgical patients . Case review suggests these findings were driven by failures of documentation rather than failures in providing the proper care to patients; therefore, the disparity in these rates reflected differences in documentation issues and not true differences in care delivery .
4 MGH AnnuAl RepoRt on equity in HeAltH CARe quAlity 2015
Inpatient Patient Experience: HCAHPS
African Americans reported significantly less positive experiences than non-Hispanic whites for 4 of 10 HCAHPS measures .
Asians reported significantly less positive experiences than non-Hispanic whites for 5 of 10 HCAHPS measures .
American Indians reported less positive experiences than non-Hispanic whites for 4 of 10 HCAHPS measures .
Outpatient Patient Experience: CG-CAHPS and Pediatric CG-CAHPS
Disparities were identified for almost all racial and ethnic minority groups for both outpatient C/G-CAHPS measures . All minority groups except for American Indians reported lower overall provider ratings . The scores for willingness to recommend were lower for Hispanic, Asian, and Other patients, compared to white patients .
Adult patients who indicated Spanish as their primary language provided significantly higher ratings for willingness to recommend their outpatient provider on CG-CAHPS surveys, an improvement from last year . However, scores on overall provider rating continue to be lower for Spanish-speaking patients compared to patients with English as their primary language .
Among Pediatric CG-CAHPS respondents, overall provider ratings improved for Black/African American patients, compared to the 2014 results . Yet, a new disparity is present, with Asian patients providing significantly lower ratings on both overall provider rating and willingness to recommend provider, compared to non-Hispanic white patients .
Outpatient Quality Indicators: Primary Care Linkage and HEDIS Measures
The gap between patients that are linked to a primary care physician and those who are not has decreased over time . We believe this linkage provides the opportunity for more continuity and coordination and therefore is an important marker of quality . Overall, only 4% of patients are not linked, and there is no significant gap between racial and ethnic groups .
No disparities were present among racial and ethnic minorities in the areas of diabetes care or coronary artery disease .
In contrast to the 2014 report, disparities were found in the areas of breast, cervical, and colorectal cancer screenings for Asian patients compared to white patients .
5MGH AnnuAl RepoRt on equity in HeAltH CARe quAlity 2015
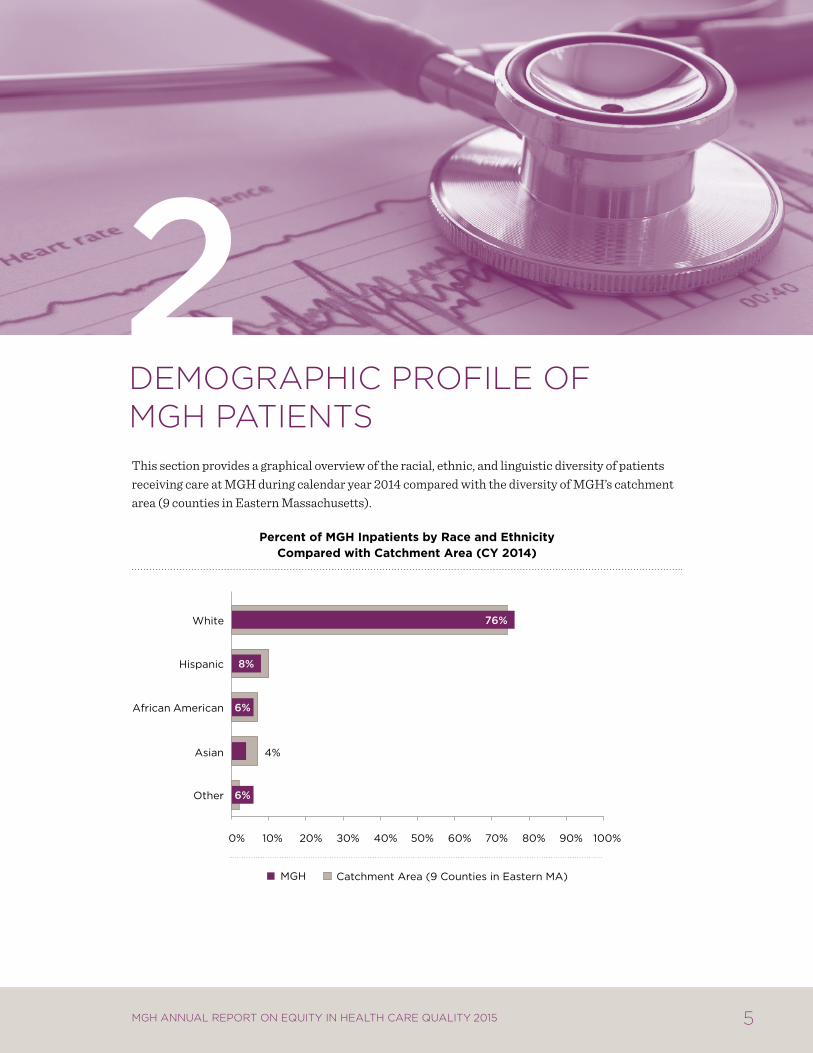
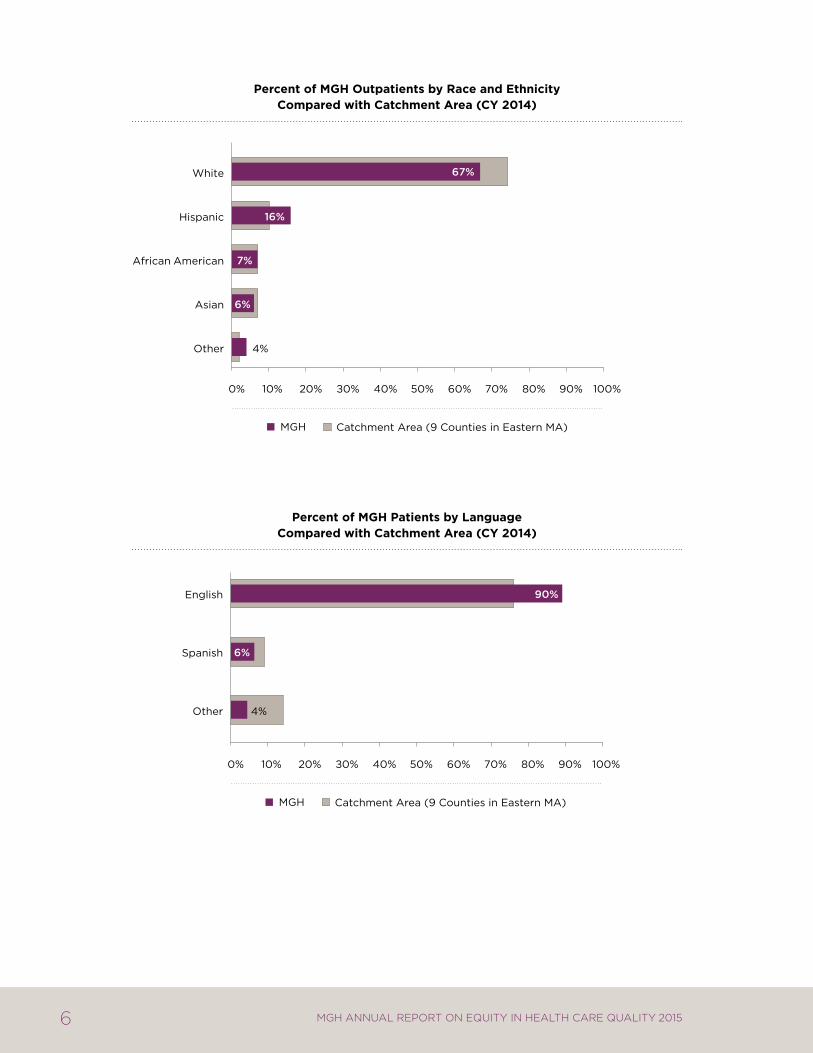
2 Demographic profile of mgh patientsThis section provides a graphical overview of the racial, ethnic, and linguistic diversity of patients receiving care at MGH during calendar year 2014 compared with the diversity of MGH’s catchment area (9 counties in Eastern Massachusetts) .
percent of mgh inpatients by race and ethnicity compared with catchment area (cY 2014)
Other
Asian
African American
Hispanic
White
MGH Catchment Area (9 Counties in Eastern MA)
6%
4%
6%
8%
76%
0% 10% 20% 30% 40% 50% 60% 70% 80% 90% 100%
6 MGH AnnuAl RepoRt on equity in HeAltH CARe quAlity 2015
percent of mgh outpatients by race and ethnicity compared with catchment area (cY 2014)
percent of mgh patients by language compared with catchment area (cY 2014)
4% Other
Asian
African American
Hispanic
White
MGH Catchment Area (9 Counties in Eastern MA)
0% 10% 20% 30% 40% 50% 60% 70% 80% 90% 100%
67%
6%
7%
16%
Other
Spanish
English
MGH Catchment Area (9 Counties in Eastern MA)
90%
4%
6%
0% 10% 20% 30% 40% 50% 60% 70% 80% 90% 100%
7MGH AnnuAl RepoRt on equity in HeAltH CARe quAlity 2015
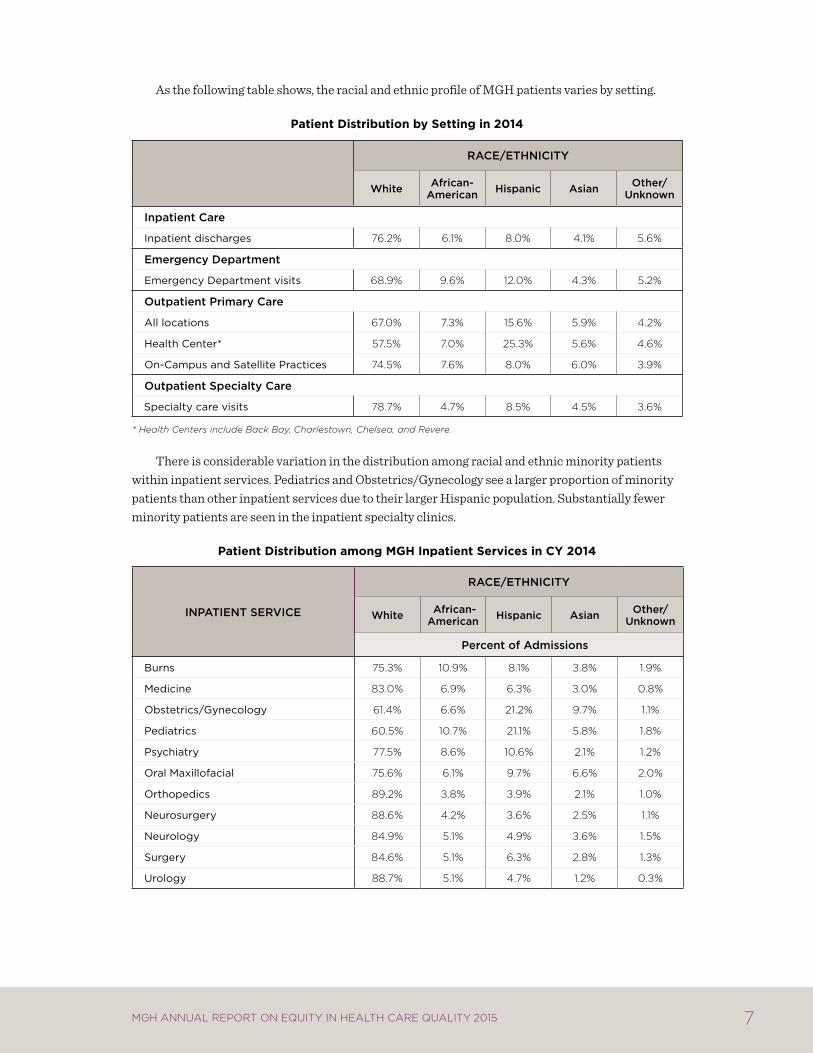
As the following table shows, the racial and ethnic profile of MGH patients varies by setting .
patient distribution by setting in 2014
Race/ethnicity
White african-american hispanic asian Other/
Unknown
inpatient care
inpatient discharges 76.2% 6.1% 8.0% 4.1% 5.6%
emergency Department
Emergency Department visits 68.9% 9.6% 12.0% 4.3% 5.2%
Outpatient Primary care
all locations 67.0% 7.3% 15.6% 5.9% 4.2%
health center* 57.5% 7.0% 25.3% 5.6% 4.6%
on-campus and Satellite practices 74.5% 7.6% 8.0% 6.0% 3.9%
Outpatient Specialty care
Specialty care visits 78.7% 4.7% 8.5% 4.5% 3.6%
* Health Centers include Back Bay, Charlestown, Chelsea, and Revere.
There is considerable variation in the distribution among racial and ethnic minority patients within inpatient services . Pediatrics and Obstetrics/Gynecology see a larger proportion of minority patients than other inpatient services due to their larger Hispanic population . Substantially fewer minority patients are seen in the inpatient specialty clinics .
patient distribution among mgh inpatient services in cY 2014
inPatient SeRvice
Race/ethnicity
White african- american hispanic asian Other/
Unknown
Percent of admissions
Burns 75.3% 10.9% 8.1% 3.8% 1.9%
medicine 83.0% 6.9% 6.3% 3.0% 0.8%
obstetrics/gynecology 61.4% 6.6% 21.2% 9.7% 1.1%
pediatrics 60.5% 10.7% 21.1% 5.8% 1.8%
psychiatry 77.5% 8.6% 10.6% 2.1% 1.2%
oral maxillofacial 75.6% 6.1% 9.7% 6.6% 2.0%
orthopedics 89.2% 3.8% 3.9% 2.1% 1.0%
neurosurgery 88.6% 4.2% 3.6% 2.5% 1.1%
neurology 84.9% 5.1% 4.9% 3.6% 1.5%
Surgery 84.6% 5.1% 6.3% 2.8% 1.3%
urology 88.7% 5.1% 4.7% 1.2% 0.3%

8 MGH AnnuAl RepoRt on equity in HeAltH CARe quAlity 2015
3 new areas of exploration: reaDmission
3.1 BackgrouNd oN disparities iN readmissioN rates
The national focus on maximizing the value of healthcare has led to conversations about improving outcomes for patients while simultaneously reducing the costs of care .3 Readmission rates, typically within thirty days of hospital discharge, are commonly used as measure of quality and efficiency . CMS and state payers have initiated financial penalties for providers with “excess” readmissions, and readmission rates for many common medical conditions and procedures are now publicly reported and incentivized through pay for performance programs . While some readmissions are preventable and may result from inadequate outpatient follow-up or the development of complications, clearly not all readmissions are avoidable . The challenge for hospitals nationwide is to put tailored plans in place for all patients when they leave the hospital so their recovery plan is safe and contingency plans are in place .
A readmission occurs when a patient returns to the hospital for a subsequent inpatient stay within 30 days of discharge from MGH .i Emergency Department visits or observation stays do not count as readmissions . Some planned readmissions are excluded (for example, chemotherapy, childbirth, radiation, dialysis, and some instances of follow-up care for heart attack and pneumonia patients) .ii This approach is consistent with how CMS and other payers define readmissions .
Reduction of preventable readmission rates is an MGH goal . Multiple efforts are underway across all departments to reduce unnecessary returns to the hospital, including improving the way we manage discharge transitions, calculating the risk of readmission for each individual patient and providing special attention to high risk patients, providing more specific and user-friendly discharge
i Readmission rates include returns to MGH (discharging hospital) only . ii Other exclusions to the readmission rate are: patients with a discharge status of deceased, left against
medical advice, transferred to another short term acute facility, transferred to a psychiatric hospital, transfer within the same hospital (for psychiatry, rehabilitation, or hospice) in the index admission .
9MGH AnnuAl RepoRt on equity in HeAltH CARe quAlity 2015
instructions to patients, and closely monitoring readmission rates within each department and service . MGH also engages interpreter services to support the communication needs of our patients at discharge . Despite these efforts, readmission rates have been relatively stable for several years between 12–12 .5% .
Patients who are readmitted tend to be the most medically complex and socioeconomically disadvantaged .4 Research has shown that hospitals serving vulnerable and minority populations are more likely than others to incur readmission penalties, in part because their patient population faces financial, social, cultural, and linguistic barriers that make them more likely to have problems after discharge, even if the hospital is trying to oversee their recuperations .4 As such, disparities in readmission rates for vulnerable populations may be driven by a more complex set of factors than disparities in the process of care measures explored in other sections of this report . Preventing avoidable readmissions requires assuring that patients have the social support needed to manage their condition and addressing the social determinants that put them at continued and repetitive risk for bouncing back to the hospital after their initial hospitalization .
3.2 summarY of aNalYses coNducted aNd keY fiNdiNgs
Given that communication of a discharge plan would appear to be a critical part of a safety discharge plan, we looked at patients with limited English proficiency (LEP) as a group to see if their readmission rates were higher than their English-speaking counterparts . We hypothesized that patients with LEP might have higher readmission rates, due to the complexities of care transitions and the potential for miscommunication, particularly when complicated discharge instructions or handoffs to other providers are involved .
We began with an analysis of the racial/ethnic differences in overall readmission rates, followed by differences in readmission rates between patients with a primary language of English versus patients with LEP . These analyses are exploratory . For this first phase we used only administrative data and looked only at univariate associations . There were a number of interesting patterns observed and in this report we focus our discussion on areas where we identified racial and ethnic disparities, that is, where readmission rates for non-white patients were higher than for their white counterparts . Further work is planned .
The diagrams on the next page provide a visual overview of the analyses we conducted .

10 MGH AnnuAl RepoRt on equity in HeAltH CARe quAlity 2015
data analysis process
Readmission Rates by Race and Ethnicity
We used three fiscal years of data from 2012–2014 to examine readmission rates by race/ethnicity and found no evidence of racial or ethnic disparities in overall readmission rates .
readmission rates by race/ethnicity
Race/ethnicity
White african- american hispanic asian all Other
n % n % n % n % n %
oct 2012–Sept 2014 108,721 12.6% 7,732 12.8% 9,618 10.8% 5,175 10.0% 8,320 8.9%
* Comparison is statistically significant at P<0.05 using CHI Square Test. Statistically significant scores are shown in bold italics.
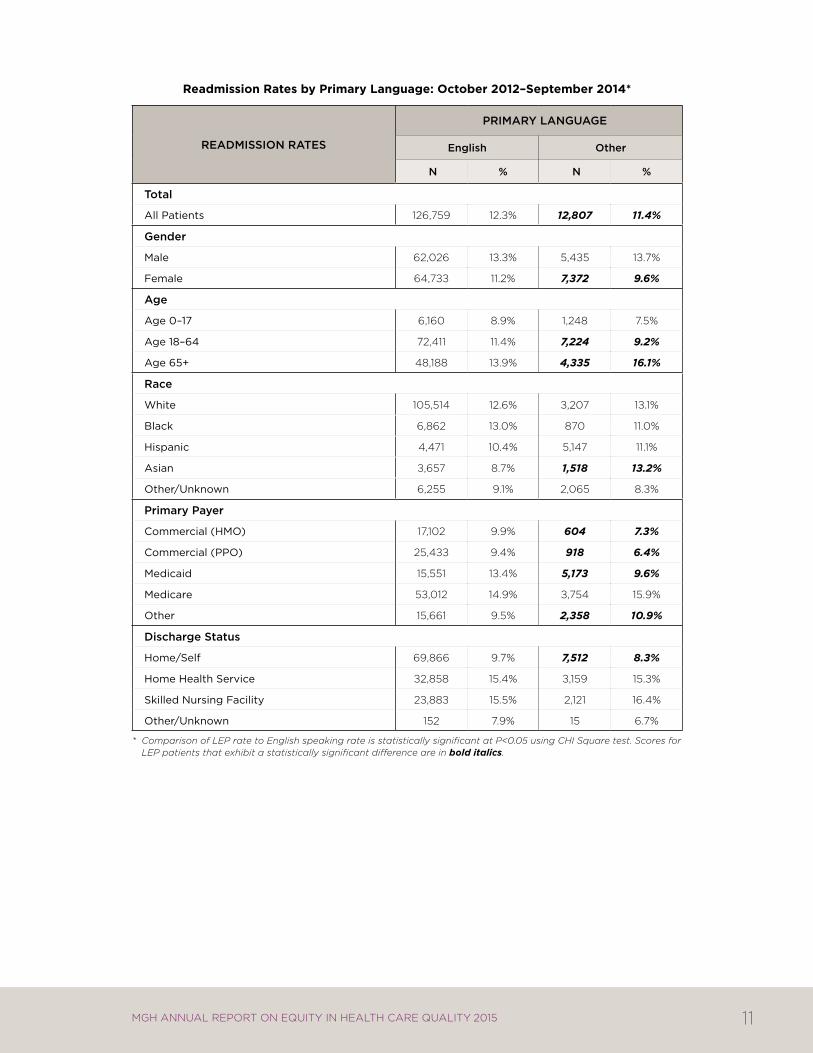
Readmission Rates by Primary Language
We then looked at readmission rates by primary language and found that patients with LEP had lower rates of readmission compared to patients who speak English (11 .4% vs .12 .3% respectively) . Further stratification of readmission rates by sociodemographic factors such as age, gender, and other factors revealed the following patterns of interest:
Readmission rates were statistically higher for patients with LEP age 65 or older compared with their English-speaking counterparts (16 .1% vs . 13 .9%) .
Asian patients with LEP had a readmission rate of 13 .2%, compared with 8 .7% for Asians with English as their primary language .
SteP 1:Readmission Rates by Race and ethnicity
White african-american hispanic asian all Other
englishOther Primary
Language
SteP 2:Readmission Rates by Primary Language
11MGH AnnuAl RepoRt on equity in HeAltH CARe quAlity 2015
readmission rates by primary language: october 2012–september 2014*
ReaDmiSSiOn RateS
PRimaRy LangUage
english Other
n % n %
total
all patients 126,759 12.3% 12,807 11.4%
gender
male 62,026 13.3% 5,435 13.7%
female 64,733 11.2% 7,372 9.6%
age
age 0–17 6,160 8.9% 1,248 7.5%
age 18–64 72,411 11.4% 7,224 9.2%
age 65+ 48,188 13.9% 4,335 16.1%
Race
white 105,514 12.6% 3,207 13.1%
Black 6,862 13.0% 870 11.0%
hispanic 4,471 10.4% 5,147 11.1%
asian 3,657 8.7% 1,518 13.2%
other/unknown 6,255 9.1% 2,065 8.3%
Primary Payer
commercial (hmo) 17,102 9.9% 604 7.3%
commercial (ppo) 25,433 9.4% 918 6.4%
medicaid 15,551 13.4% 5,173 9.6%
medicare 53,012 14.9% 3,754 15.9%
other 15,661 9.5% 2,358 10.9%
Discharge Status
home/Self 69,866 9.7% 7,512 8.3%
home health Service 32,858 15.4% 3,159 15.3%
Skilled nursing facility 23,883 15.5% 2,121 16.4%
other/unknown 152 7.9% 15 6.7%
* Comparison of LEP rate to English speaking rate is statistically significant at P<0.05 using CHI Square test. Scores for LEP patients that exhibit a statistically significant difference are in bold italics.
12 MGH AnnuAl RepoRt on equity in HeAltH CARe quAlity 2015
Directions for Future Readmission Analysis
These results offer several opportunities for future exploration and analysis of readmission rates among the non-English speaking population . The preliminary findings comparing the readmission rates by primary language suggest patients speaking other languages have lower readmission rates than English-speaking patients . Yet, further breakdown by demographic and clinical factors suggest there may be opportunities for improvement among non-English speaking elders and Asian patients . Given the limitations of administrative data, further review of clinical and socioeconomic factors and multivariate analysis, qualitative interviews, or focus groups may be helpful to better understand the complex issues driving readmission rates for these patients . Recent research in this area suggests the independent effect of language disappears after controlling for other factors, most notably socioeconomic status .5,6
One key question emerging from this analysis is whether patients with limited English proficiency have sufficient access to interpreter services, particularly during the discharge process . Future analyses linking the readmission data to interpreter services data could address questions about the mode and frequency of interpreter services during the inpatient stay and whether the use of interpreter services has a positive impact on reducing readmissions for non-English speaking patients . Furthermore, the interpreter services data are more granular with regard to language and would allow us to explore whether improvement opportunities exist by specific languages . In the future, it would be helpful to capture additional modes of interpretation, such as bilingual providers .
13MGH AnnuAl RepoRt on equity in HeAltH CARe quAlity 2015
4 improvement initiatives: patients with limiteD english proficiency
4.1 commuNicatiNg With our patieNts
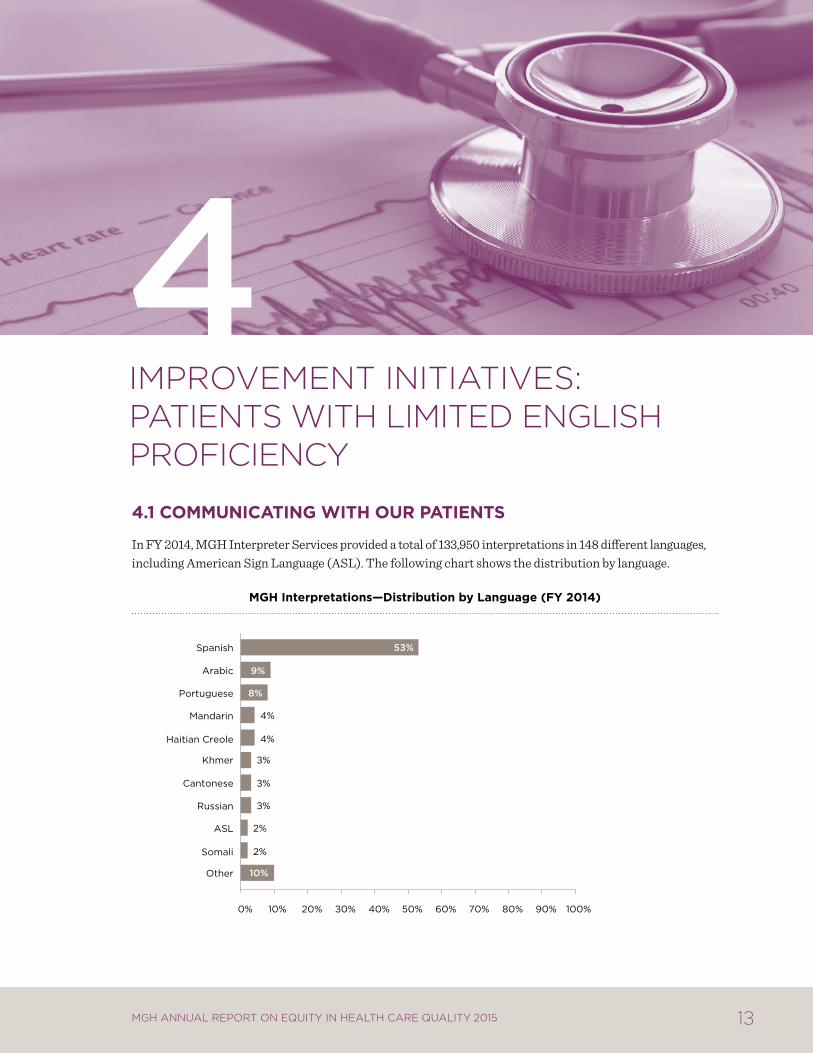
In FY 2014, MGH Interpreter Services provided a total of 133,950 interpretations in 148 different languages, including American Sign Language (ASL) . The following chart shows the distribution by language .
mgh interpretations—distribution by language (fY 2014)
2% Somali
10% Other
2% ASL
3% Russian
3% Cantonese
3% Khmer
4% Haitian Creole
4% Mandarin
8% Portuguese
9% Arabic
53% Spanish
0% 10% 20% 30% 40% 50% 60% 70% 80% 90% 100%
14 MGH AnnuAl RepoRt on equity in HeAltH CARe quAlity 2015
MGH provided a total of 53,471 face-to-face interpretations in 2014, along with 72,801 telephonic and 7,678 video interpretations . Telephonic and video interpretations saw increases in volume in the past year . Factors contributing to the increase include continued education of staff through in-services in individual clinical practices and inpatient units, as well as continued focus on improving access to professional interpreters .
4.2 improviNg care for patieNts With limited eNglish proficieNcY
The role of language barriers and their impact on adverse events is now receiving greater attention . Recent research suggests that adverse events that affect patients with LEP are more frequently caused by communication problems and more likely to result in serious harm, compared to English-speaking patients .7 Language barriers also lead to longer length of stay and higher readmission rates .8 To address this, the Joint Commission has developed a set of standards on patient-centered communication that emphasize the importance of language, cultural competence, and patient-centered care, and hospitals seeking accreditation were expected to comply with these recommendations as of 2012 .
As part of efforts to develop strategies and systems to prevent medical errors and address disparities between patients with LEP and English-speaking patients, the following initiatives are being undertaken:
training for mgh clinicians on Providing Safe care for Patients with LeP
The Disparities Solutions Center, in collaboration with the MGH Institute of Health Professions, has developed and pilot tested an interprofessional curriculum, Providing Safe, Effective Care for Patients with Limited English Proficiency . In 2014, the DSC pilot tested two 15-minute e-learning modules with physicians and midwives in the Department of Obstetrics . These modules address the evidence of disparities and high rate of medical errors for patients with LEP and provide training on concrete skills for working with professional interpreters as integral members of the care team . Ninety percent of OB physicians and midwives completed the program, with improvements in pre-post test scores, as well as high program ratings overall . Qualitative feedback indicated that the training led to positive changes in how providers interact and work with interpreters and patients with LEP . Success of the pilot led to the adoption of the e-learning program at MGH . The module on working with interpreters was rolled out as part of the MGPO’s mandatory annual training requirements for all MDs, PhDs, trainees, physician assistants, nurse practitioners, case managers, and ambulatory nurses, which started in the fall 2015 and will reach a total of 5,696 employees .
interpreter Rounds
Interpreter rounds continue to be conducted to complement hourly rounding on inpatient units . The objectives are to educate patients on the availability and benefit of working with professional medical interpreters in person, by telephone, or by video and to advocate for patients and providers to use the available language resources for safer and higher quality patient care . During rounds interpreters inform patients that interpreter services are available free of charge any time of day they need it . They also distribute language cards to patients to facilitate patients requesting interpreters or calling interpreter services when they need to contact their providers by telephone . Language cards were redesigned in 2015 to make it clear to patients how to reach an interpreter when they are outside the hospital . Direct language lines for the languages with the highest volume were created to
15MGH AnnuAl RepoRt on equity in HeAltH CARe quAlity 2015
enable patients to reach an interpreter directly . Interpreters also distribute Point-To-Talk booklets, a tool to help patients communicate simple needs to their clinicians . Interpreters also facilitate communication with the providers on the spot if the patient has questions and clinicians are available . Otherwise, they use the in-room white boards to write the patient’s question on the board for the medical team . Staff members on the clinical units have found this approach very helpful . During rounds interpreters also assess how patients’ language needs have been met . In most cases, patients who were rounded on by medical interpreters increased their usage of interpreter services .
executive Quality and Safety Rounds
The Director of Interpreter Services (DIS) accompanies the Center for Quality and Safety team and Senior Executive on an intermittent basis on Walk Rounds to various inpatient and ambulatory practice units . The rounds include targeted questions for staff on their concerns and questions regarding caring for patients with limited English proficiency . If a number of issues are raised, the DIS will return to the unit for follow-up education . One of the issues addressed with staff has been best practices when caring for patients with limited English proficiency, particularly the use of technology (IPOPs and VPOPs) vs . in-person interpreters .
16 MGH AnnuAl RepoRt on equity in HeAltH CARe quAlity 2015
5 Department-specific Quality measures
5.1 oBstetrics: iNpatieNt measures
Group B Streptococcus
Group B strep (GBS) is a bacterium that can cause life-threatening infections in newborns .9,10 Perinatal GBS infection is preventable with the administration of intrapartum antibiotics to women at risk of transmitting the bacterium their newborns, largely as determined by results of screening cultures .11 Studies have confirmed that Black infants have higher rates of early-onset GBS compared with white infants, and that Black women are more likely to carry GBS, a known risk factor for late-onset disease .12-19 Additionally, a 2002-2003 study in North Carolina found that Hispanic women receiving care at a hospital or health department clinic were less likely to receive prenatal screening for GBS .11 Another study in Northern California found that Black women were less likely to be screened, seemingly related to practice variation in an era before screening was the standard of care for GBS prevention .16
MGH data from 2009-2012 suggested a disparity in administration/documentation of appropriate intrapartum antibiotic prophylaxis for Group B streptococcus among eligible patients with limited English proficiency . Based on chart review analysis, the Department of Obstetrics and Gynecology found that the disparity was partially attributable to precipitous deliveries, defined as a labor that lasts no more than three hours from onset of regular contractions to delivery, as well as unscheduled Cesarean deliveries .
Following review of the cases in which appropriate intrapartum antibiotic prophylaxis was not delivered, the Department of Obstetrics and Gynecology reviewed protocols and patient scenarios to encourage appropriate antibiotic use, particularly in cases in which patients arrive to the hospital in later stages of labor or in need of unscheduled Cesarean deliveries . We continue to reinforce to providers the importance of encouraging women colonized with GBS to present early in labor . The disparity in appropriate antibiotic use by primary language is no longer apparent; some of this may
17MGH AnnuAl RepoRt on equity in HeAltH CARe quAlity 2015
be related to lower rates among English-speaking women during this time frame, but efforts to improve care quality for all women continue within the department .
As discussed previously, in 2014 the DSC worked with the Department of Obstetrics and Gynecology to pilot test the e-learning program, Providing Safe and Effective Care for Patients with Limited English Proficiency, with physicians and midwives . The training addressed the evidence of disparities in care for patients with LEP and skills for working with professional interpreters . Ninety percent of OB physicians and midwives completed the e-learning program, with improvements in pre-post test scores, as well as high program ratings overall . Although the disparity was eliminated prior to the implementation of this e-learning program, the program provided valuable insights into working effectively with professional interpreters and providing high-quality care to this vulnerable population . MGH rolled out the e-learning program hospital-wide in 2015 .
Early Elective Deliveries
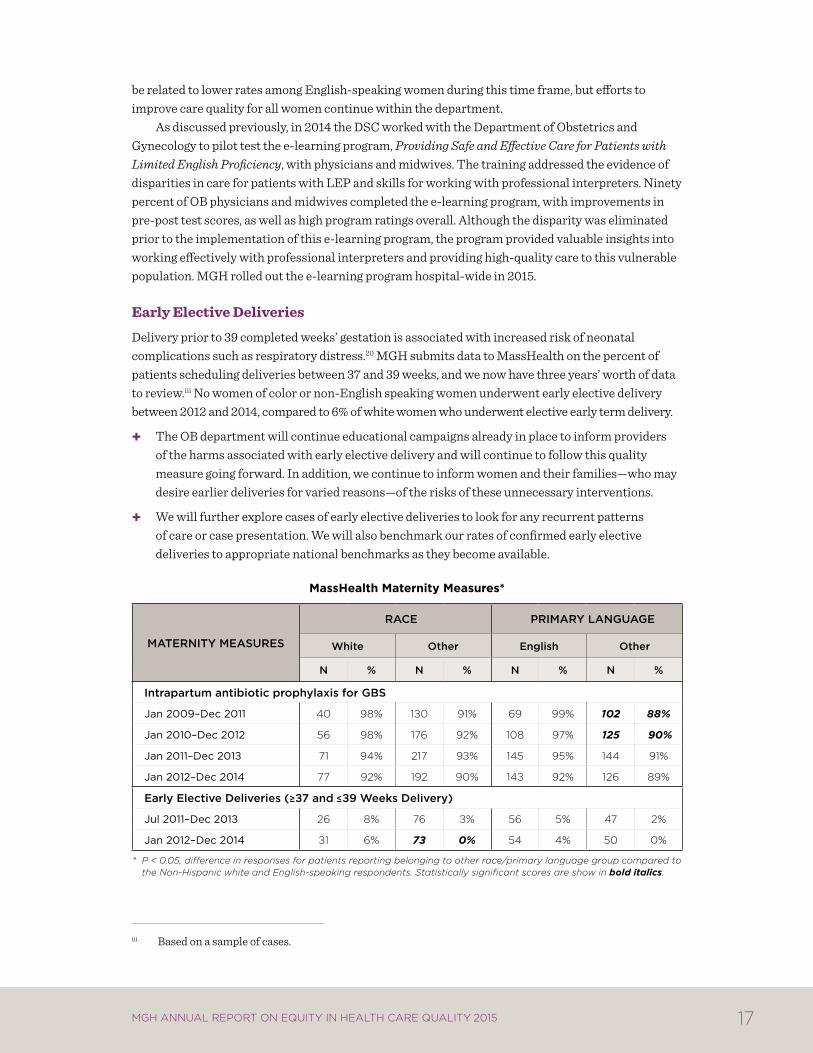
Delivery prior to 39 completed weeks’ gestation is associated with increased risk of neonatal complications such as respiratory distress .20 MGH submits data to MassHealth on the percent of patients scheduling deliveries between 37 and 39 weeks, and we now have three years’ worth of data to review .iii No women of color or non-English speaking women underwent early elective delivery between 2012 and 2014, compared to 6% of white women who underwent elective early term delivery .
The OB department will continue educational campaigns already in place to inform providers of the harms associated with early elective delivery and will continue to follow this quality measure going forward . In addition, we continue to inform women and their families—who may desire earlier deliveries for varied reasons—of the risks of these unnecessary interventions .
We will further explore cases of early elective deliveries to look for any recurrent patterns of care or case presentation . We will also benchmark our rates of confirmed early elective deliveries to appropriate national benchmarks as they become available .
masshealth maternity measures*
mateRnity meaSUReS
Race PRimaRy LangUage
White Other english Other
n % n % n % n %
intrapartum antibiotic prophylaxis for gBS
Jan 2009–Dec 2011 40 98% 130 91% 69 99% 102 88%
Jan 2010–Dec 2012 56 98% 176 92% 108 97% 125 90%
Jan 2011–Dec 2013 71 94% 217 93% 145 95% 144 91%
Jan 2012–Dec 2014 77 92% 192 90% 143 92% 126 89%
early elective Deliveries ( 37 and 39 Weeks Delivery)
Jul 2011–Dec 2013 26 8% 76 3% 56 5% 47 2%
Jan 2012–Dec 2014 31 6% 73 0% 54 4% 50 0%
* P < 0.05, difference in responses for patients reporting belonging to other race/primary language group compared to the Non-Hispanic white and English-speaking respondents. Statistically significant scores are show in bold italics.
iii Based on a sample of cases .
18 MGH AnnuAl RepoRt on equity in HeAltH CARe quAlity 2015
NTSV Cesarean Deliveries
The Cesarean delivery rate in the U .S . has been steadily rising over the last two decades, reaching its highest rate of 32 .9% in 2009 .21 These deliveries are associated with increased maternal morbidity, longer recovery period, and future pregnancy complications .
Approximately 60% of all Cesarean deliveries are first Cesarean deliveries . Nationally, fewer than one in 10 women with a prior Cesarean delivery will have a vaginal birth in a later pregnancy .22 For this reason, efforts to reduce the Cesarean delivery rate have focused on women who are at “low risk” to require a first Cesarean delivery, defined as nulliparous (first-time mothers) and term (greater or equal to 37 weeks) women carrying a singleton and vertex-presenting (head down) fetus, or NTSV . Since 2009, several national organizations have issued objectives to track Cesarean deliveries among women with NTSV pregnancies, including the U .S . Department of Health and Human services, the Joint Commission, and the American College of Obstetricians and Gynecologists .
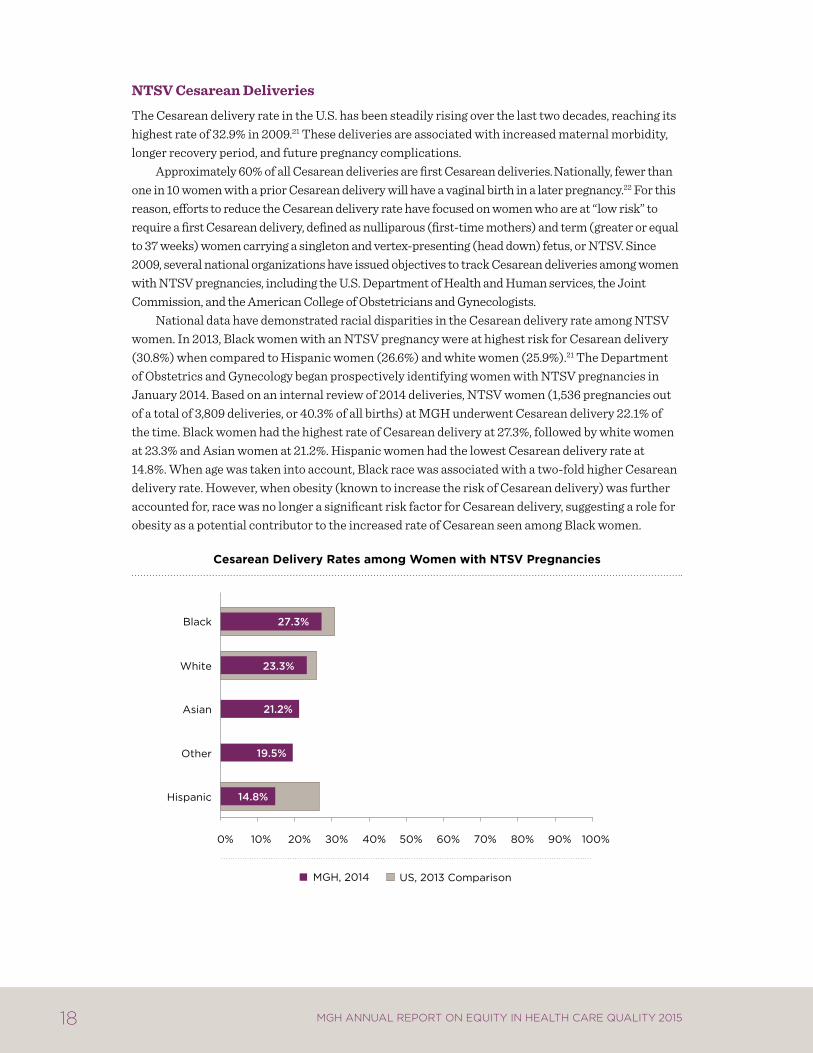
National data have demonstrated racial disparities in the Cesarean delivery rate among NTSV women . In 2013, Black women with an NTSV pregnancy were at highest risk for Cesarean delivery (30 .8%) when compared to Hispanic women (26 .6%) and white women (25 .9%) .21 The Department of Obstetrics and Gynecology began prospectively identifying women with NTSV pregnancies in January 2014 . Based on an internal review of 2014 deliveries, NTSV women (1,536 pregnancies out of a total of 3,809 deliveries, or 40 .3% of all births) at MGH underwent Cesarean delivery 22 .1% of the time . Black women had the highest rate of Cesarean delivery at 27 .3%, followed by white women at 23 .3% and Asian women at 21 .2% . Hispanic women had the lowest Cesarean delivery rate at 14 .8% . When age was taken into account, Black race was associated with a two-fold higher Cesarean delivery rate . However, when obesity (known to increase the risk of Cesarean delivery) was further accounted for, race was no longer a significant risk factor for Cesarean delivery, suggesting a role for obesity as a potential contributor to the increased rate of Cesarean seen among Black women .
cesarean delivery rates among Women with Ntsv pregnancies
14.8%
19.5%
21.2%
23.3%
27.3%
Hispanic
Other
Asian
White
Black
MGH, 2014 US, 2013 Comparison
0% 10% 20% 30% 40% 50% 60% 70% 80% 90% 100%
19MGH AnnuAl RepoRt on equity in HeAltH CARe quAlity 2015
The reasons low-risk women underwent Cesarean delivery seem to differ by race . A non-reassuring fetal heart tracing (NRFHT, sometimes called “fetal distress”) was the most common indication for a Cesarean delivery for Black and Hispanic women, whereas failure to progress in labor was the most common indication among white and Asian women . Black women had twice the risk of Cesarean delivery for NRFHT but again, when obesity was considered, the differences were minimized .
The Department of Obstetrics and Gynecology has identified the following potential next steps:
Continue to raise awareness among all of our patients and providers about existing disparities in Cesarean delivery rates and in indications for Cesarean birth (but so far we do not have clear evidence of inappropriate use in any one group) .
Further investigate root causes for the variation in indications for Cesarean delivery among racial and ethnic groups, keeping in mind that decision making regarding mode of delivery is often a process between patient and provider that is communication-sensitive .
Work toward improved access to preconception health care for women, including discussions of healthy weight and nutrition prior to pregnancy, recognizing obesity’s possible contribution to differences in Cesarean rates .
Continue to update our models every 12 months to follow trends in both Cesarean delivery rate and indications for Cesarean delivery over time as more data become available .
5.2 pediatrics: outpatieNt pediatric asthma measures
More than 7 million children in the U .S . have asthma,23 and asthma is a leading cause of school absenteeism among children and adolescents .24 Data from the CDC National Asthma Control Program indicate that 1 in 5 children with asthma visited an emergency room in 2009 .25 The data also indicate that Black children are twice as likely to have asthma as white children .25 Additionally, ED visit and hospitalization rates are more than three times higher for Black children and almost twice as high for Hispanic children compared to whites .26 Asthma is also more prevalent among those with family income below the federal poverty level .27
We studied data from the MGH Pediatric Asthma Registry, which tracks active chronic asthma patients ages 5-17 in six outpatient practices,iv to examine differences in key process of care measures for children with asthma . These measures include Influenza vaccination, use of controller medication, and documentation of a current asthma action plan . Use of controller medication refers to the prescription of a steroid inhaler and/or mast cell stabilizers . The asthma action plan is intended for any patient who meets the HEDISv criteria for a diagnosis of persistent asthma and consists of 5 sub-components, all of which must be documented in the plan to be in compliance with this measure . These include: an appointment for follow-up care; environmental control and control of other triggers; the method of timing of rescue actions; name, dose, frequency, and method of administration of prescribed controller medications; and name, dose, frequency, method of administration, and stepwise method of adjusting the dose and/or frequency of any prescribed
iv Outpatient practices include Charlestown, Chelsea, and Revere Health Centers, as well as Revere Health Center Med/Peds clinic, Mass General West, MGH Everett Family Care, and MGH Pediatric Group Practice .
v HEDIS stands for Healthcare Effectiveness Data and Information Set, a set of quality measures used by health plans to measure important aspects of care .
20 MGH AnnuAl RepoRt on equity in HeAltH CARe quAlity 2015
reliever medications based on severity of symptoms . The provider should review these plans annually (at a minimum) with the patient and document the updated plan in the medical record .
We worked with colleagues in the pediatric outpatient practices to identify the chronic asthma patients and then analyzed the data by race/ethnicity (White/Other) and primary language (English/Other) . The pediatric asthma measures are computed from information collected for active persistent asthma patients from a pre-defined, two-year reference period . An active persistent asthma patient is defined as follows:
Active Asthma Patient: The patient had at least two physician appointments in any of the pediatric practices at MGH with an ICD-9 diagnosis of Asthma
Persistent Asthma: In addition to being an active asthma patient, they had one of the following:
• At least four physician appointments with a primary diagnosis of asthma AND two medication dispensing events, OR
• One ED visit, OR
• One inpatient encounter, OR
• Four medication dispensing events .
The results provide a baseline for tracking future performance improvement . Although no disparities were detected, there is room for improvement in some measures .
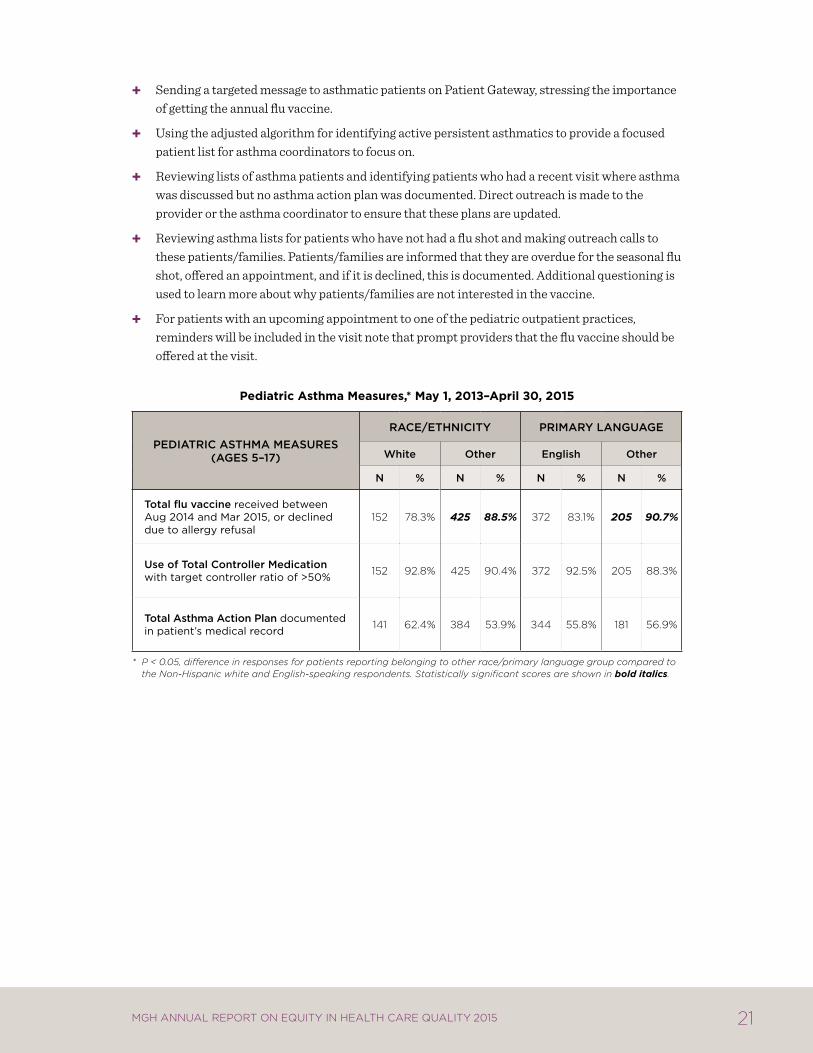
Analysis suggests non-white children with asthma were more likely to receive the Influenza vaccine compared to non-Hispanic whites . The same statistically significant finding is present for children speaking a primary language other than English . Overall, Influenza vaccination rates are robust, ranging from 78 .3% for white patients to 90 .7% for non-English speaking patients . Ideally, all children with chronic asthma would be vaccinated; therefore there is some room for improvement . The MGH practice with the largest number of asthmatics, which also serves the largest number of non-white children and children speaking a primary language other than English, has put in place an asthma coach, which may explain these differences in Influenza rates .
MGH is exceeding the target for use of controller medication, with no evidence of any disparities by race/ethnicity or primary language . The controller ratio of >50% is intended to maximize the number of patients who are filling their controller medication at least as often as they are filling their reliever . Performance is strong on this measure across all relevant populations .
Although there is no evidence of any disparities in the documentation of asthma action plans, compliance in the 50-60% range suggests room for improvement . MGH has implemented population health management strategies to improve care for these patients . This includes population health coordinators to work with staff and providers in the primary care practices to monitor and coordinate services for patients with asthma who are not meeting established metrics . In addition, we are currently updating our asthma registry capabilities to improve the tracking and reporting of our patients with asthma . We are also bringing together asthma coordinators at each practice on a quarterly basis to enhance their training and share best practices . Finally, both the population health coordinators and asthma coordinators are being encouraged to use quality improvement strategies to optimize the proactive management of patients with asthma . Some of the asthma specific strategies we have employed include:
21MGH AnnuAl RepoRt on equity in HeAltH CARe quAlity 2015
Sending a targeted message to asthmatic patients on Patient Gateway, stressing the importance of getting the annual flu vaccine .
Using the adjusted algorithm for identifying active persistent asthmatics to provide a focused patient list for asthma coordinators to focus on .
Reviewing lists of asthma patients and identifying patients who had a recent visit where asthma was discussed but no asthma action plan was documented . Direct outreach is made to the provider or the asthma coordinator to ensure that these plans are updated .
Reviewing asthma lists for patients who have not had a flu shot and making outreach calls to these patients/families . Patients/families are informed that they are overdue for the seasonal flu shot, offered an appointment, and if it is declined, this is documented . Additional questioning is used to learn more about why patients/families are not interested in the vaccine .
For patients with an upcoming appointment to one of the pediatric outpatient practices, reminders will be included in the visit note that prompt providers that the flu vaccine should be offered at the visit .
pediatric asthma measures,* may 1, 2013–april 30, 2015
PeDiatRic aSthma meaSUReS (ageS 5–17)
Race/ethnicity PRimaRy LangUage
White Other english Other
n % n % n % n %
total flu vaccine received between aug 2014 and mar 2015, or declined due to allergy refusal
152 78.3% 425 88.5% 372 83.1% 205 90.7%
Use of total controller medication with target controller ratio of >50% 152 92.8% 425 90.4% 372 92.5% 205 88.3%
total asthma action Plan documented in patient’s medical record 141 62.4% 384 53.9% 344 55.8% 181 56.9%
* P < 0.05, difference in responses for patients reporting belonging to other race/primary language group compared to the Non-Hispanic white and English-speaking respondents. Statistically significant scores are shown in bold italics.
22 MGH AnnuAl RepoRt on equity in HeAltH CARe quAlity 2015
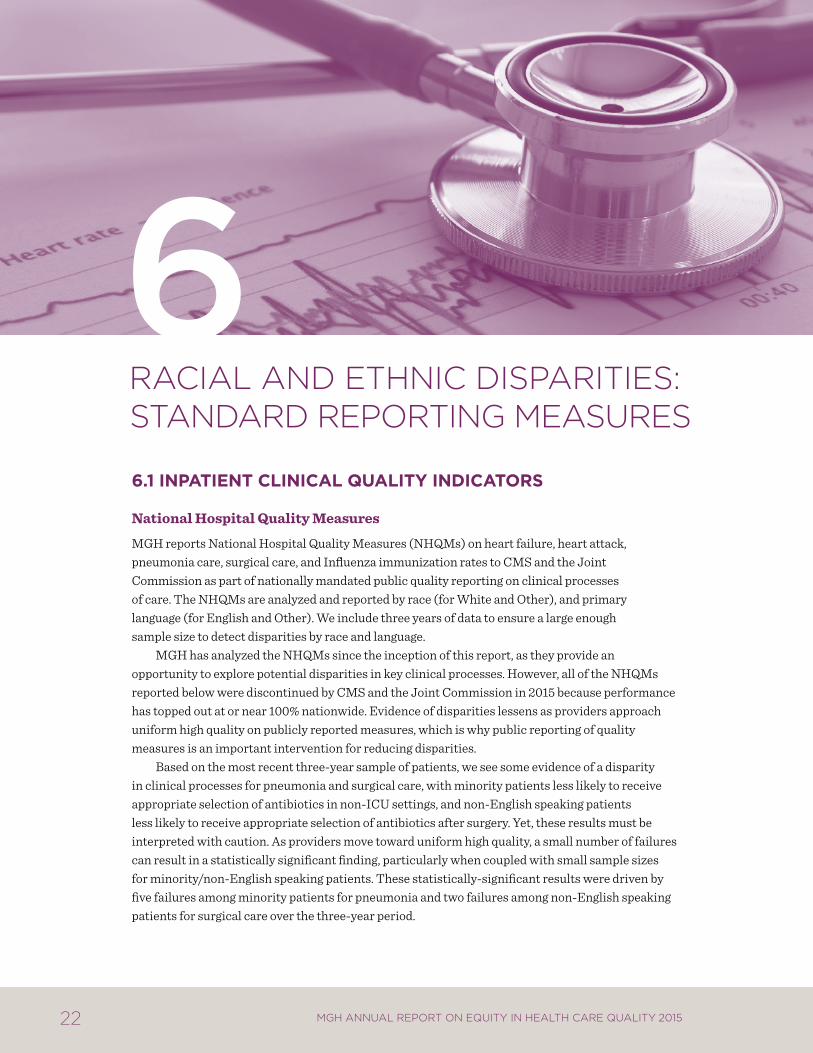
6 racial anD ethnic Disparities: stanDarD reporting measures
6.1 iNpatieNt cliNical QualitY iNdicators
National Hospital Quality Measures
MGH reports National Hospital Quality Measures (NHQMs) on heart failure, heart attack, pneumonia care, surgical care, and Influenza immunization rates to CMS and the Joint Commission as part of nationally mandated public quality reporting on clinical processes of care . The NHQMs are analyzed and reported by race (for White and Other), and primary language (for English and Other) . We include three years of data to ensure a large enough sample size to detect disparities by race and language .
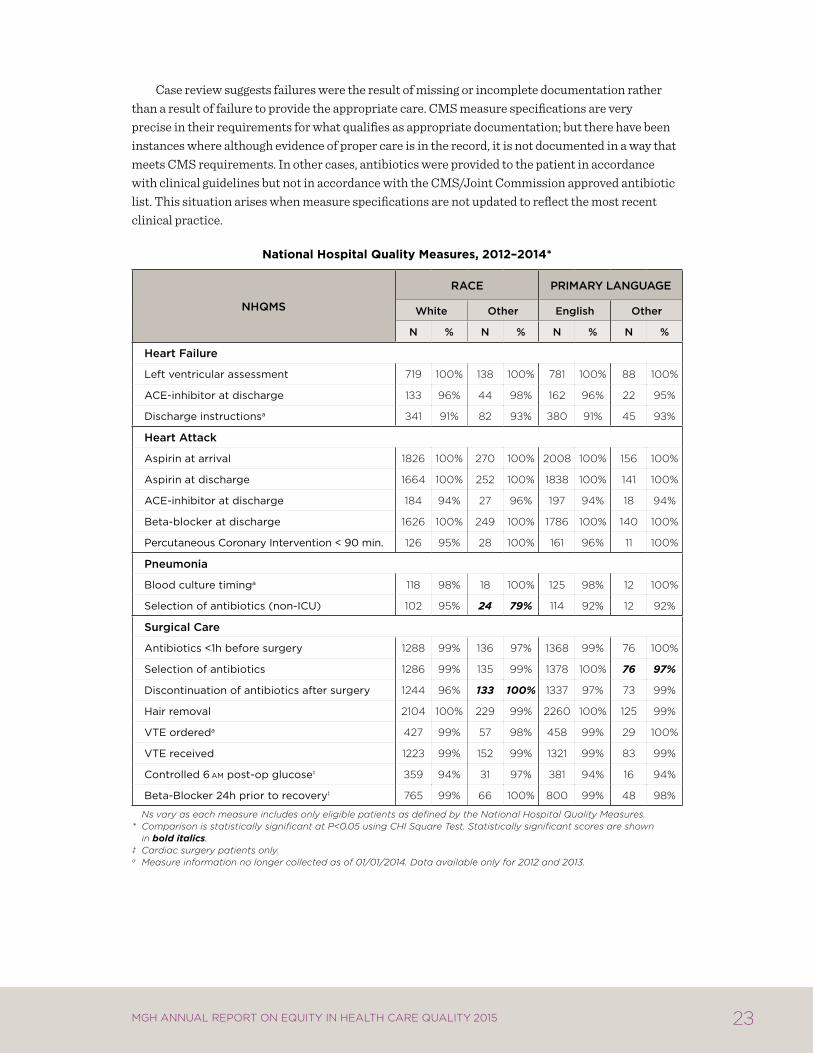
MGH has analyzed the NHQMs since the inception of this report, as they provide an opportunity to explore potential disparities in key clinical processes . However, all of the NHQMs reported below were discontinued by CMS and the Joint Commission in 2015 because performance has topped out at or near 100% nationwide . Evidence of disparities lessens as providers approach uniform high quality on publicly reported measures, which is why public reporting of quality measures is an important intervention for reducing disparities .
Based on the most recent three-year sample of patients, we see some evidence of a disparity in clinical processes for pneumonia and surgical care, with minority patients less likely to receive appropriate selection of antibiotics in non-ICU settings, and non-English speaking patients less likely to receive appropriate selection of antibiotics after surgery . Yet, these results must be interpreted with caution . As providers move toward uniform high quality, a small number of failures can result in a statistically significant finding, particularly when coupled with small sample sizes for minority/non-English speaking patients . These statistically-significant results were driven by five failures among minority patients for pneumonia and two failures among non-English speaking patients for surgical care over the three-year period .
23MGH AnnuAl RepoRt on equity in HeAltH CARe quAlity 2015
Case review suggests failures were the result of missing or incomplete documentation rather than a result of failure to provide the appropriate care . CMS measure specifications are very precise in their requirements for what qualifies as appropriate documentation; but there have been instances where although evidence of proper care is in the record, it is not documented in a way that meets CMS requirements . In other cases, antibiotics were provided to the patient in accordance with clinical guidelines but not in accordance with the CMS/Joint Commission approved antibiotic list . This situation arises when measure specifications are not updated to reflect the most recent clinical practice .
National hospital Quality measures, 2012–2014*
nhQmS
Race PRimaRy LangUage
White Other english Other
n % n % n % n %
heart Failure
left ventricular assessment 719 100% 138 100% 781 100% 88 100%
acE-inhibitor at discharge 133 96% 44 98% 162 96% 22 95%
Discharge instructionsa 341 91% 82 93% 380 91% 45 93%
heart attack
aspirin at arrival 1826 100% 270 100% 2008 100% 156 100%
aspirin at discharge 1664 100% 252 100% 1838 100% 141 100%
acE-inhibitor at discharge 184 94% 27 96% 197 94% 18 94%
Beta-blocker at discharge 1626 100% 249 100% 1786 100% 140 100%
percutaneous coronary intervention < 90 min. 126 95% 28 100% 161 96% 11 100%
Pneumonia
Blood culture timinga 118 98% 18 100% 125 98% 12 100%
Selection of antibiotics (non-icu) 102 95% 24 79% 114 92% 12 92%
Surgical care
antibiotics <1h before surgery 1288 99% 136 97% 1368 99% 76 100%
Selection of antibiotics 1286 99% 135 99% 1378 100% 76 97%
Discontinuation of antibiotics after surgery 1244 96% 133 100% 1337 97% 73 99%
hair removal 2104 100% 229 99% 2260 100% 125 99%
vtE ordereda 427 99% 57 98% 458 99% 29 100%
vtE received 1223 99% 152 99% 1321 99% 83 99%
controlled 6am post-op glucose‡ 359 94% 31 97% 381 94% 16 94%
Beta-Blocker 24h prior to recovery‡ 765 99% 66 100% 800 99% 48 98%
Ns vary as each measure includes only eligible patients as defined by the National Hospital Quality Measures. * Comparison is statistically significant at P<0.05 using CHI Square Test. Statistically significant scores are shown
in bold italics. ‡ Cardiac surgery patients only. a Measure information no longer collected as of 01/01/2014. Data available only for 2012 and 2013.
24 MGH AnnuAl RepoRt on equity in HeAltH CARe quAlity 2015
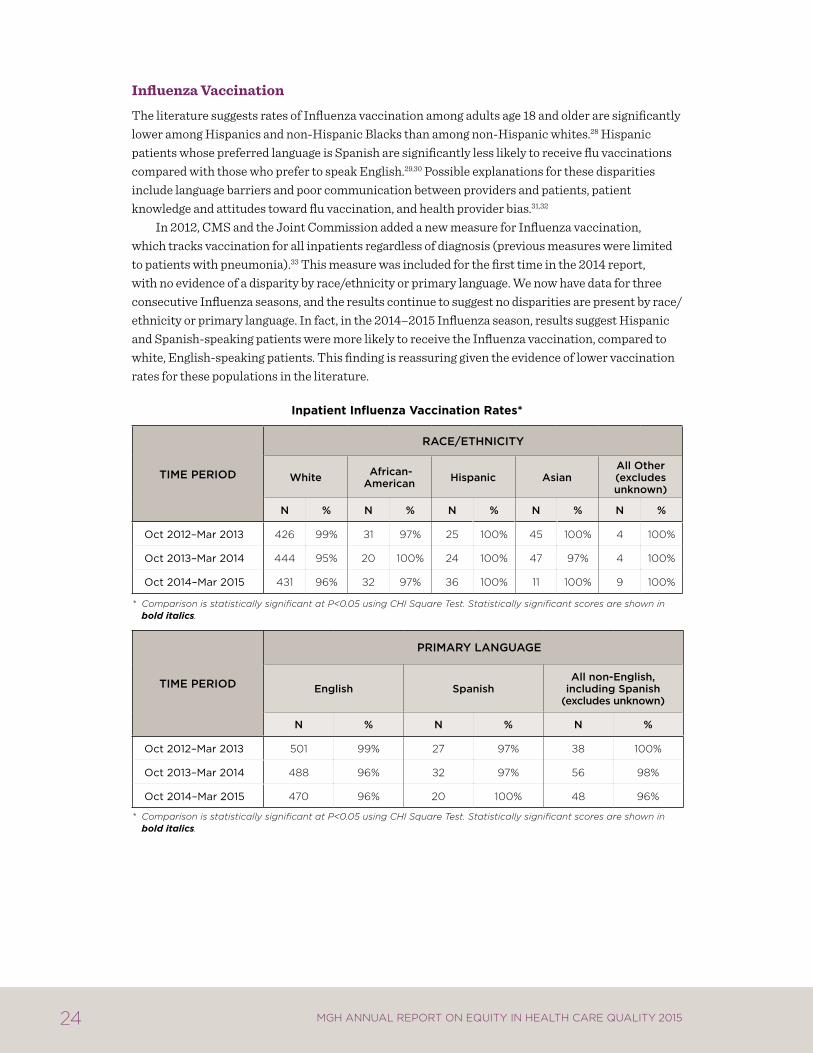
Influenza Vaccination
The literature suggests rates of Influenza vaccination among adults age 18 and older are significantly lower among Hispanics and non-Hispanic Blacks than among non-Hispanic whites .28 Hispanic patients whose preferred language is Spanish are significantly less likely to receive flu vaccinations compared with those who prefer to speak English .29,30 Possible explanations for these disparities include language barriers and poor communication between providers and patients, patient knowledge and attitudes toward flu vaccination, and health provider bias .31,32
In 2012, CMS and the Joint Commission added a new measure for Influenza vaccination, which tracks vaccination for all inpatients regardless of diagnosis (previous measures were limited to patients with pneumonia) .33 This measure was included for the first time in the 2014 report, with no evidence of a disparity by race/ethnicity or primary language . We now have data for three consecutive Influenza seasons, and the results continue to suggest no disparities are present by race/ethnicity or primary language . In fact, in the 2014–2015 Influenza season, results suggest Hispanic and Spanish-speaking patients were more likely to receive the Influenza vaccination, compared to white, English-speaking patients . This finding is reassuring given the evidence of lower vaccination rates for these populations in the literature .
inpatient influenza vaccination rates*
time PeRiOD
Race/ethnicity
White african-american hispanic asian
all Other (excludes unknown)
n % n % n % n % n %
oct 2012–mar 2013 426 99% 31 97% 25 100% 45 100% 4 100%
oct 2013–mar 2014 444 95% 20 100% 24 100% 47 97% 4 100%
oct 2014–mar 2015 431 96% 32 97% 36 100% 11 100% 9 100%
* Comparison is statistically significant at P<0.05 using CHI Square Test. Statistically significant scores are shown in bold italics.
time PeRiOD
PRimaRy LangUage
english Spanishall non-english,
including Spanish(excludes unknown)
n % n % n %
oct 2012–mar 2013 501 99% 27 97% 38 100%
oct 2013–mar 2014 488 96% 32 97% 56 98%
oct 2014–mar 2015 470 96% 20 100% 48 96%
* Comparison is statistically significant at P<0.05 using CHI Square Test. Statistically significant scores are shown in bold italics.
25MGH AnnuAl RepoRt on equity in HeAltH CARe quAlity 2015
6.2 outpatieNt cliNical QualitY iNdicators
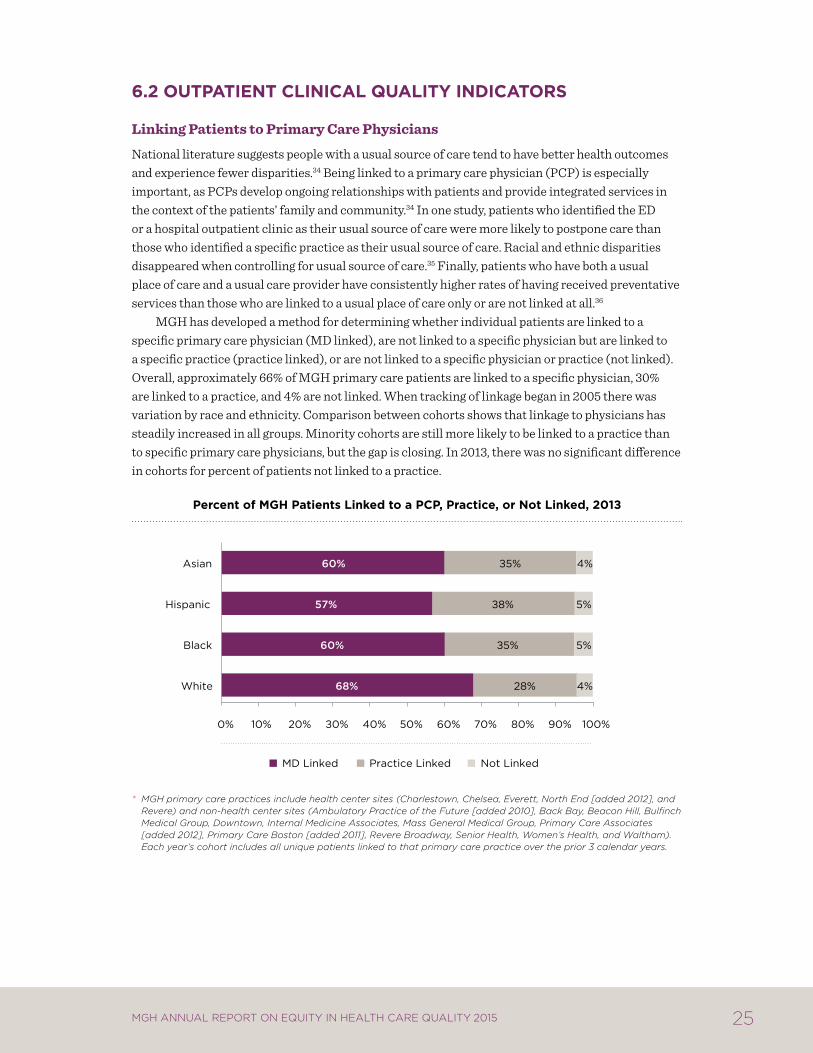
Linking Patients to Primary Care Physicians
National literature suggests people with a usual source of care tend to have better health outcomes and experience fewer disparities .34 Being linked to a primary care physician (PCP) is especially important, as PCPs develop ongoing relationships with patients and provide integrated services in the context of the patients’ family and community .34 In one study, patients who identified the ED or a hospital outpatient clinic as their usual source of care were more likely to postpone care than those who identified a specific practice as their usual source of care . Racial and ethnic disparities disappeared when controlling for usual source of care .35 Finally, patients who have both a usual place of care and a usual care provider have consistently higher rates of having received preventative services than those who are linked to a usual place of care only or are not linked at all .36
MGH has developed a method for determining whether individual patients are linked to a specific primary care physician (MD linked), are not linked to a specific physician but are linked to a specific practice (practice linked), or are not linked to a specific physician or practice (not linked) . Overall, approximately 66% of MGH primary care patients are linked to a specific physician, 30% are linked to a practice, and 4% are not linked . When tracking of linkage began in 2005 there was variation by race and ethnicity . Comparison between cohorts shows that linkage to physicians has steadily increased in all groups . Minority cohorts are still more likely to be linked to a practice than to specific primary care physicians, but the gap is closing . In 2013, there was no significant difference in cohorts for percent of patients not linked to a practice .
percent of mgh patients linked to a pcp, practice, or Not linked, 2013
* MGH primary care practices include health center sites (Charlestown, Chelsea, Everett, North End [added 2012], and Revere) and non-health center sites (Ambulatory Practice of the Future [added 2010], Back Bay, Beacon Hill, Bulfinch Medical Group, Downtown, Internal Medicine Associates, Mass General Medical Group, Primary Care Associates [added 2012], Primary Care Boston [added 2011], Revere Broadway, Senior Health, Women’s Health, and Waltham). Each year’s cohort includes all unique patients linked to that primary care practice over the prior 3 calendar years.
68%
60%
57%
60%
28%
35%
38%
35%
4%
5%
5%
4%
0% 10% 20% 30% 40% 50% 60% 70% 80% 90% 100%
White
Black
Hispanic
Asian
MD Linked Practice Linked Not Linked
26 MGH AnnuAl RepoRt on equity in HeAltH CARe quAlity 2015
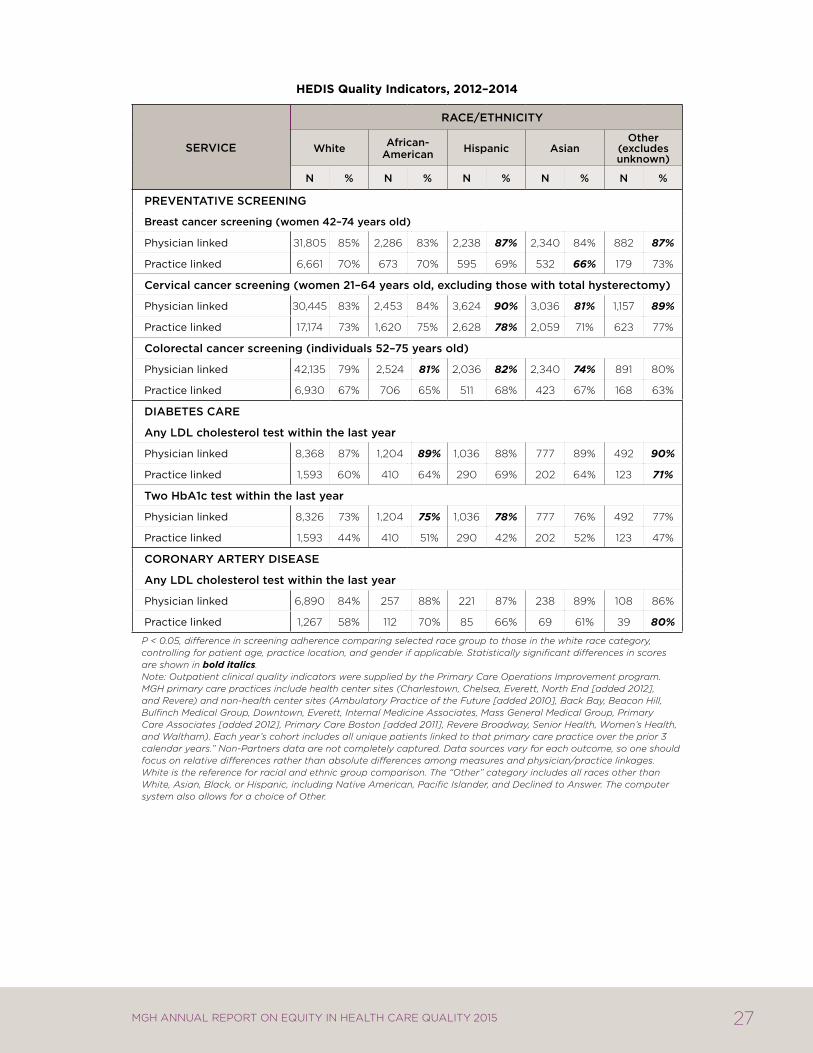
HEDIS Measures by Linkage Category
The outpatient clinical quality indicators show performance measures based on HEDIS (Healthcare Effectiveness Data and Information Set) standards for patients seen between 2012 and 2014 . As in other sections of the report, results are based on comparison of racial and ethnic minority groups to the white reference group . For nearly all comparisons, adherence rates were higher for patients linked to a physician compared to patients linked to a practice . These findings indicate an opportunity to evaluate the practice-specific model to identify opportunities for performance improvement . While there are differences in adherence rates for each measure by race, patterns are not consistent across measures, and the results are not adjusted for clinical severity .
Racial and ethnic disparities were found at MGH in three out of six measures analyzed (breast, cervical, and colorectal cancer screening):
Breast and cervical cancer screening rates were lower for Asians, compared to whites . Hispanics and patients identifying as Other race had higher screening rates for these measures .
Asians also had lower screening rates for colorectal cancer, while Hispanics and African American patients had higher screening rates .
No disparities were evident in diabetes care or coronary artery disease . In fact, African Americans had higher screening rates for both measures of diabetes care, compared to whites . Diabetic patients identifying as Other race also had higher rates of LDL cholesterol screening compared to whites . Patients with coronary artery disease identifying as Other race had higher rates of LDL testing compared to whites .
Disparities in cancer screening rates for Asians are reflected in the national literature . According to the 2013 National Health Interview Survey, overall screening rates were 72 .4% for breast cancer, 80 .8% for cervical cancer, and 58 .6% for colorectal cancer . The screening rates for breast, cervical, and colorectal cancer were lower for Asian Americans than for white Americans (50 .3% vs . 52 .1% for breast cancer, 70 .6% vs . 82 .8% for cervical cancer, and 53 .2% vs . 60 .5% for colorectal cancer) .38 Research has shown that foreign birth and limited English proficiency may be associated with lower screening rates among Asian Americans .39,40,41 Additionally cultural beliefs (modesty, shame, and fatalism) and structural barriers to care (lack of insurance and distance to healthcare services) may negatively impact cancer screening rates among Asian American immigrants .38,41
Efforts to improve quality of care measures for all MGH patients, including racial and ethnic minorities, include a population health program targeting chronic disease management and cancer prevention . This program specifically addresses gaps in care between patients with well-established ties to a primary care physician and those whose care is more sporadic and is only linked to a practice rather than a specific physician . Many of these “practice-linked” patients have socioeconomic and other barriers to accessing care that are being addressed through efforts that move care outside of the office visit . Moreover, these population health efforts are also working to coordinate with patient navigator programs that are focused on MGH community health centers and target those individuals who have language or cultural barriers to care .
27MGH AnnuAl RepoRt on equity in HeAltH CARe quAlity 2015
hedis Quality indicators, 2012–2014
SeRvice
Race/ethnicity
White african- american hispanic asian
Other (excludes unknown)
n % n % n % n % n %
PReventative ScReening
Breast cancer screening (women 42–74 years old)
physician linked 31,805 85% 2,286 83% 2,238 87% 2,340 84% 882 87%
practice linked 6,661 70% 673 70% 595 69% 532 66% 179 73%
cervical cancer screening (women 21–64 years old, excluding those with total hysterectomy)
physician linked 30,445 83% 2,453 84% 3,624 90% 3,036 81% 1,157 89%
practice linked 17,174 73% 1,620 75% 2,628 78% 2,059 71% 623 77%
colorectal cancer screening (individuals 52–75 years old)
physician linked 42,135 79% 2,524 81% 2,036 82% 2,340 74% 891 80%
practice linked 6,930 67% 706 65% 511 68% 423 67% 168 63%
DiaBeteS caRe
any LDL cholesterol test within the last year
physician linked 8,368 87% 1,204 89% 1,036 88% 777 89% 492 90%
practice linked 1,593 60% 410 64% 290 69% 202 64% 123 71%
two hba1c test within the last year
physician linked 8,326 73% 1,204 75% 1,036 78% 777 76% 492 77%
practice linked 1,593 44% 410 51% 290 42% 202 52% 123 47%
cOROnaRy aRteRy DiSeaSe
any LDL cholesterol test within the last year
physician linked 6,890 84% 257 88% 221 87% 238 89% 108 86%
practice linked 1,267 58% 112 70% 85 66% 69 61% 39 80%
P < 0.05, difference in screening adherence comparing selected race group to those in the white race category, controlling for patient age, practice location, and gender if applicable. Statistically significant differences in scores are shown in bold italics.
Note: Outpatient clinical quality indicators were supplied by the Primary Care Operations Improvement program. MGH primary care practices include health center sites (Charlestown, Chelsea, Everett, North End [added 2012], and Revere) and non-health center sites (Ambulatory Practice of the Future [added 2010], Back Bay, Beacon Hill, Bulfinch Medical Group, Downtown, Everett, Internal Medicine Associates, Mass General Medical Group, Primary Care Associates [added 2012], Primary Care Boston [added 2011], Revere Broadway, Senior Health, Women’s Health, and Waltham). Each year’s cohort includes all unique patients linked to that primary care practice over the prior 3 calendar years.” Non-Partners data are not completely captured. Data sources vary for each outcome, so one should focus on relative differences rather than absolute differences among measures and physician/practice linkages. White is the reference for racial and ethnic group comparison. The “Other” category includes all races other than White, Asian, Black, or Hispanic, including Native American, Pacific Islander, and Declined to Answer. The computer system also allows for a choice of Other.
28 MGH AnnuAl RepoRt on equity in HeAltH CARe quAlity 2015
6.3 patieNt experieNces of care
Analysis of HCAHPS and C/G-CAHPS
MGH has been collecting patient experience data through the inpatient HCAHPS survey since 2007 and the ambulatory C/G-CAHPS survey since 2008 . Surveys are administered in English and Spanish . This 2015 report reflects January 2012 through December 2014 data . Results are presented as the percentage of patients who provide the most positive response to a given question (i .e . top box score), divided by the number of patients who provide any response to the question .
These results suggest differences by race, ethnicity, and language in the following areas:
inpatient (hcahPS):
Asian patients reported significantly less positive experiences than non-Hispanic whites for 5 of 10 measures, and significantly more positive experiences than non-Hispanic whites on 1 measure (quiet at night) .
American Indians reported significantly less positive experiences than whites for 4 of 10 measures, and significantly more positive experiences than non-Hispanic whites for 1 measure (quiet at night) .
Hispanics reported significantly more positive experiences with care than non-Hispanic whites for 7 of 10 measures .
Black/African American patients reported more positive experiences than non-Hispanic whites in 4 of 10 measures, and significantly less positive experiences than non-Hispanic whites for 4 of 10 measures .
Spanish-speaking respondents reported significantly more positive experiences compared to the English-speaking cohort for all 10 inpatient measures .
For the quiet at night measure, all racial and ethnic minority groups reported a more positive experience, compared to the white reference group . For all other measures, there was at least one racial and ethnic minority group that reported significantly less positive experiences compared to non-Hispanic whites .
Outpatient (c/g-cahPS):
With regard to the “overall provider rating” measure, the results suggest a disparity for all racial and ethnic minority groups except American Indians, compared to non-Hispanic whites . Similarly, the data suggests a disparity between Spanish and English-speaking patients in overall provider rating . These findings are in alignment with 2014 results .
The results for “willingness to recommend provider” differ from those reported in 2014 . Last year, there was evidence of disparities across all racial and ethnic minority groups as well as Spanish-speaking patients, compared to white and English-speaking patients, respectively . This year, no statistically significant differences were detected for Black/African American or American Indian patients on this question . Evidence of a disparity remains for Hispanics, Asians, Pacific Islanders, and other races . Furthermore, these data suggest Spanish-speaking patients were more likely to answer that they are willing to recommend their provider, compared to English-speaking patients .
29MGH AnnuAl RepoRt on equity in HeAltH CARe quAlity 2015
Differences among certain racial and ethnic groups should be interpreted with caution . There may be cultural barriers or norms at play, as well as perceptions of bias and discrimination that impact how different groups perceive their care experiences, as well as the healthcare system more broadly .42,43
Overall, the survey results are consistent with research in the field that demonstrates variations in patient-reported experiences by characteristics such as race, ethnicity, and culture .44 However, it is important not to generalize or stereotype entire populations based on these findings, given the heterogeneity within these groups . Instead, ways to explore the root causes of these differences and strategies to address them, as appropriate, must be considered .
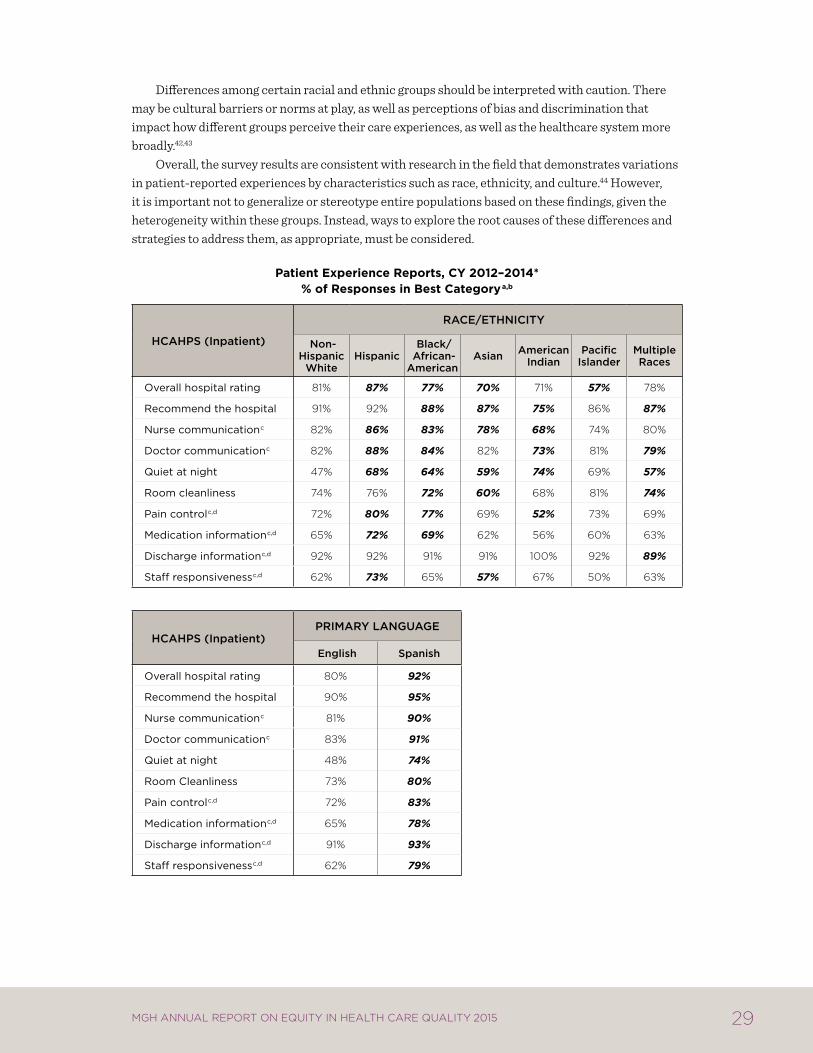
patient experience reports, cY 2012–2014* % of responses in Best categorya,b
hcahPS (inpatient)
Race/ethnicity
non-hispanic
Whitehispanic
Black/ african-american
asian americanindian
Pacificislander
multipleRaces
overall hospital rating 81% 87% 77% 70% 71% 57% 78%
recommend the hospital 91% 92% 88% 87% 75% 86% 87%
nurse communicationc 82% 86% 83% 78% 68% 74% 80%
Doctor communicationc 82% 88% 84% 82% 73% 81% 79%
Quiet at night 47% 68% 64% 59% 74% 69% 57%
room cleanliness 74% 76% 72% 60% 68% 81% 74%
pain controlc,d 72% 80% 77% 69% 52% 73% 69%
medication informationc,d 65% 72% 69% 62% 56% 60% 63%
Discharge informationc,d 92% 92% 91% 91% 100% 92% 89%
Staff responsivenessc,d 62% 73% 65% 57% 67% 50% 63%
hcahPS (inpatient)PRimaRy LangUage
english Spanish
overall hospital rating 80% 92%
recommend the hospital 90% 95%
nurse communicationc 81% 90%
Doctor communicationc 83% 91%
Quiet at night 48% 74%
room cleanliness 73% 80%
pain controlc,d 72% 83%
medication informationc,d 65% 78%
Discharge informationc,d 91% 93%
Staff responsivenessc,d 62% 79%
30 MGH AnnuAl RepoRt on equity in HeAltH CARe quAlity 2015
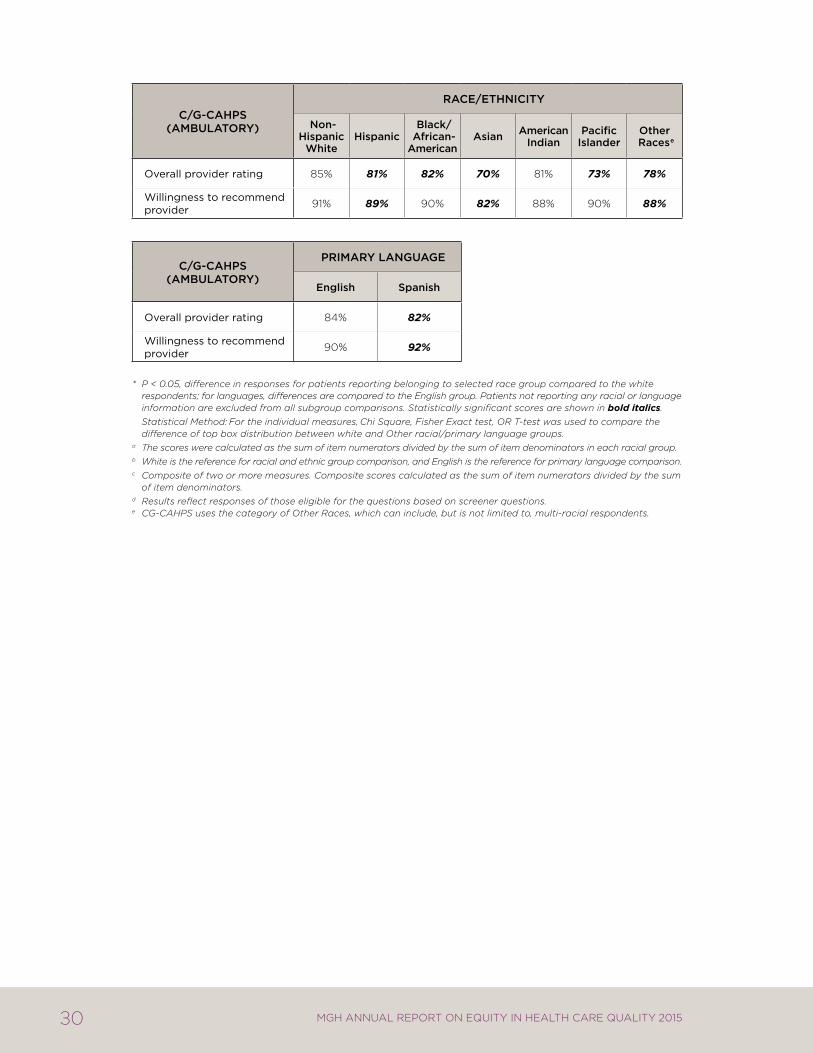
c/g-cahPS (amBULatORy)
Race/ethnicity
non-hispanic
Whitehispanic
Black/ african-american
asian americanindian
Pacificislander
Other Racese
overall provider rating 85% 81% 82% 70% 81% 73% 78%
willingness to recommend provider 91% 89% 90% 82% 88% 90% 88%
c/g-cahPS (amBULatORy)
PRimaRy LangUage
english Spanish
overall provider rating 84% 82%
willingness to recommend provider 90% 92%
* P < 0.05, difference in responses for patients reporting belonging to selected race group compared to the white respondents; for languages, differences are compared to the English group. Patients not reporting any racial or language information are excluded from all subgroup comparisons. Statistically significant scores are shown in bold italics.
Statistical Method: For the individual measures, Chi Square, Fisher Exact test, OR T-test was used to compare the difference of top box distribution between white and Other racial/primary language groups.
a The scores were calculated as the sum of item numerators divided by the sum of item denominators in each racial group.b White is the reference for racial and ethnic group comparison, and English is the reference for primary language comparison.c Composite of two or more measures. Composite scores calculated as the sum of item numerators divided by the sum
of item denominators.d Results reflect responses of those eligible for the questions based on screener questions. e CG-CAHPS uses the category of Other Races, which can include, but is not limited to, multi-racial respondents.
31MGH AnnuAl RepoRt on equity in HeAltH CARe quAlity 2015
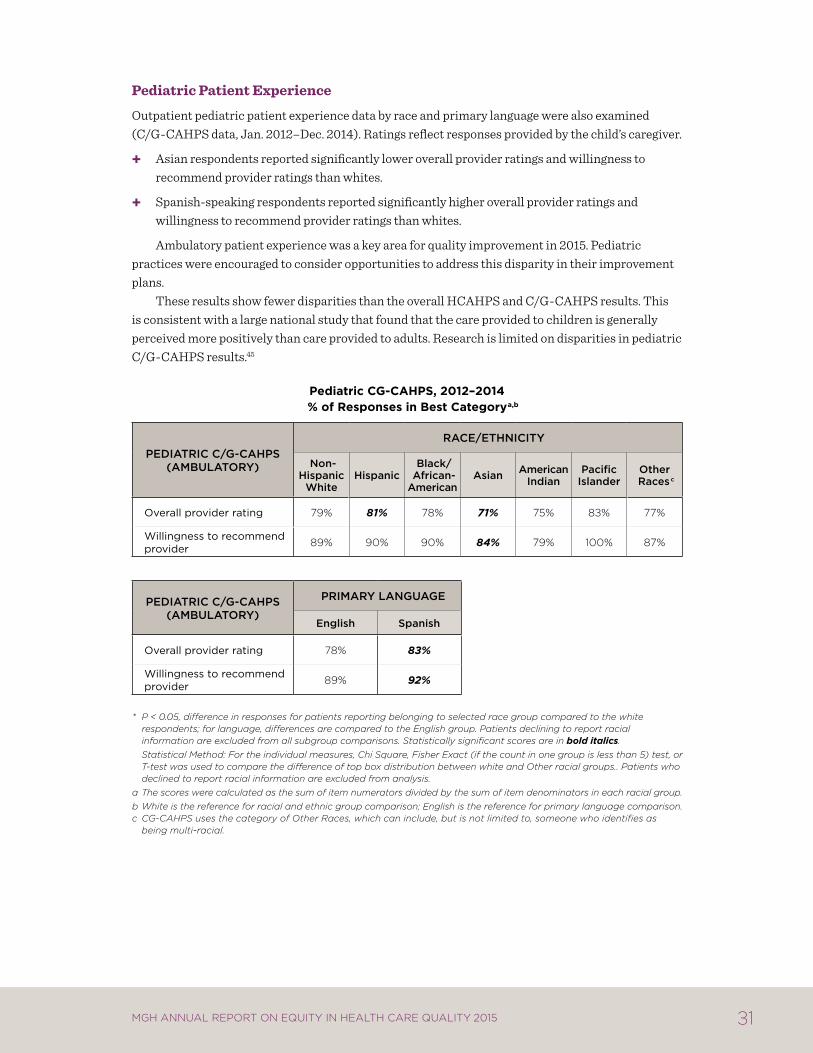
Pediatric Patient Experience
Outpatient pediatric patient experience data by race and primary language were also examined (C/G-CAHPS data, Jan . 2012–Dec . 2014) . Ratings reflect responses provided by the child’s caregiver .
Asian respondents reported significantly lower overall provider ratings and willingness to recommend provider ratings than whites .
Spanish-speaking respondents reported significantly higher overall provider ratings and willingness to recommend provider ratings than whites .
Ambulatory patient experience was a key area for quality improvement in 2015 . Pediatric practices were encouraged to consider opportunities to address this disparity in their improvement plans .
These results show fewer disparities than the overall HCAHPS and C/G-CAHPS results . This is consistent with a large national study that found that the care provided to children is generally perceived more positively than care provided to adults . Research is limited on disparities in pediatric C/G-CAHPS results .45
pediatric cg-cahps, 2012–2014% of responses in Best categorya,b
PeDiatRic c/g-cahPS (amBULatORy)
Race/ethnicity
non-hispanic
Whitehispanic
Black/ african-american
asian americanindian
Pacificislander
Other Racesc
overall provider rating 79% 81% 78% 71% 75% 83% 77%
willingness to recommend provider 89% 90% 90% 84% 79% 100% 87%
PeDiatRic c/g-cahPS (amBULatORy)
PRimaRy LangUage
english Spanish
overall provider rating 78% 83%
willingness to recommend provider 89% 92%
* P < 0.05, difference in responses for patients reporting belonging to selected race group compared to the white respondents; for language, differences are compared to the English group. Patients declining to report racial information are excluded from all subgroup comparisons. Statistically significant scores are in bold italics.
Statistical Method: For the individual measures, Chi Square, Fisher Exact (if the count in one group is less than 5) test, or T-test was used to compare the difference of top box distribution between white and Other racial groups.. Patients who declined to report racial information are excluded from analysis.
a The scores were calculated as the sum of item numerators divided by the sum of item denominators in each racial group.b White is the reference for racial and ethnic group comparison; English is the reference for primary language comparison.c CG-CAHPS uses the category of Other Races, which can include, but is not limited to, someone who identifies as
being multi-racial.
32 MGH AnnuAl RepoRt on equity in HeAltH CARe quAlity 2015
references1. Institute of Medicine Committee on Quality of Health Care in America . Crossing the Quality
Chasm: A new health system for the 21st century. National Academies Press; 2001 .2. Smedley BD, Stith AY, Nelson AR . Unequal Treatment: Confronting racial and ethnic disparities
in health care (full printed version) . National Academies Press; 2002 .3. Porter ME, Teisberg EO . Redefining health care: creating value-based competition on results.
Harvard Business Press; 2006 .4. Joynt KE, Jha AK . Thirty-day readmissions—truth and consequences . N Engl J Med. Apr 12
2012;366(15):1366-1369 .5. Cronin PR, Greenwald JL, Crevensten GC, Chueh HC, Zai AH . Development and
implementation of a real-time 30-day readmission predictive model . AMIA Annu Symp Proc. 2014;2014:424–431 .
6. Lopez L, Rodriguez F, Huerta D, Soukup J, Hicks L . Use of interpreters by physicians for hospitalized limited English proficient patients and its impact on patient outcomes . J Gen Intern Med. Jun 2015;30(6):783–789 .
7. Divi C, Koss RG, Schmaltz SP, Loeb JM . Language proficiency and adverse events in US hospitals: a pilot study . Int J Qual Health Care. Apr 2007;19(2):60–67 .
8. Lindholm M, Hargraves JL, Ferguson WJ, Reed G . Professional language interpretation and inpatient length of stay and readmission rates . J Gen Intern Med. Oct 2012;27(10):1294–1299 .
9. MedicineNet . Definition of Infection, group B strep . Medterms http://www .medterms .com/script/main/art .asp?articlekey=8352 . Accessed July 1, 2013 .
10. About Group B Strep . Centers for Disease Control and Prevention http://www .cdc .gov/groupbstrep/about/index .html . Accessed July 1, 2013 .
11. Disparities in universal prenatal screening for group B streptococcus—North Carolina, 2002-2003 . Morbidity and Mortality Weekly Report. Vol 28: Centers for Disease Control and Prevention; 2005:700–703 .
12. Phares CR, Lynfield R, Farley MM, et al . Epidemiology of invasive group B streptococcal disease in the United States, 1999-2005 . JAMA. May 7 2008;299(17):2056–2065 .
13. Schrag SJ, Zell ER, Lynfield R, et al . A population-based comparison of strategies to prevent early-onset group B streptococcal disease in neonates . N Engl J Med. Jul 25 2002;347(4):233–239 .
14. Schuchat A, Wenger JD . Epidemiology of group B streptococcal disease . Risk factors, prevention strategies, and vaccine development . Epidemiol Rev. 1994;16(2):374–402 .
15. Trends in perinatal group B streptococcal disease—United States, 2000-2006 . Morbidity and Mortality Weekly Report. Vol 58: Centers for Disease Control and Prevention; 2009:109–112 .
16. Bryant AS, Cheng YW, Caughey AB . Equality in obstetrical care: racial/ethnic variation in group B streptococcus screening . Matern Child Health J. Nov 2011;15(8):1160–1165 .
17. Hickman ME, Rench MA, Ferrieri P, Baker CJ . Changing epidemiology of group B streptococcal colonization . Pediatrics. 1999;104(2):203–209 .
18. Newton ER, Butler MC, Shain RN . Sexual behavior and vaginal colonization by group B streptococcus among minority women . Obstetrics & Gynecology. 1996;88(4):577–582 .
19. Taylor JK, Hall RW, Dupre AR . The incidence of group B streptococcus in the vaginal tracts of pregnant women in central Alabama . Clin Lab Sci. Winter 2002;15(1):16–17 .
33MGH AnnuAl RepoRt on equity in HeAltH CARe quAlity 2015
20. Clark SL, Miller DD, Belfort MA, Dildy GA, Frye DK, Meyers JA . Neonatal and maternal outcomes associated with elective term delivery . Am J Obstet Gynecol. Feb 2009;200(2):156 e151–154 .
21. Osterman MJ, Martin JA . Trends in low-risk Cesarean delivery in the United States, 1990-2013 . Natl Vital Stat Rep. Nov 5 2014;63(6):1–16 .
22. Curtin SC, Gregory KD, Korst LM, Uddin SF . Maternal Morbidity for Vaginal and Cesarean Deliveries, According to Previous Cesarean History: New Data From the Birth Certificate, 2013 . Natl Vital Stat Rep. May 20 2015;64(4):1–13, back cover .
23. Asthma . FastStats—National Center for Health Statistics, Centers for Disease Control and Prevention 2013; http://www .cdc .gov/nchs/fastats/asthma .htm . Accessed December 12, 2013 .
24. Adolescent and School Health, Asthma and Schools . Centers for Disease Control and Prevention 2013; http://www .cdc .gov/healthyyouth/Asthma/index .htm . Accessed December 16, 2013 .
25. Asthma’s Impact on the Nation, Data from the CDC National Asthma Control Program . Centers for Disease Control and Prevention; 2012 .
26. Akinbami L, Centers for Disease C, Prevention National Center for Health S . The state of childhood asthma, United States, 1980-2005 . Adv Data. Dec 12 2006(381):1–24 .
27. Akinbami L, Moorman JE, Bailey C, et al . Trends in Asthma Prevalence, Health Care Use, and Mortality in the United States, 2001–2010 . NCHS Data Brief. Vol 94: National Center for Health Statistics, Centers for Disease Control and Prevention .
28. Seasonal Influenza Vaccination Coverage—United States, 2009–10 and 2010–11 . CDC Health Disparities and Inequalities Report- United States, MMWR Vol 62 (Suppl 3): Centers for Disease Control and Prevention; 2013:65–68 .
29. Pearson WS, Zhao G, Ford ES . An Analysis of Language as a Barrier to Receiving Influenza Vaccinations among an Elderly Hispanic Population in the United States . Adv Prev Med. 2011;298787 .
30. DuBard CA, Gizlice Z . Language spoken and differences in health status, access to care, and receipt of preventive services among US Hispanics . Am J Public Health. Nov 2008;98(11):2021–2028 .
31. Fiscella K . Commentary—anatomy of racial disparity in influenza vaccination . Health Serv Res. Apr 2005;40(2):539–549 .
32. Haviland AM, Elliott MN, Hambarsoomian K, Lurie N . Immunization disparities by Hispanic ethnicity and language preference . Arch Intern Med. Jan 24 2011;171(2):158–165 .
33. Joint Commission . Centers for Medicare and Medicaid Services . Specifications Manual for National Hospital Inpatient Quality Measures v4 .3b . 2014 .
34. 2020 Topics & Objectives: Access to Health Services . US Department of Health and Human Services. http://www .healthypeople .gov/2020/topicsobjectives2020/objectiveslist .aspx?topicId=1 . Accessed December 19, 2013 .
35. Shi L, Nie X, Wang TF . Type of usual source of care and access to care . J Ambul Care Manage. Jul-Sep 2013;36(3):209–221 .
36. Blewett LA, Johnson PJ, Lee B, Scal PB . When a usual source of care and usual provider matter: adult prevention and screening services . J Gen Intern Med. Sep 2008;23(9):1354–1360 .
37. American Cancer Society . Cancer Facts & Figures for Hispanics/Latinos 2012–2014. Atlanta: American Cancer Society;2012 .
38. American Cancer Society . Cancer Prevention & Early Detection Facts & Figures 2015–2016. Atlanta: American Cancer Society;2015 .
34 MGH AnnuAl RepoRt on equity in HeAltH CARe quAlity 2015
39. Kandula NR, Wen M, Jacobs EA, Lauderdale DS . Low rates of colorectal, cervical, and breast cancer screening in Asian Americans compared with non-Hispanic whites: Cultural influences or access to care? Cancer. Jul 1 2006;107(1):184–192 .
40. Lee HY, Ju E, Vang PD, Lundquist M . Breast and cervical cancer screening disparity among Asian American women: does race/ethnicity matter? J Womens Health (Larchmt). Oct 2010;19(10):1877–1884 .
41. Pourat N, Kagawa-Singer M, Breen N, Sripipatana A . Access versus acculturation: identifying modifiable factors to promote cancer screening among Asian American women . Med Care. Dec 2010;48(12):1088–1096 .
42. Joint Pew Hispanic Center and Robert Wood Johnson Foundation . Hispanics and Healthcare in the United States: Access, Information, and Knowledge. August 2008 .
43. Sorkin DH, Ngo-Metzger Q, De Alba I . Racial/ethnic discrimination in health care: impact on perceived quality of care . J Gen Intern Med. May 2010;25(5):390–396 .
44. Elliott MN, Lehrman WG, Goldstein E, Hambarsoomian K, Beckett MK, Giordano LA . Do hospitals rank differently on HCAHPS for different patient subgroups? Medical Care Research and Review. 2010;67(1):56–73 .
45. Chen AY, Elliott MN, Spritzer KL, et al . Differences in CAHPS reports and ratings of health care provided to adults and children . Med Care. Nov 2012;50 Suppl:S35–39 .
46. Health Research and Educational Trust . Reducing health care disparities: Collection and use of race, ethnicity and language data. Chicago: Health Research & Educational Trust;2013 .
35MGH AnnuAl RepoRt on equity in HeAltH CARe quAlity 2015
appenDix a: methoDs anD Data collectionThe data in this report are drawn from a wide variety of institutional sources (see Appendix B for a complete list of data sources) . The time periods vary depending on the measure and availability of data being presented . In several cases, groups needed to be combined into white and Other and English-speaking and Other groupings in order to meet minimum sample size requirements . For some measures, multiple years of data have been combined to ensure that sample sizes are adequate to draw meaningful conclusions . White and English-speaking groups are used as the reference group for statistical analyses throughout the report . Finally, the naming conventions for the data elements are based on the nomenclature of the data sources . This explains why in some cases “white” is used, while in other cases “Non-Hispanic white” is used .
Collection of Data on Race, Ethnicity, and Language at MGH
In July 2014, MGH transitioned from its existing registration and billing system to Epic as part of the Partners-wide eCare implementation . In doing so, MGH changed its race and ethnicity data collection slightly . In the past, when patients presented for registration, registrars asked them to identify first their race and then their ethnicity using categories that were standard across the state; whether a patient identified as Hispanic/Latino was included in the question about race . During registration in Epic, registrars now ask patients to first identify their ethnicity, then race, and then answer the OMB standard question “Hispanic/Latino: Yes/No .”
With the transition to Epic, the category lists for both ethnicity and race remain largely the same, using pre-existing lists as a model . Training surrounding the collection of this data remains the same as well . When a patient asks why MGH requests this data, registration staff are trained to explain that we collect this information to better serve our diverse patient population . Because self-identification is the gold standard for collecting data on race and ethnicity,46 registrars are trained never to enter their perception of the patient’s race or ethnicity . If a patient does not wish to provide this information, registrars select the value of “Declined .” Patients rarely decline to answer these questions (1 .4% decline rate for race, and 5 .8% decline rate for ethnicity in from July-December 2014) .vi If a patient’s stated race or ethnicity is not an option available to registrars in the system, the patient is registered with a code of “Other,” and additional information is entered in the free text fields to communicate the person’s self-reported race or ethnicity .
Registrars continue to collect data on patients’ preferred languages with the question, “In what language do you prefer to discuss health-related concerns?” With the implementation of Epic, registrars now ask an additional question regarding language preferences: “In what language do you prefer to receive written materials?”
Similarly, the data collection around patient disabilities slightly expanded with the implementation of Epic . In addition to pre-existing values (Blind/Visual Impairment, Cognitive, Deaf/Hard of Hearing, Physical/Congenital, Multiple, Declined, None, and Unavailable), MGH
vi July 2014 coincides with the date of Epic go-live at MGH . The decline rates are based on any new MGH MRNs created or any MRNs with edited race and ethnicity information from July-December 2014 . Since Epic go-live, the decline rates have decreased and are leveling off close to the 2013 rates of 0 .9% for race and 3 .4% for ethnicity .
36 MGH AnnuAl RepoRt on equity in HeAltH CARe quAlity 2015
registrars are now able to document Speech Impairments and Special Requests . A free-text comment box accompanies the value entered . As the ambulatory scheduling system and patient placement system (IDX and AllScripts, respectively) moved to Epic as well, this data continues to remain integrated across the front-end to allow for proactive accommodations for inpatients as well as outpatient practices .
All data collected at the patient’s initial MGH registration, including data on race, ethnicity, language, and disability, are confirmed during subsequent registration updates . The accuracy of these data has increased markedly in the last decade as a result of standardizing the methodology for objectively assessing race .
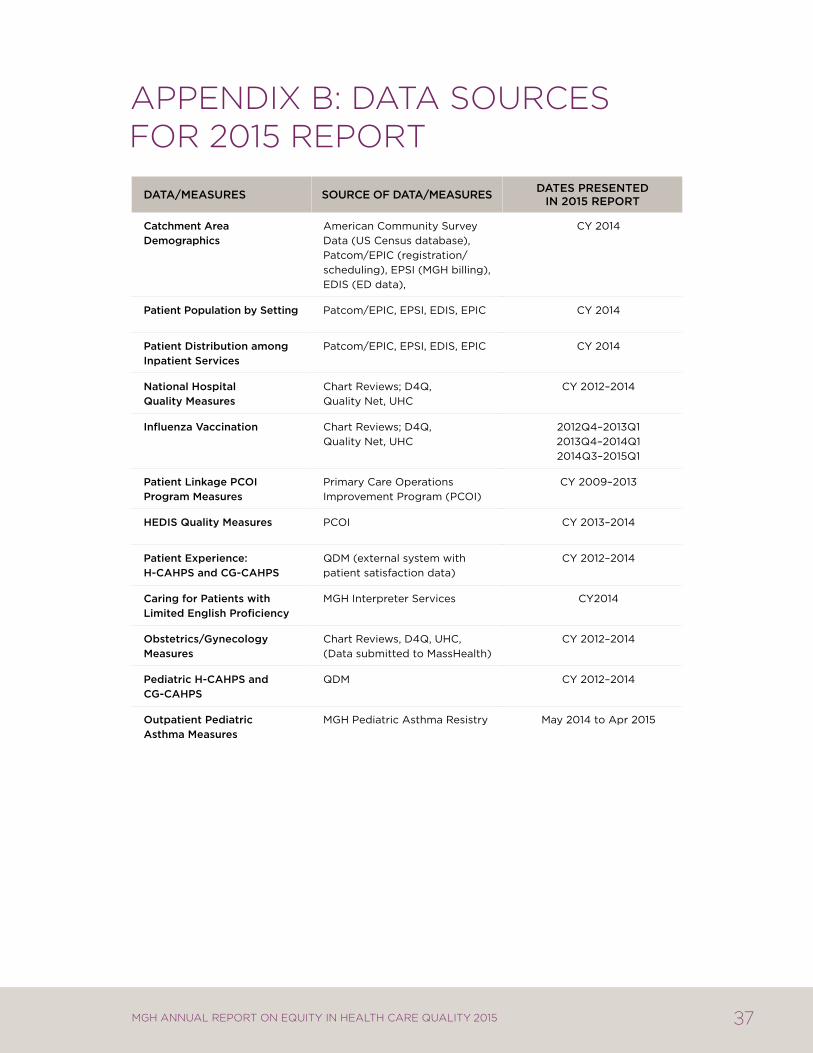
37MGH AnnuAl RepoRt on equity in HeAltH CARe quAlity 2015
appenDix B: Data sources for 2015 report
Data/meaSUReS SOURce OF Data/meaSUReS DateS PReSenteD in 2015 RePORt
catchment area Demographics
american community Survey Data (uS census database),patcom/Epic (registration/scheduling), EpSi (mgh billing), EDiS (ED data),
cy 2014
Patient Population by Setting patcom/Epic, EpSi, EDiS, Epic cy 2014
Patient Distribution among inpatient Services
patcom/Epic, EpSi, EDiS, Epic cy 2014
national hospital Quality measures
chart reviews; D4Q, Quality net, uhc
cy 2012–2014
influenza vaccination chart reviews; D4Q, Quality net, uhc
2012Q4–2013Q12013Q4–2014Q12014Q3–2015Q1
Patient Linkage PcOi Program measures
primary care operations improvement program (pcoi)
cy 2009–2013
heDiS Quality measures pcoi cy 2013–2014
Patient experience: h-cahPS and cg-cahPS
QDm (external system with patient satisfaction data)
cy 2012–2014
caring for Patients with Limited english Proficiency
mgh interpreter Services cy2014
Obstetrics/gynecology measures
chart reviews, D4Q, uhc, (Data submitted to masshealth)
cy 2012–2014
Pediatric h-cahPS and cg-cahPS
QDm cy 2012–2014
Outpatient Pediatric asthma measures
mgh pediatric asthma resistry may 2014 to apr 2015

The Disparities Solutions Center50 Staniford Street, Suite 901Boston, MA 02114mghdisparitiessolutions.org
Edward P. Lawrence Center for Quality and Safety55 Fruit StreetBoston, MA 02114qualityandsafety.massgeneral.org
For more information, please visit:

