massachusetts hospital - chiamass.gov · massachusetts hospital profiles 214 1 about this brief...
TRANSCRIPT

NOVEMBER 2015
CHIAcenter
for healthinformation
and analysis
MASSACHUSETTS HOSPITAL P R O F I L E S
CENTER FOR HEALTH INFORMATION AND ANALYSIS
D A T A T H R O U G H FISCAL YEAR 2014


center for health information and analysis iMassachusetts Hospital Profiles - Data through Fiscal Year 2014
Table of Contents
Massachusetts Hospital Profiles- Data through Fiscal Year 2014 Industry Overview 1-3
Massachusetts Hospital Profiles- Data through Fiscal Year 2014 Chartbook 5-19
Introduction to Multi-Acute Hospital System Profiles Ai
How to Read Multi-Acute Hospital System Profiles Aiii
Multi-Acute Hospital System Profiles Comparative Overview A1Partners HealthCare System A2CareGroup A3UMass Memorial Health Care A4Steward Health Care System A5Baystate Health A6Lahey Health System A7Cape Cod Healthcare A8Berkshire Health Systems A9Heywood Healthcare A10
Introduction to Acute Hospital Cohorts Bi
How to Read Acute Hospital Cohort Profile Biii
Changes from FY13 Acute Hospital Cohort Profiles BvAcute Hospital Cohort Profile B1
Introduction to Acute Hospital Profiles Ci
How to Read Acute Hospital Profiles Ciii
Changes from FY13 Acute Hospital Profiles Cv
Acute Hospitals - by Cohort
Academic Medical CenterBeth Israel Deaconess Medical Center C1Boston Medical Center C2Brigham and Women’s Hospital C3Massachusetts General Hospital C4Tufts Medical Center C5UMass Memorial Medical Center C6
Teaching Baystate Medical Center C7Berkshire Medical Center C8Brigham and Women’s Faulkner Hospital C9Cambridge Health Alliance C10Lahey Hospital & Medical Center C11Mount Auburn Hospital C12Saint Vincent Hospital C13Steward Carney Hospital C14Steward St. Elizabeth’s Medical Center C15

Massachusetts Hospital Profiles - Data through Fiscal Year 2014center for health information and analysisii
Community Anna Jaques Hospital C16Baystate Mary Lane Hospital C17Beth Israel Deaconess Hospital - Milton C18Beth Israel Deaconess Hospital - Needham C19Cooley Dickinson Hospital C20Emerson Hospital C21Hallmark Health C22MetroWest Medical Center C23Milford Regional Medical Center C24Nantucket Cottage Hospital C25Newton-Wellesley Hospital C26Northeast Hospital C27South Shore Hospital C28Winchester Hospital C29
Community-DSH Athol Hospital C30Baystate Franklin Medical Center C31Baystate Noble Hospital C32Baystate Wing Hospital C33Beth Israel Deaconess Hospital - Plymouth C34Cape Cod Hospital C35Clinton Hospital C36Fairview Hospital C37Falmouth Hospital C38Harrington Memorial Hospital C39HealthAlliance Hospital C40Heywood Hospital C41Holyoke Medical Center C42Lawrence General Hospital C43Lowell General Hospital C44Marlborough Hospital C45Martha’s Vineyard Hospital C46Mercy Medical Center C47Merrimack Valley Hospital C48Morton Hospital C49Nashoba Valley Medical Center C50North Shore Medical Center C51Quincy Medical Center C52Signature Healthcare Brockton Hospital C53Southcoast Hospitals Group C54Steward Good Samaritan Medical Center C55Steward Holy Family Hospital C56Steward Norwood Hospital C57Steward Saint Anne’s Hospital C58Sturdy Memorial Hospital C59
center for health information and analysis iiiMassachusetts Hospital Profiles - Data through Fiscal Year 2014
SpecialtyBoston Children’s Hospital C60Dana-Farber Cancer Institute C61Kindred Hospital - Boston C62Kindred Hospital - Boston North Shore C63Massachusetts Eye and Ear Infirmary C64New England Baptist Hospital C65Shriners Hospitals for Children - Boston C66Shriners Hospitals for Children - Springfield C67
Introduction to Non-Acute Hospital Profiles Di
How to Read Non-Acute Hospital Profiles Diii
Changes from FY13 Non-Acute Hospital Profiles Dv
Non-Acute Hospitals - by Cohort Psychiatric D1
Rehabilitation D2
Chronic Care D3
Specialty D4 AdCare Hospital of Worcester Franciscan Hospital for Children Hebrew Rehabilitation Hospital
Technical Appendix E1


NOVEMBER 2015
CHIAcenter
for healthinformation
and analysis
MASSACHUSETTS HOSPITAL P R O F I L E S
CENTER FOR HEALTH INFORMATION AND ANALYSIS
D A T A T H R O U G H FISCAL YEAR 2014
INDUSTRY OVERVIEW

center for health information and analysis 1Massachusetts Hospital Profiles - INDUSTRY OVERVIEW - Data through Fiscal Year 2014
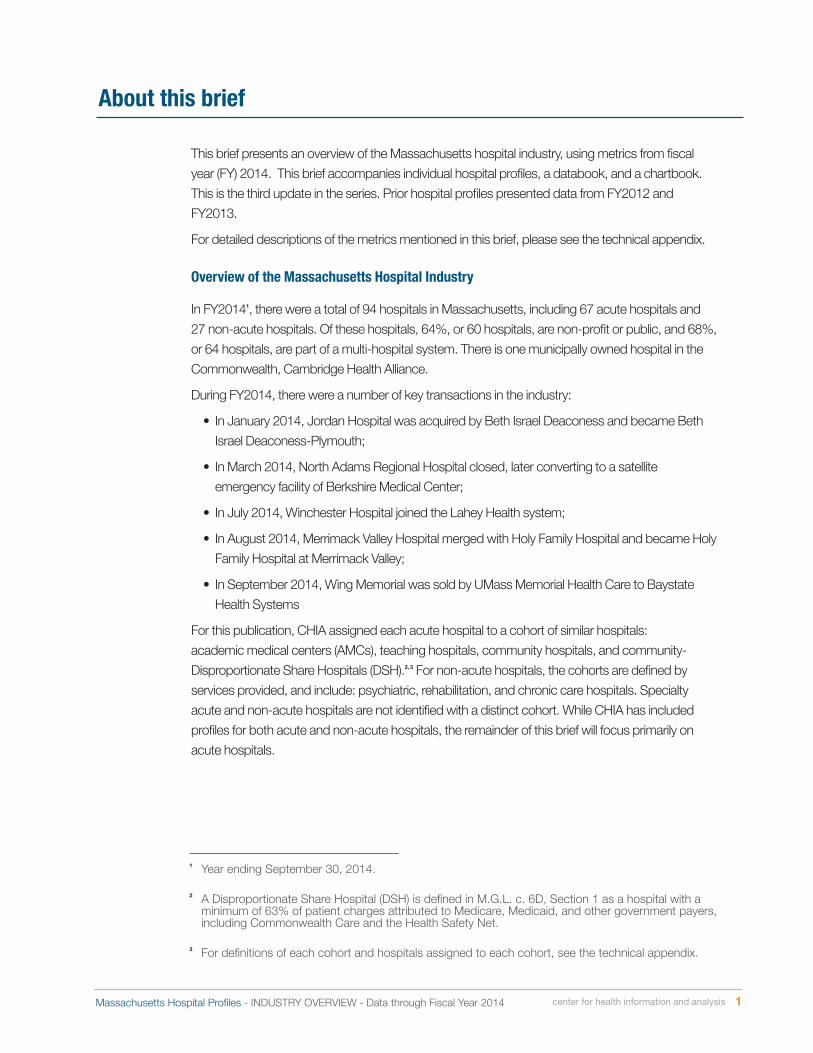
About this brief
This brief presents an overview of the Massachusetts hospital industry, using metrics from fiscal year (FY) 2014. This brief accompanies individual hospital profiles, a databook, and a chartbook. This is the third update in the series. Prior hospital profiles presented data from FY2012 and FY2013.
For detailed descriptions of the metrics mentioned in this brief, please see the technical appendix.
Overview of the Massachusetts Hospital Industry
In FY20141, there were a total of 94 hospitals in Massachusetts, including 67 acute hospitals and 27 non-acute hospitals. Of these hospitals, 64%, or 60 hospitals, are non-profit or public, and 68%, or 64 hospitals, are part of a multi-hospital system. There is one municipally owned hospital in the Commonwealth, Cambridge Health Alliance.
During FY2014, there were a number of key transactions in the industry:
• In January 2014, Jordan Hospital was acquired by Beth Israel Deaconess and became Beth Israel Deaconess-Plymouth;
• In March 2014, North Adams Regional Hospital closed, later converting to a satellite emergency facility of Berkshire Medical Center;
• In July 2014, Winchester Hospital joined the Lahey Health system;
• In August 2014, Merrimack Valley Hospital merged with Holy Family Hospital and became Holy Family Hospital at Merrimack Valley;
• In September 2014, Wing Memorial was sold by UMass Memorial Health Care to Baystate Health Systems
For this publication, CHIA assigned each acute hospital to a cohort of similar hospitals: academic medical centers (AMCs), teaching hospitals, community hospitals, and community-Disproportionate Share Hospitals (DSH).2, 3 For non-acute hospitals, the cohorts are defined by services provided, and include: psychiatric, rehabilitation, and chronic care hospitals. Specialty acute and non-acute hospitals are not identified with a distinct cohort. While CHIA has included profiles for both acute and non-acute hospitals, the remainder of this brief will focus primarily on acute hospitals.
1 Year ending September 30, 2014.
2 A Disproportionate Share Hospital (DSH) is defined in M.G.L. c. 6D, Section 1 as a hospital with a minimum of 63% of patient charges attributed to Medicare, Medicaid, and other government payers, including Commonwealth Care and the Health Safety Net.
3 For definitions of each cohort and hospitals assigned to each cohort, see the technical appendix.

center for health information and analysis 2Massachusetts Hospital Profiles - INDUSTRY OVERVIEW - Data through Fiscal Year 2014
Hospital Utilization
Statewide inpatient discharges continued to decline for the third consecutive year. Between FY2010 and FY2014, inpatient discharges declined by 8%, and between FY2013 and FY2014, discharges declined by 2.6%. Community hospitals had an 11% decrease in discharges between FY2010 and FY2014, the largest decline among all cohorts. Total discharges at teaching hospitals remained flat between FY2010 and FY2014. The teaching hospital cohort is the only cohort that saw no declines in total discharges between FY2010 and FY2014.
Inpatient occupancy rates, which show what percent of a hospital’s staffed beds were filled over the course of the year, have increased statewide, from a median of 66% in FY2013 to 68% in FY2014. AMCs had the highest median occupancy rate in FY2014, of 80%, and community hospitals had the lowest occupancy rate during the same period, of 61%.
While inpatient discharges have been declining, statewide outpatient visit trends have remained relatively unchanged between FY2010 and FY2014. There have been differences in trends among cohorts, however. Teaching hospitals saw the largest increase in outpatient visits, increasing by 6% between FY2010 and FY2014. Community-DSH hospitals saw the largest decrease, 3.6%, for the same time period.
Hospital Payer Mix and Relative Prices
There were no significant changes in hospital payer mix statistics between FY2013 and FY2014. Public payers, including Medicare, Medicaid, and other state and federal programs, accounted for 62% of acute hospital gross revenue in FY2014. Community hospitals had the lowest amount of public payer share among all the cohorts, of 54%. By definition, community-DSH hospitals are most dependent on public payers, which accounted for 69% of their gross revenue in FY2014.
Consistent with prior year findings, AMCs and teaching hospitals have the highest relative commercial payer prices. Based on calendar year 2014 data collected by CHIA, AMCs had the highest average composite relative price percentile, the 74th percentile. Community-DSH hospitals had the lowest average composite relative price percentile, the 44th percentile.
Quality of Care
The quality measures included in the individual acute hospital profiles were selected from the Commonwealth’s Standard Quality Measure Set. Five measures of acute hospital quality are included: all-payer, all-cause unplanned 30-day hospital readmission; rate of early elective deliveries; and three measures of health care-associated infections: central line-associated bloodstream infection, catheter-associated urinary tract infections (CAUTI), and surgical site infection for colon surgery. These measures are hospital-specific quality indicators; the data are reported by hospitals to the Centers for Medicare and Medicaid Services and the Leapfrog Group.
Statewide, unplanned hospital readmissions improved slightly from 15.9% in 2011 to 15.0% in 2013. Across hospitals, rates ranged from 11.8% at the highest performing, non-specialty hospital, to 18.6% at the lowest performing hospital. In 2013, some Massachusetts hospitals under-performed on certain measures of health care-associated infections, notably CAUTI and hospital-onset C. difficile. Early elective deliveries are non-medically necessary cesarean or induced deliveries prior to 39 weeks gestation. Between 2011 and 2013, the range in the rates of early elective deliveries between Massachusetts’ highest and lowest performing acute hospitals decreased substantially, from 38 percentage points in 2011-2012 to five percentage points in 2012-2013. However, in 2014-2015 the range of hospital performance broadened again to 13 percentage points.

center for health information and analysis 3Massachusetts Hospital Profiles - INDUSTRY OVERVIEW - Data through Fiscal Year 2014
Hospital Costs and Revenue
Between FY2010 and FY2014, the statewide average inpatient revenue per discharge increased by 7.6%.4 Among the hospital cohorts, community hospitals had the largest growth during this period, 14.0%, while teaching hospitals saw a decline of 1.6% between FY2010 and FY2014.
In contrast, the rate of adjusted inpatient cost growth was lower than the inpatient revenue growth for this period. The statewide average increase in the adjusted inpatient cost per discharge was 3.9% between FY2010 and FY2014, and 1.9% between FY2013 and FY2014.5 Community-DSH hospitals had the largest increase between FY2010 and FY2014, of 6.1%, while teaching hospitals saw a 2.5% decline over the same period. AMCs had average adjusted inpatient costs per discharge that were 13% higher than the statewide average in FY2014.
Total hospital outpatient revenue increased by an average of 9.2% between FY2010 and FY2014. AMCs had the largest increase over this period, of 10.3%, while community hospitals had the lowest rate of increase, 2.6%.
Hospital Financial Performance
Acute hospitals saw little change in their financial performance between FY2013 and FY2014. The statewide6 median total margin in FY2013 and FY2014 was 4.2%. Operating margins, which reflect loss or gains from patient care activities, improved slightly statewide, from 2.1% in FY2013 to 2.4% in FY2014.
Among the cohorts, teaching hospitals experienced the strongest financial performance in FY2014, with a median total margin of 8.2%, and a median operating margin of 5.6%. Teaching hospitals and AMCs accounted for 68% of the statewide surplus in FY2014. Community hospitals had the lowest margins among the cohorts, with a total margin of 2.9% and an operating margin of 1.3%. In FY2014, only seven non-specialty hospitals had total margins below 0%.
Multi-Acute Hospital System Financial Performance
Data from the most recent fiscal year available to CHIA shows that the nine multi-acute hospital systems profiled in this publication generated $22.7 billion in operating revenue, and all but one generated a profit. Performance of these systems declined from the previous year but remained strong as they generated a 4.7% median total margin, down from 5.4%. While acute hospitals accounted for a sizeable portion of revenue within each system, each system contained a variety of other organizations. Some included non-acute hospitals, physician organizations, and health plans, among other types of entities. The specific types of organizations within each system are displayed on the individual system profiles included in this publication.
4 Discharges refer to casemix-adjusted discharges (CMADs). Using CMADs adjusts for higher revenue that is attributable to more complex cases, and enables a more standardized comparison among hospital cohorts.
5 Inpatient cost per discharge uses casemix-adjusted discharges. In addition, the cost figure was adjusted to exclude direct medical education and physician compensation expenses, which occur only at some hospitals. Statewide average figures do not include specialty hospitals.
6 Includes acute Kindred Hospitals and Shriners Hospitals for Children.


MASSACHUSETTS HOSPITAL P R O F I L E S
CENTER FOR HEALTH INFORMATION AND ANALYSIS
D A T A T H R O U G H FISCAL YEAR 2014
CHIA
C H A R T B O O K
NOVEMBER 2015


Massachusetts Hospital Profiles - CHARTBOOK - Data through Fiscal Year 2014 center for health information and analysis 5
Number of Massachusetts Hospitals by System Affiliation and Profit Status
■ 68% of hospitals are part of multi-hospital systems
■ 36% of hospitals are for-profit hospitals
CategoryAcute Non-
Profit or PublicAcute For-
ProfitNon-Acute Non-Profit
Non-Acute For-Profit TOTAL
Multi-Hospital System 33 14 5 12 64
Individual Hospitals 20 0 2 8 30
TOTAL 53 14 7 20 94

Massachusetts Hospital Profiles - CHARTBOOK - Data through Fiscal Year 2014 center for health information and analysis 6
Top Discharges Statewide (by Diagnostic Group)
Normal neonate births were the most common reasons for inpatient admissions in FY2014.
Rank DRG Description Discharges*% Total
Discharges
1 640 Normal neonate birth 63,137 8%
2 560 Vaginal delivery 46,897 6%
3 720 Septicemia & disseminated infections 26,573 3%
4 540 Cesarean delivery 22,109 3%
5 194 Heart failure 21,995 3%
6 139 Other pneumonia 17,546 2%
7 302 Knee joint replacement 16,100 2%
8 140 Chronic obstructive pulmonary disease 15,904 2%
9 383 Cellulitis & other bacterial skin infections 13,643 2%
10 301 Hip joint replacement 13,115 2%
All other Cases 528,466 67%
Total Discharges 785,485 100%
Data Source: Hospital Discharge Database (HDD)
Note: Total discharges reported by hospitals in the HDD may vary from total discharges reported by hospitals in the Hospital 403 Cost Reports. See the technical appendix for more information. * Discharge data does not include the acute care Kindred Hospitals as HDD data was not available for these hospitals.

Massachusetts Hospital Profiles - CHARTBOOK - Data through Fiscal Year 2014 center for health information and analysis 7
Median Occupancy Rates by Cohort
Median occupancy rates decreased for academic medical centers, community hospitals, and community-DSH hospitals between FY2013 and FY2014, while median occupancy rates remained the same for teaching hospitals.
CohortFY2013
Occupancy RateFY2014
Occupancy Rate
Academic Medical Center 84% 80%
Teaching 71% 71%
Community 63% 61%
Community-DSH 64% 63%
Specialty Hospitals 63% 64%
Data Source: Hospital 403 Cost Reports

Massachusetts Hospital Profiles - CHARTBOOK - Data through Fiscal Year 2014 center for health information and analysis 8
Discharges by Cohort
■ Total hospital discharges declined 8% from FY2010 to FY2014
■ With the exception of the teaching hospital cohort, inpatient discharges declined in each cohort from FY2010 to FY2014
Cohort
Number of
HospitalsFY2010
DischargesFY2013
DischargesFY2014
Discharges
% of Statewide
Discharges in FY14
% Change, FY2010-
2014
% Change, FY2013-
2014
Academic Medical Center 6 241,043 224,757 219,458 28% -9.0% -2.4%
Teaching 9 145,438 144,473 145,592 18% 0.1% 0.8%
Community 14 159,760 146,557 141,874 18% -11.2% -3.2%
Community-DSH 30 285,845 270,718 258,382 33% -9.6% -4.6%
Specialty Hospitals 8 28,828 27,013 26,876 3% -6.8% -0.5%
TOTAL STATEWIDE 67 860,914 813,518 792,182 100% -8.0% -2.6%
Data Source: Hospital 403 Cost Reports Note: Total discharges reported by hospitals in the Hospital 403 Cost Reports may vary from total discharges reported by hospitals in the Hospital Discharge Database (HDD).
See the technical appendix for more information.

Massachusetts Hospital Profiles - CHARTBOOK - Data through Fiscal Year 2014 center for health information and analysis 9
Change in Outpatient Visits, by Cohort
Median outpatient visits increased at the academic medical center and teaching hospital cohorts, while they decreased at community and community-DSH hospital cohorts.
Cohort
Median % Change in Outpatient Visits - Cumulative from FY2010
FY2010-FY2011 FY2010-FY2012 FY2010-FY2013 FY2010-FY2014
Academic Medical Center 1.5% 3.9% 2.4% 3.2%
Teaching -0.1% 5.7% 4.0% 6.0%
Community -1.1% -2.1% -1.8% -1.5%
Community-DSH -1.3% -0.5% -2.9% -3.6%
Specialty Hospitals* 1.9% 3.5% 4.8% 4.8%
TOTAL STATEWIDE -0.4% 1.9% 0.2% -0.3%
Data Source: Hospital 403 Cost Reports * Shriners Hospitals for Children were not included in this analysis.

Massachusetts Hospital Profiles - CHARTBOOK - Data through Fiscal Year 2014 center for health information and analysis 10
FY2014 Payer Mix
Community-DSH and teaching hospitals had the highest share of public payer mix.
Community-DSH
CommunityTeachingAcademicMedical Center
Statewide(n=67)
43%37% 43% 41%
47%
20%
38%
24%
39%
22%
35%
13%
46%
22%
31%Commercial
and Other
State Programs
Medicare and Other Federal
Programs
of hospitals’ gross revenues were attributed to Medicareand other federal programs
= 1 Hospital
DSH Threshold*
Data Source: Hospital 403 Cost Reports* Hospitals have DSH status if they have 63% or more of gross revenues (GPSR) attributable to Medicare, Medicaid, and other government payers, including
Commonwealth Care and the Health Safety Net.

Massachusetts Hospital Profiles - CHARTBOOK - Data through Fiscal Year 2014 center for health information and analysis 11
Acute Hospital Blended Composite Relative Price Percentile, by Hospital Cohort, CY2014
Academic medical centers, on average, had prices well above the median in CY2014.
100th
75th
50th
25th
0Academic Medical
Centers Teaching Community Community-
DSH
Perc
entil
es
$ $ $ $ $ $ $ = 1 Billion
Total Commercial Payer Revenue for Each Cohort
= 1 Hospital
$ $$ $
74
444556 50th Percentile
(Median)

Massachusetts Hospital Profiles - CHARTBOOK - Data through Fiscal Year 2014 center for health information and analysis 12
Growth in Inpatient Revenue per CMAD, FY2010 - FY2014
Community hospitals had the highest growth in inpatient revenue per case mix-adjusted discharge (CMAD) from FY2010 to FY2014 of 14.0%. The teaching hospital cohort was the only cohort that experienced a decline in inpatient revenue per CMAD between FY2010 and FY2014.
-9
-6
-3
0
3
6
9
12
15
FY14FY13FY12FY11FY10
14.0%
8.2%
-1.6%
9.3%
7.6% Statewide*Community-DSH
Community
Academic Medical Center
Teaching
Data Source: Hospital 403 Cost Reports* Statewide excludes Shriners Hospitals for Children and acute care Kindred hospitals.

Massachusetts Hospital Profiles - CHARTBOOK - Data through Fiscal Year 2014 center for health information and analysis 13
Growth in Adjusted Cost per CMAD, FY2010 - FY2014
-6
-4
-2
0
2
4
6
8
Community-DSH
Community
Academic Medical Center
FY14FY13FY12FY11FY10
3.5%
6.1%
-2.5%
5.9%
3.9% Statewide*
Teaching
Data Source: Hospital 403 Cost Reports* Statewide excludes Shriners Hospitals for Children and acute care Kindred hospitals.
Community-DSH hospitals had the highest growth in inpatient adjusted cost per case mix-adjusted discharge (CMAD) from FY2010 to FY2014 of 6.1%, while teaching hospitals experienced a decline of 2.5%.
Massachusetts Hospital Profiles - CHARTBOOK - Data through Fiscal Year 2014 center for health information and analysis 14
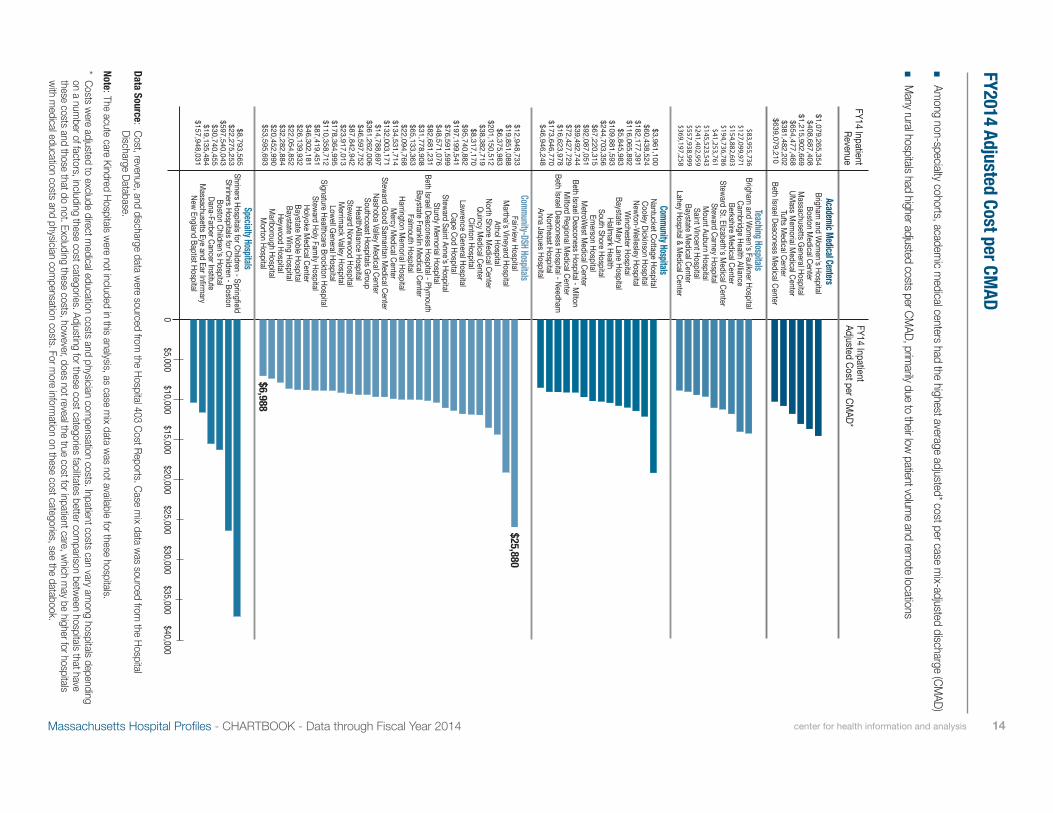
■Among non-specialty cohorts, academ
ic medical centers had the highest average adjusted* cost per case m
ix-adjusted discharge (CMAD)
■Many rural hospitals had higher adjusted costs per CM
AD, primarily due to their low patient volum
e and remote locations
Data Source: Cost, revenue, and discharge data were sourced from the Hospital 403 Cost Reports. Case m
ix data was sourced from the Hospital
Discharge Database.Note: The acute care Kindred Hospitals were not included in this analysis, as case m
ix data was not available for these hospitals. * Costs were adjusted to exclude direct m
edical education costs and physician compensation costs. Inpatient costs can vary am
ong hospitals depending on a num
ber of factors, including these cost categories. Adjusting for these cost categories facilitates better comparison between hospitals that have
these costs and those that do not. Excluding these costs, however, does not reveal the true cost for inpatient care, which may be higher for hospitals
with medical education costs and physician com
pensation costs. For more inform
ation on these cost categories, see the databook.
FY2014 Adjusted Cost per CMAD
0$5,000
$10,000$15,000
$20,000$25,000
$30,000$35,000
$40,000
New England Baptist HospitalM
assachusetts Eye and Ear Infirmary
Dana-Farber Cancer InstituteBoston Children's Hospital
Shriners Hospitals for Children - BostonShriners Hospitals for Children - Springfield
Morton Hospital
Marlborough HospitalHeywood Hospital
Baystate Wing Hospital
Baystate Noble HospitalHolyoke M
edical CenterSteward Holy Fam
ily HospitalSignature Healthcare Brockton Hospital
Lowell General HospitalM
errimack Valley Hospital
Steward Norwood HospitalHealthAlliance Hospital
Southcoast Hospitals GroupNashoba Valley M
edical CenterSteward Good Sam
aritan Medical Center
Mercy M
edical CenterHarrington M
emorial Hospital
Falmouth Hospital
Baystate Franklin Medical Center
Beth Israel Deaconess Hospital - Plymouth
Sturdy Mem
orial HospitalSteward Saint Anne's Hospital
Cape Cod HospitalLawrence General Hospital
Clinton HospitalQuincy M
edical CenterNorth Shore M
edical CenterAthol Hospital
Martha's Vineyard Hospital
Fairview Hospital
Anna Jaques HospitalNortheast Hospital
Beth Israel Deaconess Hospital - NeedhamM
ilford Regional Medical Center
Beth Israel Deaconess Hospital - Milton
MetroW
est Medical Center
Emerson Hospital
South Shore HospitalHallm
ark HealthBaystate M
ary Lane HospitalW
inchester HospitalNewton-W
ellesley HospitalCooley Dickinson Hospital
Nantucket Cottage Hospital
Lahey Hospital & Medical Center
Baystate Medical Center
Saint Vincent HospitalM
ount Auburn HospitalSteward Carney Hospital
Steward St. Elizabeth's Medical Center
Berkshire Medical Center
Cambridge Health Alliance
Brigham and W
omen's Faulkner Hospital
Beth Israel Deaconess Medical Center
Tufts Medical Center
UMass M
emorial M
edical CenterM
assachusetts General HospitalBoston M
edical CenterBrigham
and Wom
en's Hospital$1,079,265,354
$408,687,408 $1,215,902,669
$654,477,468 $381,482,202
$639,079,210 $83,955,736
$127,099,971 $154,882,603 $194,736,786
$41,253,761 $145,523,543 $241,402,959 $557,938,999 $369,197,258
$3,961,100 $60,438,524
$182,177,391 $116,065,892
$5,845,983 $109,881,593 $244,703,356 $67,220,315 $92,087,051 $39,492,744 $72,427,729 $16,623,978
$173,646,770 $46,946,248
$12,948,733 $19,851,088 $6,375,983
$201,150,512 $38,382,719 $8,317,170
$95,740,882 $197,199,541 $76,591,599 $48,571,076 $82,681,231 $31,778,908 $65,133,363 $22,094,768
$134,531,714 $132,003,171 $14,788,697
$361,262,006 $46,597,752 $87,842,942 $23,917,013
$178,364,995 $110,358,712 $87,419,451 $46,302,181 $26,139,932 $22,054,852 $32,282,884 $20,452,990 $53,595,693
$8,793,565 $22,275,253
$597,540,043 $30,740,455 $19,135,484
$157,948,031
Academic Medical Centers
Teaching Hospitals
Community Hospitals
Community-DSH Hospitals
Specialty Hospitals
FY14 Inpatient Revenue
FY14 Inpatient Adjusted Cost per CM
AD*
$25,880
$6,988

Massachusetts Hospital Profiles - CHARTBOOK - Data through Fiscal Year 2014 center for health information and analysis 15
■Full inpatient costs per case mix-adjusted discharge (CM
AD) vary widely among hospitals, even within cohorts
■Academic m
edical centers and teaching hospitals have higher than average full costs per CMAD, in part due to the costs
of their medical residency program
s
Data Source: Cost, revenue, and discharge data were sourced from the Hospital 403 Cost Reports. Case m
ix data was sourced from the Hospital
Discharge Database.Note: The acute care Kindred Hospitals were not included in this analysis, as case m
ix data was not available for these hospitals.
FY2014 Full Cost per CMAD
010000
2000030000
4000050000
New England Baptist HospitalM
assachusetts Eye and Ear Infirmary
Dana-Farber Cancer InstituteBoston Children's Hospital
Shriners Hospitals for Children - BostonShriners Hospitals for Children - Springfield
Morton Hospital
Marlborough HospitalHeywood Hospital
Baystate Wing Hospital
Baystate Noble HospitalHolyoke M
edical CenterSteward Holy Fam
ily HospitalSignature Healthcare Brockton Hospital
Lowell General HospitalM
errimack Valley Hospital
Steward Norwood HospitalHealthAlliance Hospital
Southcoast Hospitals GroupNashoba Valley M
edical CenterSteward Good Sam
aritan Medical Center
Mercy M
edical CenterHarrington M
emorial Hospital
Falmouth Hospital
Baystate Franklin Medical Center
Beth Israel Deaconess Hospital - Plymouth
Sturdy Mem
orial HospitalSteward Saint Anne's Hospital
Cape Cod HospitalLawrence General Hospital
Clinton HospitalQuincy M
edical CenterNorth Shore M
edical CenterAthol Hospital
Martha's Vineyard Hospital
Fairview Hospital
Anna Jaques HospitalNortheast Hospital
Beth Israel Deaconess Hospital - NeedhamM
ilford Regional Medical Center
Beth Israel Deaconess Hospital - Milton
MetroW
est Medical Center
Emerson Hospital
South Shore HospitalHallm
ark HealthBaystate M
ary Lane HospitalW
inchester HospitalNewton-W
ellesley HospitalCooley Dickinson Hospital
Nantucket Cottage Hospital
Lahey Hospital & Medical Center
Baystate Medical Center
Saint Vincent HospitalM
ount Auburn HospitalSteward Carney Hospital
Steward St. Elizabeth's Medical Center
Berkshire Medical Center
Cambridge Health Alliance
Brigham and W
omen's Faulkner Hospital
Beth Israel Deaconess Medical Center
Tufts Medical Center
UMass M
emorial M
edical CenterM
assachusetts General HospitalBoston M
edical CenterBrigham
and Wom
en's Hospital$1,079,265,354
$408,687,408 $1,215,902,669
$654,477,468 $381,482,202 $639,079,210
$83,955,736 $127,099,971 $154,882,603 $194,736,786
$41,253,761 $145,523,543 $241,402,959 $557,938,999 $369,197,258
$3,961,100 $60,438,524
$182,177,391 $116,065,892
$5,845,983 $109,881,593 $244,703,356
$67,220,315 $92,087,051 $39,492,744 $72,427,729 $16,623,978
$173,646,770 $46,946,248
$12,948,733 $19,851,088
$6,375,983 $201,150,512
$38,382,719 $8,317,170
$95,740,882 $197,199,541
$76,591,599 $48,571,076 $82,681,231 $31,778,908 $65,133,363 $22,094,768
$134,531,714 $132,003,171
$14,788,697 $361,262,006
$46,597,752 $87,842,942 $23,917,013
$178,364,995 $110,358,712
$87,419,451 $46,302,181 $26,139,932 $22,054,852 $32,282,884 $20,452,990 $53,595,693
$8,793,565 $22,275,253
$597,540,043 $30,740,455 $19,135,484
$157,948,031
Academic Medical Centers
Teaching Hospitals
Community Hospitals
Community-DSH Hospitals
Specialty Hospitals
FY14 Inpatient Revenue
FY14 Inpatient Full Cost per CM
AD*
$27,933
$7,744

Massachusetts Hospital Profiles - CHARTBOOK - Data through Fiscal Year 2014 center for health information and analysis 16
Growth in Outpatient Revenue, FY2010-FY2014
-6
-4
-2
0
2
4
6
8
10
12
Statewide*Community-DSH
Community
Teaching
FY14FY13FY12FY11FY10
8.1%8.3%
2.6%
9.2%10.3% Academic Medical Center
Data Source: Hospital 403 Cost Reports* Statewide excludes Shriners Hospitals for Children and acute care Kindred hospitals.
Academic medical centers had the highest growth in outpatient revenue from FY2010 to FY2014.

Massachusetts Hospital Profiles - CHARTBOOK - Data through Fiscal Year 2014 center for health information and analysis 17
Surplus by Cohort
0
$100
$200
$300
$400
$500
$600
Academic Medical Center
FY14FY13FY12FY11FY10
Tota
l Sur
plus
(mill
ions
)
Community-DSH
Community
$510M
$250M
$79M
$296M Teaching
Data Source: Hospital Standardized Financial Statements
Academic medical centers collectively had the largest surplus in absolute dollars every year from FY2010 to FY2014.

Massachusetts Hospital Profiles - CHARTBOOK - Data through Fiscal Year 2014 center for health information and analysis 18
Median Operating Margin
0
2%
3%
4%
5%
6%
FY14FY13FY12FY11FY10
1.3%
4.5%
2.6%
5.6%
Med
ian
Oper
atin
g M
argi
n
1%
Academic Medical Center
Community-DSH
Community
Teaching
Data Source: Hospital Standardized Financial Statements
All cohorts have had positive median operating margins since FY2010. Teaching hospitals tended to have the highest median operating margin over this period, including a 5.6% median operating margin in FY2014.

Massachusetts Hospital Profiles - CHARTBOOK - Data through Fiscal Year 2014 center for health information and analysis 19
Median Total Margin
0
2%
4%
6%
8%
10%
5.3%
2.9%
8.2%
4.7%
FY14FY13FY12FY11FY10
Med
ian T
otal
Mar
gin
Academic Medical CenterCommunity-DSH
Community
Teaching
Data Source: Hospital Standardized Financial Statements
Teaching hospitals had the highest median total margin in FY2014, at 8.2%.


Ai
Steward Health Care System ..................................................................................................... page A4 Steward St. Elizabeth’s Medical Center ...............C15 Steward Good Samaritan Medical Center ...........C55 Steward Saint Anne’s Hospital ............................C58 Steward Holy Family Hospital ..............................C56 Steward Norwood Hospital .................................C57 Morton Hospital ..................................................C49 Steward Carney Hospital ....................................C14 Quincy Medical Center ........................................C52 Merrimack Valley Hospital ...................................C48 Nashoba Valley Medical Center ...........................C50
This section provides an overview of multi-acute hospital systems in Massachusetts (“system profiles”). Multi-acute hospital systems play a central role in the Massachusetts health care environment, accounting for the majority of acute hospitals statewide. In FY14, there were twelve1 multi-acute hospital systems that encompassed 47 of the state’s 67 acute hospitals.2 The information presented in the system profiles is based primarily on financial data. Each profile includes measures that highlight financial performance, organizational structure, and relative size of each component entity within the system.See below for an index of the systems as well as their acute and non-acute hospitals. Non-acute hospitals are included for reference only. Hospitals are listed according to their size within their systems.
Partners HealthCare System ....................................................................................................... page A1 Massachusetts General Hospital .........................C4 Brigham and Women’s Hospital ...........................C3 North Shore Medical Center ..............................C51 Newton-Wellesley Hospital ................................C26 Brigham and Women’s Faulkner Hospital ............C9 Martha’s Vineyard Hospital ................................C46 Cooley Dickinson Hospital .................................C20 Nantucket Cottage Hospital ..............................C25
McLean Hospital ............................................D1Spaulding Rehabilitation Hospital ...................D2Spaulding Hospital Cambridge .......................D3Spaulding North Shore...................................D3Spaulding Rehabilitation Hospital of Cape Cod ...D2
CareGroup ................................................................................................................................ page A2 Beth Israel Deaconess Medical Center ..................C1 Mount Auburn Hospital .......................................C12 New England Baptist Hospital ............................C65 Beth Israel Deaconess Hospital — Milton ...........C18 Beth Israel Deaconess Hospital — Needham ......C19 Beth Israel Deaconess Hospital — Plymouth ......C34
UMass Memorial Health Care………..……………… .....................................................................page A3 UMass Memorial Medical Center ...........................C6 HealthAlliance Hospital ........................................C41 Marlborough Hospital… ......................................C45 Clinton Hospital ...................................................C36
New England Sinai Hospital ..........................D3
1 Kindred Healthcare, Inc., Tenet Healthcare Corporation, and Shriners Hospitals for Children are multi-state health systems with a large presence outside of Massachusetts. Each owns two acute hospitals in Massachusetts (Kindred owns Kindred Hospital – Boston and Kindred Hospital – Boston North Shore; Tenet owns MetroWest Medical Center and Saint Vincent Hospital; Shriners owns Shriners Hospitals for Children – Boston and Shriners Hospitals for Children - Springfield). Due to their broad presence outside of Massachusetts, CHIA did not include Kindred, Tenet, or Shriners in the multi-acute hospital system profiles chapter.
2 Refer to the “Subsequent Events” section (Exhibit A) of the technical appendix for additional information on the number of hospitals in Massachusetts, as there have been several changes during FY15.
Massachusetts Hospital Profiles - Data through Fiscal Year 2014 center for health information and analysis
INTRODUCTION TO MULTI-ACUTE HOSPITAL SYSTEMS

Aii
Baystate Health ......................................................................................................................... page A5 Baystate Medical Center .......................................C7 Baystate Franklin Medical Center ........................C31 Baystate Mary Lane Hospital ...............................C17 Baystate Wing Hospital .......................................C33
Cape Cod Healthcare ................................................................................................................ page A7 Cape Cod Hospital. .............................................C35 Falmouth Hospital… ............................................C38
Berkshire Health Systems ......................................................................................................... page A8 Berkshire Medical Center .......................................C8 Fairview Hospital .................................................C37
Lahey Health System ................................................................................................................ page A6 Lahey Hospital & Medical Center. ....................... C11 Northeast Hospital .............................................. C27 Winchester Hospital ........................................... C29
Heywood Healthcare ................................................................................................................. page A9 Heywood Hospital ................................................C41 Athol Hospital .......................................................C30
center for health information and analysis Massachusetts Hospital Profiles - Data through Fiscal Year 2014

Newton- Wellesley
$421M $172M
North Shore
$414M $18M
Other Organizations OO
Health Plans HP Physician Organizations PO Non-Acute Hospitals NH Acute Hospitals AH
% of System’s Operating Revenue: < 10% 10-20% > 20%
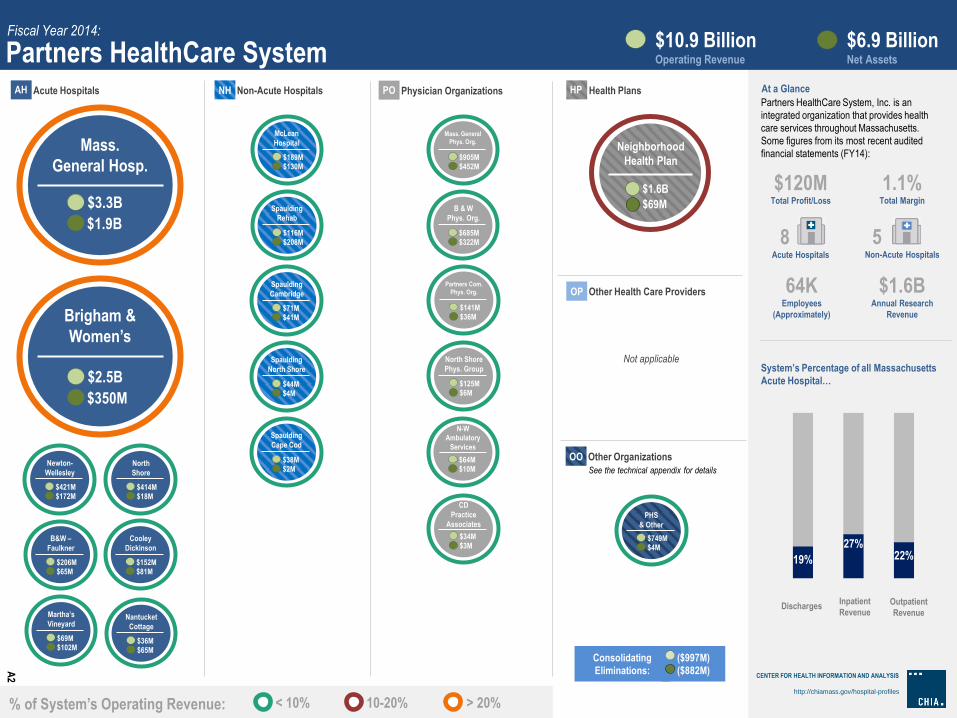
Partners HealthCare System, Inc. (Partners) is an integrated organization that provides health care services throughout Massachusetts. Some figures from its most recent audited financial statements (FY14):
$120M Total Profit/Loss
1.1% Total Margin
64K Employees
(Approximately)
$1.6B Annual Research
Revenue
8 Acute Hospitals
5 Non-Acute Hospitals
Partners HealthCare System $10.9 Billion Operating Revenue
$6.9 Billion Net Assets
Other Health Care Providers OP
Mass. General Hosp.
$3.3B $1.9B
$2.5B $350M
Neighborhood Health Plan
$1.6B $69M
Fiscal Year 2014:
See Technical Appendix for details
Consolidating Eliminations:
($997M) ($882M)
At a Glance
System’s Percentage of all Massachusetts Acute Hospital…
Inpatient Revenue
Outpatient Revenue
Discharges
McLean Hospital
$189M $130M
Spaulding Rehab
$116M $208M
Spaulding Cambridge
$71M $41M
Spaulding North Shore
$44M $4M
Spaulding Cape Cod
$38M $2M
Mass. General Phys. Org.
$905M $452M
B & W Phys. Org.
$685M $322M
North Shore Phys. Group
$125M $6M
Partners Com. Phys. Org.
$141M $36M
PHS & Other
$749M $4M
B&W – Faulkner
$206M $65M
Martha’s Vineyard
$69M $102M
Cooley Dickinson
$152M $81M
Nantucket Cottage
$36M $65M
Not applicable
Brigham & Women’s
CENTER FOR HEALTH INFORMATION AND ANALYSIS
http://chiamass.gov/hospital-profiles
N-W Ambulatory
Services
$64M $10M
CD Practice
Associates
$34M $3M
19% 27%
22%
A2
Descriptive metrics
Financial indicators of system affiliate Operating revenue and net assets of the entity within the system.
Measuring year The system’s fiscal year for the data on this page.
Size of system Operating revenue is a financial measure of an organization’s size.
System’s financial stabilityNet assets is a measure of an organization’s financial stability.
Proportion of operating revenue Circle size and the color of the band are based on the entity’s proportion of the system’s total operating revenue.
Consolidating eliminationsIntercompany transactions that are eliminated during the financial consolidation process.
Share of patient discharges and revenueBars show the system’s proportion of total acute hospital inpatient discharges, inpatient revenue, and outpatient revenue in Massachusetts.Note that outpatient visits are not represented in this chart. See the technical appendix for more information.
Massachusetts Hospital Profiles - Data through Fiscal Year 2014 center for health information and analysis Aiii
This sheet provides a brief introduction to the metrics on the multi-acute hospital system profiles. Definitions and notes on all metrics are available in the technical appendix.
HOW TO READ MULTI-ACUTE HOSPITAL SYSTEM PROFILES – FISCAL YEAR 2014


Partners HealthCare
System
CareGroup
UMass Memorial
Health Care
Steward Health
Care System
Baystate Health
Lahey Health
System
Cape Cod
Healthcare
Berkshire
Health Systems
Heywood Healthcare
Health System Profiles: Comparative Overview Circle areas are scaled based on system operating revenue
A1
Newton-
Wellesley
$421M $172M
North
Shore
$414M $18M
Other Organizations OO
Health Plans HP Physician Organizations PO Non-Acute Hospitals NH Acute Hospitals AH
% of System’s Operating Revenue: < 10% 10-20% > 20%
Partners HealthCare System, Inc. is an
integrated organization that provides health
care services throughout Massachusetts.
Some figures from its most recent audited
financial statements (FY14):
$120M Total Profit/Loss
1.1% Total Margin
64K Employees
(Approximately)
$1.6B Annual Research
Revenue
8 Acute Hospitals
5 Non-Acute Hospitals
Partners HealthCare System $10.9 Billion Operating Revenue
$6.9 Billion Net Assets
Other Health Care Providers OP
Mass.
General Hosp.
$3.3B
$1.9B
$2.5B
$350M
Neighborhood
Health Plan
$1.6B
$69M
Fiscal Year 2014:
See the technical appendix for details
Consolidating
Eliminations:
($997M)
($882M)
At a Glance
System’s Percentage of all Massachusetts
Acute Hospital…
Inpatient
Revenue Outpatient
Revenue Discharges
McLean
Hospital
$189M $130M
Spaulding
Rehab
$116M $208M
Spaulding
Cambridge
$71M $41M
Spaulding
North Shore
$44M $4M
Spaulding
Cape Cod
$38M $2M
PHS
& Other
$749M $4M
B&W –
Faulkner
$206M $65M
Martha’s
Vineyard
$69M $102M
Cooley
Dickinson
$152M $81M
Nantucket
Cottage
$36M $65M
Not applicable
Brigham &
Women’s
CENTER FOR HEALTH INFORMATION AND ANALYSIS
http://chiamass.gov/hospital-profiles
19%
27% 22%
A2
Mass. General
Phys. Org.
$905M $452M
B & W
Phys. Org.
$685M $322M
North Shore
Phys. Group
$125M $6M
Partners Com.
Phys. Org.
$141M $36M
N-W
Ambulatory
Services
$64M $10M
CD
Practice
Associates
$34M $3M

Other Organizations OO
Health Plans HP Physician Organizations* PO Non-Acute Hospitals NH Acute Hospitals* AH
CareGroup, Inc. is a corporate entity that
controls several regional teaching and
community hospitals and physician groups.
Some figures from its most recent audited
financial statements (FY14):
$161M Total Profit/Loss
5.6% Total Margin
14K Employees
(Approximately)
6 Acute Hospitals
Other Health Care Providers OP
Not applicable
See the technical appendix for details
Consolidating
Eliminations:
($217M)
($0M)
Inpatient
Revenue Outpatient
Revenue Discharges
% of System’s Operating Revenue: < 10% 10-20% > 20%
Not applicable
CareGroup $2.7 Billion Operating Revenue
$1.7 Billion Net Assets
Fiscal Year 2014:
At a Glance
System’s Percentage of all Massachusetts
Acute Hospital…
Beth Israel
Deaconess Med.
Center (BIDMC)
$1.4B
$908M
Mt. Auburn
Hospital
$322M
$268M
Harvard Med.
Faculty Physicians
$489M
$182M
Affiliated
Physicians
Group
$73M $0
Mt. Auburn
Professional
Services
$67M $17M
Jordan
Physician
Associates
$19M $2M
CareGroup
& Other
$20M $25M
Not applicable
NE Baptist
Hospital
$236M $126M
BIDH –
Plymouth
$192M $79M
BIDH –
Milton
$83M $75M
CENTER FOR HEALTH INFORMATION AND ANALYSIS
http://chiamass.gov/hospital-profiles
BIDH –
Needham
$70M $38M
NE Baptist
Med. Associates
$12M $1M
Community
Physicians
Associates
$2M ($2M)
9% 10% 8%
*The totals presented here represent all of FY14 for BIDH-Plymouth, Inc. and Affiliates (formerly Jordan Health Systems, Inc.
and Affiliates), including amounts from October 1 through December 31, 2013, which is prior to its January 1, 2014 affiliation
with BIDMC.
A3

Other Organizations OO
Health Plans HP Physician Organizations PO Non-Acute Hospitals NH Acute Hospitals AH
UMass Memorial Health Care, Inc. is an
integrated organization that provides health
care services throughout Massachusetts.
Some figures from its most recent audited
financial statements (FY14):
$61M Total Profit/Loss
2.7% Total Margin
12K Employees
(Approximately)
4 Acute Hospitals
1 Rehabilitation
Hospital
Inpatient
Revenue Outpatient
Revenue Discharges
Other Health Care Providers OP
Fairlawn Rehabilitation
Hospital*
*In June 2014, UMass reduced its 50 percent interest in Fairlawn Rehabilitation Hospital to 20 percent.
See the technical appendix for details
Consolidating
Eliminations:
($340M)
($65M)
% of System’s Operating Revenue: < 10% 10-20% > 20%
UMass Memorial Health Care $2.3 Billion Operating Revenue
$879 Million Net Assets
Fiscal Year 2014:
At a Glance
System’s Percentage of all Massachusetts
Acute Hospital…
UMass
Memorial
$1.5B
$298M
Medical Group
$472M
$73M
Health Ventures
& Other
$266M
$362M
Behavioral
Health Systems
$66M $8M
Not applicable
HealthAlliance
Hospital
$160M $153M
Marlborough
Hospital
$80M $29M
Clinton
Hospital
$27M $19M
CENTER FOR HEALTH INFORMATION AND ANALYSIS
http://chiamass.gov/hospital-profiles
HealthAlliance
Home Health
and Hospice
$9M $2M
Coordinated
Primary Care
$0 $0
7% 7% 7%
A4
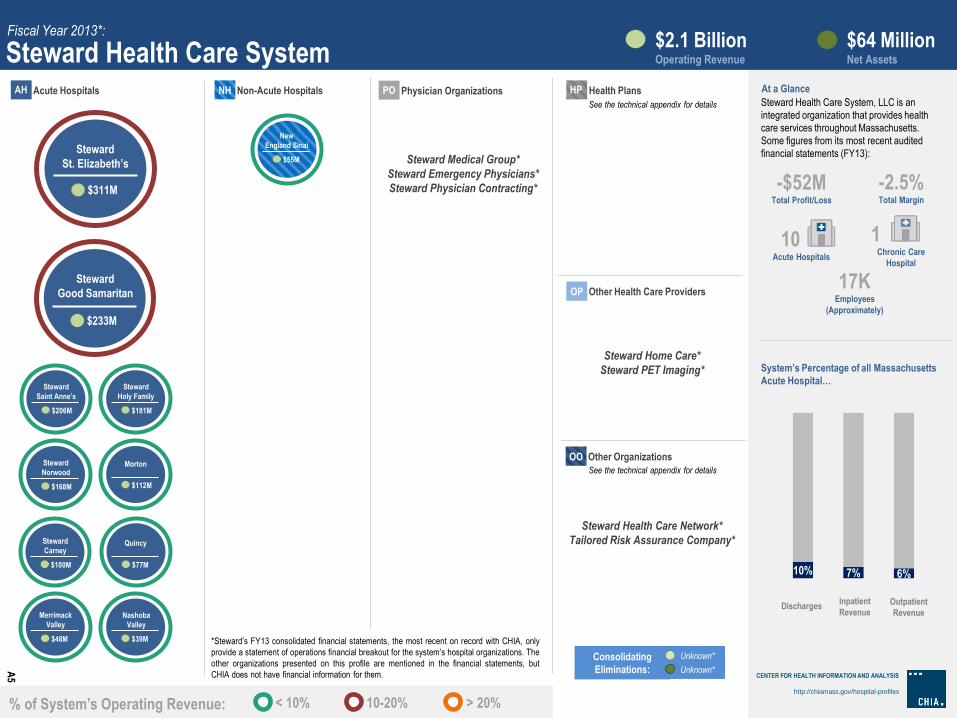
Unknown*
Unknown*
Other Organizations OO
Health Plans HP Physician Organizations PO Non-Acute Hospitals NH Acute Hospitals AH
Other Health Care Providers OP
10% 7% 6%
Steward Medical Group*
Steward Emergency Physicians*
Steward Physician Contracting*
Steward Home Care*
Steward PET Imaging*
Steward Health Care Network*
Tailored Risk Assurance Company*
See the technical appendix for details
Consolidating
Eliminations:
Inpatient
Revenue Outpatient
Revenue Discharges
% of System’s Operating Revenue: < 10% 10-20% > 20%
*Steward’s FY13 consolidated financial statements, the most recent on record with CHIA, only
provide a statement of operations financial breakout for the system’s hospital organizations. The
other organizations presented on this profile are mentioned in the financial statements, but
CHIA does not have financial information for them.
Steward Health Care System, LLC is an
integrated organization that provides health
care services throughout Massachusetts.
Some figures from its most recent audited
financial statements (FY13):
Steward Health Care System $2.1 Billion Operating Revenue
$64 Million Net Assets
Fiscal Year 2013*:
At a Glance
System’s Percentage of all Massachusetts
Acute Hospital…
New
England Sinai
$55M Steward
St. Elizabeth’s
$311M
Steward
Good Samaritan
$233M
Steward
Saint Anne’s
$206M
Steward
Holy Family
$181M
-$52M Total Profit/Loss
-2.5% Total Margin
17K Employees
(Approximately)
10 Acute Hospitals
1 Chronic Care
Hospital
See the technical appendix for details
CENTER FOR HEALTH INFORMATION AND ANALYSIS
http://chiamass.gov/hospital-profiles
Steward
Norwood
$168M
Morton
$112M
Steward
Carney
$100M
Quincy
$77M
Merrimack
Valley
$48M
Nashoba
Valley
$39M
A5
Other Organizations OO
Health Plans HP Physician Organizations PO Non-Acute Hospitals NH Acute Hospitals AH
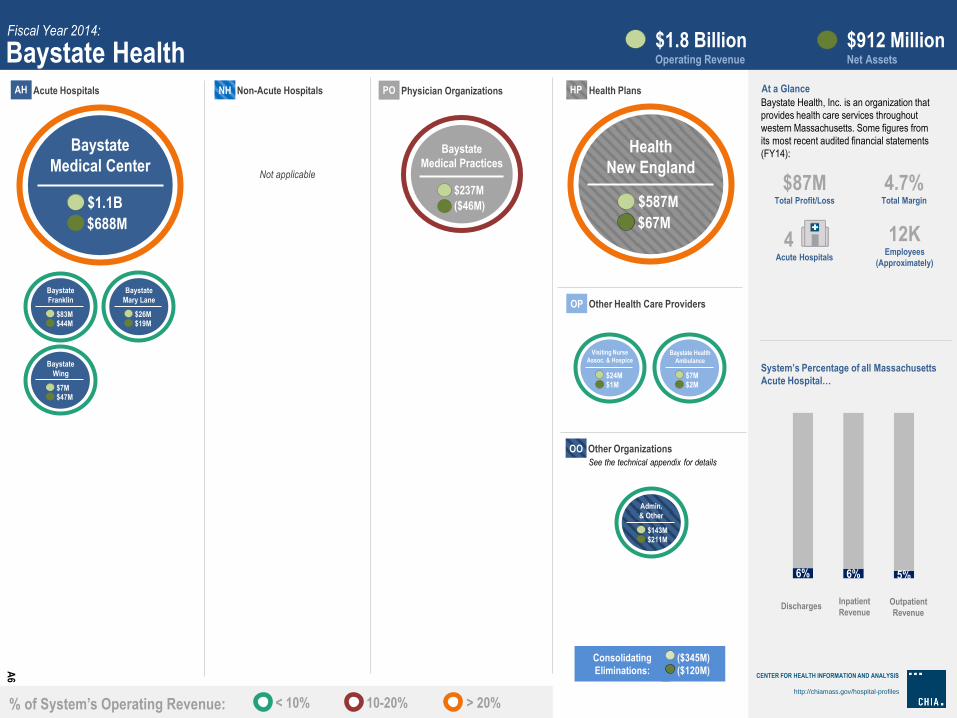
Baystate Health, Inc. is an organization that
provides health care services throughout
western Massachusetts. Some figures from
its most recent audited financial statements
(FY14):
$87M Total Profit/Loss
4.7% Total Margin
12K Employees
(Approximately)
4 Acute Hospitals
Other Health Care Providers OP
See the technical appendix for details
Consolidating
Eliminations:
($345M)
($120M)
Inpatient
Revenue Outpatient
Revenue Discharges
% of System’s Operating Revenue: < 10% 10-20% > 20%
Baystate Health $1.8 Billion Operating Revenue
$912 Million Net Assets
Fiscal Year 2014:
At a Glance
System’s Percentage of all Massachusetts
Acute Hospital…
Baystate
Medical Center
$1.1B
$688M
Baystate
Franklin
$83M $44M
Baystate
Mary Lane
$26M $19M
Not applicable
Baystate
Medical Practices
$237M
($46M)
Health
New England
$587M
$67M
Admin.
& Other
$143M $211M
Visiting Nurse
Assoc. & Hospice
$24M $1M
Baystate Health
Ambulance
$7M $2M
6% 6% 5%
CENTER FOR HEALTH INFORMATION AND ANALYSIS
http://chiamass.gov/hospital-profiles
Baystate
Wing
$7M $47M
A6

Other Organizations OO
Health Plans HP Physician Organizations PO Non-Acute Hospitals NH Acute Hospitals AH
Lahey Health System, Inc. is an integrated
health care system acting as the parent
organization of Lahey Affiliates; Lahey Clinic
Foundation, Inc. and Affiliates; Northeast
Hospital Corp. and Affiliate; and Winchester
Healthcare Management, Inc. and Affiliates.
Some figures from its most recent audited
financial statements (FY14):
$286M Total Profit/Loss
15.5% Total Margin
14K Employees
(Approximately)
3 Acute Hospitals
See the technical appendix for details
Consolidating
Eliminations:
($62M)
($20M)
Inpatient
Revenue Outpatient
Revenue Discharges
Other Health Care Providers OP
% of System’s Operating Revenue: < 10% 10-20% > 20%
Lahey Health System $1.6 Billion Operating Revenue
$1.1 Billion Net Assets
Fiscal Year 2014:
At a Glance
System’s Percentage of all Massachusetts
Acute Hospital…
Lahey Hospital
& Medical Center
$821M
$158M
$333M
$209M
Not applicable
Lahey Clinic
$267M
$94M
Northeast
Medical Practice
$14M ($11M)
Not applicable
NE Beh.
Health Corp.
$87M $15M
NE Senior
Health Corp.
$22M $2M
Seacoast
Nursing & Rehab.
Center
$13M $3M
Shared
Services
& Other
$33M $438M
Northeast
Hospital Corp.
CENTER FOR HEALTH INFORMATION AND ANALYSIS
http://chiamass.gov/hospital-profiles
Winchester
Hospital
$68M $253M
Winchester
Physician Assoc.
$13M $2M
7% 6% 6%
A7

$16M $13M
Other Organizations OO
Health Plans HP Physician Organizations PO Non-Acute Hospitals NH Acute Hospitals AH
Cape Cod Healthcare, Inc. provides health
care services in Cape Cod, Massachusetts.
Some figures from its most recent audited
financial statements (FY14):
$35M Total Profit/Loss
4.8% Total Margin
5K Employees
(Approximately)
2 Acute Hospitals
Other Health Care Providers OP
3% 2% 3%
See the technical appendix for details
Consolidating
Eliminations:
($65M)
($173M)
Inpatient
Revenue Outpatient
Revenue Discharges
% of System’s Operating Revenue: < 10% 10-20% > 20%
Cape Cod Healthcare $730 Million Operating Revenue
$535 Million Net Assets
Fiscal Year 2014:
At a Glance
System’s Percentage of all Massachusetts
Acute Hospital…
Cape Cod
Hospital
$447M
$278M
Falmouth
Hospital
$154M
$181M
Not applicable Not applicable Med. Affiliates
of Cape Cod
$58M $19M
$4M $12M
JML
Care Center
Falmouth
Assisted Living
$49M $22M
Cape & Islands
Health Services
$9M $0.4M
VNA of
Cape Cod
CENTER FOR HEALTH INFORMATION AND ANALYSIS
http://chiamass.gov/hospital-profiles
$3M $0
Cape Cod
Human Services
A8
CCHC
& Other
$55M $182M
Other Organizations OO
Health Plans HP Physician Organizations PO Non-Acute Hospitals NH Acute Hospitals AH
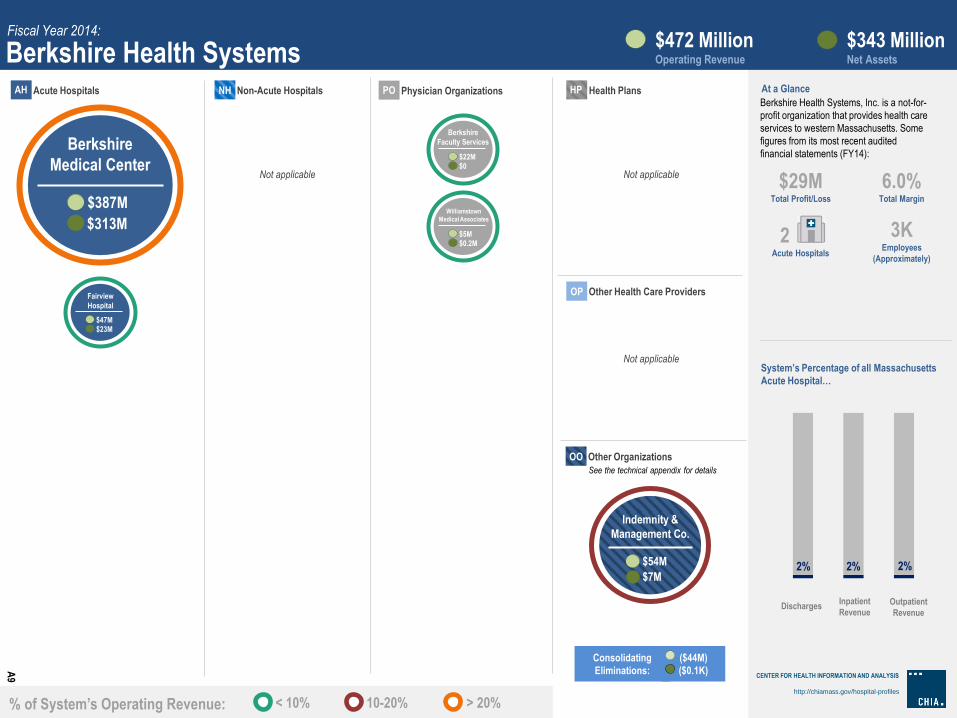
Berkshire Health Systems, Inc. is a not-for-
profit organization that provides health care
services to western Massachusetts. Some
figures from its most recent audited
financial statements (FY14):
$29M Total Profit/Loss
6.0% Total Margin
3K Employees
(Approximately)
2 Acute Hospitals
Other Health Care Providers OP
2% 2% 2%
See the technical appendix for details
Consolidating
Eliminations:
($44M)
($0.1K)
Inpatient
Revenue Outpatient
Revenue Discharges
% of System’s Operating Revenue: < 10% 10-20% > 20%
Berkshire Health Systems $472 Million Operating Revenue
$343 Million Net Assets
Fiscal Year 2014:
At a Glance
System’s Percentage of all Massachusetts
Acute Hospital…
$387M
$313M
Berkshire
Faculty Services
$22M $0
Williamstown
Medical Associates
$5M $0.2M
Indemnity &
Management Co.
$54M
$7M
Berkshire
Medical Center
CENTER FOR HEALTH INFORMATION AND ANALYSIS
http://chiamass.gov/hospital-profiles
Fairview
Hospital
$47M $23M
Not applicable
Not applicable Not applicable
A9

Other Organizations OO
Health Plans HP Physician Organizations PO Non-Acute Hospitals NH Acute Hospitals AH
Heywood Healthcare, Inc. operates two not-
for-profit acute care hospitals in central
Massachusetts. Some figures from its most
recent audited financial statements (FY14):
$3M Total Profit/Loss
2.6% Total Margin
1K Employees
(Approximately)
2 Acute Hospitals
Other Health Care Providers OP
See the technical appendix for details
Consolidating
Eliminations:
($3M)
$0
Inpatient
Revenue Outpatient
Revenue Discharges
% of System’s Operating Revenue: < 10% 10-20% > 20%
Heywood Healthcare $132 Million Operating Revenue
$59 Million Net Assets
Fiscal Year 2014:
At a Glance
System’s Percentage of all Massachusetts
Acute Hospital…
$102M
$53M
Athol
Hospital
$23M
$4M
Heywood
Medical Group
$10M ($1M)
Heywood
Hospital Realty
$1M $3M
Heywood
Hospital
CENTER FOR HEALTH INFORMATION AND ANALYSIS
http://chiamass.gov/hospital-profiles
0.7% 0.4% 0.7%
Not applicable
Not applicable Not applicable
A10


Bi
Acute hospitals are grouped into cohorts of similar hospitals, as follows:
Academic Medical Centers (AMCs) are a subset of teaching hospitals. AMCs are characterized by extensive research and teaching programs, comprehensive resources for tertiary and quaternary care, being principal teaching hospitals for their respective medical schools, and being full service hospitals with case mix intensity greater than 5% above the statewide average.
AMC Cohort
Beth Israel Deaconess Medical Center Massachusetts General Hospital Boston Medical Center Tufts Medical Center Brigham and Women’s Hospital UMass Memorial Medical Center
Teaching hospitals are hospitals that report at least 25 full-time equivalent medical school residents per one hundred inpatient beds in accordance with the Medicare Payment Advisory Commission (MedPAC) and are not classified as AMCs.
Teaching Hospital Cohort Baystate Medical Center Mount Auburn Hospital Berkshire Medical Center Saint Vincent Hospital Brigham and Women’s Faulkner Hospital Steward Carney Hospital Cambridge Health Alliance Steward St. Elizabeth’s Medical Center Lahey Hospital & Medical Center
Community hospitals are hospitals that do not meet the MedPAC definition to be classified as teaching hospitals and have a public payer mix of less than 63%.
Community Hospital Cohort Anna Jaques Hospital MetroWest Medical Center Baystate Mary Lane Hospital Milford Regional Medical Center Beth Israel Deaconess Hospital — Milton Nantucket Cottage Hospital Beth Israel Deaconess Hospital — Needham Newton-Wellesley Hospital Cooley Dickinson Hospital Northeast Hospital Emerson Hospital South Shore Hospital Hallmark Health Winchester Hospital
Massachusetts Hospital Profiles - Data through Fiscal Year 2014 center for health information and analysis
INTRODUCTION TO ACUTE HOSPITAL COHORTS

Bii
Community-Disproportionate Share Hospitals (DSH) are community hospitals that are disproportionately reliant upon public revenue by virtue of a public payer mix of 63% or greater. Public payers include Medicare, MassHealth, and other government payers, including ConnectorCare and the Health Safety Net.
center for health information and analysis Massachusetts Hospital Profiles - Data through Fiscal Year 2014
Community-DSH Cohort Athol HospitalBaystate Franklin Medical CenterBaystate Noble HospitalBaystate Wing HospitalBeth Israel Deaconess Hospital – Plymouth Cape Cod HospitalClinton HospitalFairview HospitalFalmouth HospitalHarrington Memorial Hospital HealthAlliance Hospital Heywood Hospital Holyoke Medical Center Lawrence General HospitalLowell General Hospital
Specialty hospitals are not included in any cohort comparison analysis due to the unique patient populations they serve and/or the unique sets of services they provide. Specialty hospitals may be included in statewide analyses.
Marlborough HospitalMartha’s Vineyard HospitalMercy Medical CenterMerrimack Valley HospitalMorton HospitalNashoba Valley Medical CenterNorth Shore Medical CenterQuincy Medical CenterSignature Healthcare Brockton HospitalSouthcoast Hospitals GroupSteward Good Samaritan Medical CenterSteward Holy Family HospitalSteward Norwood HospitalSteward Saint Anne’s HospitalSturdy Memorial Hospital
Specialty Hospitals Boston Children’s Hospital Dana-Farber Cancer InstituteKindred Hospital — BostonKindred Hospital — Boston North Shore
For detailed descriptions of the data sources and metrics used in the acute hospital cohort profile, please see the technical appendix.
Massachusetts Eye and Ear InfirmaryNew England Baptist HospitalShriners Hospitals for Children — Boston Shriners Hospitals for Children — Springfield
TOTAL STAFFED BEDSMEDIAN % OCCUPANCYTOTAL DISCHARGESEMERGENCY DEPARTMENT VISITSAVG. COMMERCIAL PAYER PRICE LEVELAVG. PUBLIC PAYER MIXTOTAL REVENUE IN FY14 (in millions)INPATIENT:OUTPATIENT REVENUE IN FY14ADJUSTED COST PER DISCHARGE
For descriptions of the metrics, please see the technical appendix.
$9,739
$2,914
$10,972
2,54060.6%
141,874
2,55171.3%
145,5921,377,765
44th68.6%$5,381
35%:65%
There were six academic medical centers (AMCs) in FY14, nine teaching hospitals, fourteen community hospitals, and twenty-nine community-Disproportionate Share Hospitals (DSH). Teaching hospitals are training institutions with at least twenty-five full-time equivalent medical school residents per one hundred inpatient beds. AMCs are characterized by more extensive research and teaching programs than teaching hospitals, as well as significant capacity for highly specialized and complex care (i.e., tertiary and quaternary). Community hospitals are hospitals that are not characterized as specialty, teaching, or AMCs. Community-DSH hospitals are a subset of community hospitals that receive 63% or more of their business from Medicare, Medicaid, and other government programs.
Comm.-DSH4,73762.7%
258,382
CommunityTeaching
$12,37049%:51%$10,65861.0%
579,01145th
54.3%74th
507,308
33%:67%$10,155
496,87455th
65.4%$4,202
37%:63%
ACUTE HOSPITAL COHORTS2014 Hospital Profile
AMCs
What were the most common inpatient cases (DRGs) treated at acute hospitals statewide in FY14? What proportion of these types of cases did each cohort treat?
What was the severity distribution of inpatient cases statewide in FY14? What was the severity distribution of inpatient cases within each cohort in FY14?
What was each cohort's blended composite relative price percentile in calendar year 2014?
What was each cohort's payer mix in FY14? How does each cohort compare to the statewide payer mix?
219,45880.2%4,059
43% 37% 43% 41% 47%
20% 24% 22% 13%
22%
38% 39% 35% 46% 31%
At a
Glan
ce
Serv
ices
Seve
rity
AMC Teaching Community Comm.-DSH
0 10,000 20,000 30,000 40,000 50,000 60,000 70,000
Hip joint replacement (13,115)Cellulitis & other bacterial skin infections (13,643)
Chronic obstructive pulmonary disease (15,904)Knee joint replacement (16,100)
Other pneumonia (17,546)Heart failure (21,995)
Cesarean delivery (22,109)Septicemia & disseminated infections (26,573)
Vaginal delivery (46,897)Normal Neonate Birth (63,137)
Statewide Discharges
Discharge Type
44%
23%
18%
10% 4%
0%
20%
40%
60%
80%
100%
Total Statewide Discharges: 759,518
Least Severe
Most Severe
48%
51%
41%
36%
25%
22%
25%
21%
18%
19%
18%
18%
7%
7%
12%
16%
2%
1%
4%
10%
0% 20% 40% 60% 80% 100%
Comm.-DSH
Community
Teaching
AMC
CMI=0.81
CMI=0.88
CMI=1.05
CMI=1.36
Paye
r Mix
AMC Teaching Community Community -DSH
Statewide
DSH Threshold
Percentage calculations may not sum to 100% due to rounding
0th
25th
50th
75th
100th
Academic MedicalCenter
Teaching Hospital CommunityHospital
Community,DisproportionateShare Hospital
Most Severe Least Severe
Commercial & Other
State Programs
Medicare and Other Federal
Programs
Total statewide discharges include specialty hospitals
XX
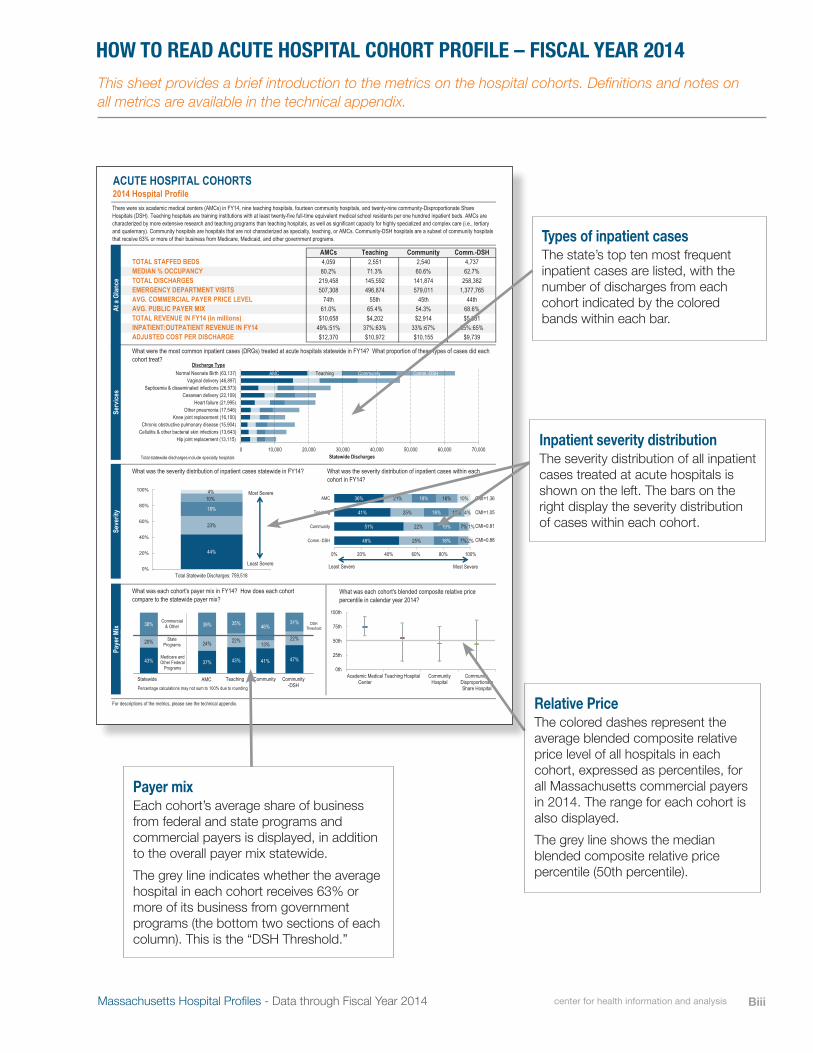
Inpatient severity distributionThe severity distribution of all inpatient cases treated at acute hospitals is shown on the left. The bars on the right display the severity distribution of cases within each cohort.
Massachusetts Hospital Profiles - Data through Fiscal Year 2014
Types of inpatient cases The state’s top ten most frequent inpatient cases are listed, with the number of discharges from each cohort indicated by the colored bands within each bar.
Relative Price The colored dashes represent the average blended composite relative price level of all hospitals in each cohort, expressed as percentiles, for all Massachusetts commercial payers in 2014. The range for each cohort is also displayed. The grey line shows the median blended composite relative price percentile (50th percentile).
Payer mix Each cohort’s average share of business from federal and state programs and commercial payers is displayed, in addition to the overall payer mix statewide. The grey line indicates whether the average hospital in each cohort receives 63% or more of its business from government programs (the bottom two sections of each column). This is the “DSH Threshold.”
This sheet provides a brief introduction to the metrics on the hospital cohorts. Definitions and notes on all metrics are available in the technical appendix.
HOW TO READ ACUTE HOSPITAL COHORT PROFILE – FISCAL YEAR 2014
center for health information and analysis Biii

For descriptions of the metrics, please see the technical appendix.*Disproportionate Share Hospitals (DSH) receive a minimum of 63% of gross patient service revenue from public payers.
*Costs were adjusted to exclude direct medical education costs and physician compensation.
ACUTE HOSPITAL COHORTS2014 Hospital Profile
Key:
Total Profit (Loss)
DSHComm.TeachingAMCCohort
Operating Revenue
Total Revenue
Total Costs
$ 85
$ 10,658
$ 10,148
$ 510 $ 296
$ 3,907
$ 4,202
$ 2,835
$ 5,304
$ 79 $ 250
$ 5,132
$ 5,381
$ 78
$ 2,890
$ 25
How has each cohort's volume of inpatient discharges changed compared to FY10? (FY10=0)
How has each cohort's median outpatient visits changed compared to FY10? (FY10=0)
How has each cohort's total outpatient revenue changed since FY10? (FY10=0)
What were each acute hospital cohort's median operating and total margin from FY10 to FY14?
$ 2,914
Revenue, Cost, & Profit (Loss) in millions
Non-Operating Revenue
$ 10,573
$ 61
$ 4,141
What were each cohort's aggregate revenue, cost, and profit (loss) in FY14?
How has each cohort's inpatient revenue per CMAD changed since FY10? (FY10=0)
4.6% 4.7% 5.3%
8.2%
1.7% 2.9% 2.8%
5.3%
0%
5%
10%
2010 2011 2012 2013 2014
Utiliz
atio
n
-9.0%
0.1%
-11.2%
-9.6%
-8.0%
-15%
-10%
-5%
0%
5%
2010 2011 2012 2013 2014
Patie
nt R
even
ue T
rend
s Fi
nanc
ial P
erfo
rman
ce
Total
3.8%
2.6% 3.2%
5.6%
2.1% 1.3% 1.5%
4.5%
0%
6%
Oper
ating
3.2%
6.0%
-1.5%
-3.6%
-0.3%
-10%
-5%
0%
5%
10%
2010 2011 2012 2013 2014
Community
AMC Teaching
Community-DSH Statewide
9.3%
-1.6%
14.0%
8.2% 7.8%
-10%
-5%
0%
5%
10%
15%
20%
2010 2011 2012 2013 2014
10.3%
8.1%
2.6%
8.3% 9.0%
-10%
-5%
0%
5%
10%
15%
20%
2010 2011 2012 2013 2014
November 2015
Change in volume of outpatient visits
Change in volume of inpatient discharges
Total and operating margin history
Change in inpatient severity-adjusted revenue per case (i.e., per capita)
FY14 financial information for each cohort
Change in total outpatient revenue(note: not per unit. This metric is influenced both by unit price and by volume changes.)
Massachusetts Hospital Profiles - Data through Fiscal Year 2014
These graphs compare trends among the cohorts. All trends in the first four graphs are anchored at 0 to emphasize recent changes. The labeled points are cumulative over the time period.
HOW TO READ ACUTE HOSPITAL COHORT PROFILE – FISCAL YEAR 2014
center for health information and analysisBiv

Massachusetts Hospital Profiles - Data through Fiscal Year 2014 center for health information and analysis Bv
TOTAL STAFFED BEDSMEDIAN % OCCUPANCYTOTAL DISCHARGESEMERGENCY DEPARTMENT VISITSAVG. COMMERCIAL PAYER PRICE LEVELAVG. PUBLIC PAYER MIXTOTAL REVENUE IN FY14 (in millions)INPATIENT:OUTPATIENT REVENUE IN FY14ADJUSTED COST PER DISCHARGE
For descriptions of the metrics, please see the technical appendix.
$9,739
$2,914
$10,972
2,54060.6%
141,874
2,55171.3%
145,5921,377,765
44th68.6%$5,381
35%:65%
There were six academic medical centers (AMCs) in FY14, nine teaching hospitals, fourteen community hospitals, and twenty-nine community-Disproportionate Share Hospitals (DSH). Teaching hospitals are training institutions with at least twenty-five full-time equivalent medical school residents per one hundred inpatient beds. AMCs are characterized by more extensive research and teaching programs than teaching hospitals, as well as significant capacity for highly specialized and complex care (i.e., tertiary and quaternary). Community hospitals are hospitals that are not characterized as specialty, teaching, or AMCs. Community-DSH hospitals are a subset of community hospitals that receive 63% or more of their business from Medicare, Medicaid, and other government programs.
Comm.-DSH4,73762.7%
258,382
CommunityTeaching
$12,37049%:51%$10,65861.0%
579,01145th
54.3%74th
507,308
33%:67%$10,155
496,87455th
65.4%$4,202
37%:63%
ACUTE HOSPITAL COHORTS2014 Hospital Profile
AMCs
What were the most common inpatient cases (DRGs) treated at acute hospitals statewide in FY14? What proportion of these types of cases did each cohort treat?
What was the severity distribution of inpatient cases statewide in FY14? What was the severity distribution of inpatient cases within each cohort in FY14?
What was each cohort's blended composite relative price percentile in calendar year 2014?
What was each cohort's payer mix in FY14? How does each cohort compare to the statewide payer mix?
219,45880.2%4,059
43% 37% 43% 41% 47%
20% 24% 22% 13%
22%
38% 39% 35% 46% 31%
At a
Glan
ce
Serv
ices
Seve
rity
AMC Teaching Community Comm.-DSH
0 10,000 20,000 30,000 40,000 50,000 60,000 70,000
Hip joint replacement (13,115)Cellulitis & other bacterial skin infections (13,643)
Chronic obstructive pulmonary disease (15,904)Knee joint replacement (16,100)
Other pneumonia (17,546)Heart failure (21,995)
Cesarean delivery (22,109)Septicemia & disseminated infections (26,573)
Vaginal delivery (46,897)Normal Neonate Birth (63,137)
Statewide Discharges
Discharge Type
44%
23%
18%
10% 4%
0%
20%
40%
60%
80%
100%
Total Statewide Discharges: 759,518
Least Severe
Most Severe
48%
51%
41%
36%
25%
22%
25%
21%
18%
19%
18%
18%
7%
7%
12%
16%
2%
1%
4%
10%
0% 20% 40% 60% 80% 100%
Comm.-DSH
Community
Teaching
AMC
CMI=0.81
CMI=0.88
CMI=1.05
CMI=1.36
Paye
r Mix
AMC Teaching Community Community -DSH
Statewide
DSH Threshold
Percentage calculations may not sum to 100% due to rounding
0th
25th
50th
75th
100th
Academic MedicalCenter
Teaching Hospital CommunityHospital
Community,DisproportionateShare Hospital
Most Severe Least Severe
Commercial & Other
State Programs
Medicare and Other Federal
Programs
Total statewide discharges include specialty hospitals
XX
What changed from Acute Hospital Cohort Profiles – Data through Fiscal Year 2013?
MASSACHUSETTS ACUTE HOSPITAL COHORT PROFILE – FISCAL YEAR 2014
CHIA is committed to ensuring that our customers receive quality content and service, and to help us do so, we surveyed stakeholders prior to planning this year’s publication. The Hospital Profiles – FY 2014 presentation was updated to focus on the metrics and formats most valuable to our stakeholders. In addition to an updated look, CHIA made the updates noted below to the Acute Hospital Cohort Profile template.
1. In place of individual profiles for each acute hospital cohort, CHIA created one profile that displays the performance of all four cohorts as well as statewide performance. Metrics remain consistent with those displayed on the cohort-level profiles in FY13.
2. The Growth Measures section was removed to provide space for an At a Glance section that allows readers to easily compare key demographic, utilization, cost, revenue, and financial information across cohorts.
For descriptions of the metrics, please see the technical appendix.*Disproportionate Share Hospitals (DSH) receive a minimum of 63% of gross patient service revenue from public payers.
*Costs were adjusted to exclude direct medical education costs and physician compensation.
ACUTE HOSPITAL COHORTS2014 Hospital Profile
Key:
Total Profit (Loss)
DSHComm.TeachingAMCCohort
Operating Revenue
Total Revenue
Total Costs
$ 85
$ 10,658
$ 10,148
$ 510 $ 296
$ 3,907
$ 4,202
$ 2,835
$ 5,304
$ 79 $ 250
$ 5,132
$ 5,381
$ 78
$ 2,890
$ 25
How has each cohort's volume of inpatient discharges changed compared to FY10? (FY10=0)
How has each cohort's median outpatient visits changed compared to FY10? (FY10=0)
How has each cohort's total outpatient revenue changed since FY10? (FY10=0)
What were each acute hospital cohort's median operating and total margin from FY10 to FY14?
$ 2,914
Revenue, Cost, & Profit (Loss) in millions
Non-Operating Revenue
$ 10,573
$ 61
$ 4,141
What were each cohort's aggregate revenue, cost, and profit (loss) in FY14?
How has each cohort's inpatient revenue per CMAD changed since FY10? (FY10=0)
4.6% 4.7% 5.3%
8.2%
1.7% 2.9% 2.8%
5.3%
0%
5%
10%
2010 2011 2012 2013 2014
Utiliz
atio
n
-9.0%
0.1%
-11.2%
-9.6%
-8.0%
-15%
-10%
-5%
0%
5%
2010 2011 2012 2013 2014
Patie
nt R
even
ue T
rend
s Fi
nanc
ial P
erfo
rman
ce
Total
3.8%
2.6% 3.2%
5.6%
2.1% 1.3% 1.5%
4.5%
0%
6%
Oper
ating
3.2%
6.0%
-1.5%
-3.6%
-0.3%
-10%
-5%
0%
5%
10%
2010 2011 2012 2013 2014
Community
AMC Teaching
Community-DSH Statewide
9.3%
-1.6%
14.0%
8.2% 7.8%
-10%
-5%
0%
5%
10%
15%
20%
2010 2011 2012 2013 2014
10.3%
8.1%
2.6%
8.3% 9.0%
-10%
-5%
0%
5%
10%
15%
20%
2010 2011 2012 2013 2014
November 2015


TOTAL STAFFED BEDSMEDIAN % OCCUPANCYTOTAL DISCHARGESEMERGENCY DEPARTMENT VISITSAVG. COMMERCIAL PAYER PRICE LEVELAVG. PUBLIC PAYER MIXTOTAL REVENUE IN FY14 (in millions)INPATIENT:OUTPATIENT REVENUE IN FY14MEDIAN ADJUSTED COST PER DISCHARGE
For descriptions of the metrics, please see the technical appendix.
$9,739
$2,914
$10,972
2,54060.6%
141,874
2,55171.3%
145,5921,377,765
44th68.6%$5,381
35%:65%
There were six academic medical centers (AMCs) in FY14, nine teaching hospitals, fourteen community hospitals, and thirty community-Disproportionate Share Hospitals (DSH). Teaching hospitals are training institutions with at least twenty-five full-time equivalent medical school residents per one hundred inpatient beds. AMCs are characterized by more extensive research and teaching programs than teaching hospitals, as well as significant capacity for highly specialized and complex care (i.e., tertiary and quaternary). Community hospitals are hospitals that are not characterized as specialty, teaching, or AMCs. Community-DSH hospitals are a subset of community hospitals that receive 63% or more of their business from Medicare, Medicaid, and other government programs.
Comm.-DSH4,73762.7%
258,382
CommunityTeaching
$12,37049%:51%$10,65861.0%
579,01145th
54.3%74th
507,308
33%:67%$10,155
496,87455th
65.4%$4,202
37%:63%
ACUTE HOSPITAL COHORTS2014 Hospital Profile
AMCs
What were the most common inpatient cases (DRGs) treated at acute hospitals statewide in FY14? What proportion of these types of cases did each cohort treat?
What was the severity distribution of inpatient cases statewide in FY14? What was the severity distribution of inpatient cases within each cohort in FY14?
What was each cohort's blended composite relative price percentile in calendar year 2014?
What was each cohort's payer mix in FY14? How does each cohort compare to the statewide payer mix?
219,45880.2%4,059
43% 37% 43% 41% 47%
20% 24% 22% 13%
22%
38% 39% 35% 46% 31%
At a
Glan
ce
Serv
ices
Seve
rity
AMC Teaching Community Comm.-DSH
0 10,000 20,000 30,000 40,000 50,000 60,000 70,000
Hip joint replacement (13,115)Cellulitis & other bacterial skin infections (13,643)
Chronic obstructive pulmonary disease (15,904)Knee joint replacement (16,100)
Other pneumonia (17,546)Heart failure (21,995)
Cesarean delivery (22,109)Septicemia & disseminated infections (26,573)
Vaginal delivery (46,897)Normal Neonate Birth (63,137)
Statewide Discharges
Discharge Type
44%
23%
18%
10% 4%
0%
20%
40%
60%
80%
100%
Total Statewide Discharges: 759,518
Least Severe
Most Severe
48%
51%
41%
36%
25%
22%
25%
21%
18%
19%
18%
18%
7%
7%
12%
16%
2%
1%
4%
10%
0% 20% 40% 60% 80% 100%
Comm.-DSH
Community
Teaching
AMC
CMI=0.81
CMI=0.88
CMI=1.05
CMI=1.36
Paye
r Mix
AMC Teaching Community Community -DSH
Statewide
DSH Threshold
Percentage calculations may not sum to 100% due to rounding
0th
25th
50th
75th
100th
Academic MedicalCenter
Teaching Hospital CommunityHospital
Community,DisproportionateShare Hospital
Most Severe Least Severe
Commercial & Other
State Programs
Medicare and Other Federal
Programs
Total statewide discharges include specialty hospitals
B1

For descriptions of the metrics, please see the technical appendix.*Disproportionate Share Hospitals (DSH) receive a minimum of 63% of gross patient service revenue from public payers.
*Costs were adjusted to exclude direct medical education costs and physician compensation.
ACUTE HOSPITAL COHORTS2014 Hospital Profile
Key:
Total Profit (Loss)
DSHComm.TeachingAMCCohort
Operating Revenue
Total Revenue
Total Costs
$ 85
$ 10,658
$ 10,148
$ 510 $ 296
$ 3,907
$ 4,202
$ 2,835
$ 5,304
$ 79 $ 250
$ 5,132
$ 5,381
$ 78
$ 2,890
$ 25
How has each cohort's volume of inpatient discharges changed compared to FY10? (FY10=0)
How has each cohort's median outpatient visits changed compared to FY10? (FY10=0)
How has each cohort's total outpatient revenue changed since FY10? (FY10=0)
What were each acute hospital cohort's median operating and total margin from FY10 to FY14?
$ 2,914
Revenue, Cost, & Profit (Loss) in millions
Non-Operating Revenue
$ 10,573
$ 61
$ 4,141
What were each cohort's aggregate revenue, cost, and profit (loss) in FY14?
How has each cohort's inpatient revenue per CMAD changed since FY10? (FY10=0)
4.6% 4.7% 5.3%
8.2%
1.7% 2.9% 2.8%
5.3%
0%
5%
10%
2010 2011 2012 2013 2014
Utiliz
atio
n
-9.0%
0.1%
-11.2%
-9.6%
-8.1%
-15%
-10%
-5%
0%
5%
2010 2011 2012 2013 2014
Patie
nt R
even
ue T
rend
s Fi
nanc
ial P
erfo
rman
ce
Total
3.8%
2.6% 3.2%
5.6%
2.1% 1.3% 1.5%
4.5%
0%
6%
Oper
ating
3.2%
6.0%
-1.5%
-3.6%
-0.3%
-10%
-5%
0%
5%
10%
2010 2011 2012 2013 2014
Community
AMC Teaching
Community-DSH Statewide
9.3%
-1.6%
14.0%
8.2% 7.6%
-10%
-5%
0%
5%
10%
15%
20%
2010 2011 2012 2013 2014
10.3%
8.1%
2.6%
8.3% 9.2%
-10%
-5%
0%
5%
10%
15%
20%
2010 2011 2012 2013 2014
November 2015
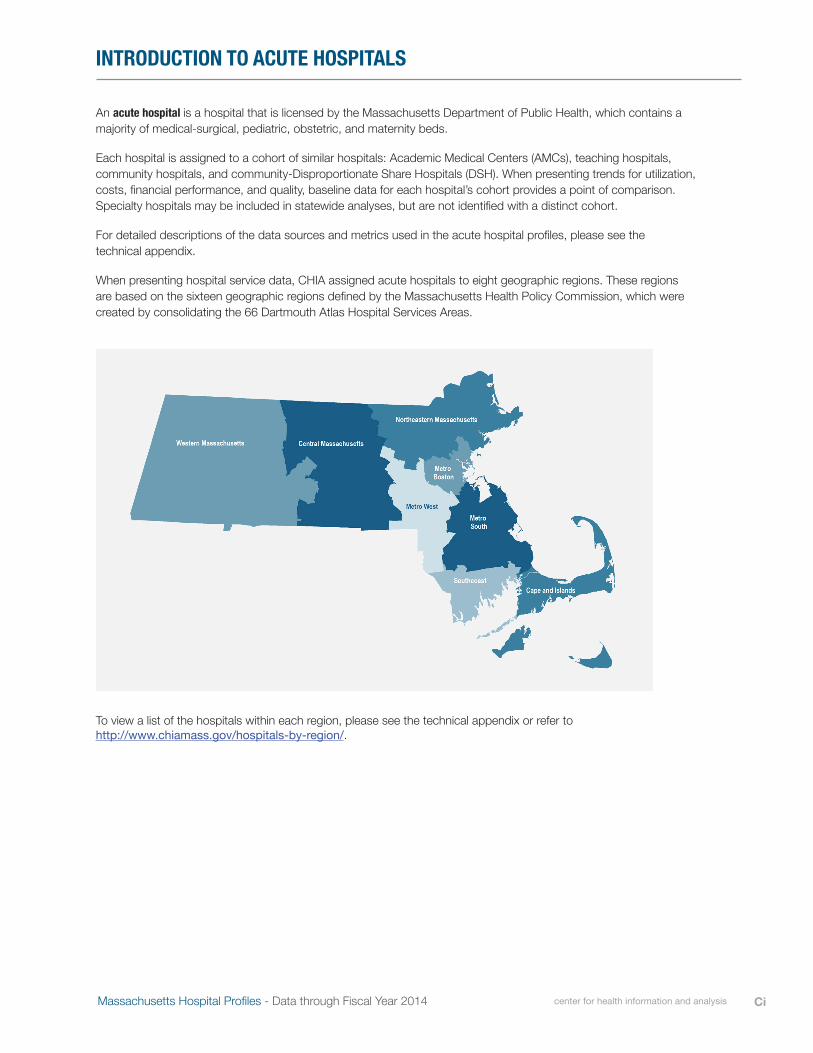
An acute hospital is a hospital that is licensed by the Massachusetts Department of Public Health, which contains a majority of medical-surgical, pediatric, obstetric, and maternity beds.
Each hospital is assigned to a cohort of similar hospitals: Academic Medical Centers (AMCs), teaching hospitals, community hospitals, and community-Disproportionate Share Hospitals (DSH). When presenting trends for utilization, costs, financial performance, and quality, baseline data for each hospital’s cohort provides a point of comparison. Specialty hospitals may be included in statewide analyses, but are not identified with a distinct cohort.
For detailed descriptions of the data sources and metrics used in the acute hospital profiles, please see the technical appendix.
When presenting hospital service data, CHIA assigned acute hospitals to eight geographic regions. These regions are based on the sixteen geographic regions defined by the Massachusetts Health Policy Commission, which were created by consolidating the 66 Dartmouth Atlas Hospital Services Areas.
To view a list of the hospitals within each region, please see the technical appendix or refer to http://www.chiamass.gov/hospitals-by-region/.
Massachusetts Hospital Profiles - Data through Fiscal Year 2014 center for health information and analysis Ci
INTRODUCTION TO ACUTE HOSPITALS

Hospital
Anna Jaques Hospital C16Athol Hospital C30Baystate Franklin Medical Center C31Baystate Mary Lane Hospital C17Baystate Medical Center C7Baystate Noble Hospital C32Baystate Wing Hospital C33Berkshire Medical Center C8Beth Israel Deaconess Hospital — Milton C18Beth Israel Deaconess Hospital — Needham C19Beth Israel Deaconess Hospital — Plymouth C34Beth Israel Deaconess Medical Center C1Boston Children's Hospital C60Boston Medical Center C2Brigham and Women's Faulkner Hospital C9Brigham and Women's Hospital C3Cambridge Health Alliance C10Cape Cod Hospital C35Clinton Hospital C36Cooley Dickinson Hospital C20Dana-Farber Cancer Institute C61Emerson Hospital C21Fairview Hospital C37Falmouth Hospital C38Hallmark Health C22Harrington Memorial Hospital C39HealthAlliance Hospital C40Heywood Hospital C41Holyoke Medical Center C42Kindred Hospital — Boston C62Kindred Hospital — Boston North Shore C63Lahey Hospital & Medical Center C11Lawrence General Hospital C43Lowell General Hospital C44
Hospital
Marlborough Hospital C45Martha's Vineyard Hospital C46Massachusetts Eye and Ear Infirmary C64Massachusetts General Hospital C4Mercy Medical Center C47Merrimack Valley Hospital C48MetroWest Medical Center C23Milford Regional Medical Center C24Morton Hospital C49Mount Auburn Hospital C12Nantucket Cottage Hospital C25Nashoba Valley Medical Center C50New England Baptist Hospital C65Newton-Wellesley Hospital C26North Shore Medical Center C51Northeast Hospital C27Quincy Medical Center C52Saint Vincent Hospital C13Shriners Hospitals for Children — Boston C66Shriners Hospitals for Children — Springfield C67Signature Healthcare Brockton Hospital C53South Shore Hospital C28Southcoast Hospitals Group C54Steward Carney Hospital C14Steward Good Samaritan Medical Center C55Steward Holy Family Hospital C56Steward Norwood Hospital C57Steward Saint Anne's Hospital C58Steward St. Elizabeth's Medical Center C15Sturdy Memorial Hospital C59Tufts Medical Center C5UMass Memorial Medical Center C6Winchester Hospital C29
center for health information and analysisCii Massachusetts Hospital Profiles - Data through Fiscal Year 2014

POPO
2014 Hospital Profile
Overview / Size Payer MixHospital System Affiliation: Public Payer Mix:Change in Ownership (FY10-FY14): CY14 Commercial Payer Price Level:Total Staffed Beds: Top 3 Commercial Payers:% Occupancy:Special Public Funding:
Financial Change FY13-FY14:Adjusted‡ Cost per Discharge: Emergency Department Visits in FY14:Inpatient NPSR per CMAD: Change FY13-FY14:
Outpatient Visits in FY14:
For descriptions of the metrics, please see the technical appendix.
Hospital (15,593) = 16% of total regional discharges - - -
Total Surplus (Loss) in FY14:
Inpatient:Outpatient Revenue in FY14: 50%:50%Outpatient Revenue in FY14: $103,635,961
14.4%Total Revenue in FY14:
$17,667,822$251,289,500
Change FY13-FY14:
What proportion of adult patient discharges from this hospital resulted in a readmission at any hospital within 30 days, and how does this compare to the state average?
What were the most common inpatient cases (DRGs) treated at the hospital in FY14? What proportion of the region’s cases did this hospital treat for each service?
14.5%
26th Percentile
How many central line-associated blood stream infections (CLABSI), catheter-associated urinary tract infections (CAUTI), and surgical site infections (SSI) after colon surgery did patients get at this hospital compared to what was expected based on the hospital's characteristics and case mix?
0.5%0.0%
Change FY11-FY13 (percentage points):Early Elective Deliveries Rate (Jan 2014-Jun 2015):
15,593Inpatient Discharges in FY14:-1.8%
66,751
UniCare Life and Health Insurance Company
QualityReadmission Rate in FY13:
Utilization
Change FY13-FY14: 9.5%209,655
Where did most of the hospital's inpatients reside? What proportion of each community's total discharges was attributed to this hospital?
3.7%
0.87, > cohort avg. (0.85); < statewide (1.00)
Change FY13-FY14:
MERCY MEDICAL CENTER
$9,900
Trauma Center Designation:
$9,978
Mercy Medical Center is a large, non-profit community-Disproportionate Share Hospital (DSH) located in the Western Massachusetts region. Mercy Medical Center had 3.9% fewer inpatient discharges in FY14 than in FY10, compared with a median decrease of 7.1% in its peer cohort. Outpatient visits likewise declined at Mercy Medical Center, by 2.9%, compared with a median decline of 3.1% in its peer cohort. The hospital earned a profit each year from FY10 to FY14, with a 7.0% total margin in FY14, compared to a median total margin of 4.6% among cohort hospitals.
54.2%, < cohort avg. (66%)
74.2% (DSH* Hospital)
Health New England, Inc.420, 9th largest acute hospital
Not Applicable
Blue Cross Blue Shield of MassachusettsNot Applicable
CHART^, DSTIη
Springfield, MACommunity, Disproportionate Share Hospital
Case Mix Index:
Western Massachusetts
Not Applicable
-0.3%
At a
Glan
ce
Serv
ices
52% 15% 12% 36% 22% 45% 25% 16% 16% 65%
0% 20% 40% 60% 80% 100%
Opioid Abuse & Dependence (342)Cesarean Delivery (348)
Heart Failure (395)Drug/Alcohol Abuse, LAMA (443)
Maj Dep& Oth/Unsp Psychoses (446)Rehabilitation (521)
Bipolar Disorders (594)Vaginal Delivery (857)
Normal Neonate Birth (1120)Alc & Drg Dx-Rehab w/wo Detox (1492)Discharges by DRG
of regional discharges were treated at this hospital in FY14
26% 28% 22% 22% 26% 16% 28% 17% 26% 29%
0% 20% 40% 60% 80% 100%
Feeding Hills MA (290)Indian Orchard MA (305)
East Longmeadow MA (377)Ludlow MA (468)
Agawam MA (694)Westfield MA (716)
West Springfield MA (943)Holyoke MA (1,071)
Chicopee MA (1,882)Springfield MA (5,837)
Discharges by Community
Quali
ty
14.0% 14.5%
15.9% 15.0%
0%
5%
10%
15%
20%
25%
2011 20130
1
2
3
Lower is Better
CLABSI CAUTI SSI: Colon Surgery
of community discharges were treated at this hospital in FY14
Lower is Better
C47
Health care-associated infectionsThis measure displays how many central line-associated blood stream infections (CLABSI), catheter-associated urinary tract infections (CAUTI), and surgical site infections (SSI) after colon surgery patients experienced relative to what was expected, based on the hospital’s characteristics and case mix. The dotted line indicates that the expected and observed number of infections were equal. A lower score is better.
Massachusetts Hospital Profiles - Data through Fiscal Year 2014
Regional utilization The communities where the hospital’s inpatients reside are listed, with the number of this hospital’s discharges from each community and a bar representing the share this hospital provides for each community among Massachusetts hospitals.
Hospital name change (if applicable)
Campus location(s)
Multi-hospital system affiliation (if applicable)
Hospital’s cohort
Region
Readmissions This measure is designed to follow adult patients for 30 days from discharge and determine whether they are admitted to a hospital during this period. The unadjusted readmission rates for 2011 and 2013 are displayed in the graph. A lower score is better.
Types of inpatient cases This hospital’s most frequent inpatient cases are listed, with the number of discharges in each group and a bar representing the proportion of regional cases treated at this hospital.
This sheet provides a brief introduction to the metrics on the acute hospital profiles. Definitions and notes on all metrics are available in the technical appendix.
HOW TO READ ACUTE HOSPITAL PROFILES – FISCAL YEAR 2014
center for health information and analysis Ciii

PO
Key:
Hospital
Cohort: Community, Disproportionate Share Hospital Peer Cohort
For descriptions of the metrics, please see the technical appendix.
218$ 216$ Total Revenue
‡ Costs were adjusted to exclude direct medical education costs and physician compensation.
^ For more information on Community Hospital Acceleration, Revitalization and Transformation (CHART) special funding, please contact the Health Policy Commission (HPC).
η For more information on Delivery System Transformation Initiative (DSTI) special funding, please contact the Massachusetts Executive Office of Health and Human Service (EOHHS).
207$ 219$ 120$
* Disproportionate Share Hospitals (DSH) receive a minimum of 63% of gross patient service revenue from public payers.
218$ 242$ Operating Revenue
1$ 1$ 1$
Total Costs
Total Profit (Loss) 7.2$ 11.0$ 25.2$ 9.9$ 17.7$
234$ 209$
251$
Non-Operating Revenue
250$ 129$ 217$
0$ (1)$
244$ 130$
How has the hospital's total outpatient revenue changed compared to FY10, and how does this compare to the hospital's peer cohort median? (FY10=100)
2014 HOSPITAL PROFILE: MERCY MEDICAL CENTER
What were the hospital's total margin and operating margins between FY10 and FY14, and how do these compare to the hospital's peer cohort medians?
Revenue, Cost, & Profit/Loss (in millions)
How have the hospital's total revenue and costs changed between FY10 and FY14?
How has the volume of the hospital's inpatient discharges changed compared to FY10, and how does this compare to the hospital's peer cohort median? (FY10=100)
How has the volume of the hospital's outpatient visits changed compared to FY10, and how does this compare to the hospital's peer cohort median? (FY10=100)
FY
What was the hospital's net inpatient service revenue per case mix adjusted discharge between FY10 and FY14, and how does this compare to the hospital's peer cohort median?
2011 2012 20132010 2014
Utiliz
atio
n
-3.9%
-7.1%
65707580859095
100105110115120125130135140
2010 2011 2012 2013 2014
FY14 Inpatient Discharges = 15,593
+10.1%
-2.2%
65707580859095
100105110115120125130135140
2010 2011 2012 2013 2014
FY14 Outpatient Visits = 209,655
Patie
nt R
even
ue T
rend
s
Hospital Cohort Median
$2,000
$6,000
$10,000
$14,000
$18,000
$22,000
2010 2011 2012 2013 2014
+39.9%
+11.2%
65707580859095
100105110115120125130135140
2010 2011 2012 2013 2014
FY14 Outpatient Revenue = $104 M
Fina
ncial
Per
form
ance
3.3% 7.0%
2.8% 4.6%
-10%
0%
10%
2010 2011 2012 2013 2014
Total
3.9% 6.7%
1.5% 2.9%
-10%
0%
10%
Oper
ating
November 2015
Change in volume of outpatient visits
Change in volume of inpatient discharges
Total and operating margin history
Change in inpatient severity-adjusted revenue per case (i.e., per capita) among Massachusetts hospitals.
Annual financial information
Change in total outpatient revenue (note: not per unit. This metric is influenced both by unit price and by volume changes.)
Each of the first four graphs compares trends at the featured hospital (in blue) to the trend among the peer cohort hospitals (in orange). Both trends are anchored at 100 to emphasize recent changes. The labeled points are cumulative over the time period. Absolute differences between the hospital and the cohort cannot be read from these graphs, but are available in the data supplement to these reports.
HOW TO READ ACUTE HOSPITAL PROFILES – FISCAL YEAR 2014
center for health information and analysisCiv Massachusetts Hospital Profiles - Data through Fiscal Year 2014

Cv
2014 Hospital Profile
Overview / Size Payer MixHospital System Affiliation: Public Payer Mix:Change in Ownership (FY10-FY14): CY14 Commercial Payer Price Level:Total Staffed Beds: Top 3 Commercial Payers:% Occupancy:Special Public Funding:
Financial Change FY13-FY14:Adjusted‡ Cost per Discharge: Emergency Department Visits in FY14:Inpatient NPSR per CMAD: Change FY13-FY14:
Outpatient Visits in FY14:
For descriptions of the metrics, please see the technical appendix.
Hospital (15,593) = 16% of total regional discharges - - -
Total Surplus (Loss) in FY14:
Inpatient:Outpatient Revenue in FY14: 50%:50%Outpatient Revenue in FY14: $103,635,961
14.4%Total Revenue in FY14:
$17,667,822$251,289,500
Change FY13-FY14:
What proportion of adult patient discharges from this hospital resulted in a readmission at any hospital within 30 days, and how does this compare to the state average?
What were the most common inpatient cases (DRGs) treated at the hospital in FY14? What proportion of the region’s cases did this hospital treat for each service?
14.5%
26th Percentile
How many central line-associated blood stream infections (CLABSI), catheter-associated urinary tract infections (CAUTI), and surgical site infections (SSI) after colon surgery did patients get at this hospital compared to what was expected based on the hospital's characteristics and case mix?
0.5%0.0%
Change FY11-FY13 (percentage points):Early Elective Deliveries Rate (Jan 2014-Jun 2015):
15,593Inpatient Discharges in FY14:-1.8%
66,751
UniCare Life and Health Insurance Company
QualityReadmission Rate in FY13:
Utilization
Change FY13-FY14: 9.5%209,655
Where did most of the hospital's inpatients reside? What proportion of each community's total discharges was attributed to this hospital?
3.7%
0.87, > cohort avg. (0.85); < statewide (1.00)
Change FY13-FY14:
MERCY MEDICAL CENTER
$9,900
Trauma Center Designation:
$9,978
Mercy Medical Center is a large, non-profit community-Disproportionate Share Hospital (DSH) located in the Western Massachusetts region. Mercy Medical Center had 3.9% fewer inpatient discharges in FY14 than in FY10, compared with a median decrease of 7.1% in its peer cohort. Outpatient visits likewise declined at Mercy Medical Center, by 2.9%, compared with a median decline of 3.1% in its peer cohort. The hospital earned a profit each year from FY10 to FY14, with a 7.0% total margin in FY14, compared to a median total margin of 4.6% among cohort hospitals.
54.2%, < cohort avg. (66%)
74.2% (DSH* Hospital)
Health New England, Inc.420, 9th largest acute hospital
Not Applicable
Blue Cross Blue Shield of MassachusettsNot Applicable
CHART^, DSTIη
Springfield, MACommunity, Disproportionate Share Hospital
Case Mix Index:
Western Massachusetts
Not Applicable
-0.3%
At a
Glan
ce
Serv
ices
52% 15% 12% 36% 22% 45% 25% 16% 16% 65%
0% 20% 40% 60% 80% 100%
Opioid Abuse & Dependence (342)Cesarean Delivery (348)
Heart Failure (395)Drug/Alcohol Abuse, LAMA (443)
Maj Dep& Oth/Unsp Psychoses (446)Rehabilitation (521)
Bipolar Disorders (594)Vaginal Delivery (857)
Normal Neonate Birth (1120)Alc & Drg Dx-Rehab w/wo Detox (1492)Discharges by DRG
of regional discharges were treated at this hospital in FY14
26% 28% 22% 22% 26% 16% 28% 17% 26% 29%
0% 20% 40% 60% 80% 100%
Feeding Hills MA (290)Indian Orchard MA (305)
East Longmeadow MA (377)Ludlow MA (468)
Agawam MA (694)Westfield MA (716)
West Springfield MA (943)Holyoke MA (1,071)
Chicopee MA (1,882)Springfield MA (5,837)
Discharges by Community
Quali
ty
14.0% 14.5%
15.9% 15.0%
0%
5%
10%
15%
20%
25%
2011 20130
1
2
3
Lower is Better
CLABSI CAUTI SSI: Colon Surgery
of community discharges were treated at this hospital in FY14
Lower is Better
C47
What changed from Acute Hospital Profiles – Data through Fiscal Year 2013?
MASSACHUSETTS ACUTE HOSPITAL PROFILES – FISCAL YEAR 2014
CHIA is committed to ensuring that our customers receive quality content and service, and to help us do so, we surveyed stakeholders prior to planning this year’s publication. The Hospital Profiles – FY 2014 presentation was updated to focus on the metrics and formats most valuable to our stakeholders. In addition to an updated look, CHIA made the updates noted below to the Acute Hospital Profiles template.
1. The Growth Measures section was removed to allow for an expanded At a Glance section that includes overview, financial, payer mix, utilization, and quality sections, and growth measure data points within.
2. Select quality measures are featured on the first page of each acute hospital’s profile.
3. Relative Price and payer mix figures were removed; the data points now appear in the At a Glance section.
Data for each individual acute hospital can also be found in CHIA’s online databook.
Massachusetts Hospital Profiles - Data through Fiscal Year 2014 center for health information and analysis
Key:
Hospital
Cohort: Community, Disproportionate Share Hospital Peer Cohort
For descriptions of the metrics, please see the technical appendix.
218$ 216$ Total Revenue
‡ Costs were adjusted to exclude direct medical education costs and physician compensation.
^ For more information on Community Hospital Acceleration, Revitalization and Transformation (CHART) special funding, please contact the Health Policy Commission (HPC).
η For more information on Delivery System Transformation Initiative (DSTI) special funding, please contact the Massachusetts Executive Office of Health and Human Service (EOHHS).
207$ 219$ 120$
* Disproportionate Share Hospitals (DSH) receive a minimum of 63% of gross patient service revenue from public payers.
218$ 242$ Operating Revenue
1$ 1$ 1$
Total Costs
Total Profit (Loss) 7.2$ 11.0$ 25.2$ 9.9$ 17.7$
234$ 209$
251$
Non-Operating Revenue
250$ 129$ 217$
0$ (1)$
244$ 130$
How has the hospital's total outpatient revenue changed compared to FY10, and how does this compare to the hospital's peer cohort median? (FY10=100)
2014 HOSPITAL PROFILE: MERCY MEDICAL CENTER
What were the hospital's total margin and operating margins between FY10 and FY14, and how do these compare to the hospital's peer cohort medians?
Revenue, Cost, & Profit/Loss (in millions)
How have the hospital's total revenue and costs changed between FY10 and FY14?
How has the volume of the hospital's inpatient discharges changed compared to FY10, and how does this compare to the hospital's peer cohort median? (FY10=100)
How has the volume of the hospital's outpatient visits changed compared to FY10, and how does this compare to the hospital's peer cohort median? (FY10=100)
FY
What was the hospital's net inpatient service revenue per case mix adjusted discharge between FY10 and FY14, and how does this compare to the hospital's peer cohort median?
2011 2012 20132010 2014
Utiliz
atio
n
-3.9%
-7.1%
65707580859095
100105110115120125130135140
2010 2011 2012 2013 2014
FY14 Inpatient Discharges = 15,593
+10.1%
-2.2%
65707580859095
100105110115120125130135140
2010 2011 2012 2013 2014
FY14 Outpatient Visits = 209,655
Patie
nt R
even
ue T
rend
s
Hospital Cohort Median
$2,000
$6,000
$10,000
$14,000
$18,000
$22,000
2010 2011 2012 2013 2014
+39.9%
+11.2%
65707580859095
100105110115120125130135140
2010 2011 2012 2013 2014
FY14 Outpatient Revenue = $104 M
Fina
ncial
Per
form
ance
3.3% 7.0%
2.8% 4.6%
-10%
0%
10%
2010 2011 2012 2013 2014
Total
3.9% 6.7%
1.5% 2.9%
-10%
0%
10%
Oper
ating
November 2015

Cvi center for health information and analysis Massachusetts Hospital Profiles - Data through Fiscal Year 2014

2014 Hospital Profile
Overview / Size Payer Mix
Hospital System Affiliation: Public Payer Mix:
Change in Ownership (FY10-FY14): CY14 Commercial Payer Price Level:
Total Staffed Beds: Top 3 Commercial Payers:
% Occupancy:
Special Public Funding:
Financial Change FY13-FY14:
Adjusted‡ Cost per Discharge: Emergency Department Visits in FY14:
Inpatient NPSR per CMAD: Change FY13-FY14:
Outpatient Visits in FY14:
For descriptions of the metrics, please see the technical appendix.
-0.2%
1.28, < cohort avg. (1.35); > statewide (1.00)
Change FY13-FY14:
BETH ISRAEL DEACONESS MEDICAL CENTER
$10,185
Trauma Center Designation:
$13,417
Beth Israel Deaconess Medical Center (BIDMC) is a large, non-profit academic medical center (AMC) located in the Metro Boston region. It is one of eight
organ transplant centers in Massachusetts, and is a member of the CareGroup health care system. Over one-third of Brookline resident discharges were
from Beth Israel Deaconess Medical Center. It earned a profit each year from FY10 to FY14, with a 4.4% total margin in FY14, slightly lower than the AMC
median total margin of 4.7%. Its largest profit in the five-year period of $100.2M (7.1% total margin) was reported in FY13.
78.5%, < cohort avg. (82%)
56.5% (Non-DSH* Hospital)
Harvard Pilgrim Health Care
703, 5th largest acute hospital
CareGroup
Blue Cross Blue Shield of Massachusetts
Not Applicable
ICBθ
Boston, MA
Academic Medical Center
Case Mix Index:
Metro Boston
Adult: Level 1
-4.0%
15.7%
66th Percentile
How many central line-associated blood stream infections (CLABSI),
catheter-associated urinary tract infections (CAUTI), and surgical site
infections (SSI) after colon surgery did patients get at this hospital
compared to what was expected based on the hospital's characteristics
and case mix?
-2.1%
0.0%
Change FY11-FY13 (percentage points):
Early Elective Deliveries Rate (Jan 2014-Jun 2015):
37,206Inpatient Discharges in FY14:
4.7%
42,593
Tufts Associated Health Maintenance Org.
Quality
Readmission Rate in FY13:
Utilization
Change FY13-FY14: 2.5%
717,827
Where did most of the hospital's inpatients reside? What proportion of
each community's total discharges was attributed to this hospital?
Total Surplus (Loss) in FY14:
Inpatient:Outpatient Revenue in FY14: 44%:56%
Outpatient Revenue in FY14: $473,521,386
3.8%
Total Revenue in FY14:
$63,285,000
$1,448,606,866
Change FY13-FY14:
What proportion of adult patient discharges from this hospital resulted
in a readmission at any hospital within 30 days, and how does this
compare to the state average?
What were the most common inpatient cases (DRGs) treated at the
hospital in FY14? What proportion of the region’s cases did this
hospital treat for each service?
Hospital (37,206) = 13% of total regional discharges - - -
At
a G
lan
ce
Ser
vice
s
6%
20%
18%
18%
17%
11%
13%
17%
17%
17%
0% 20% 40% 60% 80% 100%
Knee Joint Replacement (416)
Other Vascular Procedures (425)
Percut Card proc w/o AMI (433)
Chemotherapy (449)
Maj Sml & Lrg Bowel Procs (566)
Heart Failure (658)
Sepsis & Dissem Inf (913)
Cesarean Delivery (1511)
Vaginal Delivery (3253)
Normal Neonate Birth (4225)
Discharges by DRG
of regional discharges were treated at this hospital in FY14
8%
4%
16%
11%
19%
9%
12%
11%
35%
12%
0% 20% 40% 60% 80% 100%
Revere MA (553)
Brockton MA (605)
Roxbury MA (666)
Dorchester Center MA (703)
Jamaica Plain MA (721)
Cambridge MA (781)
Dorchester MA (1,234)
Quincy MA (1,251)
Brookline MA (1,271)
Boston MA (2,149)
Discharges by Community
Qu
alit
y
17.8%
15.7% 15.9%
15.0%
0%
5%
10%
15%
20%
25%
2011 2013
0
1
2
3CLABSI CAUTI SSI: Colon Surgery
of community discharges were treated at this hospital in FY14
Lower is Better
Lower is Better
State Average
C1

Key:
Hospital
Cohort: Academic Medical Center Peer Cohort
For descriptions of the metrics, please see the technical appendix.
FY
What was the hospital's net inpatient service revenue per case mix
adjusted discharge between FY10 and FY14, and how does this
compare to the hospital's peer cohort median?
2011 2012 20132010 2014
How has the hospital's total outpatient revenue changed compared to
FY10, and how does this compare to the hospital's peer cohort
median? (FY10=100)
2014 HOSPITAL PROFILE: BETH ISRAEL DEACONESS MEDICAL CENTER
What were the hospital's total margin and operating margins between
FY10 and FY14, and how do these compare to the hospital's peer
cohort medians?Revenue, Cost, & Profit/Loss (in millions)
How have the hospital's total revenue and costs changed between
FY10 and FY14?
How has the volume of the hospital's inpatient discharges changed
compared to FY10, and how does this compare to the hospital's peer
cohort median? (FY10=100)
How has the volume of the hospital's outpatient visits changed
compared to FY10, and how does this compare to the hospital's peer
cohort median? (FY10=100)
1,368$ 1,380$ Operating Revenue
32$ 49$ 29$
Total Costs
Total Profit (Loss) 84.2$ 62.3$ 74.0$ 100.2$ 63.3$
1,385$ 1,262$
1,449$
Non-Operating
Revenue
1,417$ 1,360$ 1,318$
14$ 28$
1,410$ 1,410$ 1,382$ 1,346$ Total Revenue
‡ Costs were adjusted to exclude direct medical education costs and physician compensation.
θ For more information on Infrastructure and Capacity Building (ICB) special funding, please contact the
Massachusetts Executive Office of Health and Human Services (EOHHS).
1,320$ 1,336$ 1,309$
* Disproportionate Share Hospitals (DSH) receive a minimum of 63% of gross patient service revenue from public
payers.
Uti
lizat
ion
-11.0%
-12.5%
65707580859095
100105110115120125130135140
2010 2011 2012 2013 2014
FY14 Inpatient Discharges = 37,206
+2.3%
+3.2%
65707580859095
100105110115120125130135140
2010 2011 2012 2013 2014
FY14 Outpatient Visits = 717,827
Pat
ien
t R
even
ue
Tre
nd
s
Hospital
Cohort Median
$2,000
$6,000
$10,000
$14,000
$18,000
$22,000
2010 2011 2012 2013 2014
+14.1%
+12.0%
65707580859095
100105110115120125130135140
2010 2011 2012 2013 2014
FY14 Outpatient Revenue = $474 M
Fin
anci
al P
erfo
rman
ce
6.3%
4.4% 4.6%
4.7%
-10%
0%
10%
2010 2011 2012 2013 2014
Tot
al
4.2%
2.2% 3.8% 2.6%
-10%
0%
10%
Ope
ratin
g
November 2015

2014 Hospital Profile
Overview / Size Payer Mix
Hospital System Affiliation: Public Payer Mix:
Change in Ownership (FY10-FY14): CY14 Commercial Payer Price Level:
Total Staffed Beds: Top 3 Commercial Payers:
% Occupancy:
Special Public Funding:
Financial Change FY13-FY14:
Adjusted‡ Cost per Discharge: Emergency Department Visits in FY14:
Inpatient NPSR per CMAD: Change FY13-FY14:
Outpatient Visits in FY14:
For descriptions of the metrics, please see the technical appendix.
2.5%
1.10, < cohort avg. (1.35); > statewide (1.00)
Change FY13-FY14:
BOSTON MEDICAL CENTER
$13,631
Trauma Center Designation:
$14,216
Boston Medical Center (BMC) is a large, non-profit academic medical center (AMC) located in the Metro Boston region. It also qualifies as a
Disproportionate Share Hospital (DSH), and has the highest public payer mix of all AMCs. BMC is a teaching hospital of Boston University School of
Medicine. It is the state’s seventh largest hospital, and one of eight organ transplant centers in Massachusetts. BMC treated 23% of all asthma cases in
Metro Boston, though it accounted for only 9% of total regional discharges. BMC was profitable from FY12 to FY14, reporting its greatest surplus in FY14
at $55.5M (5.0% total margin).
74.0%, lowest in cohort (avg. 82%)
77.8% (DSH* Hospital)
Harvard Pilgrim Health Care
470, 7th largest acute hospital
Not Applicable
Blue Cross Blue Shield of Massachusetts
Not Applicable
DSTIη
Boston, MA
Academic Medical Center
Case Mix Index:
Metro Boston
Adult: Level 1, Pedi: Level 2
-0.7%
16.3%
58th Percentile
How many central line-associated blood stream infections (CLABSI),
catheter-associated urinary tract infections (CAUTI), and surgical site
infections (SSI) after colon surgery did patients get at this hospital
compared to what was expected based on the hospital's characteristics
and case mix?
-1.3%
8.9%
Change FY11-FY13 (percentage points):
Early Elective Deliveries Rate (Jan 2014-Jun 2015):
26,069Inpatient Discharges in FY14:
0.2%
128,839
Tufts Associated Health Maintenance Org.
Quality
Readmission Rate in FY13:
Utilization
Change FY13-FY14: 6.1%
1,617,480
Where did most of the hospital's inpatients reside? What proportion of
each community's total discharges was attributed to this hospital?
Total Surplus (Loss) in FY14:
Inpatient:Outpatient Revenue in FY14: 32%:68%
Outpatient Revenue in FY14: $702,800,111
12.6%
Total Revenue in FY14:
$55,503,000
$1,108,936,000
Change FY13-FY14:
What proportion of adult patient discharges from this hospital resulted
in a readmission at any hospital within 30 days, and how does this
compare to the state average?
What were the most common inpatient cases (DRGs) treated at the
hospital in FY14? What proportion of the region’s cases did this
hospital treat for each service?
Hospital (26,069) = 9% of total regional discharges - - -
At
a G
lan
ce
Ser
vice
s
12%
9%
13%
12%
23%
12%
11%
9%
9%
9%
0% 20% 40% 60% 80% 100%
COPD (376)
Other Pneumonia (377)
Seizure (386)
Cellulitis, Oth Bact Skn Inf (397)
Asthma (413)
Heart Failure (720)
Sepsis & Dissem Inf (761)
Cesarean Delivery (782)
Vaginal Delivery (1656)
Normal Neonate Birth (2153)
Discharges by DRG of regional discharges
were treated at this hospital in FY14
4%
10%
6%
20%
17%
33%
41%
30%
38%
26%
0% 20% 40% 60% 80% 100%
Brockton MA (615)
Revere MA (642)
Quincy MA (651)
Hyde Park MA (761)
Chelsea MA (807)
Mattapan MA (1,070)
Roxbury MA (1,644)
Dorchester Center MA (1,961)
Dorchester MA (3,868)
Boston MA (4,857)
Discharges by Community
Qu
alit
y 17.6% 16.3%
15.9% 15.0%
0%
5%
10%
15%
20%
25%
2011 2013
0
1
2
3CLABSI CAUTI SSI: Colon Surgery
of community discharges were treated at this hospital in FY14
Lower is Better
Lower is Better
State Average
C2

Key:
Hospital
Cohort: Academic Medical Center Peer Cohort
For descriptions of the metrics, please see the technical appendix.
FY
What was the hospital's net inpatient service revenue per case mix
adjusted discharge between FY10 and FY14, and how does this
compare to the hospital's peer cohort median?
2011 2012 20132010 2014
How has the hospital's total outpatient revenue changed compared to
FY10, and how does this compare to the hospital's peer cohort
median? (FY10=100)
2014 HOSPITAL PROFILE: BOSTON MEDICAL CENTER
What were the hospital's total margin and operating margins between
FY10 and FY14, and how do these compare to the hospital's peer
cohort medians?Revenue, Cost, & Profit/Loss (in millions)
How have the hospital's total revenue and costs changed between
FY10 and FY14?
How has the volume of the hospital's inpatient discharges changed
compared to FY10, and how does this compare to the hospital's peer
cohort median? (FY10=100)
How has the volume of the hospital's outpatient visits changed
compared to FY10, and how does this compare to the hospital's peer
cohort median? (FY10=100)
980$ 1,011$ Operating Revenue
22$ 13$ 6$
Total Costs
Total Profit (Loss) (25.7)$ (25.1)$ 8.8$ 20.0$ 55.5$
1,053$ 1,043$
1,109$
Non-Operating
Revenue
1,087$ 1,016$ 1,006$
5$ 11$
1,017$ 1,029$ 985$ 1,017$ Total Revenue
‡ Costs were adjusted to exclude direct medical education costs and physician compensation.
η For more information on Delivery System Transformation Initiative (DSTI) special funding, please contact the
Massachusetts Executive Office of Health and Human Service (EOHHS).
1,010$ 1,008$ 1,009$
* Disproportionate Share Hospitals (DSH) receive a minimum of 63% of gross patient service revenue from public
payers.
Uti
lizat
ion
-13.7%
-12.5%
65707580859095
100105110115120125130135140
2010 2011 2012 2013 2014
FY14 Inpatient Discharges = 26,069
+15.9%
+3.2%
65707580859095
100105110115120125130135140
2010 2011 2012 2013 2014
FY14 Outpatient Visits = 1,617,480
Pat
ien
t R
even
ue
Tre
nd
s
Hospital
Cohort Median
$2,000
$6,000
$10,000
$14,000
$18,000
$22,000
2010 2011 2012 2013 2014
+12.5%
+12.0%
65707580859095
100105110115120125130135140
2010 2011 2012 2013 2014
FY14 Outpatient Revenue = $703 M
Fin
anci
al P
erfo
rman
ce
-2.5%
5.0% 4.6%
4.7%
-10%
0%
10%
2010 2011 2012 2013 2014
Tot
al
-3.6%
3.0% 3.8% 2.6%
-10%
0%
10%
Ope
ratin
g
November 2015

2014 Hospital Profile
Overview / Size Payer Mix
Hospital System Affiliation: Public Payer Mix:
Change in Ownership (FY10-FY14): CY14 Commercial Payer Price Level:
Total Staffed Beds: Top 3 Commercial Payers:
% Occupancy:
Special Public Funding:
Financial Change FY13-FY14:
Adjusted‡ Cost per Discharge: Emergency Department Visits in FY14:
Inpatient NPSR per CMAD: Change FY13-FY14:
Outpatient Visits in FY14:
For descriptions of the metrics, please see the technical appendix.
Hospital (44,909) = 15% of total regional discharges - - -
What proportion of adult patient discharges from this hospital resulted
in a readmission at any hospital within 30 days, and how does this
compare to the state average?
Inpatient:Outpatient Revenue in FY14: 60%:40%
Outpatient Revenue in FY14: $675,727,004
14.2%
Total Revenue in FY14:
$151,657,000
$2,538,005,000
Change FY13-FY14:
What were the most common inpatient cases (DRGs) treated at the
hospital in FY14? What proportion of the region’s cases did this
hospital treat for each service?
15.4%
93rd Percentile
How many central line-associated blood stream infections (CLABSI),
catheter-associated urinary tract infections (CAUTI), and surgical site
infections (SSI) after colon surgery did patients get at this hospital
compared to what was expected based on the hospital's characteristics
and case mix?
-0.5%
3.7%
Change FY11-FY13 (percentage points):
Early Elective Deliveries Rate (Jan 2014-Jun 2015):
44,909Inpatient Discharges in FY14:
-8.6%
59,718
Tufts Associated Health Maintenance Org.
Quality
Readmission Rate in FY13:
Utilization
Change FY13-FY14: -0.3%
645,563
Where did most of the hospital's inpatients reside? What proportion of
each community's total discharges was attributed to this hospital?
-5.1%
1.51, > cohort avg. (1.35); > statewide (1.00)
Change FY13-FY14:
Total Surplus (Loss) in FY14:
BRIGHAM AND WOMEN'S HOSPITAL
$14,505
Trauma Center Designation:
$15,913
Brigham and Women’s Hospital is a non-profit academic medical center (AMC) located in the Metro Boston region. Within Massachusetts, it is the second
largest hospital, has the highest number of births at any hospital, and is designated as one of eight organ transplant centers in the state. It is a member of
Partners HealthCare System. Its operating and total margins remained fairly steady from FY10 to FY14, with a 6.0% total margin in FY14, higher than its
peer cohort median total margin of 4.7%.
83.1%, > cohort avg. (82%)
51.4% (Non-DSH* Hospital)
Harvard Pilgrim Health Care
851, 2nd largest acute hospital
Partners HealthCare System
Blue Cross Blue Shield of Massachusetts
Not Applicable
Not Applicable
Boston, MA
Academic Medical Center
Case Mix Index:
Metro Boston
Adult: Level 1
-0.3%
At
a G
lan
ce
Ser
vice
s
10%
23%
9%
26%
11% 11%
23%
23%
23%
22%
0% 20% 40% 60% 80% 100%
Heart Failure (576)
Chemotherapy (596)
Sepsis & Dissem Inf (655)
Craniotomy; exc Trauma (682)
Hip Joint Replacement (713)
Knee Joint Replacement (756)
Maj Sml & Lrg Bowel Procs (784)
Cesarean Delivery (2001)
Vaginal Delivery (4453)
Normal Neonate Birth (5540)
Discharges by DRG
of regional discharges were treated at this hospital in FY14
9%
23%
21%
20%
8%
28%
17%
32%
16%
12%
0% 20% 40% 60% 80% 100%
Cambridge MA (753)
Roslindale MA (782)
Hyde Park MA (798)
Roxbury MA (824)
Quincy MA (920)
Brookline MA (1,016)
Dorchester Center MA (1,116)
Jamaica Plain MA (1,202)
Dorchester MA (1,631)
Boston MA (2,166)
Discharges by Community
Qu
alit
y
15.9% 15.4% 15.9%
15.0%
0%
5%
10%
15%
20%
25%
2011 2013
0
1
2
3CLABSI CAUTI SSI: Colon Surgery
of community discharges were treated at this hospital in FY14
Lower is Better
Lower is Better
State Average
C3

Key:
Hospital
Cohort: Academic Medical Center Peer Cohort
For descriptions of the metrics, please see the technical appendix.
‡ Costs were adjusted to exclude direct medical education costs and physician compensation.
2,231$ 2,325$ 2,377$
* Disproportionate Share Hospitals (DSH) receive a minimum of 63% of gross patient service revenue from public
payers.
2,356$ 2,455$ Operating Revenue
0$ (0)$ 2$
Total Costs
Total Profit (Loss) 112.1$ 122.0$ 132.2$ 139.0$ 151.7$
2,386$ 2,100$
2,538$
Non-Operating
Revenue
2,538$ 2,517$ 2,210$
(3)$ 1$
2,457$ 2,516$
How has the hospital's total outpatient revenue changed compared to
FY10, and how does this compare to the hospital's peer cohort
median? (FY10=100)
2,353$ 2,212$ Total Revenue
2014 HOSPITAL PROFILE: BRIGHAM AND WOMEN'S HOSPITAL
What were the hospital's total margin and operating margins between
FY10 and FY14, and how do these compare to the hospital's peer
cohort medians?Revenue, Cost, & Profit/Loss (in millions)
How have the hospital's total revenue and costs changed between
FY10 and FY14?
How has the volume of the hospital's inpatient discharges changed
compared to FY10, and how does this compare to the hospital's peer
cohort median? (FY10=100)
How has the volume of the hospital's outpatient visits changed
compared to FY10, and how does this compare to the hospital's peer
cohort median? (FY10=100)
FY
What was the hospital's net inpatient service revenue per case mix
adjusted discharge between FY10 and FY14, and how does this
compare to the hospital's peer cohort median?
2011 2012 20132010 2014
Uti
lizat
ion
-13.0%
-12.5%
65707580859095
100105110115120125130135140
2010 2011 2012 2013 2014
FY14 Inpatient Discharges = 44,909
+6.5%
+3.2%
65707580859095
100105110115120125130135140
2010 2011 2012 2013 2014
FY14 Outpatient Visits = 645,563
Pat
ien
t R
even
ue
Tre
nd
s
Hospital
Cohort Median
$2,000
$6,000
$10,000
$14,000
$18,000
$22,000
2010 2011 2012 2013 2014
+1.8%
+12.0%
65707580859095
100105110115120125130135140
2010 2011 2012 2013 2014
FY14 Outpatient Revenue = $676 M
Fin
anci
al P
erfo
rman
ce
5.1% 6.0%
4.6% 4.7%
-10%
0%
10%
2010 2011 2012 2013 2014
Tot
al
5.0% 6.0%
3.8% 2.6%
-10%
0%
10%
Ope
ratin
g
November 2015

2014 Hospital Profile
Overview / Size Payer Mix
Hospital System Affiliation: Public Payer Mix:
Change in Ownership (FY10-FY14): CY14 Commercial Payer Price Level:
Total Staffed Beds: Top 3 Commercial Payers:
% Occupancy:
Special Public Funding:
Financial Change FY13-FY14:
Adjusted‡ Cost per Discharge: Emergency Department Visits in FY14:
Inpatient NPSR per CMAD: Change FY13-FY14:
Outpatient Visits in FY14:
For descriptions of the metrics, please see the technical appendix.
Hospital (53,117) = 18% of total regional discharges - - -
What proportion of adult patient discharges from this hospital resulted
in a readmission at any hospital within 30 days, and how does this
compare to the state average?
Inpatient:Outpatient Revenue in FY14: 50%:50%
Outpatient Revenue in FY14: $1,110,373,403
2.7%
Total Revenue in FY14:
$200,086,000
$3,339,296,000
Change FY13-FY14:
What were the most common inpatient cases (DRGs) treated at the
hospital in FY14? What proportion of the region’s cases did this
hospital treat for each service?
14.2%
90th Percentile
How many central line-associated blood stream infections (CLABSI),
catheter-associated urinary tract infections (CAUTI), and surgical site
infections (SSI) after colon surgery did patients get at this hospital
compared to what was expected based on the hospital's characteristics
and case mix?
-0.1%
Not Available
Change FY11-FY13 (percentage points):
Early Elective Deliveries Rate (Jan 2014-Jun 2015):
53,117Inpatient Discharges in FY14:
1.8%
102,705
Tufts Associated Health Maintenance Org.
Quality
Readmission Rate in FY13:
Utilization
Change FY13-FY14: -2.2%
943,929
Where did most of the hospital's inpatients reside? What proportion of
each community's total discharges was attributed to this hospital?
0.0%
1.41, > cohort avg. (1.35); > statewide (1.00)
Change FY13-FY14:
Total Surplus (Loss) in FY14:
MASSACHUSETTS GENERAL HOSPITAL
$12,998
Trauma Center Designation:
$16,224
Massachusetts General Hospital (MGH) is a non-profit academic medical center (AMC) located in the Metro Boston region. MGH is the largest hospital in
Massachusetts, with 1,043 staffed beds; it is also the oldest hospital in Massachusetts. It is a teaching hospital of Harvard Medical School and a member
of Partners HealthCare System. MGH is one of eight organ transplant centers in Massachusetts. MGH earned a profit each year from FY10 to FY14, with
a 6.0% total margin in FY14, slightly higher than the median total margin of its peer cohort.
81.2%, < cohort avg. (82%)
56.2% (Non-DSH* Hospital)
Harvard Pilgrim Health Care
1,043, largest acute hospital
Partners HealthCare System
Blue Cross Blue Shield of Massachusetts
Not Applicable
Not Applicable
Boston, MA
Academic Medical Center
Case Mix Index:
Metro Boston
Adult: Level 1, Pedi: Level 1
2.2%
At
a G
lan
ce
Ser
vice
s
24%
12%
33%
32%
14% 14%
17%
13%
14%
14%
0% 20% 40% 60% 80% 100%
Maj Sml & Lrg Bowel Procs (811)
Knee Joint Replacement (836)
Chemotherapy (836)
Craniotomy; exc Trauma (837)
Hip Joint Replacement (947)
Sepsis & Dissem Inf (963)
Heart Failure (989)
Cesarean Delivery (1096)
Vaginal Delivery (2631)
Normal Neonate Birth (3475)
Discharges by DRG
of regional discharges were treated at this hospital in FY14
16%
59%
17%
19%
16%
11% 26%
39%
37%
23%
0% 20% 40% 60% 80% 100%
Medford MA (1,036)
Charlestown MA (1,090)
Somerville MA (1,123)
Malden MA (1,282)
Cambridge MA (1,312)
Lynn MA (1,362)
Everett MA (1,412)
Chelsea MA (1,880)
Revere MA (2,444)
Boston MA (4,357)
Discharges by Community
Qu
alit
y
14.2% 14.2%
15.9% 15.0%
0%
5%
10%
15%
20%
25%
2011 2013
0
1
2
3CLABSI CAUTI SSI: Colon Surgery
of community discharges were treated at this hospital in FY14
Lower is Better
Lower is Better
State Average
C4

Key:
Hospital
Cohort: Academic Medical Center Peer Cohort
For descriptions of the metrics, please see the technical appendix.
‡ Costs were adjusted to exclude direct medical education costs and physician compensation.
2,810$ 2,987$ 3,123$
* Disproportionate Share Hospitals (DSH) receive a minimum of 63% of gross patient service revenue from public
payers.
3,021$ 3,255$ Operating Revenue
13$ 1$ 6$
Total Costs
Total Profit (Loss) 181.3$ 223.9$ 273.6$ 149.2$ 200.1$
3,139$ 2,683$
3,339$
Non-Operating
Revenue
3,326$ 3,271$ 2,859$
13$ 6$
3,260$ 3,272$
How has the hospital's total outpatient revenue changed compared to
FY10, and how does this compare to the hospital's peer cohort
median? (FY10=100)
3,033$ 2,865$ Total Revenue
2014 HOSPITAL PROFILE: MASSACHUSETTS GENERAL HOSPITAL
What were the hospital's total margin and operating margins between
FY10 and FY14, and how do these compare to the hospital's peer
cohort medians?Revenue, Cost, & Profit/Loss (in millions)
How have the hospital's total revenue and costs changed between
FY10 and FY14?
How has the volume of the hospital's inpatient discharges changed
compared to FY10, and how does this compare to the hospital's peer
cohort median? (FY10=100)
How has the volume of the hospital's outpatient visits changed
compared to FY10, and how does this compare to the hospital's peer
cohort median? (FY10=100)
FY
What was the hospital's net inpatient service revenue per case mix
adjusted discharge between FY10 and FY14, and how does this
compare to the hospital's peer cohort median?
2011 2012 20132010 2014
Uti
lizat
ion
+5.3%
-12.5%
65707580859095
100105110115120125130135140
2010 2011 2012 2013 2014
FY14 Inpatient Discharges = 53,117
+1.1%
+3.2%
65707580859095
100105110115120125130135140
2010 2011 2012 2013 2014
FY14 Outpatient Visits = 943,929
Pat
ien
t R
even
ue
Tre
nd
s
Hospital
Cohort Median
$2,000
$6,000
$10,000
$14,000
$18,000
$22,000
2010 2011 2012 2013 2014
+11.5%
+12.0%
65707580859095
100105110115120125130135140
2010 2011 2012 2013 2014
FY14 Outpatient Revenue = $1,110 M
Fin
anci
al P
erfo
rman
ce
6.3% 6.0%
4.6% 4.7%
-10%
0%
10%
2010 2011 2012 2013 2014
Tot
al
6.1% 5.6% 3.8% 2.6%
-10%
0%
10%
Ope
ratin
g
November 2015
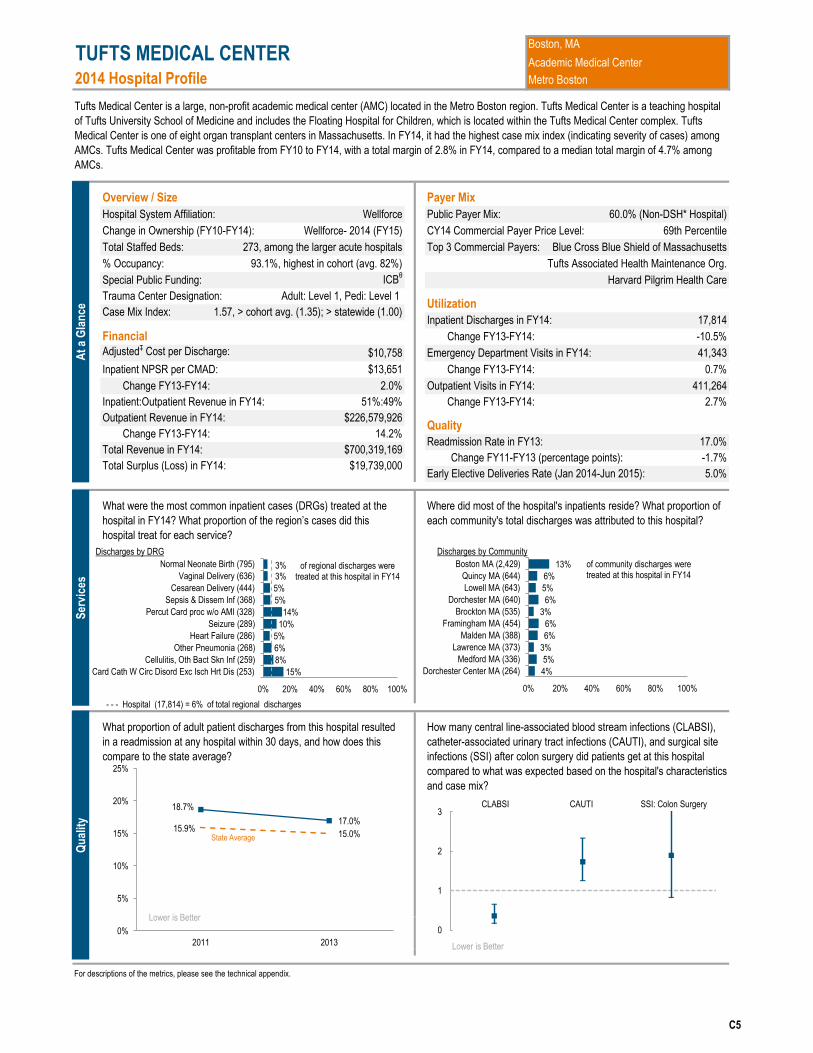
2014 Hospital Profile
Overview / Size Payer Mix
Hospital System Affiliation: Public Payer Mix:
Change in Ownership (FY10-FY14): CY14 Commercial Payer Price Level:
Total Staffed Beds: Top 3 Commercial Payers:
% Occupancy:
Special Public Funding:
Financial Change FY13-FY14:
Adjusted‡ Cost per Discharge: Emergency Department Visits in FY14:
Inpatient NPSR per CMAD: Change FY13-FY14:
Outpatient Visits in FY14:
For descriptions of the metrics, please see the technical appendix.
Hospital (17,814) = 6% of total regional discharges - - -
Total Surplus (Loss) in FY14:
Inpatient:Outpatient Revenue in FY14: 51%:49%
Outpatient Revenue in FY14: $226,579,926
14.2%
Total Revenue in FY14:
$19,739,000
$700,319,169
Change FY13-FY14:
What proportion of adult patient discharges from this hospital resulted
in a readmission at any hospital within 30 days, and how does this
compare to the state average?
What were the most common inpatient cases (DRGs) treated at the
hospital in FY14? What proportion of the region’s cases did this
hospital treat for each service?
17.0%
69th Percentile
How many central line-associated blood stream infections (CLABSI),
catheter-associated urinary tract infections (CAUTI), and surgical site
infections (SSI) after colon surgery did patients get at this hospital
compared to what was expected based on the hospital's characteristics
and case mix?
-1.7%
5.0%
Change FY11-FY13 (percentage points):
Early Elective Deliveries Rate (Jan 2014-Jun 2015):
17,814Inpatient Discharges in FY14:
-10.5%
41,343
Harvard Pilgrim Health Care
Quality
Readmission Rate in FY13:
Utilization
Change FY13-FY14: 2.7%
411,264
Where did most of the hospital's inpatients reside? What proportion of
each community's total discharges was attributed to this hospital?
2.0%
1.57, > cohort avg. (1.35); > statewide (1.00)
Change FY13-FY14:
TUFTS MEDICAL CENTER
$10,758
Trauma Center Designation:
$13,651
Tufts Medical Center is a large, non-profit academic medical center (AMC) located in the Metro Boston region. Tufts Medical Center is a teaching hospital
of Tufts University School of Medicine and includes the Floating Hospital for Children, which is located within the Tufts Medical Center complex. Tufts
Medical Center is one of eight organ transplant centers in Massachusetts. In FY14, it had the highest case mix index (indicating severity of cases) among
AMCs. Tufts Medical Center was profitable from FY10 to FY14, with a total margin of 2.8% in FY14, compared to a median total margin of 4.7% among
AMCs.
93.1%, highest in cohort (avg. 82%)
60.0% (Non-DSH* Hospital)
Tufts Associated Health Maintenance Org.
273, among the larger acute hospitals
Wellforce
Blue Cross Blue Shield of Massachusetts
Wellforce- 2014 (FY15)
ICBθ
Boston, MA
Academic Medical Center
Case Mix Index:
Metro Boston
Adult: Level 1, Pedi: Level 1
0.7%
At
a G
lan
ce
Ser
vice
s
15%
8%
6%
5%
10%
14%
5%
5%
3% 3%
0% 20% 40% 60% 80% 100%
Card Cath W Circ Disord Exc Isch Hrt Dis (253)
Cellulitis, Oth Bact Skn Inf (259)
Other Pneumonia (268)
Heart Failure (286)
Seizure (289)
Percut Card proc w/o AMI (328)
Sepsis & Dissem Inf (368)
Cesarean Delivery (444)
Vaginal Delivery (636)
Normal Neonate Birth (795)
Discharges by DRG
of regional discharges were treated at this hospital in FY14
4%
5%
3%
6%
6%
3%
6%
5%
6%
13%
0% 20% 40% 60% 80% 100%
Dorchester Center MA (264)
Medford MA (336)
Lawrence MA (373)
Malden MA (388)
Framingham MA (454)
Brockton MA (535)
Dorchester MA (640)
Lowell MA (643)
Quincy MA (644)
Boston MA (2,429)
Discharges by Community
Qu
alit
y
18.7%
17.0% 15.9%
15.0%
0%
5%
10%
15%
20%
25%
2011 2013
0
1
2
3CLABSI CAUTI SSI: Colon Surgery
of community discharges were treated at this hospital in FY14
Lower is Better
Lower is Better
State Average
C5
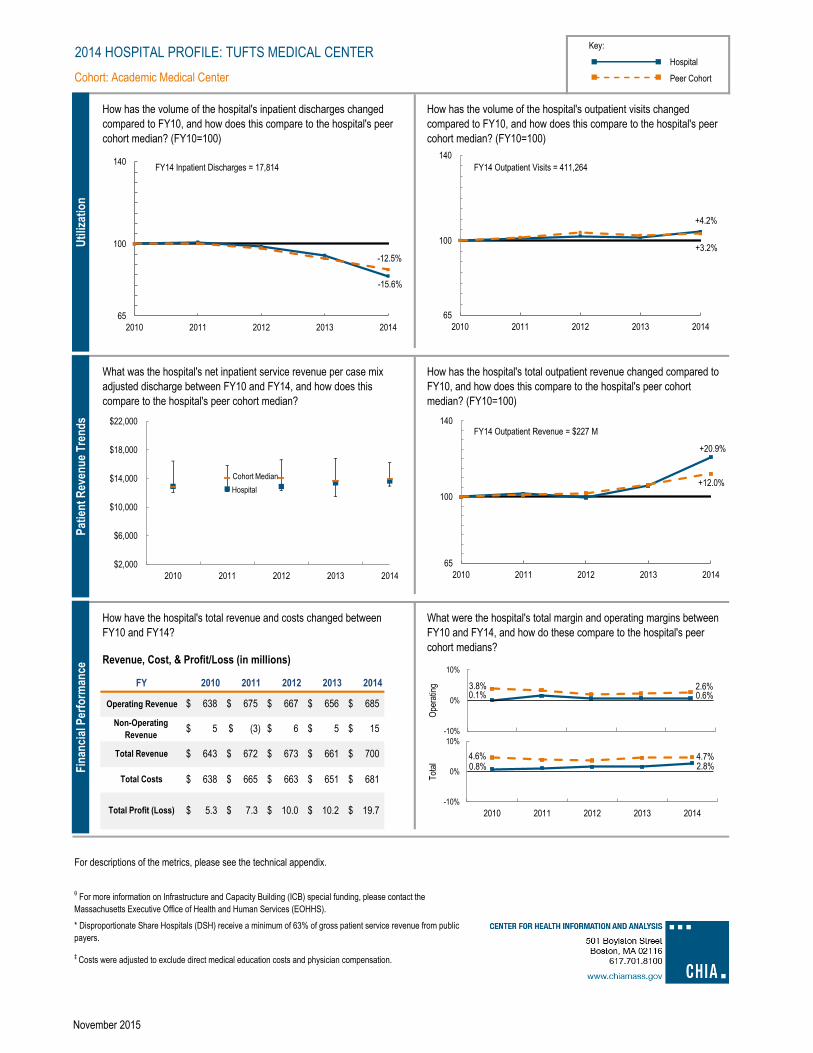
Key:
Hospital
Cohort: Academic Medical Center Peer Cohort
For descriptions of the metrics, please see the technical appendix.
672$ 643$ Total Revenue
‡ Costs were adjusted to exclude direct medical education costs and physician compensation.
θ For more information on Infrastructure and Capacity Building (ICB) special funding, please contact the
Massachusetts Executive Office of Health and Human Services (EOHHS).
665$ 663$ 651$
* Disproportionate Share Hospitals (DSH) receive a minimum of 63% of gross patient service revenue from public
payers.
675$ 667$ Operating Revenue
15$ 5$ 6$
Total Costs
Total Profit (Loss) 5.3$ 7.3$ 10.0$ 10.2$ 19.7$
681$ 638$
700$
Non-Operating
Revenue
685$ 656$ 638$
(3)$ 5$
673$ 661$
How has the hospital's total outpatient revenue changed compared to
FY10, and how does this compare to the hospital's peer cohort
median? (FY10=100)
2014 HOSPITAL PROFILE: TUFTS MEDICAL CENTER
What were the hospital's total margin and operating margins between
FY10 and FY14, and how do these compare to the hospital's peer
cohort medians?Revenue, Cost, & Profit/Loss (in millions)
How have the hospital's total revenue and costs changed between
FY10 and FY14?
How has the volume of the hospital's inpatient discharges changed
compared to FY10, and how does this compare to the hospital's peer
cohort median? (FY10=100)
How has the volume of the hospital's outpatient visits changed
compared to FY10, and how does this compare to the hospital's peer
cohort median? (FY10=100)
FY
What was the hospital's net inpatient service revenue per case mix
adjusted discharge between FY10 and FY14, and how does this
compare to the hospital's peer cohort median?
2011 2012 20132010 2014
Uti
lizat
ion
-15.6%
-12.5%
65707580859095
100105110115120125130135140
2010 2011 2012 2013 2014
FY14 Inpatient Discharges = 17,814
+4.2%
+3.2%
65707580859095
100105110115120125130135140
2010 2011 2012 2013 2014
FY14 Outpatient Visits = 411,264
Pat
ien
t R
even
ue
Tre
nd
s
Hospital
Cohort Median
$2,000
$6,000
$10,000
$14,000
$18,000
$22,000
2010 2011 2012 2013 2014
+20.9%
+12.0%
65707580859095
100105110115120125130135140
2010 2011 2012 2013 2014
FY14 Outpatient Revenue = $227 M
Fin
anci
al P
erfo
rman
ce
0.8% 2.8% 4.6% 4.7%
-10%
0%
10%
2010 2011 2012 2013 2014
Tot
al
0.1% 0.6% 3.8% 2.6%
-10%
0%
10%
Ope
ratin
g
November 2015

2014 Hospital Profile
Overview / Size Payer Mix
Hospital System Affiliation: Public Payer Mix:
Change in Ownership (FY10-FY14): CY14 Commercial Payer Price Level:
Total Staffed Beds: Top 3 Commercial Payers:
% Occupancy:
Special Public Funding:
Financial Change FY13-FY14:
Adjusted‡ Cost per Discharge: Emergency Department Visits in FY14:
Inpatient NPSR per CMAD: Change FY13-FY14:
Outpatient Visits in FY14:
For descriptions of the metrics, please see the technical appendix.
12.4%
1.26, < cohort avg. (1.35); > statewide (1.00)
Change FY13-FY14:
UMASS MEMORIAL MEDICAL CENTER
$11,743
Trauma Center Designation:
$12,925
UMass Memorial Medical Center is a large, non-profit academic medical center (AMC) located in the Central Massachusetts region. UMass Memorial is a
member of the UMass Memorial Health Care system and one of eight organ transplant centers in Massachusetts. It also qualifies as a Disproportionate
Share Hospital (DSH). Inpatient discharges decreased 12% at the hospital between FY10 and FY14, consistent with the median performance of its peer
cohort. UMass Memorial earned a profit each year from FY10 to FY14, with a total margin of 1.3% in FY14, lower than the peer cohort hospital median
total margin of 4.7%.
79.2%, < cohort avg. (82%)
64.3% (DSH* Hospital)
Fallon Health and Life Assurance Company
719, 4th largest acute hospital
UMass Memorial Health Care
Blue Cross Blue Shield of Massachusetts
Not Applicable
ICBθ
Worcester, MA
Academic Medical Center
Case Mix Index:
Central Massachusetts
Adult: Level 1, Pedi: Level 1
-2.1%
16.4%
72nd Percentile
How many central line-associated blood stream infections (CLABSI),
catheter-associated urinary tract infections (CAUTI), and surgical site
infections (SSI) after colon surgery did patients get at this hospital
compared to what was expected based on the hospital's characteristics
and case mix?
-0.6%Change FY11-FY13 (percentage points):
Early Elective Deliveries Rate (Jan 2014-Jun 2015):
40,343Inpatient Discharges in FY14:
-3.9%
132,110
Harvard Pilgrim Health Care
Quality
Readmission Rate in FY13:
Utilization
Change FY13-FY14: 0.7%
996,867
Where did most of the hospital's inpatients reside? What proportion of
each community's total discharges was attributed to this hospital?
Not ApplicableTotal Surplus (Loss) in FY14:
Inpatient:Outpatient Revenue in FY14: 44%:56%
Outpatient Revenue in FY14: $595,744,781
2.4%
Total Revenue in FY14:
$19,830,000
$1,523,219,000
Change FY13-FY14:
What proportion of adult patient discharges from this hospital resulted
in a readmission at any hospital within 30 days, and how does this
compare to the state average?
What were the most common inpatient cases (DRGs) treated at the
hospital in FY14? What proportion of the region’s cases did this
hospital treat for each service?
Hospital (40,343) = 52% of total regional discharges - - -
At
a G
lan
ce
Ser
vice
s
47%
46%
75%
31%
38%
39%
52%
46%
51%
50%
0% 20% 40% 60% 80% 100%
Bipolar Disorders (523)
Renal Failure (533)
Percut Card proc w/ AMI (538)
COPD (541)
Other Pneumonia (729)
Heart Failure (844)
Cesarean Delivery (1114)
Sepsis & Dissem Inf (1482)
Vaginal Delivery (2697)
Normal Neonate Birth (3404)
Discharges by DRG
of regional discharges were treated at this
hospital in FY14
28%
55%
44%
20%
20%
48%
40%
24%
60%
63%
0% 20% 40% 60% 80% 100%
Southbridge MA (655)
Holden MA (680)
Westborough MA (715)
Leominster MA (866)
Fitchburg MA (881)
Auburn MA (883)
Webster MA (886)
Marlborough MA (1,026)
Shrewsbury MA (1,885)
Worcester MA (13,559)
Discharges by Community
Qu
alit
y
16.9%
16.4% 15.9% 15.0%
0%
5%
10%
15%
20%
25%
2011 2013
0
1
2
3CLABSI CAUTI SSI: Colon Surgery
of community discharges were treated at this
hospital in FY14
Lower is Better
State Average
Lower is Better
C6

Key:
Hospital
Cohort: Academic Medical Center Peer Cohort
For descriptions of the metrics, please see the technical appendix.
FY
What was the hospital's net inpatient service revenue per case mix
adjusted discharge between FY10 and FY14, and how does this
compare to the hospital's peer cohort median?
2011 2012 20132010 2014
How has the hospital's total outpatient revenue changed compared to
FY10, and how does this compare to the hospital's peer cohort
median? (FY10=100)
2014 HOSPITAL PROFILE: UMASS MEMORIAL MEDICAL CENTER
What were the hospital's total margin and operating margins between
FY10 and FY14, and how do these compare to the hospital's peer
cohort medians?Revenue, Cost, & Profit/Loss (in millions)
How have the hospital's total revenue and costs changed between
FY10 and FY14?
How has the volume of the hospital's inpatient discharges changed
compared to FY10, and how does this compare to the hospital's peer
cohort median? (FY10=100)
How has the volume of the hospital's outpatient visits changed
compared to FY10, and how does this compare to the hospital's peer
cohort median? (FY10=100)
1,375$ 1,380$ Operating Revenue
3$ 104$ 17$
Total Costs
Total Profit (Loss) 57.2$ 42.9$ 27.8$ 68.9$ 19.8$
1,503$ 1,343$
1,523$
Non-Operating
Revenue
1,521$ 1,408$ 1,391$
(2)$ 9$
1,396$ 1,512$ 1,373$ 1,400$ Total Revenue
‡ Costs were adjusted to exclude direct medical education costs and physician compensation.
θ For more information on Infrastructure and Capacity Building (ICB) special funding, please contact the
Massachusetts Executive Office of Health and Human Services (EOHHS).
1,330$ 1,368$ 1,443$
* Disproportionate Share Hospitals (DSH) receive a minimum of 63% of gross patient service revenue from public
payers.
Uti
lizat
ion
-12.0%
-12.5%
65707580859095
100105110115120125130135140
2010 2011 2012 2013 2014
FY14 Inpatient Discharges = 40,343
-0.9%
+3.2%
65707580859095
100105110115120125130135140
2010 2011 2012 2013 2014
FY14 Outpatient Visits = 996,867
Pat
ien
t R
even
ue
Tre
nd
s
Hospital
Cohort Median
$2,000
$6,000
$10,000
$14,000
$18,000
$22,000
2010 2011 2012 2013 2014
+9.3%
+12.0%
65707580859095
100105110115120125130135140
2010 2011 2012 2013 2014
FY14 Outpatient Revenue = $596 M
Fin
anci
al P
erfo
rman
ce
4.1% 1.3%
4.6% 4.7%
-10%
0%
10%
2010 2011 2012 2013 2014
Tot
al
3.5% 1.1% 3.8% 2.6%
-10%
0%
10%
Ope
ratin
g
November 2015

2014 Hospital Profile
Overview / Size Payer Mix
Hospital System Affiliation: Public Payer Mix:
Change in Ownership (FY10-FY14): CY14 Commercial Payer Price Level:
Total Staffed Beds: Top 3 Commercial Payers:
% Occupancy:
Special Public Funding:
Financial Change FY13-FY14:
Adjusted‡ Cost per Discharge: Emergency Department Visits in FY14:
Inpatient NPSR per CMAD: Change FY13-FY14:
Outpatient Visits in FY14:
For descriptions of the metrics, please see the technical appendix.
Hospital (39,798) = 42% of total regional discharges - - -
Total Surplus (Loss) in FY14:
Inpatient:Outpatient Revenue in FY14: 47%:53%
Outpatient Revenue in FY14: $401,958,799
6.1%
Total Revenue in FY14:
$96,280,000
$1,080,564,000
Change FY13-FY14:
What proportion of adult patient discharges from this hospital resulted
in a readmission at any hospital within 30 days, and how does this
compare to the state average?
What were the most common inpatient cases (DRGs) treated at the
hospital in FY14? What proportion of the region’s cases did this
hospital treat for each service?
14.7%
60th Percentile
How many central line-associated blood stream infections (CLABSI),
catheter-associated urinary tract infections (CAUTI), and surgical site
infections (SSI) after colon surgery did patients get at this hospital
compared to what was expected based on the hospital's characteristics
and case mix?
0.5%
0.9%
Change FY11-FY13 (percentage points):
Early Elective Deliveries Rate (Jan 2014-Jun 2015):
39,798Inpatient Discharges in FY14:
2.3%
102,701
Cigna Health and Life Ins. Co. (EAST)
Quality
Readmission Rate in FY13:
Utilization
Change FY13-FY14: -0.7%
443,166
Where did most of the hospital's inpatients reside? What proportion of
each community's total discharges was attributed to this hospital?
3.1%
1.13, > cohort avg. (0.99); > statewide (1.00)
Change FY13-FY14:
BAYSTATE MEDICAL CENTER
$8,950
Trauma Center Designation:
$12,376
Baystate Medical Center is a non-profit teaching hospital located in the Western Massachusetts region. It is the third largest acute hospital in
Massachusetts, with 767 staffed beds. It is a member of the Baystate Health system and qualifies as a Disproportionate Share Hospital (DSH). It is the
only Level 1 Trauma Center its region, the only Pediatric Trauma Center in its region, and one of eight organ transplant centers in Massachusetts.
Baystate Medical Center was profitable each year from FY10 to FY14, with an 8.9% total margin in FY14, similar to the median among cohort hospitals.
69.9%, < cohort avg. (73%)
68.5% (DSH* Hospital)
Health New England, Inc.
767, 3rd largest acute hospital
Baystate Health
Blue Cross Blue Shield of Massachusetts
Not Applicable
ICBθ
Springfield, MA
Teaching Hospital
Case Mix Index:
Western Massachusetts
Adult: Level 1, Pedi: Level 2
2.4%
At
a G
lan
ce
Ser
vice
s
36%
37%
29%
100%
51%
39%
54%
44%
51%
50%
0% 20% 40% 60% 80% 100%
Card Arrth & Cond Dis (586)
Renal Failure (607)
COPD (613)
Percut Card proc w/ AMI (657)
Knee Joint Replacement (864)
Sepsis & Dissem Inf (1242)
Cesarean Delivery (1264)
Heart Failure (1402)
Vaginal Delivery (2775)
Normal Neonate Birth (3529)
Discharges by DRG
of regional discharges were treated at this
hospital in FY14
57%
68%
68%
55%
36%
63%
30%
57%
54%
65%
0% 20% 40% 60% 80% 100%
Wilbraham MA (821)
Longmeadow MA (897)
East Longmeadow MA (1,166)
Ludlow MA (1,190)
Westfield MA (1,623)
Agawam MA (1,691)
Holyoke MA (1,873)
West Springfield MA (1,934)
Chicopee MA (3,881)
Springfield MA (12,995)
Discharges by Community
Qu
alit
y
14.3% 14.7%
15.9% 15.0%
0%
5%
10%
15%
20%
25%
2011 2013
0
1
2
3
CLABSI CAUTI SSI: Colon Surgery
of community discharges were treated at this
hospital in FY14
Lower is Better
Lower is Better
State Average 3.2
C7
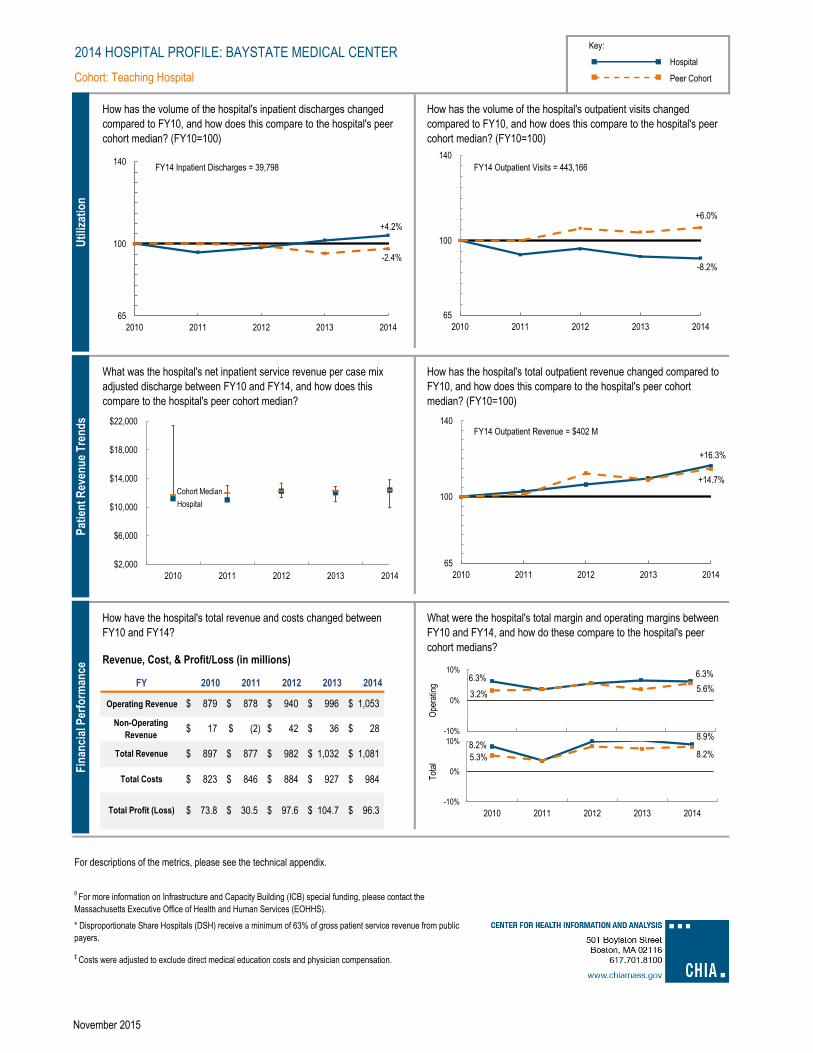
Key:
Hospital
Cohort: Teaching Hospital Peer Cohort
For descriptions of the metrics, please see the technical appendix.
877$ 897$ Total Revenue
‡ Costs were adjusted to exclude direct medical education costs and physician compensation.
θ For more information on Infrastructure and Capacity Building (ICB) special funding, please contact the
Massachusetts Executive Office of Health and Human Services (EOHHS).
846$ 884$ 927$
* Disproportionate Share Hospitals (DSH) receive a minimum of 63% of gross patient service revenue from public
payers.
878$ 940$ Operating Revenue
28$ 36$ 42$
Total Costs
Total Profit (Loss) 73.8$ 30.5$ 97.6$ 104.7$ 96.3$
984$ 823$
1,081$
Non-Operating
Revenue
1,053$ 996$ 879$
(2)$ 17$
982$ 1,032$
How has the hospital's total outpatient revenue changed compared to
FY10, and how does this compare to the hospital's peer cohort
median? (FY10=100)
2014 HOSPITAL PROFILE: BAYSTATE MEDICAL CENTER
What were the hospital's total margin and operating margins between
FY10 and FY14, and how do these compare to the hospital's peer
cohort medians?Revenue, Cost, & Profit/Loss (in millions)
How have the hospital's total revenue and costs changed between
FY10 and FY14?
How has the volume of the hospital's inpatient discharges changed
compared to FY10, and how does this compare to the hospital's peer
cohort median? (FY10=100)
How has the volume of the hospital's outpatient visits changed
compared to FY10, and how does this compare to the hospital's peer
cohort median? (FY10=100)
FY
What was the hospital's net inpatient service revenue per case mix
adjusted discharge between FY10 and FY14, and how does this
compare to the hospital's peer cohort median?
2011 2012 20132010 2014
Uti
lizat
ion
+4.2%
-2.4%
65707580859095
100105110115120125130135140
2010 2011 2012 2013 2014
FY14 Inpatient Discharges = 39,798
-8.2%
+6.0%
65707580859095
100105110115120125130135140
2010 2011 2012 2013 2014
FY14 Outpatient Visits = 443,166
Pat
ien
t R
even
ue
Tre
nd
s
Hospital
Cohort Median
$2,000
$6,000
$10,000
$14,000
$18,000
$22,000
2010 2011 2012 2013 2014
+16.3%
+14.7%
65707580859095
100105110115120125130135140
2010 2011 2012 2013 2014
FY14 Outpatient Revenue = $402 M
Fin
anci
al P
erfo
rman
ce
8.2% 8.9%
5.3% 8.2%
-10%
0%
10%
2010 2011 2012 2013 2014
Tot
al
6.3% 6.3%
3.2% 5.6%
-10%
0%
10%
Ope
ratin
g
November 2015
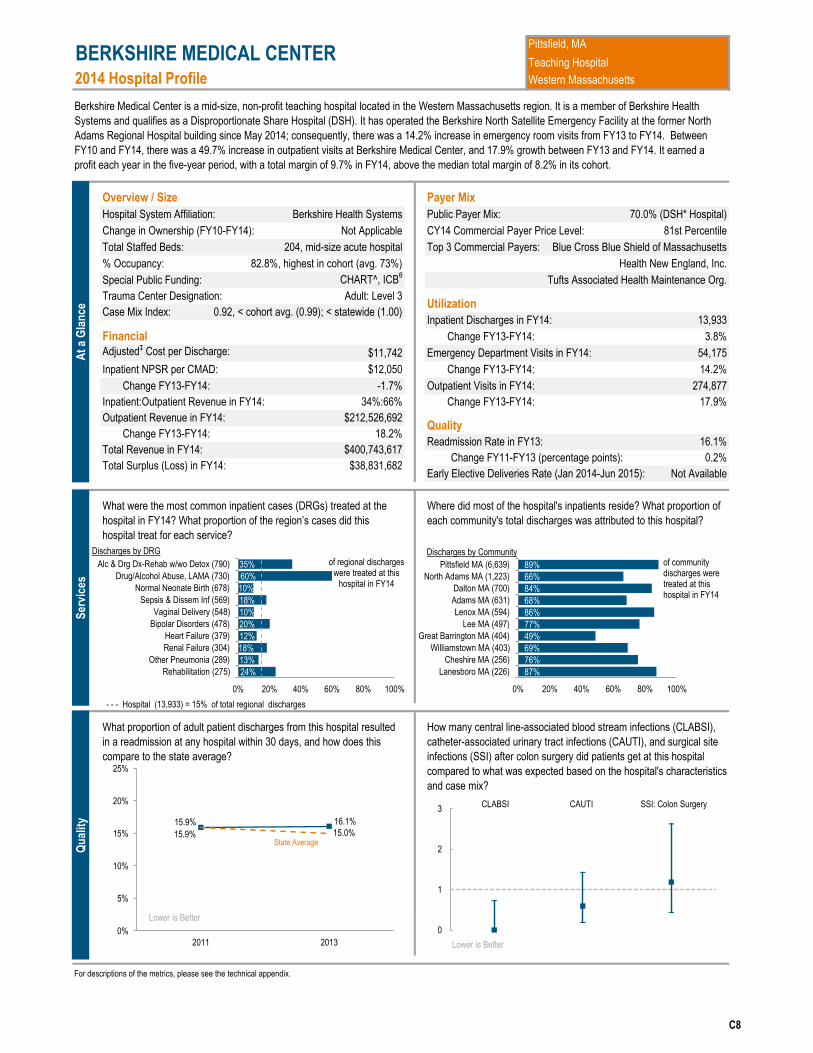
2014 Hospital Profile
Overview / Size Payer Mix
Hospital System Affiliation: Public Payer Mix:
Change in Ownership (FY10-FY14): CY14 Commercial Payer Price Level:
Total Staffed Beds: Top 3 Commercial Payers:
% Occupancy:
Special Public Funding:
Financial Change FY13-FY14:
Adjusted‡ Cost per Discharge: Emergency Department Visits in FY14:
Inpatient NPSR per CMAD: Change FY13-FY14:
Outpatient Visits in FY14:
For descriptions of the metrics, please see the technical appendix.
-1.7%
0.92, < cohort avg. (0.99); < statewide (1.00)
Change FY13-FY14:
BERKSHIRE MEDICAL CENTER
$11,742
Trauma Center Designation:
$12,050
Berkshire Medical Center is a mid-size, non-profit teaching hospital located in the Western Massachusetts region. It is a member of Berkshire Health
Systems and qualifies as a Disproportionate Share Hospital (DSH). It has operated the Berkshire North Satellite Emergency Facility at the former North
Adams Regional Hospital building since May 2014; consequently, there was a 14.2% increase in emergency room visits from FY13 to FY14. Between
FY10 and FY14, there was a 49.7% increase in outpatient visits at Berkshire Medical Center, and 17.9% growth between FY13 and FY14. It earned a
profit each year in the five-year period, with a total margin of 9.7% in FY14, above the median total margin of 8.2% in its cohort.
82.8%, highest in cohort (avg. 73%)
70.0% (DSH* Hospital)
Health New England, Inc.
204, mid-size acute hospital
Berkshire Health Systems
Blue Cross Blue Shield of Massachusetts
Not Applicable
CHART^, ICBθ
Pittsfield, MA
Teaching Hospital
Case Mix Index:
Western Massachusetts
Adult: Level 3
14.2%
16.1%
81st Percentile
How many central line-associated blood stream infections (CLABSI),
catheter-associated urinary tract infections (CAUTI), and surgical site
infections (SSI) after colon surgery did patients get at this hospital
compared to what was expected based on the hospital's characteristics
and case mix?
0.2%
Not Available
Change FY11-FY13 (percentage points):
Early Elective Deliveries Rate (Jan 2014-Jun 2015):
13,933Inpatient Discharges in FY14:
3.8%
54,175
Tufts Associated Health Maintenance Org.
Quality
Readmission Rate in FY13:
Utilization
Change FY13-FY14: 17.9%
274,877
Where did most of the hospital's inpatients reside? What proportion of
each community's total discharges was attributed to this hospital?
Total Surplus (Loss) in FY14:
Inpatient:Outpatient Revenue in FY14: 34%:66%
Outpatient Revenue in FY14: $212,526,692
18.2%
Total Revenue in FY14:
$38,831,682
$400,743,617
Change FY13-FY14:
What proportion of adult patient discharges from this hospital resulted
in a readmission at any hospital within 30 days, and how does this
compare to the state average?
What were the most common inpatient cases (DRGs) treated at the
hospital in FY14? What proportion of the region’s cases did this
hospital treat for each service?
Hospital (13,933) = 15% of total regional discharges - - -
At
a G
lan
ce
Ser
vice
s
24%
13%
18%
12%
20%
10%
18%
10%
60%
35%
0% 20% 40% 60% 80% 100%
Rehabilitation (275)
Other Pneumonia (289)
Renal Failure (304)
Heart Failure (379)
Bipolar Disorders (478)
Vaginal Delivery (548)
Sepsis & Dissem Inf (569)
Normal Neonate Birth (678)
Drug/Alcohol Abuse, LAMA (730)
Alc & Drg Dx-Rehab w/wo Detox (790)
Discharges by DRG of regional discharges
were treated at this hospital in FY14
87%
76%
69%
49%
77%
86%
68%
84%
66%
89%
0% 20% 40% 60% 80% 100%
Lanesboro MA (226)
Cheshire MA (256)
Williamstown MA (403)
Great Barrington MA (404)
Lee MA (497)
Lenox MA (594)
Adams MA (631)
Dalton MA (700)
North Adams MA (1,223)
Pittsfield MA (6,639)
Discharges by Community
Qu
alit
y
15.9%
16.1% 15.9% 15.0%
0%
5%
10%
15%
20%
25%
2011 2013
0
1
2
3CLABSI CAUTI SSI: Colon Surgery
of community discharges were treated at this hospital in FY14
Lower is Better
Lower is Better
State Average
C8
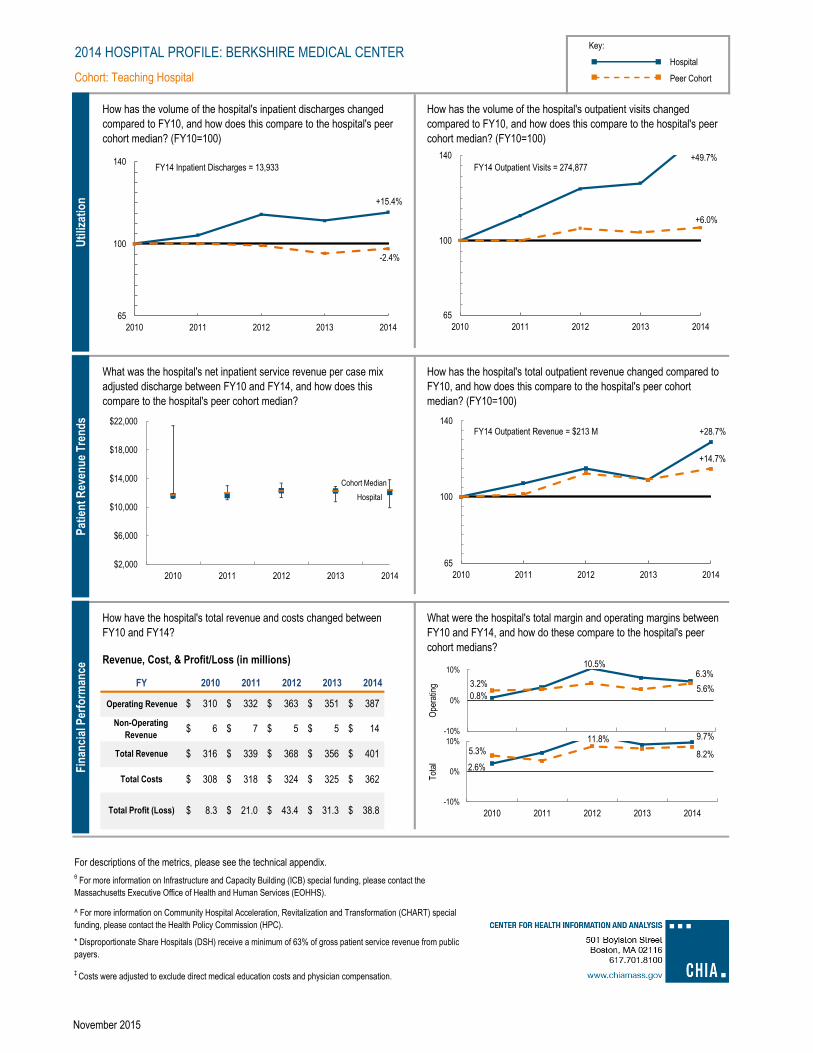
Key:
Hospital
Cohort: Teaching Hospital Peer Cohort
For descriptions of the metrics, please see the technical appendix.
FY
What was the hospital's net inpatient service revenue per case mix
adjusted discharge between FY10 and FY14, and how does this
compare to the hospital's peer cohort median?
2011 2012 20132010 2014
How has the hospital's total outpatient revenue changed compared to
FY10, and how does this compare to the hospital's peer cohort
median? (FY10=100)
2014 HOSPITAL PROFILE: BERKSHIRE MEDICAL CENTER
What were the hospital's total margin and operating margins between
FY10 and FY14, and how do these compare to the hospital's peer
cohort medians?Revenue, Cost, & Profit/Loss (in millions)
How have the hospital's total revenue and costs changed between
FY10 and FY14?
How has the volume of the hospital's inpatient discharges changed
compared to FY10, and how does this compare to the hospital's peer
cohort median? (FY10=100)
How has the volume of the hospital's outpatient visits changed
compared to FY10, and how does this compare to the hospital's peer
cohort median? (FY10=100)
332$ 363$ Operating Revenue
14$ 5$ 5$
Total Costs
Total Profit (Loss) 8.3$ 21.0$ 43.4$ 31.3$ 38.8$
362$ 308$
401$
Non-Operating
Revenue
387$ 351$ 310$
7$ 6$
368$ 356$ 339$ 316$ Total Revenue
‡ Costs were adjusted to exclude direct medical education costs and physician compensation.
^ For more information on Community Hospital Acceleration, Revitalization and Transformation (CHART) special
funding, please contact the Health Policy Commission (HPC).
θ For more information on Infrastructure and Capacity Building (ICB) special funding, please contact the
Massachusetts Executive Office of Health and Human Services (EOHHS).
318$ 324$ 325$
* Disproportionate Share Hospitals (DSH) receive a minimum of 63% of gross patient service revenue from public
payers.
Uti
lizat
ion
+15.4%
-2.4%
65707580859095
100105110115120125130135140
2010 2011 2012 2013 2014
FY14 Inpatient Discharges = 13,933
+6.0%
65707580859095
100105110115120125130135140
2010 2011 2012 2013 2014
FY14 Outpatient Visits = 274,877
Pat
ien
t R
even
ue
Tre
nd
s
Hospital
Cohort Median
$2,000
$6,000
$10,000
$14,000
$18,000
$22,000
2010 2011 2012 2013 2014
+28.7%
+14.7%
65707580859095
100105110115120125130135140
2010 2011 2012 2013 2014
FY14 Outpatient Revenue = $213 M
Fin
anci
al P
erfo
rman
ce
2.6%
9.7%
5.3% 8.2%
-10%
0%
10%
2010 2011 2012 2013 2014
Tot
al
0.8%
6.3% 3.2%
5.6%
-10%
0%
10%
Ope
ratin
g
+49.7%
11.8%
10.5%
November 2015

2014 Hospital Profile
Overview / Size Payer Mix
Hospital System Affiliation: Public Payer Mix:
Change in Ownership (FY10-FY14): CY14 Commercial Payer Price Level:
Total Staffed Beds: Top 3 Commercial Payers:
% Occupancy:
Special Public Funding:
Financial Change FY13-FY14:
Adjusted‡ Cost per Discharge: Emergency Department Visits in FY14:
Inpatient NPSR per CMAD: Change FY13-FY14:
Outpatient Visits in FY14:
For descriptions of the metrics, please see the technical appendix.
BRIGHAM AND WOMEN'S FAULKNER HOSPITAL
$14,148
Trauma Center Designation:
$13,132
Brigham and Women’s Faulkner Hospital is a non-profit teaching hospital located in the Metro Boston region. It is a mid-sized acute hospitals in
Massachusetts and is a member of Partners HealthCare System. Though it only accounted for 3% of total regional discharges in FY14, it treated 22% of
Alcohol Abuse and Dependence cases and 21% of Mastectomy Procedures in Metro Boston. Outpatient visits at the hospital decreased 30% between
FY10 and FY14, while there was a median increase of 6.0% in its peer cohort during that period. The hospital had the highest total margin in the five year
period in FY14 at 4.4%, though still lower than its peer cohort’s median total margin of 8.2%.
67.9%, lowest in cohort (avg. 73%)
55.7% (Non-DSH* Hospital)
Harvard Pilgrim Health Care
138, mid-size acute hospital
Partners HealthCare System
Blue Cross Blue Shield of Massachusetts
Not Applicable
Not Applicable
Boston, MA
Teaching Hospital
Case Mix Index:
Metro Boston
Not Applicable
-15.0%
What were the most common inpatient cases (DRGs) treated at the
hospital in FY14? What proportion of the region’s cases did this
hospital treat for each service?
14.6%
71st Percentile
How many central line-associated blood stream infections (CLABSI),
catheter-associated urinary tract infections (CAUTI), and surgical site
infections (SSI) after colon surgery did patients get at this hospital
compared to what was expected based on the hospital's characteristics
and case mix?
-0.5%Change FY11-FY13 (percentage points):
Early Elective Deliveries Rate (Jan 2014-Jun 2015):
7,566Inpatient Discharges in FY14:
4.9%
22,215
Tufts Associated Health Maintenance Org.
Quality
Readmission Rate in FY13:
Utilization
Change FY13-FY14: -23.3%
37,353
Where did most of the hospital's inpatients reside? What proportion of
each community's total discharges was attributed to this hospital?
12.6%
0.85, < cohort avg. (0.99); < statewide (1.00)
Change FY13-FY14:
Total Surplus (Loss) in FY14:
Inpatient:Outpatient Revenue in FY14: 32%:68%
Outpatient Revenue in FY14: $111,096,923
-1.0%
Total Revenue in FY14:
$9,177,000
$208,020,000
Change FY13-FY14:
Hospital (7,566) = 3% of total regional discharges - - -
What proportion of adult patient discharges from this hospital resulted
in a readmission at any hospital within 30 days, and how does this
compare to the state average?
Not Applicable
At
a G
lan
ce
Ser
vice
s
5%
6%
4%
5%
6%
4%
4%
21%
6%
22%
0% 20% 40% 60% 80% 100%
Kidney & UT Infections (167)
Maj Dep& Oth/Unsp Psychoses (168)
Other Pneumonia (170)
Cellulitis, Oth Bact Skn Inf (172)
COPD (174)
Sepsis & Dissem Inf (245)
Heart Failure (253)
Mastectomy Procedures (273)
Knee Joint Replacement (392)
Alcohol Abuse & Dependence (546)
Discharges by DRG
of regional discharges were treated at this hospital in FY14
4%
3%
4%
2%
1%
13%
16%
17%
24%
29%
0% 20% 40% 60% 80% 100%
Mattapan MA (139)
Dorchester Center MA (171)
Norwood MA (190)
Dorchester MA (210)
Boston MA (243)
Jamaica Plain MA (502)
Dedham MA (536)
Hyde Park MA (659)
Roslindale MA (811)
West Roxbury MA (881)
Discharges by Community
Qu
alit
y
15.1% 14.6%
15.9% 15.0%
0%
5%
10%
15%
20%
25%
2011 2013
0
1
2
3CLABSI CAUTI SSI: Colon Surgery
of community discharges were treated at this hospital in FY14
Lower is Better
Lower is Better
State Average
C9

Key:
Hospital
Cohort: Teaching Hospital Peer Cohort
For descriptions of the metrics, please see the technical appendix.
Total Revenue
2014 HOSPITAL PROFILE: BRIGHAM AND WOMEN'S FAULKNER HOSPITAL
What were the hospital's total margin and operating margins between
FY10 and FY14, and how do these compare to the hospital's peer
cohort medians?Revenue, Cost, & Profit/Loss (in millions)
How have the hospital's total revenue and costs changed between
FY10 and FY14?
How has the volume of the hospital's inpatient discharges changed
compared to FY10, and how does this compare to the hospital's peer
cohort median? (FY10=100)
How has the volume of the hospital's outpatient visits changed
compared to FY10, and how does this compare to the hospital's peer
cohort median? (FY10=100)
FY
What was the hospital's net inpatient service revenue per case mix
adjusted discharge between FY10 and FY14, and how does this
compare to the hospital's peer cohort median?
2011 2012 20132010 2014
193$ 184$
(0)$ (1)$
198$ 193$
How has the hospital's total outpatient revenue changed compared to
FY10, and how does this compare to the hospital's peer cohort
median? (FY10=100)
181$ 183$
‡ Costs were adjusted to exclude direct medical education costs and physician compensation.
186$ 194$ 193$
* Disproportionate Share Hospitals (DSH) receive a minimum of 63% of gross patient service revenue from public
payers.
181$ 198$ Operating Revenue
(0)$ 0$ 0$
Total Costs
Total Profit (Loss) 1.9$ (4.1)$ 4.4$ (0.0)$ 9.2$
199$ 181$
208$
Non-Operating
Revenue
208$
Uti
lizat
ion
+0.0%
-2.4%
65707580859095
100105110115120125130135140
2010 2011 2012 2013 2014
FY14 Inpatient Discharges = 7,566
-30.0%
+6.0%
65707580859095
100105110115120125130135140
2010 2011 2012 2013 2014
FY14 Outpatient Visits = 37,353
Pat
ien
t R
even
ue
Tre
nd
s
Hospital
Cohort Median
$2,000
$6,000
$10,000
$14,000
$18,000
$22,000
2010 2011 2012 2013 2014
+6.8%
+14.7%
65707580859095
100105110115120125130135140
2010 2011 2012 2013 2014
FY14 Outpatient Revenue = $111 M
Fin
anci
al P
erfo
rman
ce
1.1% 4.4%
5.3% 8.2%
-10%
0%
10%
2010 2011 2012 2013 2014
Tot
al
1.5% 4.4% 3.2% 5.6%
-10%
0%
10%
Ope
ratin
g
November 2015
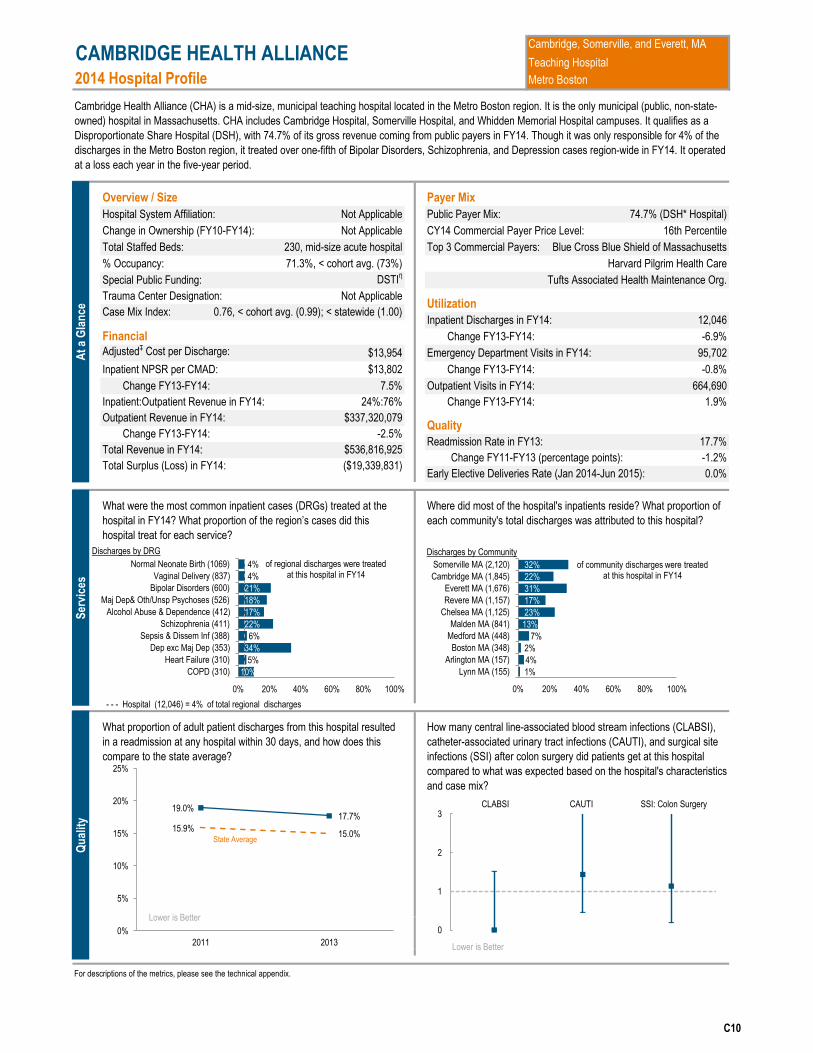
2014 Hospital Profile
Overview / Size Payer Mix
Hospital System Affiliation: Public Payer Mix:
Change in Ownership (FY10-FY14): CY14 Commercial Payer Price Level:
Total Staffed Beds: Top 3 Commercial Payers:
% Occupancy:
Special Public Funding:
Financial Change FY13-FY14:
Adjusted‡ Cost per Discharge: Emergency Department Visits in FY14:
Inpatient NPSR per CMAD: Change FY13-FY14:
Outpatient Visits in FY14:
For descriptions of the metrics, please see the technical appendix.
7.5%
0.76, < cohort avg. (0.99); < statewide (1.00)
Change FY13-FY14:
CAMBRIDGE HEALTH ALLIANCE
$13,954
Trauma Center Designation:
$13,802
Cambridge Health Alliance (CHA) is a mid-size, municipal teaching hospital located in the Metro Boston region. It is the only municipal (public, non-state-
owned) hospital in Massachusetts. CHA includes Cambridge Hospital, Somerville Hospital, and Whidden Memorial Hospital campuses. It qualifies as a
Disproportionate Share Hospital (DSH), with 74.7% of its gross revenue coming from public payers in FY14. Though it was only responsible for 4% of the
discharges in the Metro Boston region, it treated over one-fifth of Bipolar Disorders, Schizophrenia, and Depression cases region-wide in FY14. It operated
at a loss each year in the five-year period.
71.3%, < cohort avg. (73%)
74.7% (DSH* Hospital)
Harvard Pilgrim Health Care
230, mid-size acute hospital
Not Applicable
Blue Cross Blue Shield of Massachusetts
Not Applicable
DSTIη
Cambridge, Somerville, and Everett, MA
Teaching Hospital
Case Mix Index:
Metro Boston
Not Applicable
-0.8%
17.7%
16th Percentile
How many central line-associated blood stream infections (CLABSI),
catheter-associated urinary tract infections (CAUTI), and surgical site
infections (SSI) after colon surgery did patients get at this hospital
compared to what was expected based on the hospital's characteristics
and case mix?
-1.2%
0.0%
Change FY11-FY13 (percentage points):
Early Elective Deliveries Rate (Jan 2014-Jun 2015):
12,046Inpatient Discharges in FY14:
-6.9%
95,702
Tufts Associated Health Maintenance Org.
Quality
Readmission Rate in FY13:
Utilization
Change FY13-FY14: 1.9%
664,690
Where did most of the hospital's inpatients reside? What proportion of
each community's total discharges was attributed to this hospital?
Total Surplus (Loss) in FY14:
Inpatient:Outpatient Revenue in FY14: 24%:76%
Outpatient Revenue in FY14: $337,320,079
-2.5%
Total Revenue in FY14:
($19,339,831)
$536,816,925
Change FY13-FY14:
What proportion of adult patient discharges from this hospital resulted
in a readmission at any hospital within 30 days, and how does this
compare to the state average?
What were the most common inpatient cases (DRGs) treated at the
hospital in FY14? What proportion of the region’s cases did this
hospital treat for each service?
Hospital (12,046) = 4% of total regional discharges - - -
At
a G
lan
ce
Ser
vice
s
10%
5%
34%
6%
22%
17%
18%
21%
4%
4%
0% 20% 40% 60% 80% 100%
COPD (310)
Heart Failure (310)
Dep exc Maj Dep (353)
Sepsis & Dissem Inf (388)
Schizophrenia (411)
Alcohol Abuse & Dependence (412)
Maj Dep& Oth/Unsp Psychoses (526)
Bipolar Disorders (600)
Vaginal Delivery (837)
Normal Neonate Birth (1069)
Discharges by DRG
of regional discharges were treated at this hospital in FY14
1%
4%
2%
7%
13%
23%
17%
31%
22%
32%
0% 20% 40% 60% 80% 100%
Lynn MA (155)
Arlington MA (157)
Boston MA (348)
Medford MA (448)
Malden MA (841)
Chelsea MA (1,125)
Revere MA (1,157)
Everett MA (1,676)
Cambridge MA (1,845)
Somerville MA (2,120)
Discharges by Community
Qu
alit
y
19.0% 17.7%
15.9% 15.0%
0%
5%
10%
15%
20%
25%
2011 2013
0
1
2
3CLABSI CAUTI SSI: Colon Surgery
of community discharges were treated at this hospital in FY14
Lower is Better
Lower is Better
State Average
C10

Key:
Hospital
Cohort: Teaching Hospital Peer Cohort
For descriptions of the metrics, please see the technical appendix.
FY
What was the hospital's net inpatient service revenue per case mix
adjusted discharge between FY10 and FY14, and how does this
compare to the hospital's peer cohort median?
2011 2012 20132010 2014
How has the hospital's total outpatient revenue changed compared to
FY10, and how does this compare to the hospital's peer cohort
median? (FY10=100)
2014 HOSPITAL PROFILE: CAMBRIDGE HEALTH ALLIANCE
What were the hospital's total margin and operating margins between
FY10 and FY14, and how do these compare to the hospital's peer
cohort medians?Revenue, Cost, & Profit/Loss (in millions)
How have the hospital's total revenue and costs changed between
FY10 and FY14?
How has the volume of the hospital's inpatient discharges changed
compared to FY10, and how does this compare to the hospital's peer
cohort median? (FY10=100)
How has the volume of the hospital's outpatient visits changed
compared to FY10, and how does this compare to the hospital's peer
cohort median? (FY10=100)
490$ 526$ Operating Revenue
6$ 6$ 6$
Total Costs
Total Profit (Loss) (20.1)$ (36.9)$ (28.5)$ (20.0)$ (19.3)$
556$ 518$
537$
Non-Operating
Revenue
530$ 528$ 492$
6$ 6$
532$ 535$ 496$ 498$ Total Revenue
‡ Costs were adjusted to exclude direct medical education costs and physician compensation.
η For more information on Delivery System Transformation Initiative (DSTI) special funding, please contact the
Massachusetts Executive Office of Health and Human Service (EOHHS).
533$ 561$ 554$
* Disproportionate Share Hospitals (DSH) receive a minimum of 63% of gross patient service revenue from public
payers.
Uti
lizat
ion
-2.4%
-2.4%
65707580859095
100105110115120125130135140
2010 2011 2012 2013 2014
FY14 Inpatient Discharges = 12,046
+6.0%
+6.0%
65707580859095
100105110115120125130135140
2010 2011 2012 2013 2014
FY14 Outpatient Visits = 664,690
Pat
ien
t R
even
ue
Tre
nd
s
Hospital
Cohort Median
$2,000
$6,000
$10,000
$14,000
$18,000
$22,000
2010 2011 2012 2013 2014
+7.4%
+14.7%
65707580859095
100105110115120125130135140
2010 2011 2012 2013 2014
FY14 Outpatient Revenue = $337 M
Fin
anci
al P
erfo
rman
ce
-4.0% -3.6%
5.3% 8.2%
-10%
0%
10%
2010 2011 2012 2013 2014
Tot
al
-5.2% -4.8%
3.2% 5.6%
-10%
0%
10%
Ope
ratin
g
November 2015
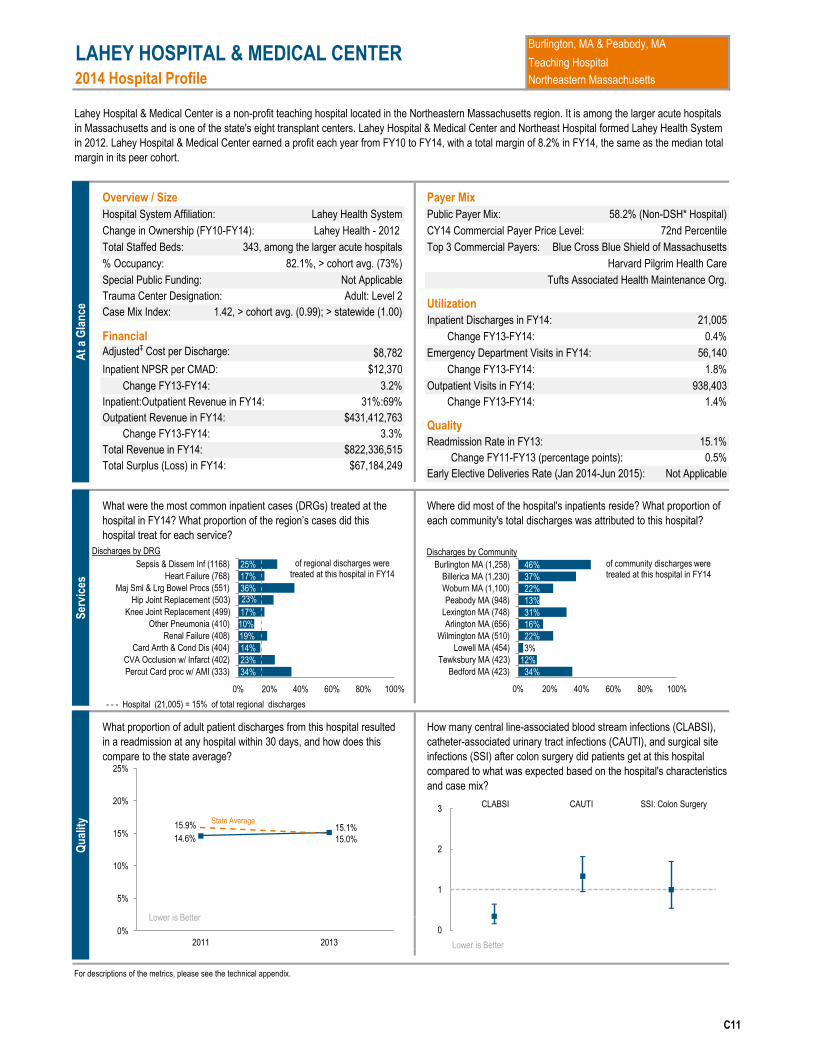
2014 Hospital Profile
Overview / Size Payer Mix
Hospital System Affiliation: Public Payer Mix:
Change in Ownership (FY10-FY14): CY14 Commercial Payer Price Level:
Total Staffed Beds: Top 3 Commercial Payers:
% Occupancy:
Special Public Funding:
Financial Change FY13-FY14:
Adjusted‡ Cost per Discharge: Emergency Department Visits in FY14:
Inpatient NPSR per CMAD: Change FY13-FY14:
Outpatient Visits in FY14:
For descriptions of the metrics, please see the technical appendix.
LAHEY HOSPITAL & MEDICAL CENTER
$8,782
Trauma Center Designation:
$12,370
Lahey Hospital & Medical Center is a non-profit teaching hospital located in the Northeastern Massachusetts region. It is among the larger acute hospitals
in Massachusetts and is one of the state's eight transplant centers. Lahey Hospital & Medical Center and Northeast Hospital formed Lahey Health System
in 2012. Lahey Hospital & Medical Center earned a profit each year from FY10 to FY14, with a total margin of 8.2% in FY14, the same as the median total
margin in its peer cohort.
82.1%, > cohort avg. (73%)
58.2% (Non-DSH* Hospital)
Harvard Pilgrim Health Care
343, among the larger acute hospitals
Lahey Health System
Blue Cross Blue Shield of Massachusetts
Lahey Health - 2012
Not Applicable
Burlington, MA & Peabody, MA
Teaching Hospital
Case Mix Index:
Northeastern Massachusetts
Adult: Level 2
1.8%
What were the most common inpatient cases (DRGs) treated at the
hospital in FY14? What proportion of the region’s cases did this
hospital treat for each service?
15.1%
72nd Percentile
How many central line-associated blood stream infections (CLABSI),
catheter-associated urinary tract infections (CAUTI), and surgical site
infections (SSI) after colon surgery did patients get at this hospital
compared to what was expected based on the hospital's characteristics
and case mix?
0.5%Change FY11-FY13 (percentage points):
Early Elective Deliveries Rate (Jan 2014-Jun 2015):
21,005Inpatient Discharges in FY14:
0.4%
56,140
Tufts Associated Health Maintenance Org.
Quality
Readmission Rate in FY13:
Utilization
Change FY13-FY14: 1.4%
938,403
Where did most of the hospital's inpatients reside? What proportion of
each community's total discharges was attributed to this hospital?
3.2%
1.42, > cohort avg. (0.99); > statewide (1.00)
Change FY13-FY14:
Total Surplus (Loss) in FY14:
Inpatient:Outpatient Revenue in FY14: 31%:69%
Outpatient Revenue in FY14: $431,412,763
3.3%
Total Revenue in FY14:
$67,184,249
$822,336,515
Change FY13-FY14:
Hospital (21,005) = 15% of total regional discharges - - -
What proportion of adult patient discharges from this hospital resulted
in a readmission at any hospital within 30 days, and how does this
compare to the state average?
Not Applicable
At
a G
lan
ce
Ser
vice
s
34%
23%
14%
19%
10%
17%
23% 36%
17%
25%
0% 20% 40% 60% 80% 100%
Percut Card proc w/ AMI (333)
CVA Occlusion w/ Infarct (402)
Card Arrth & Cond Dis (404)
Renal Failure (408)
Other Pneumonia (410)
Knee Joint Replacement (499)
Hip Joint Replacement (503)
Maj Sml & Lrg Bowel Procs (551)
Heart Failure (768)
Sepsis & Dissem Inf (1168)
Discharges by DRG
of regional discharges were treated at this hospital in FY14
34%
12%
3%
22%
16%
31%
13%
22%
37%
46%
0% 20% 40% 60% 80% 100%
Bedford MA (423)
Tewksbury MA (423)
Lowell MA (454)
Wilmington MA (510)
Arlington MA (656)
Lexington MA (748)
Peabody MA (948)
Woburn MA (1,100)
Billerica MA (1,230)
Burlington MA (1,258)
Discharges by Community
Qu
alit
y
14.6% 15.1% 15.9%
15.0%
0%
5%
10%
15%
20%
25%
2011 2013
0
1
2
3CLABSI CAUTI SSI: Colon Surgery
of community discharges were treated at this hospital in FY14
Lower is Better
Lower is Better
State Average
C11

Key:
Hospital
Cohort: Teaching Hospital Peer Cohort
For descriptions of the metrics, please see the technical appendix.
Total Revenue
2014 HOSPITAL PROFILE: LAHEY HOSPITAL & MEDICAL CENTER
What were the hospital's total margin and operating margins between
FY10 and FY14, and how do these compare to the hospital's peer
cohort medians?Revenue, Cost, & Profit/Loss (in millions)
How have the hospital's total revenue and costs changed between
FY10 and FY14?
How has the volume of the hospital's inpatient discharges changed
compared to FY10, and how does this compare to the hospital's peer
cohort median? (FY10=100)
How has the volume of the hospital's outpatient visits changed
compared to FY10, and how does this compare to the hospital's peer
cohort median? (FY10=100)
FY
What was the hospital's net inpatient service revenue per case mix
adjusted discharge between FY10 and FY14, and how does this
compare to the hospital's peer cohort median?
2011 2012 20132010 2014
794$ 894$
(0)$ 19$
817$ 794$
How has the hospital's total outpatient revenue changed compared to
FY10, and how does this compare to the hospital's peer cohort
median? (FY10=100)
760$ 913$
‡ Costs were adjusted to exclude direct medical education costs and physician compensation.
695$ 748$ 734$
* Disproportionate Share Hospitals (DSH) receive a minimum of 63% of gross patient service revenue from public
payers.
760$ 816$ Operating Revenue
1$ (0)$ 0$
Total Costs
Total Profit (Loss) 47.9$ 65.1$ 68.3$ 60.1$ 67.2$
755$ 865$
822$
Non-Operating
Revenue
821$
Uti
lizat
ion
-4.5%
-2.4%
65707580859095
100105110115120125130135140
2010 2011 2012 2013 2014
FY14 Inpatient Discharges = 21,005
+14.1%
+6.0%
65707580859095
100105110115120125130135140
2010 2011 2012 2013 2014
FY14 Outpatient Visits = 938,403
Pat
ien
t R
even
ue
Tre
nd
s
Hospital
Cohort Median
$2,000
$6,000
$10,000
$14,000
$18,000
$22,000
2010 2011 2012 2013 2014
+20.3%
+14.7%
65707580859095
100105110115120125130135140
2010 2011 2012 2013 2014
FY14 Outpatient Revenue = $431 M
Fin
anci
al P
erfo
rman
ce
5.3%
8.2%
5.3% 8.2%
-10%
0%
10%
2010 2011 2012 2013 2014
Tot
al
3.2%
8.1%
3.2% 5.6%
-10%
0%
10%
Ope
ratin
g
November 2015

2014 Hospital Profile
Overview / Size Payer Mix
Hospital System Affiliation: Public Payer Mix:
Change in Ownership (FY10-FY14): CY14 Commercial Payer Price Level:
Total Staffed Beds: Top 3 Commercial Payers:
% Occupancy:
Special Public Funding:
Financial Change FY13-FY14:
Adjusted‡ Cost per Discharge: Emergency Department Visits in FY14:
Inpatient NPSR per CMAD: Change FY13-FY14:
Outpatient Visits in FY14:
For descriptions of the metrics, please see the technical appendix.
Hospital (14,040) = 5% of total regional discharges - - -
What proportion of adult patient discharges from this hospital resulted
in a readmission at any hospital within 30 days, and how does this
compare to the state average?
Inpatient:Outpatient Revenue in FY14: 33%:67%
Outpatient Revenue in FY14: $165,199,128
4.1%
Total Revenue in FY14:
$30,679,000
$332,087,000
Change FY13-FY14:
What were the most common inpatient cases (DRGs) treated at the
hospital in FY14? What proportion of the region’s cases did this
hospital treat for each service?
12.7%
60th Percentile
How many central line-associated blood stream infections (CLABSI),
catheter-associated urinary tract infections (CAUTI), and surgical site
infections (SSI) after colon surgery did patients get at this hospital
compared to what was expected based on the hospital's characteristics
and case mix?
-2.0%
0.0%
Change FY11-FY13 (percentage points):
Early Elective Deliveries Rate (Jan 2014-Jun 2015):
14,040Inpatient Discharges in FY14:
5.5%
35,246
Harvard Pilgrim Health Care
Quality
Readmission Rate in FY13:
Utilization
Change FY13-FY14: -2.5%
174,654
Where did most of the hospital's inpatients reside? What proportion of
each community's total discharges was attributed to this hospital?
-0.2%
0.84, < cohort avg. (0.99); < statewide (1.00)
Change FY13-FY14:
Total Surplus (Loss) in FY14:
MOUNT AUBURN HOSPITAL
$9,563
Trauma Center Designation:
$12,379
Mount Auburn Hospital is a mid-size, non-profit teaching hospital located in the Metro Boston region. It is a member of the CareGroup health care system.
Between FY10 and FY14, outpatient visits decreased by 6.9% at Mount Auburn Hospital, compared to a median increase of 6.0% in its peer cohort.
Outpatient revenue increased 14.7% for the hospital in that period, consistent with the median performance of its cohort. Mount Auburn Hospital was
profitable each year from FY10 to FY14, and it earned a total margin of 9.2%, higher than the median of its peer cohort.
71.3%, < cohort avg. (73%)
53.8% (Non-DSH* Hospital)
Tufts Associated Health Maintenance Org.
225, mid-size acute hospital
CareGroup
Blue Cross Blue Shield of Massachusetts
Not Applicable
Not Applicable
Cambridge, MA
Teaching Hospital
Case Mix Index:
Metro Boston
Not Applicable
-1.4%
At
a G
lan
ce
Ser
vice
s
5%
3%
6%
6%
7%
5%
6%
6%
9%
8%
0% 20% 40% 60% 80% 100%
COPD (160)
Knee Joint Replacement (185)
Card Arrth & Cond Dis (201)
Kidney & UT Infections (204)
Other Pneumonia (283)
Sepsis & Dissem Inf (337)
Heart Failure (357)
Cesarean Delivery (481)
Vaginal Delivery (1688)
Normal Neonate Birth (2144)
Discharges by DRG
of regional discharges were treated at this hospital in FY14
3%
1%
15%
8%
45%
16%
31%
39%
20%
30%
0% 20% 40% 60% 80% 100%
Malden MA (182)
Boston MA (185)
Lexington MA (356)
Medford MA (510)
Belmont MA (955)
Waltham MA (980)
Arlington MA (1,295)
Watertown MA (1,308)
Somerville MA (1,320)
Cambridge MA (2,461)
Discharges by Community
Qu
alit
y
14.8% 12.7%
15.9% 15.0%
0%
5%
10%
15%
20%
25%
2011 2013
0
1
2
3CLABSI CAUTI SSI: Colon Surgery
of community discharges were treated at this hospital in FY14
Lower is Better
Lower is Better
State Average
C12

Key:
Hospital
Cohort: Teaching Hospital Peer Cohort
For descriptions of the metrics, please see the technical appendix.
‡ Costs were adjusted to exclude direct medical education costs and physician compensation.
289$ 297$ 293$
* Disproportionate Share Hospitals (DSH) receive a minimum of 63% of gross patient service revenue from public
payers.
310$ 316$ Operating Revenue
12$ 19$ 11$
Total Costs
Total Profit (Loss) 27.3$ 25.0$ 30.4$ 30.4$ 30.7$
301$ 286$
332$
Non-Operating
Revenue
320$ 305$ 302$
5$ 10$
327$ 324$
How has the hospital's total outpatient revenue changed compared to
FY10, and how does this compare to the hospital's peer cohort
median? (FY10=100)
314$ 313$ Total Revenue
2014 HOSPITAL PROFILE: MOUNT AUBURN HOSPITAL
What were the hospital's total margin and operating margins between
FY10 and FY14, and how do these compare to the hospital's peer
cohort medians?Revenue, Cost, & Profit/Loss (in millions)
How have the hospital's total revenue and costs changed between
FY10 and FY14?
How has the volume of the hospital's inpatient discharges changed
compared to FY10, and how does this compare to the hospital's peer
cohort median? (FY10=100)
How has the volume of the hospital's outpatient visits changed
compared to FY10, and how does this compare to the hospital's peer
cohort median? (FY10=100)
FY
What was the hospital's net inpatient service revenue per case mix
adjusted discharge between FY10 and FY14, and how does this
compare to the hospital's peer cohort median?
2011 2012 20132010 2014
Uti
lizat
ion
-5.7%
-2.4%
65707580859095
100105110115120125130135140
2010 2011 2012 2013 2014
FY14 Inpatient Discharges = 14,040
-6.9%
+6.0%
65707580859095
100105110115120125130135140
2010 2011 2012 2013 2014
FY14 Outpatient Visits = 174,654
Pat
ien
t R
even
ue
Tre
nd
s
Hospital
Cohort Median
$2,000
$6,000
$10,000
$14,000
$18,000
$22,000
2010 2011 2012 2013 2014
+14.7%
+14.7%
65707580859095
100105110115120125130135140
2010 2011 2012 2013 2014
FY14 Outpatient Revenue = $165 M
Fin
anci
al P
erfo
rman
ce
8.7% 9.2%
5.3% 8.2%
-10%
0%
10%
2010 2011 2012 2013 2014
Tot
al
5.4% 5.6%
3.2% 5.6%
-10%
0%
10%
Ope
ratin
g
November 2015

2014 Hospital Profile
Overview / Size Payer Mix
Hospital System Affiliation: Public Payer Mix:
Change in Ownership (FY10-FY14): CY14 Commercial Payer Price Level:
Total Staffed Beds: Top 3 Commercial Payers:
% Occupancy:
Special Public Funding:
Financial Change FY13-FY14:
Adjusted‡ Cost per Discharge: Emergency Department Visits in FY14:
Inpatient NPSR per CMAD: Change FY13-FY14:
Outpatient Visits in FY14:
For descriptions of the metrics, please see the technical appendix.
SAINT VINCENT HOSPITAL
$9,384
Trauma Center Designation:
$13,024
Saint Vincent Hospital is a for-profit teaching hospital located in the Central Massachusetts region. It is among the larger acute hospitals in Massachusetts.
It also qualifies as a Disproportionate Share Hospital (DSH). Along with MetroWest Medical Center, Saint Vincent Hospital was bought by Tenet
Healthcare Corporation in 2013. While outpatient visits grew 8.5% at the hospital, outpatient revenue grew 37.9% over the five year period. Saint Vincent
Hospital earned a profit each year from FY10 to FY14, with a 15.6% operating margin and a 15.6% total margin in FY14, while the median total and
operating margins for teaching hospitals were 5.6% and 8.2%, respectively.
69.6%, < cohort avg. (73%)
65.6% (DSH* Hospital)
Blue Cross Blue Shield of Massachusetts
299, among the larger acute hospitals
Tenet Healthcare
Fallon Health and Life Assurance Co.
Tenet - 2013
Not Applicable
Worcester, MA
Teaching Hospital
Case Mix Index:
Central Massachusetts
Not Applicable
7.9%
What were the most common inpatient cases (DRGs) treated at the
hospital in FY14? What proportion of the region’s cases did this
hospital treat for each service?
15.6%
48th Percentile
How many central line-associated blood stream infections (CLABSI),
catheter-associated urinary tract infections (CAUTI), and surgical site
infections (SSI) after colon surgery did patients get at this hospital
compared to what was expected based on the hospital's characteristics
and case mix?
-1.4%
1.7%
Change FY11-FY13 (percentage points):
Early Elective Deliveries Rate (Jan 2014-Jun 2015):
19,341Inpatient Discharges in FY14:
-0.9%
69,034
Harvard Pilgrim Health Care
Quality
Readmission Rate in FY13:
Utilization
Change FY13-FY14: 4.1%
123,670
Where did most of the hospital's inpatients reside? What proportion of
each community's total discharges was attributed to this hospital?
4.5%
0.96, < cohort avg. (0.99); < statewide (1.00)
Change FY13-FY14:
Total Surplus (Loss) in FY14:
Inpatient:Outpatient Revenue in FY14: 40%:60%
Outpatient Revenue in FY14: $166,879,529
32.0%
Total Revenue in FY14:
$65,222,309
$418,245,520
Change FY13-FY14:
Hospital (19,341) = 25% of total regional discharges - - -
What proportion of adult patient discharges from this hospital resulted
in a readmission at any hospital within 30 days, and how does this
compare to the state average?
At
a G
lan
ce
Ser
vice
s
30%
25%
23%
39%
34%
29%
29%
35%
26%
28%
0% 20% 40% 60% 80% 100%
Renal Failure (349)
COPD (436)
Other Pneumonia (448)
Knee Joint Replacement (451)
Cellulitis, Oth Bact Skn Inf (477)
Heart Failure (625)
Cesarean Delivery (629)
Sepsis & Dissem Inf (1131)
Vaginal Delivery (1366)
Normal Neonate Birth (1915)
Discharges by DRG
of regional discharges were treated at this hospital in FY14
7%
27%
32%
36%
38%
18%
26%
43%
43%
29%
0% 20% 40% 60% 80% 100%
Leominster MA (285)
Charlton MA (298)
Holden MA (395)
Oxford MA (422)
Spencer MA (494)
Shrewsbury MA (579)
Webster MA (588)
Millbury MA (601)
Auburn MA (786)
Worcester MA (6,381)
Discharges by Community
Qu
alit
y 17.0% 15.6% 15.9% 15.0%
0%
5%
10%
15%
20%
25%
2011 2013
0
1
2
3CLABSI CAUTI SSI: Colon Surgery
of community discharges were treated at this hospital in FY14
Lower is Better
Lower is Better
State Average
C13

Key:
Hospital
Cohort: Teaching Hospital Peer Cohort
For descriptions of the metrics, please see the technical appendix.
2014 HOSPITAL PROFILE: SAINT VINCENT HOSPITAL
What were the hospital's total margin and operating margins between
FY10 and FY14, and how do these compare to the hospital's peer
cohort medians?Revenue, Cost, & Profit/Loss (in millions)
How have the hospital's total revenue and costs changed between
FY10 and FY14?
How has the volume of the hospital's inpatient discharges changed
compared to FY10, and how does this compare to the hospital's peer
cohort median? (FY10=100)
How has the volume of the hospital's outpatient visits changed
compared to FY10, and how does this compare to the hospital's peer
cohort median? (FY10=100)
FY
What was the hospital's net inpatient service revenue per case mix
adjusted discharge between FY10 and FY14, and how does this
compare to the hospital's peer cohort median?
2011 2012 20132010 2014
338$
0$ 0$
351$ 359$
How has the hospital's total outpatient revenue changed compared to
FY10, and how does this compare to the hospital's peer cohort
median? (FY10=100)
328$ 338$ Total Revenue
‡ Costs were adjusted to exclude direct medical education costs and physician compensation.
306$ 316$ 309$
* Disproportionate Share Hospitals (DSH) receive a minimum of 63% of gross patient service revenue from public
payers.
328$ 351$ Operating Revenue
0$ 0$ 0$
Total Costs
Total Profit (Loss) 30.4$ 22.7$ 34.7$ 50.3$ 65.2$
353$ 307$
418$
Non-Operating
Revenue
418$ 359$
Uti
lizat
ion
+9.5%
-2.4%
65707580859095
100105110115120125130135140
2010 2011 2012 2013 2014
FY14 Inpatient Discharges = 19,341
+8.5%
+6.0%
65707580859095
100105110115120125130135140
2010 2011 2012 2013 2014
FY14 Outpatient Visits = 123,670
Pat
ien
t R
even
ue
Tre
nd
s
Hospital
Cohort Median
$2,000
$6,000
$10,000
$14,000
$18,000
$22,000
2010 2011 2012 2013 2014
+37.9%
+14.7%
65707580859095
100105110115120125130135140
2010 2011 2012 2013 2014
FY14 Outpatient Revenue = $167 M
Fin
anci
al P
erfo
rman
ce
9.0%
5.3% 8.2%
-10%
0%
10%
2010 2011 2012 2013 2014
Tot
al
9.0%
3.2% 5.6%
-10%
0%
10%
Ope
ratin
g
14.0%
14.0% 15.6%
15.6%
November 2015

2014 Hospital Profile
Overview / Size Payer Mix
Hospital System Affiliation: Public Payer Mix:
Change in Ownership (FY10-FY14): CY14 Commercial Payer Price Level:
Total Staffed Beds: Top 3 Commercial Payers:
% Occupancy:
Special Public Funding:
Financial Change FY13-FY14:
Adjusted‡ Cost per Discharge: Emergency Department Visits in FY14:
Inpatient NPSR per CMAD: Change FY13-FY14:
Outpatient Visits in FY14:
For descriptions of the metrics, please see the technical appendix.
Hospital (4,364) = 1% of total regional discharges - - -
Total Surplus (Loss) in FY14:
Inpatient:Outpatient Revenue in FY14: 33%:67%
Outpatient Revenue in FY14: $45,878,284
-1.3%
Total Revenue in FY14:
($9,311,742)
$91,343,730
Change FY13-FY14:
What proportion of adult patient discharges from this hospital resulted
in a readmission at any hospital within 30 days, and how does this
compare to the state average?
What were the most common inpatient cases (DRGs) treated at the
hospital in FY14? What proportion of the region’s cases did this
hospital treat for each service?
16.9%
35th Percentile
How many central line-associated blood stream infections (CLABSI),
catheter-associated urinary tract infections (CAUTI), and surgical site
infections (SSI) after colon surgery did patients get at this hospital
compared to what was expected based on the hospital's characteristics
and case mix?
-2.3%
Not Applicable
Change FY11-FY13 (percentage points):
Early Elective Deliveries Rate (Jan 2014-Jun 2015):
4,364Inpatient Discharges in FY14:
-15.8%
30,556
Harvard Pilgrim Health Care
Quality
Readmission Rate in FY13:
Utilization
Change FY13-FY14: -6.8%
87,667
Where did most of the hospital's inpatients reside? What proportion of
each community's total discharges was attributed to this hospital?
-7.9%
0.96, < cohort avg. (0.99); < statewide (1.00)
Change FY13-FY14:
STEWARD CARNEY HOSPITAL
$10,972
Trauma Center Designation:
$9,885
Steward Carney Hospital is a for-profit teaching hospital located in the Metro Boston region. Steward Carney is a member of Steward Health Care System.
It is among the smaller acute hospitals in Massachusetts and qualifies as a Disproportionate Share Hospital (DSH). Steward Carney had 32.7% fewer
inpatient discharges in FY14 than in FY10, compared to a cohort median decrease of 2.4%. While its peer cohort’s median outpatient visits and outpatient
revenue increased from FY10 to FY14, Steward Carney’s outpatient visits and revenue decreased from FY10 to FY14. Steward Carney reported a loss
from FY11 to FY14, with a total margin of -10.2% in FY14, compared with a median total margin of 8.2% in its cohort.
77.4%, > cohort avg. (73%)
76.5% (DSH* Hospital)
Tufts Associated Health Maintenance Org.
83, among the smaller acute hospitals
Steward Health Care System
Blue Cross Blue Shield of Massachusetts
Steward Health Care - 2010
DSTIη
Dorchester, MA
Teaching Hospital
Case Mix Index:
Metro Boston
Not Applicable
-0.2%
At
a G
lan
ce
Ser
vice
s
13%
3%
2%
4%
4%
12%
3%
12%
10%
12%
0% 20% 40% 60% 80% 100%
Adj Dis/Neur exc Dep (89)
Renal Failure (98)
Heart Failure (119)
COPD (127)
Cellulitis, Oth Bact Skn Inf (128)
Dep exc Maj Dep (130)
Sepsis & Dissem Inf (198)
Schizophrenia (216)
Maj Dep& Oth/Unsp Psychoses (289)
Bipolar Disorders (335)
Discharges by DRG
of regional discharges were treated at this hospital in FY14
2%
3%
1%
2%
1%
4%
3%
12%
8%
16%
0% 20% 40% 60% 80% 100%
Randolph MA (74)
Milton MA (92)
Brockton MA (96)
Braintree MA (111)
Boston MA (145)
Hyde Park MA (155)
Quincy MA (384)
Mattapan MA (398)
Dorchester MA (789)
Dorchester Center MA (1,046)
Discharges by Community
Qu
alit
y
19.2%
16.9% 15.9%
15.0%
0%
5%
10%
15%
20%
25%
2011 2013
State Average
0
1
2
3CLABSI CAUTI SSI: Colon Surgery
of community discharges were treated at this hospital in FY14
Lower is Better
Lower is Better
Data is not available for this
measure
C14

Key:
Hospital
Cohort: Teaching Hospital Peer Cohort
For descriptions of the metrics, please see the technical appendix.
111$ 119$ Total Revenue
‡ Costs were adjusted to exclude direct medical education costs and physician compensation.
η For more information on Delivery System Transformation Initiative (DSTI) special funding, please contact the
Massachusetts Executive Office of Health and Human Service (EOHHS).
112$ 120$ 110$
* Disproportionate Share Hospitals (DSH) receive a minimum of 63% of gross patient service revenue from public
payers.
111$ 110$ Operating Revenue
(0)$ 0$ 0$
Total Costs
Total Profit (Loss) 2.6$ (1.3)$ (10.0)$ (9.0)$ (9.3)$
101$ 116$
91$
Non-Operating
Revenue
91$ 101$ 119$
0$ 0$
110$ 101$
How has the hospital's total outpatient revenue changed compared to
FY10, and how does this compare to the hospital's peer cohort
median? (FY10=100)
2014 HOSPITAL PROFILE: STEWARD CARNEY HOSPITAL
What were the hospital's total margin and operating margins between
FY10 and FY14, and how do these compare to the hospital's peer
cohort medians?Revenue, Cost, & Profit/Loss (in millions)
How have the hospital's total revenue and costs changed between
FY10 and FY14?
How has the volume of the hospital's inpatient discharges changed
compared to FY10, and how does this compare to the hospital's peer
cohort median? (FY10=100)
How has the volume of the hospital's outpatient visits changed
compared to FY10, and how does this compare to the hospital's peer
cohort median? (FY10=100)
FY
What was the hospital's net inpatient service revenue per case mix
adjusted discharge between FY10 and FY14, and how does this
compare to the hospital's peer cohort median?
2011 2012 20132010 2014
Uti
lizat
ion
-32.7%
-2.4%
65707580859095
100105110115120125130135140
2010 2011 2012 2013 2014
FY14 Inpatient Discharges = 4,364
-3.9%
+6.0%
65707580859095
100105110115120125130135140
2010 2011 2012 2013 2014
FY14 Outpatient Visits = 87,667
Pat
ien
t R
even
ue
Tre
nd
s
Hospital
Cohort Median
$2,000
$6,000
$10,000
$14,000
$18,000
$22,000
2010 2011 2012 2013 2014
-6.5%
+14.7%
65707580859095
100105110115120125130135140
2010 2011 2012 2013 2014
FY14 Outpatient Revenue = $46 M
Fin
anci
al P
erfo
rman
ce
2.2%
5.3% 8.2%
-10%
0%
10%
2010 2011 2012 2013 2014
Tot
al
2.2% 3.2%
5.6%
-10%
0%
10%
Ope
ratin
g
-10.2%
-10.2%
November 2015

2014 Hospital Profile
Overview / Size Payer Mix
Hospital System Affiliation: Public Payer Mix:
Change in Ownership (FY10-FY14): CY14 Commercial Payer Price Level:
Total Staffed Beds: Top 3 Commercial Payers:
% Occupancy:
Special Public Funding:
Financial Change FY13-FY14:
Adjusted‡ Cost per Discharge: Emergency Department Visits in FY14:
Inpatient NPSR per CMAD: Change FY13-FY14:
Outpatient Visits in FY14:
For descriptions of the metrics, please see the technical appendix.
1.5%
1.11, > cohort avg. (0.99); > statewide (1.00)
Change FY13-FY14:
STEWARD ST. ELIZABETH'S MEDICAL CENTER
$11,147
Trauma Center Designation:
$12,949
Steward St. Elizabeth’s Medical Center is a large, for-profit teaching hospital located in the Metro Boston region. Steward St. Elizabeth’s is a member of
Steward Health Care System, and it also qualifies as a Disproportionate Share Hospital (DSH). Outpatient revenue at the hospital decreased 53.9%
between FY10 and FY14, compared to a median 14.7% increase in its cohort. St. Elizabeth’s was profitable three of the five years in the FY10 to FY14
period, and had a total margin of 5.5% in FY14, compared to a median of 8.2% among cohort hospitals.
68.5%, < cohort avg. (73%)
65.4% (DSH* Hospital)
Tufts Associated Health Maintenance Org.
262, among the larger acute hospitals
Steward Health Care System
Blue Cross Blue Shield of Massachusetts
Steward Health Care - 2010
ICBθ
Brighton, MA
Teaching Hospital
Case Mix Index:
Metro Boston
Not Applicable
-4.9%
16.9%
58th Percentile
How many central line-associated blood stream infections (CLABSI),
catheter-associated urinary tract infections (CAUTI), and surgical site
infections (SSI) after colon surgery did patients get at this hospital
compared to what was expected based on the hospital's characteristics
and case mix?
-0.7%
0.9%
Change FY11-FY13 (percentage points):
Early Elective Deliveries Rate (Jan 2014-Jun 2015):
13,499Inpatient Discharges in FY14:
3.4%
31,105
Harvard Pilgrim Health Care
Quality
Readmission Rate in FY13:
Utilization
Change FY13-FY14: 20.5%
193,013
Where did most of the hospital's inpatients reside? What proportion of
each community's total discharges was attributed to this hospital?
Total Surplus (Loss) in FY14:
Inpatient:Outpatient Revenue in FY14: 50%:50%
Outpatient Revenue in FY14: $105,167,937
-6.4%
Total Revenue in FY14:
$17,055,211
$312,328,863
Change FY13-FY14:
What proportion of adult patient discharges from this hospital resulted
in a readmission at any hospital within 30 days, and how does this
compare to the state average?
What were the most common inpatient cases (DRGs) treated at the
hospital in FY14? What proportion of the region’s cases did this
hospital treat for each service?
Hospital (13,499) = 5% of total regional discharges - - -
At
a G
lan
ce
Ser
vice
s
5% 15%
35%
4%
5%
14%
14%
3%
99%
3%
0% 20% 40% 60% 80% 100%
Heart Failure (268)
Schizophrenia (278)
Opioid Abuse & Dependence (293)
Cesarean Delivery (344)
Sepsis & Dissem Inf (347)
Bipolar Disorders (391)
Maj Dep& Oth/Unsp Psychoses (403)
Vaginal Delivery (595)
Alc & Drg Dx-Rehab w/wo Detox (614)
Normal Neonate Birth (798)
Discharges by DRG
of regional discharges were treated at this
hospital in FY14
3%
4%
8%
2% 2%
4%
14%
46%
10%
48%
0% 20% 40% 60% 80% 100%
Haverhill MA (249)
Taunton MA (251)
Brookline MA (282)
Boston MA (335)
Brockton MA (370)
Quincy MA (457)
Watertown MA (464)
Allston MA (563)
Waltham MA (602)
Brighton MA (1,778)
Discharges by Community
Qu
alit
y 17.6% 16.9% 15.9% 15.0%
0%
5%
10%
15%
20%
25%
2011 2013
0
1
2
3CLABSI CAUTI SSI: Colon Surgery
of community discharges were treated at this
hospital in FY14
Lower is Better
Lower is Better
State Average
C15

Key:
Hospital
Cohort: Teaching Hospital Peer Cohort
For descriptions of the metrics, please see the technical appendix.
FY
What was the hospital's net inpatient service revenue per case mix
adjusted discharge between FY10 and FY14, and how does this
compare to the hospital's peer cohort median?
2011 2012 20132010 2014
How has the hospital's total outpatient revenue changed compared to
FY10, and how does this compare to the hospital's peer cohort
median? (FY10=100)
2014 HOSPITAL PROFILE: STEWARD ST. ELIZABETH'S MEDICAL CENTER
What were the hospital's total margin and operating margins between
FY10 and FY14, and how do these compare to the hospital's peer
cohort medians?Revenue, Cost, & Profit/Loss (in millions)
How have the hospital's total revenue and costs changed between
FY10 and FY14?
How has the volume of the hospital's inpatient discharges changed
compared to FY10, and how does this compare to the hospital's peer
cohort median? (FY10=100)
How has the volume of the hospital's outpatient visits changed
compared to FY10, and how does this compare to the hospital's peer
cohort median? (FY10=100)
264$ 311$ Operating Revenue
0$ 0$ (5)$
Total Costs
Total Profit (Loss) 24.8$ (20.9)$ (1.3)$ 9.8$ 17.1$
295$ 390$
312$
Non-Operating
Revenue
312$ 313$ 413$
0$ 2$
306$ 313$ 264$ 415$ Total Revenue
‡ Costs were adjusted to exclude direct medical education costs and physician compensation.
θ For more information on Infrastructure and Capacity Building (ICB) special funding, please contact the
Massachusetts Executive Office of Health and Human Services (EOHHS).
285$ 307$ 303$
* Disproportionate Share Hospitals (DSH) receive a minimum of 63% of gross patient service revenue from public
payers.
Uti
lizat
ion
-5.1%
-2.4%
65707580859095
100105110115120125130135140
2010 2011 2012 2013 2014
FY14 Inpatient Discharges = 13,499 +32.9%
+6.0%
65707580859095
100105110115120125130135140
2010 2011 2012 2013 2014
FY14 Outpatient Visits = 193,013
Pat
ien
t R
even
ue
Tre
nd
s
Hospital
Cohort Median
$2,000
$6,000
$10,000
$14,000
$18,000
$22,000
2010 2011 2012 2013 2014
+14.7%
65707580859095
100105110115120125130135140
2010 2011 2012 2013 2014
FY14 Outpatient Revenue = $105 M
Fin
anci
al P
erfo
rman
ce
6.0%
5.5% 5.3%
8.2%
-10%
0%
10%
2010 2011 2012 2013 2014
Tot
al
5.6%
5.3% 3.2%
5.6%
-10%
0%
10%
Ope
ratin
g
-52.7% -45.7% -50.7% -53.9%
November 2015

2014 Hospital Profile
Overview / Size Payer Mix
Hospital System Affiliation: Public Payer Mix:
Change in Ownership (FY10-FY14): CY14 Commercial Payer Price Level:
Total Staffed Beds: Top 3 Commercial Payers:
% Occupancy:
Special Public Funding:
Financial Change FY13-FY14:
Adjusted‡ Cost per Discharge: Emergency Department Visits in FY14:
Inpatient NPSR per CMAD: Change FY13-FY14:
Outpatient Visits in FY14:
For descriptions of the metrics, please see the technical appendix.
Hospital (7,591) = 6% of total regional discharges - - -
Total Surplus (Loss) in FY14:
Inpatient:Outpatient Revenue in FY14: 34%:66%
Outpatient Revenue in FY14: $61,571,040
2.7%
Total Revenue in FY14:
$874,080
$112,819,358
Change FY13-FY14:
What proportion of adult patient discharges from this hospital resulted
in a readmission at any hospital within 30 days, and how does this
compare to the state average?
What were the most common inpatient cases (DRGs) treated at the
hospital in FY14? What proportion of the region’s cases did this
hospital treat for each service?
15.1%
13th Percentile
How many central line-associated blood stream infections (CLABSI),
catheter-associated urinary tract infections (CAUTI), and surgical site
infections (SSI) after colon surgery did patients get at this hospital
compared to what was expected based on the hospital's characteristics
and case mix?
-1.2%
0.0%
Change FY11-FY13 (percentage points):
Early Elective Deliveries Rate (Jan 2014-Jun 2015):
7,591Inpatient Discharges in FY14:
-0.6%
31,020
Tufts Associated Health Maintenance Org.
Quality
Readmission Rate in FY13:
Utilization
Change FY13-FY14: 2.3%
56,566
Where did most of the hospital's inpatients reside? What proportion of
each community's total discharges was attributed to this hospital?
-2.2%
0.75, < cohort avg. (0.81); < statewide (1.00)
Change FY13-FY14:
ANNA JAQUES HOSPITAL
$8,464
Trauma Center Designation:
$8,285
Anna Jaques Hospital is a mid-size, non-profit community hospital located in the Northeastern Massachusetts region. It has been clinically affiliated with
Beth Israel Deaconess Medical Center since 2010. From FY10 to FY14, inpatient discharges decreased 2.7% at the hospital, compared to a median
decrease of 9.5% in its peer cohort. Anna Jaques was profitable four of the five years between FY10 and FY14, with a 0.8% total margin in FY14. Its
operating margin was similar to the median of its peer cohort each year.
64.2%, > cohort avg. (61%)
59.1% (Non-DSH* Hospital)
Harvard Pilgrim Health Care
140, mid-size acute hospital
Not Applicable
Blue Cross Blue Shield of Massachusetts
Not Applicable
CHART^, ICBθ
Newburyport, MA
Community Hospital
Case Mix Index:
Northeastern Massachusetts
Adult: Level 3
-1.9%
At
a G
lan
ce
Ser
vice
s
3%
6%
4%
5%
8%
7%
21%
7%
18%
6%
0% 20% 40% 60% 80% 100%
Sepsis & Dissem Inf (140)
Card Arrth & Cond Dis (180)
Heart Failure (189)
Cesarean Delivery (209)
COPD (268)
Other Pneumonia (289)
Maj Dep& Oth/Unsp Psychoses (460)
Vaginal Delivery (507)
Bipolar Disorders (538)
Normal Neonate Birth (682)
Discharges by DRG
of regional discharges were treated at this hospital in FY14
26%
26%
54%
32%
54%
47%
63%
12%
63%
64%
0% 20% 40% 60% 80% 100%
Rowley MA (173)
Groveland MA (175)
Newbury MA (176)
Georgetown MA (240)
Seabrook NH (283)
Merrimac MA (319)
Salisbury MA (756)
Haverhill MA (1,035)
Amesbury MA (1,295)
Newburyport MA (1,315)
Discharges by Community
Qu
alit
y 16.3% 15.1%
15.9% 15.0%
0%
5%
10%
15%
20%
25%
2011 2013
State Average
0
1
2
3
Lower is Better
CLABSI CAUTI SSI: Colon Surgery
of community discharges were treated at this
hospital in FY14
Lower is Better
Data is not available for this
measure
C16

Key:
Hospital
Cohort: Community Hospital Peer Cohort
For descriptions of the metrics, please see the technical appendix.
107$ 110$ Total Revenue
‡ Costs were adjusted to exclude direct medical education costs and physician compensation.
^ For more information on Community Hospital Acceleration, Revitalization and Transformation (CHART) special
funding, please contact the Health Policy Commission (HPC).
θ For more information on Infrastructure and Capacity Building (ICB) special funding, please contact the
Massachusetts Executive Office of Health and Human Services (EOHHS).
108$ 113$ 111$
* Disproportionate Share Hospitals (DSH) receive a minimum of 63% of gross patient service revenue from public
payers.
109$ 115$ Operating Revenue
(0)$ 1$ (0)$
Total Costs
Total Profit (Loss) 2.8$ (1.6)$ 2.0$ 3.2$ 0.9$
112$ 108$
113$
Non-Operating
Revenue
113$ 112$ 110$
(3)$ 0$
115$ 114$
How has the hospital's total outpatient revenue changed compared to
FY10, and how does this compare to the hospital's peer cohort
median? (FY10=100)
2014 HOSPITAL PROFILE: ANNA JAQUES HOSPITAL
What were the hospital's total margin and operating margins between
FY10 and FY14, and how do these compare to the hospital's peer
cohort medians?Revenue, Cost, & Profit/Loss (in millions)
How have the hospital's total revenue and costs changed between
FY10 and FY14?
How has the volume of the hospital's inpatient discharges changed
compared to FY10, and how does this compare to the hospital's peer
cohort median? (FY10=100)
How has the volume of the hospital's outpatient visits changed
compared to FY10, and how does this compare to the hospital's peer
cohort median? (FY10=100)
FY
What was the hospital's net inpatient service revenue per case mix
adjusted discharge between FY10 and FY14, and how does this
compare to the hospital's peer cohort median?
2011 2012 20132010 2014
Uti
lizat
ion
-2.7%
-9.5%
65707580859095
100105110115120125130135140
2010 2011 2012 2013 2014
FY14 Inpatient Discharges = 7,591
-0.2%
-1.5%
65707580859095
100105110115120125130135140
2010 2011 2012 2013 2014
FY14 Outpatient Visits = 56,566
Pat
ien
t R
even
ue
Tre
nd
s
Hospital
Cohort Median
$2,000
$6,000
$10,000
$14,000
$18,000
$22,000
2010 2011 2012 2013 2014
+3.9%
+4.2%
65707580859095
100105110115120125130135140
2010 2011 2012 2013 2014
FY14 Outpatient Revenue = $62 M
Fin
anci
al P
erfo
rman
ce
2.5% 0.8% 1.7% 2.9%
-10%
0%
10%
2010 2011 2012 2013 2014
Tot
al
2.3%
1.0% 2.1% 1.3%
-10%
0%
10%
Ope
ratin
g
November 2015
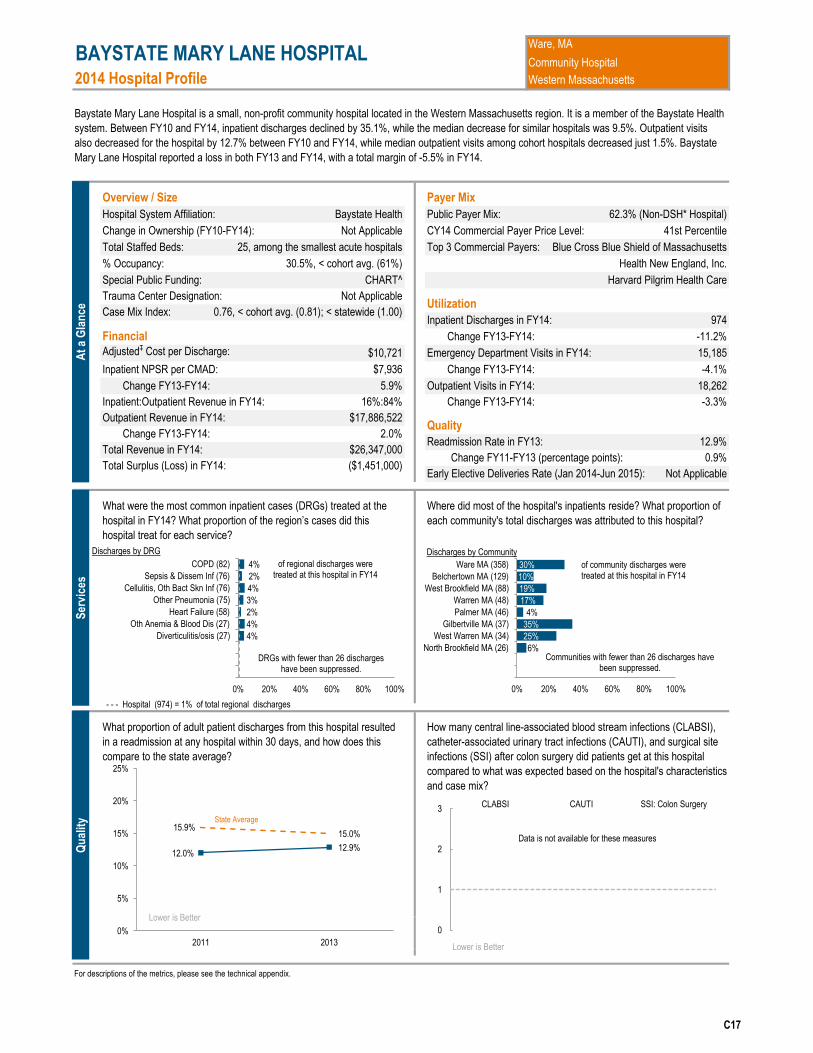
2014 Hospital Profile
Overview / Size Payer Mix
Hospital System Affiliation: Public Payer Mix:
Change in Ownership (FY10-FY14): CY14 Commercial Payer Price Level:
Total Staffed Beds: Top 3 Commercial Payers:
% Occupancy:
Special Public Funding:
Financial Change FY13-FY14:
Adjusted‡ Cost per Discharge: Emergency Department Visits in FY14:
Inpatient NPSR per CMAD: Change FY13-FY14:
Outpatient Visits in FY14:
For descriptions of the metrics, please see the technical appendix.
Hospital (974) = 1% of total regional discharges - - -
Total Surplus (Loss) in FY14:
Inpatient:Outpatient Revenue in FY14: 16%:84%
Outpatient Revenue in FY14: $17,886,522
2.0%
Total Revenue in FY14:
($1,451,000)
$26,347,000
Change FY13-FY14:
What proportion of adult patient discharges from this hospital resulted
in a readmission at any hospital within 30 days, and how does this
compare to the state average?
What were the most common inpatient cases (DRGs) treated at the
hospital in FY14? What proportion of the region’s cases did this
hospital treat for each service?
12.9%
41st Percentile
How many central line-associated blood stream infections (CLABSI),
catheter-associated urinary tract infections (CAUTI), and surgical site
infections (SSI) after colon surgery did patients get at this hospital
compared to what was expected based on the hospital's characteristics
and case mix?
0.9%Change FY11-FY13 (percentage points):
Early Elective Deliveries Rate (Jan 2014-Jun 2015):
974Inpatient Discharges in FY14:
-11.2%
15,185
Harvard Pilgrim Health Care
Quality
Readmission Rate in FY13:
Utilization
Change FY13-FY14: -3.3%
18,262
Where did most of the hospital's inpatients reside? What proportion of
each community's total discharges was attributed to this hospital?
Not Applicable
5.9%
0.76, < cohort avg. (0.81); < statewide (1.00)
Change FY13-FY14:
BAYSTATE MARY LANE HOSPITAL
$10,721
Trauma Center Designation:
$7,936
Baystate Mary Lane Hospital is a small, non-profit community hospital located in the Western Massachusetts region. It is a member of the Baystate Health
system. Between FY10 and FY14, inpatient discharges declined by 35.1%, while the median decrease for similar hospitals was 9.5%. Outpatient visits
also decreased for the hospital by 12.7% between FY10 and FY14, while median outpatient visits among cohort hospitals decreased just 1.5%. Baystate
Mary Lane Hospital reported a loss in both FY13 and FY14, with a total margin of -5.5% in FY14.
30.5%, < cohort avg. (61%)
62.3% (Non-DSH* Hospital)
Health New England, Inc.
25, among the smallest acute hospitals
Baystate Health
Blue Cross Blue Shield of Massachusetts
Not Applicable
CHART^
Ware, MA
Community Hospital
Case Mix Index:
Western Massachusetts
Not Applicable
-4.1%
At
a G
lan
ce
Ser
vice
s
4%
4%
2%
3%
4%
2%
4%
0% 20% 40% 60% 80% 100%
Diverticulitis/osis (27)
Oth Anemia & Blood Dis (27)
Heart Failure (58)
Other Pneumonia (75)
Cellulitis, Oth Bact Skn Inf (76)
Sepsis & Dissem Inf (76)
COPD (82)
Discharges by DRG
of regional discharges were treated at this hospital in FY14
0%
0%
6%
25%
35%
4%
17%
19%
10%
30%
0% 20% 40% 60% 80% 100%
North Brookfield MA (26)
West Warren MA (34)
Gilbertville MA (37)
Palmer MA (46)
Warren MA (48)
West Brookfield MA (88)
Belchertown MA (129)
Ware MA (358)
Discharges by Community
Qu
alit
y
12.0% 12.9%
15.9% 15.0%
0%
5%
10%
15%
20%
25%
2011 2013
0
1
2
3CLABSI CAUTI SSI: Colon Surgery
DRGs with fewer than 26 discharges have been suppressed.
Communities with fewer than 26 discharges have been suppressed.
of community discharges were treated at this hospital in FY14
Lower is Better
Lower is Better
Data is not available for these measures
State Average
C17

Key:
Hospital
Cohort: Community Hospital Peer Cohort
For descriptions of the metrics, please see the technical appendix.
30$ 29$ Total Revenue
‡ Costs were adjusted to exclude direct medical education costs and physician compensation.
^ For more information on Community Hospital Acceleration, Revitalization and Transformation (CHART) special
public funding, please contact the Health Policy Commission (HPC).
31$ 30$ 26$
* Disproportionate Share Hospitals (DSH) receive a minimum of 63% of gross patient service revenue from public
payers.
30$ 30$ Operating Revenue
0$ 0$ 0$
Total Costs
Total Profit (Loss) (2.9)$ (1.4)$ 0.3$ (0.6)$ (1.5)$
28$ 32$
26$
Non-Operating
Revenue
26$ 26$ 29$
0$ 1$
30$ 26$
How has the hospital's total outpatient revenue changed compared to
FY10, and how does this compare to the hospital's peer cohort
median? (FY10=100)
2014 HOSPITAL PROFILE: BAYSTATE MARY LANE HOSPITAL
What were the hospital's total margin and operating margins between
FY10 and FY14, and how do these compare to the hospital's peer
cohort medians?Revenue, Cost, & Profit/Loss (in millions)
How have the hospital's total revenue and costs changed between
FY10 and FY14?
How has the volume of the hospital's inpatient discharges changed
compared to FY10, and how does this compare to the hospital's peer
cohort median? (FY10=100)
How has the volume of the hospital's outpatient visits changed
compared to FY10, and how does this compare to the hospital's peer
cohort median? (FY10=100)
FY
What was the hospital's net inpatient service revenue per case mix
adjusted discharge between FY10 and FY14, and how does this
compare to the hospital's peer cohort median?
2011 2012 20132010 2014
Uti
lizat
ion
-9.5%
65707580859095
100105110115120125130135140
2010 2011 2012 2013 2014
FY14 Inpatient Discharges = 974
-12.7%
-1.5%
65707580859095
100105110115120125130135140
2010 2011 2012 2013 2014
FY14 Outpatient Visits = 18,262
Pat
ien
t R
even
ue
Tre
nd
s
Hospital
Cohort Median
$2,000
$6,000
$10,000
$14,000
$18,000
$22,000
2010 2011 2012 2013 2014
-13.2%
+4.2%
65707580859095
100105110115120125130135140
2010 2011 2012 2013 2014
FY14 Outpatient Revenue = $18 M
Fin
anci
al P
erfo
rman
ce
-9.7% -5.5%
1.7% 2.9%
-10%
0%
10%
2010 2011 2012 2013 2014
Tot
al
-7.4%
2.1% 1.3%
-10%
0%
10%
Ope
ratin
g
-35.1%
-11.5%
November 2015

2014 Hospital Profile
Overview / Size Payer Mix
Hospital System Affiliation: Public Payer Mix:
Change in Ownership (FY10-FY14): CY14 Commercial Payer Price Level:
Total Staffed Beds: Top 3 Commercial Payers:
% Occupancy:
Special Public Funding:
Financial Change FY13-FY14:
Adjusted‡ Cost per Discharge: Emergency Department Visits in FY14:
Inpatient NPSR per CMAD: Change FY13-FY14:
Outpatient Visits in FY14:
For descriptions of the metrics, please see the technical appendix.
Not Applicable
Hospital (4,309) = 1% of total regional discharges - - -
What proportion of adult patient discharges from this hospital resulted
in a readmission at any hospital within 30 days, and how does this
compare to the state average?
Inpatient:Outpatient Revenue in FY14: 32%:68%
Outpatient Revenue in FY14: $39,798,089
11.8%
Total Revenue in FY14:
$2,352,183
$84,398,308
Change FY13-FY14:
What were the most common inpatient cases (DRGs) treated at the
hospital in FY14? What proportion of the region’s cases did this
hospital treat for each service?
14.3%
18th Percentile
How many central line-associated blood stream infections (CLABSI),
catheter-associated urinary tract infections (CAUTI), and surgical site
infections (SSI) after colon surgery did patients get at this hospital
compared to what was expected based on the hospital's characteristics
and case mix?
-1.6%Change FY11-FY13 (percentage points):
Early Elective Deliveries Rate (Jan 2014-Jun 2015):
4,309Inpatient Discharges in FY14:
-17.8%
27,081
Tufts Associated Health Maintenance Org.
Quality
Readmission Rate in FY13:
Utilization
Change FY13-FY14: -2.1%
34,893
Where did most of the hospital's inpatients reside? What proportion of
each community's total discharges was attributed to this hospital?
2.0%
0.92, > cohort avg. (0.81); < statewide (1.00)
Change FY13-FY14:
Total Surplus (Loss) in FY14:
BETH ISRAEL DEACONESS HOSPITAL - MILTON
$9,028
Trauma Center Designation:
$10,006
Beth Israel Deaconess Hospital – Milton (BID-Milton) is a non-profit community hospital located in the Metro Boston region. It is among the smaller acute
hospitals in Massachusetts. It was purchased by Beth Israel Deaconess Medical Center in 2012 and at that time became a member of the CareGroup
health care system. Between FY10 and FY14, there was a 15.1% increase in outpatient visits at the hospital, compared to a median decrease of 1.5% in
its peer cohort. It earned a profit each year in the five-year period, with a total margin of 2.8% in FY14, down from 9.5% in FY13.
82.4%, > cohort avg. (61%)
60.0% (Non-DSH* Hospital)
Harvard Pilgrim Health Care
58, among the smaller acute hospitals
CareGroup
Blue Cross Blue Shield of Massachusetts
CareGroup - 2012
CHART^
Milton, MA
Community Hospital
Case Mix Index:
Metro Boston
Not Applicable
3.4%
At
a G
lan
ce
Ser
vice
s
3%
4%
2%
5%
5%
4%
5%
3%
3%
5%
0% 20% 40% 60% 80% 100%
Kidney & UT Infections (105)
Card Arrth & Cond Dis (126)
Hip Joint Replacement (127)
Renal Failure (138)
COPD (147)
Other Pneumonia (168)
Cellulitis, Oth Bact Skn Inf (170)
Heart Failure (194)
Knee Joint Replacement (201)
Sepsis & Dissem Inf (347)
Discharges by DRG
of regional discharges were treated at this hospital in FY14
1%
3%
1%
2%
7%
5%
7%
26%
19%
7%
0% 20% 40% 60% 80% 100%
Stoughton MA (57)
Mattapan MA (84)
Dorchester MA (116)
Dorchester Center MA (137)
Canton MA (199)
Hyde Park MA (203)
Braintree MA (324)
Milton MA (731)
Randolph MA (776)
Quincy MA (796)
Discharges by Community
Qu
alit
y
15.8% 14.3%
15.9% 15.0%
0%
5%
10%
15%
20%
25%
2011 2013
0
1
2
3
CLABSI CAUTI SSI: Colon Surgery
of community discharges were treated at this hospital in FY14
Lower is Better
Lower is Better
Data is not available for this measure
3.7 State Average
C18

Key:
Hospital
Cohort: Community Hospital Peer Cohort
For descriptions of the metrics, please see the technical appendix.
Non-Operating
Revenue
83$
68$ 67$
‡ Costs were adjusted to exclude direct medical education costs and physician compensation.
68$ 74$ 78$
* Disproportionate Share Hospitals (DSH) receive a minimum of 63% of gross patient service revenue from public
payers.
68$ 75$ Operating Revenue
1$ 2$ 0$
Total Costs
Total Profit (Loss) 0.8$ 0.2$ 1.2$ 8.1$ 2.4$
82$ 67$
84$
^ For more information on Community Hospital Acceleration, Revitalization, and Transformation (CHART) special public
funding, please contact the Health Policy Commission (HPC)
Total Revenue
2014 HOSPITAL PROFILE: BETH ISRAEL DEACONESS HOSPITAL - MILTON
What were the hospital's total margin and operating margins between
FY10 and FY14, and how do these compare to the hospital's peer
cohort medians?Revenue, Cost, & Profit/Loss (in millions)
How have the hospital's total revenue and costs changed between
FY10 and FY14?
How has the volume of the hospital's inpatient discharges changed
compared to FY10, and how does this compare to the hospital's peer
cohort median? (FY10=100)
How has the volume of the hospital's outpatient visits changed
compared to FY10, and how does this compare to the hospital's peer
cohort median? (FY10=100)
FY
What was the hospital's net inpatient service revenue per case mix
adjusted discharge between FY10 and FY14, and how does this
compare to the hospital's peer cohort median?
2011 2012 20132010 2014
84$ 67$
1$ 0$
75$ 86$
How has the hospital's total outpatient revenue changed compared to
FY10, and how does this compare to the hospital's peer cohort
median? (FY10=100)
Uti
lizat
ion
-9.0%
-9.5%
65707580859095
100105110115120125130135140
2010 2011 2012 2013 2014
FY14 Inpatient Discharges = 4,309
+15.1%
-1.5%
65707580859095
100105110115120125130135140
2010 2011 2012 2013 2014
FY14 Outpatient Visits = 34,893
Pat
ien
t R
even
ue
Tre
nd
s
Hospital
Cohort Median
$2,000
$6,000
$10,000
$14,000
$18,000
$22,000
2010 2011 2012 2013 2014
+10.9%
+4.2%
65707580859095
100105110115120125130135140
2010 2011 2012 2013 2014
FY14 Outpatient Revenue = $40 M
Fin
anci
al P
erfo
rman
ce
1.2% 2.8%
1.7% 2.9%
-10%
0%
10%
2010 2011 2012 2013 2014
Tot
al
1.0%
1.3% 2.1% 1.3%
-10%
0%
10%
Ope
ratin
g
November 2015

2014 Hospital Profile
Overview / Size Payer Mix
Hospital System Affiliation: Public Payer Mix:
Change in Ownership (FY10-FY14): CY14 Commercial Payer Price Level:
Total Staffed Beds: Top 3 Commercial Payers:
% Occupancy:
Special Public Funding:
Financial Change FY13-FY14:
Adjusted‡ Cost per Discharge: Emergency Department Visits in FY14:
Inpatient NPSR per CMAD: Change FY13-FY14:
Outpatient Visits in FY14:
For descriptions of the metrics, please see the technical appendix.
Hospital (1,909) = 1% of total regional discharges - - -
Total Surplus (Loss) in FY14:
Inpatient:Outpatient Revenue in FY14: 15%:85%
Outpatient Revenue in FY14: $52,928,605
11.0%
Total Revenue in FY14:
$2,303,405
$70,568,868
Change FY13-FY14:
What proportion of adult patient discharges from this hospital resulted
in a readmission at any hospital within 30 days, and how does this
compare to the state average?
What were the most common inpatient cases (DRGs) treated at the
hospital in FY14? What proportion of the region’s cases did this
hospital treat for each service?
12.0%
49th Percentile
How many central line-associated blood stream infections (CLABSI),
catheter-associated urinary tract infections (CAUTI), and surgical site
infections (SSI) after colon surgery did patients get at this hospital
compared to what was expected based on the hospital's characteristics
and case mix?
-0.5%Change FY11-FY13 (percentage points):
Early Elective Deliveries Rate (Jan 2014-Jun 2015):
1,909Inpatient Discharges in FY14:
-5.6%
11,934
Tufts Associated Health Maintenance Org.
Quality
Readmission Rate in FY13:
Utilization
Change FY13-FY14: 7.7%
146,210
Where did most of the hospital's inpatients reside? What proportion of
each community's total discharges was attributed to this hospital?
Not Applicable
4.5%
0.94, > cohort avg. (0.81); < statewide (1.00)
Change FY13-FY14:
BETH ISRAEL DEACONESS HOSPITAL - NEEDHAM
$9,019
Trauma Center Designation:
$9,297
Beth Israel Deaconess Hospital – Needham (BID-Needham) is a non-profit community hospital located in the Metro Boston region. It is among the smaller
acute hospitals in Massachusetts, and is a member of the CareGroup health care system. It experienced a 25.2% increase in outpatient visits between
FY10 and FY14, compared to a median decrease of 1.5% for cohort hospitals. Following a similar trend, outpatient revenue increased by 41.2% compared
with a median increase of 4.2% for cohort hospitals. BID-Needham’s total margin was positive each year in the five year period except in FY11, and it had
a 3.3% total margin in FY14. The median total margin in its peer cohort was positive each year from FY10 to FY14, at 2.9% in FY14.
53.1%, < cohort avg. (61%)
51.8% (Non-DSH* Hospital)
Harvard Pilgrim Health Care
31, among the smallest acute hospitals
CareGroup
Blue Cross Blue Shield of Massachusetts
Not Applicable
CHART^
Needham, MA
Community Hospital
Case Mix Index:
Metro Boston
Not Applicable
1.9%
At
a G
lan
ce
Ser
vice
s
1%
2%
4%
3%
2%
2%
2%
3%
2%
4%
0% 20% 40% 60% 80% 100%
Hip Joint Replacement (45)
COPD (48)
Diverticulitis/osis (54)
Maj Resp Infect & Inflam (58)
Card Arrth & Cond Dis (59)
Kidney & UT Infections (62)
Other Pneumonia (85)
Cellulitis, Oth Bact Skn Inf (89)
Heart Failure (141)
Sepsis & Dissem Inf (294)
Discharges by DRG
of regional discharges were treated at this hospital in FY14
3%
9%
1%
2%
6%
1%
7%
25%
9%
24%
0% 20% 40% 60% 80% 100%
Newton Center MA (35)
Dover MA (36)
Natick MA (36)
Walpole MA (42)
Medfield MA (56)
Norwood MA (60)
Westwood MA (110)
Needham Heights MA (225)
Dedham MA (296)
Needham MA (403)
Discharges by Community
Qu
alit
y
12.5% 12.0%
15.9%
15.0%
0%
5%
10%
15%
20%
25%
2011 2013
State Average
0
1
2
3CLABSI CAUTI SSI: Colon Surgery
Data is not available for this
measure
of community discharges were treated at this hospital in FY14
Lower is Better
Lower is Better
Data is not available for this
measure
C19

Key:
Hospital
Cohort: Community Hospital Peer Cohort
For descriptions of the metrics, please see the technical appendix.
55$ 54$ Total Revenue
‡ Costs were adjusted to exclude direct medical education costs and physician compensation.
^ For more information on Community Hospital Acceleration, Revitalization and Transformation (CHART) special
funding, please contact the Health Policy Commission (HPC).
56$ 59$ 63$
* Disproportionate Share Hospitals (DSH) receive a minimum of 63% of gross patient service revenue from public
payers.
55$ 60$ Operating Revenue
1$ 0$ 0$
Total Costs
Total Profit (Loss) 0.2$ (0.7)$ 1.6$ 1.4$ 2.3$
68$ 54$
71$
Non-Operating
Revenue
70$ 64$ 54$
0$ 0$
61$ 64$
How has the hospital's total outpatient revenue changed compared to
FY10, and how does this compare to the hospital's peer cohort
median? (FY10=100)
2014 HOSPITAL PROFILE: BETH ISRAEL DEACONESS HOSPITAL - NEEDHAM
What were the hospital's total margin and operating margins between
FY10 and FY14, and how do these compare to the hospital's peer
cohort medians?Revenue, Cost, & Profit/Loss (in millions)
How have the hospital's total revenue and costs changed between
FY10 and FY14?
How has the volume of the hospital's inpatient discharges changed
compared to FY10, and how does this compare to the hospital's peer
cohort median? (FY10=100)
How has the volume of the hospital's outpatient visits changed
compared to FY10, and how does this compare to the hospital's peer
cohort median? (FY10=100)
FY
What was the hospital's net inpatient service revenue per case mix
adjusted discharge between FY10 and FY14, and how does this
compare to the hospital's peer cohort median?
2011 2012 20132010 2014
Uti
lizat
ion
-20.5%
-9.5%
65707580859095
100105110115120125130135140
2010 2011 2012 2013 2014
FY14 Inpatient Discharges = 1,909 +25.2%
-1.5%
65707580859095
100105110115120125130135140
2010 2011 2012 2013 2014
FY14 Outpatient Visits = 146,210
Pat
ien
t R
even
ue
Tre
nd
s
Hospital
Cohort Median
$2,000
$6,000
$10,000
$14,000
$18,000
$22,000
2010 2011 2012 2013 2014
+4.2%
65707580859095
100105110115120125130135140
2010 2011 2012 2013 2014
FY14 Outpatient Revenue = $53 M
Fin
anci
al P
erfo
rman
ce
0.4%
3.3% 1.7% 2.9%
-10%
0%
10%
2010 2011 2012 2013 2014
Tot
al
-0.1%
2.4% 2.1% 1.3%
-10%
0%
10%
Ope
ratin
g
+41.2%
November 2015

2014 Hospital Profile
Overview / Size Payer Mix
Hospital System Affiliation: Public Payer Mix:
Change in Ownership (FY10-FY14): CY14 Commercial Payer Price Level:
Total Staffed Beds: Top 3 Commercial Payers:
% Occupancy:
Special Public Funding:
Financial Change FY13-FY14:
Adjusted‡ Cost per Discharge: Emergency Department Visits in FY14:
Inpatient NPSR per CMAD: Change FY13-FY14:
Outpatient Visits in FY14:
For descriptions of the metrics, please see the technical appendix.
Hospital (7,012) = 7% of total regional discharges - - -
Total Surplus (Loss) in FY14:
Inpatient:Outpatient Revenue in FY14: 39%:61%
Outpatient Revenue in FY14: $88,942,922
-6.2%
Total Revenue in FY14:
($431,000)
$153,378,000
Change FY13-FY14:
What proportion of adult patient discharges from this hospital resulted
in a readmission at any hospital within 30 days, and how does this
compare to the state average?
What were the most common inpatient cases (DRGs) treated at the
hospital in FY14? What proportion of the region’s cases did this
hospital treat for each service?
12.8%
63rd Percentile
How many central line-associated blood stream infections (CLABSI),
catheter-associated urinary tract infections (CAUTI), and surgical site
infections (SSI) after colon surgery did patients get at this hospital
compared to what was expected based on the hospital's characteristics
and case mix?
-1.4%
0.0%
Change FY11-FY13 (percentage points):
Early Elective Deliveries Rate (Jan 2014-Jun 2015):
7,012Inpatient Discharges in FY14:
-13.8%
34,283
UniCare Life and Health Insurance Company
Quality
Readmission Rate in FY13:
Utilization
Change FY13-FY14: -3.5%
51,562
Where did most of the hospital's inpatients reside? What proportion of
each community's total discharges was attributed to this hospital?
7.2%
0.84, > cohort avg. (0.81); < statewide (1.00)
Change FY13-FY14:
COOLEY DICKINSON HOSPITAL
$12,042
Trauma Center Designation:
$10,320
Cooley Dickinson Hospital is a community hospital located in the Western Massachusetts region. It is among the smaller acute hospitals in Massachusetts
and a member of Partners HealthCare System. Between FY10 and FY14, inpatient discharges at the hospital fell 23.3%, compared with a median
decrease of 9.5% among cohort hospitals. During the same period, outpatient visits decreased 30.2% at the hospital, compared with a median decrease of
1.5% at cohort hospitals. Cooley Dickinson’s operating margin decreased from 8.3% in FY13 to -0.3% in FY14, and it had a total margin of -0.3% in FY14,
representing its only loss in the five-year period.
87.0%, highest in cohort (avg. 61%)
58.7% (Non-DSH* Hospital)
Health New England, Inc.
93, among the smaller acute hospitals
Partners HealthCare System
Blue Cross Blue Shield of Massachusetts
Partners HealthCare - 2013
ICBθ
Northampton, MA
Community Hospital
Case Mix Index:
Western Massachusetts
Not Applicable
-4.8%
At
a G
lan
ce
Ser
vice
s
8%
10%
9%
7%
10%
11%
12%
11%
9%
9%
0% 20% 40% 60% 80% 100%
Maj Dep& Oth/Unsp Psychoses (163)
Knee Joint Replacement (164)
COPD (182)
Heart Failure (214)
Other Pneumonia (231)
Cesarean Delivery (255)
Bipolar Disorders (274)
Sepsis & Dissem Inf (347)
Vaginal Delivery (488)
Normal Neonate Birth (665)
Discharges by DRG
of regional discharges were treated at this hospital in FY14
29%
10%
3%
17%
74%
59%
65%
52%
63%
63%
0% 20% 40% 60% 80% 100%
Southampton MA (154)
South Hadley MA (176)
Holyoke MA (181)
Belchertown MA (208)
Leeds MA (231)
Hadley MA (334)
Florence MA (587)
Easthampton MA (983)
Amherst MA (987)
Northampton MA (997)
Discharges by Community
Qu
alit
y
14.2% 12.8%
15.9% 15.0%
0%
5%
10%
15%
20%
25%
2011 2013
0
1
2
3
CLABSI CAUTI SSI: Colon Surgery
of community discharges were treated at this hospital in FY14
Lower is Better
Lower is Better
State Average 3.3
C20

Key:
Hospital
Cohort: Community Hospital Peer Cohort
For descriptions of the metrics, please see the technical appendix.
161$ 168$ Total Revenue
‡ Costs were adjusted to exclude direct medical education costs and physician compensation.
θ For more information on Infrastructure and Capacity Building (ICB) special funding, please contact the
Massachusetts Executive Office of Health and Human Services (EOHHS).
152$ 151$ 149$
* Disproportionate Share Hospitals (DSH) receive a minimum of 63% of gross patient service revenue from public
payers.
161$ 168$ Operating Revenue
0$ (12)$ 2$
Total Costs
Total Profit (Loss) 5.7$ 8.5$ 18.3$ 0.8$ (0.4)$
154$ 162$
153$
Non-Operating
Revenue
153$ 161$ 167$
(0)$ 1$
169$ 150$
How has the hospital's total outpatient revenue changed compared to
FY10, and how does this compare to the hospital's peer cohort
median? (FY10=100)
2014 HOSPITAL PROFILE: COOLEY DICKINSON HOSPITAL
What were the hospital's total margin and operating margins between
FY10 and FY14, and how do these compare to the hospital's peer
cohort medians?Revenue, Cost, & Profit/Loss (in millions)
How have the hospital's total revenue and costs changed between
FY10 and FY14?
How has the volume of the hospital's inpatient discharges changed
compared to FY10, and how does this compare to the hospital's peer
cohort median? (FY10=100)
How has the volume of the hospital's outpatient visits changed
compared to FY10, and how does this compare to the hospital's peer
cohort median? (FY10=100)
FY
What was the hospital's net inpatient service revenue per case mix
adjusted discharge between FY10 and FY14, and how does this
compare to the hospital's peer cohort median?
2011 2012 20132010 2014
Uti
lizat
ion
-23.3%
-9.5%
65707580859095
100105110115120125130135140
2010 2011 2012 2013 2014
FY14 Inpatient Discharges = 7,012
-30.2%
-1.5%
65707580859095
100105110115120125130135140
2010 2011 2012 2013 2014
FY14 Outpatient Visits = 51,562
Pat
ien
t R
even
ue
Tre
nd
s
Hospital
Cohort Median
$2,000
$6,000
$10,000
$14,000
$18,000
$22,000
2010 2011 2012 2013 2014
-8.9%
+4.2%
65707580859095
100105110115120125130135140
2010 2011 2012 2013 2014
FY14 Outpatient Revenue = $89 M
Fin
anci
al P
erfo
rman
ce
3.4%
-0.3%
1.7% 2.9%
-10%
0%
10%
2010 2011 2012 2013 2014
Tot
al
2.7%
-0.3%
2.1% 1.3%
-10%
0%
10%
Ope
ratin
g
10.8
November 2015

2014 Hospital Profile
Overview / Size Payer Mix
Hospital System Affiliation: Public Payer Mix:
Change in Ownership (FY10-FY14): CY14 Commercial Payer Price Level:
Total Staffed Beds: Top 3 Commercial Payers:
% Occupancy:
Special Public Funding:
Financial Change FY13-FY14:
Adjusted‡ Cost per Discharge: Emergency Department Visits in FY14:
Inpatient NPSR per CMAD: Change FY13-FY14:
Outpatient Visits in FY14:
For descriptions of the metrics, please see the technical appendix.
Hospital (8,740) = 6% of total regional discharges - - -
Total Surplus (Loss) in FY14:
Inpatient:Outpatient Revenue in FY14: 28%:72%
Outpatient Revenue in FY14: $121,362,273
4.0%
Total Revenue in FY14:
$2,076,704
$193,301,365
Change FY13-FY14:
What proportion of adult patient discharges from this hospital resulted
in a readmission at any hospital within 30 days, and how does this
compare to the state average?
What were the most common inpatient cases (DRGs) treated at the
hospital in FY14? What proportion of the region’s cases did this
hospital treat for each service?
12.1%
35th Percentile
How many central line-associated blood stream infections (CLABSI),
catheter-associated urinary tract infections (CAUTI), and surgical site
infections (SSI) after colon surgery did patients get at this hospital
compared to what was expected based on the hospital's characteristics
and case mix?
0.6%
1.6%
Change FY11-FY13 (percentage points):
Early Elective Deliveries Rate (Jan 2014-Jun 2015):
8,740Inpatient Discharges in FY14:
-3.6%
32,471
Tufts Associated Health Maintenance Org.
Quality
Readmission Rate in FY13:
Utilization
Change FY13-FY14: -1.8%
92,957
Where did most of the hospital's inpatients reside? What proportion of
each community's total discharges was attributed to this hospital?
-2.9%
0.77, < cohort avg. (0.81); < statewide (1.00)
Change FY13-FY14:
EMERSON HOSPITAL
$10,142
Trauma Center Designation:
$10,049
Emerson Hospital is a mid-size, non-profit community hospital located in the Northeastern Massachusetts region. While outpatient visits at the hospital
decreased 2.9% between FY10 and FY14, outpatient revenue increased 8.2% in that same period. Though it was only responsible for 6% of total regional
discharges in FY14, it treated 28% of all regional Opioid & Abuse cases and 27% of all Alcohol Abuse & Dependence cases. It earned a profit each year
from FY11 to FY14, with a 1.1% total margin in FY14, compared with its peer cohort’s median of 2.9%.
54.6%, < cohort avg. (61%)
44.9% (Non-DSH* Hospital)
Harvard Pilgrim Health Care
199, mid-size acute hospital
Not Applicable
Blue Cross Blue Shield of Massachusetts
Not Applicable
CHART^, ICBθ
Concord, MA
Community Hospital
Case Mix Index:
Northeastern Massachusetts
Not Applicable
-2.8%
At
a G
lan
ce
Ser
vice
s
4%
8%
18%
4%
28%
8%
9%
27%
10%
10%
0% 20% 40% 60% 80% 100%
Heart Failure (182)
Maj Dep& Oth/Unsp Psychoses (190)
Procedures for Obesity (194)
Sepsis & Dissem Inf (197)
Opioid Abuse & Dependence (198)
Knee Joint Replacement (223)
Cesarean Delivery (371)
Alcohol Abuse & Dependence (430)
Vaginal Delivery (777)
Normal Neonate Birth (1082)
Discharges by DRG
of regional discharges were treated at this hospital in FY14
20%
46%
9%
23%
25%
46%
31%
60%
54%
52%
0% 20% 40% 60% 80% 100%
Ayer MA (216)
Stow MA (244)
Chelmsford MA (245)
Bedford MA (283)
Sudbury MA (313)
Littleton MA (361)
Westford MA (507)
Maynard MA (577)
Concord MA (789)
Acton MA (799)
Discharges by Community
Qu
alit
y
11.5% 12.1%
15.9% 15.0%
0%
5%
10%
15%
20%
25%
2011 2013
0
1
2
3CLABSI CAUTI SSI: Colon Surgery
of community discharges were treated at this hospital
in FY14
Lower is Better
Lower is Better
State Average
C21

Key:
Hospital
Cohort: Community Hospital Peer Cohort
For descriptions of the metrics, please see the technical appendix.
180$ 184$ Total Revenue
‡ Costs were adjusted to exclude direct medical education costs and physician compensation.
^ For more information on Community Hospital Acceleration, Revitalization and Transformation (CHART) special
funding, please contact the Health Policy Commission (HPC).
θ For more information on Infrastructure and Capacity Building (ICB) special funding, please contact the
Massachusetts Executive Office of Health and Human Services (EOHHS).
177$ 185$ 188$
* Disproportionate Share Hospitals (DSH) receive a minimum of 63% of gross patient service revenue from public
payers.
179$ 189$ Operating Revenue
1$ (0)$ 1$
Total Costs
Total Profit (Loss) (0.6)$ 3.3$ 4.5$ 1.1$ 2.1$
191$ 184$
193$
Non-Operating
Revenue
192$ 190$ 183$
1$ 1$
190$ 190$
How has the hospital's total outpatient revenue changed compared to
FY10, and how does this compare to the hospital's peer cohort
median? (FY10=100)
2014 HOSPITAL PROFILE: EMERSON HOSPITAL
What were the hospital's total margin and operating margins between
FY10 and FY14, and how do these compare to the hospital's peer
cohort medians?Revenue, Cost, & Profit/Loss (in millions)
How have the hospital's total revenue and costs changed between
FY10 and FY14?
How has the volume of the hospital's inpatient discharges changed
compared to FY10, and how does this compare to the hospital's peer
cohort median? (FY10=100)
How has the volume of the hospital's outpatient visits changed
compared to FY10, and how does this compare to the hospital's peer
cohort median? (FY10=100)
FY
What was the hospital's net inpatient service revenue per case mix
adjusted discharge between FY10 and FY14, and how does this
compare to the hospital's peer cohort median?
2011 2012 20132010 2014
Uti
lizat
ion
-10.0%
-9.5%
65707580859095
100105110115120125130135140
2010 2011 2012 2013 2014
FY14 Inpatient Discharges = 8,740
-2.9%
-1.5%
65707580859095
100105110115120125130135140
2010 2011 2012 2013 2014
FY14 Outpatient Visits = 92,957
Pat
ien
t R
even
ue
Tre
nd
s
Hospital
Cohort Median
$2,000
$6,000
$10,000
$14,000
$18,000
$22,000
2010 2011 2012 2013 2014
+8.2%
+4.2%
65707580859095
100105110115120125130135140
2010 2011 2012 2013 2014
FY14 Outpatient Revenue = $121 M
Fin
anci
al P
erfo
rman
ce
-0.3% 1.1%
1.7% 2.9%
-10%
0%
10%
2010 2011 2012 2013 2014
Tot
al
-0.7%
0.6% 2.1% 1.3%
-10%
0%
10%
Ope
ratin
g
November 2015
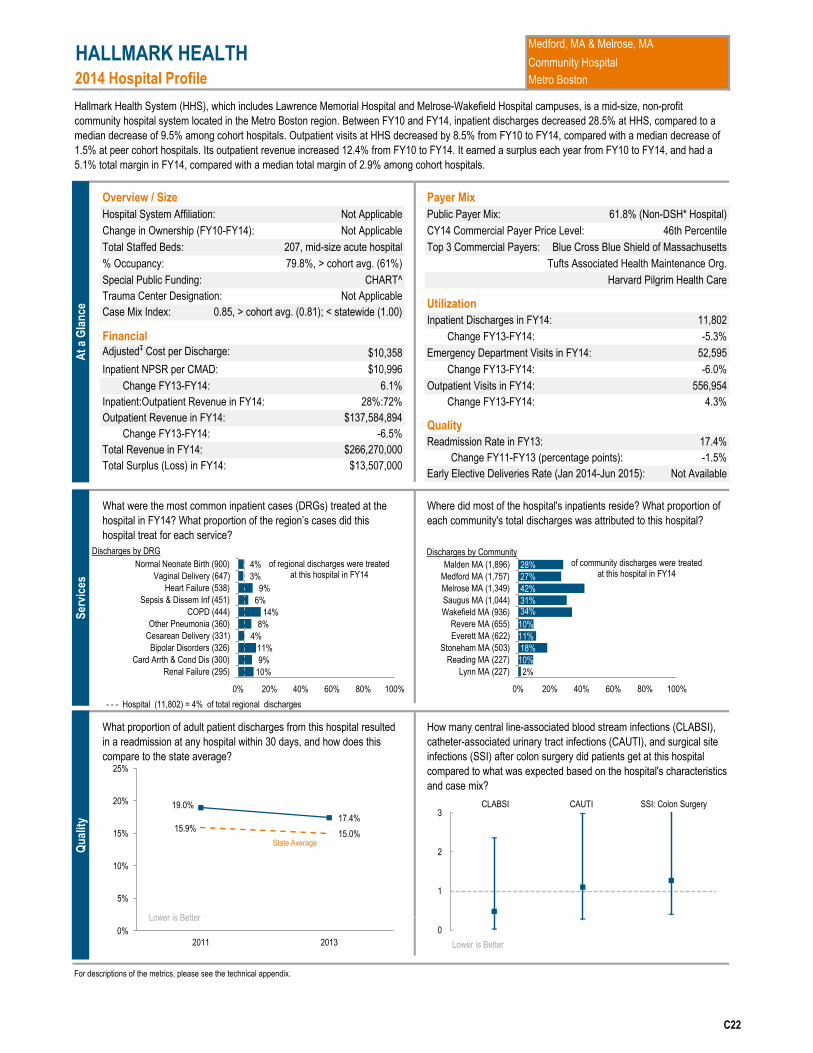
2014 Hospital Profile
Overview / Size Payer Mix
Hospital System Affiliation: Public Payer Mix:
Change in Ownership (FY10-FY14): CY14 Commercial Payer Price Level:
Total Staffed Beds: Top 3 Commercial Payers:
% Occupancy:
Special Public Funding:
Financial Change FY13-FY14:
Adjusted‡ Cost per Discharge: Emergency Department Visits in FY14:
Inpatient NPSR per CMAD: Change FY13-FY14:
Outpatient Visits in FY14:
For descriptions of the metrics, please see the technical appendix.
6.1%
0.85, > cohort avg. (0.81); < statewide (1.00)
Change FY13-FY14:
HALLMARK HEALTH
$10,358
Trauma Center Designation:
$10,996
Hallmark Health System (HHS), which includes Lawrence Memorial Hospital and Melrose-Wakefield Hospital campuses, is a mid-size, non-profit
community hospital system located in the Metro Boston region. Between FY10 and FY14, inpatient discharges decreased 28.5% at HHS, compared to a
median decrease of 9.5% among cohort hospitals. Outpatient visits at HHS decreased by 8.5% from FY10 to FY14, compared with a median decrease of
1.5% at peer cohort hospitals. Its outpatient revenue increased 12.4% from FY10 to FY14. It earned a surplus each year from FY10 to FY14, and had a
5.1% total margin in FY14, compared with a median total margin of 2.9% among cohort hospitals.
79.8%, > cohort avg. (61%)
61.8% (Non-DSH* Hospital)
Tufts Associated Health Maintenance Org.
207, mid-size acute hospital
Not Applicable
Blue Cross Blue Shield of Massachusetts
Not Applicable
CHART^
Medford, MA & Melrose, MA
Community Hospital
Case Mix Index:
Metro Boston
Not Applicable
-6.0%
17.4%
46th Percentile
How many central line-associated blood stream infections (CLABSI),
catheter-associated urinary tract infections (CAUTI), and surgical site
infections (SSI) after colon surgery did patients get at this hospital
compared to what was expected based on the hospital's characteristics
and case mix?
-1.5%
Not Available
Change FY11-FY13 (percentage points):
Early Elective Deliveries Rate (Jan 2014-Jun 2015):
11,802Inpatient Discharges in FY14:
-5.3%
52,595
Harvard Pilgrim Health Care
Quality
Readmission Rate in FY13:
Utilization
Change FY13-FY14: 4.3%
556,954
Where did most of the hospital's inpatients reside? What proportion of
each community's total discharges was attributed to this hospital?
Total Surplus (Loss) in FY14:
Inpatient:Outpatient Revenue in FY14: 28%:72%
Outpatient Revenue in FY14: $137,584,894
-6.5%
Total Revenue in FY14:
$13,507,000
$266,270,000
Change FY13-FY14:
What proportion of adult patient discharges from this hospital resulted
in a readmission at any hospital within 30 days, and how does this
compare to the state average?
What were the most common inpatient cases (DRGs) treated at the
hospital in FY14? What proportion of the region’s cases did this
hospital treat for each service?
Hospital (11,802) = 4% of total regional discharges - - -
At
a G
lan
ce
Ser
vice
s
10%
9%
11%
4%
8%
14%
6%
9%
3%
4%
0% 20% 40% 60% 80% 100%
Renal Failure (295)
Card Arrth & Cond Dis (300)
Bipolar Disorders (326)
Cesarean Delivery (331)
Other Pneumonia (360)
COPD (444)
Sepsis & Dissem Inf (451)
Heart Failure (538)
Vaginal Delivery (647)
Normal Neonate Birth (900)
Discharges by DRG
of regional discharges were treated at this hospital in FY14
2%
10%
18%
11%
10%
34% 31%
42%
27%
28%
0% 20% 40% 60% 80% 100%
Lynn MA (227)
Reading MA (227)
Stoneham MA (503)
Everett MA (622)
Revere MA (655)
Wakefield MA (936)
Saugus MA (1,044)
Melrose MA (1,349)
Medford MA (1,757)
Malden MA (1,896)
Discharges by Community
Qu
alit
y
19.0%
17.4% 15.9%
15.0%
0%
5%
10%
15%
20%
25%
2011 2013
0
1
2
3CLABSI CAUTI SSI: Colon Surgery
of community discharges were treated at this hospital in FY14
Lower is Better
Lower is Better
State Average
C22
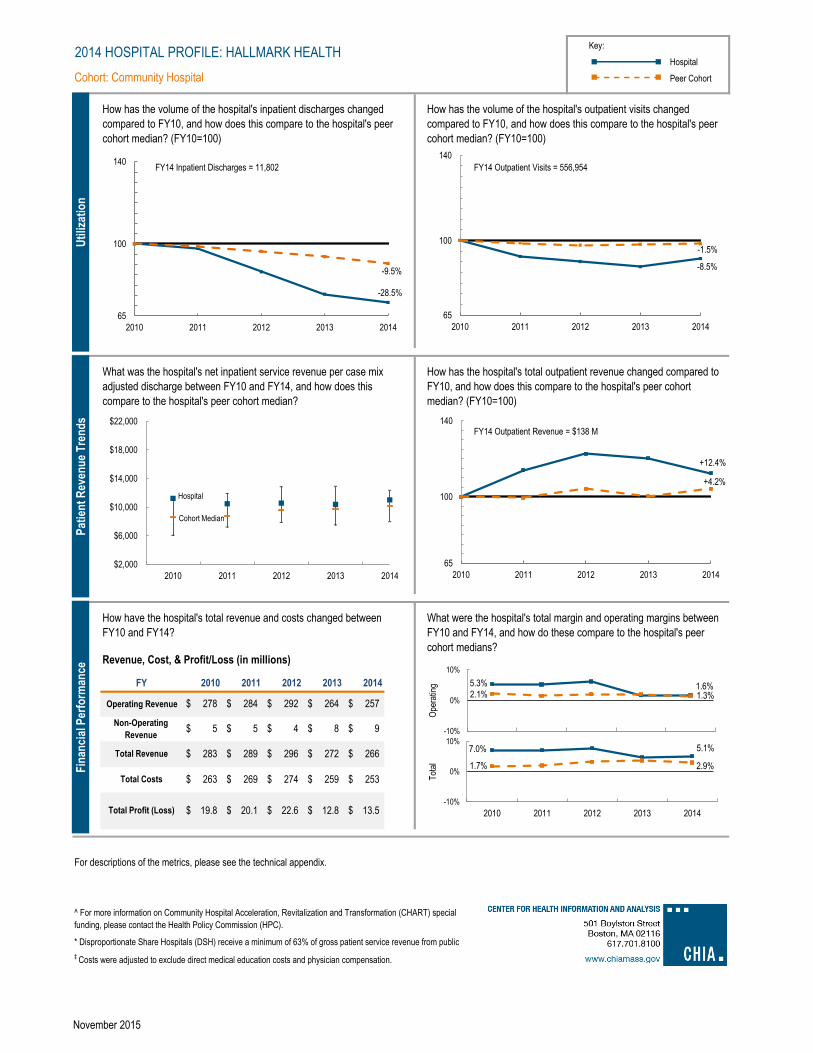
Key:
Hospital
Cohort: Community Hospital Peer Cohort
For descriptions of the metrics, please see the technical appendix.
FY
What was the hospital's net inpatient service revenue per case mix
adjusted discharge between FY10 and FY14, and how does this
compare to the hospital's peer cohort median?
2011 2012 20132010 2014
How has the hospital's total outpatient revenue changed compared to
FY10, and how does this compare to the hospital's peer cohort
median? (FY10=100)
2014 HOSPITAL PROFILE: HALLMARK HEALTH
What were the hospital's total margin and operating margins between
FY10 and FY14, and how do these compare to the hospital's peer
cohort medians?Revenue, Cost, & Profit/Loss (in millions)
How have the hospital's total revenue and costs changed between
FY10 and FY14?
How has the volume of the hospital's inpatient discharges changed
compared to FY10, and how does this compare to the hospital's peer
cohort median? (FY10=100)
How has the volume of the hospital's outpatient visits changed
compared to FY10, and how does this compare to the hospital's peer
cohort median? (FY10=100)
284$ 292$ Operating Revenue
9$ 8$ 4$
Total Costs
Total Profit (Loss) 19.8$ 20.1$ 22.6$ 12.8$ 13.5$
253$ 263$
266$
Non-Operating
Revenue
257$ 264$ 278$
5$ 5$
296$ 272$ 289$ 283$ Total Revenue
* Disproportionate Share Hospitals (DSH) receive a minimum of 63% of gross patient service revenue from public
payers.‡ Costs were adjusted to exclude direct medical education costs and physician compensation.
^ For more information on Community Hospital Acceleration, Revitalization and Transformation (CHART) special
funding, please contact the Health Policy Commission (HPC).
269$ 274$ 259$
Uti
lizat
ion
-28.5%
-9.5%
65707580859095
100105110115120125130135140
2010 2011 2012 2013 2014
FY14 Inpatient Discharges = 11,802
-8.5%
-1.5%
65707580859095
100105110115120125130135140
2010 2011 2012 2013 2014
FY14 Outpatient Visits = 556,954
Pat
ien
t R
even
ue
Tre
nd
s
Hospital
Cohort Median
$2,000
$6,000
$10,000
$14,000
$18,000
$22,000
2010 2011 2012 2013 2014
+12.4%
+4.2%
65707580859095
100105110115120125130135140
2010 2011 2012 2013 2014
FY14 Outpatient Revenue = $138 M
Fin
anci
al P
erfo
rman
ce
7.0% 5.1%
1.7% 2.9%
-10%
0%
10%
2010 2011 2012 2013 2014
Tot
al
5.3% 1.6% 2.1% 1.3%
-10%
0%
10%
Ope
ratin
g
November 2015

2014 Hospital Profile
Overview / Size Payer Mix
Hospital System Affiliation: Public Payer Mix:
Change in Ownership (FY10-FY14): CY14 Commercial Payer Price Level:
Total Staffed Beds: Top 3 Commercial Payers:
% Occupancy:
Special Public Funding:
Financial Change FY13-FY14:
Adjusted‡ Cost per Discharge: Emergency Department Visits in FY14:
Inpatient NPSR per CMAD: Change FY13-FY14:
Outpatient Visits in FY14:
For descriptions of the metrics, please see the technical appendix.
METROWEST MEDICAL CENTER
$9,636
Trauma Center Designation:
$8,374
MetroWest Medical Center is a for-profit community hospital located in the Metro West region. It is among the larger acute hospitals in Massachusetts.
Along with Saint Vincent Hospital, MetroWest Medical Center was bought by Tenet Healthcare Corporation in 2013. Between FY10 and FY14, MetroWest
Medical Center’s inpatient discharges decreased by 24.8%, compared with a median decrease of 9.5% among cohort hospitals. Outpatient visits increased
by 14.3% during that period, compared with a median decrease of 1.5% in its peer cohort. MetroWest operated at a loss each year from FY10 to FY14,
and had a total margin of -2.4% in FY14, compared with a median total margin of 2.9% in its cohort.
50.4%, < cohort avg. (61%)
61.5% (Non-DSH* Hospital)
Harvard Pilgrim Health Care
284, among the larger acute hospitals
Tenet Healthcare
Blue Cross Blue Shield of Massachusetts
Tenet - 2013
Not Applicable
Framingham, MA & Natick, MA
Community Hospital
Case Mix Index:
Metro West
Not Applicable
3.8%
What were the most common inpatient cases (DRGs) treated at the
hospital in FY14? What proportion of the region’s cases did this
hospital treat for each service?
15.9%
47th Percentile
How many central line-associated blood stream infections (CLABSI),
catheter-associated urinary tract infections (CAUTI), and surgical site
infections (SSI) after colon surgery did patients get at this hospital
compared to what was expected based on the hospital's characteristics
and case mix?
-1.6%
0.0%
Change FY11-FY13 (percentage points):
Early Elective Deliveries Rate (Jan 2014-Jun 2015):
11,917Inpatient Discharges in FY14:
-7.3%
64,068
Tufts Associated Health Maintenance Org.
Quality
Readmission Rate in FY13:
Utilization
Change FY13-FY14: 3.0%
190,584
Where did most of the hospital's inpatients reside? What proportion of
each community's total discharges was attributed to this hospital?
-5.7%
0.92, > cohort avg. (0.81); < statewide (1.00)
Change FY13-FY14:
Total Surplus (Loss) in FY14:
Inpatient:Outpatient Revenue in FY14: 30%:70%
Outpatient Revenue in FY14: $144,819,089
2.2%
Total Revenue in FY14:
($5,993,741)
$249,364,378
Change FY13-FY14:
Hospital (11,917) = 28% of total regional discharges - - -
What proportion of adult patient discharges from this hospital resulted
in a readmission at any hospital within 30 days, and how does this
compare to the state average?
At
a G
lan
ce
Ser
vice
s
17%
21%
32%
29%
25%
34%
26%
26%
27%
47%
0% 20% 40% 60% 80% 100%
COPD (229)
Other Pneumonia (240)
Renal Failure (246)
Cesarean Delivery (309)
Heart Failure (383)
Sepsis & Dissem Inf (443)
Maj Dep& Oth/Unsp Psychoses (443)
Vaginal Delivery (475)
Normal Neonate Birth (753)
Bipolar Disorders (784)
Discharges by DRG of regional discharges
were treated at this hospital in FY14
14%
17%
26%
17%
25%
10% 37%
45%
39%
52%
0% 20% 40% 60% 80% 100%
Medway MA (161)
Wayland MA (184)
Millis MA (199)
Sudbury MA (214)
Hopkinton MA (245)
Marlborough MA (430)
Holliston MA (447)
Ashland MA (673)
Natick MA (1,404)
Framingham MA (3,701)
Discharges by Community
Qu
alit
y
17.5%
15.9% 15.9% 15.0%
0%
5%
10%
15%
20%
25%
2011 2013
0
1
2
3CLABSI CAUTI SSI: Colon Surgery
of community discharges were treated at this hospital in
FY14
Lower is Better
Lower is Better
State Average
C23

Key:
Hospital
Cohort: Community Hospital Peer Cohort
For descriptions of the metrics, please see the technical appendix.
2014 HOSPITAL PROFILE: METROWEST MEDICAL CENTER
What were the hospital's total margin and operating margins between
FY10 and FY14, and how do these compare to the hospital's peer
cohort medians?Revenue, Cost, & Profit/Loss (in millions)
How have the hospital's total revenue and costs changed between
FY10 and FY14?
How has the volume of the hospital's inpatient discharges changed
compared to FY10, and how does this compare to the hospital's peer
cohort median? (FY10=100)
How has the volume of the hospital's outpatient visits changed
compared to FY10, and how does this compare to the hospital's peer
cohort median? (FY10=100)
FY
What was the hospital's net inpatient service revenue per case mix
adjusted discharge between FY10 and FY14, and how does this
compare to the hospital's peer cohort median?
2011 2012 20132010 2014
Non-Operating
Revenue
249$ 256$ 258$
0$ 0$
259$ 256$
How has the hospital's total outpatient revenue changed compared to
FY10, and how does this compare to the hospital's peer cohort
median? (FY10=100)
‡ Costs were adjusted to exclude direct medical education costs and physician compensation.
* Disproportionate Share Hospitals (DSH) receive a minimum of 63% of gross patient service revenue from public
payers.
256$ 258$ Total Revenue
268$ 266$ 257$
256$ 259$ Operating Revenue
1$ 0$ 0$
Total Costs
Total Profit (Loss) (10.6)$ (11.4)$ (6.3)$ (1.4)$ (6.0)$
255$ 269$
249$
Uti
lizat
ion
-24.8%
-9.5%
65707580859095
100105110115120125130135140
2010 2011 2012 2013 2014
FY14 Inpatient Discharges = 11,917
+14.3%
-1.5%
65707580859095
100105110115120125130135140
2010 2011 2012 2013 2014
FY14 Outpatient Visits = 190,584
Pat
ien
t R
even
ue
Tre
nd
s
Hospital
Cohort Median
$2,000
$6,000
$10,000
$14,000
$18,000
$22,000
2010 2011 2012 2013 2014
-3.3%
+4.2%
65707580859095
100105110115120125130135140
2010 2011 2012 2013 2014
FY14 Outpatient Revenue = $145 M
Fin
anci
al P
erfo
rman
ce
-4.1% -2.4%
1.7% 2.9%
-10%
0%
10%
2010 2011 2012 2013 2014
Tot
al
-4.2% -2.6%
2.1% 1.3%
-10%
0%
10%
Ope
ratin
g
November 2015
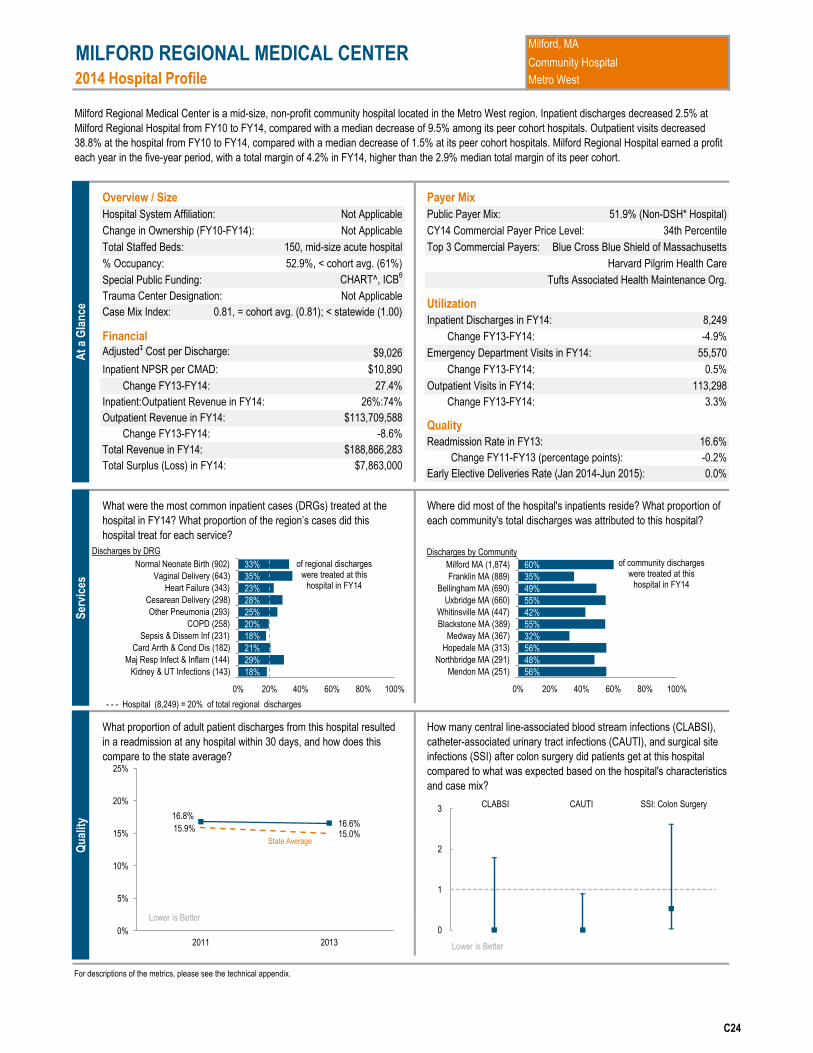
2014 Hospital Profile
Overview / Size Payer Mix
Hospital System Affiliation: Public Payer Mix:
Change in Ownership (FY10-FY14): CY14 Commercial Payer Price Level:
Total Staffed Beds: Top 3 Commercial Payers:
% Occupancy:
Special Public Funding:
Financial Change FY13-FY14:
Adjusted‡ Cost per Discharge: Emergency Department Visits in FY14:
Inpatient NPSR per CMAD: Change FY13-FY14:
Outpatient Visits in FY14:
For descriptions of the metrics, please see the technical appendix.
27.4%
0.81, = cohort avg. (0.81); < statewide (1.00)
Change FY13-FY14:
MILFORD REGIONAL MEDICAL CENTER
$9,026
Trauma Center Designation:
$10,890
Milford Regional Medical Center is a mid-size, non-profit community hospital located in the Metro West region. Inpatient discharges decreased 2.5% at
Milford Regional Hospital from FY10 to FY14, compared with a median decrease of 9.5% among its peer cohort hospitals. Outpatient visits decreased
38.8% at the hospital from FY10 to FY14, compared with a median decrease of 1.5% at its peer cohort hospitals. Milford Regional Hospital earned a profit
each year in the five-year period, with a total margin of 4.2% in FY14, higher than the 2.9% median total margin of its peer cohort.
52.9%, < cohort avg. (61%)
51.9% (Non-DSH* Hospital)
Harvard Pilgrim Health Care
150, mid-size acute hospital
Not Applicable
Blue Cross Blue Shield of Massachusetts
Not Applicable
CHART^, ICBθ
Milford, MA
Community Hospital
Case Mix Index:
Metro West
Not Applicable
0.5%
16.6%
34th Percentile
How many central line-associated blood stream infections (CLABSI),
catheter-associated urinary tract infections (CAUTI), and surgical site
infections (SSI) after colon surgery did patients get at this hospital
compared to what was expected based on the hospital's characteristics
and case mix?
-0.2%
0.0%
Change FY11-FY13 (percentage points):
Early Elective Deliveries Rate (Jan 2014-Jun 2015):
8,249Inpatient Discharges in FY14:
-4.9%
55,570
Tufts Associated Health Maintenance Org.
Quality
Readmission Rate in FY13:
Utilization
Change FY13-FY14: 3.3%
113,298
Where did most of the hospital's inpatients reside? What proportion of
each community's total discharges was attributed to this hospital?
Total Surplus (Loss) in FY14:
Inpatient:Outpatient Revenue in FY14: 26%:74%
Outpatient Revenue in FY14: $113,709,588
-8.6%
Total Revenue in FY14:
$7,863,000
$188,866,283
Change FY13-FY14:
What proportion of adult patient discharges from this hospital resulted
in a readmission at any hospital within 30 days, and how does this
compare to the state average?
What were the most common inpatient cases (DRGs) treated at the
hospital in FY14? What proportion of the region’s cases did this
hospital treat for each service?
Hospital (8,249) = 20% of total regional discharges - - -
At
a G
lan
ce
Ser
vice
s
18%
29%
21%
18%
20%
25%
28%
23%
35%
33%
0% 20% 40% 60% 80% 100%
Kidney & UT Infections (143)
Maj Resp Infect & Inflam (144)
Card Arrth & Cond Dis (182)
Sepsis & Dissem Inf (231)
COPD (258)
Other Pneumonia (293)
Cesarean Delivery (298)
Heart Failure (343)
Vaginal Delivery (643)
Normal Neonate Birth (902)
Discharges by DRG
of regional discharges were treated at this
hospital in FY14
56%
48%
56%
32%
55%
42%
55%
49%
35%
60%
0% 20% 40% 60% 80% 100%
Mendon MA (251)
Northbridge MA (291)
Hopedale MA (313)
Medway MA (367)
Blackstone MA (389)
Whitinsville MA (447)
Uxbridge MA (660)
Bellingham MA (690)
Franklin MA (889)
Milford MA (1,874)
Discharges by Community
Qu
alit
y 16.8% 16.6%
15.9% 15.0%
0%
5%
10%
15%
20%
25%
2011 2013
0
1
2
3CLABSI CAUTI SSI: Colon Surgery
of community discharges were treated at this
hospital in FY14
Lower is Better
Lower is Better
State Average
C24

Key:
Hospital
Cohort: Community Hospital Peer Cohort
For descriptions of the metrics, please see the technical appendix.
FY
What was the hospital's net inpatient service revenue per case mix
adjusted discharge between FY10 and FY14, and how does this
compare to the hospital's peer cohort median?
2011 2012 20132010 2014
How has the hospital's total outpatient revenue changed compared to
FY10, and how does this compare to the hospital's peer cohort
median? (FY10=100)
2014 HOSPITAL PROFILE: MILFORD REGIONAL MEDICAL CENTER
What were the hospital's total margin and operating margins between
FY10 and FY14, and how do these compare to the hospital's peer
cohort medians?Revenue, Cost, & Profit/Loss (in millions)
How have the hospital's total revenue and costs changed between
FY10 and FY14?
How has the volume of the hospital's inpatient discharges changed
compared to FY10, and how does this compare to the hospital's peer
cohort median? (FY10=100)
How has the volume of the hospital's outpatient visits changed
compared to FY10, and how does this compare to the hospital's peer
cohort median? (FY10=100)
195$ 196$ Operating Revenue
1$ 1$ 2$
Total Costs
Total Profit (Loss) 6.2$ 11.6$ 17.2$ 8.8$ 7.9$
181$ 183$
189$
Non-Operating
Revenue
188$ 183$ 189$
0$ 1$
198$ 185$ 195$ 190$ Total Revenue
‡ Costs were adjusted to exclude direct medical education costs and physician compensation.
^ For more information on Community Hospital Acceleration, Revitalization and Transformation (CHART) special
funding, please contact the Health Policy Commission (HPC).
θ For more information on Infrastructure and Capacity Building (ICB) special funding, please contact the
Massachusetts Executive Office of Health and Human Services (EOHHS).
184$ 181$ 176$
* Disproportionate Share Hospitals (DSH) receive a minimum of 63% of gross patient service revenue from public
payers.
Uti
lizat
ion
-2.5%
-9.5%
65707580859095
100105110115120125130135140
2010 2011 2012 2013 2014
FY14 Inpatient Discharges = 8,249
-1.5%
65707580859095
100105110115120125130135140
2010 2011 2012 2013 2014
FY14 Outpatient Visits = 113,298
Pat
ien
t R
even
ue
Tre
nd
s
Hospital
Cohort Median
$2,000
$6,000
$10,000
$14,000
$18,000
$22,000
2010 2011 2012 2013 2014
-18.8%
+4.2%
65707580859095
100105110115120125130135140
2010 2011 2012 2013 2014
FY14 Outpatient Revenue = $114 M
Fin
anci
al P
erfo
rman
ce
3.3% 4.2%
1.7% 2.9%
-10%
0%
10%
2010 2011 2012 2013 2014
Tot
al
2.8% 3.4%
2.1% 1.3%
-10%
0%
10%
Ope
ratin
g
-40.7% -38.8%
November 2015

2014 Hospital Profile
Overview / Size Payer Mix
Hospital System Affiliation: Public Payer Mix:
Change in Ownership (FY10-FY14): CY14 Commercial Payer Price Level:
Total Staffed Beds: Top 3 Commercial Payers:
% Occupancy:
Special Public Funding:
Financial Change FY13-FY14:
Adjusted‡ Cost per Discharge: Emergency Department Visits in FY14:
Inpatient NPSR per CMAD: Change FY13-FY14:
Outpatient Visits in FY14:
For descriptions of the metrics, please see the technical appendix.
NANTUCKET COTTAGE HOSPITAL
$19,112
Trauma Center Designation:
$10,190
Nantucket Cottage Hospital is a non-profit community hospital located in the Cape and Islands region. Nantucket Cottage is the second smallest hospital in
Massachusetts, with 23 staffed beds. It is a member of Partners HealthCare System. Inpatient discharges increased 21.2% at the hospital between FY10
and FY14, compared with a 9.5% decrease at the median of its cohort. Outpatient revenue at the hospital increased 54.7% in that period. Nantucket
Cottage Hospital earned a profit in FY12, FY13, and FY14, with a total margin of 5.9% in FY14, higher than the cohort median of 2.9%.
26.8%, lowest in cohort (avg. 61%)
44.1% (Non-DSH* Hospital)
Harvard Pilgrim Health Care
23, among the smallest acute hospitals
Partners HealthCare System
Blue Cross Blue Shield of Massachusetts
Not Applicable
Not Applicable
Nantucket, MA
Community Hospital
Case Mix Index:
Cape and Islands
Not Applicable
-11.3%
What were the most common inpatient cases (DRGs) treated at the
hospital in FY14? What proportion of the region’s cases did this
hospital treat for each service?
16.0%
72nd Percentile
How many central line-associated blood stream infections (CLABSI),
catheter-associated urinary tract infections (CAUTI), and surgical site
infections (SSI) after colon surgery did patients get at this hospital
compared to what was expected based on the hospital's characteristics
and case mix?
-0.7%
Not Available
Change FY11-FY13 (percentage points):
Early Elective Deliveries Rate (Jan 2014-Jun 2015):
628Inpatient Discharges in FY14:
12.9%
10,044
Aetna Health Inc. (PA)
Quality
Readmission Rate in FY13:
Utilization
Change FY13-FY14: -11.4%
24,094
Where did most of the hospital's inpatients reside? What proportion of
each community's total discharges was attributed to this hospital?
36.0%
0.62, < cohort avg. (0.81); < statewide (1.00)
Change FY13-FY14:
Total Surplus (Loss) in FY14:
Inpatient:Outpatient Revenue in FY14: 13%:87%
Outpatient Revenue in FY14: $30,531,057
7.2%
Total Revenue in FY14:
$2,349,000
$39,775,000
Change FY13-FY14:
Hospital (628) = 3% of total regional discharges - - -
What proportion of adult patient discharges from this hospital resulted
in a readmission at any hospital within 30 days, and how does this
compare to the state average?
At
a G
lan
ce
Ser
vice
s
5%
7%
86%
8% 9%
0% 20% 40% 60% 80% 100%
Other Pneumonia (28)
Cesarean Delivery (35)
Rehabilitation (66)
Vaginal Delivery (78)
Normal Neonate Birth (118)
Discharges by DRG of regional discharges were
treated at this hospital in FY14
0%
0%
0%
0%
0%
0%
0%
0%
0%
54%
0% 20% 40% 60% 80% 100%
Nantucket MA (545)
Discharges by Community
Qu
alit
y 16.7% 16.0%
15.9% 15.0%
0%
5%
10%
15%
20%
25%
2011 2013
0
1
2
3CLABSI CAUTI SSI: Colon Surgery
Data is not available for these measures
DRGs with fewer than 26 discharges have been suppressed.
Communities with fewer than 26 discharges have been suppressed.
of community discharges were treated at this hospital in FY14
Lower is Better
Lower is Better
State Average
C25

Key:
Hospital
Cohort: Community Hospital Peer Cohort
For descriptions of the metrics, please see the technical appendix.
2014 HOSPITAL PROFILE: NANTUCKET COTTAGE HOSPITAL
What were the hospital's total margin and operating margins between
FY10 and FY14, and how do these compare to the hospital's peer
cohort medians?Revenue, Cost, & Profit/Loss (in millions)
How have the hospital's total revenue and costs changed between
FY10 and FY14?
How has the volume of the hospital's inpatient discharges changed
compared to FY10, and how does this compare to the hospital's peer
cohort median? (FY10=100)
How has the volume of the hospital's outpatient visits changed
compared to FY10, and how does this compare to the hospital's peer
cohort median? (FY10=100)
FY
What was the hospital's net inpatient service revenue per case mix
adjusted discharge between FY10 and FY14, and how does this
compare to the hospital's peer cohort median?
2011 2012 20132010 2014
27$
1$ 2$
37$ 35$
How has the hospital's total outpatient revenue changed compared to
FY10, and how does this compare to the hospital's peer cohort
median? (FY10=100)
27$ 30$ Total Revenue
‡ Costs were adjusted to exclude direct medical education costs and physician compensation.
32$ 33$ 35$
* Disproportionate Share Hospitals (DSH) receive a minimum of 63% of gross patient service revenue from public
payers.
26$ 33$ Operating Revenue
3$ 3$ 3$
Total Costs
Total Profit (Loss) (6.7)$ (5.4)$ 3.2$ 0.5$ 2.3$
37$ 36$
40$
Non-Operating
Revenue
37$ 32$
Uti
lizat
ion
+21.2%
-9.5%
65707580859095
100105110115120125130135140
2010 2011 2012 2013 2014
FY14 Inpatient Discharges = 628
-13.8%
-1.5%
65707580859095
100105110115120125130135140
2010 2011 2012 2013 2014
FY14 Outpatient Visits = 24,094
Pat
ien
t R
even
ue
Tre
nd
s
Hospital
Cohort Median
$2,000
$6,000
$10,000
$14,000
$18,000
$22,000
2010 2011 2012 2013 2014
+4.2%
65707580859095
100105110115120125130135140
2010 2011 2012 2013 2014
FY14 Outpatient Revenue = $31 M
Fin
anci
al P
erfo
rman
ce
5.9%
1.7% 2.9%
-10%
0%
10%
2010 2011 2012 2013 2014
Tot
al
-2.2%
2.1% 1.3%
-10%
0%
10%
Ope
ratin
g
+51.6% +44.3% +54.7%
-24.9% -30.1%
-20.0% -22.7%
November 2015

2014 Hospital Profile
Overview / Size Payer Mix
Hospital System Affiliation: Public Payer Mix:
Change in Ownership (FY10-FY14): CY14 Commercial Payer Price Level:
Total Staffed Beds: Top 3 Commercial Payers:
% Occupancy:
Special Public Funding:
Financial Change FY13-FY14:
Adjusted‡ Cost per Discharge: Emergency Department Visits in FY14:
Inpatient NPSR per CMAD: Change FY13-FY14:
Outpatient Visits in FY14:
For descriptions of the metrics, please see the technical appendix.
Hospital (20,091) = 7% of total regional discharges - - -
What proportion of adult patient discharges from this hospital resulted
in a readmission at any hospital within 30 days, and how does this
compare to the state average?
Inpatient:Outpatient Revenue in FY14: 35%:65%
Outpatient Revenue in FY14: $222,175,786
3.5%
Total Revenue in FY14:
$11,769,000
$426,470,000
Change FY13-FY14:
What were the most common inpatient cases (DRGs) treated at the
hospital in FY14? What proportion of the region’s cases did this
hospital treat for each service?
11.8%
62nd Percentile
How many central line-associated blood stream infections (CLABSI),
catheter-associated urinary tract infections (CAUTI), and surgical site
infections (SSI) after colon surgery did patients get at this hospital
compared to what was expected based on the hospital's characteristics
and case mix?
-2.1%
4.1%
Change FY11-FY13 (percentage points):
Early Elective Deliveries Rate (Jan 2014-Jun 2015):
20,091Inpatient Discharges in FY14:
2.9%
54,664
Tufts Associated Health Maintenance Org.
Quality
Readmission Rate in FY13:
Utilization
Change FY13-FY14: 1.9%
129,471
Where did most of the hospital's inpatients reside? What proportion of
each community's total discharges was attributed to this hospital?
-5.2%
0.74, < cohort avg. (0.81); < statewide (1.00)
Change FY13-FY14:
Total Surplus (Loss) in FY14:
NEWTON-WELLESLEY HOSPITAL
$11,373
Trauma Center Designation:
$12,227
Newton-Wellesley Hospital is a non-profit community hospital located in the Metro Boston region. It is among the larger acute hospitals in Massachusetts
and a member of Partners HealthCare System. Though it treated only 7% of total regional discharges, it was responsible for 17% of all Cesarean delivery
discharges in Metro Boston. Inpatient discharges at Newton-Wellesley decreased 1.6% from FY10 to FY14, compared to a median decrease of 9.5% in its
peer cohort. Newton-Wellesley was profitable each year in the five-year period, and it had a total margin of 2.8% in FY14, the lowest in the five year
period. It receives the lowest percentage of business from public payers of any non-specialty acute hospital.
75.5%, > cohort avg. (61%)
40.3% (Non-DSH* Hospital)
Harvard Pilgrim Health Care
282, among the larger acute hospitals
Partners HealthCare System
Blue Cross Blue Shield of Massachusetts
Not Applicable
Not Applicable
Newton, MA
Community Hospital
Case Mix Index:
Metro Boston
Not Applicable
-1.5%
At
a G
lan
ce
Ser
vice
s
8%
11% 6%
14%
6%
8%
12%
17%
15%
16%
0% 20% 40% 60% 80% 100%
Card Arrth & Cond Dis (256)
Dors&Lum Fus exc Curv (305)
Heart Failure (369)
Bipolar Disorders (402)
Knee Joint Replacement (449)
Sepsis & Dissem Inf (553)
Hip Joint Replacement (779)
Cesarean Delivery (1455)
Vaginal Delivery (2924)
Normal Neonate Birth (4155)
Discharges by DRG of regional discharges
were treated at this hospital in FY14
8%
22%
45%
32%
50%
48%
49%
13%
25%
39%
0% 20% 40% 60% 80% 100%
Norwood MA (360)
Needham MA (371)
Weston MA (390)
Newton Center MA (395)
Wellesley MA (414)
West Newton MA (504)
Wellesley Hills MA (526)
Framingham MA (888)
Natick MA (896)
Waltham MA (2,470)
Discharges by Community
Qu
alit
y
13.9%
11.8%
15.9% 15.0%
0%
5%
10%
15%
20%
25%
2011 2013
0
1
2
3CLABSI CAUTI SSI: Colon Surgery
of community discharges were treated at this hospital in FY14
Lower is Better
Lower is Better
State Average
C26

Key:
Hospital
Cohort: Community Hospital Peer Cohort
For descriptions of the metrics, please see the technical appendix.
‡ Costs were adjusted to exclude direct medical education costs and physician compensation.
377$ 398$ 398$
* Disproportionate Share Hospitals (DSH) receive a minimum of 63% of gross patient service revenue from public
payers.
398$ 426$ Operating Revenue
(0)$ 1$ 4$
Total Costs
Total Profit (Loss) 19.3$ 19.6$ 31.2$ 18.8$ 11.8$
415$ 365$
426$
Non-Operating
Revenue
427$ 416$ 384$
(1)$ 0$
429$ 417$
How has the hospital's total outpatient revenue changed compared to
FY10, and how does this compare to the hospital's peer cohort
median? (FY10=100)
397$ 385$ Total Revenue
2014 HOSPITAL PROFILE: NEWTON-WELLESLEY HOSPITAL
What were the hospital's total margin and operating margins between
FY10 and FY14, and how do these compare to the hospital's peer
cohort medians?Revenue, Cost, & Profit/Loss (in millions)
How have the hospital's total revenue and costs changed between
FY10 and FY14?
How has the volume of the hospital's inpatient discharges changed
compared to FY10, and how does this compare to the hospital's peer
cohort median? (FY10=100)
How has the volume of the hospital's outpatient visits changed
compared to FY10, and how does this compare to the hospital's peer
cohort median? (FY10=100)
FY
What was the hospital's net inpatient service revenue per case mix
adjusted discharge between FY10 and FY14, and how does this
compare to the hospital's peer cohort median?
2011 2012 20132010 2014
Uti
lizat
ion
-1.6%
-9.5%
65707580859095
100105110115120125130135140
2010 2011 2012 2013 2014
FY14 Inpatient Discharges = 20,091
-3.6%
-1.5%
65707580859095
100105110115120125130135140
2010 2011 2012 2013 2014
FY14 Outpatient Visits = 129,471
Pat
ien
t R
even
ue
Tre
nd
s
Hospital
Cohort Median
$2,000
$6,000
$10,000
$14,000
$18,000
$22,000
2010 2011 2012 2013 2014
+4.6%
+4.2%
65707580859095
100105110115120125130135140
2010 2011 2012 2013 2014
FY14 Outpatient Revenue = $222 M
Fin
anci
al P
erfo
rman
ce
5.0%
2.8% 1.7% 2.9%
-10%
0%
10%
2010 2011 2012 2013 2014
Tot
al
4.9% 2.9% 2.1% 1.3%
-10%
0%
10%
Ope
ratin
g
November 2015

2014 Hospital Profile
Overview / Size Payer Mix
Hospital System Affiliation: Public Payer Mix:
Change in Ownership (FY10-FY14): CY14 Commercial Payer Price Level:
Total Staffed Beds: Top 3 Commercial Payers:
% Occupancy:
Special Public Funding:
Financial Change FY13-FY14:
Adjusted‡ Cost per Discharge: Emergency Department Visits in FY14:
Inpatient NPSR per CMAD: Change FY13-FY14:
Outpatient Visits in FY14:
For descriptions of the metrics, please see the technical appendix.
1.2%
0.79, < cohort avg. (0.81); < statewide (1.00)
Change FY13-FY14:
NORTHEAST HOSPITAL
$8,993
Trauma Center Designation:
$10,108
Northeast Hospital, which includes Addison Gilbert Hospital and Beverly Hospital campuses, is a non-profit community hospital located in the Northeastern
Massachusetts region. It is among the larger acute hospitals in Massachusetts. Northeast Hospital and Lahey Hospital & Medical Center formed Lahey
Health in 2012. Inpatient discharges at the hospital increased 3.7% from FY10 to FY14, while the median inpatient discharges among peer cohort
hospitals decreased 9.5%. Northeast Hospital earned a profit each year from FY10 to FY14, with a total margin of 5.7% in FY14, higher than the 2.9%
median total margin among cohort hospitals, and the highest in the five-year period.
66.5%, > cohort avg. (61%)
61.9% (Non-DSH* Hospital)
Harvard Pilgrim Health Care
404, among the larger acute hospitals
Lahey Health System
Blue Cross Blue Shield of Massachusetts
Lahey Health - 2012
CHART^, ICBθ
Beverly, MA & Gloucester, MA
Community Hospital
Case Mix Index:
Northeastern Massachusetts
Adult: Level 3
-1.5%
16.7%
36th Percentile
How many central line-associated blood stream infections (CLABSI),
catheter-associated urinary tract infections (CAUTI), and surgical site
infections (SSI) after colon surgery did patients get at this hospital
compared to what was expected based on the hospital's characteristics
and case mix?
-0.6%
13.0%
Change FY11-FY13 (percentage points):
Early Elective Deliveries Rate (Jan 2014-Jun 2015):
21,656Inpatient Discharges in FY14:
3.1%
62,697
Tufts Associated Health Maintenance Org.
Quality
Readmission Rate in FY13:
Utilization
Change FY13-FY14: -0.6%
165,792
Where did most of the hospital's inpatients reside? What proportion of
each community's total discharges was attributed to this hospital?
Total Surplus (Loss) in FY14:
Inpatient:Outpatient Revenue in FY14: 37%:63%
Outpatient Revenue in FY14: $154,605,194
-4.1%
Total Revenue in FY14:
$19,194,000
$336,505,000
Change FY13-FY14:
What proportion of adult patient discharges from this hospital resulted
in a readmission at any hospital within 30 days, and how does this
compare to the state average?
What were the most common inpatient cases (DRGs) treated at the
hospital in FY14? What proportion of the region’s cases did this
hospital treat for each service?
Hospital (21,656) = 16% of total regional discharges - - -
At
a G
lan
ce
Ser
vice
s
11%
46%
12%
16%
16%
29%
17%
36%
20%
20%
0% 20% 40% 60% 80% 100%
Sepsis & Dissem Inf (500)
Schizophrenia (522)
Heart Failure (537)
COPD (544)
Other Pneumonia (645)
Maj Dep& Oth/Unsp Psychoses (650)
Cesarean Delivery (674)
Bipolar Disorders (1041)
Vaginal Delivery (1557)
Normal Neonate Birth (2172)
Discharges by DRG
of regional discharges were treated at this hospital in FY14
45%
64%
69%
61%
22%
12%
27%
54%
74%
73%
0% 20% 40% 60% 80% 100%
Middleton MA (372)
South Hamilton MA (399)
Rockport MA (629)
Ipswich MA (923)
Salem MA (1,091)
Lynn MA (1,468)
Peabody MA (1,876)
Danvers MA (2,088)
Gloucester MA (3,106)
Beverly MA (4,265)
Discharges by Community
Qu
alit
y 17.3% 16.7%
15.9% 15.0%
0%
5%
10%
15%
20%
25%
2011 2013
0
1
2
3CLABSI CAUTI SSI: Colon Surgery
of community discharges were treated at this
hospital in FY14
Lower is Better
Lower is Better
Data is not available for this measure
State Average
C27

Key:
Hospital
Cohort: Community Hospital Peer Cohort
For descriptions of the metrics, please see the technical appendix.
FY
What was the hospital's net inpatient service revenue per case mix
adjusted discharge between FY10 and FY14, and how does this
compare to the hospital's peer cohort median?
2011 2012 20132010 2014
How has the hospital's total outpatient revenue changed compared to
FY10, and how does this compare to the hospital's peer cohort
median? (FY10=100)
2014 HOSPITAL PROFILE: NORTHEAST HOSPITAL
What were the hospital's total margin and operating margins between
FY10 and FY14, and how do these compare to the hospital's peer
cohort medians?Revenue, Cost, & Profit/Loss (in millions)
How have the hospital's total revenue and costs changed between
FY10 and FY14?
How has the volume of the hospital's inpatient discharges changed
compared to FY10, and how does this compare to the hospital's peer
cohort median? (FY10=100)
How has the volume of the hospital's outpatient visits changed
compared to FY10, and how does this compare to the hospital's peer
cohort median? (FY10=100)
316$ 330$ Operating Revenue
3$ 10$ 3$
Total Costs
Total Profit (Loss) 3.7$ 7.1$ 12.6$ 19.1$ 19.2$
317$ 316$
337$
Non-Operating
Revenue
333$ 321$ 322$
2$ (3)$
333$ 331$ 318$ 319$ Total Revenue
‡ Costs were adjusted to exclude direct medical education costs and physician compensation.
^ For more information on Community Hospital Acceleration, Revitalization and Transformation (CHART) special
funding, please contact the Health Policy Commission (HPC).
θ For more information on Infrastructure and Capacity Building (ICB) special funding, please contact the
Massachusetts Executive Office of Health and Human Services (EOHHS).
311$ 320$ 312$
* Disproportionate Share Hospitals (DSH) receive a minimum of 63% of gross patient service revenue from public
payers.
Uti
lizat
ion
+3.7%
-9.5%
65707580859095
100105110115120125130135140
2010 2011 2012 2013 2014
FY14 Inpatient Discharges = 21,656
+3.3%
-1.5%
65707580859095
100105110115120125130135140
2010 2011 2012 2013 2014
FY14 Outpatient Visits = 165,792
Pat
ien
t R
even
ue
Tre
nd
s
Hospital
Cohort Median
$2,000
$6,000
$10,000
$14,000
$18,000
$22,000
2010 2011 2012 2013 2014
-18.0%
+4.2%
65707580859095
100105110115120125130135140
2010 2011 2012 2013 2014
FY14 Outpatient Revenue = $155 M
Fin
anci
al P
erfo
rman
ce
1.2%
5.7% 1.7% 2.9%
-10%
0%
10%
2010 2011 2012 2013 2014
Tot
al
2.0%
4.7% 2.1% 1.3%
-10%
0%
10%
Ope
ratin
g
November 2015

2014 Hospital Profile
Overview / Size Payer Mix
Hospital System Affiliation: Public Payer Mix:
Change in Ownership (FY10-FY14): CY14 Commercial Payer Price Level:
Total Staffed Beds: Top 3 Commercial Payers:
% Occupancy:
Special Public Funding:
Financial Change FY13-FY14:
Adjusted‡ Cost per Discharge: Emergency Department Visits in FY14:
Inpatient NPSR per CMAD: Change FY13-FY14:
Outpatient Visits in FY14:
For descriptions of the metrics, please see the technical appendix.
1.7%
0.84, > cohort avg. (0.81); < statewide (1.00)
Change FY13-FY14:
SOUTH SHORE HOSPITAL
$10,168
Trauma Center Designation:
$11,791
South Shore Hospital is a large, non-profit community hospital located in the Metro South region. Inpatient discharges at South Shore Hospital decreased
6.6% between FY10 and FY14, compared with a 9.5% decrease at the cohort median. Outpatient visits increased 7.2% between FY10 and FY14 at the
hospital, compared to a median decrease of 1.5% at peer cohort hospitals. During the same period, outpatient revenue increased 30.9% at the hospital.
South Shore Hospital was profitable from FY10 to FY14, with a total margin of 3.3% in FY14, higher than the 2.9% median total margin of its cohort.
68.1%, > cohort avg. (61%)
57.5% (Non-DSH* Hospital)
Harvard Pilgrim Health Care
415, 10th largest acute hospital
Not Applicable
Blue Cross Blue Shield of Massachusetts
Not Applicable
Not Applicable
South Weymouth, MA
Community Hospital
Case Mix Index:
Metro South
Adult: Level 2, Pedi: Level 3
1.1%
14.4%
61st Percentile
How many central line-associated blood stream infections (CLABSI),
catheter-associated urinary tract infections (CAUTI), and surgical site
infections (SSI) after colon surgery did patients get at this hospital
compared to what was expected based on the hospital's characteristics
and case mix?
-1.6%
0.0%
Change FY11-FY13 (percentage points):
Early Elective Deliveries Rate (Jan 2014-Jun 2015):
24,738Inpatient Discharges in FY14:
-0.9%
86,923
Tufts Associated Health Maintenance Org.
Quality
Readmission Rate in FY13:
Utilization
Change FY13-FY14: -1.1%
301,227
Where did most of the hospital's inpatients reside? What proportion of
each community's total discharges was attributed to this hospital?
Total Surplus (Loss) in FY14:
Inpatient:Outpatient Revenue in FY14: 44%:56%
Outpatient Revenue in FY14: $236,436,116
7.8%
Total Revenue in FY14:
$16,370,390
$494,896,482
Change FY13-FY14:
What proportion of adult patient discharges from this hospital resulted
in a readmission at any hospital within 30 days, and how does this
compare to the state average?
What were the most common inpatient cases (DRGs) treated at the
hospital in FY14? What proportion of the region’s cases did this
hospital treat for each service?
Hospital (24,738) = 36% of total regional discharges - - -
At
a G
lan
ce
Ser
vice
s
29%
28%
38%
36%
37%
34%
33%
56%
52%
52%
0% 20% 40% 60% 80% 100%
Renal Failure (398)
Cellulitis, Oth Bact Skn Inf (475)
Kidney & UT Infections (548)
Other Pneumonia (648)
COPD (753)
Heart Failure (789)
Sepsis & Dissem Inf (1022)
Cesarean Delivery (1283)
Vaginal Delivery (2114)
Normal Neonate Birth (3015)
Discharges by DRG of regional discharges
were treated at this hospital in FY14
50%
57%
51%
62%
57%
68%
56%
57%
15%
44%
0% 20% 40% 60% 80% 100%
Pembroke MA (837)
Scituate MA (982)
Marshfield MA (1,168)
East Weymouth MA (1,211)
Weymouth MA (1,356)
South Weymouth MA (1,374)
Rockland MA (1,402)
Hingham MA (1,425)
Quincy MA (1,733)
Braintree MA (2,093)
Discharges by Community
Qu
alit
y 16.0%
14.4% 15.9%
15.0%
0%
5%
10%
15%
20%
25%
2011 2013
0
1
2
3CLABSI CAUTI SSI: Colon Surgery
of community discharges were treated at this hospital in FY14
Lower is Better
Lower is Better
State Average
C28

Key:
Hospital
Cohort: Community Hospital Peer Cohort
For descriptions of the metrics, please see the technical appendix.
FY
What was the hospital's net inpatient service revenue per case mix
adjusted discharge between FY10 and FY14, and how does this
compare to the hospital's peer cohort median?
2011 2012 20132010 2014
How has the hospital's total outpatient revenue changed compared to
FY10, and how does this compare to the hospital's peer cohort
median? (FY10=100)
2014 HOSPITAL PROFILE: SOUTH SHORE HOSPITAL
What were the hospital's total margin and operating margins between
FY10 and FY14, and how do these compare to the hospital's peer
cohort medians?Revenue, Cost, & Profit/Loss (in millions)
How have the hospital's total revenue and costs changed between
FY10 and FY14?
How has the volume of the hospital's inpatient discharges changed
compared to FY10, and how does this compare to the hospital's peer
cohort median? (FY10=100)
How has the volume of the hospital's outpatient visits changed
compared to FY10, and how does this compare to the hospital's peer
cohort median? (FY10=100)
436$ 459$ Operating Revenue
(0)$ 7$ (4)$
Total Costs
Total Profit (Loss) 9.6$ 9.1$ 4.2$ 21.7$ 16.4$
479$ 411$
495$
Non-Operating
Revenue
495$ 472$ 421$
(0)$ 0$
455$ 479$ 436$ 421$ Total Revenue
‡ Costs were adjusted to exclude direct medical education costs and physician compensation.
427$ 451$ 457$
* Disproportionate Share Hospitals (DSH) receive a minimum of 63% of gross patient service revenue from public
payers.
Uti
lizat
ion
-6.6%
-9.5%
65707580859095
100105110115120125130135140
2010 2011 2012 2013 2014
FY14 Inpatient Discharges = 24,738
+7.2%
-1.5%
65707580859095
100105110115120125130135140
2010 2011 2012 2013 2014
FY14 Outpatient Visits = 301,227
Pat
ien
t R
even
ue
Tre
nd
s
Hospital
Cohort Median
$2,000
$6,000
$10,000
$14,000
$18,000
$22,000
2010 2011 2012 2013 2014
+30.9%
+4.2%
65707580859095
100105110115120125130135140
2010 2011 2012 2013 2014
FY14 Outpatient Revenue = $236 M
Fin
anci
al P
erfo
rman
ce
2.3% 3.3%
1.7% 2.9%
-10%
0%
10%
2010 2011 2012 2013 2014
Tot
al
2.3% 3.4%
2.1% 1.3%
-10%
0%
10%
Ope
ratin
g
November 2015
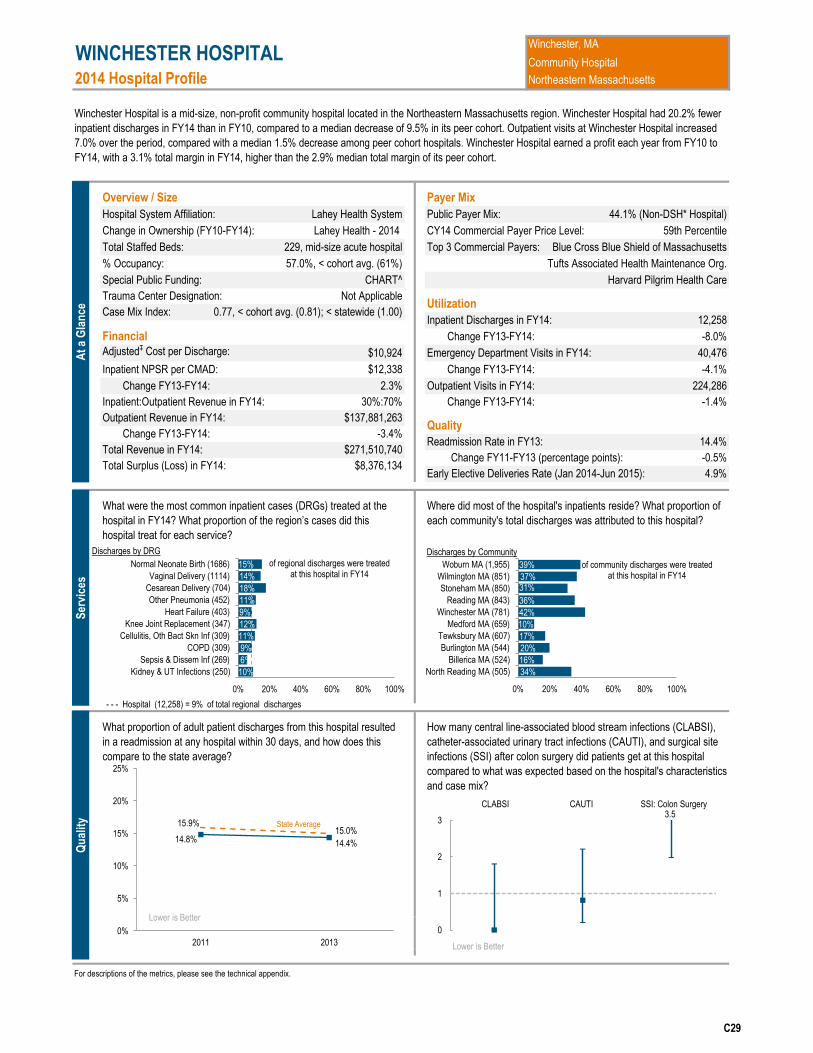
2014 Hospital Profile
Overview / Size Payer Mix
Hospital System Affiliation: Public Payer Mix:
Change in Ownership (FY10-FY14): CY14 Commercial Payer Price Level:
Total Staffed Beds: Top 3 Commercial Payers:
% Occupancy:
Special Public Funding:
Financial Change FY13-FY14:
Adjusted‡ Cost per Discharge: Emergency Department Visits in FY14:
Inpatient NPSR per CMAD: Change FY13-FY14:
Outpatient Visits in FY14:
For descriptions of the metrics, please see the technical appendix.
Hospital (12,258) = 9% of total regional discharges - - -
Total Surplus (Loss) in FY14:
Inpatient:Outpatient Revenue in FY14: 30%:70%
Outpatient Revenue in FY14: $137,881,263
-3.4%
Total Revenue in FY14:
$8,376,134
$271,510,740
Change FY13-FY14:
What proportion of adult patient discharges from this hospital resulted
in a readmission at any hospital within 30 days, and how does this
compare to the state average?
What were the most common inpatient cases (DRGs) treated at the
hospital in FY14? What proportion of the region’s cases did this
hospital treat for each service?
14.4%
59th Percentile
How many central line-associated blood stream infections (CLABSI),
catheter-associated urinary tract infections (CAUTI), and surgical site
infections (SSI) after colon surgery did patients get at this hospital
compared to what was expected based on the hospital's characteristics
and case mix?
-0.5%
4.9%
Change FY11-FY13 (percentage points):
Early Elective Deliveries Rate (Jan 2014-Jun 2015):
12,258Inpatient Discharges in FY14:
-8.0%
40,476
Harvard Pilgrim Health Care
Quality
Readmission Rate in FY13:
Utilization
Change FY13-FY14: -1.4%
224,286
Where did most of the hospital's inpatients reside? What proportion of
each community's total discharges was attributed to this hospital?
2.3%
0.77, < cohort avg. (0.81); < statewide (1.00)
Change FY13-FY14:
WINCHESTER HOSPITAL
$10,924
Trauma Center Designation:
$12,338
Winchester Hospital is a mid-size, non-profit community hospital located in the Northeastern Massachusetts region. Winchester Hospital had 20.2% fewer
inpatient discharges in FY14 than in FY10, compared to a median decrease of 9.5% in its peer cohort. Outpatient visits at Winchester Hospital increased
7.0% over the period, compared with a median 1.5% decrease among peer cohort hospitals. Winchester Hospital earned a profit each year from FY10 to
FY14, with a 3.1% total margin in FY14, higher than the 2.9% median total margin of its peer cohort.
57.0%, < cohort avg. (61%)
44.1% (Non-DSH* Hospital)
Tufts Associated Health Maintenance Org.
229, mid-size acute hospital
Lahey Health System
Blue Cross Blue Shield of Massachusetts
Lahey Health - 2014
CHART^
Winchester, MA
Community Hospital
Case Mix Index:
Northeastern Massachusetts
Not Applicable
-4.1%
At
a G
lan
ce
Ser
vice
s
10%
6%
9%
11%
12%
9%
11%
18%
14%
15%
0% 20% 40% 60% 80% 100%
Kidney & UT Infections (250)
Sepsis & Dissem Inf (269)
COPD (309)
Cellulitis, Oth Bact Skn Inf (309)
Knee Joint Replacement (347)
Heart Failure (403)
Other Pneumonia (452)
Cesarean Delivery (704)
Vaginal Delivery (1114)
Normal Neonate Birth (1686)
Discharges by DRG
of regional discharges were treated at this hospital in FY14
34%
16%
20%
17%
10%
42%
36%
31% 37%
39%
0% 20% 40% 60% 80% 100%
North Reading MA (505)
Billerica MA (524)
Burlington MA (544)
Tewksbury MA (607)
Medford MA (659)
Winchester MA (781)
Reading MA (843)
Stoneham MA (850)
Wilmington MA (851)
Woburn MA (1,955)
Discharges by Community
Qu
alit
y
14.8% 14.4%
15.9% 15.0%
0%
5%
10%
15%
20%
25%
2011 2013
0
1
2
3
CLABSI CAUTI SSI: Colon Surgery
of community discharges were treated at this hospital in FY14
Lower is Better
State Average
Lower is Better
3.5
C29

Key:
Hospital
Cohort: Community Hospital Peer Cohort
For descriptions of the metrics, please see the technical appendix.
271$ 267$ Total Revenue
‡ Costs were adjusted to exclude direct medical education costs and physician compensation.
^ For more information on Community Hospital Acceleration, Revitalization and Transformation (CHART) special
funding, please contact the Health Policy Commission (HPC).
260$ 273$ 266$
* Disproportionate Share Hospitals (DSH) receive a minimum of 63% of gross patient service revenue from public
payers.
268$ 282$ Operating Revenue
5$ 11$ 12$
Total Costs
Total Profit (Loss) 8.3$ 10.6$ 21.1$ 16.8$ 8.4$
263$ 258$
272$
Non-Operating
Revenue
267$ 273$ 266$
2$ 0$
294$ 283$
How has the hospital's total outpatient revenue changed compared to
FY10, and how does this compare to the hospital's peer cohort
median? (FY10=100)
2014 HOSPITAL PROFILE: WINCHESTER HOSPITAL
What were the hospital's total margin and operating margins between
FY10 and FY14, and how do these compare to the hospital's peer
cohort medians?Revenue, Cost, & Profit/Loss (in millions)
How have the hospital's total revenue and costs changed between
FY10 and FY14?
How has the volume of the hospital's inpatient discharges changed
compared to FY10, and how does this compare to the hospital's peer
cohort median? (FY10=100)
How has the volume of the hospital's outpatient visits changed
compared to FY10, and how does this compare to the hospital's peer
cohort median? (FY10=100)
FY
What was the hospital's net inpatient service revenue per case mix
adjusted discharge between FY10 and FY14, and how does this
compare to the hospital's peer cohort median?
2011 2012 20132010 2014
Uti
lizat
ion
-20.2%
-9.5%
65707580859095
100105110115120125130135140
2010 2011 2012 2013 2014
FY14 Inpatient Discharges = 12,258
+7.0%
-1.5%
65707580859095
100105110115120125130135140
2010 2011 2012 2013 2014
FY14 Outpatient Visits = 224,286
Pat
ien
t R
even
ue
Tre
nd
s
Hospital
Cohort Median
$2,000
$6,000
$10,000
$14,000
$18,000
$22,000
2010 2011 2012 2013 2014
-4.2%
+4.2%
65707580859095
100105110115120125130135140
2010 2011 2012 2013 2014
FY14 Outpatient Revenue = $138 M
Fin
anci
al P
erfo
rman
ce
3.1% 3.1% 1.7% 2.9%
-10%
0%
10%
2010 2011 2012 2013 2014
Tot
al
3.0% 1.4%
2.1% 1.3%
-10%
0%
10%
Ope
ratin
g
November 2015

2014 Hospital Profile
Overview / Size Payer Mix
Hospital System Affiliation: Public Payer Mix:
Change in Ownership (FY10-FY14): CY14 Commercial Payer Price Level:
Total Staffed Beds: Top 3 Commercial Payers:
% Occupancy:
Special Public Funding:
Financial Change FY13-FY14:
Adjusted‡ Cost per Discharge: Emergency Department Visits in FY14:
Inpatient NPSR per CMAD: Change FY13-FY14:
Outpatient Visits in FY14:
For descriptions of the metrics, please see the technical appendix.
Hospital (573) = 1% of total regional discharges - - -
Total Surplus (Loss) in FY14:
Inpatient:Outpatient Revenue in FY14: 13%:87%
Outpatient Revenue in FY14: $15,210,670
8.8%
Total Revenue in FY14:
$1,415,657
$22,840,837
Change FY13-FY14:
What proportion of adult patient discharges from this hospital resulted
in a readmission at any hospital within 30 days, and how does this
compare to the state average?
What were the most common inpatient cases (DRGs) treated at the
hospital in FY14? What proportion of the region’s cases did this
hospital treat for each service?
13.0%
48th Percentile
How many central line-associated blood stream infections (CLABSI),
catheter-associated urinary tract infections (CAUTI), and surgical site
infections (SSI) after colon surgery did patients get at this hospital
compared to what was expected based on the hospital's characteristics
and case mix?
-1.4%
Not Available
Change FY11-FY13 (percentage points):
Early Elective Deliveries Rate (Jan 2014-Jun 2015):
573Inpatient Discharges in FY14:
-0.5%
9,959
Tufts Associated Health Maintenance Org.
Quality
Readmission Rate in FY13:
Utilization
Change FY13-FY14: -6.5%
38,489
Where did most of the hospital's inpatients reside? What proportion of
each community's total discharges was attributed to this hospital?
4.3%
0.82, < cohort avg. (0.85); < statewide (1.00)
Change FY13-FY14:
ATHOL HOSPITAL
$14,274
Trauma Center Designation:
$13,536
Athol Hospital is a non-profit community-Disproportionate Share Hospital (DSH) located in the Central Massachusetts region. It is the smallest acute
hospital in Massachusetts, with 11 staffed beds. It is a member of the Heywood Healthcare system, and is designated by the Centers for Medicare &
Medicaid Services (CMS) as one of three Critical Access Hospitals (CAH) in Massachusetts. Athol Hospital reported losses from FY10 through FY12, but
it earned a profit in FY13 and FY14, with a 6.2% total margin in FY14 compared with a median total margin of 5.3% in its peer cohort.
85.8%, > cohort avg. (66%)
70.8% (DSH* Hospital)
Fallon Health and Life Assurance Company
11, the smallest acute hospital
Heywood Healthcare
Blue Cross Blue Shield of Massachusetts
Heywood Healthcare - 2012
CHART^, ICBθ
Athol, MA
Community, Disproportionate Share Hospital
Case Mix Index:
Central Massachusetts
Not Applicable
-3.6%
At
a G
lan
ce
Ser
vice
s
1%
3%
2%
4%
100%
0% 20% 40% 60% 80% 100%
Heart Failure (30)
Kidney & UT Infections (32)
Other Pneumonia (39)
COPD (62)
Rehabilitation (138)
Discharges by DRG
of regional discharges were treated at this hospital in FY14
0%
0%
0%
0%
0%
0%
0%
0%
17%
19%
0% 20% 40% 60% 80% 100%
Orange MA (153)
Athol MA (333)
Discharges by Community
Qu
alit
y
14.4% 13.0%
15.9% 15.0%
0%
5%
10%
15%
20%
25%
2011 2013
0
1
2
3CLABSI CAUTI SSI: Colon Surgery
Data is not available for these measures
DRGs with fewer than 26 discharges have been suppressed.
Communities with fewer than 26 discharges have been suppressed.
of community discharges were treated at this hospital in FY14
Lower is Better
Lower is Better
State Average
C30

Key:
Hospital
Cohort: Community, Disproportionate Share Hospital Peer Cohort
For descriptions of the metrics, please see the technical appendix.
18$ 22$ Total Revenue
‡ Costs were adjusted to exclude direct medical education costs and physician compensation.
^ For more information on Community Hospital Acceleration, Revitalization and Transformation (CHART) special
funding, please contact the Health Policy Commission (HPC).
θ For more information on Infrastructure and Capacity Building (ICB) special funding, please contact the
Massachusetts Executive Office of Health and Human Services (EOHHS).
22$ 22$ 19$
* Disproportionate Share Hospitals (DSH) receive a minimum of 63% of gross patient service revenue from public
payers.
19$ 20$ Operating Revenue
0$ 0$ 0$
Total Costs
Total Profit (Loss) (0.8)$ (4.7)$ (2.3)$ 0.1$ 1.4$
21$ 23$
23$
Non-Operating
Revenue
23$ 19$ 22$
(1)$ 0$
20$ 20$
How has the hospital's total outpatient revenue changed compared to
FY10, and how does this compare to the hospital's peer cohort
median? (FY10=100)
2014 HOSPITAL PROFILE: ATHOL HOSPITAL
What were the hospital's total margin and operating margins between
FY10 and FY14, and how do these compare to the hospital's peer
cohort medians?Revenue, Cost, & Profit/Loss (in millions)
How have the hospital's total revenue and costs changed between
FY10 and FY14?
How has the volume of the hospital's inpatient discharges changed
compared to FY10, and how does this compare to the hospital's peer
cohort median? (FY10=100)
How has the volume of the hospital's outpatient visits changed
compared to FY10, and how does this compare to the hospital's peer
cohort median? (FY10=100)
FY
What was the hospital's net inpatient service revenue per case mix
adjusted discharge between FY10 and FY14, and how does this
compare to the hospital's peer cohort median?
2011 2012 20132010 2014
Uti
lizat
ion
-9.4%
65707580859095
100105110115120125130135140
2010 2011 2012 2013 2014
FY14 Inpatient Discharges = 573
-23.7%
-3.6%
65707580859095
100105110115120125130135140
2010 2011 2012 2013 2014
FY14 Outpatient Visits = 38,489
Pat
ien
t R
even
ue
Tre
nd
s
Hospital
Cohort Median
$2,000
$6,000
$10,000
$14,000
$18,000
$22,000
2010 2011 2012 2013 2014
-18.3%
+11.2%
65707580859095
100105110115120125130135140
2010 2011 2012 2013 2014
FY14 Outpatient Revenue = $15 M
Fin
anci
al P
erfo
rman
ce
-3.5%
6.2% 2.8% 5.3%
-10%
0%
10%
2010 2011 2012 2013 2014
Tot
al
-3.8%
5.9%
1.5% 4.5%
-10%
0%
10%
Ope
ratin
g
-38.0%
-37.7%
-22.4% -11.6%
-26.6% -11.2%
November 2015
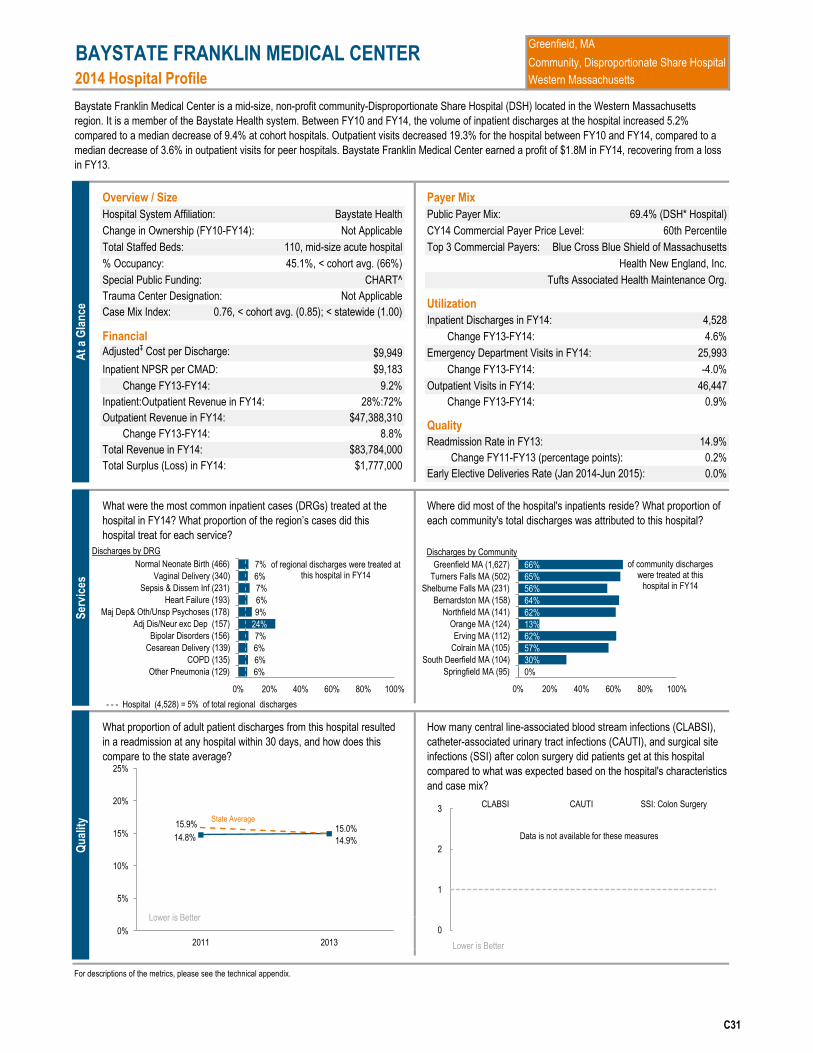
2014 Hospital Profile
Overview / Size Payer Mix
Hospital System Affiliation: Public Payer Mix:
Change in Ownership (FY10-FY14): CY14 Commercial Payer Price Level:
Total Staffed Beds: Top 3 Commercial Payers:
% Occupancy:
Special Public Funding:
Financial Change FY13-FY14:
Adjusted‡ Cost per Discharge: Emergency Department Visits in FY14:
Inpatient NPSR per CMAD: Change FY13-FY14:
Outpatient Visits in FY14:
For descriptions of the metrics, please see the technical appendix.
9.2%
0.76, < cohort avg. (0.85); < statewide (1.00)
Change FY13-FY14:
BAYSTATE FRANKLIN MEDICAL CENTER
$9,949
Trauma Center Designation:
$9,183
Baystate Franklin Medical Center is a mid-size, non-profit community-Disproportionate Share Hospital (DSH) located in the Western Massachusetts
region. It is a member of the Baystate Health system. Between FY10 and FY14, the volume of inpatient discharges at the hospital increased 5.2%
compared to a median decrease of 9.4% at cohort hospitals. Outpatient visits decreased 19.3% for the hospital between FY10 and FY14, compared to a
median decrease of 3.6% in outpatient visits for peer hospitals. Baystate Franklin Medical Center earned a profit of $1.8M in FY14, recovering from a loss
in FY13.
45.1%, < cohort avg. (66%)
69.4% (DSH* Hospital)
Health New England, Inc.
110, mid-size acute hospital
Baystate Health
Blue Cross Blue Shield of Massachusetts
Not Applicable
CHART^
Greenfield, MA
Community, Disproportionate Share Hospital
Case Mix Index:
Western Massachusetts
Not Applicable
-4.0%
14.9%
60th Percentile
How many central line-associated blood stream infections (CLABSI),
catheter-associated urinary tract infections (CAUTI), and surgical site
infections (SSI) after colon surgery did patients get at this hospital
compared to what was expected based on the hospital's characteristics
and case mix?
0.2%
0.0%
Change FY11-FY13 (percentage points):
Early Elective Deliveries Rate (Jan 2014-Jun 2015):
4,528Inpatient Discharges in FY14:
4.6%
25,993
Tufts Associated Health Maintenance Org.
Quality
Readmission Rate in FY13:
Utilization
Change FY13-FY14: 0.9%
46,447
Where did most of the hospital's inpatients reside? What proportion of
each community's total discharges was attributed to this hospital?
Total Surplus (Loss) in FY14:
Inpatient:Outpatient Revenue in FY14: 28%:72%
Outpatient Revenue in FY14: $47,388,310
8.8%
Total Revenue in FY14:
$1,777,000
$83,784,000
Change FY13-FY14:
What proportion of adult patient discharges from this hospital resulted
in a readmission at any hospital within 30 days, and how does this
compare to the state average?
What were the most common inpatient cases (DRGs) treated at the
hospital in FY14? What proportion of the region’s cases did this
hospital treat for each service?
Hospital (4,528) = 5% of total regional discharges - - -
At
a G
lan
ce
Ser
vice
s
6%
6%
6%
7%
24%
9%
6%
7%
6%
7%
0% 20% 40% 60% 80% 100%
Other Pneumonia (129)
COPD (135)
Cesarean Delivery (139)
Bipolar Disorders (156)
Adj Dis/Neur exc Dep (157)
Maj Dep& Oth/Unsp Psychoses (178)
Heart Failure (193)
Sepsis & Dissem Inf (231)
Vaginal Delivery (340)
Normal Neonate Birth (466)
Discharges by DRG
of regional discharges were treated at this hospital in FY14
0%
30%
57%
62%
13%
62%
64%
56%
65%
66%
0% 20% 40% 60% 80% 100%
Springfield MA (95)
South Deerfield MA (104)
Colrain MA (105)
Erving MA (112)
Orange MA (124)
Northfield MA (141)
Bernardston MA (158)
Shelburne Falls MA (231)
Turners Falls MA (502)
Greenfield MA (1,627)
Discharges by Community
Qu
alit
y
14.8% 14.9%
15.9% 15.0%
0%
5%
10%
15%
20%
25%
2011 2013
0
1
2
3CLABSI CAUTI SSI: Colon Surgery
Data is not available for these measures
of community discharges were treated at this
hospital in FY14
Lower is Better
Lower is Better
State Average
C31

Key:
Hospital
Cohort: Community, Disproportionate Share Hospital Peer Cohort
For descriptions of the metrics, please see the technical appendix.
FY
What was the hospital's net inpatient service revenue per case mix
adjusted discharge between FY10 and FY14, and how does this
compare to the hospital's peer cohort median?
2011 2012 20132010 2014
How has the hospital's total outpatient revenue changed compared to
FY10, and how does this compare to the hospital's peer cohort
median? (FY10=100)
2014 HOSPITAL PROFILE: BAYSTATE FRANKLIN MEDICAL CENTER
What were the hospital's total margin and operating margins between
FY10 and FY14, and how do these compare to the hospital's peer
cohort medians?Revenue, Cost, & Profit/Loss (in millions)
How have the hospital's total revenue and costs changed between
FY10 and FY14?
How has the volume of the hospital's inpatient discharges changed
compared to FY10, and how does this compare to the hospital's peer
cohort median? (FY10=100)
How has the volume of the hospital's outpatient visits changed
compared to FY10, and how does this compare to the hospital's peer
cohort median? (FY10=100)
76$ 82$ Operating Revenue
0$ 1$ 1$
Total Costs
Total Profit (Loss) (4.1)$ (3.5)$ 0.8$ (0.9)$ 1.8$
82$ 81$
84$
Non-Operating
Revenue
83$ 78$ 77$
1$ 1$
82$ 78$ 77$ 77$ Total Revenue
‡ Costs were adjusted to exclude direct medical education costs and physician compensation.
^ For more information on Community Hospital Acceleration, Revitalization and Transformation (CHART) special
funding, please contact the Health Policy Commission (HPC).
80$ 81$ 79$
* Disproportionate Share Hospitals (DSH) receive a minimum of 63% of gross patient service revenue from public
payers.
Uti
lizat
ion
+5.2%
-9.4%
65707580859095
100105110115120125130135140
2010 2011 2012 2013 2014
FY14 Inpatient Discharges = 4,528
-19.3%
-3.6%
65707580859095
100105110115120125130135140
2010 2011 2012 2013 2014
FY14 Outpatient Visits = 46,447
Pat
ien
t R
even
ue
Tre
nd
s
Hospital
Cohort Median
$2,000
$6,000
$10,000
$14,000
$18,000
$22,000
2010 2011 2012 2013 2014
-7.1%
+11.2%
65707580859095
100105110115120125130135140
2010 2011 2012 2013 2014
FY14 Outpatient Revenue = $47 M
Fin
anci
al P
erfo
rman
ce
-5.3%
2.1% 2.8%
5.3%
-10%
0%
10%
2010 2011 2012 2013 2014
Tot
al
-6.1%
1.7% 1.5%
4.5%
-10%
0%
10%
Ope
ratin
g

2014 Hospital Profile
Overview / Size Payer Mix
Hospital System Affiliation: Public Payer Mix:
Change in Ownership (FY10-FY14): CY14 Commercial Payer Price Level:
Total Staffed Beds: Top 3 Commercial Payers:
% Occupancy:
Special Public Funding:
Financial Change FY13-FY14:
Adjusted‡ Cost per Discharge: Emergency Department Visits in FY14:
Inpatient NPSR per CMAD: Change FY13-FY14:
Outpatient Visits in FY14:
For descriptions of the metrics, please see the technical appendix.
-22.5%
0.91, > cohort avg. (0.85); < statewide (1.00)
Change FY13-FY14:
BAYSTATE NOBLE HOSPITAL (Noble Hospital)
$8,719
Trauma Center Designation:
$8,851
Baystate Noble Hospital is a non-profit community-Disproportionate Share Hospital (DSH) located in the Western Massachusetts region. It is among the
smaller acute hospitals in Massachusetts. It became affiliated with Baystate Health in 2015. While there was a 6.5% decrease in outpatient visits at
Baystate Noble Hospital from FY10 to FY14, compared to a median decrease of 3.6% among peer cohort hospitals, outpatient revenue rose 43.0% from
FY10 to FY14. The hospital earned a profit in FY12, FY13, and FY14, with a total margin of 2.6% in FY14, lower than the median total margin of 5.3%
among peer cohort hospitals.
49.7%, < cohort avg. (66%)
66.5% (DSH* Hospital)
Health New England, Inc.
97, among the smaller acute hospitals
Baystate Health
Blue Cross Blue Shield of Massachusetts
Baystate Health - 2015 (FY15)
CHART^, ICBθ
Westfield, MA
Community, Disproportionate Share Hospital
Case Mix Index:
Western Massachusetts
Not Applicable
1.3%
14.4%
11th Percentile
How many central line-associated blood stream infections (CLABSI),
catheter-associated urinary tract infections (CAUTI), and surgical site
infections (SSI) after colon surgery did patients get at this hospital
compared to what was expected based on the hospital's characteristics
and case mix?
1.1%Change FY11-FY13 (percentage points):
Early Elective Deliveries Rate (Jan 2014-Jun 2015):
3,263Inpatient Discharges in FY14:
-2.4%
25,824
Cigna Health and Life Ins. Co. (EAST)
Quality
Readmission Rate in FY13:
Utilization
Change FY13-FY14: -10.4%
41,024
Where did most of the hospital's inpatients reside? What proportion of
each community's total discharges was attributed to this hospital?
Not ApplicableTotal Surplus (Loss) in FY14:
Inpatient:Outpatient Revenue in FY14: 35%:65%
Outpatient Revenue in FY14: $32,170,935
41.4%
Total Revenue in FY14:
$1,505,412
$57,390,675
Change FY13-FY14:
What proportion of adult patient discharges from this hospital resulted
in a readmission at any hospital within 30 days, and how does this
compare to the state average?
What were the most common inpatient cases (DRGs) treated at the
hospital in FY14? What proportion of the region’s cases did this
hospital treat for each service?
Hospital (3,263) = 3% of total regional discharges - - -
At
a G
lan
ce
Ser
vice
s
5%
7%
7%
11%
4%
7%
7%
7%
10%
30%
0% 20% 40% 60% 80% 100%
Card Arrth & Cond Dis (82)
Kidney & UT Infections (84)
Schizophrenia (84)
Dep exc Maj Dep (86)
Heart Failure (119)
COPD (142)
Other Pneumonia (150)
Bipolar Disorders (170)
Maj Dep& Oth/Unsp Psychoses (199)
Rehabilitation (348)
Discharges by DRG
of regional discharges were treated at this hospital in FY14
15%
1%
39%
40%
9%
4%
1% 5%
43%
38%
0% 20% 40% 60% 80% 100%
Huntington MA (39)
Chicopee MA (52)
Russell MA (55)
Granville MA (60)
Feeding Hills MA (102)
Agawam MA (115)
Springfield MA (117)
West Springfield MA (167)
Southwick MA (404)
Westfield MA (1,722)
Discharges by Community
Qu
alit
y
13.4% 14.4%
15.9% 15.0%
0%
5%
10%
15%
20%
25%
2011 2013
0
1
2
3CLABSI CAUTI SSI: Colon Surgery
of community discharges were treated at this hospital in FY14
Lower is Better
Lower is Better
Data is not available for these measures
State Average
C32
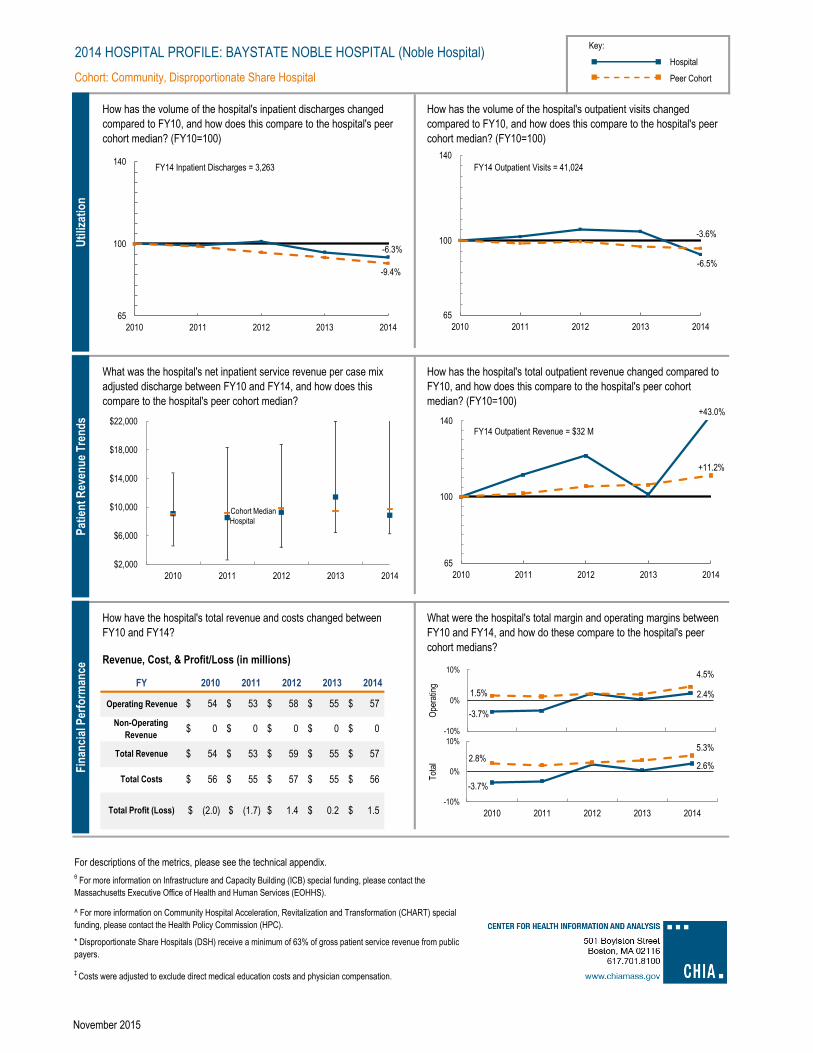
Key:
Hospital
Cohort: Community, Disproportionate Share Hospital Peer Cohort
For descriptions of the metrics, please see the technical appendix.
FY
What was the hospital's net inpatient service revenue per case mix
adjusted discharge between FY10 and FY14, and how does this
compare to the hospital's peer cohort median?
2011 2012 20132010 2014
How has the hospital's total outpatient revenue changed compared to
FY10, and how does this compare to the hospital's peer cohort
median? (FY10=100)
2014 HOSPITAL PROFILE: BAYSTATE NOBLE HOSPITAL (Noble Hospital)
What were the hospital's total margin and operating margins between
FY10 and FY14, and how do these compare to the hospital's peer
cohort medians?Revenue, Cost, & Profit/Loss (in millions)
How have the hospital's total revenue and costs changed between
FY10 and FY14?
How has the volume of the hospital's inpatient discharges changed
compared to FY10, and how does this compare to the hospital's peer
cohort median? (FY10=100)
How has the volume of the hospital's outpatient visits changed
compared to FY10, and how does this compare to the hospital's peer
cohort median? (FY10=100)
53$ 58$ Operating Revenue
0$ 0$ 0$
Total Costs
Total Profit (Loss) (2.0)$ (1.7)$ 1.4$ 0.2$ 1.5$
56$ 56$
57$
Non-Operating
Revenue
57$ 55$ 54$
0$ 0$
59$ 55$ 53$ 54$ Total Revenue
‡ Costs were adjusted to exclude direct medical education costs and physician compensation.
^ For more information on Community Hospital Acceleration, Revitalization and Transformation (CHART) special
funding, please contact the Health Policy Commission (HPC).
θ For more information on Infrastructure and Capacity Building (ICB) special funding, please contact the
Massachusetts Executive Office of Health and Human Services (EOHHS).
55$ 57$ 55$
* Disproportionate Share Hospitals (DSH) receive a minimum of 63% of gross patient service revenue from public
payers.
Uti
lizat
ion
-6.3%
-9.4%
65707580859095
100105110115120125130135140
2010 2011 2012 2013 2014
FY14 Inpatient Discharges = 3,263
-6.5%
-3.6%
65707580859095
100105110115120125130135140
2010 2011 2012 2013 2014
FY14 Outpatient Visits = 41,024
Pat
ien
t R
even
ue
Tre
nd
s
Hospital Cohort Median
$2,000
$6,000
$10,000
$14,000
$18,000
$22,000
2010 2011 2012 2013 2014
+11.2%
65707580859095
100105110115120125130135140
2010 2011 2012 2013 2014
FY14 Outpatient Revenue = $32 M
Fin
anci
al P
erfo
rman
ce
-3.7%
2.6% 2.8%
5.3%
-10%
0%
10%
2010 2011 2012 2013 2014
Tot
al
-3.7%
2.4% 1.5%
4.5%
-10%
0%
10%
Ope
ratin
g
+43.0%
November 2015

2014 Hospital Profile
Overview / Size Payer Mix
Hospital System Affiliation: Public Payer Mix:
Change in Ownership (FY10-FY14): CY14 Commercial Payer Price Level:
Total Staffed Beds: Top 3 Commercial Payers:
% Occupancy:
Special Public Funding:
Financial Change FY13-FY14:
Adjusted‡ Cost per Discharge: Emergency Department Visits in FY14:
Inpatient NPSR per CMAD: Change FY13-FY14:
Outpatient Visits in FY14:
For descriptions of the metrics, please see the technical appendix.
Hospital (3,049) = 3% of total regional discharges - - -
Total Surplus (Loss) in FY14:
Inpatient:Outpatient Revenue in FY14: 27%:73%
Outpatient Revenue in FY14: $56,803,252
-3.6%
Total Revenue in FY14:
$1,881,000
$88,136,000
Change FY13-FY14:
What proportion of adult patient discharges from this hospital resulted
in a readmission at any hospital within 30 days, and how does this
compare to the state average?
What were the most common inpatient cases (DRGs) treated at the
hospital in FY14? What proportion of the region’s cases did this
hospital treat for each service?
15.6%
23rd Percentile
How many central line-associated blood stream infections (CLABSI),
catheter-associated urinary tract infections (CAUTI), and surgical site
infections (SSI) after colon surgery did patients get at this hospital
compared to what was expected based on the hospital's characteristics
and case mix?
-1.9%Change FY11-FY13 (percentage points):
Early Elective Deliveries Rate (Jan 2014-Jun 2015):
3,049Inpatient Discharges in FY14:
-2.7%
22,940
Cigna Health and Life Ins. Co. (EAST)
Quality
Readmission Rate in FY13:
Utilization
Change FY13-FY14: -2.6%
180,814
Where did most of the hospital's inpatients reside? What proportion of
each community's total discharges was attributed to this hospital?
Not Applicable
14.0%
0.83, < cohort avg. (0.85); < statewide (1.00)
Change FY13-FY14:
BAYSTATE WING HOSPITAL (Wing Memorial Hospital)
$8,567
Trauma Center Designation:
$8,714
Baystate Wing Hospital is a non-profit community-Disproportionate Share Hospital (DSH) located in the Western Massachusetts region. It is among the
smaller acute hospitals in Massachusetts. Baystate Wing Hospital joined Baystate Health effective September 1, 2014. For the preceding October 1, 2013
through August 30, 2014 of FY14, Wing Memorial Hospital was a member of UMass Memorial Health Care. Baystate Wing Hospital earned a profit each
year from FY10 to FY14, with a 2.1% total margin in FY14, lower than the 5.3% median total margin of peer cohort hospitals.
62.0%, < cohort avg. (66%)
69.6% (DSH* Hospital)
Health New England, Inc.
74, among the smaller acute hospitals
Baystate Health
Blue Cross Blue Shield of Massachusetts
Baystate Health - 2013
CHART^
Palmer, MA
Community, Disproportionate Share Hospital
Case Mix Index:
Western Massachusetts
Not Applicable
-6.1%
At
a G
lan
ce
Ser
vice
s
9%
5%
5%
9%
7%
5%
7%
7%
50%
11%
0% 20% 40% 60% 80% 100%
NBact Gastro, Naus, Vom (74)
Card Arrth & Cond Dis (90)
Cellulitis, Oth Bact Skn Inf (99)
Kidney & UT Infections (115)
Maj Dep& Oth/Unsp Psychoses (137)
Heart Failure (150)
COPD (151)
Other Pneumonia (157)
Org Mental Hlth Disturb (187)
Bipolar Disorders (252)
Discharges by DRG
of regional discharges were treated at this
hospital in FY14
1%
0%
9% 47%
12%
1%
18%
13%
34%
42%
0% 20% 40% 60% 80% 100%
Chicopee MA (79)
Worcester MA (84)
Ware MA (103)
Three Rivers MA (142)
Belchertown MA (151)
Springfield MA (233)
Wilbraham MA (264)
Ludlow MA (281)
Monson MA (295)
Palmer MA (486)
Discharges by Community
Qu
alit
y
17.6%
15.6% 15.9%
15.0%
0%
5%
10%
15%
20%
25%
2011 2013
0
1
2
3CLABSI CAUTI SSI: Colon Surgery
Data is not available for these measures
of community discharges were treated at this hospital in FY14
Lower is Better
Lower is Better
State Average
C33

Key:
Hospital
Cohort: Community, Disproportionate Share Hospital Peer Cohort
For descriptions of the metrics, please see the technical appendix.
92$ 90$ Total Revenue
‡ Costs were adjusted to exclude direct medical education costs and physician compensation.
^ For more information on Community Hospital Acceleration, Revitalization and Transformation (CHART) special
public funding, please contact the Health Policy Commission
90$ 89$ 90$
* Disproportionate Share Hospitals (DSH) receive a minimum of 63% of gross patient service revenue from public
payers.
91$ 92$ Operating Revenue
1$ 1$ 5$
Total Costs
Total Profit (Loss) 1.2$ 1.9$ 7.6$ 2.8$ 1.9$
86$ 88$
88$
Non-Operating
Revenue
87$ 92$ 89$
0$ 0$
97$ 93$
How has the hospital's total outpatient revenue changed compared to
FY10, and how does this compare to the hospital's peer cohort
median? (FY10=100)
2014 HOSPITAL PROFILE: BAYSTATE WING HOSPITAL (Wing Memorial Hospital)
What were the hospital's total margin and operating margins between
FY10 and FY14, and how do these compare to the hospital's peer
cohort medians?Revenue, Cost, & Profit/Loss (in millions)
How have the hospital's total revenue and costs changed between
FY10 and FY14?
How has the volume of the hospital's inpatient discharges changed
compared to FY10, and how does this compare to the hospital's peer
cohort median? (FY10=100)
How has the volume of the hospital's outpatient visits changed
compared to FY10, and how does this compare to the hospital's peer
cohort median? (FY10=100)
FY
What was the hospital's net inpatient service revenue per case mix
adjusted discharge between FY10 and FY14, and how does this
compare to the hospital's peer cohort median?
2011 2012 20132010 2014
Uti
lizat
ion
-19.7%
-9.4%
65707580859095
100105110115120125130135140
2010 2011 2012 2013 2014
FY14 Inpatient Discharges = 3,049
-8.7%
-3.6%
65707580859095
100105110115120125130135140
2010 2011 2012 2013 2014
FY14 Outpatient Visits = 180,814
Pat
ien
t R
even
ue
Tre
nd
s
Hospital
Cohort Median
$2,000
$6,000
$10,000
$14,000
$18,000
$22,000
2010 2011 2012 2013 2014
+0.8%
+11.2%
65707580859095
100105110115120125130135140
2010 2011 2012 2013 2014
FY14 Outpatient Revenue = $57 M
Fin
anci
al P
erfo
rman
ce
1.3% 2.1% 2.8%
5.3%
-10%
0%
10%
2010 2011 2012 2013 2014
Tot
al
1.1% 1.3%
1.5% 4.5%
-10%
0%
10%
Ope
ratin
g
November 2015
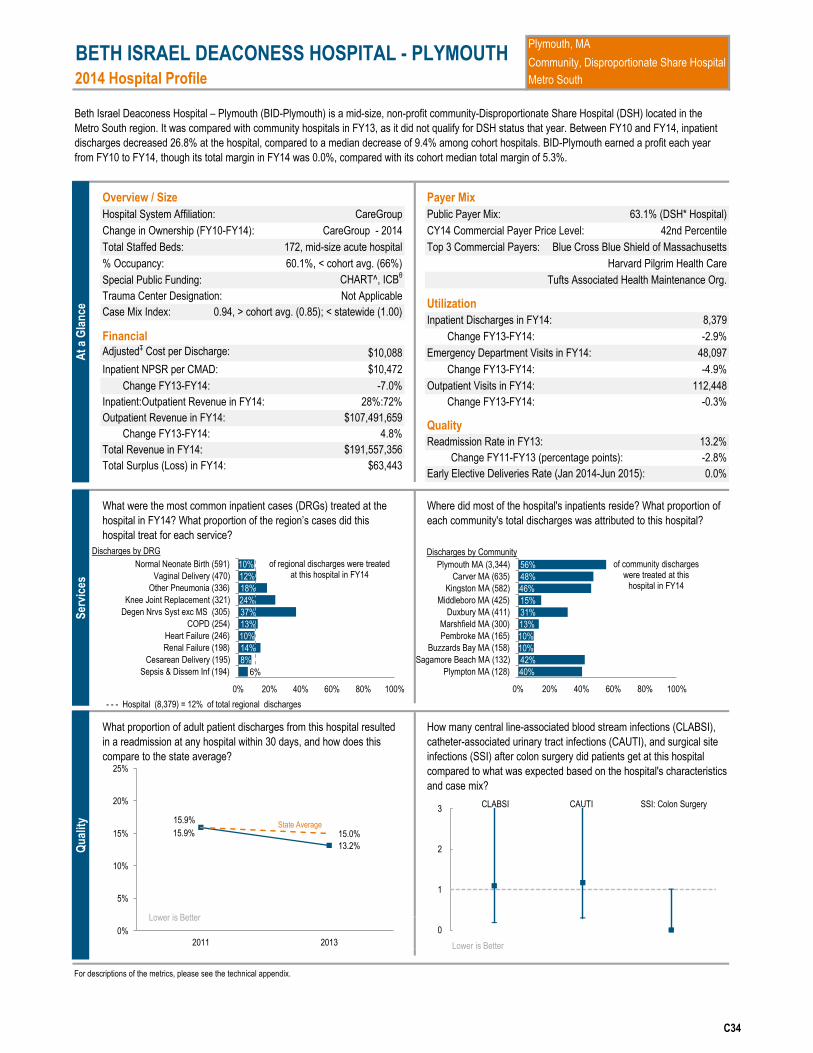
2014 Hospital Profile
Overview / Size Payer Mix
Hospital System Affiliation: Public Payer Mix:
Change in Ownership (FY10-FY14): CY14 Commercial Payer Price Level:
Total Staffed Beds: Top 3 Commercial Payers:
% Occupancy:
Special Public Funding:
Financial Change FY13-FY14:
Adjusted‡ Cost per Discharge: Emergency Department Visits in FY14:
Inpatient NPSR per CMAD: Change FY13-FY14:
Outpatient Visits in FY14:
For descriptions of the metrics, please see the technical appendix.
-7.0%
0.94, > cohort avg. (0.85); < statewide (1.00)
Change FY13-FY14:
BETH ISRAEL DEACONESS HOSPITAL - PLYMOUTH
$10,088
Trauma Center Designation:
$10,472
Beth Israel Deaconess Hospital – Plymouth (BID-Plymouth) is a mid-size, non-profit community-Disproportionate Share Hospital (DSH) located in the
Metro South region. It was compared with community hospitals in FY13, as it did not qualify for DSH status that year. Between FY10 and FY14, inpatient
discharges decreased 26.8% at the hospital, compared to a median decrease of 9.4% among cohort hospitals. BID-Plymouth earned a profit each year
from FY10 to FY14, though its total margin in FY14 was 0.0%, compared with its cohort median total margin of 5.3%.
60.1%, < cohort avg. (66%)
63.1% (DSH* Hospital)
Harvard Pilgrim Health Care
172, mid-size acute hospital
CareGroup
Blue Cross Blue Shield of Massachusetts
CareGroup - 2014
CHART^, ICBθ
Plymouth, MA
Community, Disproportionate Share Hospital
Case Mix Index:
Metro South
Not Applicable
-4.9%
13.2%
42nd Percentile
How many central line-associated blood stream infections (CLABSI),
catheter-associated urinary tract infections (CAUTI), and surgical site
infections (SSI) after colon surgery did patients get at this hospital
compared to what was expected based on the hospital's characteristics
and case mix?
-2.8%
0.0%
Change FY11-FY13 (percentage points):
Early Elective Deliveries Rate (Jan 2014-Jun 2015):
8,379Inpatient Discharges in FY14:
-2.9%
48,097
Tufts Associated Health Maintenance Org.
Quality
Readmission Rate in FY13:
Utilization
Change FY13-FY14: -0.3%
112,448
Where did most of the hospital's inpatients reside? What proportion of
each community's total discharges was attributed to this hospital?
Total Surplus (Loss) in FY14:
Inpatient:Outpatient Revenue in FY14: 28%:72%
Outpatient Revenue in FY14: $107,491,659
4.8%
Total Revenue in FY14:
$63,443
$191,557,356
Change FY13-FY14:
What proportion of adult patient discharges from this hospital resulted
in a readmission at any hospital within 30 days, and how does this
compare to the state average?
What were the most common inpatient cases (DRGs) treated at the
hospital in FY14? What proportion of the region’s cases did this
hospital treat for each service?
Hospital (8,379) = 12% of total regional discharges - - -
At
a G
lan
ce
Ser
vice
s
6%
8%
14%
10%
13%
37%
24%
18%
12%
10%
0% 20% 40% 60% 80% 100%
Sepsis & Dissem Inf (194)
Cesarean Delivery (195)
Renal Failure (198)
Heart Failure (246)
COPD (254)
Degen Nrvs Syst exc MS (305)
Knee Joint Replacement (321)
Other Pneumonia (336)
Vaginal Delivery (470)
Normal Neonate Birth (591)
Discharges by DRG
of regional discharges were treated at this hospital in FY14
40%
42%
10%
10%
13%
31%
15%
46%
48%
56%
0% 20% 40% 60% 80% 100%
Plympton MA (128)
Sagamore Beach MA (132)
Buzzards Bay MA (158)
Pembroke MA (165)
Marshfield MA (300)
Duxbury MA (411)
Middleboro MA (425)
Kingston MA (582)
Carver MA (635)
Plymouth MA (3,344)
Discharges by Community
Qu
alit
y
15.9%
13.2%
15.9%
15.0%
0%
5%
10%
15%
20%
25%
2011 2013
0
1
2
3CLABSI CAUTI SSI: Colon Surgery
of community discharges were treated at this
hospital in FY14
Lower is Better
Lower is Better
State Average
C34

Key:
Hospital
Cohort: Community, Disproportionate Share Hospital Peer Cohort
For descriptions of the metrics, please see the technical appendix.
FY
What was the hospital's net inpatient service revenue per case mix
adjusted discharge between FY10 and FY14, and how does this
compare to the hospital's peer cohort median?
2011 2012 20132010 2014
How has the hospital's total outpatient revenue changed compared to
FY10, and how does this compare to the hospital's peer cohort
median? (FY10=100)
2014 HOSPITAL PROFILE: BETH ISRAEL DEACONESS HOSPITAL - PLYMOUTH
What were the hospital's total margin and operating margins between
FY10 and FY14, and how do these compare to the hospital's peer
cohort medians?Revenue, Cost, & Profit/Loss (in millions)
How have the hospital's total revenue and costs changed between
FY10 and FY14?
How has the volume of the hospital's inpatient discharges changed
compared to FY10, and how does this compare to the hospital's peer
cohort median? (FY10=100)
How has the volume of the hospital's outpatient visits changed
compared to FY10, and how does this compare to the hospital's peer
cohort median? (FY10=100)
200$ 205$ Operating Revenue
1$ 3$ 1$
Total Costs
Total Profit (Loss) 6.3$ 4.1$ 6.1$ 2.8$ 0.1$
191$ 191$
192$
Non-Operating
Revenue
191$ 196$ 197$
1$ 1$
206$ 199$ 201$ 197$ Total Revenue
‡ Costs were adjusted to exclude direct medical education costs and physician compensation.
^ For more information on Community Hospital Acceleration, Revitalization and Transformation (CHART) special
funding, please contact the Health Policy Commission (HPC).
θ For more information on Infrastructure and Capacity Building (ICB) special funding, please contact the
Massachusetts Executive Office of Health and Human Services (EOHHS).
197$ 200$ 196$
* Disproportionate Share Hospitals (DSH) receive a minimum of 63% of gross patient service revenue from public
payers.
Uti
lizat
ion
-26.8%
-9.4%
65707580859095
100105110115120125130135140
2010 2011 2012 2013 2014
FY14 Inpatient Discharges = 8,379
+1.0%
-3.6%
65707580859095
100105110115120125130135140
2010 2011 2012 2013 2014
FY14 Outpatient Visits = 112,448
Pat
ien
t R
even
ue
Tre
nd
s
Hospital
Cohort Median
$2,000
$6,000
$10,000
$14,000
$18,000
$22,000
2010 2011 2012 2013 2014
-1.9%
+11.2%
65707580859095
100105110115120125130135140
2010 2011 2012 2013 2014
FY14 Outpatient Revenue = $107 M
Fin
anci
al P
erfo
rman
ce
3.2%
0.0% 2.8%
5.3%
-10%
0%
10%
2010 2011 2012 2013 2014
Tot
al
2.9%
-0.5%
1.5% 4.5%
-10%
0%
10%
Ope
ratin
g
November 2015

2014 Hospital Profile
Overview / Size Payer Mix
Hospital System Affiliation: Public Payer Mix:
Change in Ownership (FY10-FY14): CY14 Commercial Payer Price Level:
Total Staffed Beds: Top 3 Commercial Payers:
% Occupancy:
Special Public Funding:
Financial Change FY13-FY14:
Adjusted‡ Cost per Discharge: Emergency Department Visits in FY14:
Inpatient NPSR per CMAD: Change FY13-FY14:
Outpatient Visits in FY14:
For descriptions of the metrics, please see the technical appendix.
CAPE COD HOSPITAL
$11,322
Trauma Center Designation:
$11,990
Cape Cod Hospital is a non-profit community-Disproportionate Share Hospital (DSH) located in the Cape and Islands region. It is among the larger acute
hospitals in Massachusetts and is a member of the Cape Cod Healthcare system. Cape Cod Hospital treated 66% of all discharges and 100% of Major
Depression/Unspecified Psychoses cases in the region. Inpatient discharges at Cape Cod Hospital decreased 5.9% from FY10 to FY14, compared with a
median decrease of 9.4% among cohort hospitals. Cape Cod Hospital earned a profit each year from FY10 to FY14, with a total margin of 6.5% in FY14,
compared to a median total margin of 5.3% in its cohort.
67.6%, > cohort avg. (66%)
68.3% (DSH* Hospital)
Harvard Pilgrim Health Care
269, among the larger acute hospitals
Cape Cod Healthcare
Blue Cross Blue Shield of Massachusetts
Not Applicable
Not Applicable
Hyannis, MA
Community, Disproportionate Share Hospital
Case Mix Index:
Cape and Islands
Not Applicable
-4.3%
What were the most common inpatient cases (DRGs) treated at the
hospital in FY14? What proportion of the region’s cases did this
hospital treat for each service?
12.0%
78th Percentile
How many central line-associated blood stream infections (CLABSI),
catheter-associated urinary tract infections (CAUTI), and surgical site
infections (SSI) after colon surgery did patients get at this hospital
compared to what was expected based on the hospital's characteristics
and case mix?
-1.0%
Not Available
Change FY11-FY13 (percentage points):
Early Elective Deliveries Rate (Jan 2014-Jun 2015):
15,875Inpatient Discharges in FY14:
-2.5%
82,678
Tufts Associated Health Maintenance Org.
Quality
Readmission Rate in FY13:
Utilization
Change FY13-FY14: -4.6%
141,627
Where did most of the hospital's inpatients reside? What proportion of
each community's total discharges was attributed to this hospital?
18.2%
1.04, > cohort avg. (0.85); > statewide (1.00)
Change FY13-FY14:
Total Surplus (Loss) in FY14:
Inpatient:Outpatient Revenue in FY14: 33%:67%
Outpatient Revenue in FY14: $243,599,492
-1.0%
Total Revenue in FY14:
$29,481,049
$453,688,465
Change FY13-FY14:
Hospital (15,875) = 66% of total regional discharges - - -
What proportion of adult patient discharges from this hospital resulted
in a readmission at any hospital within 30 days, and how does this
compare to the state average?
At
a G
lan
ce
Ser
vice
s
57%
59%
67%
54%
100%
65%
55%
63%
52%
56%
0% 20% 40% 60% 80% 100%
Kidney & UT Infections (297)
Hip Joint Replacement (307)
CVA Occlusion w/ Infarct (312)
Other Pneumonia (315)
Maj Dep& Oth/Unsp Psychoses (344)
Renal Failure (360)
Vaginal Delivery (534)
Heart Failure (554)
Normal Neonate Birth (698)
Sepsis & Dissem Inf (975)
Discharges by DRG of regional discharges
were treated at this hospital in FY14
23%
80%
76%
74%
74%
78%
72%
80%
80%
81%
0% 20% 40% 60% 80% 100%
Mashpee MA (457)
Orleans MA (502)
South Dennis MA (604)
Yarmouth Port MA (629)
Harwich MA (807)
Brewster MA (866)
Centerville MA (916)
West Yarmouth MA (922)
South Yarmouth MA (1,105)
Hyannis MA (1,819)
Discharges by Community
Qu
alit
y
12.9% 12.0%
15.9%
15.0%
0%
5%
10%
15%
20%
25%
2011 2013
0
1
2
3CLABSI CAUTI SSI: Colon Surgery
of community discharges were treated at this hospital in FY14
Lower is Better
Lower is Better
State Average
C35

Key:
Hospital
Cohort: Community, Disproportionate Share Hospital Peer Cohort
For descriptions of the metrics, please see the technical appendix.
2014 HOSPITAL PROFILE: CAPE COD HOSPITAL
What were the hospital's total margin and operating margins between
FY10 and FY14, and how do these compare to the hospital's peer
cohort medians?Revenue, Cost, & Profit/Loss (in millions)
How have the hospital's total revenue and costs changed between
FY10 and FY14?
How has the volume of the hospital's inpatient discharges changed
compared to FY10, and how does this compare to the hospital's peer
cohort median? (FY10=100)
How has the volume of the hospital's outpatient visits changed
compared to FY10, and how does this compare to the hospital's peer
cohort median? (FY10=100)
FY
What was the hospital's net inpatient service revenue per case mix
adjusted discharge between FY10 and FY14, and how does this
compare to the hospital's peer cohort median?
2011 2012 20132010 2014
404$
3$ (6)$
447$ 422$
How has the hospital's total outpatient revenue changed compared to
FY10, and how does this compare to the hospital's peer cohort
median? (FY10=100)
414$ 399$ Total Revenue
‡ Costs were adjusted to exclude direct medical education costs and physician compensation.
383$ 408$ 397$
* Disproportionate Share Hospitals (DSH) receive a minimum of 63% of gross patient service revenue from public
payers.
412$ 444$ Operating Revenue
5$ 6$ 4$
Total Costs
Total Profit (Loss) 22.9$ 31.5$ 39.5$ 25.7$ 29.5$
424$ 376$
454$
Non-Operating
Revenue
449$ 416$
Uti
lizat
ion
-5.9%
-9.4%
65707580859095
100105110115120125130135140
2010 2011 2012 2013 2014
FY14 Inpatient Discharges = 15,875
-4.0%
-3.6%
65707580859095
100105110115120125130135140
2010 2011 2012 2013 2014
FY14 Outpatient Visits = 141,627
Pat
ien
t R
even
ue
Tre
nd
s
Hospital
Cohort Median
$2,000
$6,000
$10,000
$14,000
$18,000
$22,000
2010 2011 2012 2013 2014
+9.9%
+11.2%
65707580859095
100105110115120125130135140
2010 2011 2012 2013 2014
FY14 Outpatient Revenue = $244 M
Fin
anci
al P
erfo
rman
ce
5.7% 6.5%
2.8% 5.3%
-10%
0%
10%
2010 2011 2012 2013 2014
Tot
al
7.2% 5.5%
1.5% 4.5%
-10%
0%
10%
Ope
ratin
g
November 2015

2014 Hospital Profile
Overview / Size Payer Mix
Hospital System Affiliation: Public Payer Mix:
Change in Ownership (FY10-FY14): CY14 Commercial Payer Price Level:
Total Staffed Beds: Top 3 Commercial Payers:
% Occupancy:
Special Public Funding:
Financial Change FY13-FY14:
Adjusted‡ Cost per Discharge: Emergency Department Visits in FY14:
Inpatient NPSR per CMAD: Change FY13-FY14:
Outpatient Visits in FY14:
For descriptions of the metrics, please see the technical appendix.
What proportion of adult patient discharges from this hospital resulted
in a readmission at any hospital within 30 days, and how does this
compare to the state average?
Total Revenue in FY14:
$163,000
$26,915,000
Change FY13-FY14:
Hospital (999) = 1% of total regional discharges - - -
What were the most common inpatient cases (DRGs) treated at the
hospital in FY14? What proportion of the region’s cases did this
hospital treat for each service?
18.6%
42nd Percentile
How many central line-associated blood stream infections (CLABSI),
catheter-associated urinary tract infections (CAUTI), and surgical site
infections (SSI) after colon surgery did patients get at this hospital
compared to what was expected based on the hospital's characteristics
and case mix?
-0.6%Change FY11-FY13 (percentage points):
Early Elective Deliveries Rate (Jan 2014-Jun 2015):
999Inpatient Discharges in FY14:
-10.6%
12,830
Fallon Health and Life Assurance Company
Quality
Readmission Rate in FY13:
Utilization
Change FY13-FY14: -5.8%
16,891
Where did most of the hospital's inpatients reside? What proportion of
each community's total discharges was attributed to this hospital?
23.1%
0.92, > cohort avg. (0.85); < statewide (1.00)
Change FY13-FY14:
Total Surplus (Loss) in FY14:
Inpatient:Outpatient Revenue in FY14:
Not Available
CLINTON HOSPITAL
$11,786
Trauma Center Designation:
$9,055
Clinton Hospital is a non-profit community-Disproportionate Share Hospital (DSH) located in the Central Massachusetts region. It is among the smallest
acute hospitals in Massachusetts and is a member of the UMass Memorial Health Care system. Though it was only responsible for 1% of total regional
discharges, it treated 38% of Organic Mental Health Disturbances cases and 36% of the Degenerative Nervous System excluding MS cases in FY14.
Between FY10 and FY14, inpatient discharges decreased 26.6%, while there was a 9.4% median decrease in its peer cohort. Clinton Hospital had a
positive total margin of 0.6% in FY14, recovering from a loss in FY13.
61.3%, < cohort avg. (66%)
69.5% (DSH* Hospital)
Tufts Associated Health Maintenance Org.
41, among the smallest acute hospitals
UMass Memorial Health Care
Blue Cross Blue Shield of Massachusetts
Not Applicable
Not Applicable
Clinton, MA
Community, Disproportionate Share Hospital
Case Mix Index:
Central Massachusetts
Not Applicable
-3.1%
30%:70%
Outpatient Revenue in FY14: $14,443,876
-0.1%
At
a G
lan
ce
Ser
vice
s
2%
1%
4%
7%
3%
5%
3%
3%
36%
38%
0% 20% 40% 60% 80% 100%
Cellulitis, Oth Bact Skn Inf (33)
Sepsis & Dissem Inf (33)
Bipolar Disorders (48)
Schizophrenia (50)
Other Pneumonia (53)
Maj Dep& Oth/Unsp Psychoses (54)
Heart Failure (56)
COPD (61)
Degen Nrvs Syst exc MS (99)
Org Mental Hlth Disturb (160)
Discharges by DRG
of regional discharges were treated at this
hospital in FY14
0%
0%
0%
1%
1%
1%
11%
15%
0%
20%
0% 20% 40% 60% 80% 100%
Marlborough MA (25)
Fitchburg MA (34)
Leominster MA (54)
Sterling MA (66)
Lancaster MA (80)
Worcester MA (99)
Clinton MA (304)
Discharges by Community
Qu
alit
y
19.2% 18.6%
15.9% 15.0%
0%
5%
10%
15%
20%
25%
2011 2013
0
1
2
3CLABSI CAUTI SSI: Colon Surgery
Data is not available for these measures
of community discharges were treated at this hospital in FY14
Lower is Better
Lower is Better
State Average
Communities with fewer than 26 discharges have been suppressed.
C36

Key:
Hospital
Cohort: Community, Disproportionate Share Hospital Peer Cohort
For descriptions of the metrics, please see the technical appendix.
(0.3)$ 0.2$
27$ 25$
27$
Non-Operating
Revenue
26$ 24$
0$ 0$
26$ 24$
How has the hospital's total outpatient revenue changed compared to
FY10, and how does this compare to the hospital's peer cohort
median? (FY10=100)
26$ 26$ Total Revenue
‡ Costs were adjusted to exclude direct medical education costs and physician compensation.
25$ 26$ 24$
* Disproportionate Share Hospitals (DSH) receive a minimum of 63% of gross patient service revenue from public
payers.
26$ 25$ Operating Revenue
0$ 0$ 0$
Total Costs
Total Profit (Loss) 0.7$ 0.9$ (0.0)$
FY
What was the hospital's net inpatient service revenue per case mix
adjusted discharge between FY10 and FY14, and how does this
compare to the hospital's peer cohort median?
2011 2012 20132010 2014
26$
2014 HOSPITAL PROFILE: CLINTON HOSPITAL
What were the hospital's total margin and operating margins between
FY10 and FY14, and how do these compare to the hospital's peer
cohort medians?Revenue, Cost, & Profit/Loss (in millions)
How have the hospital's total revenue and costs changed between
FY10 and FY14?
How has the volume of the hospital's inpatient discharges changed
compared to FY10, and how does this compare to the hospital's peer
cohort median? (FY10=100)
How has the volume of the hospital's outpatient visits changed
compared to FY10, and how does this compare to the hospital's peer
cohort median? (FY10=100)
Uti
lizat
ion
-26.6%
-9.4%
65707580859095
100105110115120125130135140
2010 2011 2012 2013 2014
FY14 Inpatient Discharges = 999
-8.5%
-3.6%
65707580859095
100105110115120125130135140
2010 2011 2012 2013 2014
FY14 Outpatient Visits = 16,891
Pat
ien
t R
even
ue
Tre
nd
s
Hospital
Cohort Median
$2,000
$6,000
$10,000
$14,000
$18,000
$22,000
2010 2011 2012 2013 2014
+7.5%
+11.2%
65707580859095
100105110115120125130135140
2010 2011 2012 2013 2014
FY14 Outpatient Revenue = $14 M
Fin
anci
al P
erfo
rman
ce
2.7% 0.6% 2.8%
5.3%
-10%
0%
10%
2010 2011 2012 2013 2014
Tot
al
1.6%
-1.0%
1.5% 4.5%
-10%
0%
10%
Ope
ratin
g
November 2015

2014 Hospital Profile
Overview / Size Payer Mix
Hospital System Affiliation: Public Payer Mix:
Change in Ownership (FY10-FY14): CY14 Commercial Payer Price Level:
Total Staffed Beds: Top 3 Commercial Payers:
% Occupancy:
Special Public Funding:
Financial Change FY13-FY14:
Adjusted‡ Cost per Discharge: Emergency Department Visits in FY14:
Inpatient NPSR per CMAD: Change FY13-FY14:
Outpatient Visits in FY14:
For descriptions of the metrics, please see the technical appendix.
Hospital (908) = 1% of total regional discharges - - -
Total Surplus (Loss) in FY14:
Inpatient:Outpatient Revenue in FY14: 17%:83%
Outpatient Revenue in FY14: $32,708,209
5.1%
Total Revenue in FY14:
$3,920,208
$48,079,695
Change FY13-FY14:
What proportion of adult patient discharges from this hospital resulted
in a readmission at any hospital within 30 days, and how does this
compare to the state average?
What were the most common inpatient cases (DRGs) treated at the
hospital in FY14? What proportion of the region’s cases did this
hospital treat for each service?
18.0%
73rd Percentile
How many central line-associated blood stream infections (CLABSI),
catheter-associated urinary tract infections (CAUTI), and surgical site
infections (SSI) after colon surgery did patients get at this hospital
compared to what was expected based on the hospital's characteristics
and case mix?
3.2%
0.0%
Change FY11-FY13 (percentage points):
Early Elective Deliveries Rate (Jan 2014-Jun 2015):
908Inpatient Discharges in FY14:
-22.1%
12,022
Aetna Health Inc. (PA)
Quality
Readmission Rate in FY13:
Utilization
Change FY13-FY14: 0.1%
24,547
Where did most of the hospital's inpatients reside? What proportion of
each community's total discharges was attributed to this hospital?
31.2%
0.60, < cohort avg. (0.85); < statewide (1.00)
Change FY13-FY14:
FAIRVIEW HOSPITAL
$25,880
Trauma Center Designation:
$23,805
Fairview Hospital is a small, non-profit community-Disproportionate Share Hospital (DSH) located in the Western Massachusetts region. It is a member of
Berkshire Health Systems. Fairview Hospital is designated by the Centers for Medicare & Medicaid Services (CMS) as one of three Critical Access
Hospitals (CAH) in Massachusetts. Between FY10 and FY14, its outpatient visits increased 60.2%, compared with a 3.6% decline for the median peer
cohort hospital. It earned a profit each year from FY10 to FY14, with a total margin of 8.2% in FY14, compared with a median total margin of 5.3% in its
peer cohort.
33.5%, lowest in cohort (avg. 66%)
66.2% (DSH* Hospital)
Health New England, Inc.
28, among the smallest acute hospitals
Berkshire Health Systems
Blue Cross Blue Shield of Massachusetts
Not Applicable
ICBθ
Great Barrington, MA
Community, Disproportionate Share Hospital
Case Mix Index:
Western Massachusetts
Not Applicable
-5.1%
At
a G
lan
ce
Ser
vice
s
2%
1%
1%
2%
2%
2%
0% 20% 40% 60% 80% 100%
Card Arrth & Cond Dis (26)
Cesarean Delivery (33)
Heart Failure (43)
Other Pneumonia (51)
Vaginal Delivery (106)
Normal Neonate Birth (135)
Discharges by DRG
of regional discharges were treated at this hospital in FY14
0%
0%
0%
57%
65% 8%
1%
35%
34%
35%
0% 20% 40% 60% 80% 100%
Hillsdale NY (28)
Canaan CT (35)
Lee MA (50)
Pittsfield MA (53)
Housatonic MA (54)
Sheffield MA (83)
Great Barrington MA (290)
Discharges by Community
Qu
alit
y
14.8%
18.0% 15.9%
15.0%
0%
5%
10%
15%
20%
25%
2011 2013
DRGs with fewer than 26 discharges have been suppressed. Communities with fewer than 26 discharges
have been suppressed.
of community discharges were treated at this hospital in FY14
Lower is Better
State Average
Data is not available for these measures
C37
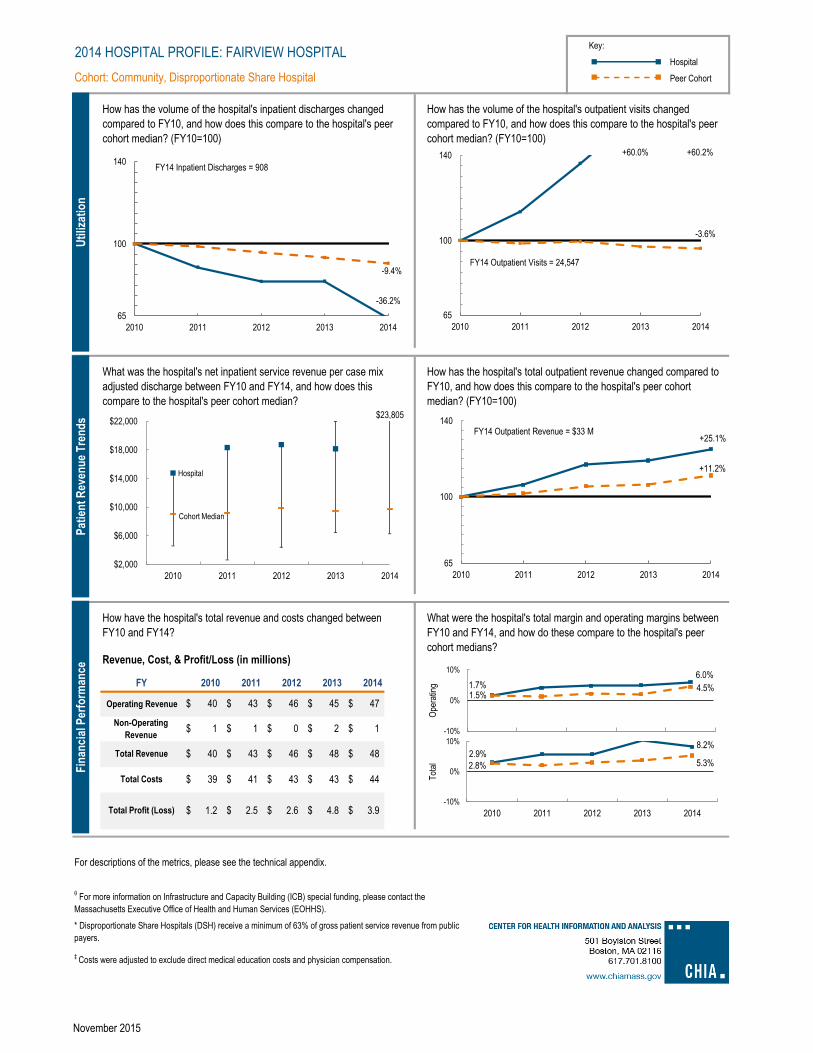
Key:
Hospital
Cohort: Community, Disproportionate Share Hospital Peer Cohort
For descriptions of the metrics, please see the technical appendix.
43$ 40$ Total Revenue
‡ Costs were adjusted to exclude direct medical education costs and physician compensation.
θ For more information on Infrastructure and Capacity Building (ICB) special funding, please contact the
Massachusetts Executive Office of Health and Human Services (EOHHS).
41$ 43$ 43$
* Disproportionate Share Hospitals (DSH) receive a minimum of 63% of gross patient service revenue from public
payers.
43$ 46$ Operating Revenue
1$ 2$ 0$
Total Costs
Total Profit (Loss) 1.2$ 2.5$ 2.6$ 4.8$ 3.9$
44$ 39$
48$
Non-Operating
Revenue
47$ 45$ 40$
1$ 1$
46$ 48$
How has the hospital's total outpatient revenue changed compared to
FY10, and how does this compare to the hospital's peer cohort
median? (FY10=100)
2014 HOSPITAL PROFILE: FAIRVIEW HOSPITAL
What were the hospital's total margin and operating margins between
FY10 and FY14, and how do these compare to the hospital's peer
cohort medians?Revenue, Cost, & Profit/Loss (in millions)
How have the hospital's total revenue and costs changed between
FY10 and FY14?
How has the volume of the hospital's inpatient discharges changed
compared to FY10, and how does this compare to the hospital's peer
cohort median? (FY10=100)
How has the volume of the hospital's outpatient visits changed
compared to FY10, and how does this compare to the hospital's peer
cohort median? (FY10=100)
FY
What was the hospital's net inpatient service revenue per case mix
adjusted discharge between FY10 and FY14, and how does this
compare to the hospital's peer cohort median?
2011 2012 20132010 2014
Uti
lizat
ion
-9.4%
65707580859095
100105110115120125130135140
2010 2011 2012 2013 2014
FY14 Inpatient Discharges = 908
-3.6%
65707580859095
100105110115120125130135140
2010 2011 2012 2013 2014
FY14 Outpatient Visits = 24,547
Pat
ien
t R
even
ue
Tre
nd
s
Hospital
Cohort Median
$2,000
$6,000
$10,000
$14,000
$18,000
$22,000
2010 2011 2012 2013 2014
+25.1%
+11.2%
65707580859095
100105110115120125130135140
2010 2011 2012 2013 2014
FY14 Outpatient Revenue = $33 M
Fin
anci
al P
erfo
rman
ce
2.9% 8.2%
2.8% 5.3%
-10%
0%
10%
2010 2011 2012 2013 2014
Tot
al
1.7% 6.0%
1.5% 4.5%
-10%
0%
10%
Ope
ratin
g
-36.2%
+60.0% +60.2%
$23,805
November 2015

2014 Hospital Profile
Overview / Size Payer Mix
Hospital System Affiliation: Public Payer Mix:
Change in Ownership (FY10-FY14): CY14 Commercial Payer Price Level:
Total Staffed Beds: Top 3 Commercial Payers:
% Occupancy:
Special Public Funding:
Financial Change FY13-FY14:
Adjusted‡ Cost per Discharge: Emergency Department Visits in FY14:
Inpatient NPSR per CMAD: Change FY13-FY14:
Outpatient Visits in FY14:
For descriptions of the metrics, please see the technical appendix.
Hospital (6,299) = 26% of total regional discharges - - -
What proportion of adult patient discharges from this hospital resulted
in a readmission at any hospital within 30 days, and how does this
compare to the state average?
Inpatient:Outpatient Revenue in FY14: 30%:70%
Outpatient Revenue in FY14: $85,472,311
-2.3%
Total Revenue in FY14:
$14,405,976
$158,573,734
Change FY13-FY14:
What were the most common inpatient cases (DRGs) treated at the
hospital in FY14? What proportion of the region’s cases did this
hospital treat for each service?
13.6%
75th Percentile
How many central line-associated blood stream infections (CLABSI),
catheter-associated urinary tract infections (CAUTI), and surgical site
infections (SSI) after colon surgery did patients get at this hospital
compared to what was expected based on the hospital's characteristics
and case mix?
-2.6%
Not Available
Change FY11-FY13 (percentage points):
Early Elective Deliveries Rate (Jan 2014-Jun 2015):
6,299Inpatient Discharges in FY14:
-3.7%
35,457
Tufts Associated Health Maintenance Org.
Quality
Readmission Rate in FY13:
Utilization
Change FY13-FY14: 0.3%
47,944
Where did most of the hospital's inpatients reside? What proportion of
each community's total discharges was attributed to this hospital?
15.1%
0.99, > cohort avg. (0.85); < statewide (1.00)
Change FY13-FY14:
Total Surplus (Loss) in FY14:
FALMOUTH HOSPITAL
$9,930
Trauma Center Designation:
$10,441
Falmouth Hospital is a mid-size, non-profit community-Disproportionate Share Hospital (DSH) located in the Cape and Islands region. It is a member of the
Cape Cod Healthcare system. Between FY10 and FY14, its inpatient discharges decreased 5.7%, compared with a median decrease of 9.4% among
cohort hospitals. Outpatient visits increased 3.8% in that same period, while there was a median decrease of 3.6% in its cohort. Falmouth Hospital earned
a profit each year from FY10 to FY14, and earned a 9.1% total margin in FY14, compared to a cohort median total margin of 5.3%.
67.1%, > cohort avg. (66%)
69.1% (DSH* Hospital)
Harvard Pilgrim Health Care
103, mid-size acute hospital
Cape Cod Healthcare
Blue Cross Blue Shield of Massachusetts
Not Applicable
Not Applicable
Falmouth, MA
Community, Disproportionate Share Hospital
Case Mix Index:
Cape and Islands
Not Applicable
-3.5%
At
a G
lan
ce
Ser
vice
s
34%
31%
30%
34%
38%
30%
28%
50%
31%
42%
0% 20% 40% 60% 80% 100%
Cesarean Delivery (163)
Renal Failure (172)
Other Pneumonia (176)
Kidney & UT Infections (176)
Hip Joint Replacement (196)
Heart Failure (266)
Vaginal Delivery (268)
Knee Joint Replacement (299)
Normal Neonate Birth (414)
Sepsis & Dissem Inf (718)
Discharges by DRG of regional discharges
were treated at this hospital in FY14
10%
17%
37%
24%
60%
67%
29%
71%
49%
62%
0% 20% 40% 60% 80% 100%
Marstons Mills MA (74)
East Sandwich MA (92)
Forestdale MA (132)
Sandwich MA (219)
Pocasset MA (300)
North Falmouth MA (307)
Buzzards Bay MA (454)
Falmouth MA (921)
Mashpee MA (948)
East Falmouth MA (1,597)
Discharges by Community
Qu
alit
y 16.1%
13.6% 15.9% 15.0%
0%
5%
10%
15%
20%
25%
2011 2013
0
1
2
3CLABSI CAUTI SSI: Colon Surgery
of community discharges were treated at this
hospital in FY14
Lower is Better
Lower is Better
State Average
C38

Key:
Hospital
Cohort: Community, Disproportionate Share Hospital Peer Cohort
For descriptions of the metrics, please see the technical appendix.
‡ Costs were adjusted to exclude direct medical education costs and physician compensation.
135$ 143$ 136$
* Disproportionate Share Hospitals (DSH) receive a minimum of 63% of gross patient service revenue from public
payers.
147$ 156$ Operating Revenue
3$ 3$ 3$
Total Costs
Total Profit (Loss) 2.7$ 13.7$ 16.2$ 17.6$ 14.4$
144$ 131$
159$
Non-Operating
Revenue
155$ 150$ 134$
2$ 0$
159$ 154$
How has the hospital's total outpatient revenue changed compared to
FY10, and how does this compare to the hospital's peer cohort
median? (FY10=100)
149$ 134$ Total Revenue
2014 HOSPITAL PROFILE: FALMOUTH HOSPITAL
What were the hospital's total margin and operating margins between
FY10 and FY14, and how do these compare to the hospital's peer
cohort medians?Revenue, Cost, & Profit/Loss (in millions)
How have the hospital's total revenue and costs changed between
FY10 and FY14?
How has the volume of the hospital's inpatient discharges changed
compared to FY10, and how does this compare to the hospital's peer
cohort median? (FY10=100)
How has the volume of the hospital's outpatient visits changed
compared to FY10, and how does this compare to the hospital's peer
cohort median? (FY10=100)
FY
What was the hospital's net inpatient service revenue per case mix
adjusted discharge between FY10 and FY14, and how does this
compare to the hospital's peer cohort median?
2011 2012 20132010 2014
Uti
lizat
ion
-5.7%
-9.4%
65707580859095
100105110115120125130135140
2010 2011 2012 2013 2014
FY14 Inpatient Discharges = 6,299
+3.8%
-3.6%
65707580859095
100105110115120125130135140
2010 2011 2012 2013 2014
FY14 Outpatient Visits = 47,944
Pat
ien
t R
even
ue
Tre
nd
s
Hospital
Cohort Median
$2,000
$6,000
$10,000
$14,000
$18,000
$22,000
2010 2011 2012 2013 2014
+11.4%
+11.2%
65707580859095
100105110115120125130135140
2010 2011 2012 2013 2014
FY14 Outpatient Revenue = $85 M
Fin
anci
al P
erfo
rman
ce
2.0%
9.1% 2.8% 5.3%
-10%
0%
10%
2010 2011 2012 2013 2014
Tot
al
1.7% 7.0%
1.5% 4.5%
-10%
0%
10%
Ope
ratin
g
11.4%
November 2015
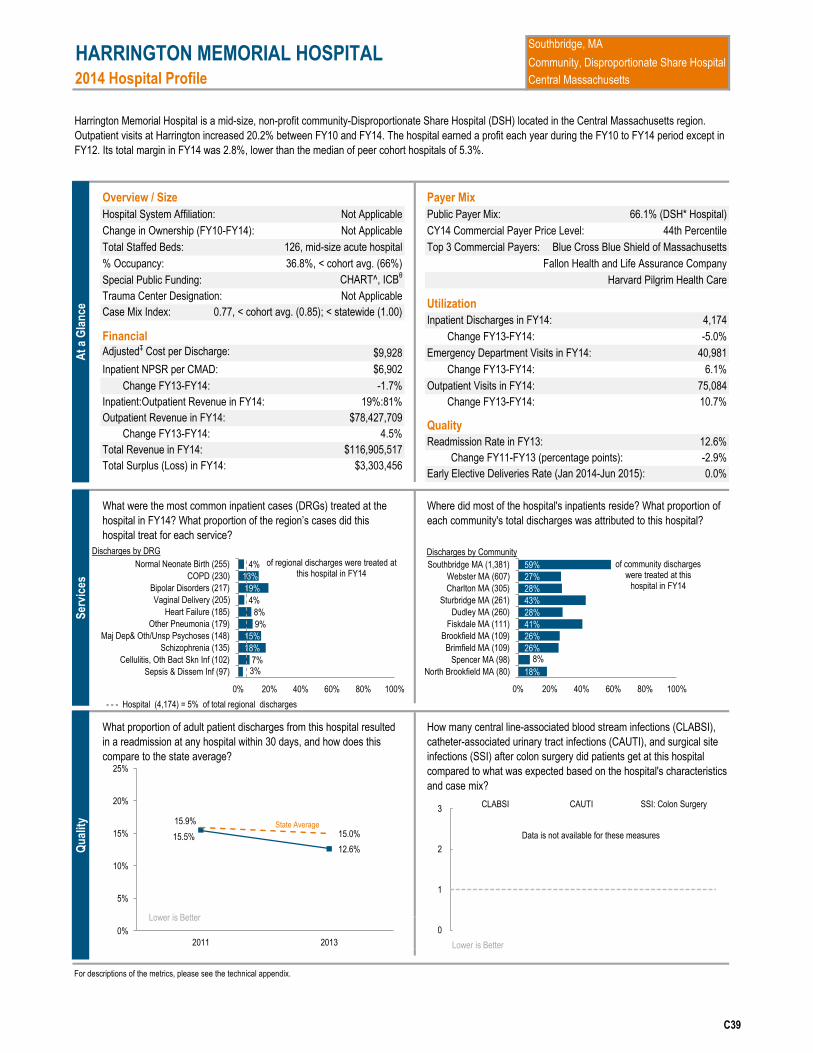
2014 Hospital Profile
Overview / Size Payer Mix
Hospital System Affiliation: Public Payer Mix:
Change in Ownership (FY10-FY14): CY14 Commercial Payer Price Level:
Total Staffed Beds: Top 3 Commercial Payers:
% Occupancy:
Special Public Funding:
Financial Change FY13-FY14:
Adjusted‡ Cost per Discharge: Emergency Department Visits in FY14:
Inpatient NPSR per CMAD: Change FY13-FY14:
Outpatient Visits in FY14:
For descriptions of the metrics, please see the technical appendix.
-1.7%
0.77, < cohort avg. (0.85); < statewide (1.00)
Change FY13-FY14:
HARRINGTON MEMORIAL HOSPITAL
$9,928
Trauma Center Designation:
$6,902
Harrington Memorial Hospital is a mid-size, non-profit community-Disproportionate Share Hospital (DSH) located in the Central Massachusetts region.
Outpatient visits at Harrington increased 20.2% between FY10 and FY14. The hospital earned a profit each year during the FY10 to FY14 period except in
FY12. Its total margin in FY14 was 2.8%, lower than the median of peer cohort hospitals of 5.3%.
36.8%, < cohort avg. (66%)
66.1% (DSH* Hospital)
Fallon Health and Life Assurance Company
126, mid-size acute hospital
Not Applicable
Blue Cross Blue Shield of Massachusetts
Not Applicable
CHART^, ICBθ
Southbridge, MA
Community, Disproportionate Share Hospital
Case Mix Index:
Central Massachusetts
Not Applicable
6.1%
12.6%
44th Percentile
How many central line-associated blood stream infections (CLABSI),
catheter-associated urinary tract infections (CAUTI), and surgical site
infections (SSI) after colon surgery did patients get at this hospital
compared to what was expected based on the hospital's characteristics
and case mix?
-2.9%
0.0%
Change FY11-FY13 (percentage points):
Early Elective Deliveries Rate (Jan 2014-Jun 2015):
4,174Inpatient Discharges in FY14:
-5.0%
40,981
Harvard Pilgrim Health Care
Quality
Readmission Rate in FY13:
Utilization
Change FY13-FY14: 10.7%
75,084
Where did most of the hospital's inpatients reside? What proportion of
each community's total discharges was attributed to this hospital?
Total Surplus (Loss) in FY14:
Inpatient:Outpatient Revenue in FY14: 19%:81%
Outpatient Revenue in FY14: $78,427,709
4.5%
Total Revenue in FY14:
$3,303,456
$116,905,517
Change FY13-FY14:
What proportion of adult patient discharges from this hospital resulted
in a readmission at any hospital within 30 days, and how does this
compare to the state average?
What were the most common inpatient cases (DRGs) treated at the
hospital in FY14? What proportion of the region’s cases did this
hospital treat for each service?
Hospital (4,174) = 5% of total regional discharges - - -
At
a G
lan
ce
Ser
vice
s
3% 7%
18%
15%
9%
8%
4%
19%
13%
4%
0% 20% 40% 60% 80% 100%
Sepsis & Dissem Inf (97)
Cellulitis, Oth Bact Skn Inf (102)
Schizophrenia (135)
Maj Dep& Oth/Unsp Psychoses (148)
Other Pneumonia (179)
Heart Failure (185)
Vaginal Delivery (205)
Bipolar Disorders (217)
COPD (230)
Normal Neonate Birth (255)
Discharges by DRG
of regional discharges were treated at this hospital in FY14
18%
8% 26%
26%
41%
28%
43%
28%
27%
59%
0% 20% 40% 60% 80% 100%
North Brookfield MA (80)
Spencer MA (98)
Brimfield MA (109)
Brookfield MA (109)
Fiskdale MA (111)
Dudley MA (260)
Sturbridge MA (261)
Charlton MA (305)
Webster MA (607)
Southbridge MA (1,381)
Discharges by Community
Qu
alit
y
15.5%
12.6%
15.9%
15.0%
0%
5%
10%
15%
20%
25%
2011 2013
0
1
2
3CLABSI CAUTI SSI: Colon Surgery
Data is not available for these measures
of community discharges were treated at this
hospital in FY14
Lower is Better
Lower is Better
State Average
C39

Key:
Hospital
Cohort: Community, Disproportionate Share Hospital Peer Cohort
For descriptions of the metrics, please see the technical appendix.
FY
What was the hospital's net inpatient service revenue per case mix
adjusted discharge between FY10 and FY14, and how does this
compare to the hospital's peer cohort median?
2011 2012 20132010 2014
How has the hospital's total outpatient revenue changed compared to
FY10, and how does this compare to the hospital's peer cohort
median? (FY10=100)
2014 HOSPITAL PROFILE: HARRINGTON MEMORIAL HOSPITAL
What were the hospital's total margin and operating margins between
FY10 and FY14, and how do these compare to the hospital's peer
cohort medians?Revenue, Cost, & Profit/Loss (in millions)
How have the hospital's total revenue and costs changed between
FY10 and FY14?
How has the volume of the hospital's inpatient discharges changed
compared to FY10, and how does this compare to the hospital's peer
cohort median? (FY10=100)
How has the volume of the hospital's outpatient visits changed
compared to FY10, and how does this compare to the hospital's peer
cohort median? (FY10=100)
115$ 115$ Operating Revenue
3$ 2$ 2$
Total Costs
Total Profit (Loss) 3.7$ 8.5$ (1.1)$ 4.6$ 3.3$
114$ 102$
117$
Non-Operating
Revenue
113$ 110$ 105$
4$ 1$
117$ 112$ 118$ 106$ Total Revenue
‡ Costs were adjusted to exclude direct medical education costs and physician compensation.
^ For more information on Community Hospital Acceleration, Revitalization and Transformation (CHART) special
funding, please contact the Health Policy Commission (HPC).
θ For more information on Infrastructure and Capacity Building (ICB) special funding, please contact the
Massachusetts Executive Office of Health and Human Services (EOHHS).
110$ 118$ 107$
* Disproportionate Share Hospitals (DSH) receive a minimum of 63% of gross patient service revenue from public
payers.
Uti
lizat
ion
+2.7%
-9.4%
65707580859095
100105110115120125130135140
2010 2011 2012 2013 2014
FY14 Inpatient Discharges = 4,174
+20.2%
-3.6%
65707580859095
100105110115120125130135140
2010 2011 2012 2013 2014
FY14 Outpatient Visits = 75,084
Pat
ien
t R
even
ue
Tre
nd
s
Hospital
Cohort Median
$2,000
$6,000
$10,000
$14,000
$18,000
$22,000
2010 2011 2012 2013 2014
+3.4%
+11.2%
65707580859095
100105110115120125130135140
2010 2011 2012 2013 2014
FY14 Outpatient Revenue = $78 M
Fin
anci
al P
erfo
rman
ce
3.5%
2.8% 2.8%
5.3%
-10%
0%
10%
2010 2011 2012 2013 2014
Tot
al
2.5%
-0.2%
1.5%
4.5%
-10%
0%
10%
Ope
ratin
g
November 2015
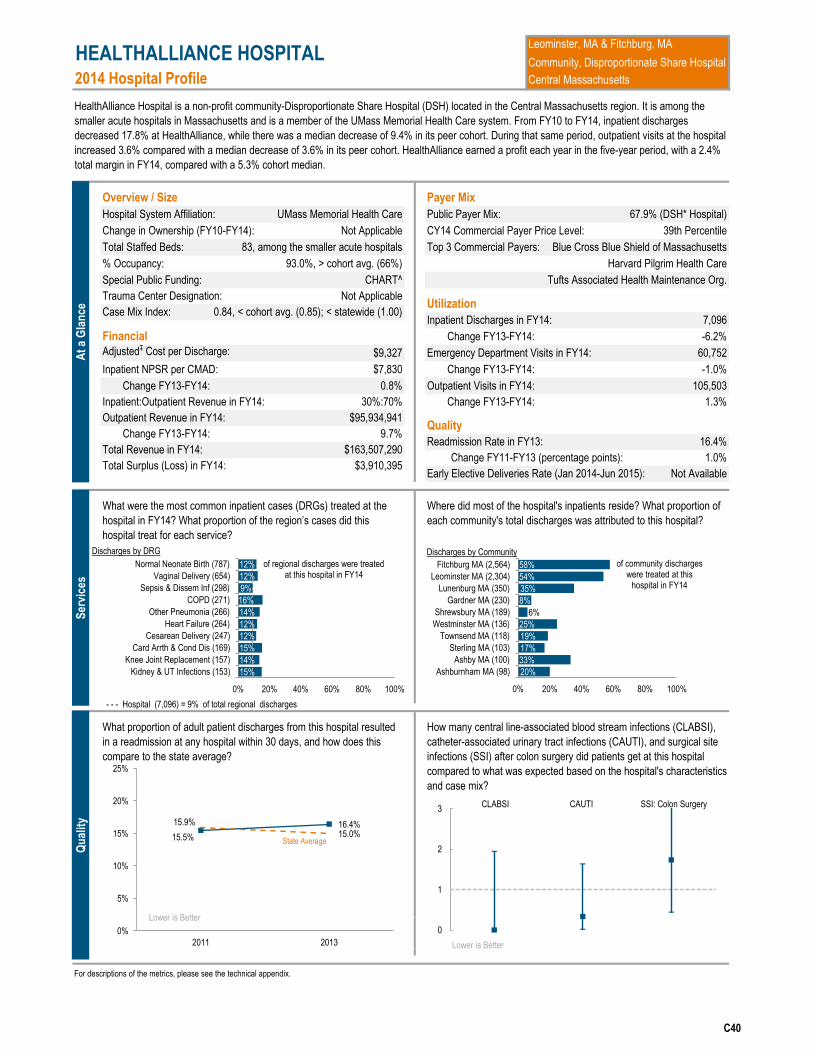
2014 Hospital Profile
Overview / Size Payer Mix
Hospital System Affiliation: Public Payer Mix:
Change in Ownership (FY10-FY14): CY14 Commercial Payer Price Level:
Total Staffed Beds: Top 3 Commercial Payers:
% Occupancy:
Special Public Funding:
Financial Change FY13-FY14:
Adjusted‡ Cost per Discharge: Emergency Department Visits in FY14:
Inpatient NPSR per CMAD: Change FY13-FY14:
Outpatient Visits in FY14:
For descriptions of the metrics, please see the technical appendix.
Hospital (7,096) = 9% of total regional discharges - - -
Total Surplus (Loss) in FY14:
Inpatient:Outpatient Revenue in FY14: 30%:70%
Outpatient Revenue in FY14: $95,934,941
9.7%
Total Revenue in FY14:
$3,910,395
$163,507,290
Change FY13-FY14:
What proportion of adult patient discharges from this hospital resulted
in a readmission at any hospital within 30 days, and how does this
compare to the state average?
What were the most common inpatient cases (DRGs) treated at the
hospital in FY14? What proportion of the region’s cases did this
hospital treat for each service?
16.4%
39th Percentile
How many central line-associated blood stream infections (CLABSI),
catheter-associated urinary tract infections (CAUTI), and surgical site
infections (SSI) after colon surgery did patients get at this hospital
compared to what was expected based on the hospital's characteristics
and case mix?
1.0%
Not Available
Change FY11-FY13 (percentage points):
Early Elective Deliveries Rate (Jan 2014-Jun 2015):
7,096Inpatient Discharges in FY14:
-6.2%
60,752
Tufts Associated Health Maintenance Org.
Quality
Readmission Rate in FY13:
Utilization
Change FY13-FY14: 1.3%
105,503
Where did most of the hospital's inpatients reside? What proportion of
each community's total discharges was attributed to this hospital?
0.8%
0.84, < cohort avg. (0.85); < statewide (1.00)
Change FY13-FY14:
HEALTHALLIANCE HOSPITAL
$9,327
Trauma Center Designation:
$7,830
HealthAlliance Hospital is a non-profit community-Disproportionate Share Hospital (DSH) located in the Central Massachusetts region. It is among the
smaller acute hospitals in Massachusetts and is a member of the UMass Memorial Health Care system. From FY10 to FY14, inpatient discharges
decreased 17.8% at HealthAlliance, while there was a median decrease of 9.4% in its peer cohort. During that same period, outpatient visits at the hospital
increased 3.6% compared with a median decrease of 3.6% in its peer cohort. HealthAlliance earned a profit each year in the five-year period, with a 2.4%
total margin in FY14, compared with a 5.3% cohort median.
93.0%, > cohort avg. (66%)
67.9% (DSH* Hospital)
Harvard Pilgrim Health Care
83, among the smaller acute hospitals
UMass Memorial Health Care
Blue Cross Blue Shield of Massachusetts
Not Applicable
CHART^
Leominster, MA & Fitchburg, MA
Community, Disproportionate Share Hospital
Case Mix Index:
Central Massachusetts
Not Applicable
-1.0%
At
a G
lan
ce
Ser
vice
s
15%
14%
15%
12%
12%
14%
16%
9%
12%
12%
0% 20% 40% 60% 80% 100%
Kidney & UT Infections (153)
Knee Joint Replacement (157)
Card Arrth & Cond Dis (169)
Cesarean Delivery (247)
Heart Failure (264)
Other Pneumonia (266)
COPD (271)
Sepsis & Dissem Inf (298)
Vaginal Delivery (654)
Normal Neonate Birth (787)
Discharges by DRG
of regional discharges were treated at this hospital in FY14
20%
33%
17%
19%
25%
6%
8%
35%
54%
58%
0% 20% 40% 60% 80% 100%
Ashburnham MA (98)
Ashby MA (100)
Sterling MA (103)
Townsend MA (118)
Westminster MA (136)
Shrewsbury MA (189)
Gardner MA (230)
Lunenburg MA (350)
Leominster MA (2,304)
Fitchburg MA (2,564)
Discharges by Community
Qu
alit
y
15.5%
16.4% 15.9%
15.0%
0%
5%
10%
15%
20%
25%
2011 2013
0
1
2
3CLABSI CAUTI SSI: Colon Surgery
of community discharges were treated at this
hospital in FY14
Lower is Better
Lower is Better
State Average
C40

Key:
Hospital
Cohort: Community, Disproportionate Share Hospital Peer Cohort
For descriptions of the metrics, please see the technical appendix.
168$ 168$ Total Revenue
‡ Costs were adjusted to exclude direct medical education costs and physician compensation.
^ For more information on Community Hospital Acceleration, Revitalization and Transformation (CHART) special
funding, please contact the Health Policy Commission (HPC).
159$ 157$ 155$
* Disproportionate Share Hospitals (DSH) receive a minimum of 63% of gross patient service revenue from public
payers.
168$ 165$ Operating Revenue
2$ 2$ 3$
Total Costs
Total Profit (Loss) 5.6$ 9.2$ 11.0$ 6.6$ 3.9$
160$ 162$
164$
Non-Operating
Revenue
161$ 159$ 166$
(0)$ 2$
168$ 162$
How has the hospital's total outpatient revenue changed compared to
FY10, and how does this compare to the hospital's peer cohort
median? (FY10=100)
2014 HOSPITAL PROFILE: HEALTHALLIANCE HOSPITAL
What were the hospital's total margin and operating margins between
FY10 and FY14, and how do these compare to the hospital's peer
cohort medians?Revenue, Cost, & Profit/Loss (in millions)
How have the hospital's total revenue and costs changed between
FY10 and FY14?
How has the volume of the hospital's inpatient discharges changed
compared to FY10, and how does this compare to the hospital's peer
cohort median? (FY10=100)
How has the volume of the hospital's outpatient visits changed
compared to FY10, and how does this compare to the hospital's peer
cohort median? (FY10=100)
FY
What was the hospital's net inpatient service revenue per case mix
adjusted discharge between FY10 and FY14, and how does this
compare to the hospital's peer cohort median?
2011 2012 20132010 2014
Uti
lizat
ion
-17.8%
-9.4%
65707580859095
100105110115120125130135140
2010 2011 2012 2013 2014
FY14 Inpatient Discharges = 7,096
+3.6%
-3.6%
65707580859095
100105110115120125130135140
2010 2011 2012 2013 2014
FY14 Outpatient Visits = 105,503
Pat
ien
t R
even
ue
Tre
nd
s
Hospital
Cohort Median
$2,000
$6,000
$10,000
$14,000
$18,000
$22,000
2010 2011 2012 2013 2014
+8.0%
+11.2%
65707580859095
100105110115120125130135140
2010 2011 2012 2013 2014
FY14 Outpatient Revenue = $96 M
Fin
anci
al P
erfo
rman
ce
3.3%
2.4% 2.8%
5.3%
-10%
0%
10%
2010 2011 2012 2013 2014
Tot
al
2.4% 1.0% 1.5%
4.5%
-10%
0%
10%
Ope
ratin
g
November 2015
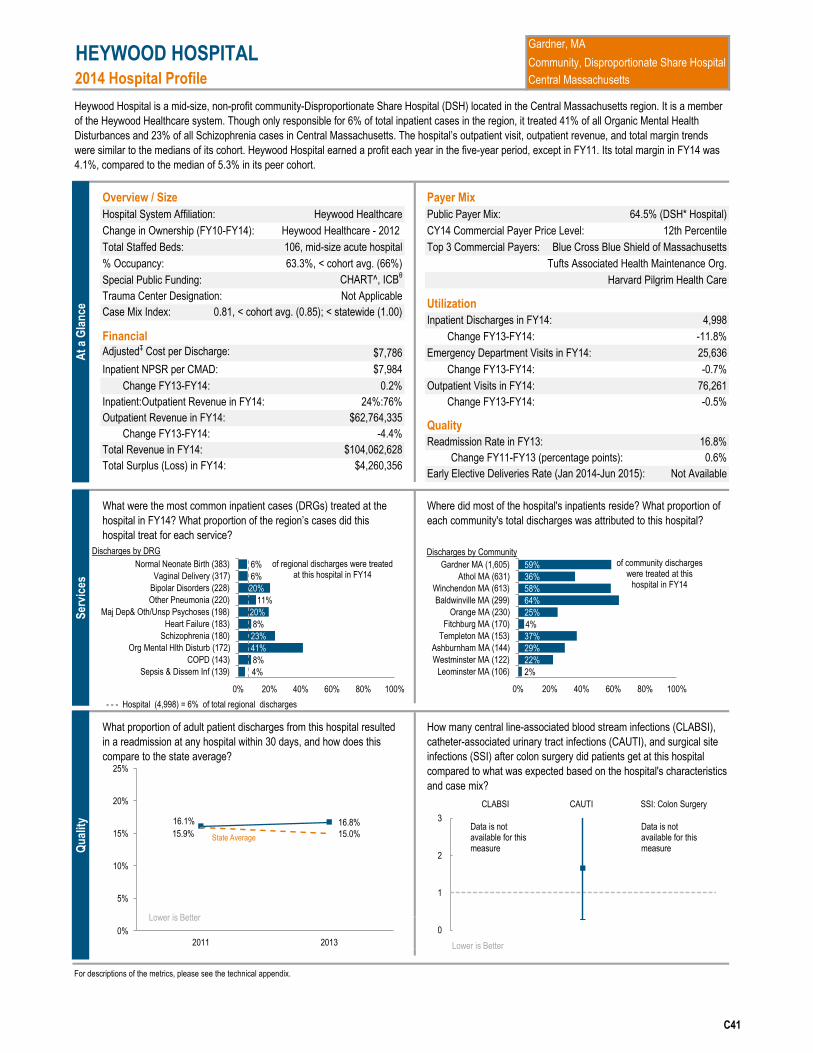
2014 Hospital Profile
Overview / Size Payer Mix
Hospital System Affiliation: Public Payer Mix:
Change in Ownership (FY10-FY14): CY14 Commercial Payer Price Level:
Total Staffed Beds: Top 3 Commercial Payers:
% Occupancy:
Special Public Funding:
Financial Change FY13-FY14:
Adjusted‡ Cost per Discharge: Emergency Department Visits in FY14:
Inpatient NPSR per CMAD: Change FY13-FY14:
Outpatient Visits in FY14:
For descriptions of the metrics, please see the technical appendix.
0.2%
0.81, < cohort avg. (0.85); < statewide (1.00)
Change FY13-FY14:
HEYWOOD HOSPITAL
$7,786
Trauma Center Designation:
$7,984
Heywood Hospital is a mid-size, non-profit community-Disproportionate Share Hospital (DSH) located in the Central Massachusetts region. It is a member
of the Heywood Healthcare system. Though only responsible for 6% of total inpatient cases in the region, it treated 41% of all Organic Mental Health
Disturbances and 23% of all Schizophrenia cases in Central Massachusetts. The hospital’s outpatient visit, outpatient revenue, and total margin trends
were similar to the medians of its cohort. Heywood Hospital earned a profit each year in the five-year period, except in FY11. Its total margin in FY14 was
4.1%, compared to the median of 5.3% in its peer cohort.
63.3%, < cohort avg. (66%)
64.5% (DSH* Hospital)
Tufts Associated Health Maintenance Org.
106, mid-size acute hospital
Heywood Healthcare
Blue Cross Blue Shield of Massachusetts
Heywood Healthcare - 2012
CHART^, ICBθ
Gardner, MA
Community, Disproportionate Share Hospital
Case Mix Index:
Central Massachusetts
Not Applicable
-0.7%
16.8%
12th Percentile
How many central line-associated blood stream infections (CLABSI),
catheter-associated urinary tract infections (CAUTI), and surgical site
infections (SSI) after colon surgery did patients get at this hospital
compared to what was expected based on the hospital's characteristics
and case mix?
0.6%
Not Available
Change FY11-FY13 (percentage points):
Early Elective Deliveries Rate (Jan 2014-Jun 2015):
4,998Inpatient Discharges in FY14:
-11.8%
25,636
Harvard Pilgrim Health Care
Quality
Readmission Rate in FY13:
Utilization
Change FY13-FY14: -0.5%
76,261
Where did most of the hospital's inpatients reside? What proportion of
each community's total discharges was attributed to this hospital?
Total Surplus (Loss) in FY14:
Inpatient:Outpatient Revenue in FY14: 24%:76%
Outpatient Revenue in FY14: $62,764,335
-4.4%
Total Revenue in FY14:
$4,260,356
$104,062,628
Change FY13-FY14:
What proportion of adult patient discharges from this hospital resulted
in a readmission at any hospital within 30 days, and how does this
compare to the state average?
What were the most common inpatient cases (DRGs) treated at the
hospital in FY14? What proportion of the region’s cases did this
hospital treat for each service?
Hospital (4,998) = 6% of total regional discharges - - -
At
a G
lan
ce
Ser
vice
s
4%
8%
41%
23%
8%
20%
11%
20%
6%
6%
0% 20% 40% 60% 80% 100%
Sepsis & Dissem Inf (139)
COPD (143)
Org Mental Hlth Disturb (172)
Schizophrenia (180)
Heart Failure (183)
Maj Dep& Oth/Unsp Psychoses (198)
Other Pneumonia (220)
Bipolar Disorders (228)
Vaginal Delivery (317)
Normal Neonate Birth (383)
Discharges by DRG
of regional discharges were treated at this hospital in FY14
2%
22%
29%
37%
4%
25%
64%
58%
36%
59%
0% 20% 40% 60% 80% 100%
Leominster MA (106)
Westminster MA (122)
Ashburnham MA (144)
Templeton MA (153)
Fitchburg MA (170)
Orange MA (230)
Baldwinville MA (299)
Winchendon MA (613)
Athol MA (631)
Gardner MA (1,605)
Discharges by Community
Qu
alit
y 16.1% 16.8%
15.9% 15.0%
0%
5%
10%
15%
20%
25%
2011 2013
0
1
2
3
CLABSI CAUTI SSI: Colon Surgery
of community discharges were treated at this
hospital in FY14
Lower is Better
Lower is Better
Data is not available for this measure
Data is not available for this measure
State Average
C41

Key:
Hospital
Cohort: Community, Disproportionate Share Hospital Peer Cohort
For descriptions of the metrics, please see the technical appendix.
FY
What was the hospital's net inpatient service revenue per case mix
adjusted discharge between FY10 and FY14, and how does this
compare to the hospital's peer cohort median?
2011 2012 20132010 2014
How has the hospital's total outpatient revenue changed compared to
FY10, and how does this compare to the hospital's peer cohort
median? (FY10=100)
2014 HOSPITAL PROFILE: HEYWOOD HOSPITAL
What were the hospital's total margin and operating margins between
FY10 and FY14, and how do these compare to the hospital's peer
cohort medians?Revenue, Cost, & Profit/Loss (in millions)
How have the hospital's total revenue and costs changed between
FY10 and FY14?
How has the volume of the hospital's inpatient discharges changed
compared to FY10, and how does this compare to the hospital's peer
cohort median? (FY10=100)
How has the volume of the hospital's outpatient visits changed
compared to FY10, and how does this compare to the hospital's peer
cohort median? (FY10=100)
97$ 101$ Operating Revenue
2$ 3$ 2$
Total Costs
Total Profit (Loss) 3.6$ (1.3)$ 4.0$ 5.4$ 4.3$
100$ 92$
104$
Non-Operating
Revenue
102$ 102$ 95$
(0)$ 1$
103$ 105$ 97$ 96$ Total Revenue
‡ Costs were adjusted to exclude direct medical education costs and physician compensation.
^ For more information on Community Hospital Acceleration, Revitalization and Transformation (CHART) special
funding, please contact the Health Policy Commission (HPC).
θ For more information on Infrastructure and Capacity Building (ICB) special funding, please contact the
Massachusetts Executive Office of Health and Human Services (EOHHS).
99$ 99$ 100$
* Disproportionate Share Hospitals (DSH) receive a minimum of 63% of gross patient service revenue from public
payers.
Uti
lizat
ion
-13.7%
-9.4%
65707580859095
100105110115120125130135140
2010 2011 2012 2013 2014
FY14 Inpatient Discharges = 4,998
-3.8%
-3.6%
65707580859095
100105110115120125130135140
2010 2011 2012 2013 2014
FY14 Outpatient Visits = 76,261
Pat
ien
t R
even
ue
Tre
nd
s
Hospital
Cohort Median
$2,000
$6,000
$10,000
$14,000
$18,000
$22,000
2010 2011 2012 2013 2014
+11.0%
+11.2%
65707580859095
100105110115120125130135140
2010 2011 2012 2013 2014
FY14 Outpatient Revenue = $63 M
Fin
anci
al P
erfo
rman
ce
3.7%
4.1% 2.8%
5.3%
-10%
0%
10%
2010 2011 2012 2013 2014
Tot
al
2.8% 2.4% 1.5%
4.5%
-10%
0%
10%
Ope
ratin
g
November 2015

2014 Hospital Profile
Overview / Size Payer Mix
Hospital System Affiliation: Public Payer Mix:
Change in Ownership (FY10-FY14): CY14 Commercial Payer Price Level:
Total Staffed Beds: Top 3 Commercial Payers:
% Occupancy:
Special Public Funding:
Financial Change FY13-FY14:
Adjusted‡ Cost per Discharge: Emergency Department Visits in FY14:
Inpatient NPSR per CMAD: Change FY13-FY14:
Outpatient Visits in FY14:
For descriptions of the metrics, please see the technical appendix.
0.7%
0.84, < cohort avg. (0.85); < statewide (1.00)
Change FY13-FY14:
HOLYOKE MEDICAL CENTER
$8,758
Trauma Center Designation:
$9,893
Holyoke Medical Center is a mid-size, non-profit community-Disproportionate Share Hospital (DSH) located in the Western Massachusetts region.
Between FY10 and FY14, Holyoke Medical Center had a 0.6% increase in outpatient visits, compared with a median decrease of 3.6% in its cohort. Its
outpatient revenue increased 26.7% from FY10 to FY14, compared to a median increase of 11.2% in its cohort. Holyoke Medical Center earned a profit
each year in the period, with a 5.0% total margin in FY14, compared to a 5.3% median total margin in its peer cohort.
61.5%, < cohort avg. (66%)
76.2% (DSH* Hospital)
Health New England, Inc.
107, mid-size acute hospital
Not Applicable
Blue Cross Blue Shield of Massachusetts
Not Applicable
CHART^, DSTIη
Holyoke, MA
Community, Disproportionate Share Hospital
Case Mix Index:
Western Massachusetts
Not Applicable
-3.1%
14.8%
29th Percentile
How many central line-associated blood stream infections (CLABSI),
catheter-associated urinary tract infections (CAUTI), and surgical site
infections (SSI) after colon surgery did patients get at this hospital
compared to what was expected based on the hospital's characteristics
and case mix?
-2.3%
0.0%
Change FY11-FY13 (percentage points):
Early Elective Deliveries Rate (Jan 2014-Jun 2015):
5,591Inpatient Discharges in FY14:
-5.7%
41,987
Fallon Health and Life Assurance Company
Quality
Readmission Rate in FY13:
Utilization
Change FY13-FY14: -4.1%
82,150
Where did most of the hospital's inpatients reside? What proportion of
each community's total discharges was attributed to this hospital?
Total Surplus (Loss) in FY14:
Inpatient:Outpatient Revenue in FY14: 27%:73%
Outpatient Revenue in FY14: $60,518,646
1.9%
Total Revenue in FY14:
$6,185,448
$123,496,760
Change FY13-FY14:
What proportion of adult patient discharges from this hospital resulted
in a readmission at any hospital within 30 days, and how does this
compare to the state average?
What were the most common inpatient cases (DRGs) treated at the
hospital in FY14? What proportion of the region’s cases did this
hospital treat for each service?
Hospital (5,591) = 6% of total regional discharges - - -
At
a G
lan
ce
Ser
vice
s
5%
10%
7%
11%
7%
11%
12%
12%
6%
5%
0% 20% 40% 60% 80% 100%
Sepsis & Dissem Inf (154)
Renal Failure (159)
Bipolar Disorders (171)
Cellulitis, Oth Bact Skn Inf (198)
Heart Failure (239)
Other Pneumonia (246)
Maj Dep& Oth/Unsp Psychoses (249)
COPD (264)
Vaginal Delivery (308)
Normal Neonate Birth (363)
Discharges by DRG
of regional discharges were treated at this hospital in FY14
2%
11%
5%
4%
21%
3%
1%
30%
14%
46%
0% 20% 40% 60% 80% 100%
Agawam MA (43)
Southampton MA (59)
Easthampton MA (101)
West Springfield MA (121)
Granby MA (125)
Westfield MA (126)
Springfield MA (238)
South Hadley MA (556)
Chicopee MA (1,005)
Holyoke MA (2,848)
Discharges by Community
Qu
alit
y 17.1%
14.8%
15.9% 15.0%
0%
5%
10%
15%
20%
25%
2011 2013
0
1
2
3CLABSI CAUTI SSI: Colon Surgery
of community discharges were treated at this
hospital in FY14
Lower is Better
Lower is Better
State Average
C42

Key:
Hospital
Cohort: Community, Disproportionate Share Hospital Peer Cohort
For descriptions of the metrics, please see the technical appendix.
FY
What was the hospital's net inpatient service revenue per case mix
adjusted discharge between FY10 and FY14, and how does this
compare to the hospital's peer cohort median?
2011 2012 20132010 2014
How has the hospital's total outpatient revenue changed compared to
FY10, and how does this compare to the hospital's peer cohort
median? (FY10=100)
2014 HOSPITAL PROFILE: HOLYOKE MEDICAL CENTER
What were the hospital's total margin and operating margins between
FY10 and FY14, and how do these compare to the hospital's peer
cohort medians?Revenue, Cost, & Profit/Loss (in millions)
How have the hospital's total revenue and costs changed between
FY10 and FY14?
How has the volume of the hospital's inpatient discharges changed
compared to FY10, and how does this compare to the hospital's peer
cohort median? (FY10=100)
How has the volume of the hospital's outpatient visits changed
compared to FY10, and how does this compare to the hospital's peer
cohort median? (FY10=100)
122$ 129$ Operating Revenue
1$ 0$ 1$
Total Costs
Total Profit (Loss) 0.2$ 3.5$ 8.0$ 4.5$ 6.2$
117$ 116$
123$
Non-Operating
Revenue
123$ 121$ 116$
(0)$ 0$
130$ 122$ 122$ 116$ Total Revenue
‡ Costs were adjusted to exclude direct medical education costs and physician compensation.
^ For more information on Community Hospital Acceleration, Revitalization and Transformation (CHART) special
funding, please contact the Health Policy Commission (HPC).
η For more information on Delivery System Transformation Initiative (DSTI) special funding, please contact the
Massachusetts Executive Office of Health and Human Service (EOHHS).
119$ 122$ 117$
* Disproportionate Share Hospitals (DSH) receive a minimum of 63% of gross patient service revenue from public
payers.
Uti
lizat
ion
-16.4%
-9.4%
65707580859095
100105110115120125130135140
2010 2011 2012 2013 2014
FY14 Inpatient Discharges = 5,591
+0.6%
-3.6%
65707580859095
100105110115120125130135140
2010 2011 2012 2013 2014
FY14 Outpatient Visits = 82,150
Pat
ien
t R
even
ue
Tre
nd
s
Hospital
Cohort Median
$2,000
$6,000
$10,000
$14,000
$18,000
$22,000
2010 2011 2012 2013 2014
+26.7%
+11.2%
65707580859095
100105110115120125130135140
2010 2011 2012 2013 2014
FY14 Outpatient Revenue = $61 M
Fin
anci
al P
erfo
rman
ce
0.1% 5.0% 2.8%
5.3%
-10%
0%
10%
2010 2011 2012 2013 2014
Tot
al
0.0%
4.5% 1.5% 4.5%
-10%
0%
10%
Ope
ratin
g
November 2015
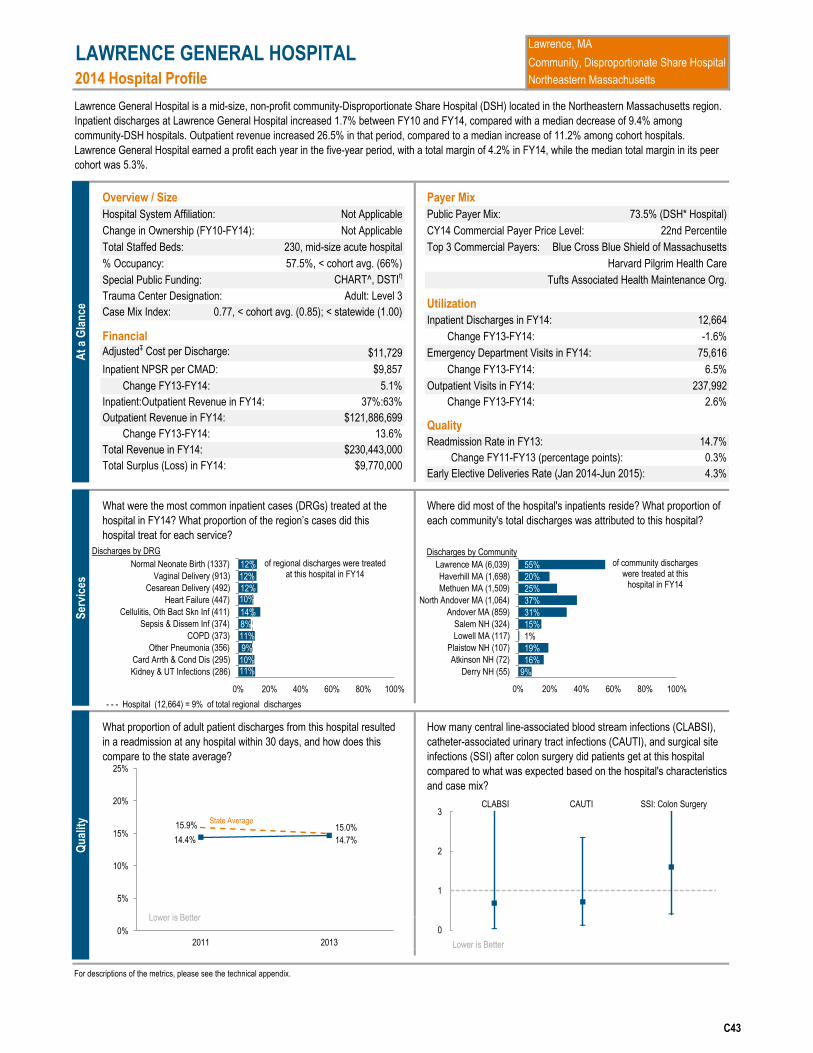
2014 Hospital Profile
Overview / Size Payer Mix
Hospital System Affiliation: Public Payer Mix:
Change in Ownership (FY10-FY14): CY14 Commercial Payer Price Level:
Total Staffed Beds: Top 3 Commercial Payers:
% Occupancy:
Special Public Funding:
Financial Change FY13-FY14:
Adjusted‡ Cost per Discharge: Emergency Department Visits in FY14:
Inpatient NPSR per CMAD: Change FY13-FY14:
Outpatient Visits in FY14:
For descriptions of the metrics, please see the technical appendix.
5.1%
0.77, < cohort avg. (0.85); < statewide (1.00)
Change FY13-FY14:
LAWRENCE GENERAL HOSPITAL
$11,729
Trauma Center Designation:
$9,857
Lawrence General Hospital is a mid-size, non-profit community-Disproportionate Share Hospital (DSH) located in the Northeastern Massachusetts region.
Inpatient discharges at Lawrence General Hospital increased 1.7% between FY10 and FY14, compared with a median decrease of 9.4% among
community-DSH hospitals. Outpatient revenue increased 26.5% in that period, compared to a median increase of 11.2% among cohort hospitals.
Lawrence General Hospital earned a profit each year in the five-year period, with a total margin of 4.2% in FY14, while the median total margin in its peer
cohort was 5.3%.
57.5%, < cohort avg. (66%)
73.5% (DSH* Hospital)
Harvard Pilgrim Health Care
230, mid-size acute hospital
Not Applicable
Blue Cross Blue Shield of Massachusetts
Not Applicable
CHART^, DSTIη
Lawrence, MA
Community, Disproportionate Share Hospital
Case Mix Index:
Northeastern Massachusetts
Adult: Level 3
6.5%
14.7%
22nd Percentile
How many central line-associated blood stream infections (CLABSI),
catheter-associated urinary tract infections (CAUTI), and surgical site
infections (SSI) after colon surgery did patients get at this hospital
compared to what was expected based on the hospital's characteristics
and case mix?
0.3%
4.3%
Change FY11-FY13 (percentage points):
Early Elective Deliveries Rate (Jan 2014-Jun 2015):
12,664Inpatient Discharges in FY14:
-1.6%
75,616
Tufts Associated Health Maintenance Org.
Quality
Readmission Rate in FY13:
Utilization
Change FY13-FY14: 2.6%
237,992
Where did most of the hospital's inpatients reside? What proportion of
each community's total discharges was attributed to this hospital?
Total Surplus (Loss) in FY14:
Inpatient:Outpatient Revenue in FY14: 37%:63%
Outpatient Revenue in FY14: $121,886,699
13.6%
Total Revenue in FY14:
$9,770,000
$230,443,000
Change FY13-FY14:
What proportion of adult patient discharges from this hospital resulted
in a readmission at any hospital within 30 days, and how does this
compare to the state average?
What were the most common inpatient cases (DRGs) treated at the
hospital in FY14? What proportion of the region’s cases did this
hospital treat for each service?
Hospital (12,664) = 9% of total regional discharges - - -
At
a G
lan
ce
Ser
vice
s
11% 10%
9%
11%
8%
14%
10% 12%
12%
12%
0% 20% 40% 60% 80% 100%
Kidney & UT Infections (286)
Card Arrth & Cond Dis (295)
Other Pneumonia (356)
COPD (373)
Sepsis & Dissem Inf (374)
Cellulitis, Oth Bact Skn Inf (411)
Heart Failure (447)
Cesarean Delivery (492)
Vaginal Delivery (913)
Normal Neonate Birth (1337)
Discharges by DRG
of regional discharges were treated at this hospital in FY14
9%
16%
19%
1%
15%
31%
37%
25%
20%
55%
0% 20% 40% 60% 80% 100%
Derry NH (55)
Atkinson NH (72)
Plaistow NH (107)
Lowell MA (117)
Salem NH (324)
Andover MA (859)
North Andover MA (1,064)
Methuen MA (1,509)
Haverhill MA (1,698)
Lawrence MA (6,039)
Discharges by Community
Qu
alit
y
14.4% 14.7%
15.9% 15.0%
0%
5%
10%
15%
20%
25%
2011 2013
0
1
2
3CLABSI CAUTI SSI: Colon Surgery
of community discharges were treated at this
hospital in FY14
Lower is Better
Lower is Better
State Average
C43

Key:
Hospital
Cohort: Community, Disproportionate Share Hospital Peer Cohort
For descriptions of the metrics, please see the technical appendix.
FY
What was the hospital's net inpatient service revenue per case mix
adjusted discharge between FY10 and FY14, and how does this
compare to the hospital's peer cohort median?
2011 2012 20132010 2014
How has the hospital's total outpatient revenue changed compared to
FY10, and how does this compare to the hospital's peer cohort
median? (FY10=100)
2014 HOSPITAL PROFILE: LAWRENCE GENERAL HOSPITAL
What were the hospital's total margin and operating margins between
FY10 and FY14, and how do these compare to the hospital's peer
cohort medians?Revenue, Cost, & Profit/Loss (in millions)
How have the hospital's total revenue and costs changed between
FY10 and FY14?
How has the volume of the hospital's inpatient discharges changed
compared to FY10, and how does this compare to the hospital's peer
cohort median? (FY10=100)
How has the volume of the hospital's outpatient visits changed
compared to FY10, and how does this compare to the hospital's peer
cohort median? (FY10=100)
190$ 217$ Operating Revenue
2$ 2$ 2$
Total Costs
Total Profit (Loss) 3.3$ 4.4$ 12.4$ 9.9$ 9.8$
221$ 176$
230$
Non-Operating
Revenue
229$ 217$ 178$
0$ 1$
220$ 220$ 190$ 179$ Total Revenue
‡ Costs were adjusted to exclude direct medical education costs and physician compensation.
^ For more information on Community Hospital Acceleration, Revitalization and Transformation (CHART) special
funding, please contact the Health Policy Commission (HPC).
η For more information on Delivery System Transformation Initiative (DSTI) special funding, please contact the
Massachusetts Executive Office of Health and Human Service (EOHHS).
185$ 207$ 210$
* Disproportionate Share Hospitals (DSH) receive a minimum of 63% of gross patient service revenue from public
payers.
Uti
lizat
ion
+1.7%
-9.4%
65707580859095
100105110115120125130135140
2010 2011 2012 2013 2014
FY14 Inpatient Discharges = 12,664
+9.3%
-3.6%
65707580859095
100105110115120125130135140
2010 2011 2012 2013 2014
FY14 Outpatient Visits = 237,992
Pat
ien
t R
even
ue
Tre
nd
s
Hospital
Cohort Median
$2,000
$6,000
$10,000
$14,000
$18,000
$22,000
2010 2011 2012 2013 2014
+26.5%
+11.2%
65707580859095
100105110115120125130135140
2010 2011 2012 2013 2014
FY14 Outpatient Revenue = $122 M
Fin
anci
al P
erfo
rman
ce
1.8% 4.2% 2.8%
5.3%
-10%
0%
10%
2010 2011 2012 2013 2014
Tot
al
1.1% 3.5% 1.5%
4.5%
-10%
0%
10%
Ope
ratin
g
November 2015

2014 Hospital Profile
Overview / Size Payer Mix
Hospital System Affiliation: Public Payer Mix:
Change in Ownership (FY10-FY14): CY14 Commercial Payer Price Level:
Total Staffed Beds: Top 3 Commercial Payers:
% Occupancy:
Special Public Funding:
Financial Change FY13-FY14:
Adjusted‡ Cost per Discharge: Emergency Department Visits in FY14:
Inpatient NPSR per CMAD: Change FY13-FY14:
Outpatient Visits in FY14:
For descriptions of the metrics, please see the technical appendix.
Hospital (21,750) = 16% of total regional discharges - - -
Total Surplus (Loss) in FY14:
Inpatient:Outpatient Revenue in FY14: 36%:64%
Outpatient Revenue in FY14: $227,039,597
-2.7%
Total Revenue in FY14:
$17,568,472
$426,793,264
Change FY13-FY14:
What proportion of adult patient discharges from this hospital resulted
in a readmission at any hospital within 30 days, and how does this
compare to the state average?
What were the most common inpatient cases (DRGs) treated at the
hospital in FY14? What proportion of the region’s cases did this
hospital treat for each service?
14.7%
35th Percentile
How many central line-associated blood stream infections (CLABSI),
catheter-associated urinary tract infections (CAUTI), and surgical site
infections (SSI) after colon surgery did patients get at this hospital
compared to what was expected based on the hospital's characteristics
and case mix?
0.0%
0.8%
Change FY11-FY13 (percentage points):
Early Elective Deliveries Rate (Jan 2014-Jun 2015):
21,750Inpatient Discharges in FY14:
-5.8%
100,730
Tufts Associated Health Maintenance Org.
Quality
Readmission Rate in FY13:
Utilization
Change FY13-FY14: -20.1%
187,206
Where did most of the hospital's inpatients reside? What proportion of
each community's total discharges was attributed to this hospital?
1.8%
0.85, < cohort avg. (0.85); < statewide (1.00)
Change FY13-FY14:
LOWELL GENERAL HOSPITAL
$8,823
Trauma Center Designation:
$9,634
Lowell General Hospital is a non-profit community-Disproportionate Share Hospital (DSH) located in the Northeastern Massachusetts region. It was
compared with community hospitals in FY13, as it did not qualify for DSH status that year. It is among the larger acute hospitals in Massachusetts. Lowell
General merged with Saints Medical Center in 2012. As such, utilization data from Saints Medical Center is included in Lowell General’s FY13 and FY14
data. Lowell General Hospital was profitable each year from FY10 to FY14, with a total margin of 4.1% in FY14, compared to a median total margin of
5.3% in its peer cohort.
68.3%, > cohort avg. (66%)
64.3% (DSH* Hospital)
Harvard Pilgrim Health Care
333, among the larger acute hospitals
Wellforce
Blue Cross Blue Shield of Massachusetts
Wellforce - 2014 (FY15)
CHART^
Lowell, MA
Community, Disproportionate Share Hospital
Case Mix Index:
Northeastern Massachusetts
Adult: Level 3
-0.1%
At
a G
lan
ce
Ser
vice
s
19%
16%
14%
16%
20%
17%
17%
22%
20%
19%
0% 20% 40% 60% 80% 100%
Renal Failure (425)
Cellulitis, Oth Bact Skn Inf (452)
Other Pneumonia (550)
COPD (566)
Knee Joint Replacement (586)
Cesarean Delivery (688)
Heart Failure (769)
Sepsis & Dissem Inf (1007)
Vaginal Delivery (1568)
Normal Neonate Birth (2110)
Discharges by DRG of regional discharges
were treated at this hospital in FY14
44%
37%
29%
17%
60%
69%
41%
56%
70%
77%
0% 20% 40% 60% 80% 100%
Pelham NH (311)
North Billerica MA (415)
Westford MA (473)
Billerica MA (575)
Tyngsboro MA (617)
North Chelmsford MA (698)
Tewksbury MA (1,449)
Chelmsford MA (1,502)
Dracut MA (2,434)
Lowell MA (10,831)
Discharges by Community
Qu
alit
y
14.7% 14.7%
15.9% 15.0%
0%
5%
10%
15%
20%
25%
2011 2013
State Average
0
1
2
3CLABSI CAUTI SSI: Colon Surgery
of community discharges were treated at this
hospital in FY14
Lower is Better
Lower is Better
C44

Key:
Hospital
Cohort: Community, Disproportionate Share Hospital Peer Cohort
For descriptions of the metrics, please see the technical appendix.
258$ 238$ Total Revenue
‡ Costs were adjusted to exclude direct medical education costs and physician compensation.
^ For more information on Community Hospital Acceleration, Revitalization and Transformation (CHART) special
funding, please contact the Health Policy Commission (HPC).
244$ 304$ 402$
* Disproportionate Share Hospitals (DSH) receive a minimum of 63% of gross patient service revenue from public
payers.
255$ 317$ Operating Revenue
11$ 22$ 16$
Total Costs
Total Profit (Loss) 11.6$ 13.6$ 28.7$ 24.3$ 17.6$
409$ 226$
427$
Non-Operating
Revenue
416$ 405$ 236$
3$ 2$
333$ 427$
How has the hospital's total outpatient revenue changed compared to
FY10, and how does this compare to the hospital's peer cohort
median? (FY10=100)
2014 HOSPITAL PROFILE: LOWELL GENERAL HOSPITAL
What were the hospital's total margin and operating margins between
FY10 and FY14, and how do these compare to the hospital's peer
cohort medians?Revenue, Cost, & Profit/Loss (in millions)
How have the hospital's total revenue and costs changed between
FY10 and FY14?
How has the volume of the hospital's inpatient discharges changed
compared to FY10, and how does this compare to the hospital's peer
cohort median? (FY10=100)
How has the volume of the hospital's outpatient visits changed
compared to FY10, and how does this compare to the hospital's peer
cohort median? (FY10=100)
FY
What was the hospital's net inpatient service revenue per case mix
adjusted discharge between FY10 and FY14, and how does this
compare to the hospital's peer cohort median?
2011 2012 20132010 2014
Uti
lizat
ion
+38.6%
-9.4%
65707580859095
100105110115120125130135140
2010 2011 2012 2013 2014
merger
FY14 Inpatient Discharges = 21,750
-3.6%
65707580859095
100105110115120125130135140
2010 2011 2012 2013 2014
merger
FY14 Outpatient Visits = 187,206
Pat
ien
t R
even
ue
Tre
nd
s
Hospital
Cohort Median
$2,000
$6,000
$10,000
$14,000
$18,000
$22,000
2010 2011 2012 2013 2014
+11.2%
65707580859095
100105110115120125130135140
2010 2011 2012 2013 2014
merger
FY14 Outpatient Revenue = $227 M
Fin
anci
al P
erfo
rman
ce
4.9% 4.1% 2.8%
5.3%
-10%
0%
10%
2010 2011 2012 2013 2014
Tot
al
4.0% 1.5% 1.5%
4.5%
-10%
0%
10%
Ope
ratin
g
+47.1% +137.5% +89.8%
+71.9% +67.3%
merger
merger
November 2015
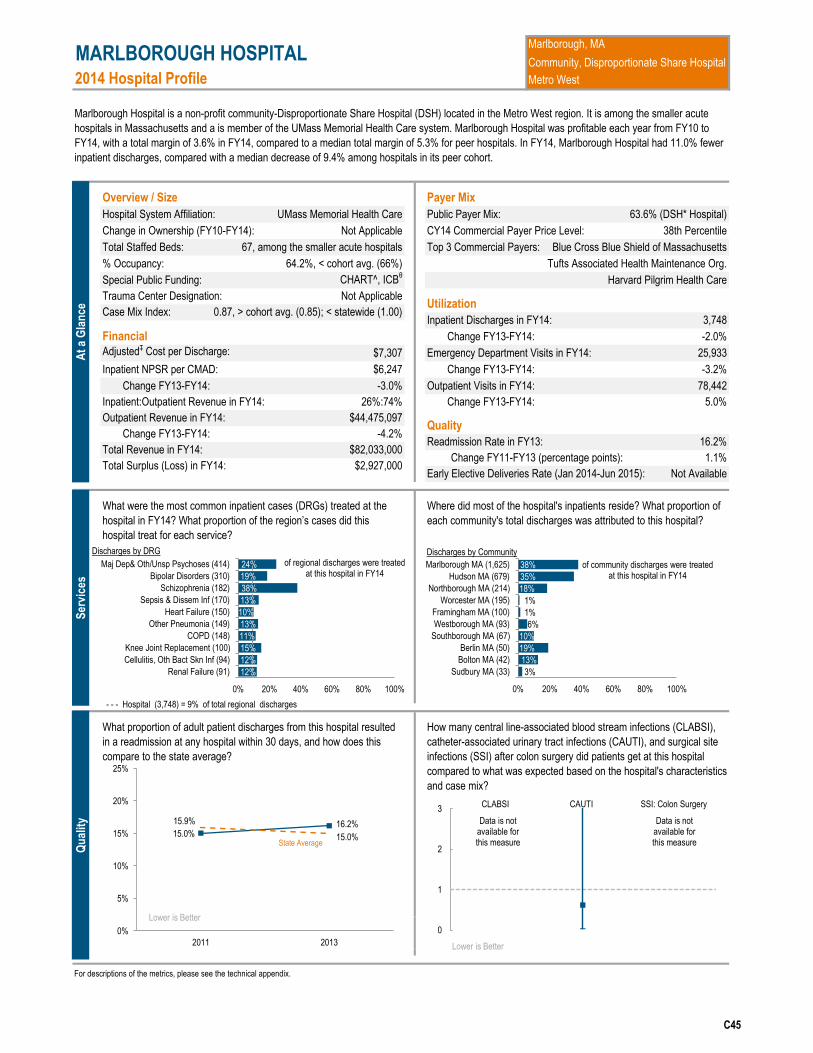
2014 Hospital Profile
Overview / Size Payer Mix
Hospital System Affiliation: Public Payer Mix:
Change in Ownership (FY10-FY14): CY14 Commercial Payer Price Level:
Total Staffed Beds: Top 3 Commercial Payers:
% Occupancy:
Special Public Funding:
Financial Change FY13-FY14:
Adjusted‡ Cost per Discharge: Emergency Department Visits in FY14:
Inpatient NPSR per CMAD: Change FY13-FY14:
Outpatient Visits in FY14:
For descriptions of the metrics, please see the technical appendix.
Hospital (3,748) = 9% of total regional discharges - - -
Total Surplus (Loss) in FY14:
Inpatient:Outpatient Revenue in FY14: 26%:74%
Outpatient Revenue in FY14: $44,475,097
-4.2%
Total Revenue in FY14:
$2,927,000
$82,033,000
Change FY13-FY14:
What proportion of adult patient discharges from this hospital resulted
in a readmission at any hospital within 30 days, and how does this
compare to the state average?
What were the most common inpatient cases (DRGs) treated at the
hospital in FY14? What proportion of the region’s cases did this
hospital treat for each service?
16.2%
38th Percentile
How many central line-associated blood stream infections (CLABSI),
catheter-associated urinary tract infections (CAUTI), and surgical site
infections (SSI) after colon surgery did patients get at this hospital
compared to what was expected based on the hospital's characteristics
and case mix?
1.1%Change FY11-FY13 (percentage points):
Early Elective Deliveries Rate (Jan 2014-Jun 2015):
3,748Inpatient Discharges in FY14:
-2.0%
25,933
Harvard Pilgrim Health Care
Quality
Readmission Rate in FY13:
Utilization
Change FY13-FY14: 5.0%
78,442
Where did most of the hospital's inpatients reside? What proportion of
each community's total discharges was attributed to this hospital?
Not Available
-3.0%
0.87, > cohort avg. (0.85); < statewide (1.00)
Change FY13-FY14:
MARLBOROUGH HOSPITAL
$7,307
Trauma Center Designation:
$6,247
Marlborough Hospital is a non-profit community-Disproportionate Share Hospital (DSH) located in the Metro West region. It is among the smaller acute
hospitals in Massachusetts and a is member of the UMass Memorial Health Care system. Marlborough Hospital was profitable each year from FY10 to
FY14, with a total margin of 3.6% in FY14, compared to a median total margin of 5.3% for peer hospitals. In FY14, Marlborough Hospital had 11.0% fewer
inpatient discharges, compared with a median decrease of 9.4% among hospitals in its peer cohort.
64.2%, < cohort avg. (66%)
63.6% (DSH* Hospital)
Tufts Associated Health Maintenance Org.
67, among the smaller acute hospitals
UMass Memorial Health Care
Blue Cross Blue Shield of Massachusetts
Not Applicable
CHART^, ICBθ
Marlborough, MA
Community, Disproportionate Share Hospital
Case Mix Index:
Metro West
Not Applicable
-3.2%
At
a G
lan
ce
Ser
vice
s
12%
12%
15%
11%
13%
10%
13%
38%
19%
24%
0% 20% 40% 60% 80% 100%
Renal Failure (91)
Cellulitis, Oth Bact Skn Inf (94)
Knee Joint Replacement (100)
COPD (148)
Other Pneumonia (149)
Heart Failure (150)
Sepsis & Dissem Inf (170)
Schizophrenia (182)
Bipolar Disorders (310)
Maj Dep& Oth/Unsp Psychoses (414)
Discharges by DRG
of regional discharges were treated at this hospital in FY14
3%
13%
19%
10%
6%
1%
1%
18%
35%
38%
0% 20% 40% 60% 80% 100%
Sudbury MA (33)
Bolton MA (42)
Berlin MA (50)
Southborough MA (67)
Westborough MA (93)
Framingham MA (100)
Worcester MA (195)
Northborough MA (214)
Hudson MA (679)
Marlborough MA (1,625)
Discharges by Community
Qu
alit
y
15.0% 16.2% 15.9%
15.0%
0%
5%
10%
15%
20%
25%
2011 2013
0
1
2
3CLABSI CAUTI SSI: Colon Surgery
of community discharges were treated at this hospital in FY14
Lower is Better
Lower is Better
Data is not available for this measure
Data is not available for this measure State Average
C45

Key:
Hospital
Cohort: Community, Disproportionate Share Hospital Peer Cohort
For descriptions of the metrics, please see the technical appendix.
76$ 73$ Total Revenue
‡ Costs were adjusted to exclude direct medical education costs and physician compensation.
^ For more information on Community Hospital Acceleration, Revitalization and Transformation (CHART) special
funding, please contact the Health Policy Commission (HPC).
θ For more information on Infrastructure and Capacity Building (ICB) special funding, please contact the
Massachusetts Executive Office of Health and Human Services (EOHHS).
75$ 78$ 78$
* Disproportionate Share Hospitals (DSH) receive a minimum of 63% of gross patient service revenue from public
payers.
76$ 77$ Operating Revenue
2$ 2$ 2$
Total Costs
Total Profit (Loss) 2.2$ 1.3$ 1.0$ 2.4$ 2.9$
79$ 70$
82$
Non-Operating
Revenue
80$ 79$ 71$
1$ 1$
79$ 81$
How has the hospital's total outpatient revenue changed compared to
FY10, and how does this compare to the hospital's peer cohort
median? (FY10=100)
2014 HOSPITAL PROFILE: MARLBOROUGH HOSPITAL
What were the hospital's total margin and operating margins between
FY10 and FY14, and how do these compare to the hospital's peer
cohort medians?Revenue, Cost, & Profit/Loss (in millions)
How have the hospital's total revenue and costs changed between
FY10 and FY14?
How has the volume of the hospital's inpatient discharges changed
compared to FY10, and how does this compare to the hospital's peer
cohort median? (FY10=100)
How has the volume of the hospital's outpatient visits changed
compared to FY10, and how does this compare to the hospital's peer
cohort median? (FY10=100)
FY
What was the hospital's net inpatient service revenue per case mix
adjusted discharge between FY10 and FY14, and how does this
compare to the hospital's peer cohort median?
2011 2012 20132010 2014
Uti
lizat
ion
-11.0%
-9.4%
65707580859095
100105110115120125130135140
2010 2011 2012 2013 2014
FY14 Inpatient Discharges = 3,748
-5.5%
-3.6%
65707580859095
100105110115120125130135140
2010 2011 2012 2013 2014
FY14 Outpatient Visits = 78,442
Pat
ien
t R
even
ue
Tre
nd
s
Hospital
Cohort Median
$2,000
$6,000
$10,000
$14,000
$18,000
$22,000
2010 2011 2012 2013 2014
+18.0%
+11.2%
65707580859095
100105110115120125130135140
2010 2011 2012 2013 2014
FY14 Outpatient Revenue = $44 M
Fin
anci
al P
erfo
rman
ce
3.0%
3.6% 2.8%
5.3%
-10%
0%
10%
2010 2011 2012 2013 2014
Tot
al
1.0% 1.7% 1.5%
4.5%
-10%
0%
10%
Ope
ratin
g
November 2015

2014 Hospital Profile
Overview / Size Payer Mix
Hospital System Affiliation: Public Payer Mix:
Change in Ownership (FY10-FY14): CY14 Commercial Payer Price Level:
Total Staffed Beds: Top 3 Commercial Payers:
% Occupancy:
Special Public Funding:
Financial Change FY13-FY14:
Adjusted‡ Cost per Discharge: Emergency Department Visits in FY14:
Inpatient NPSR per CMAD: Change FY13-FY14:
Outpatient Visits in FY14:
For descriptions of the metrics, please see the technical appendix.
Hospital (1,313) = 5% of total regional discharges - - -
What proportion of adult patient discharges from this hospital resulted
in a readmission at any hospital within 30 days, and how does this
compare to the state average?
Inpatient:Outpatient Revenue in FY14: 24%:76%
Outpatient Revenue in FY14: $45,344,130
5.1%
Total Revenue in FY14:
$3,837,000
$72,248,000
Change FY13-FY14:
What were the most common inpatient cases (DRGs) treated at the
hospital in FY14? What proportion of the region’s cases did this
hospital treat for each service?
18.1%
84th Percentile
How many central line-associated blood stream infections (CLABSI),
catheter-associated urinary tract infections (CAUTI), and surgical site
infections (SSI) after colon surgery did patients get at this hospital
compared to what was expected based on the hospital's characteristics
and case mix?
5.8%
Not Available
Change FY11-FY13 (percentage points):
Early Elective Deliveries Rate (Jan 2014-Jun 2015):
1,313Inpatient Discharges in FY14:
8.6%
14,408
Aetna Health Inc. (PA)
Quality
Readmission Rate in FY13:
Utilization
Change FY13-FY14: 5.8%
57,442
Where did most of the hospital's inpatients reside? What proportion of
each community's total discharges was attributed to this hospital?
6.1%
0.65, < cohort avg. (0.85); < statewide (1.00)
Change FY13-FY14:
Total Surplus (Loss) in FY14:
MARTHA'S VINEYARD HOSPITAL
$19,015
Trauma Center Designation:
$23,267
Martha’s Vineyard Hospital is a small, non-profit community-Disproportionate Share Hospital (DSH) located in the Cape and Islands region. It is a member
of Partners HealthCare System. Martha’s Vineyard Hospital is designated by the Centers for Medicare & Medicaid Services (CMS) as one of three Critical
Access Hospitals (CAH) in Massachusetts. Martha’s Vineyard Hospital was profitable each year from FY10 to FY14, with a total margin of 5.3% in FY14,
consistent with the median total margin of its peer cohort hospitals. In FY14, Martha’s Vineyard Hospital had 4.0% more inpatient discharges than in FY10,
compared with a median decrease of 9.4% in its peer cohort.
60.8%, < cohort avg. (66%)
65.9% (DSH* Hospital)
Harvard Pilgrim Health Care
31, among the smallest acute hospitals
Partners HealthCare System
Blue Cross Blue Shield of Massachusetts
Not Applicable
Not Applicable
Oak Bluffs, MA
Community, Disproportionate Share Hospital
Case Mix Index:
Cape and Islands
Not Applicable
-1.6%
At
a G
lan
ce
Ser
vice
s
8%
24%
8%
10%
16% 9%
6%
11%
9%
9%
0% 20% 40% 60% 80% 100%
COPD (35)
Oth Muscskel & ConnTis Dx (37)
Cesarean Delivery (38)
Cellulitis, Oth Bact Skn Inf (40)
Oth Bck & Nck, Fx and Inj Dx (46)
Kidney & UT Infections (46)
Heart Failure (56)
Other Pneumonia (65)
Vaginal Delivery (84)
Normal Neonate Birth (116)
Discharges by DRG
of regional discharges were treated at this hospital in FY14
0%
0%
0%
0%
0%
52%
56%
55%
52%
56%
0% 20% 40% 60% 80% 100%
Chilmark MA (62)
West Tisbury MA (104)
Oak Bluffs MA (221)
Edgartown MA (262)
Vineyard Haven MA (472)
Discharges by Community
Qu
alit
y
12.3%
18.1%
15.9% 15.0%
0%
5%
10%
15%
20%
25%
2011 2013
0
1
2
3CLABSI CAUTI SSI: Colon Surgery
Data is not available for these measures
of community discharges were treated at this
hospital in FY14
Lower is Better
Communities with fewer than 26 discharges have been suppressed
Lower is Better
State Average
C46

Key:
Hospital
Cohort: Community, Disproportionate Share Hospital Peer Cohort
For descriptions of the metrics, please see the technical appendix.
‡ Costs were adjusted to exclude direct medical education costs and physician compensation.
56$ 60$ 61$
* Disproportionate Share Hospitals (DSH) receive a minimum of 63% of gross patient service revenue from public
payers.
56$ 59$ Operating Revenue
3$ 3$ 1$
Total Costs
Total Profit (Loss) 3.9$ 2.4$ 0.1$ 4.3$ 3.8$
68$ 51$
72$
Non-Operating
Revenue
69$ 62$ 51$
2$ 4$
60$ 65$
How has the hospital's total outpatient revenue changed compared to
FY10, and how does this compare to the hospital's peer cohort
median? (FY10=100)
58$ 55$ Total Revenue
2014 HOSPITAL PROFILE: MARTHA'S VINEYARD HOSPITAL
What were the hospital's total margin and operating margins between
FY10 and FY14, and how do these compare to the hospital's peer
cohort medians?Revenue, Cost, & Profit/Loss (in millions)
How have the hospital's total revenue and costs changed between
FY10 and FY14?
How has the volume of the hospital's inpatient discharges changed
compared to FY10, and how does this compare to the hospital's peer
cohort median? (FY10=100)
How has the volume of the hospital's outpatient visits changed
compared to FY10, and how does this compare to the hospital's peer
cohort median? (FY10=100)
FY
What was the hospital's net inpatient service revenue per case mix
adjusted discharge between FY10 and FY14, and how does this
compare to the hospital's peer cohort median?
2011 2012 20132010 2014
Uti
lizat
ion
+4.0%
-9.4%
65707580859095
100105110115120125130135140
2010 2011 2012 2013 2014
FY14 Inpatient Discharges = 1,313
-3.5%
-3.6%
65707580859095
100105110115120125130135140
2010 2011 2012 2013 2014
FY14 Outpatient Visits = 57,442
Pat
ien
t R
even
ue
Tre
nd
s
Hospital
Cohort Median
$2,000
$6,000
$10,000
$14,000
$18,000
$22,000
2010 2011 2012 2013 2014
+11.6%
+11.2%
65707580859095
100105110115120125130135140
2010 2011 2012 2013 2014
FY14 Outpatient Revenue = $45 M
Fin
anci
al P
erfo
rman
ce
7.1% 5.3%
2.8% 5.3%
-10%
0%
10%
2010 2011 2012 2013 2014
Tot
al
0.1% 0.7%
1.5% 4.5%
-10%
0%
10%
Ope
ratin
g
November 2015
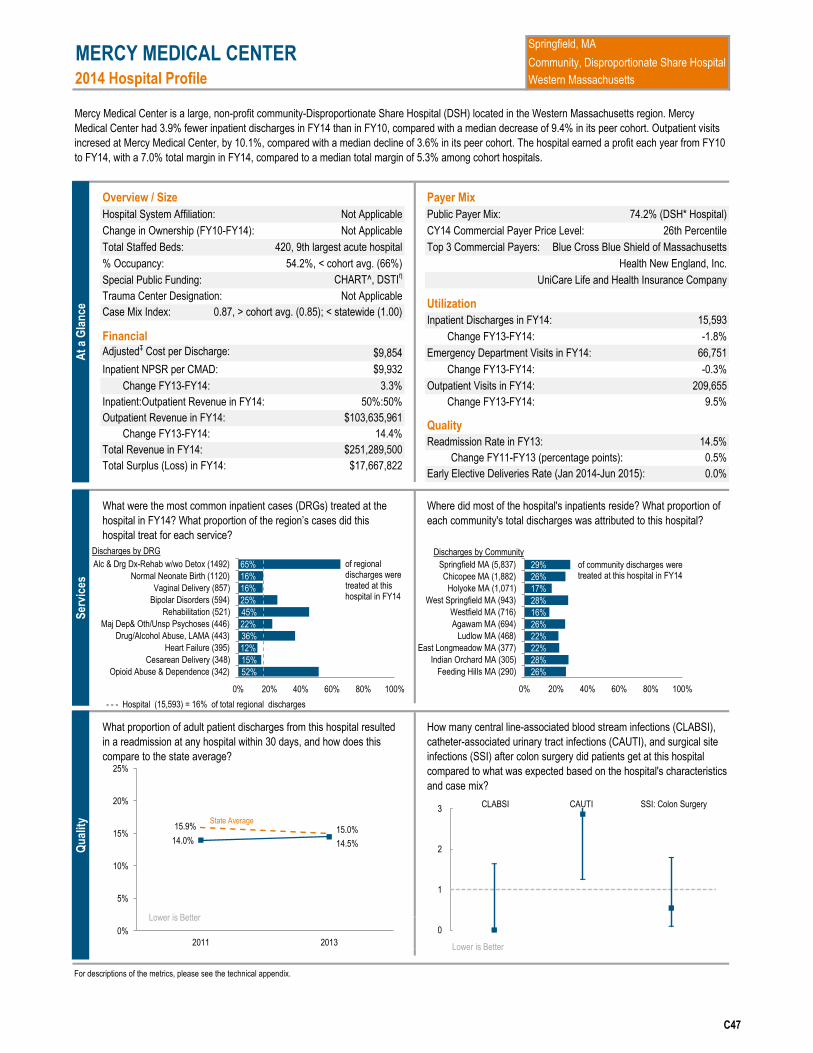
2014 Hospital Profile
Overview / Size Payer MixHospital System Affiliation: Public Payer Mix:Change in Ownership (FY10-FY14): CY14 Commercial Payer Price Level:Total Staffed Beds: Top 3 Commercial Payers:% Occupancy:Special Public Funding:
Financial Change FY13-FY14:Adjusted‡ Cost per Discharge: Emergency Department Visits in FY14:Inpatient NPSR per CMAD: Change FY13-FY14:
Outpatient Visits in FY14:
For descriptions of the metrics, please see the technical appendix.
Hospital (15,593) = 16% of total regional discharges - - -
Total Surplus (Loss) in FY14:
Inpatient:Outpatient Revenue in FY14: 50%:50%Outpatient Revenue in FY14: $103,635,961
14.4%Total Revenue in FY14:
$17,667,822$251,289,500
Change FY13-FY14:
What proportion of adult patient discharges from this hospital resulted in a readmission at any hospital within 30 days, and how does this compare to the state average?
What were the most common inpatient cases (DRGs) treated at the hospital in FY14? What proportion of the region’s cases did this
hospital treat for each service?
14.5%
26th Percentile
How many central line-associated blood stream infections (CLABSI), catheter-associated urinary tract infections (CAUTI), and surgical site infections (SSI) after colon surgery did patients get at this hospital compared to what was expected based on the hospital's characteristics and case mix?
0.5%0.0%
Change FY11-FY13 (percentage points):Early Elective Deliveries Rate (Jan 2014-Jun 2015):
15,593Inpatient Discharges in FY14:-1.8%
66,751
UniCare Life and Health Insurance Company
QualityReadmission Rate in FY13:
Utilization
Change FY13-FY14: 9.5%209,655
Where did most of the hospital's inpatients reside? What proportion of each community's total discharges was attributed to this hospital?
3.3%
0.87, > cohort avg. (0.85); < statewide (1.00)
Change FY13-FY14:
MERCY MEDICAL CENTER
$9,854
Trauma Center Designation:
$9,932
Mercy Medical Center is a large, non-profit community-Disproportionate Share Hospital (DSH) located in the Western Massachusetts region. Mercy Medical Center had 3.9% fewer inpatient discharges in FY14 than in FY10, compared with a median decrease of 9.4% in its peer cohort. Outpatient visits incresed at Mercy Medical Center, by 10.1%, compared with a median decline of 3.6% in its peer cohort. The hospital earned a profit each year from FY10 to FY14, with a 7.0% total margin in FY14, compared to a median total margin of 5.3% among cohort hospitals.
54.2%, < cohort avg. (66%)
74.2% (DSH* Hospital)
Health New England, Inc.420, 9th largest acute hospital
Not Applicable
Blue Cross Blue Shield of MassachusettsNot Applicable
CHART^, DSTIη
Springfield, MACommunity, Disproportionate Share Hospital
Case Mix Index:
Western Massachusetts
Not Applicable
-0.3%
At a
Glan
ce
Serv
ices
52% 15% 12% 36% 22% 45% 25% 16% 16% 65%
0% 20% 40% 60% 80% 100%
Opioid Abuse & Dependence (342)Cesarean Delivery (348)
Heart Failure (395)Drug/Alcohol Abuse, LAMA (443)
Maj Dep& Oth/Unsp Psychoses (446)Rehabilitation (521)
Bipolar Disorders (594)Vaginal Delivery (857)
Normal Neonate Birth (1120)Alc & Drg Dx-Rehab w/wo Detox (1492)Discharges by DRG
of regional discharges were treated at this hospital in FY14
26% 28% 22% 22% 26% 16% 28% 17% 26% 29%
0% 20% 40% 60% 80% 100%
Feeding Hills MA (290)Indian Orchard MA (305)
East Longmeadow MA (377)Ludlow MA (468)
Agawam MA (694)Westfield MA (716)
West Springfield MA (943)Holyoke MA (1,071)
Chicopee MA (1,882)Springfield MA (5,837)
Discharges by Community
Quali
ty
14.0% 14.5%
15.9% 15.0%
0%
5%
10%
15%
20%
25%
2011 20130
1
2
3 CLABSI CAUTI SSI: Colon Surgery
of community discharges were treated at this hospital in FY14
Lower is Better
State Average
Lower is Better
C47

Key:
Hospital
Cohort: Community, Disproportionate Share Hospital Peer Cohort
For descriptions of the metrics, please see the technical appendix.
218$ 216$ Total Revenue
‡ Costs were adjusted to exclude direct medical education costs and physician compensation.
^ For more information on Community Hospital Acceleration, Revitalization and Transformation (CHART) special funding, please contact the Health Policy Commission (HPC).
η For more information on Delivery System Transformation Initiative (DSTI) special funding, please contact the Massachusetts Executive Office of Health and Human Service (EOHHS).
207$ 219$ 120$
* Disproportionate Share Hospitals (DSH) receive a minimum of 63% of gross patient service revenue from public payers.
218$ 242$ Operating Revenue
1$ 1$ 1$
Total Costs
Total Profit (Loss) 7.2$ 11.0$ 25.2$ 9.9$ 17.7$
234$ 209$
251$
Non-Operating Revenue
250$ 129$ 217$
0$ (1)$
244$ 130$
How has the hospital's total outpatient revenue changed compared to FY10, and how does this compare to the hospital's peer cohort median? (FY10=100)
2014 HOSPITAL PROFILE: MERCY MEDICAL CENTER
What were the hospital's total margin and operating margins between FY10 and FY14, and how do these compare to the hospital's peer cohort medians?
Revenue, Cost, & Profit/Loss (in millions)
How have the hospital's total revenue and costs changed between FY10 and FY14?
How has the volume of the hospital's inpatient discharges changed compared to FY10, and how does this compare to the hospital's peer cohort median? (FY10=100)
How has the volume of the hospital's outpatient visits changed compared to FY10, and how does this compare to the hospital's peer cohort median? (FY10=100)
FY
What was the hospital's net inpatient service revenue per case mix adjusted discharge between FY10 and FY14, and how does this compare to the hospital's peer cohort median?
2011 2012 20132010 2014
Utiliz
atio
n
-3.9%
-9.4%
65707580859095
100105110115120125130135140
2010 2011 2012 2013 2014
FY14 Inpatient Discharges = 15,593
+10.1%
-3.6%
65707580859095
100105110115120125130135140
2010 2011 2012 2013 2014
FY14 Outpatient Visits = 209,655
Patie
nt R
even
ue T
rend
s
Hospital Cohort Median
$2,000
$6,000
$10,000
$14,000
$18,000
$22,000
2010 2011 2012 2013 2014
+39.9%
+11.2%
65707580859095
100105110115120125130135140
2010 2011 2012 2013 2014
FY14 Outpatient Revenue = $104 M
Fina
ncial
Per
form
ance
3.3% 7.0%
2.8% 5.3%
-10%
0%
10%
2010 2011 2012 2013 2014
Total
3.9% 6.7%
1.5% 4.5%
-10%
0%
10%
Oper
ating
November 2015

2014 Hospital Profile
Overview / Size Payer Mix
Hospital System Affiliation: Public Payer Mix:
Change in Ownership (FY10-FY14): CY14 Commercial Payer Price Level:
Total Staffed Beds: Top 3 Commercial Payers:
% Occupancy:
Special Public Funding:
Financial Change FY13-FY14:
Adjusted‡ Cost per Discharge: Emergency Department Visits in FY14:
Inpatient NPSR per CMAD: Change FY13-FY14:
Outpatient Visits in FY14:
For descriptions of the metrics, please see the technical appendix.
0.0%
0.90, > cohort avg. (0.85); < statewide (1.00)
Change FY13-FY14:
MERRIMACK VALLEY HOSPITAL
$9,068
Trauma Center Designation:
$8,658
Merrimack Valley Hospital merged with Steward Holy Family Hospital in July 2014, and is now a campus of Holy Family Hospital. Merrimack Valley
Hospital was unprofitable each year from FY10 to FY13, with a total margin of -22.1% in FY13, compared with a median total margin of 4.1% in its peer
cohort. Financial data and some utilzation data for FY14 is included in Steward Holy Family's data for that year, and is reported in Steward Holy Family
Hospital's profile.
97.7%, highest in cohort (avg. 66%)
74.7% (DSH* Hospital)
Tufts Associated Health Maintenance Org.
56, among the smaller acute hospitals
Steward Health Care System
Blue Cross Blue Shield of Massachusetts
Steward Health Care - 2011
ICBθ
Haverhill, MA
Community, Disproportionate Share Hospital
Case Mix Index:
Northeastern Massachusetts
Not Applicable
-19.5%
17.5%
30th Percentile
How many central line-associated blood stream infections (CLABSI),
catheter-associated urinary tract infections (CAUTI), and surgical site
infections (SSI) after colon surgery did patients get at this hospital
compared to what was expected based on the hospital's characteristics
and case mix?
0.7%
Not Available
Change FY11-FY13 (percentage points):
Early Elective Deliveries Rate (Jan 2014-Jun 2015):
3,064Inpatient Discharges in FY14:
-3.7%
17,367
Harvard Pilgrim Health Care
Quality
Readmission Rate in FY13:
Utilization
Change FY13-FY14: -12.5%
28,089
Where did most of the hospital's inpatients reside? What proportion of
each community's total discharges was attributed to this hospital?
Total Surplus (Loss) in FY14:
Inpatient:Outpatient Revenue in FY14: 43%:57%
Outpatient Revenue in FY14: $18,684,563
-12.0%
Total Revenue in FY14:
Not Applicable
Not Applicable
Change FY13-FY14:
What proportion of adult patient discharges from this hospital resulted
in a readmission at any hospital within 30 days, and how does this
compare to the state average?
What were the most common inpatient cases (DRGs) treated at the
hospital in FY14? What proportion of the region’s cases did this
hospital treat for each service?
At
a G
lan
ce
Ser
vice
s
Qu
alit
y 16.9% 17.5%
15.9% 15.0%
0%
5%
10%
15%
20%
25%
2011 2013
State Average
0
1
2
3CLABSI CAUTI SSI: Colon Surgery
Lower is Better
Lower is Better
Data is not available for this measure
Data for this measure was reported under Steward Holy Family as a result of a merger in FY14.
Data for this measure was reported under Steward Holy Family as a result of a merger in FY14.
C48

Key:
Hospital
Cohort: Community, Disproportionate Share Hospital Peer Cohort
For descriptions of the metrics, please see the technical appendix.
FY
What was the hospital's net inpatient service revenue per case mix
adjusted discharge between FY10 and FY14, and how does this
compare to the hospital's peer cohort median?
2011 2012 20132010 2014
How has the hospital's total outpatient revenue changed compared to
FY10, and how does this compare to the hospital's peer cohort
median? (FY10=100)
2014 HOSPITAL PROFILE: MERRIMACK VALLEY HOSPITAL
What were the hospital's total margin and operating margins between
FY10 and FY14, and how do these compare to the hospital's peer
cohort medians?Revenue, Cost, & Profit/Loss (in millions)
How have the hospital's total revenue and costs changed between
FY10 and FY14?
How has the volume of the hospital's inpatient discharges changed
compared to FY10, and how does this compare to the hospital's peer
cohort median? (FY10=100)
How has the volume of the hospital's outpatient visits changed
compared to FY10, and how does this compare to the hospital's peer
cohort median? (FY10=100)
23$ 56$ Operating Revenue
N/A(0)$ (0)$
Total Costs
Total Profit (Loss) (4.1)$ (1.2)$ (5.8)$ (10.7)$ N/A
N/A59$
N/A
Non-Operating
Revenue
N/A48$ 55$
0$ 0$
56$ 48$ 23$ 55$ Total Revenue
‡ Costs were adjusted to exclude direct medical education costs and physician compensation.
θ For more information on Infrastructure and Capacity Building (ICB) special funding, please contact the
Massachusetts Executive Office of Health and Human Services (EOHHS).
24$ 62$ 59$
* Disproportionate Share Hospitals (DSH) receive a minimum of 63% of gross patient service revenue from public
payers.
Uti
lizat
ion
-20.8%
-9.4%
65707580859095
100105110115120125130135140
2010 2011 2012 2013 2014
FY14 Inpatient Discharges = 3,064
-3.6%
65707580859095
100105110115120125130135140
2010 2011 2012 2013 2014
FY14 Outpatient Visits = 28,089
Pat
ien
t R
even
ue
Tre
nd
s
Hospital
Cohort Median
$2,000
$6,000
$10,000
$14,000
$18,000
$22,000
2010 2011 2012 2013 2014
-34.9%
+11.2%
65707580859095
100105110115120125130135140
2010 2011 2012 2013 2014
FY14 Outpatient Revenue = $19 M
Fin
anci
al P
erfo
rman
ce
-7.4%
2.8% 5.3%
-10%
0%
10%
2010 2011 2012 2013 2014
Tot
al
-7.4%
1.5% 4.5%
-10%
0%
10%
Ope
ratin
g
-22.1%
-22.1%
Hospital merged in FY14
Hospital merged in FY14
-63.1% -60.0% -61.2% -66.1%
November 2015

2014 Hospital Profile
Overview / Size Payer Mix
Hospital System Affiliation: Public Payer Mix:
Change in Ownership (FY10-FY14): CY14 Commercial Payer Price Level:
Total Staffed Beds: Top 3 Commercial Payers:
% Occupancy:
Special Public Funding:
Financial Change FY13-FY14:
Adjusted‡ Cost per Discharge: Emergency Department Visits in FY14:
Inpatient NPSR per CMAD: Change FY13-FY14:
Outpatient Visits in FY14:
For descriptions of the metrics, please see the technical appendix.
Hospital (6,025) = 9% of total regional discharges - - -
Total Surplus (Loss) in FY14:
Inpatient:Outpatient Revenue in FY14: 27%:73%
Outpatient Revenue in FY14: $56,607,679
-7.5%
Total Revenue in FY14:
$8,936,862
$116,238,769
Change FY13-FY14:
What proportion of adult patient discharges from this hospital resulted
in a readmission at any hospital within 30 days, and how does this
compare to the state average?
What were the most common inpatient cases (DRGs) treated at the
hospital in FY14? What proportion of the region’s cases did this
hospital treat for each service?
16.4%
31st Percentile
How many central line-associated blood stream infections (CLABSI),
catheter-associated urinary tract infections (CAUTI), and surgical site
infections (SSI) after colon surgery did patients get at this hospital
compared to what was expected based on the hospital's characteristics
and case mix?
-3.7%
0.0%
Change FY11-FY13 (percentage points):
Early Elective Deliveries Rate (Jan 2014-Jun 2015):
6,025Inpatient Discharges in FY14:
-8.9%
50,697
Tufts Associated Health Maintenance Org.
Quality
Readmission Rate in FY13:
Utilization
Change FY13-FY14: -4.6%
64,410
Where did most of the hospital's inpatients reside? What proportion of
each community's total discharges was attributed to this hospital?
13.1%
0.92, > cohort avg. (0.85); < statewide (1.00)
Change FY13-FY14:
MORTON HOSPITAL
$6,988
Trauma Center Designation:
$9,699
Morton Hospital is a for-profit community-Disproportionate Share Hospital (DSH) located in the Metro South region. Morton Hospital is a member of
Steward Health Care System. Inpatient discharges at Morton Hospital decreased by 28.1% from FY10 to FY14, compared to a median decrease of 9.4%
in peer cohort hospitals during that time. Outpatient visits declined sharply (-46.8%) between FY10 and FY14 at Morton Hospital, while the median
outpatient visits in its cohort only declined by only 3.6% during that period. Morton Hospital recovered from losses in FY12 and FY13, and earned a total
margin of 7.7% in FY14, higher than the 5.3% median total margin in its peer cohort.
75.2%, > cohort avg. (66%)
68.4% (DSH* Hospital)
Harvard Pilgrim Health Care
91, among the smaller acute hospitals
Steward Health Care System
Blue Cross Blue Shield of Massachusetts
Steward Health Care - 2011
ICBθ
Taunton, MA
Community, Disproportionate Share Hospital
Case Mix Index:
Metro South
Not Applicable
-3.7%
At
a G
lan
ce
Ser
vice
s
9%
10%
12%
23%
20%
14%
6%
6%
14%
13%
0% 20% 40% 60% 80% 100%
Other Pneumonia (156)
Cellulitis, Oth Bact Skn Inf (162)
Renal Failure (163)
Degen Nrvs Syst exc MS (190)
Pulm Edema & Resp Failure (190)
Knee Joint Replacement (193)
Vaginal Delivery (233)
Normal Neonate Birth (317)
Heart Failure (330)
Sepsis & Dissem Inf (415)
Discharges by DRG
of regional discharges were treated at this hospital in FY14
0%
3%
5%
20%
40%
38%
26%
18%
33%
52%
0% 20% 40% 60% 80% 100%
Fall River MA (62)
Bridgewater MA (76)
Norton MA (86)
Berkley MA (110)
North Dighton MA (141)
East Taunton MA (243)
Lakeville MA (281)
Middleboro MA (510)
Raynham MA (553)
Taunton MA (3,323)
Discharges by Community
Qu
alit
y
20.1%
16.4% 15.9% 15.0%
0%
5%
10%
15%
20%
25%
2011 2013
0
1
2
3CLABSI CAUTI SSI: Colon Surgery
of community discharges were treated at this hospital in FY14
Lower is Better
Lower is Better
State Average
C49

Key:
Hospital
Cohort: Community, Disproportionate Share Hospital Peer Cohort
For descriptions of the metrics, please see the technical appendix.
126$ 133$ Total Revenue
‡ Costs were adjusted to exclude direct medical education costs and physician compensation.
θ For more information on Infrastructure and Capacity Building (ICB) special funding, please contact the
Massachusetts Executive Office of Health and Human Services (EOHHS).
129$ 129$ 122$
* Disproportionate Share Hospitals (DSH) receive a minimum of 63% of gross patient service revenue from public
payers.
124$ 125$ Operating Revenue
0$ -$ -$
Total Costs
Total Profit (Loss) 3.1$ (3.1)$ (3.7)$ (9.7)$ 8.9$
107$ 130$
116$
Non-Operating
Revenue
116$ 113$ 131$
1$ 2$
125$ 113$
How has the hospital's total outpatient revenue changed compared to
FY10, and how does this compare to the hospital's peer cohort
median? (FY10=100)
2014 HOSPITAL PROFILE: MORTON HOSPITAL
What were the hospital's total margin and operating margins between
FY10 and FY14, and how do these compare to the hospital's peer
cohort medians?Revenue, Cost, & Profit/Loss (in millions)
How have the hospital's total revenue and costs changed between
FY10 and FY14?
How has the volume of the hospital's inpatient discharges changed
compared to FY10, and how does this compare to the hospital's peer
cohort median? (FY10=100)
How has the volume of the hospital's outpatient visits changed
compared to FY10, and how does this compare to the hospital's peer
cohort median? (FY10=100)
FY
What was the hospital's net inpatient service revenue per case mix
adjusted discharge between FY10 and FY14, and how does this
compare to the hospital's peer cohort median?
2011 2012 20132010 2014
Uti
lizat
ion
-28.1%
-9.4%
65707580859095
100105110115120125130135140
2010 2011 2012 2013 2014
FY14 Inpatient Discharges = 6,025
-3.6%
65707580859095
100105110115120125130135140
2010 2011 2012 2013 2014
FY14 Outpatient Visits = 64,410
Pat
ien
t R
even
ue
Tre
nd
s
Hospital
Cohort Median
$2,000
$6,000
$10,000
$14,000
$18,000
$22,000
2010 2011 2012 2013 2014
-13.5%
+11.2%
65707580859095
100105110115120125130135140
2010 2011 2012 2013 2014
FY14 Outpatient Revenue = $57 M
Fin
anci
al P
erfo
rman
ce
2.3%
7.7%
2.8% 5.3%
-10%
0%
10%
2010 2011 2012 2013 2014
Tot
al
1.2%
7.7%
1.5% 4.5%
-10%
0%
10%
Ope
ratin
g
-44.2% -46.8%
November 2015

2014 Hospital Profile
Overview / Size Payer Mix
Hospital System Affiliation: Public Payer Mix:
Change in Ownership (FY10-FY14): CY14 Commercial Payer Price Level:
Total Staffed Beds: Top 3 Commercial Payers:
% Occupancy:
Special Public Funding:
Financial Change FY13-FY14:
Adjusted‡ Cost per Discharge: Emergency Department Visits in FY14:
Inpatient NPSR per CMAD: Change FY13-FY14:
Outpatient Visits in FY14:
For descriptions of the metrics, please see the technical appendix.
Hospital (1,968) = 1% of total regional discharges - - -
Total Surplus (Loss) in FY14:
Inpatient:Outpatient Revenue in FY14: 23%:77%
Outpatient Revenue in FY14: $30,037,959
7.2%
Total Revenue in FY14:
$3,157,161
$49,268,169
Change FY13-FY14:
What proportion of adult patient discharges from this hospital resulted
in a readmission at any hospital within 30 days, and how does this
compare to the state average?
What were the most common inpatient cases (DRGs) treated at the
hospital in FY14? What proportion of the region’s cases did this
hospital treat for each service?
13.7%
37th Percentile
How many central line-associated blood stream infections (CLABSI),
catheter-associated urinary tract infections (CAUTI), and surgical site
infections (SSI) after colon surgery did patients get at this hospital
compared to what was expected based on the hospital's characteristics
and case mix?
-2.1%Change FY11-FY13 (percentage points):
Early Elective Deliveries Rate (Jan 2014-Jun 2015):
1,968Inpatient Discharges in FY14:
7.6%
15,409
Harvard Pilgrim Health Care
Quality
Readmission Rate in FY13:
Utilization
Change FY13-FY14: 7.2%
48,777
Where did most of the hospital's inpatients reside? What proportion of
each community's total discharges was attributed to this hospital?
Not Applicable
11.5%
0.80, < cohort avg. (0.85); < statewide (1.00)
Change FY13-FY14:
NASHOBA VALLEY MEDICAL CENTER
$9,599
Trauma Center Designation:
$9,398
Nashoba Valley Medical Center is a small, for-profit community-Disproportionate Share Hospital (DSH) located in the Northeastern Massachusetts region.
It did not qualify for DSH status in FY13 and was a member of the community hospital cohort. It is a member of the Steward Health Care System. Inpatient
discharges at the hospital increased 10.3% from FY10 to FY14, compared to a median decrease of 9.4% among peer cohort hospitals. Nashoba Valley
Medical Center had 61.5% fewer outpatient visits in FY14 than in FY10, compared to 3.6% fewer at the median of its cohort. The hospital earned its
largest profit and highest total margin of the five-year period in FY14, with a total margin of 6.4%, higher than the median total margin in its cohort.
59.9%, < cohort avg. (66%)
63.3% (DSH* Hospital)
Tufts Associated Health Maintenance Org.
42, among the smaller acute hospitals
Steward Health Care System
Blue Cross Blue Shield of Massachusetts
Steward Health Care - 2011
ICBθ
Ayer, MA
Community, Disproportionate Share Hospital
Case Mix Index:
Northeastern Massachusetts
Not Applicable
-0.8%
At
a G
lan
ce
Ser
vice
s
3%
1%
3%
2%
2%
3%
3%
15%
3%
4%
0% 20% 40% 60% 80% 100%
NBact Gastro, Naus, Vom (39)
Sepsis & Dissem Inf (41)
Diverticulitis/osis (45)
Card Arrth & Cond Dis (67)
Cellulitis, Oth Bact Skn Inf (68)
Kidney & UT Infections (77)
Other Pneumonia (107)
Org Mental Hlth Disturb (119)
Heart Failure (127)
COPD (145)
Discharges by DRG
of regional discharges were treated at this hospital in FY14
1%
3%
19%
8%
12%
23% 26%
27%
27%
35%
0% 20% 40% 60% 80% 100%
Fitchburg MA (53)
Westford MA (56)
Harvard MA (67)
Lunenburg MA (83)
Littleton MA (97)
Townsend MA (142)
Shirley MA (183)
Groton MA (212)
Pepperell MA (249)
Ayer MA (364)
Discharges by Community
Qu
alit
y
15.9%
13.7%
15.9%
15.0%
0%
5%
10%
15%
20%
25%
2011 2013
0
1
2
3CLABSI CAUTI SSI: Colon Surgery
of community discharges were treated at this hospital in FY14
Lower is Better
Lower is Better
Data is not available for these measures State Average
C50

Key:
Hospital
Cohort: Community, Disproportionate Share Hospital Peer Cohort
For descriptions of the metrics, please see the technical appendix.
17$ 45$ Total Revenue
‡ Costs were adjusted to exclude direct medical education costs and physician compensation.
θ For more information on Infrastructure and Capacity Building (ICB) special funding, please contact the
Massachusetts Executive Office of Health and Human Services (EOHHS).
17$ 46$ 40$
* Disproportionate Share Hospitals (DSH) receive a minimum of 63% of gross patient service revenue from public
payers.
17$ 44$ Operating Revenue
0$ 0$ 0$
Total Costs
Total Profit (Loss) (0.8)$ (0.2)$ (1.6)$ 0.1$ 3.2$
46$ 46$
49$
Non-Operating
Revenue
49$ 40$ 45$
0$ 0$
44$ 40$
How has the hospital's total outpatient revenue changed compared to
FY10, and how does this compare to the hospital's peer cohort
median? (FY10=100)
2014 HOSPITAL PROFILE: NASHOBA VALLEY MEDICAL CENTER
What were the hospital's total margin and operating margins between
FY10 and FY14, and how do these compare to the hospital's peer
cohort medians?Revenue, Cost, & Profit/Loss (in millions)
How have the hospital's total revenue and costs changed between
FY10 and FY14?
How has the volume of the hospital's inpatient discharges changed
compared to FY10, and how does this compare to the hospital's peer
cohort median? (FY10=100)
How has the volume of the hospital's outpatient visits changed
compared to FY10, and how does this compare to the hospital's peer
cohort median? (FY10=100)
FY
What was the hospital's net inpatient service revenue per case mix
adjusted discharge between FY10 and FY14, and how does this
compare to the hospital's peer cohort median?
2011 2012 20132010 2014
Uti
lizat
ion
+10.3%
-9.4%
65707580859095
100105110115120125130135140
2010 2011 2012 2013 2014
FY14 Inpatient Discharges = 1,968
-3.6%
65707580859095
100105110115120125130135140
2010 2011 2012 2013 2014
FY14 Outpatient Visits = 48,777
Pat
ien
t R
even
ue
Tre
nd
s
Hospital
Cohort Median
$2,000
$6,000
$10,000
$14,000
$18,000
$22,000
2010 2011 2012 2013 2014
-10.5%
+11.2%
65707580859095
100105110115120125130135140
2010 2011 2012 2013 2014
FY14 Outpatient Revenue = $30 M
Fin
anci
al P
erfo
rman
ce
-1.8%
6.4%
2.8% 5.3%
-10%
0%
10%
2010 2011 2012 2013 2014
Tot
al
-1.8%
6.4%
1.5% 4.5%
-10%
0%
10%
Ope
ratin
g
-78.3% -64.8% -64.1% -61.5%
November 2015

2014 Hospital Profile
Overview / Size Payer Mix
Hospital System Affiliation: Public Payer Mix:
Change in Ownership (FY10-FY14): CY14 Commercial Payer Price Level:
Total Staffed Beds: Top 3 Commercial Payers:
% Occupancy:
Special Public Funding:
Financial Change FY13-FY14:
Adjusted‡ Cost per Discharge: Emergency Department Visits in FY14:
Inpatient NPSR per CMAD: Change FY13-FY14:
Outpatient Visits in FY14:
For descriptions of the metrics, please see the technical appendix.
NORTH SHORE MEDICAL CENTER
$13,457
Trauma Center Designation:
$11,977
North Shore Medical Center is a large, non-profit community-Disproportionate Share Hospital (DSH) located in the Northeastern Massachusetts region. It
is a member of Partners HealthCare System. Inpatient discharges decreased by 13.1% from FY10 to FY14, compared to a median decrease of 9.4% at
peer cohort hospitals during that time. Outpatient visits decreased by 15.3% from FY10 to FY14, compared to the median decrease of 3.6% among cohort
hospitals. The hospital was unprofitable each year from FY10 to FY14, with a total margin of -5.3% in FY14, compared to the 5.3% median total margin of
peer hospitals.
58.1%, < cohort avg. (66%)
70.5% (DSH* Hospital)
Harvard Pilgrim Health Care
431, 8th largest acute hospital
Partners HealthCare System
Blue Cross Blue Shield of Massachusetts
Not Applicable
Not Applicable
Salem, MA & Lynn, MA
Community, Disproportionate Share Hospital
Case Mix Index:
Northeastern Massachusetts
Adult: Level 3
-5.0%
What were the most common inpatient cases (DRGs) treated at the
hospital in FY14? What proportion of the region’s cases did this
hospital treat for each service?
14.4%
62nd Percentile
How many central line-associated blood stream infections (CLABSI),
catheter-associated urinary tract infections (CAUTI), and surgical site
infections (SSI) after colon surgery did patients get at this hospital
compared to what was expected based on the hospital's characteristics
and case mix?
0.0%
Not Available
Change FY11-FY13 (percentage points):
Early Elective Deliveries Rate (Jan 2014-Jun 2015):
18,474Inpatient Discharges in FY14:
-7.0%
73,117
Tufts Associated Health Maintenance Org.
Quality
Readmission Rate in FY13:
Utilization
Change FY13-FY14: -6.4%
107,903
Where did most of the hospital's inpatients reside? What proportion of
each community's total discharges was attributed to this hospital?
4.8%
0.91, > cohort avg. (0.85); < statewide (1.00)
Change FY13-FY14:
Total Surplus (Loss) in FY14:
Inpatient:Outpatient Revenue in FY14: 39%:61%
Outpatient Revenue in FY14: $191,121,833
-2.5%
Total Revenue in FY14:
($22,158,000)
$415,999,000
Change FY13-FY14:
Hospital (18,474) = 13% of total regional discharges - - -
What proportion of adult patient discharges from this hospital resulted
in a readmission at any hospital within 30 days, and how does this
compare to the state average?
At
a G
lan
ce
Ser
vice
s
15%
16%
16%
19%
13%
17%
14%
16%
11%
10%
0% 20% 40% 60% 80% 100%
Card Arrth & Cond Dis (441)
Knee Joint Replacement (466)
Bipolar Disorders (479)
Kidney & UT Infections (500)
Sepsis & Dissem Inf (601)
COPD (608)
Heart Failure (629)
Other Pneumonia (634)
Vaginal Delivery (825)
Normal Neonate Birth (1157)
Discharges by DRG
of regional discharges were treated at this hospital in FY14
57%
24%
8%
17%
17%
53%
52%
39%
56%
60%
0% 20% 40% 60% 80% 100%
Nahant MA (228)
Lynnfield MA (299)
Beverly MA (463)
Saugus MA (584)
Danvers MA (643)
Swampscott MA (686)
Marblehead MA (875)
Peabody MA (2,729)
Salem MA (2,796)
Lynn MA (7,206)
Discharges by Community
Qu
alit
y
14.4% 14.4%
15.9% 15.0%
0%
5%
10%
15%
20%
25%
2011 2013
0
1
2
3CLABSI CAUTI SSI: Colon Surgery
of community discharges were treated at this
hospital in FY14
Lower is Better
Lower is Better
State Average
C51
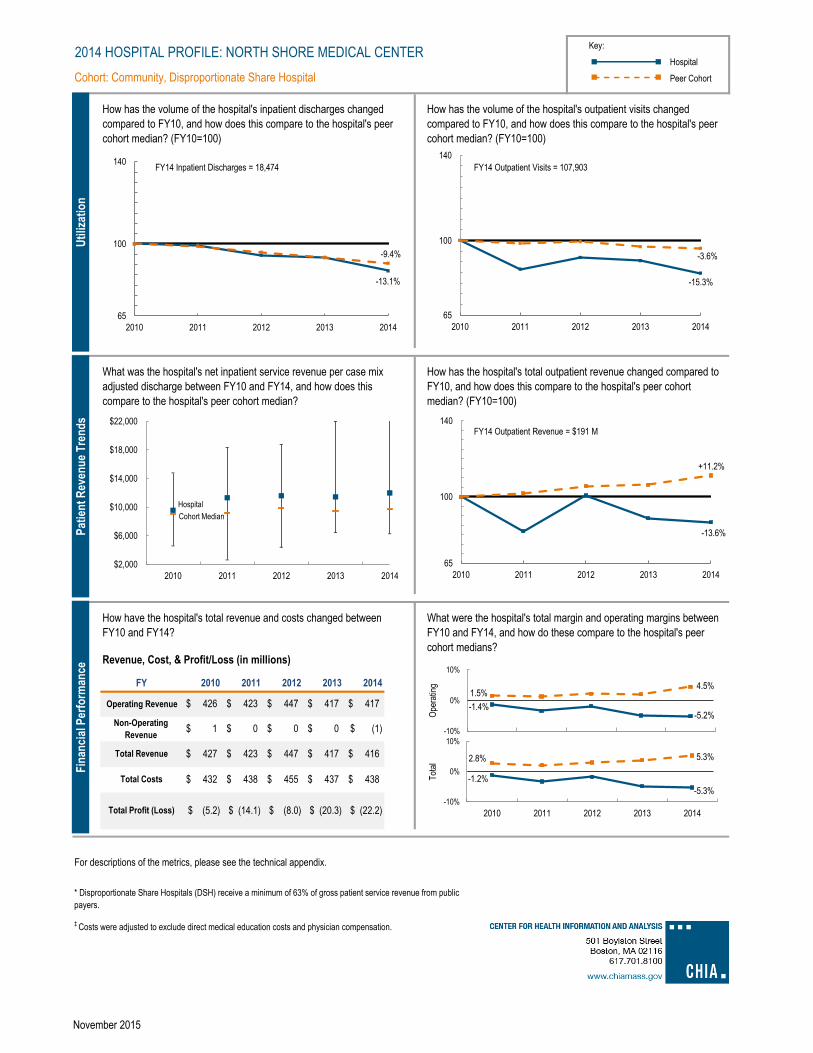
Key:
Hospital
Cohort: Community, Disproportionate Share Hospital Peer Cohort
For descriptions of the metrics, please see the technical appendix.
2014 HOSPITAL PROFILE: NORTH SHORE MEDICAL CENTER
What were the hospital's total margin and operating margins between
FY10 and FY14, and how do these compare to the hospital's peer
cohort medians?Revenue, Cost, & Profit/Loss (in millions)
How have the hospital's total revenue and costs changed between
FY10 and FY14?
How has the volume of the hospital's inpatient discharges changed
compared to FY10, and how does this compare to the hospital's peer
cohort median? (FY10=100)
How has the volume of the hospital's outpatient visits changed
compared to FY10, and how does this compare to the hospital's peer
cohort median? (FY10=100)
FY
What was the hospital's net inpatient service revenue per case mix
adjusted discharge between FY10 and FY14, and how does this
compare to the hospital's peer cohort median?
2011 2012 20132010 2014
426$
0$ 1$
447$ 417$
How has the hospital's total outpatient revenue changed compared to
FY10, and how does this compare to the hospital's peer cohort
median? (FY10=100)
423$ 427$ Total Revenue
‡ Costs were adjusted to exclude direct medical education costs and physician compensation.
438$ 455$ 437$
423$ 447$ Operating Revenue
(1)$ 0$ 0$
Total Costs
Total Profit (Loss) (5.2)$ (14.1)$ (8.0)$ (20.3)$ (22.2)$
438$ 432$
416$
* Disproportionate Share Hospitals (DSH) receive a minimum of 63% of gross patient service revenue from public
payers.
Non-Operating
Revenue
417$ 417$
Uti
lizat
ion
-13.1%
-9.4%
65707580859095
100105110115120125130135140
2010 2011 2012 2013 2014
FY14 Inpatient Discharges = 18,474
-15.3%
-3.6%
65707580859095
100105110115120125130135140
2010 2011 2012 2013 2014
FY14 Outpatient Visits = 107,903
Pat
ien
t R
even
ue
Tre
nd
s
Hospital
Cohort Median
$2,000
$6,000
$10,000
$14,000
$18,000
$22,000
2010 2011 2012 2013 2014
-13.6%
+11.2%
65707580859095
100105110115120125130135140
2010 2011 2012 2013 2014
FY14 Outpatient Revenue = $191 M
Fin
anci
al P
erfo
rman
ce
-1.2%
-5.3%
2.8% 5.3%
-10%
0%
10%
2010 2011 2012 2013 2014
Tot
al
-1.4% -5.2%
1.5% 4.5%
-10%
0%
10%
Ope
ratin
g
November 2015

2014 Hospital Profile
Overview / Size Payer Mix
Hospital System Affiliation: Public Payer Mix:
Change in Ownership (FY10-FY14): CY14 Commercial Payer Price Level:
Total Staffed Beds: Top 3 Commercial Payers:
% Occupancy:
Special Public Funding:
Financial Change FY13-FY14:
Adjusted‡ Cost per Discharge: Emergency Department Visits in FY14:
Inpatient NPSR per CMAD: Change FY13-FY14:
Outpatient Visits in FY14:
For descriptions of the metrics, please see the technical appendix.
Hospital (4,419) = 6% of total regional discharges - - -
Total Surplus (Loss) in FY14:
Inpatient:Outpatient Revenue in FY14: 41%:59%
Outpatient Revenue in FY14: $32,144,691
-5.7%
Total Revenue in FY14:
($39,096,126)
$68,554,166
Change FY13-FY14:
What proportion of adult patient discharges from this hospital resulted
in a readmission at any hospital within 30 days, and how does this
compare to the state average?
What were the most common inpatient cases (DRGs) treated at the
hospital in FY14? What proportion of the region’s cases did this
hospital treat for each service?
14.8%
20th Percentile
How many central line-associated blood stream infections (CLABSI),
catheter-associated urinary tract infections (CAUTI), and surgical site
infections (SSI) after colon surgery did patients get at this hospital
compared to what was expected based on the hospital's characteristics
and case mix?
-2.1%Change FY11-FY13 (percentage points):
Early Elective Deliveries Rate (Jan 2014-Jun 2015):
4,419Inpatient Discharges in FY14:
-8.0%
32,521
Tufts Associated Health Maintenance Org.
Quality
Readmission Rate in FY13:
Utilization
Change FY13-FY14: -15.0%
46,899
Where did most of the hospital's inpatients reside? What proportion of
each community's total discharges was attributed to this hospital?
Not Available
-1.7%
0.86, > cohort avg. (0.85); < statewide (1.00)
Change FY13-FY14:
QUINCY MEDICAL CENTER
$11,883
Trauma Center Designation:
$10,139
Quincy Medical Center closed at the end of 2014, but this profile contains full FY14 data for Quincy Medical Center. Quincy Medical Center was a for-profit
community-Disproportionate Share Hospital (DSH) located in the Metro South region. It was among the smaller acute hospitals in Massachusetts and a
member of Steward Health Care System.
71.9%, > cohort avg. (65%)
74.7% (DSH* Hospital)
Harvard Pilgrim Health Care
90, among the smaller acute hospitals
Steward Health Care System
Blue Cross Blue Shield of Massachusetts
Steward Health Care - 2011
ICBθ
Quincy, MA
Community, Disproportionate Share Hospital
Case Mix Index:
Metro South
Not Applicable
-9.3%
At
a G
lan
ce
Ser
vice
s
7%
34%
4%
13%
7%
11%
11%
7%
9%
10%
0% 20% 40% 60% 80% 100%
Alcohol Abuse & Dependence (101)
Org Mental Hlth Disturb (108)
Sepsis & Dissem Inf (111)
Pulm Edema & Resp Failure (130)
COPD (149)
Kidney & UT Infections (153)
Knee Joint Replacement (154)
Heart Failure (161)
Other Pneumonia (164)
Cellulitis, Oth Bact Skn Inf (165)
Discharges by DRG
of regional discharges were treated at this hospital in FY14
0%
0%
2%
1%
7%
6%
5%
6%
8%
24%
0% 20% 40% 60% 80% 100%
Dorchester MA (41)
Boston MA (43)
Hingham MA (44)
Randolph MA (61)
North Weymouth MA (72)
Hull MA (79)
East Weymouth MA (90)
Weymouth MA (139)
Braintree MA (374)
Quincy MA (2,803)
Discharges by Community
Qu
alit
y
17.0%
14.8%
15.9% 15.0%
0%
5%
10%
15%
20%
25%
2011 2013
0
1
2
3CLABSI CAUTI SSI: Colon Surgery
Data is not available for these measures
of community discharges were treated at this hospital in FY14
Lower is Better
Lower is Better
State Average
C52

Key:
Hospital
Cohort: Community, Disproportionate Share Hospital Peer Cohort
For descriptions of the metrics, please see the technical appendix.
99$ 104$ Total Revenue
‡ Costs were adjusted to exclude direct medical education costs and physician compensation.
θ For more information on Infrastructure and Capacity Building (ICB) special funding, please contact the
Massachusetts Executive Office of Health and Human Services (EOHHS).
117$ 104$ 98$
* Disproportionate Share Hospitals (DSH) receive a minimum of 63% of gross patient service revenue from public
payers.
100$ 99$ Operating Revenue
0$ 1$ -$
Total Costs
Total Profit (Loss) (5.9)$ (18.5)$ (5.4)$ (19.7)$ (39.1)$
108$ 109$
69$
Non-Operating
Revenue
69$ 78$ 104$
(1)$ (0)$
99$ 79$
How has the hospital's total outpatient revenue changed compared to
FY10, and how does this compare to the hospital's peer cohort
median? (FY10=100)
2014 HOSPITAL PROFILE: QUINCY MEDICAL CENTER
What were the hospital's total margin and operating margins between
FY10 and FY14, and how do these compare to the hospital's peer
cohort medians?Revenue, Cost, & Profit/Loss (in millions)
How have the hospital's total revenue and costs changed between
FY10 and FY14?
How has the volume of the hospital's inpatient discharges changed
compared to FY10, and how does this compare to the hospital's peer
cohort median? (FY10=100)
How has the volume of the hospital's outpatient visits changed
compared to FY10, and how does this compare to the hospital's peer
cohort median? (FY10=100)
FY
What was the hospital's net inpatient service revenue per case mix
adjusted discharge between FY10 and FY14, and how does this
compare to the hospital's peer cohort median?
2011 2012 20132010 2014
Uti
lizat
ion
-27.2%
-9.4%
65707580859095
100105110115120125130135140
2010 2011 2012 2013 2014
FY14 Inpatient Discharges = 4,419
-24.1%
-3.6%
65707580859095
100105110115120125130135140
2010 2011 2012 2013 2014
FY14 Outpatient Visits = 46,899
Pat
ien
t R
even
ue
Tre
nd
s
Hospital
Cohort Median
$2,000
$6,000
$10,000
$14,000
$18,000
$22,000
2010 2011 2012 2013 2014
-33.6%
+11.2%
65707580859095
100105110115120125130135140
2010 2011 2012 2013 2014
FY14 Outpatient Revenue = $32 M
Fin
anci
al P
erfo
rman
ce
-5.7%
2.8% 5.3%
-10%
0%
10%
2010 2011 2012 2013 2014
Tot
al
-5.6%
1.5%
4.5%
-10%
0%
10%
Ope
ratin
g
-17.5%
-18.8%
-26.1% -57.0%
-57.0% -25.1%
November 2015

2014 Hospital Profile
Overview / Size Payer Mix
Hospital System Affiliation: Public Payer Mix:
Change in Ownership (FY10-FY14): CY14 Commercial Payer Price Level:
Total Staffed Beds: Top 3 Commercial Payers:
% Occupancy:
Special Public Funding:
Financial Change FY13-FY14:
Adjusted‡ Cost per Discharge: Emergency Department Visits in FY14:
Inpatient NPSR per CMAD: Change FY13-FY14:
Outpatient Visits in FY14:
For descriptions of the metrics, please see the technical appendix.
Hospital (12,472) = 18% of total regional discharges - - -
Total Surplus (Loss) in FY14:
Inpatient:Outpatient Revenue in FY14: 37%:63%
Outpatient Revenue in FY14: $116,424,310
16.8%
Total Revenue in FY14:
$25,655,699
$245,853,569
Change FY13-FY14:
What proportion of adult patient discharges from this hospital resulted
in a readmission at any hospital within 30 days, and how does this
compare to the state average?
What were the most common inpatient cases (DRGs) treated at the
hospital in FY14? What proportion of the region’s cases did this
hospital treat for each service?
17.5%
42nd Percentile
How many central line-associated blood stream infections (CLABSI),
catheter-associated urinary tract infections (CAUTI), and surgical site
infections (SSI) after colon surgery did patients get at this hospital
compared to what was expected based on the hospital's characteristics
and case mix?
-0.7%
0.0%
Change FY11-FY13 (percentage points):
Early Elective Deliveries Rate (Jan 2014-Jun 2015):
12,472Inpatient Discharges in FY14:
-4.0%
62,643
Tufts Associated Health Maintenance Org.
Quality
Readmission Rate in FY13:
Utilization
Change FY13-FY14: 6.7%
105,633
Where did most of the hospital's inpatients reside? What proportion of
each community's total discharges was attributed to this hospital?
-3.9%
0.86, > cohort avg. (0.85); < statewide (1.00)
Change FY13-FY14:
SIGNATURE HEALTHCARE BROCKTON HOSPITAL
$8,806
Trauma Center Designation:
$10,276
Signature Healthcare Brockton Hospital is a non-profit community-Disproportionate Share Hospital (DSH) located in the Metro South region. It is among
the larger acute hospitals in Massachusetts. The hospital experienced a 14.7% decrease in inpatient discharges from FY10 to FY14, compared to a
median decrease of 9.4% among peer cohort hospitals. Signature Healthcare Brockton Hospital was profitable each year from FY10 to FY14, with a total
margin of 10.4% in FY14, higher than the 5.3% median total margin of its peer cohort.
60.7%, < cohort avg. (66%)
72.0% (DSH* Hospital)
Harvard Pilgrim Health Care
245, among the larger acute hospitals
Not Applicable
Blue Cross Blue Shield of Massachusetts
Not Applicable
CHART^, DSTIη
Brockton, MA
Community, Disproportionate Share Hospital
Case Mix Index:
Metro South
Not Applicable
4.1%
At
a G
lan
ce
Ser
vice
s
19%
12%
19%
14%
17%
76%
100%
21%
16%
16%
0% 20% 40% 60% 80% 100%
Card Arrth & Cond Dis (257)
Heart Failure (272)
Cellulitis, Oth Bact Skn Inf (323)
Cesarean Delivery (330)
COPD (351)
Bipolar Disorders (361)
Rehabilitation (592)
Sepsis & Dissem Inf (649)
Vaginal Delivery (666)
Normal Neonate Birth (940)
Discharges by DRG
of regional discharges were treated at this hospital in FY14
24%
10%
4%
12%
9%
29%
24%
33%
27%
37%
0% 20% 40% 60% 80% 100%
Hanson MA (243)
Middleboro MA (286)
Taunton MA (286)
Rockland MA (311)
Stoughton MA (345)
Whitman MA (501)
Abington MA (514)
East Bridgewater MA (567)
Bridgewater MA (673)
Brockton MA (6,107)
Discharges by Community
Qu
alit
y
18.2% 17.5%
15.9% 15.0%
0%
5%
10%
15%
20%
25%
2011 2013
0
1
2
3CLABSI CAUTI SSI: Colon Surgery
of community discharges were treated at this hospital in FY14
Lower is Better
Lower is Better
State Average
C53

Key:
Hospital
Cohort: Community, Disproportionate Share Hospital Peer Cohort
For descriptions of the metrics, please see the technical appendix.
220$ 219$ Total Revenue
‡ Costs were adjusted to exclude direct medical education costs and physician compensation.
^ For more information on Community Hospital Acceleration, Revitalization and Transformation (CHART) special
funding, please contact the Health Policy Commission (HPC).
η For more information on Delivery System Transformation Initiative (DSTI) special funding, please contact the
Massachusetts Executive Office of Health and Human Service (EOHHS).
204$ 214$ 207$
* Disproportionate Share Hospitals (DSH) receive a minimum of 63% of gross patient service revenue from public
payers.
218$ 238$ Operating Revenue
8$ 3$ 2$
Total Costs
Total Profit (Loss) 19.7$ 16.1$ 25.6$ 19.6$ 25.7$
220$ 200$
246$
Non-Operating
Revenue
238$ 224$ 218$
2$ 1$
240$ 227$
How has the hospital's total outpatient revenue changed compared to
FY10, and how does this compare to the hospital's peer cohort
median? (FY10=100)
2014 HOSPITAL PROFILE: SIGNATURE HEALTHCARE BROCKTON HOSPITAL
What were the hospital's total margin and operating margins between
FY10 and FY14, and how do these compare to the hospital's peer
cohort medians?Revenue, Cost, & Profit/Loss (in millions)
How have the hospital's total revenue and costs changed between
FY10 and FY14?
How has the volume of the hospital's inpatient discharges changed
compared to FY10, and how does this compare to the hospital's peer
cohort median? (FY10=100)
How has the volume of the hospital's outpatient visits changed
compared to FY10, and how does this compare to the hospital's peer
cohort median? (FY10=100)
FY
What was the hospital's net inpatient service revenue per case mix
adjusted discharge between FY10 and FY14, and how does this
compare to the hospital's peer cohort median?
2011 2012 20132010 2014
Uti
lizat
ion
-14.7%
-9.4%
65707580859095
100105110115120125130135140
2010 2011 2012 2013 2014
FY14 Inpatient Discharges = 12,472
+6.7%
-3.6%
65707580859095
100105110115120125130135140
2010 2011 2012 2013 2014
FY14 Outpatient Visits = 105,633
Pat
ien
t R
even
ue
Tre
nd
s
Hospital
Cohort Median
$2,000
$6,000
$10,000
$14,000
$18,000
$22,000
2010 2011 2012 2013 2014
+12.5%
+11.2%
65707580859095
100105110115120125130135140
2010 2011 2012 2013 2014
FY14 Outpatient Revenue = $116 M
Fin
anci
al P
erfo
rman
ce
9.0%
2.8% 5.3%
-10%
0%
10%
2010 2011 2012 2013 2014
Tot
al
8.3% 7.1%
1.5% 4.5%
-10%
0%
10%
Ope
ratin
g
10.4%
November 2015

2014 Hospital Profile
Overview / Size Payer Mix
Hospital System Affiliation: Public Payer Mix:
Change in Ownership (FY10-FY14): CY14 Commercial Payer Price Level:
Total Staffed Beds: Top 3 Commercial Payers:
% Occupancy:
Special Public Funding:
Financial Change FY13-FY14:
Adjusted‡ Cost per Discharge: Emergency Department Visits in FY14:
Inpatient NPSR per CMAD: Change FY13-FY14:
Outpatient Visits in FY14:
For descriptions of the metrics, please see the technical appendix.
-2.9%
0.92, > cohort avg. (0.85); < statewide (1.00)
Change FY13-FY14:
SOUTHCOAST HOSPITALS GROUP
$9,328
Trauma Center Designation:
$10,193
Southcoast Hospitals Group is a large, non-profit community-Disproportionate Share Hospital (DSH) group located in the Southcoast region. Southcoast
Hospitals Group has three campuses across Southeastern Massachusetts: Charlton Memorial Hospital, St. Luke’s Hospital, and Tobey Hospital
campuses. Southcoast Hospitals Group formed an affiliation with Boston Children’s Hospital starting in 2012. Southcoast Hospitals Group was profitable
each year from FY10 to FY14, with a total margin of 7.2% in FY14, its highest in the five-year period, compared to the median 5.3% total margin in its peer
cohort.
89.9%, > cohort avg. (66%)
72.6% (DSH* Hospital)
Harvard Pilgrim Health Care
529, 6th largest acute hospital
Not Applicable
Blue Cross Blue Shield of Massachusetts
Not Applicable
CHART^
Fall River, New Bedford, & Wareham, MA
Community, Disproportionate Share Hospital
Case Mix Index:
Southcoast
Not Applicable
0.7%
16.7%
53rd Percentile
How many central line-associated blood stream infections (CLABSI),
catheter-associated urinary tract infections (CAUTI), and surgical site
infections (SSI) after colon surgery did patients get at this hospital
compared to what was expected based on the hospital's characteristics
and case mix?
-0.8%
Not Available
Change FY11-FY13 (percentage points):
Early Elective Deliveries Rate (Jan 2014-Jun 2015):
38,485Inpatient Discharges in FY14:
-4.5%
156,391
Tufts Associated Health Maintenance Org.
Quality
Readmission Rate in FY13:
Utilization
Change FY13-FY14: 0.2%
896,498
Where did most of the hospital's inpatients reside? What proportion of
each community's total discharges was attributed to this hospital?
Total Surplus (Loss) in FY14:
Inpatient:Outpatient Revenue in FY14: 44%:56%
Outpatient Revenue in FY14: $344,566,436
5.2%
Total Revenue in FY14:
$53,552,206
$745,651,811
Change FY13-FY14:
What proportion of adult patient discharges from this hospital resulted
in a readmission at any hospital within 30 days, and how does this
compare to the state average?
What were the most common inpatient cases (DRGs) treated at the
hospital in FY14? What proportion of the region’s cases did this
hospital treat for each service?
Hospital (38,485) = 84% of total regional discharges - - -
At
a G
lan
ce
Ser
vice
s
82%
85%
80%
100%
81%
77%
83%
88%
100%
100%
0% 20% 40% 60% 80% 100%
Kidney & UT Infections (808)
Card Arrth & Cond Dis (846)
Cellulitis, Oth Bact Skn Inf (982)
Cesarean Delivery (1108)
Heart Failure (1180)
Other Pneumonia (1196)
COPD (1411)
Sepsis & Dissem Inf (2146)
Vaginal Delivery (2230)
Normal Neonate Birth (3091)
Discharges by DRG
of regional discharges were treated at this
hospital in FY14
79%
64%
79%
65%
70%
77%
70%
80%
58%
84%
0% 20% 40% 60% 80% 100%
Acushnet MA (870)
Swansea MA (1,039)
South Dartmouth MA (1,062)
Westport MA (1,092)
Wareham MA (1,305)
North Dartmouth MA (1,501)
Somerset MA (1,566)
Fairhaven MA (1,815)
Fall River MA (7,844)
New Bedford MA (12,624)
Discharges by Community
Qu
alit
y 17.6% 16.7%
15.9% 15.0%
0%
5%
10%
15%
20%
25%
2011 2013
0
1
2
3CLABSI CAUTI SSI: Colon Surgery
of community discharges were treated at this hospital in FY14
Lower is Better
Lower is Better
State Average
C54

Key:
Hospital
Cohort: Community, Disproportionate Share Hospital Peer Cohort
For descriptions of the metrics, please see the technical appendix.
FY
What was the hospital's net inpatient service revenue per case mix
adjusted discharge between FY10 and FY14, and how does this
compare to the hospital's peer cohort median?
2011 2012 20132010 2014
How has the hospital's total outpatient revenue changed compared to
FY10, and how does this compare to the hospital's peer cohort
median? (FY10=100)
2014 HOSPITAL PROFILE: SOUTHCOAST HOSPITALS GROUP
What were the hospital's total margin and operating margins between
FY10 and FY14, and how do these compare to the hospital's peer
cohort medians?Revenue, Cost, & Profit/Loss (in millions)
How have the hospital's total revenue and costs changed between
FY10 and FY14?
How has the volume of the hospital's inpatient discharges changed
compared to FY10, and how does this compare to the hospital's peer
cohort median? (FY10=100)
How has the volume of the hospital's outpatient visits changed
compared to FY10, and how does this compare to the hospital's peer
cohort median? (FY10=100)
672$ 703$ Operating Revenue
15$ 14$ 7$
Total Costs
Total Profit (Loss) 25.0$ 34.0$ 45.7$ 22.4$ 53.6$
692$ 624$
746$
Non-Operating
Revenue
730$ 712$ 643$
11$ 6$
710$ 726$ 682$ 649$ Total Revenue
‡ Costs were adjusted to exclude direct medical education costs and physician compensation.
^ For more information on Community Hospital Acceleration, Revitalization and Transformation (CHART) special
funding, please contact the Health Policy Commission (HPC).
648$ 664$ 704$
* Disproportionate Share Hospitals (DSH) receive a minimum of 63% of gross patient service revenue from public
payers.
Uti
lizat
ion
-5.8%
-9.4%
65707580859095
100105110115120125130135140
2010 2011 2012 2013 2014
FY14 Inpatient Discharges = 38,485
-8.2%
-3.6%
65707580859095
100105110115120125130135140
2010 2011 2012 2013 2014
FY14 Outpatient Visits = 896,498
Pat
ien
t R
even
ue
Tre
nd
s
Hospital
Cohort Median
$2,000
$6,000
$10,000
$14,000
$18,000
$22,000
2010 2011 2012 2013 2014
+15.7%
+11.2%
65707580859095
100105110115120125130135140
2010 2011 2012 2013 2014
FY14 Outpatient Revenue = $345 M
Fin
anci
al P
erfo
rman
ce
3.9% 7.2%
2.8% 5.3%
-10%
0%
10%
2010 2011 2012 2013 2014
Tot
al
3.0% 5.1%
1.5% 4.5%
-10%
0%
10%
Ope
ratin
g
November 2015

2014 Hospital Profile
Overview / Size Payer Mix
Hospital System Affiliation: Public Payer Mix:
Change in Ownership (FY10-FY14): CY14 Commercial Payer Price Level:
Total Staffed Beds: Top 3 Commercial Payers:
% Occupancy:
Special Public Funding:
Financial Change FY13-FY14:
Adjusted‡ Cost per Discharge: Emergency Department Visits in FY14:
Inpatient NPSR per CMAD: Change FY13-FY14:
Outpatient Visits in FY14:
For descriptions of the metrics, please see the technical appendix.
Hospital (16,730) = 24% of total regional discharges - - -
Total Surplus (Loss) in FY14:
Inpatient:Outpatient Revenue in FY14: 43%:57%
Outpatient Revenue in FY14: $101,834,087
17.8%
Total Revenue in FY14:
$19,823,479
$247,029,507
Change FY13-FY14:
What proportion of adult patient discharges from this hospital resulted
in a readmission at any hospital within 30 days, and how does this
compare to the state average?
What were the most common inpatient cases (DRGs) treated at the
hospital in FY14? What proportion of the region’s cases did this
hospital treat for each service?
15.3%
53rd Percentile
How many central line-associated blood stream infections (CLABSI),
catheter-associated urinary tract infections (CAUTI), and surgical site
infections (SSI) after colon surgery did patients get at this hospital
compared to what was expected based on the hospital's characteristics
and case mix?
-1.7%
0.0%
Change FY11-FY13 (percentage points):
Early Elective Deliveries Rate (Jan 2014-Jun 2015):
16,730Inpatient Discharges in FY14:
1.2%
55,934
Harvard Pilgrim Health Care
Quality
Readmission Rate in FY13:
Utilization
Change FY13-FY14: 13.3%
75,809
Where did most of the hospital's inpatients reside? What proportion of
each community's total discharges was attributed to this hospital?
-3.6%
0.83, < cohort avg. (0.85); < statewide (1.00)
Change FY13-FY14:
STEWARD GOOD SAMARITAN MEDICAL CENTER
$9,624
Trauma Center Designation:
$9,456
Steward Good Samaritan Medical Center is a mid-size, for-profit community-Disproportionate Share Hospital (DSH) located in the Metro South region. It is
a member of Steward Health Care System. Steward Good Samaritan had 6.1% more inpatient discharges in FY14 than in FY10, compared with a median
decrease of 9.4% among peer cohort hospitals. While outpatient visits decreased 0.9% at the hospital between FY10 and FY14, outpatient revenue grew
33.6% in that period. Steward Good Samaritan earned a profit each year in the five-year period except in FY12. It earned its highest total in FY14 at 8.0%,
above the 5.3% median total margin in its cohort.
95.1%, > cohort avg. (66%)
68.2% (DSH* Hospital)
Tufts Associated Health Maintenance Org.
205, mid-size acute hospital
Steward Health Care System
Blue Cross Blue Shield of Massachusetts
Steward Health Care - 2010
ICBθ
Brockton, MA
Community, Disproportionate Share Hospital
Case Mix Index:
Metro South
Not Applicable
13.7%
At
a G
lan
ce
Ser
vice
s
20%
16%
24%
81%
23%
14%
24%
56%
16%
96%
0% 20% 40% 60% 80% 100%
Other Pneumonia (363)
Cesarean Delivery (364)
Cellulitis, Oth Bact Skn Inf (417)
Drug/Alcohol Abuse, LAMA (507)
Heart Failure (550)
Vaginal Delivery (589)
Sepsis & Dissem Inf (745)
Alcohol Abuse & Dependence (789)
Normal Neonate Birth (897)
Opioid Abuse & Dependence (1656)
Discharges by DRG
of regional discharges were treated at this hospital in FY14
12%
22%
41%
44%
8%
44%
14%
27%
42%
34%
0% 20% 40% 60% 80% 100%
Middleboro MA (352)
East Bridgewater MA (372)
South Easton MA (432)
West Bridgewater MA (468)
Taunton MA (524)
North Easton MA (547)
Randolph MA (574)
Bridgewater MA (672)
Stoughton MA (1,690)
Brockton MA (5,615)
Discharges by Community
Qu
alit
y 17.0% 15.3% 15.9% 15.0%
0%
5%
10%
15%
20%
25%
2011 2013
0
1
2
3CLABSI CAUTI SSI: Colon Surgery
of community discharges were treated at this hospital in FY14
Lower is Better
Lower is Better
State Average
C55

Key:
Hospital
Cohort: Community, Disproportionate Share Hospital Peer Cohort
For descriptions of the metrics, please see the technical appendix.
183$ 199$ Total Revenue
‡ Costs were adjusted to exclude direct medical education costs and physician compensation.
θ For more information on Infrastructure and Capacity Building (ICB) special funding, please contact the
Massachusetts Executive Office of Health and Human Services (EOHHS).
183$ 229$ 230$
* Disproportionate Share Hospitals (DSH) receive a minimum of 63% of gross patient service revenue from public
payers.
183$ 225$ Operating Revenue
0$ 0$ 0$
Total Costs
Total Profit (Loss) 12.7$ 0.1$ (4.0)$ 4.2$ 19.8$
227$ 186$
247$
Non-Operating
Revenue
247$ 234$ 196$
0$ 2$
225$ 234$
How has the hospital's total outpatient revenue changed compared to
FY10, and how does this compare to the hospital's peer cohort
median? (FY10=100)
2014 HOSPITAL PROFILE: STEWARD GOOD SAMARITAN MEDICAL CENTER
What were the hospital's total margin and operating margins between
FY10 and FY14, and how do these compare to the hospital's peer
cohort medians?Revenue, Cost, & Profit/Loss (in millions)
How have the hospital's total revenue and costs changed between
FY10 and FY14?
How has the volume of the hospital's inpatient discharges changed
compared to FY10, and how does this compare to the hospital's peer
cohort median? (FY10=100)
How has the volume of the hospital's outpatient visits changed
compared to FY10, and how does this compare to the hospital's peer
cohort median? (FY10=100)
FY
What was the hospital's net inpatient service revenue per case mix
adjusted discharge between FY10 and FY14, and how does this
compare to the hospital's peer cohort median?
2011 2012 20132010 2014
Uti
lizat
ion
+6.1%
-9.4%
65707580859095
100105110115120125130135140
2010 2011 2012 2013 2014
FY14 Inpatient Discharges = 16,730
-0.9%
-3.6%
65707580859095
100105110115120125130135140
2010 2011 2012 2013 2014
FY14 Outpatient Visits = 75,809
Pat
ien
t R
even
ue
Tre
nd
s
Hospital
Cohort Median
$2,000
$6,000
$10,000
$14,000
$18,000
$22,000
2010 2011 2012 2013 2014
+33.6%
+11.2%
65707580859095
100105110115120125130135140
2010 2011 2012 2013 2014
FY14 Outpatient Revenue = $102 M
Fin
anci
al P
erfo
rman
ce
6.4% 8.0%
2.8% 5.3%
-10%
0%
10%
2010 2011 2012 2013 2014
Tot
al
5.3% 8.0%
1.5% 4.5%
-10%
0%
10%
Ope
ratin
g
November 2015

2014 Hospital Profile
Overview / Size Payer Mix
Hospital System Affiliation: Public Payer Mix:
Change in Ownership (FY10-FY14): CY14 Commercial Payer Price Level:
Total Staffed Beds: Top 3 Commercial Payers:
% Occupancy:
Special Public Funding:
Financial Change FY13-FY14:
Adjusted‡ Cost per Discharge: Emergency Department Visits in FY14:
Inpatient NPSR per CMAD: Change FY13-FY14:
Outpatient Visits in FY14:
For descriptions of the metrics, please see the technical appendix.
Hospital (10,505) = 8% of total regional discharges - - -
Total Surplus (Loss) in FY14:
Inpatient:Outpatient Revenue in FY14: 37%:63%
Outpatient Revenue in FY14: $91,680,253
10.3%
Total Revenue in FY14:
$10,734,190
$201,945,976
Change FY13-FY14:
What proportion of adult patient discharges from this hospital resulted
in a readmission at any hospital within 30 days, and how does this
compare to the state average?
What were the most common inpatient cases (DRGs) treated at the
hospital in FY14? What proportion of the region’s cases did this
hospital treat for each service?
13.6%
36th Percentile
How many central line-associated blood stream infections (CLABSI),
catheter-associated urinary tract infections (CAUTI), and surgical site
infections (SSI) after colon surgery did patients get at this hospital
compared to what was expected based on the hospital's characteristics
and case mix?
-1.5%
3.3%
Change FY11-FY13 (percentage points):
Early Elective Deliveries Rate (Jan 2014-Jun 2015):
10,505Inpatient Discharges in FY14:
-3.7%
46,777
Harvard Pilgrim Health Care
Quality
Readmission Rate in FY13:
Utilization
Change FY13-FY14: 6.6%
90,985
Where did most of the hospital's inpatients reside? What proportion of
each community's total discharges was attributed to this hospital?
-0.9%
0.89, > cohort avg. (0.85); < statewide (1.00)
Change FY13-FY14:
STEWARD HOLY FAMILY HOSPITAL
$8,785
Trauma Center Designation:
$9,343
Steward Holy Family Hospital is a mid-size, for-profit community-Disproportionate Share Hospital (DSH) located in the Northeastern Massachusetts region.
Merrimack Hospital, another Steward Health Care System hospital, merged with Holy Family Hospital, operating under Holy Family's license as Holy
Family Hospital at Merrimack Valley. All of the utilization information in this hospital profile includes one month of Merrimack Valley Hospital data in FY14,
as the two campuses merged. Holy Family was profitable three of the five years, and had a total margin of 5.3% in FY14, consistent with the median of
cohort hospitals.
71.4%, > cohort avg. (66%)
67.2% (DSH* Hospital)
Tufts Associated Health Maintenance Org.
189, mid-size acute hospital
Steward Health Care System
Blue Cross Blue Shield of Massachusetts
Steward Health Care - 2010
ICBθ
Methuen, MA
Community, Disproportionate Share Hospital
Case Mix Index:
Northeastern Massachusetts
Not Applicable
12.7%
At
a G
lan
ce
Ser
vice
s
39% 28%
8%
10% 11%
7%
11%
23%
31%
8%
0% 20% 40% 60% 80% 100%
Org Mental Hlth Disturb (312)
Schizophrenia (320)
Sepsis & Dissem Inf (377)
Other Pneumonia (399)
Cesarean Delivery (441)
Vaginal Delivery (509)
Heart Failure (520)
Bipolar Disorders (675)
Maj Dep& Oth/Unsp Psychoses (687)
Normal Neonate Birth (881)
Discharges by DRG of regional discharges
were treated at this hospital in FY14
29% 26%
33%
2%
12%
14%
46%
23%
42%
39%
0% 20% 40% 60% 80% 100%
Atkinson NH (127)
Groveland MA (172)
Plaistow NH (186)
Lowell MA (293)
Andover MA (348)
North Andover MA (414)
Salem NH (1,016)
Lawrence MA (2,533)
Methuen MA (2,595)
Haverhill MA (3,330)
Discharges by Community
Qu
alit
y
15.1% 13.6%
15.9%
15.0%
0%
5%
10%
15%
20%
25%
2011 2013
State Average
0
1
2
3CLABSI CAUTI SSI: Colon Surgery
of community discharges were treated at this hospital in FY14
Lower is Better
Lower is Better
C56

Key:
Hospital
Cohort: Community, Disproportionate Share Hospital Peer Cohort
For descriptions of the metrics, please see the technical appendix.
154$ 154$ Total Revenue
‡ Costs were adjusted to exclude direct medical education costs and physician compensation.
θ For more information on Infrastructure and Capacity Building (ICB) special funding, please contact the
Massachusetts Executive Office of Health and Human Services (EOHHS).
156$ 191$ 174$
* Disproportionate Share Hospitals (DSH) receive a minimum of 63% of gross patient service revenue from public
payers.
154$ 188$ Operating Revenue
(0)$ (0)$ 0$
Total Costs
Total Profit (Loss) 4.8$ (2.2)$ (2.9)$ 7.7$ 10.7$
191$ 149$
202$
Non-Operating
Revenue
202$ 182$ 153$
0$ 1$
188$ 182$
How has the hospital's total outpatient revenue changed compared to
FY10, and how does this compare to the hospital's peer cohort
median? (FY10=100)
2014 HOSPITAL PROFILE: STEWARD HOLY FAMILY HOSPITAL
What were the hospital's total margin and operating margins between
FY10 and FY14, and how do these compare to the hospital's peer
cohort medians?Revenue, Cost, & Profit/Loss (in millions)
How have the hospital's total revenue and costs changed between
FY10 and FY14?
How has the volume of the hospital's inpatient discharges changed
compared to FY10, and how does this compare to the hospital's peer
cohort median? (FY10=100)
How has the volume of the hospital's outpatient visits changed
compared to FY10, and how does this compare to the hospital's peer
cohort median? (FY10=100)
FY
What was the hospital's net inpatient service revenue per case mix
adjusted discharge between FY10 and FY14, and how does this
compare to the hospital's peer cohort median?
2011 2012 20132010 2014
Uti
lizat
ion
-4.7%
-9.4%
65707580859095
100105110115120125130135140
2010 2011 2012 2013 2014
FY14 Inpatient Discharges = 10,505 +30.8%
-3.6%
65707580859095
100105110115120125130135140
2010 2011 2012 2013 2014
FY14 Outpatient Visits = 90,985
Pat
ien
t R
even
ue
Tre
nd
s
Hospital Cohort Median
$2,000
$6,000
$10,000
$14,000
$18,000
$22,000
2010 2011 2012 2013 2014
+22.6%
+11.2%
65707580859095
100105110115120125130135140
2010 2011 2012 2013 2014
FY14 Outpatient Revenue = $92 M
Fin
anci
al P
erfo
rman
ce
3.1% 5.3%
2.8% 5.3%
-10%
0%
10%
2010 2011 2012 2013 2014
Tot
al
2.6% 5.4%
1.5% 4.5%
-10%
0%
10%
Ope
ratin
g
November 2015

2014 Hospital Profile
Overview / Size Payer Mix
Hospital System Affiliation: Public Payer Mix:
Change in Ownership (FY10-FY14): CY14 Commercial Payer Price Level:
Total Staffed Beds: Top 3 Commercial Payers:
% Occupancy:
Special Public Funding:
Financial Change FY13-FY14:
Adjusted‡ Cost per Discharge: Emergency Department Visits in FY14:
Inpatient NPSR per CMAD: Change FY13-FY14:
Outpatient Visits in FY14:
For descriptions of the metrics, please see the technical appendix.
Hospital (11,322) = 27% of total regional discharges - - -
Total Surplus (Loss) in FY14:
Inpatient:Outpatient Revenue in FY14: 41%:59%
Outpatient Revenue in FY14: $77,592,671
3.4%
Total Revenue in FY14:
$9,157,089
$173,890,394
Change FY13-FY14:
What proportion of adult patient discharges from this hospital resulted
in a readmission at any hospital within 30 days, and how does this
compare to the state average?
What were the most common inpatient cases (DRGs) treated at the
hospital in FY14? What proportion of the region’s cases did this
hospital treat for each service?
14.5%
46th Percentile
How many central line-associated blood stream infections (CLABSI),
catheter-associated urinary tract infections (CAUTI), and surgical site
infections (SSI) after colon surgery did patients get at this hospital
compared to what was expected based on the hospital's characteristics
and case mix?
-1.5%
6.5%
Change FY11-FY13 (percentage points):
Early Elective Deliveries Rate (Jan 2014-Jun 2015):
11,322Inpatient Discharges in FY14:
-3.6%
41,360
Tufts Associated Health Maintenance Org.
Quality
Readmission Rate in FY13:
Utilization
Change FY13-FY14: -2.0%
56,069
Where did most of the hospital's inpatients reside? What proportion of
each community's total discharges was attributed to this hospital?
3.8%
0.87, > cohort avg. (0.85); < statewide (1.00)
Change FY13-FY14:
STEWARD NORWOOD HOSPITAL
$9,223
Trauma Center Designation:
$8,888
Steward Norwood Hospital is a mid-size, for-profit community-Disproportionate Share Hospital (DSH) located in the Metro West region. It did not qualify for
DSH status in FY13, and was a member of the community hospital cohort. Steward Norwood Hospital is a member of Steward Health Care System. The
hospital had 16.0% fewer inpatient discharges in FY14 than in FY10, compared with a median decrease of 9.4% in its cohort. It had 16.7% more
outpatient visits in FY14 than in FY10, compared with a median decrease of 3.6% among peer cohort hospitals. Steward Norwood Hospital was profitable
three of the five years in the FY10 to FY14 period, with a 5.3% total margin in FY14, consistent with the median performance of its cohort.
85.7%, > cohort avg. (66%)
63.9% (DSH* Hospital)
Harvard Pilgrim Health Care
177, mid-size acute hospital
Steward Health Care System
Blue Cross Blue Shield of Massachusetts
Steward Health Care - 2010
ICBθ
Norwood, MA
Community, Disproportionate Share Hospital
Case Mix Index:
Metro West
Not Applicable
-4.5%
At
a G
lan
ce
Ser
vice
s
31%
32%
61%
31%
16%
25%
27%
15%
34%
49%
0% 20% 40% 60% 80% 100%
Cellulitis, Oth Bact Skn Inf (242)
Kidney & UT Infections (246)
Org Mental Hlth Disturb (250)
Card Arrth & Cond Dis (269)
Vaginal Delivery (293)
COPD (325)
Heart Failure (402)
Normal Neonate Birth (422)
Bipolar Disorders (575)
Maj Dep& Oth/Unsp Psychoses (841)
Discharges by DRG of regional discharges
were treated at this hospital in FY14
30%
35%
28%
23%
31%
16%
41%
26%
47%
50%
0% 20% 40% 60% 80% 100%
Norfolk MA (276)
Wrentham MA (407)
Westwood MA (416)
Mansfield MA (443)
Sharon MA (450)
Dedham MA (533)
Foxboro MA (663)
Canton MA (726)
Walpole MA (1,035)
Norwood MA (2,186)
Discharges by Community
Qu
alit
y 16.0%
14.5% 15.9%
15.0%
0%
5%
10%
15%
20%
25%
2011 2013
0
1
2
3CLABSI CAUTI SSI: Colon Surgery
of community discharges were treated at this
hospital in FY14
Lower is Better
Lower is Better
State Average
C57

Key:
Hospital
Cohort: Community, Disproportionate Share Hospital Peer Cohort
For descriptions of the metrics, please see the technical appendix.
156$ 169$ Total Revenue
‡ Costs were adjusted to exclude direct medical education costs and physician compensation.
θ For more information on Infrastructure and Capacity Building (ICB) special funding, please contact the
Massachusetts Executive Office of Health and Human Services (EOHHS).
160$ 189$ 170$
* Disproportionate Share Hospitals (DSH) receive a minimum of 63% of gross patient service revenue from public
payers.
156$ 181$ Operating Revenue
0$ 2$ 0$
Total Costs
Total Profit (Loss) 3.4$ (4.3)$ (8.5)$ 0.2$ 9.2$
165$ 166$
174$
Non-Operating
Revenue
174$ 169$ 168$
0$ 1$
181$ 170$
How has the hospital's total outpatient revenue changed compared to
FY10, and how does this compare to the hospital's peer cohort
median? (FY10=100)
2014 HOSPITAL PROFILE: STEWARD NORWOOD HOSPITAL
What were the hospital's total margin and operating margins between
FY10 and FY14, and how do these compare to the hospital's peer
cohort medians?Revenue, Cost, & Profit/Loss (in millions)
How have the hospital's total revenue and costs changed between
FY10 and FY14?
How has the volume of the hospital's inpatient discharges changed
compared to FY10, and how does this compare to the hospital's peer
cohort median? (FY10=100)
How has the volume of the hospital's outpatient visits changed
compared to FY10, and how does this compare to the hospital's peer
cohort median? (FY10=100)
FY
What was the hospital's net inpatient service revenue per case mix
adjusted discharge between FY10 and FY14, and how does this
compare to the hospital's peer cohort median?
2011 2012 20132010 2014
Uti
lizat
ion
-16.0%
-9.4%
65707580859095
100105110115120125130135140
2010 2011 2012 2013 2014
FY14 Inpatient Discharges = 11,322
+16.7%
-3.6%
65707580859095
100105110115120125130135140
2010 2011 2012 2013 2014
FY14 Outpatient Visits = 56,069
Pat
ien
t R
even
ue
Tre
nd
s
Hospital
Cohort Median
$2,000
$6,000
$10,000
$14,000
$18,000
$22,000
2010 2011 2012 2013 2014
+13.8%
+11.2%
65707580859095
100105110115120125130135140
2010 2011 2012 2013 2014
FY14 Outpatient Revenue = $78 M
Fin
anci
al P
erfo
rman
ce
2.0%
5.3% 2.8%
5.3%
-10%
0%
10%
2010 2011 2012 2013 2014
Tot
al
1.5%
5.2% 1.5%
4.5%
-10%
0%
10%
Ope
ratin
g
November 2015

2014 Hospital Profile
Overview / Size Payer Mix
Hospital System Affiliation: Public Payer Mix:
Change in Ownership (FY10-FY14): CY14 Commercial Payer Price Level:
Total Staffed Beds: Top 3 Commercial Payers:
% Occupancy:
Special Public Funding:
Financial Change FY13-FY14:
Adjusted‡ Cost per Discharge: Emergency Department Visits in FY14:
Inpatient NPSR per CMAD: Change FY13-FY14:
Outpatient Visits in FY14:
For descriptions of the metrics, please see the technical appendix.
Hospital (7,448) = 16% of total regional discharges - - -
Total Surplus (Loss) in FY14:
Inpatient:Outpatient Revenue in FY14: 22%:78%
Outpatient Revenue in FY14: $146,199,594
15.5%
Total Revenue in FY14:
$24,557,344
$234,315,346
Change FY13-FY14:
What proportion of adult patient discharges from this hospital resulted
in a readmission at any hospital within 30 days, and how does this
compare to the state average?
What were the most common inpatient cases (DRGs) treated at the
hospital in FY14? What proportion of the region’s cases did this
hospital treat for each service?
18.1%
65th Percentile
How many central line-associated blood stream infections (CLABSI),
catheter-associated urinary tract infections (CAUTI), and surgical site
infections (SSI) after colon surgery did patients get at this hospital
compared to what was expected based on the hospital's characteristics
and case mix?
-1.9%Change FY11-FY13 (percentage points):
Early Elective Deliveries Rate (Jan 2014-Jun 2015):
7,448Inpatient Discharges in FY14:
4.9%
45,404
Tufts Associated Health Maintenance Org.
Quality
Readmission Rate in FY13:
Utilization
Change FY13-FY14: 6.7%
172,765
Where did most of the hospital's inpatients reside? What proportion of
each community's total discharges was attributed to this hospital?
Not Applicable
-1.8%
0.97, > cohort avg. (0.85); < statewide (1.00)
Change FY13-FY14:
STEWARD SAINT ANNE'S HOSPITAL
$10,983
Trauma Center Designation:
$10,612
Steward Saint Anne’s Hospital is a mid-size, for-profit community-Disproportionate Share Hospital (DSH) located in the Southcoast region. Steward Saint
Anne’s is a member of Steward Health Care System. While it treated 16% of total discharges in the Southcoast region, it treated half of all knee joint
replacement cases and over one third of all hip joint replacement cases in the region. Outpatient visits at Steward Saint Anne’s decreased by 14.8%, while
outpatient revenue increased by 59.4% in the FY10 to FY14 period. Steward Saint Anne’s was profitable each year in the five-year period, with a 10.5%
total margin in FY14, higher than the median total margin of cohort hospitals.
78.6%, > cohort avg. (66%)
69.4% (DSH* Hospital)
Harvard Pilgrim Health Care
125, mid-size acute hospital
Steward Health Care System
Blue Cross Blue Shield of Massachusetts
Steward Health Care - 2010
ICBθ
Fall River, MA
Community, Disproportionate Share Hospital
Case Mix Index:
Southcoast
Not Applicable
4.4%
At
a G
lan
ce
Ser
vice
s
24%
35%
18%
27%
20%
19%
17%
12%
50%
23%
0% 20% 40% 60% 80% 100%
Pulm Edema & Resp Failure (153)
Hip Joint Replacement (164)
Kidney & UT Infections (183)
Renal Failure (203)
Cellulitis, Oth Bact Skn Inf (248)
Heart Failure (268)
COPD (280)
Sepsis & Dissem Inf (291)
Knee Joint Replacement (358)
Other Pneumonia (363)
Discharges by DRG
of regional discharges were treated at this hospital in FY14
5%
26%
4%
8%
19%
21%
18%
36%
3%
30%
0% 20% 40% 60% 80% 100%
South Dartmouth MA (68)
Little Compton RI (69)
Fairhaven MA (87)
North Dartmouth MA (152)
Swansea MA (315)
Westport MA (352)
Somerset MA (398)
Tiverton RI (478)
New Bedford MA (485)
Fall River MA (4,108)
Discharges by Community
Qu
alit
y
20.0%
18.1%
15.9% 15.0%
0%
5%
10%
15%
20%
25%
2011 2013
0
1
2
3CLABSI CAUTI SSI: Colon Surgery
of community discharges were treated at this hospital in FY14
Lower is Better
Lower is Better
State Average
C58

Key:
Hospital
Cohort: Community, Disproportionate Share Hospital Peer Cohort
For descriptions of the metrics, please see the technical appendix.
164$ 153$ Total Revenue
‡ Costs were adjusted to exclude direct medical education costs and physician compensation.
θ For more information on Infrastructure and Capacity Building (ICB) special funding, please contact the
Massachusetts Executive Office of Health and Human Services (EOHHS).
151$ 177$ 195$
* Disproportionate Share Hospitals (DSH) receive a minimum of 63% of gross patient service revenue from public
payers.
164$ 202$ Operating Revenue
0$ 0$ -$
Total Costs
Total Profit (Loss) 13.2$ 12.7$ 25.4$ 13.2$ 24.6$
210$ 140$
234$
Non-Operating
Revenue
234$ 208$ 151$
-$ 2$
202$ 208$
How has the hospital's total outpatient revenue changed compared to
FY10, and how does this compare to the hospital's peer cohort
median? (FY10=100)
2014 HOSPITAL PROFILE: STEWARD SAINT ANNE'S HOSPITAL
What were the hospital's total margin and operating margins between
FY10 and FY14, and how do these compare to the hospital's peer
cohort medians?Revenue, Cost, & Profit/Loss (in millions)
How have the hospital's total revenue and costs changed between
FY10 and FY14?
How has the volume of the hospital's inpatient discharges changed
compared to FY10, and how does this compare to the hospital's peer
cohort median? (FY10=100)
How has the volume of the hospital's outpatient visits changed
compared to FY10, and how does this compare to the hospital's peer
cohort median? (FY10=100)
FY
What was the hospital's net inpatient service revenue per case mix
adjusted discharge between FY10 and FY14, and how does this
compare to the hospital's peer cohort median?
2011 2012 20132010 2014
Uti
lizat
ion
+12.1%
-9.4%
65707580859095
100105110115120125130135140
2010 2011 2012 2013 2014
FY14 Inpatient Discharges = 7,448
-14.8%
-3.6%
65707580859095
100105110115120125130135140
2010 2011 2012 2013 2014
FY14 Outpatient Visits = 172,765
Pat
ien
t R
even
ue
Tre
nd
s
Hospital
Cohort Median
$2,000
$6,000
$10,000
$14,000
$18,000
$22,000
2010 2011 2012 2013 2014
+11.2%
65707580859095
100105110115120125130135140
2010 2011 2012 2013 2014
FY14 Outpatient Revenue = $146 M
Fin
anci
al P
erfo
rman
ce
8.6% 2.8% 5.3%
-10%
0%
10%
2010 2011 2012 2013 2014
Tot
al
7.1%
1.5% 4.5%
-10%
0%
10%
Ope
ratin
g
+59.4% +46.0%
10.4%
10.5%
12.5%
12.5%
November 2015

2014 Hospital Profile
Overview / Size Payer Mix
Hospital System Affiliation: Public Payer Mix:
Change in Ownership (FY10-FY14): CY14 Commercial Payer Price Level:
Total Staffed Beds: Top 3 Commercial Payers:
% Occupancy:
Special Public Funding:
Financial Change FY13-FY14:
Adjusted‡ Cost per Discharge: Emergency Department Visits in FY14:
Inpatient NPSR per CMAD: Change FY13-FY14:
Outpatient Visits in FY14:
For descriptions of the metrics, please see the technical appendix.
3.1%
0.82, < cohort avg. (0.85); < statewide (1.00)
Change FY13-FY14:
STURDY MEMORIAL HOSPITAL
$10,296
Trauma Center Designation:
$8,888
Sturdy Memorial Hospital is a mid-size, non-profit community-Disproportionate Share Hospital (DSH) located in the Metro West region. Inpatient
discharges at Sturdy decreased 7.8% between FY10 and FY14, compared to a median decrease of 9.4% among peer cohort hospitals. Likewise,
outpatient visits decreased 0.3% at the hospital over the FY10 to FY14 period, compared with a median 3.6% decrease in its cohort. Sturdy was profitable
from FY10 to FY14, and had a total margin of 17.3% in FY14, the highest in its peer cohort.
50.1%, < cohort avg. (66%)
65.0% (DSH* Hospital)
Harvard Pilgrim Health Care
149, mid-size acute hospital
Not Applicable
Blue Cross Blue Shield of Massachusetts
Not Applicable
ICBθ
Attleboro, MA
Community, Disproportionate Share Hospital
Case Mix Index:
Metro West
Not Applicable
0.4%
13.0%
56th Percentile
How many central line-associated blood stream infections (CLABSI),
catheter-associated urinary tract infections (CAUTI), and surgical site
infections (SSI) after colon surgery did patients get at this hospital
compared to what was expected based on the hospital's characteristics
and case mix?
-0.6%
4.4%
Change FY11-FY13 (percentage points):
Early Elective Deliveries Rate (Jan 2014-Jun 2015):
6,670Inpatient Discharges in FY14:
-0.3%
51,551
Tufts Associated Health Maintenance Org.
Quality
Readmission Rate in FY13:
Utilization
Change FY13-FY14: -1.0%
114,215
Where did most of the hospital's inpatients reside? What proportion of
each community's total discharges was attributed to this hospital?
Total Surplus (Loss) in FY14:
Inpatient:Outpatient Revenue in FY14: 29%:71%
Outpatient Revenue in FY14: $109,018,198
2.4%
Total Revenue in FY14:
$31,212,306
$180,800,778
Change FY13-FY14:
What proportion of adult patient discharges from this hospital resulted
in a readmission at any hospital within 30 days, and how does this
compare to the state average?
What were the most common inpatient cases (DRGs) treated at the
hospital in FY14? What proportion of the region’s cases did this
hospital treat for each service?
Hospital (6,670) = 16% of total regional discharges - - -
At
a G
lan
ce
Ser
vice
s
16%
24%
29%
15%
23%
27%
22%
27%
24%
25%
0% 20% 40% 60% 80% 100%
Card Arrth & Cond Dis (138)
Cellulitis, Oth Bact Skn Inf (187)
Knee Joint Replacement (198)
Heart Failure (234)
Other Pneumonia (272)
Cesarean Delivery (280)
Sepsis & Dissem Inf (281)
COPD (360)
Vaginal Delivery (446)
Normal Neonate Birth (695)
Discharges by DRG
of regional discharges were treated at this hospital in FY14
7%
2%
33%
49%
16%
35%
20%
33%
52%
65%
0% 20% 40% 60% 80% 100%
Foxboro MA (112)
Taunton MA (115)
Rehoboth MA (177)
Seekonk MA (186)
Wrentham MA (189)
Plainville MA (277)
Mansfield MA (385)
Norton MA (570)
North Attleboro MA (1,109)
Attleboro MA (2,749)
Discharges by Community
Qu
alit
y
13.5% 13.0%
15.9% 15.0%
0%
5%
10%
15%
20%
25%
2011 2013
0
1
2
3
Lower is Better
CLABSI CAUTI SSI: Colon Surgery
of community discharges were treated at this
hospital in FY14
Lower is Better
State Average
C59

Key:
Hospital
Cohort: Community, Disproportionate Share Hospital Peer Cohort
For descriptions of the metrics, please see the technical appendix.
FY
What was the hospital's net inpatient service revenue per case mix
adjusted discharge between FY10 and FY14, and how does this
compare to the hospital's peer cohort median?
2011 2012 20132010 2014
How has the hospital's total outpatient revenue changed compared to
FY10, and how does this compare to the hospital's peer cohort
median? (FY10=100)
2014 HOSPITAL PROFILE: STURDY MEMORIAL HOSPITAL
What were the hospital's total margin and operating margins between
FY10 and FY14, and how do these compare to the hospital's peer
cohort medians?Revenue, Cost, & Profit/Loss (in millions)
How have the hospital's total revenue and costs changed between
FY10 and FY14?
How has the volume of the hospital's inpatient discharges changed
compared to FY10, and how does this compare to the hospital's peer
cohort median? (FY10=100)
How has the volume of the hospital's outpatient visits changed
compared to FY10, and how does this compare to the hospital's peer
cohort median? (FY10=100)
157$ 166$ Operating Revenue
16$ 9$ 7$
Total Costs
Total Profit (Loss) 18.3$ 15.9$ 20.5$ 20.2$ 31.2$
150$ 148$
181$
Non-Operating
Revenue
165$ 162$ 160$
7$ 7$
174$ 170$ 164$ 167$ Total Revenue
‡ Costs were adjusted to exclude direct medical education costs and physician compensation.
θ For more information on Infrastructure and Capacity Building (ICB) special funding, please contact the
Massachusetts Executive Office of Health and Human Services (EOHHS).
148$ 153$ 150$
* Disproportionate Share Hospitals (DSH) receive a minimum of 63% of gross patient service revenue from public
payers.
Uti
lizat
ion
-7.8%
-9.4%
65707580859095
100105110115120125130135140
2010 2011 2012 2013 2014
FY14 Inpatient Discharges = 6,670
-0.3%
-3.6%
65707580859095
100105110115120125130135140
2010 2011 2012 2013 2014
FY14 Outpatient Visits = 114,215
Pat
ien
t R
even
ue
Tre
nd
s
Hospital
Cohort Median
$2,000
$6,000
$10,000
$14,000
$18,000
$22,000
2010 2011 2012 2013 2014
+5.3%
+11.2%
65707580859095
100105110115120125130135140
2010 2011 2012 2013 2014
FY14 Outpatient Revenue = $109 M
Fin
anci
al P
erfo
rman
ce
2.8% 5.3%
-10%
0%
10%
2010 2011 2012 2013 2014
Tot
al
6.8% 8.5%
1.5% 4.5%
-10%
0%
10%
Ope
ratin
g
11.0% 11.8% 11.9% 17.3%
November 2015

2014 Hospital Profile
Overview / Size Payer Mix
Hospital System Affiliation: Public Payer Mix:
Change in Ownership (FY10-FY14): CY14 Commercial Payer Price Level:
Total Staffed Beds: Top 3 Commercial Payers:
% Occupancy:
Special Public Funding:
Financial Change FY13-FY14:
Adjusted‡ Cost per Discharge: Emergency Department Visits in FY14:
Inpatient NPSR per CMAD: Change FY13-FY14:
Outpatient Visits in FY14:
For descriptions of the metrics, please see the technical appendix.
Not Applicable
Not Available
Outpatient Revenue in FY14: $454,035,438
0.9%
Total Revenue in FY14:
$51,183,000
$1,380,968,000
Change FY13-FY14:
Hospital (14,870) = 5% of total regional discharges - - -
What proportion of adult patient discharges from this hospital resulted
in a readmission at any hospital within 30 days, and how does this
compare to the state average?
What were the most common inpatient cases (DRGs) treated at the
hospital in FY14? What proportion of the region’s cases did this
hospital treat for each service?
91st Percentile
How many central line-associated blood stream infections (CLABSI),
catheter-associated urinary tract infections (CAUTI), and surgical site
infections (SSI) after colon surgery did patients get at this hospital
compared to what was expected based on the hospital's characteristics
and case mix?
-Change FY11-FY13 (percentage points):
Early Elective Deliveries Rate (Jan 2014-Jun 2015):
14,870Inpatient Discharges in FY14:
-2.0%
56,707
Tufts Associated Health Maintenance Org.
Quality
Readmission Rate in FY13:
Utilization
Change FY13-FY14: -7.4%
237,681
Where did most of the hospital's inpatients reside? What proportion of
each community's total discharges was attributed to this hospital?
10.2%
1.93
Change FY13-FY14:
Total Surplus (Loss) in FY14:
Inpatient:Outpatient Revenue in FY14: 54%:46%
BOSTON CHILDREN'S HOSPITAL
$16,214
Trauma Center Designation:
$20,860
Boston Children’s Hospital is a large, non-profit specialty hospital dedicated to pediatric health care. It is located in the Metro Boston region. Boston
Children’s is a teaching hospital for Harvard Medical School, and has research partnerships with numerous institutions in Massachusetts and elsewhere. It
is one of eight organ transplant centers in Massachusetts. It earned a profit each year from FY10 to FY14. While the operating margin remained roughly
the same between FY10 and FY14, the total margin decreased from 5.6% to 3.7%.
78.2%
35.7% (Non-DSH* Hospital)
Harvard Pilgrim Health Care
389, among the larger acute hospitals
Not Applicable
Blue Cross Blue Shield of Massachusetts
Not Applicable
Not Applicable
Boston, MA
Specialty Hospital
Case Mix Index:
Metro Boston
Pedi: Level 1
-3.2%
At
a G
lan
ce
Ser
vice
s
12%
38%
7%
17%
12%
12%
47%
14%
28%
23%
0% 20% 40% 60% 80% 100%
NBact Gastro, Naus, Vom (280)
Hip & Fem; N-TrauExc Jt Rep (283)
Other Pneumonia (287)
Diabetes (295)
Chemotherapy (307)
Craniotomy; exc Trauma (308)
Bronchiolitis & RSV Pneum (309)
Other Digestive System Dx (376)
Asthma (499)
Seizure (669)
Discharges by DRG
of regional discharges were treated at this hospital in FY14
4%
1%
4%
2%
1%
2%
3%
1%
2%
4%
0% 20% 40% 60% 80% 100%
Hyde Park MA (167)
Lowell MA (173)
Roxbury MA (173)
Lawrence MA (195)
New Bedford MA (197)
Quincy MA (200)
Dorchester Center MA (221)
Brockton MA (229)
Boston MA (304)
Dorchester MA (376)
Discharges by Community
Qu
alit
y
of community discharges were treated at this hospital in FY14
Data for this measure is not available for the patient population at this specialty hospital.
Data is not available for these measures
C60
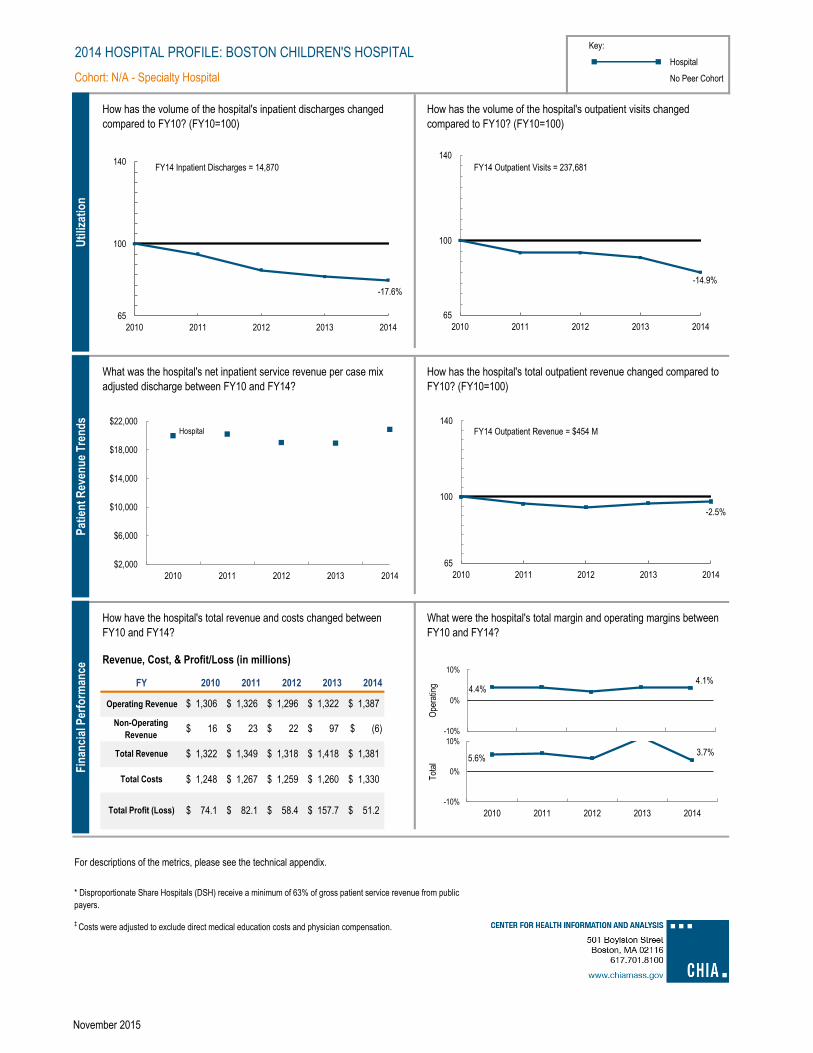
Key:
Hospital
Cohort: N/A - Specialty Hospital No Peer Cohort
For descriptions of the metrics, please see the technical appendix.
‡ Costs were adjusted to exclude direct medical education costs and physician compensation.
1,267$ 1,259$ 1,260$
* Disproportionate Share Hospitals (DSH) receive a minimum of 63% of gross patient service revenue from public
payers.
1,326$ 1,296$ Operating Revenue
(6)$ 97$ 22$
Total Costs
Total Profit (Loss) 74.1$ 82.1$ 58.4$ 157.7$ 51.2$
1,330$ 1,248$
1,381$
Non-Operating
Revenue
1,387$ 1,322$ 1,306$
23$ 16$
1,318$ 1,418$
How has the hospital's total outpatient revenue changed compared to
FY10? (FY10=100)
1,349$ 1,322$ Total Revenue
2014 HOSPITAL PROFILE: BOSTON CHILDREN'S HOSPITAL
What were the hospital's total margin and operating margins between
FY10 and FY14?
Revenue, Cost, & Profit/Loss (in millions)
How have the hospital's total revenue and costs changed between
FY10 and FY14?
How has the volume of the hospital's inpatient discharges changed
compared to FY10? (FY10=100)
How has the volume of the hospital's outpatient visits changed
compared to FY10? (FY10=100)
FY
What was the hospital's net inpatient service revenue per case mix
adjusted discharge between FY10 and FY14?
2011 2012 20132010 2014
Uti
lizat
ion
-17.6%
65707580859095
100105110115120125130135140
2010 2011 2012 2013 2014
FY14 Inpatient Discharges = 14,870
-14.9%
65707580859095
100105110115120125130135140
2010 2011 2012 2013 2014
FY14 Outpatient Visits = 237,681
Pat
ien
t R
even
ue
Tre
nd
s
Hospital
$2,000
$6,000
$10,000
$14,000
$18,000
$22,000
2010 2011 2012 2013 2014
-2.5%
65707580859095
100105110115120125130135140
2010 2011 2012 2013 2014
FY14 Outpatient Revenue = $454 M
Fin
anci
al P
erfo
rman
ce
5.6% 3.7%
-10%
0%
10%
2010 2011 2012 2013 2014
Tot
al
4.4% 4.1%
-10%
0%
10%
Ope
ratin
g
November 2015

2014 Hospital Profile
Overview / Size Payer Mix
Hospital System Affiliation: Public Payer Mix:
Change in Ownership (FY10-FY14): CY14 Commercial Payer Price Level:
Total Staffed Beds: Top 3 Commercial Payers:
% Occupancy:
Special Public Funding:
Financial Change FY13-FY14:
Adjusted‡ Cost per Discharge: Emergency Department Visits in FY14:
Inpatient NPSR per CMAD: Change FY13-FY14:
Outpatient Visits in FY14:
For descriptions of the metrics, please see the technical appendix.
Not Applicable
How many central line-associated blood stream infections (CLABSI),
catheter-associated urinary tract infections (CAUTI), and surgical site
infections (SSI) after colon surgery did patients get at this hospital
compared to what was expected based on the hospital's characteristics
and case mix?
Total Surplus (Loss) in FY14:
Inpatient:Outpatient Revenue in FY14: 5%:95%
Outpatient Revenue in FY14: $611,751,618
5.6%
Total Revenue in FY14:
$34,571,076
$1,098,160,230
Change FY13-FY14:
What proportion of adult patient discharges from this hospital resulted
in a readmission at any hospital within 30 days, and how does this
compare to the state average?
What were the most common inpatient cases (DRGs) treated at the
hospital in FY14? What proportion of the region’s cases did this
hospital treat for each service?
Not Applicable
-
-Change FY11-FY13 (percentage points):
Early Elective Deliveries Rate (Jan 2014-Jun 2015):
1,059Inpatient Discharges in FY14:
7.0%
Tufts Associated Health Maintenance Org.
Quality
Readmission Rate in FY13:
Utilization
Change FY13-FY14: 7.4%
252,058
79th Percentile
Not Applicable
Where did most of the hospital's inpatients reside? What proportion of
each community's total discharges was attributed to this hospital?
Not Applicable
2.3%
1.77
Change FY13-FY14:
DANA-FARBER CANCER INSTITUTE
$15,447
Trauma Center Designation:
$16,423
Dana-Farber Cancer Institute is a non-profit specialty hospital dedicated to pediatric and adult cancer treatment and research, primarily in an outpatient
setting, located in the Metro Boston region. It is a teaching affiliate of Harvard Medical School and collaborates with a variety of hospitals and research
institutions, including the Dana-Farber/Brigham and Women’s Cancer Center, Dana-Farber/Boston Children’s Cancer and Blood Disorders Center, Dana-
Farber/Partners Cancer Center, and Dana-Farber/Harvard Cancer Center. It is one of 41 Comprehensive Cancer Centers in the US, designated by the
National Cancer Institute. It earned a 3.1% total margin in FY14, though its operating margin was -4.0%.
80.1%
43.8% (Non-DSH* Hospital)
Harvard Pilgrim Health Care
30, among the smallest acute hospitals
Not Applicable
Blue Cross Blue Shield of Massachusetts
Not Applicable
Not Applicable
Boston, MA
Specialty Hospital
Case Mix Index:
Metro BostonA
t a
Gla
nce
S
ervi
ces
Qu
alit
y
This graph has been suppressed, as no single community accounted for more than 2% of the hospital's total discharges.
This graph has been suppressed, as the hospital provides the vast majority of its services on an outpatient basis. In FY14, this hospital reported 131,017 infusion treatments and over 250,000 outpatient visits.
This measure is not applicable to the patient population treated at this specialty hospital.
Data is not available for these measures
C61

Key:
Hospital
Cohort: N/A - Specialty Hospital No Peer Cohort
For descriptions of the metrics, please see the technical appendix.
‡ Costs were adjusted to exclude direct medical education costs and physician compensation.
967$ 985$ 1,022$
* Disproportionate Share Hospitals (DSH) receive a minimum of 63% of gross patient service revenue from public
payers.
903$ 938$ Operating Revenue
79$ 104$ 71$
Total Costs
Total Profit (Loss) 19.2$ (8.5)$ 23.4$ 56.2$ 34.6$
1,064$ 870$
1,098$
Non-Operating
Revenue
1,019$ 975$ 834$
55$ 55$
1,008$ 1,078$ 959$ 889$ Total Revenue
How has the hospital's total outpatient revenue changed compared to
FY10? (FY10=100)
2014 HOSPITAL PROFILE: DANA-FARBER CANCER INSTITUTE
What were the hospital's total margin and operating margins between
FY10 and FY14?
Revenue, Cost, & Profit/Loss (in millions)
How have the hospital's total revenue and costs changed between
FY10 and FY14?
How has the volume of the hospital's inpatient discharges changed
compared to FY10? (FY10=100)
How has the volume of the hospital's outpatient visits changed
compared to FY10? (FY10=100)
FY
What was the hospital's net inpatient service revenue per case mix
adjusted discharge between FY10 and FY14?
2011 2012 20132010 2014
Uti
lizat
ion
-3.9%
65707580859095
100105110115120125130135140
2010 2011 2012 2013 2014
FY14 Inpatient Discharges = 1,059 +26.4%
65707580859095
100105110115120125130135140
2010 2011 2012 2013 2014
FY14 Outpatient Visits = 252,058
Pat
ien
t R
even
ue
Tre
nd
s
Hospital
$2,000
$6,000
$10,000
$14,000
$18,000
$22,000
2010 2011 2012 2013 2014
+38.1%
65707580859095
100105110115120125130135140
2010 2011 2012 2013 2014
FY14 Outpatient Revenue = $612 M
Fin
anci
al P
erfo
rman
ce
2.2% 3.1%
-10%
0%
10%
2010 2011 2012 2013 2014
Tot
al
-4.0% -4.0%
-10%
0%
10%
Ope
ratin
g
November 2015

2014 Hospital Profile
Acute Specialty Hospitals - Kindred Hospitals
Kindred Hospitals
Kindred Hospital - Boston and Kindred Hospital – Boston North Shore are both owned by Kindred Healthcare, Inc., a healthcare services
company with long-term acute care hospitals, inpatient rehabilitation hospitals, nursing centers, assisted living facilities, and more in 47
states. Kindred Hospital – Boston and Kindred Hospital – Boston North Shore provide acute cardiac and pulmonary medicine, dialysis,
wound care, infectious disease, and rehabilitation services following long-term illness.
Kindred Hospital Boston
Kindred Hospital-Boston is a for-profit hospital that specializes in providing long-term acute care services. It is located in the Metro Boston
region, and is among the smaller acute hospitals in Massachusetts, with 59 staffed beds. In FY14, the average length of stay at the
hospital was 24.2 days, and the hospital provided no outpatient services. It did not earn a profit in any year between FY10 and FY14.
Kindred Hospital North Shore
Kindred Hospital- Boston North Shore is a for-profit hospital that specializes in providing long-term acute care services. It is located in the
Northeastern Massachusetts region, and is among the smaller acute hospitals in Massachusetts, with 50 staffed beds. In FY14, the
average length of stay at the hospital was 26.9 days, and the hospital provided no outpatient services. It earned a negative total margin
each year between FY10 and FY14.
Kindred Hospital Boston Kindred Hospital Boston North Shore
C62 - 63

2014 $19 $19 $0 $21 -$1.42014 $19 $19 $0 $20 -$1.5
-$0.0
2012 $18 $18 $0 $20 -$2.02012 $17 $17 $0 $17 -$0.3
2013 $17 $17 $0 $19 -$1.62013 $19 $19 $0 $19
2010 $16 $16 $0 $17 -$1.5 2010 $19 $19
2011 $18 $18 $0 $20 -$2.12011 $16 $16 $0 $17 -$0.5
Revenue, Cost, & Profit/Loss (in millions) Revenue, Cost, & Profit/Loss (in millions)
FYTotal
Revenue
Operating
Revenue
Non-
Operating
Revenue
CostsTotal
Profit/LossFY
Total
RevenueCosts
Total
Profit/Loss
$21 -$1.9
Operating
Revenue
Non-
Operating
Revenue
Total Margin -10.2% -11.9% -11.7% -9.4% -7.4%
$0
Total Margin -9.7% -3.0% -1.9% -0.1% -8.0%
Operating Margin -10.2% -11.9% -11.7% -9.4% -7.4%Operating Margin -9.7% -3.0% -1.9% -0.1% -8.0%
Outpatient Revenue (millions) $0.0 $0.0 $0.0 $0.0 $0.0Outpatient Revenue (millions) $0.0 $0.0 $0.0 $0.0 $0.1
Net Inpatient Service
Revenue per Day1,381$ 1,546$ 1,502$ 1,477$ 1,537$
Net Inpatient Service
Revenue per Day1,473$ 1,507$ 1,535$ 1,503$ 1,501$
0 0 0Outpatient Visits 0 0 0 0 0
Inpatient Days 11,680 11,091 11,019 13,154 12,767
Outpatient Visits 0 0
25.8 26.9
FY11 FY12 FY13 FY14
Inpatient Days 13,871 12,107 11,648 11,779 12,577
Average Length of Stay 26.4 24.4 23.9 25.2 24.2
What was the hospital's overall payer mix (gross
charges) and how does this hospital compare to
the average acute hospital's payer mix?
What was the hospital's overall payer mix (gross
charges) and how does this hospital compare to
the average acute hospital's payer mix?
FY10 FY11 FY12 FY13 FY14 FY10
Average Length of Stay 28.7 32.3 27.2
At a Glance
Kindred Hospital Boston Boston, MA
Payer Mix
TOTAL STAFFED BEDS:
% OCCUPANCY:
INPATIENT DISCHARGES in FY14:
TAX STATUS:
PUBLIC PAYER MIX:
TOTAL REVENUE in FY14:
INPATIENT:OUTPATIENT REVENUE in FY14:
ADJUSTED COST PER INPATIENT DAY:
CHANGE in OWNERSHIP (FY10-FY14):
70%
43%
6%
20%
24% 38%
Commercial & Other
State Programs
Medicare and Other Federal
Programs
Kindred Boston
Average Acute Hospital
Percentage calculations may not sum to 100% due to rounding.
59
59.3%
528
76%
$18,883,075
For profit
100%:0%
$1,552
N/A
At a Glance
Kindred Hospital Boston North Shore Peabody, MA
Payer Mix
TOTAL STAFFED BEDS:
% OCCUPANCY:
INPATIENT DISCHARGES in FY14:
TAX STATUS:
PUBLIC PAYER MIX:
TOTAL REVENUE in FY14:
INPATIENT:OUTPATIENT REVENUE in FY14:
ADJUSTED COST PER INPATIENT DAY:
CHANGE in OWNERSHIP (FY10-FY14):
69% 43%
3%
20%
27% 38% Commercial
& Other
State Programs
Medicare and Other Federal
Programs
Kindred North Shore
Average Acute Hospital
Percentage calculations may not sum to 100% due to rounding.
50
68.9%
468
73%
$19,114,154
For profit
100%:0%
$1,498
N/A
63
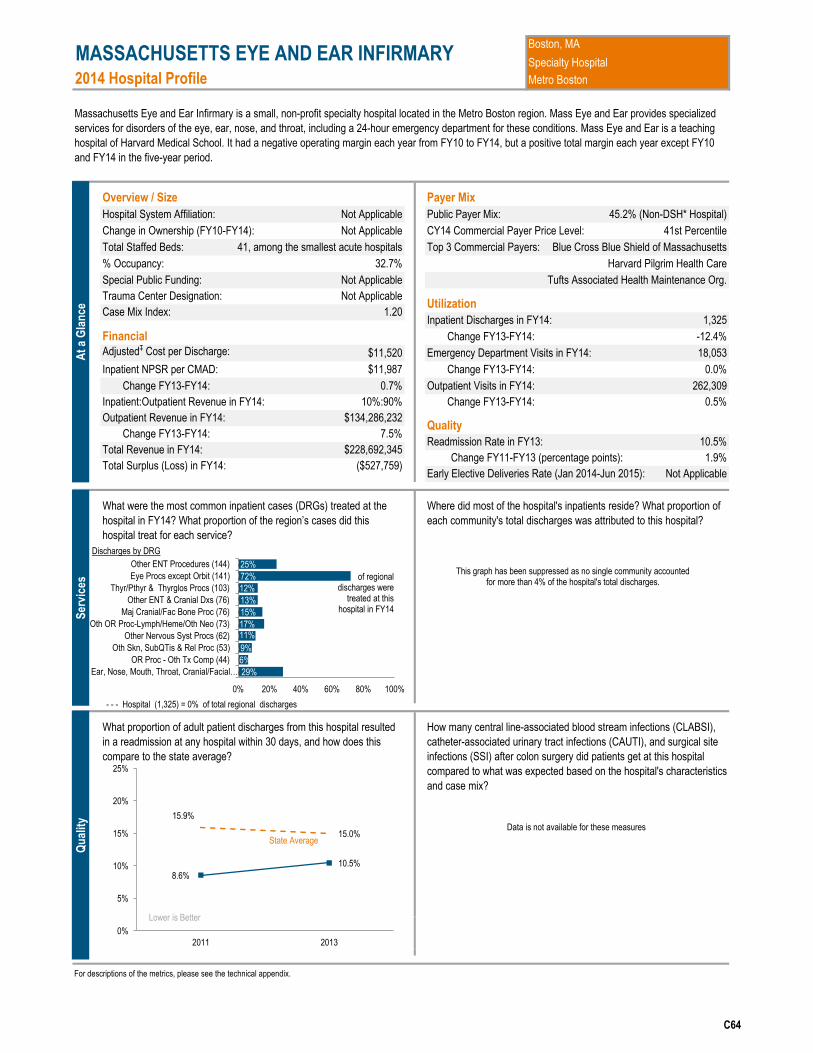
2014 Hospital Profile
Overview / Size Payer Mix
Hospital System Affiliation: Public Payer Mix:
Change in Ownership (FY10-FY14): CY14 Commercial Payer Price Level:
Total Staffed Beds: Top 3 Commercial Payers:
% Occupancy:
Special Public Funding:
Financial Change FY13-FY14:
Adjusted‡ Cost per Discharge: Emergency Department Visits in FY14:
Inpatient NPSR per CMAD: Change FY13-FY14:
Outpatient Visits in FY14:
For descriptions of the metrics, please see the technical appendix.
Not Applicable
MASSACHUSETTS EYE AND EAR INFIRMARY
$11,520
Trauma Center Designation:
$11,987
Massachusetts Eye and Ear Infirmary is a small, non-profit specialty hospital located in the Metro Boston region. Mass Eye and Ear provides specialized
services for disorders of the eye, ear, nose, and throat, including a 24-hour emergency department for these conditions. Mass Eye and Ear is a teaching
hospital of Harvard Medical School. It had a negative operating margin each year from FY10 to FY14, but a positive total margin each year except FY10
and FY14 in the five-year period.
32.7%
45.2% (Non-DSH* Hospital)
Harvard Pilgrim Health Care
41, among the smallest acute hospitals
Not Applicable
Blue Cross Blue Shield of Massachusetts
Not Applicable
Not Applicable
Boston, MA
Specialty Hospital
Case Mix Index:
Metro Boston
Not Applicable
0.0%
What were the most common inpatient cases (DRGs) treated at the
hospital in FY14? What proportion of the region’s cases did this
hospital treat for each service?
10.5%
41st Percentile
How many central line-associated blood stream infections (CLABSI),
catheter-associated urinary tract infections (CAUTI), and surgical site
infections (SSI) after colon surgery did patients get at this hospital
compared to what was expected based on the hospital's characteristics
and case mix?
1.9%Change FY11-FY13 (percentage points):
Early Elective Deliveries Rate (Jan 2014-Jun 2015):
1,325Inpatient Discharges in FY14:
-12.4%
18,053
Tufts Associated Health Maintenance Org.
Quality
Readmission Rate in FY13:
Utilization
Change FY13-FY14: 0.5%
262,309
Where did most of the hospital's inpatients reside? What proportion of
each community's total discharges was attributed to this hospital?
0.7%
1.20
Change FY13-FY14:
Total Surplus (Loss) in FY14:
Inpatient:Outpatient Revenue in FY14: 10%:90%
Outpatient Revenue in FY14: $134,286,232
7.5%
Total Revenue in FY14:
($527,759)
$228,692,345
Change FY13-FY14:
Hospital (1,325) = 0% of total regional discharges - - -
What proportion of adult patient discharges from this hospital resulted
in a readmission at any hospital within 30 days, and how does this
compare to the state average?
At
a G
lan
ce
Ser
vice
s
29%
6%
9%
11% 17%
15%
13%
12%
72%
25%
0% 20% 40% 60% 80% 100%
Ear, Nose, Mouth, Throat, Cranial/Facial…
OR Proc - Oth Tx Comp (44)
Oth Skn, SubQTis & Rel Proc (53)
Other Nervous Syst Procs (62)
Oth OR Proc-Lymph/Heme/Oth Neo (73)
Maj Cranial/Fac Bone Proc (76)
Other ENT & Cranial Dxs (76)
Thyr/Pthyr & Thyrglos Procs (103)
Eye Procs except Orbit (141)
Other ENT Procedures (144)
Discharges by DRG
of regional discharges were
treated at this hospital in FY14
Qu
alit
y
8.6%
10.5%
15.9%
15.0%
0%
5%
10%
15%
20%
25%
2011 2013
State Average
This graph has been suppressed as no single community accounted for more than 4% of the hospital's total discharges.
Lower is Better
Data is not available for these measures
C64

Key:
Hospital
Cohort: N/A - Specialty Hospital No Peer Cohort
For descriptions of the metrics, please see the technical appendix.
2014 HOSPITAL PROFILE: MASSACHUSETTS EYE AND EAR INFIRMARY
What were the hospital's total margin and operating margins between
FY10 and FY14?
Revenue, Cost, & Profit/Loss (in millions)
How have the hospital's total revenue and costs changed between
FY10 and FY14?
How has the volume of the hospital's inpatient discharges changed
compared to FY10? (FY10=100)
How has the volume of the hospital's outpatient visits changed
compared to FY10? (FY10=100)
FY
What was the hospital's net inpatient service revenue per case mix
adjusted discharge between FY10 and FY14?
2011 2012 20132010 2014
190$
25$ 3$
234$ 224$
How has the hospital's total outpatient revenue changed compared to
FY10? (FY10=100)
217$ 193$ Total Revenue
‡ Costs were adjusted to exclude direct medical education costs and physician compensation.
202$ 202$ 224$
* Disproportionate Share Hospitals (DSH) receive a minimum of 63% of gross patient service revenue from public
payers.
193$ 202$ Operating Revenue
5$ 4$ 33$
Total Costs
Total Profit (Loss) (2.1)$ 15.8$ 31.8$ 0.1$ (0.5)$
229$ 195$
229$
Non-Operating
Revenue
223$ 219$
Uti
lizat
ion
-13.3%
65707580859095
100105110115120125130135140
2010 2011 2012 2013 2014
FY14 Inpatient Discharges = 1,325
+19.8%
65707580859095
100105110115120125130135140
2010 2011 2012 2013 2014
FY14 Outpatient Visits = 262,309
Pat
ien
t R
even
ue
Tre
nd
s
Hospital
$2,000
$6,000
$10,000
$14,000
$18,000
$22,000
2010 2011 2012 2013 2014
+37.7%
65707580859095
100105110115120125130135140
2010 2011 2012 2013 2014
FY14 Outpatient Revenue = $134 M
Fin
anci
al P
erfo
rman
ce
-1.1% -0.2%
-10%
0%
10%
2010 2011 2012 2013 2014
Tot
al
-2.6% -2.6%
-10%
0%
10%
Ope
ratin
g
13.6%
November 2015

2014 Hospital Profile
Overview / Size Payer Mix
Hospital System Affiliation: Public Payer Mix:
Change in Ownership (FY10-FY14): CY14 Commercial Payer Price Level:
Total Staffed Beds: Top 3 Commercial Payers:
% Occupancy:
Special Public Funding:
Financial Change FY13-FY14:
Adjusted‡ Cost per Discharge: Emergency Department Visits in FY14:
Inpatient NPSR per CMAD: Change FY13-FY14:
Outpatient Visits in FY14:
For descriptions of the metrics, please see the technical appendix.
60%:40%
Outpatient Revenue in FY14: $62,412,954
14.5%
Total Revenue in FY14:
$5,534,690
$239,185,054
Change FY13-FY14:
Hospital (8,168) = 3% of total regional discharges - - -
What proportion of adult patient discharges from this hospital resulted
in a readmission at any hospital within 30 days, and how does this
compare to the state average?
What were the most common inpatient cases (DRGs) treated at the
hospital in FY14? What proportion of the region’s cases did this
hospital treat for each service?
3.4%
52nd Percentile
How many central line-associated blood stream infections (CLABSI),
catheter-associated urinary tract infections (CAUTI), and surgical site
infections (SSI) after colon surgery did patients get at this hospital
compared to what was expected based on the hospital's characteristics
and case mix?
-1.0%Change FY11-FY13 (percentage points):
Early Elective Deliveries Rate (Jan 2014-Jun 2015):
8,168Inpatient Discharges in FY14:
5.5%
Tufts Associated Health Maintenance Org.
Quality
Readmission Rate in FY13:
Utilization
Change FY13-FY14: -2.1%
130,394
Where did most of the hospital's inpatients reside? What proportion of
each community's total discharges was attributed to this hospital?
-
Not Applicable
-1.6%
1.36
Change FY13-FY14:
Not ApplicableTotal Surplus (Loss) in FY14:
Inpatient:Outpatient Revenue in FY14:
NEW ENGLAND BAPTIST HOSPITAL
$10,301
Trauma Center Designation:
$14,251
New England Baptist Hospital is a non-profit specialty hospital located in the Metro Boston region. New England Baptist focuses exclusively on orthopedic
and musculoskeletal conditions. It is among the smaller acute hospitals in Massachusetts and a member of the CareGroup health care system. New
England Baptist Hospital is a teaching affiliate of Tufts University School of Medicine and conducts teaching programs in collaboration with the Harvard
School of Public Health and the Harvard School of Medicine. New England Baptist earned a profit each year from FY10 to FY14, with a total margin of
2.3% and an operating margin of 0.1% in FY14.
74.8%
44.7% (Non-DSH* Hospital)
Harvard Pilgrim Health Care
95, among the smaller acute hospitals
CareGroup
Blue Cross Blue Shield of Massachusetts
Not Applicable
Not Applicable
Boston, MA
Specialty Hospital
Case Mix Index:
Metro Boston
Not Applicable
At
a G
lan
ce
Ser
vice
s
4%
13%
14%
6%
13%
20%
20%
25%
42%
44%
0% 20% 40% 60% 80% 100%
Hip & Fem; N-TrauExc Jt Rep (33)
Dors&Lumb Fus- Curv (49)
Oth Muscskel & ConnTis Proc (84)
Knee & LowLeg Exc Foot (135)
Intervert Disc Excis&Dcmpr (239)
CervFus, Oth Bck/Nck Ex Dis Ex/Dcmp (312)
Shldr & Upp/ForeArm Proc (346)
Dors&Lum Fus exc Curv (693)
Hip Joint Replacement (2754)
Knee Joint Replacement (3058)
Discharges by DRG
of regional discharges were treated at this
hospital in FY14
Qu
alit
y
4.4% 3.4%
15.9% 15.0%
0%
5%
10%
15%
20%
25%
2011 2013
0
1
2
3CLABSI CAUTI SSI: Colon Surgery
In FY14, this hospital drew patients primarily from eastern Massachusetts, including: Boston, Worcester, Quincy, Cambridge, Waltham, Plymouth,
Framingham, Brookline, Medford, and Brockton.
This graph has been suppressed as no single community accounted for more than 2% of the hospital's total discharges.
Lower is Better
Lower is Better
Data is not available for this measure
C65

Key:
Hospital
Cohort: N/A - Specialty Hospital No Peer Cohort
For descriptions of the metrics, please see the technical appendix.
‡ Costs were adjusted to exclude direct medical education costs and physician compensation.
194$ 207$ 214$
* Disproportionate Share Hospitals (DSH) receive a minimum of 63% of gross patient service revenue from public
payers.
200$ 215$ Operating Revenue
5$ 5$ 4$
Total Costs
Total Profit (Loss) 8.2$ 8.7$ 11.7$ 10.9$ 5.5$
234$ 190$
239$
Non-Operating
Revenue
234$ 220$ 194$
3$ 4$
219$ 225$
How has the hospital's total outpatient revenue changed compared to
FY10? (FY10=100)
203$ 198$ Total Revenue
What were the hospital's total margin and operating margins between
FY10 and FY14?
Revenue, Cost, & Profit/Loss (in millions)
How have the hospital's total revenue and costs changed between
FY10 and FY14?
How has the volume of the hospital's inpatient discharges changed
compared to FY10? (FY10=100)
How has the volume of the hospital's outpatient visits changed
compared to FY10? (FY10=100)
FY
What was the hospital's net inpatient service revenue per case mix
adjusted discharge between FY10 and FY14?
2011 2012 20132010 2014
2014 HOSPITAL PROFILE: NEW ENGLAND BAPTIST HOSPITAL
Uti
lizat
ion
+13.2%
65707580859095
100105110115120125130135140
2010 2011 2012 2013 2014
FY14 Inpatient Discharges = 8,168
-10.2%
65707580859095
100105110115120125130135140
2010 2011 2012 2013 2014
FY14 Outpatient Visits = 130,394
Pat
ien
t R
even
ue
Tre
nd
s
Hospital
$2,000
$6,000
$10,000
$14,000
$18,000
$22,000
2010 2011 2012 2013 2014
+11.6%
65707580859095
100105110115120125130135140
2010 2011 2012 2013 2014
FY14 Outpatient Revenue = $62 M
Fin
anci
al P
erfo
rman
ce
4.2% 2.3%
-10%
0%
10%
2010 2011 2012 2013 2014
Tot
al
2.3% 0.1%
-10%
0%
10%
Ope
ratin
g
November 2015

2014 Hospital Profile
Acute Specialty Hospitals - Shriners Hospitals for Children
This is the first year CHIA is reporting on Shriners Hospitals. Until 2011, Shriners Hospitals did not collect payments from insurers, thus they
were not subject to the same filing requirements as other acute and non-acute hospitals in Massachusetts. Shriners relies on their
endowment funds and other public support to sustain their operations.
Shriners Hospitals for Children is a health care system dedicated to pediatric specialty care, research, and teaching programs for medical
professionals. Children up to age 18 with orthopedic conditions, burns, spinal cord injuries, and cleft lip and palate are eligible for care and
receive all services regardless of the families' ability to pay. The hospital system was founded by Shriners International, a fraternity with
nearly 200 chapters and thousands of clubs around the world. Shriners Hospitals for Children has 22 facilities in the United States, Canada,
and Mexico.
Shriners Hospitals for Children - Boston is a 30-bed pediatric specialty hospital, research, and teaching center located in Boston. It treats
children with severe burn injuries, complex skin conditions, orthopedic conditions, and cleft lip and palate. It is the only exclusively pediatric,
verified burn center in New England. Sixty-two percent of its revenue comes from inpatient services, and the hospital reported 332 inpatient
discharges in FY14, 27% fewer than in the prior year. Its most prominent cases in the region were skin grafts for skin and subcutaneous
tissue diagnoses, and partial thickness burns with or without skin graft.
Shriners Hospitals for Children - Springfield is dedicated to providing care for a wide range of pediatric orthopedic and
neuromusculoskeletal disorders and diseases, as well as cleft lip and palate. Located in Springfield, it has 40 beds. Roughly 40% of its
revenue comes from inpatient services, and it had 126 discharges in FY14, a 17.1% decrease from FY13. It treated 87% of the region's
discharges for dorsal and lumbar fusion procedures for curvature of the back and 27% of the region's discharges for non-trauma hip and
femur procedures, excluding joint replacement.
Shriners Hospitals for Children - Boston Shriners Hospitals for Children - Springfield
C66 - 67
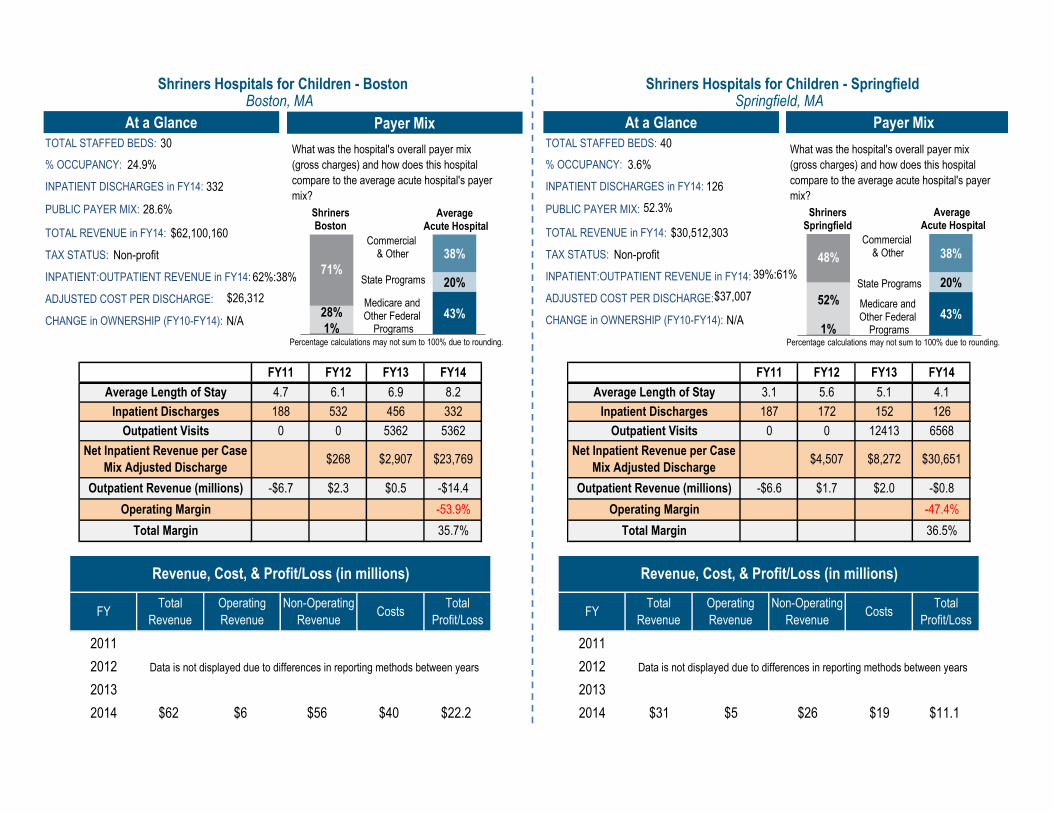
4.15.1
FY12 FY13
5.6
What was the hospital's overall payer mix
(gross charges) and how does this hospital
compare to the average acute hospital's payer
mix?
What was the hospital's overall payer mix
(gross charges) and how does this hospital
compare to the average acute hospital's payer
mix?
FY11 FY12 FY13 FY14 FY14
188Inpatient Discharges 532 456 332
4.7Average Length of Stay 6.1 6.9 8.2
Net Inpatient Revenue per Case
Mix Adjusted Discharge$268 $2,907 $23,769
0Outpatient Visits 0 5362 5362
-53.9%
35.7%
Operating Margin
-$6.7Outpatient Revenue (millions) $2.3 $0.5 -$14.4
Operating
Revenue
Non-Operating
Revenue
Total Margin
Revenue, Cost, & Profit/Loss (in millions) Revenue, Cost, & Profit/Loss (in millions)
FYTotal
Revenue
Operating
Revenue
Non-Operating
RevenueCosts
Total
Profit/LossFY
Total
RevenueCosts
Total
Profit/Loss
Total Margin
Operating Margin
2012 2012Data is not displayed due to differences in reporting methods between years Data is not displayed due to differences in reporting methods between years
20112011
2013
2014 $31 $5 $26 $19 $11.12014 $62 $6 $56 $40 $22.2
2013
126
6568
$30,651
-$0.8
-47.4%
36.5%
$2.0
$8,272
12413
152172
0
$4,507
$1.7
FY11
-$6.6
0
187
3.1Average Length of Stay
Inpatient Discharges
Outpatient Visits
Net Inpatient Revenue per Case
Mix Adjusted Discharge
Outpatient Revenue (millions)
At a Glance
Shriners Hospitals for Children - Boston Boston, MA
TOTAL STAFFED BEDS:
% OCCUPANCY:
INPATIENT DISCHARGES in FY14:
TAX STATUS:
PUBLIC PAYER MIX:
TOTAL REVENUE in FY14:
INPATIENT:OUTPATIENT REVENUE in FY14:
ADJUSTED COST PER DISCHARGE:
CHANGE in OWNERSHIP (FY10-FY14): 1%
43% 28%
20% 71%
38% Commercial
& Other
State Programs
Medicare and Other Federal
Programs
Shriners Boston
Average Acute Hospital
Percentage calculations may not sum to 100% due to rounding.
30
24.9%
332
28.6%
$62,100,160
Non-profit
62%:38%
$26,312
N/A
At a Glance
Shriners Hospitals for Children - Springfield Springfield, MA
Payer Mix
TOTAL STAFFED BEDS:
% OCCUPANCY:
INPATIENT DISCHARGES in FY14:
TAX STATUS:
PUBLIC PAYER MIX:
TOTAL REVENUE in FY14:
INPATIENT:OUTPATIENT REVENUE in FY14:
ADJUSTED COST PER DISCHARGE:
CHANGE in OWNERSHIP (FY10-FY14): 1%
43% 52%
20%
48% 38% Commercial
& Other
State Programs
Medicare and Other Federal
Programs
Shriners Springfield
Average Acute Hospital
Percentage calculations may not sum to 100% due to rounding.
40
3.6%
126
52.3%
$30,512,303
Non-profit
39%:61%
$37,007
N/A
67
Payer Mix
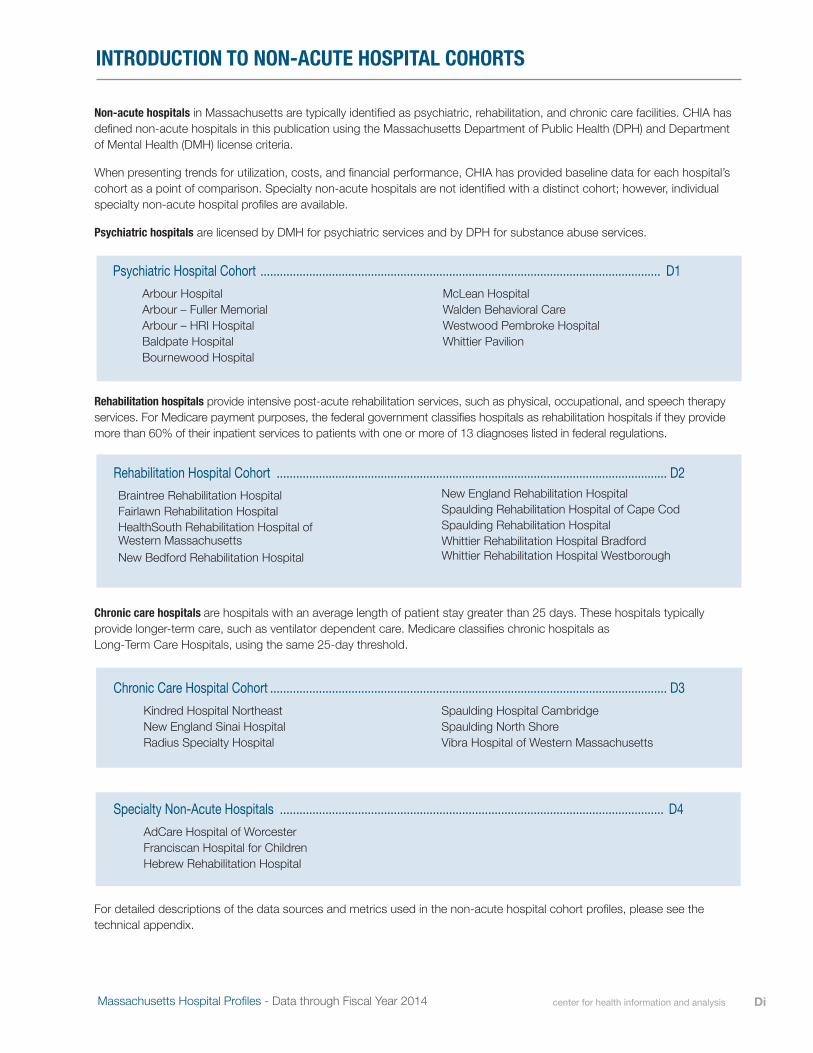
Non-acute hospitals in Massachusetts are typically identified as psychiatric, rehabilitation, and chronic care facilities. CHIA has defined non-acute hospitals in this publication using the Massachusetts Department of Public Health (DPH) and Department of Mental Health (DMH) license criteria.
When presenting trends for utilization, costs, and financial performance, CHIA has provided baseline data for each hospital’s cohort as a point of comparison. Specialty non-acute hospitals are not identified with a distinct cohort; however, individual specialty non-acute hospital profiles are available.
Psychiatric hospitals are licensed by DMH for psychiatric services and by DPH for substance abuse services.
Psychiatric Hospital Cohort ........................................................................................................................... D1 Arbour Hospital McLean Hospital Arbour – Fuller Memorial Walden Behavioral Care Arbour – HRI Hospital Westwood Pembroke Hospital Baldpate Hospital Whittier Pavilion Bournewood Hospital
Rehabilitation hospitals provide intensive post-acute rehabilitation services, such as physical, occupational, and speech therapy services. For Medicare payment purposes, the federal government classifies hospitals as rehabilitation hospitals if they provide more than 60% of their inpatient services to patients with one or more of 13 diagnoses listed in federal regulations.
Rehabilitation Hospital Cohort ........................................................................................................................ D2 Braintree Rehabilitation Hospital Fairlawn Rehabilitation Hospital HealthSouth Rehabilitation Hospital of Western Massachusetts New Bedford Rehabilitation Hospital
New England Rehabilitation Hospital Spaulding Rehabilitation Hospital of Cape CodSpaulding Rehabilitation HospitalWhittier Rehabilitation Hospital Bradford Whittier Rehabilitation Hospital Westborough
Chronic care hospitals are hospitals with an average length of patient stay greater than 25 days. These hospitals typically provide longer-term care, such as ventilator dependent care. Medicare classifies chronic hospitals as Long-Term Care Hospitals, using the same 25-day threshold.
Chronic Care Hospital Cohort .......................................................................................................................... D3 Kindred Hospital Northeast Spaulding Hospital Cambridge New England Sinai Hospital Spaulding North Shore Radius Specialty Hospital Vibra Hospital of Western Massachusetts
Specialty Non-Acute Hospitals ...................................................................................................................... D4 AdCare Hospital of Worcester Franciscan Hospital for Children Hebrew Rehabilitation Hospital
For detailed descriptions of the data sources and metrics used in the non-acute hospital cohort profiles, please see the technical appendix.
Massachusetts Hospital Profiles - Data through Fiscal Year 2014 center for health information and analysis Di
INTRODUCTION TO NON-ACUTE HOSPITAL COHORTS


2014 Hospital Profile
Hospitals in Cohort:Fairlawn Rehabilitation Hospital Spaulding Rehabilitation Hospital Cape CodBraintree Rehabilitation Hospital Spaulding Rehabilitation Hospital New England Rehabilitation Hospital Whittier Rehab Hospital BradfordHealthSouth Rehabilitation Hospital of Western Massachusetts Whittier Rehab Hospital WestboroughNew Bedford Rehabilitation Hospital
Total Beds: Average Public Payer Mix:990 (25.0% of statewide total) 72.7%, > statewide (72.0%)
Median % Occupancy: Total Gross Revenue in FY14:80.0%, < statewide (81.6%) $768 million (31.0% of statewide total)
Total Inpatient Days: Inpatient:Outpatient Revenue in FY14:235,072 (21.5% of statewide total) 83%:17% (statewide = 85%:15%)
Total Inpatient Discharges: Adjusted Cost per Inpatient Day:14,268 (23.4% of statewide total) $1,146, > statewide ($830)
Key:Cohort Statewide
REHABILITATION HOSPITALS
Rehabilitation hospitals provide intensive, post-acute rehabilitation services, such as physical, occupational, and speech therapy services. For Medicare payment purposes, hospitals as classified as rehabilitation hospitals if they provide more than 60% of their inpatient services to patients with one or more of 13 diagnoses listed in federal regulations. The nine rehabilitation hospitals treated 64% of chronic and rehabilitation cases in FY14, while other non-acute hospitals treated 29%, and acute hospitals treated 7%. All but one rehabilitation hospital was profitable in FY14, consistent with the year prior. Inpatient days decreased 4.8% between FY10 and FY14 at rehabilitation hospitals.
What proportion of total statewide chronic/rehab discharges was attributed to each of the cohort's hospitals in FY14? Overall, what proportions of total chronic/rehab discharges were attributed to acute hospitals and non-acute hospitals?
What was this cohort's average payer mix (gross charges) in FY14, and how does this compare to that of other non-acute hospital cohorts and the average non-acute hospital?
For descriptions of the metrics, please see Technical Appendix.
How has the volume of this cohort's inpatient days changed compared to FY10, and how does this compare to that of other non-acute hospitals? (FY10=100)
How has the cohort's median average length of stay (ALOS) changed compared to FY10, and how does this compare to that of other non-acute hospitals? (FY10=100)
1,619 6,354
14,268
0% 20% 40% 60% 80%
Acute HospitalsOther Non-Acute Hospitals
Rehabilitation Hospitals
At a
Glan
ce
Serv
ices
810 744 2,251 1,149 628 1,227 2,520 2,462 2,477
0% 20% 40% 60%
Whitter - WestboroughWhittier - BradfordSpaulding Rehab
Spaulding - Cape CodNew Bedford Rehab
HealthSouth of Western MANew England Rehab
Braintree RehabFairlawn Rehab
62% 31%
55% 46%
11%
34%
27% 26%
27% 36% 19% 28%
Commercial & Other
State Programs
Medicare and Other Federal
Programs
Utiliz
atio
n
-4.8%
-3.0%
80859095
100105110115120
2010 2011 2012 2013 2014
-18.3% -18.3% 80
859095
100105110115120
2010 2011 2012 2013 2014
FY14 Inpatient Days = 235,072 FY14 Median ALOS = 13.9 days
Rehabilitation Hospitals
Average Non-Acute Hospital
Psychiatric Hospitals
Chronic Care Hospitals
Percentage calculations may not sum to 100% due to rounding
XX
Payer mix The cohort’s average share of business from federal, state, and commercial payers is outlined. The average payer mix for all non-acute hospitals and for each of the other non-acute hospital cohorts is shown for comparison.
Change in volume of inpatient days
Massachusetts Hospital Profiles - Data through Fiscal Year 2014
Inpatient casesEach cohort hospital’s proportion of cohort-type discharges statewide (e.g., rehabilitation hospital’s proportion of total chronic and rehabilitation discharges) for FY14 are displayed in the top graph. Note that some cohort hospitals treat other types of cases as well. The bottom graph shows the cohort hospitals’ total number of discharges for the cohort type, and compares it to the number of discharges of that type that come from other non-acute hospitals and from acute hospitals.
Change in the median of the cohort hospitals’ average length of stay
List of hospitals in cohort
This sheet provides a brief introduction to the metrics on the non-acute hospital cohort-level profiles. Definitions and notes on all metrics are available in the technical appendix.
HOW TO READ NON-ACUTE HOSPITAL COHORT PROFILES – FISCAL YEAR 2014
center for health information and analysis Diii
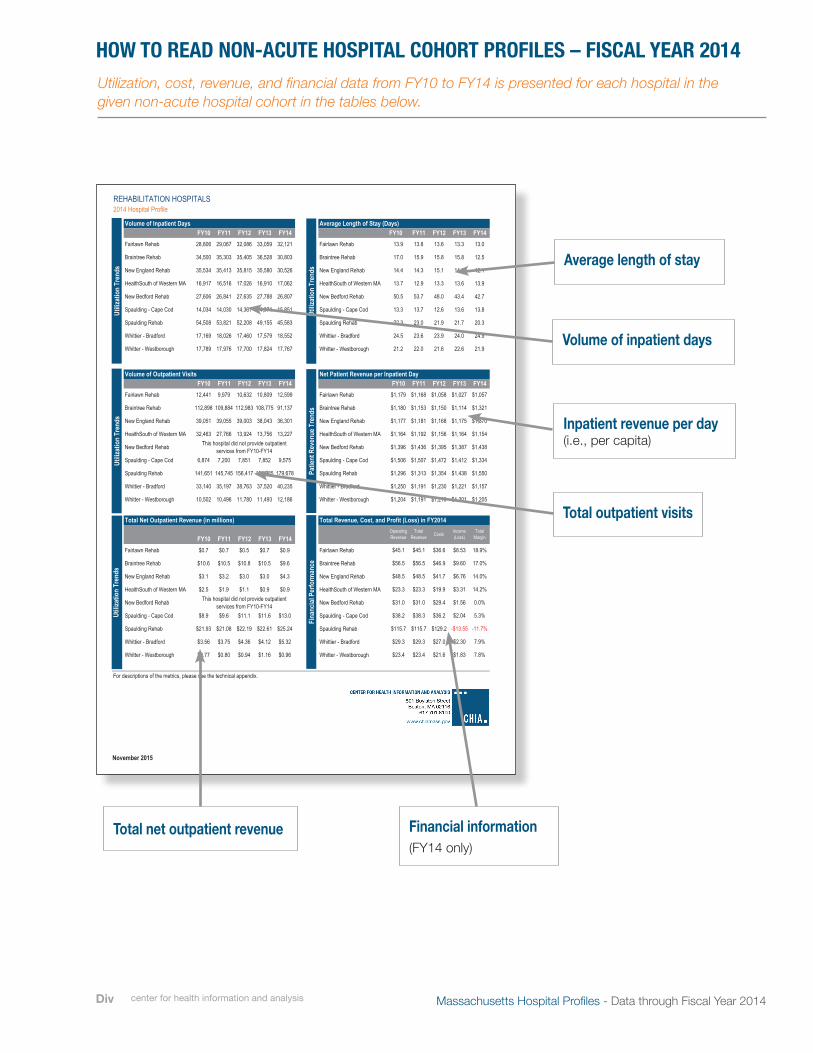
Volume of Inpatient Days Average Length of Stay (Days)FY10
Volume of Outpatient Visits Net Patient Revenue per Inpatient Day
Total Net Outpatient Revenue (in millions) Total Revenue, Cost, and Profit (Loss) in FY2014
For descriptions of the metrics, please see the technical appendix.
$2.04
-$13.55
$2.30
$1.83
$31.0
$23.3
$48.5
$56.5
$45.1 $8.53
$9.60
$6.76
$3.31
$1.56
$27.0
$21.6$23.4
$29.3
$115.7
$38.3
$36.6
$41.7
$19.9
$29.4
$36.2
$129.2
$0.96
Operating Revenue
Total Revenue Costs Income
(Loss)
$45.1
$56.5
$48.5
$23.3
$31.0
$9.6
$4.3
$0.9
$13.0
$25.24 Spaulding Rehab
Whittier - Bradford
Whitter - Westborough
Fairlawn Rehab
Braintree Rehab
New England Rehab
$11.6
$0.9
$3.0
$10.5
$0.7
$1.9
$3.2
$10.5
$0.7
This hospital did not provide outpatient services from FY10-FY14
$3.75
$21.08
$9.6
$10.6
$3.1
$2.5
$8.9
$21.93
FY10 FY11 FY12 FY13 FY14$0.7 $0.9
158,985 179,678
37,520 40,235
11,493 12,186
FY1012,441
112,898
39,051
32,463 13,756 13,227
39,055
109,884
9,979 10,809 12,599
108,775 91,137
38,043 36,301
10,632
This hospital did not provide outpatient services from FY10-FY14
FY13 FY14FY14FY13FY12FY11
$1,438
$1,334
$1,550
$1,387
$1,506 $1,507 $1,472 $1,412
$1,181 $1,168 $1,175
$1,164 $1,192 $1,156 $1,164
$1,168 $1,058 $1,027
$1,157
$1,205
$1,179
$1,177
$1,396
$1,296
$1,204
Whittier - Bradford
Whitter - Westborough
$1,057
$1,321
$1,370
$1,154
Fairlawn Rehab
FY10 FY11 FY12
$1,438
$1,250 $1,191 $1,230 $1,221
$1,436 $1,395
49,155
17,579
17,824
Fairlawn Rehab
Braintree Rehab
New England Rehab
HealthSouth of Western MA
New Bedford Rehab
Spaulding - Cape Cod
Spaulding Rehab
33,059
36,528
35,580
16,910
27,788
14,974
16,917
27,606
14,034
54,508
17,169
17,789
35,815
35,405
32,08628,806
34,500
35,534
17,700
17,460
52,208
14,361
27,635
17,026
18,026
17,976
14,030
53,821
16,516
26,841
35,303
35,413
17,062
26,807
15,851
45,583
18,552
17,767 21.9
Fairlawn Rehab
Braintree Rehab
New England Rehab
HealthSouth of Western MA
New Bedford Rehab
Spaulding - Cape Cod
Spaulding Rehab
Whittier - Bradford
Whitter - Westborough
24.0
22.6
13.0
12.5
12.1
13.9
42.7
13.8
20.3
24.9
15.8
14.3
13.6
43.4
13.6
21.7
FY12
24.5 23.6 23.9
13.7 12.9 13.3
50.5 53.7 48.0
17.0 15.9 15.8
14.4 14.3 15.1
New Bedford Rehab
Spaulding - Cape Cod
Spaulding Rehab
Whittier - Bradford
Whitter - Westborough
Fairlawn Rehab
New Bedford Rehab
HealthSouth of Western MA
New England Rehab
Braintree RehabBraintree Rehab
New England Rehab
HealthSouth of Western MA 27,766
6,874
141,651
33,140
10,502 10,496
35,197
145,745
7,200 7,852
$1.16
$4.12
$22.61
$5.32
Spaulding Rehab
Whittier - Bradford
Whitter - Westborough
Fairlawn Rehab
Braintree Rehab
New England Rehab
HealthSouth of Western MA
New Bedford Rehab
Spaulding - Cape Cod
$4.36
$11.1
$3.0
$1.1
$0.5
$10.8
$0.94
$3.56
$0.77 $0.80
HealthSouth of Western MA
New Bedford Rehab
Spaulding - Cape Cod
7.8%
$38.2
$115.7
$29.3
$23.4
2014 Hospital Profile
Total Margin
Whitter - Westborough
Whittier - Bradford
Spaulding Rehab
Spaulding - Cape Cod
7.9%
5.3%
-11.7%
14.2%
0.0%
17.0%
14.0%
18.9%
$46.9
$22.19
$1,180 $1,153 $1,150 $1,114
11,780
156,417
38,763
7,851
39,003
13,924
112,983
$1,191 $1,210 $1,201
$1,313 $1,354
9,575
21.2 22.0 21.6
13.3 13.7 12.6
22.3 23.0 21.9
30,526
FY1329,067 32,121
30,803
13.613.813.9
REHABILITATION HOSPITALS
FY11FY10 FY14FY13FY12FY1113.3
FY14
Utiliz
atio
n Tr
ends
Utiliz
atio
n Tr
ends
Utiliz
atio
n Tr
ends
Patie
nt R
even
ue T
rend
s
Utiliz
atio
n Tr
ends
Fina
ncial
Per
form
ance
November 2015
Average length of stay
Volume of inpatient days
Financial information(FY14 only)
Total outpatient visits
Inpatient revenue per day (i.e., per capita)
Total net outpatient revenue
Utilization, cost, revenue, and financial data from FY10 to FY14 is presented for each hospital in the given non-acute hospital cohort in the tables below.
HOW TO READ NON-ACUTE HOSPITAL COHORT PROFILES – FISCAL YEAR 2014
center for health information and analysisDiv Massachusetts Hospital Profiles - Data through Fiscal Year 2014

Dv
2014 Hospital Profile
Hospitals in Cohort:Fairlawn Rehabilitation Hospital Spaulding Rehabilitation Hospital Cape CodBraintree Rehabilitation Hospital Spaulding Rehabilitation Hospital New England Rehabilitation Hospital Whittier Rehab Hospital BradfordHealthSouth Rehabilitation Hospital of Western Massachusetts Whittier Rehab Hospital WestboroughNew Bedford Rehabilitation Hospital
Total Beds: Average Public Payer Mix:990 (25.0% of statewide total) 72.7%, > statewide (72.0%)
Median % Occupancy: Total Gross Revenue in FY14:80.0%, < statewide (81.6%) $768 million (31.0% of statewide total)
Total Inpatient Days: Inpatient:Outpatient Revenue in FY14:235,072 (21.5% of statewide total) 83%:17% (statewide = 85%:15%)
Total Inpatient Discharges: Adjusted Cost per Inpatient Day:14,268 (23.4% of statewide total) $1,146, > statewide ($830)
Key:Cohort Statewide
REHABILITATION HOSPITALS
Rehabilitation hospitals provide intensive, post-acute rehabilitation services, such as physical, occupational, and speech therapy services. For Medicare payment purposes, hospitals as classified as rehabilitation hospitals if they provide more than 60% of their inpatient services to patients with one or more of 13 diagnoses listed in federal regulations. The nine rehabilitation hospitals treated 64% of chronic and rehabilitation cases in FY14, while other non-acute hospitals treated 29%, and acute hospitals treated 7%. All but one rehabilitation hospital was profitable in FY14, consistent with the year prior. Inpatient days decreased 4.8% between FY10 and FY14 at rehabilitation hospitals.
What proportion of total statewide chronic/rehab discharges was attributed to each of the cohort's hospitals in FY14? Overall, what proportions of total chronic/rehab discharges were attributed to acute hospitals and non-acute hospitals?
What was this cohort's average payer mix (gross charges) in FY14, and how does this compare to that of other non-acute hospital cohorts and the average non-acute hospital?
For descriptions of the metrics, please see Technical Appendix.
How has the volume of this cohort's inpatient days changed compared to FY10, and how does this compare to that of other non-acute hospitals? (FY10=100)
How has the cohort's median average length of stay (ALOS) changed compared to FY10, and how does this compare to that of other non-acute hospitals? (FY10=100)
1,619 6,354
14,268
0% 20% 40% 60% 80%
Acute HospitalsOther Non-Acute Hospitals
Rehabilitation Hospitals
At a
Glan
ce
Serv
ices
810 744 2,251 1,149 628 1,227 2,520 2,462 2,477
0% 20% 40% 60%
Whitter - WestboroughWhittier - BradfordSpaulding Rehab
Spaulding - Cape CodNew Bedford Rehab
HealthSouth of Western MANew England Rehab
Braintree RehabFairlawn Rehab
62% 31%
55% 46%
11%
34%
27% 26%
27% 36% 19% 28%
Commercial & Other
State Programs
Medicare and Other Federal
Programs
Utiliz
atio
n
-4.8%
-3.0%
80859095
100105110115120
2010 2011 2012 2013 2014
-18.3% -18.3% 80
859095
100105110115120
2010 2011 2012 2013 2014
FY14 Inpatient Days = 235,072 FY14 Median ALOS = 13.9 days
Rehabilitation Hospitals
Average Non-Acute Hospital
Psychiatric Hospitals
Chronic Care Hospitals
Percentage calculations may not sum to 100% due to rounding
XX
What changed from Non-Acute Hospital Profiles – Data through Fiscal Year 2013?
MASSACHUSETTS NON-ACUTE HOSPITAL COHORT PROFILES – FISCAL YEAR 2014
CHIA is committed to ensuring that our customers receive quality content and service, and to help us do so, we surveyed stakeholders prior to planning this year’s publication. The Hospital Profiles – FY 2014 presentation was updated to focus on the metrics and formats most valuable to our stakeholders.In addition to an updated look, CHIA made the changes noted below to the Non-Acute Hospital Profiles template.
1. In place of individual profiles for each non-acute hospital, CHIA has created cohort-level profiles for rehabilitation, chronic care, and psychiatric non-acute hospitals. Metrics remain consistent with the FY13 non-acute hospital profiles.
2. The front side of each cohort-level profile includes aggregate cohort information to display overall cohort performance on selected metrics.
3. The back side of each cohort-level profile includes data tables that display each cohort hospital’s performance on utilization, revenue, and financial metrics.
Data for each individual non-acute hospital can be found in CHIA’s online databook.
Massachusetts Hospital Profiles - Data through Fiscal Year 2014 center for health information and analysis
Volume of Inpatient Days Average Length of Stay (Days)FY10
Volume of Outpatient Visits Net Patient Revenue per Inpatient Day
Total Net Outpatient Revenue (in millions) Total Revenue, Cost, and Profit (Loss) in FY2014
For descriptions of the metrics, please see the technical appendix.
$2.04
-$13.55
$2.30
$1.83
$31.0
$23.3
$48.5
$56.5
$45.1 $8.53
$9.60
$6.76
$3.31
$1.56
$27.0
$21.6$23.4
$29.3
$115.7
$38.3
$36.6
$41.7
$19.9
$29.4
$36.2
$129.2
$0.96
Operating Revenue
Total Revenue Costs Income
(Loss)
$45.1
$56.5
$48.5
$23.3
$31.0
$9.6
$4.3
$0.9
$13.0
$25.24 Spaulding Rehab
Whittier - Bradford
Whitter - Westborough
Fairlawn Rehab
Braintree Rehab
New England Rehab
$11.6
$0.9
$3.0
$10.5
$0.7
$1.9
$3.2
$10.5
$0.7
This hospital did not provide outpatient services from FY10-FY14
$3.75
$21.08
$9.6
$10.6
$3.1
$2.5
$8.9
$21.93
FY10 FY11 FY12 FY13 FY14$0.7 $0.9
158,985 179,678
37,520 40,235
11,493 12,186
FY1012,441
112,898
39,051
32,463 13,756 13,227
39,055
109,884
9,979 10,809 12,599
108,775 91,137
38,043 36,301
10,632
This hospital did not provide outpatient services from FY10-FY14
FY13 FY14FY14FY13FY12FY11
$1,438
$1,334
$1,550
$1,387
$1,506 $1,507 $1,472 $1,412
$1,181 $1,168 $1,175
$1,164 $1,192 $1,156 $1,164
$1,168 $1,058 $1,027
$1,157
$1,205
$1,179
$1,177
$1,396
$1,296
$1,204
Whittier - Bradford
Whitter - Westborough
$1,057
$1,321
$1,370
$1,154
Fairlawn Rehab
FY10 FY11 FY12
$1,438
$1,250 $1,191 $1,230 $1,221
$1,436 $1,395
49,155
17,579
17,824
Fairlawn Rehab
Braintree Rehab
New England Rehab
HealthSouth of Western MA
New Bedford Rehab
Spaulding - Cape Cod
Spaulding Rehab
33,059
36,528
35,580
16,910
27,788
14,974
16,917
27,606
14,034
54,508
17,169
17,789
35,815
35,405
32,08628,806
34,500
35,534
17,700
17,460
52,208
14,361
27,635
17,026
18,026
17,976
14,030
53,821
16,516
26,841
35,303
35,413
17,062
26,807
15,851
45,583
18,552
17,767 21.9
Fairlawn Rehab
Braintree Rehab
New England Rehab
HealthSouth of Western MA
New Bedford Rehab
Spaulding - Cape Cod
Spaulding Rehab
Whittier - Bradford
Whitter - Westborough
24.0
22.6
13.0
12.5
12.1
13.9
42.7
13.8
20.3
24.9
15.8
14.3
13.6
43.4
13.6
21.7
FY12
24.5 23.6 23.9
13.7 12.9 13.3
50.5 53.7 48.0
17.0 15.9 15.8
14.4 14.3 15.1
New Bedford Rehab
Spaulding - Cape Cod
Spaulding Rehab
Whittier - Bradford
Whitter - Westborough
Fairlawn Rehab
New Bedford Rehab
HealthSouth of Western MA
New England Rehab
Braintree RehabBraintree Rehab
New England Rehab
HealthSouth of Western MA 27,766
6,874
141,651
33,140
10,502 10,496
35,197
145,745
7,200 7,852
$1.16
$4.12
$22.61
$5.32
Spaulding Rehab
Whittier - Bradford
Whitter - Westborough
Fairlawn Rehab
Braintree Rehab
New England Rehab
HealthSouth of Western MA
New Bedford Rehab
Spaulding - Cape Cod
$4.36
$11.1
$3.0
$1.1
$0.5
$10.8
$0.94
$3.56
$0.77 $0.80
HealthSouth of Western MA
New Bedford Rehab
Spaulding - Cape Cod
7.8%
$38.2
$115.7
$29.3
$23.4
2014 Hospital Profile
Total Margin
Whitter - Westborough
Whittier - Bradford
Spaulding Rehab
Spaulding - Cape Cod
7.9%
5.3%
-11.7%
14.2%
0.0%
17.0%
14.0%
18.9%
$46.9
$22.19
$1,180 $1,153 $1,150 $1,114
11,780
156,417
38,763
7,851
39,003
13,924
112,983
$1,191 $1,210 $1,201
$1,313 $1,354
9,575
21.2 22.0 21.6
13.3 13.7 12.6
22.3 23.0 21.9
30,526
FY1329,067 32,121
30,803
13.613.813.9
REHABILITATION HOSPITALS
FY11FY10 FY14FY13FY12FY1113.3
FY14
Utiliz
atio
n Tr
ends
Utiliz
atio
n Tr
ends
Utiliz
atio
n Tr
ends
Patie
nt R
even
ue T
rend
s
Utiliz
atio
n Tr
ends
Fina
ncial
Per
form
ance
November 2015


2014 Hospital Profile
Hospitals in Cohort:
Arbour Hospital McLean Hospital
Baldpate Hospital Walden Behavioral Care
Bournewood Hospital Westwood Pembroke Hospital
Arbour-Fuller Hospital Whittier Pavilion
Arbour-HRI Hospital
Total Beds: Average Public Payer Mix:
988 (24.9% of statewide total) 64.4%, < statewide (72.0%)
Median % Occupancy: Total Gross Revenue in FY14:
88.6%, > statewide (81.6%) $608 million (24.5% of statewide total)
Total Inpatient Days: Inpatient:Outpatient Revenue in FY14:
313,265 (28.7% of statewide total) 84%:16% (statewide = 85%:15%)
Total Inpatient Discharges: Adjusted Cost per Inpatient Day:
31,068 (51.0% of statewide total) $646, < statewide ($830)
Key:
Cohort Statewide
PSYCHIATRIC HOSPITALS
Psychiatric hospitals are licensed by the Department of Mental Health (DMH) for psychiatric services, and by the Department of Public Health (DPH) for
substance abuse services. Psychiatric hospitals treated roughly 40% of psychiatric discharges in FY14, while acute hospitals treated nearly 60% of the
psychiatric discharges in Massachusetts. Psychiatric hospitals offer a variety of mental health services, substance abuse disorder treatments, and
inpatient, outpatient, and partial hospitalization services. Seven of the nine psychiatric hospitals earned a profit in FY14.
What proportion of total statewide psychiatric discharges was
attributed to each of the cohort's hospitals in FY14? Overall, what
proportions of total psychiatric discharges were attributed to acute
hospitals and non-acute hospitals?
What was this cohort's average payer mix (gross charges) in FY14, and
how does this compare to that of other non-acute hospital cohorts and the
average non-acute hospital?
For descriptions of the metrics, please see the technical appendix.
How has the volume of this cohort's inpatient days changed
compared to FY10, and how does this compare to that of other non-
acute hospitals? (FY10=100)
How has the cohort's median average length of stay (ALOS) changed
compared to FY10, and how does this compare to that of other non-acute
hospitals? (FY10=100)
43,117
5
31,068
0% 20% 40% 60% 80%
Acute Hospitals
Other Non-Acute Hospitals
Psychiatric Hospitals
At
a G
lan
ce
Ser
vice
s
1,921
7,392
1,629
5,763
1,994
2,927
3,712
2,115
3,615
0% 20% 40% 60%
Whittier Pavilion
Westwood Pembroke Hospital
Walden Behavioral Care
McLean Hospital
Arbour-HRI Hospital
Arbour-Fuller Hospital
Bournewood Hospital
Baldpate Hospital
Arbour Hospital
31%
62% 55% 46%
34%
11% 27% 26%
36% 27% 19%
28% Commercial
& Other
State Programs
Medicare and Other Federal
Programs
Uti
lizat
ion
8.3%
-3.0%
80
85
90
95
100
105
110
115
120
2010 2011 2012 2013 2014
2.3%
-18.3%
80
85
90
95
100
105
110
115
120
2010 2011 2012 2013 2014
FY14 Inpatient Days = 313,265 FY14 Median ALOS = 10.1 days
Rehabilitation Hospitals
Average Non-Acute Hospital
Psychiatric Hospitals
Chronic Care Hospitals
Percentage calculations may not sum to 100% due to rounding
D1

Volume of Inpatient Days Average Length of Stay (Days)
FY10
Volume of Outpatient Visits Net Patient Revenue per Inpatient Day
Total Net Outpatient Revenue (in millions) Total Revenue, Cost, and Profit (Loss) in FY2014
For descriptions of the metrics, please see the technical appendix.
30,903
FY13
40,409 44,074
13,517
10.511.511.2
PSYCHIATRIC HOSPITALS
FY11FY10 FY14FY13FY12FY11
11.1
FY14
12.3 11.6 10.7
9.6 9.4 9.6
9.8 9.4 9.7
$512 $537 $553 $636
0
12,406
15,792
15,060
103,306
25,238
16,520
0
$839 $1,042 $825
$709 $731
107,244
Arbour-Fuller
Arbour-HRI
McLean
-8.7%
$188.7
$25.6
$67.1
$18.0
2014 Hospital Profile
Total
Margin
Whittier Pavilion
Westwood Pembroke
Walden Behavioral
McLean
23.8%
3.1%
12.3%
16.9%
14.7%
-4.7%
17.8%
18.5%
$4.7
$3.13
$0.01
$7.35
$3.58
$7.73
Walden Behavioral
Westwood Pembroke
Whittier Pavilion
Arbour Hospital
Baldpate Hospital
Bournewood Hospital
Arbour-Fuller
Arbour-HRI
McLean
$7.38
$5.2
$43.1
$2.3
$4.0
$5.6
$0.0
$0.00
$6.68
$0.00 $0.00
Arbour-HRI
McLean
Walden Behavioral
Westwood Pembroke
Whittier Pavilion
Arbour Hospital
Arbour-HRI
Arbour-Fuller
Bournewood Hospital
Baldpate HospitalBaldpate Hospital
Bournewood Hospital
Arbour-Fuller
15,126
13,816
102,484
7,858
15,950
0 0
16,583
7,806
102,756 104,813
10.1
10.8
5.5
8.1
11.0
9.6
9.5
11.0
FY12
11.5 10.8 11.2
9.9 10.2 10.5
10.2 10.9 10.3
6.4 6.3 6.1
6.9 7.6 7.6
32,176
18,672
58,070
16,479
79,849
19,525 10.2
Arbour Hospital
Baldpate Hospital
Bournewood Hospital
Arbour-Fuller
Arbour-HRI
McLean
Walden Behavioral
Westwood Pembroke
Whittier Pavilion
11.4
10.4
12.2
6.4
8.3
11.0
9.4
10.1
40,71940,676
16,149
26,003
18,216
79,407
15,377
57,988
23,176
30,180
76,027
18,266
57,416
13,484
33,755
23,231
14,764
27,246
15,505
80,757
18,792
Arbour Hospital
Baldpate Hospital
Bournewood Hospital
Arbour-Fuller
Arbour-HRI
McLean
Walden Behavioral
44,642
8,378
27,880
32,149
21,591
56,910
32,608
15,354
57,611
13,521
72,475
14,945
27,924
12,224
$742
$905
$687
$628
$687
$690
$989
Westwood Pembroke
Whittier Pavilion
$723
$333
$757
$650
Arbour Hospital
FY10 FY11 FY12
$795
$691 $697 $697 $717
$718 $710
FY13 FY14FY14FY13FY12FY11
$738
$1,156
$833
$727
$1,020 $1,055 $1,052 $1,111
$667 $747 $776
$640 $641 $608 $627
$699 $711 $698
FY10
27,472
0
24,766
10,335
14,143
17,405 16,071
14,251 13,912
24,553
0
28,835 37,093 38,436
0 0
25,771 22,876
26,953
FY10 FY11 FY12 FY13 FY14
$4.8 $7.4
13,398 16,820
14,219 14,832
102 2,287
$7.04
$2.18
$38.4
$0.0
$3.9
$2.6
$4.7
$35.4
$1.79
$40.7
$5.2
$4.4
$2.5
$0.0
$7.3
$5.2
$3.4
$4.0
$0.0
$5.1
$183.1
$22.5
$0.29
Operating
Revenue
Total
RevenueCosts
Income
(Loss)
$39.4
$4.5
$28.1
$25.4
$19.0
$0.0
$3.1
$4.3
$5.2
$40.5
$6.08 Walden Behavioral
Westwood Pembroke
Whittier Pavilion
Arbour Hospital
Baldpate Hospital
Bournewood Hospital
$5.92
$3.14
$15.96
($1.57)
$19.0
$25.4
$28.2
$4.5
$39.4 $7.27
($0.21)
$5.01
$4.28
$2.80
$51.1
$19.5$18.0
$67.1
$25.6
$189.0
$32.1
$23.2
$21.1
$16.2
Uti
lizat
ion
Tre
nd
s
Uti
lizat
ion
Tre
nd
s
Uti
lizat
ion
Tre
nd
s
Pat
ien
t R
even
ue
Tre
nd
s
Uti
lizat
ion
Tre
nd
s
Fin
anci
al P
erfo
rman
ce
November 2015
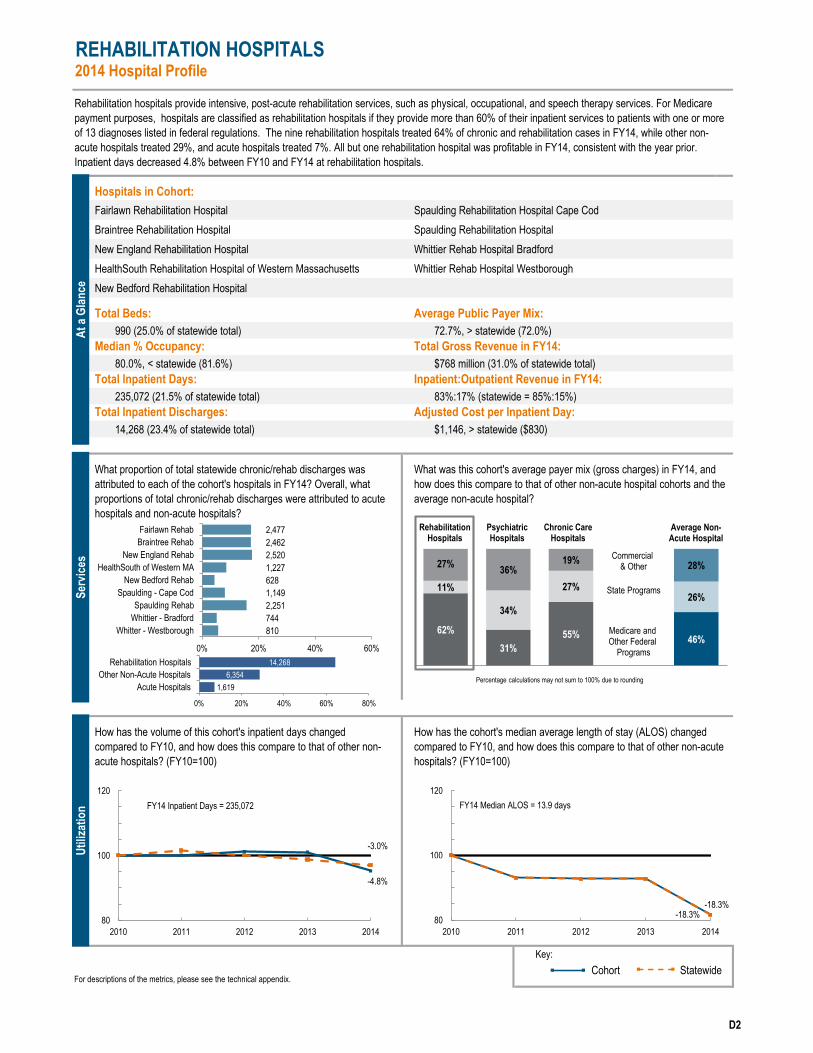
2014 Hospital Profile
Hospitals in Cohort:
Fairlawn Rehabilitation Hospital Spaulding Rehabilitation Hospital Cape CodBraintree Rehabilitation Hospital Spaulding Rehabilitation Hospital New England Rehabilitation Hospital Whittier Rehab Hospital BradfordHealthSouth Rehabilitation Hospital of Western Massachusetts Whittier Rehab Hospital WestboroughNew Bedford Rehabilitation Hospital
Total Beds: Average Public Payer Mix:
990 (25.0% of statewide total) 72.7%, > statewide (72.0%)Median % Occupancy: Total Gross Revenue in FY14:
80.0%, < statewide (81.6%) $768 million (31.0% of statewide total)Total Inpatient Days: Inpatient:Outpatient Revenue in FY14:
235,072 (21.5% of statewide total) 83%:17% (statewide = 85%:15%)Total Inpatient Discharges: Adjusted Cost per Inpatient Day:
14,268 (23.4% of statewide total) $1,146, > statewide ($830)
Key:Cohort Statewide
How has the volume of this cohort's inpatient days changed compared to FY10, and how does this compare to that of other non-acute hospitals? (FY10=100)
How has the cohort's median average length of stay (ALOS) changed compared to FY10, and how does this compare to that of other non-acute hospitals? (FY10=100)
REHABILITATION HOSPITALS
Rehabilitation hospitals provide intensive, post-acute rehabilitation services, such as physical, occupational, and speech therapy services. For Medicare payment purposes, hospitals are classified as rehabilitation hospitals if they provide more than 60% of their inpatient services to patients with one or more of 13 diagnoses listed in federal regulations. The nine rehabilitation hospitals treated 64% of chronic and rehabilitation cases in FY14, while other non-acute hospitals treated 29%, and acute hospitals treated 7%. All but one rehabilitation hospital was profitable in FY14, consistent with the year prior. Inpatient days decreased 4.8% between FY10 and FY14 at rehabilitation hospitals.
What proportion of total statewide chronic/rehab discharges was attributed to each of the cohort's hospitals in FY14? Overall, what proportions of total chronic/rehab discharges were attributed to acute hospitals and non-acute hospitals?
What was this cohort's average payer mix (gross charges) in FY14, and how does this compare to that of other non-acute hospital cohorts and the average non-acute hospital?
For descriptions of the metrics, please see the technical appendix.
1,619 6,354
14,268
0% 20% 40% 60% 80%
Acute HospitalsOther Non-Acute Hospitals
Rehabilitation Hospitals
At
a G
lan
ce
Ser
vice
s
810 744 2,251 1,149 628 1,227 2,520 2,462 2,477
0% 20% 40% 60%
Whitter - WestboroughWhittier - BradfordSpaulding Rehab
Spaulding - Cape CodNew Bedford Rehab
HealthSouth of Western MANew England Rehab
Braintree RehabFairlawn Rehab
62%
31%
55% 46%
11%
34%
27% 26%
27% 36%
19% 28%
Commercial & Other
State Programs
Medicare and Other Federal
Programs
Uti
lizat
ion
-4.8%
-3.0%
80859095
100105110115120
2010 2011 2012 2013 2014
-18.3% -18.3% 80
859095
100105110115120
2010 2011 2012 2013 2014
FY14 Inpatient Days = 235,072 FY14 Median ALOS = 13.9 days
Rehabilitation Hospitals
Average Non-Acute Hospital
Psychiatric Hospitals
Chronic Care Hospitals
Percentage calculations may not sum to 100% due to rounding
D2

Volume of Inpatient Days Average Length of Stay (Days)
FY10
Volume of Outpatient Visits Net Patient Revenue per Inpatient Day
Total Net Outpatient Revenue (in millions) Total Revenue, Cost, and Profit (Loss) in FY2014
For descriptions of the metrics, please see the technical appendix.
13.3
FY14
REHABILITATION HOSPITALS
FY11FY10 FY14FY13FY12FY11
28,806
23.0 21.9
30,526
FY13
29,067 32,121
30,803
13.613.813.9
17,062
26,807
15,851
45,583
32,086
49,155
35,303
35,413
$1,224 $1,221 $1,214
$1,400 $1,482
9,575
21.2 22.0 21.6
Hospital information suppressed due to data concerns
FY13FY10
12,441
112,898
39,051
32,463
108,775 91,137
38,043 36,301
10,632
New Bedford Rehab
Spaulding - Cape Cod
7.8%
$38.2
$115.7
$29.3
$23.4
2014 Hospital Profile
Total Margin
Whitter - Westborough
Whittier - Bradford
Spaulding Rehab
Spaulding - Cape Cod
7.9%
5.3%
-11.7%
14.2%
0.0%
17.0%
14.0%
18.9%
$46.9
$22.19
$1,180
$1.16
$4.12
$22.61
$5.32
Spaulding Rehab
Whittier - Bradford
Whitter - Westborough
Fairlawn Rehab
Braintree Rehab
New England Rehab
HealthSouth of Western MA
New Bedford Rehab
Spaulding - Cape Cod
$4.36
$11.1
$3.0
$1.1
$0.5
$10.8
$0.94
$3.56
$0.77 $0.80
$3.75
New Bedford Rehab
Spaulding - Cape Cod
Spaulding Rehab
Whittier - Bradford
Whitter - Westborough
Fairlawn Rehab
New Bedford Rehab
HealthSouth of Western MA
New England Rehab
Braintree RehabBraintree Rehab
New England Rehab
HealthSouth of Western MA 27,766
6,874
141,651
33,140
10,502 10,496
35,197
145,745
7,200 7,852
11,780
13.6
43.4
13.6
21.7
FY12
24.5 23.6 23.9
13.7 12.9 13.3
50.5 53.7 48.0
17.0 15.9 15.8
14.4 14.3 15.1
13.3 13.7 12.6
22.3
18,552
17,767 21.9
Fairlawn Rehab
Braintree Rehab
New England Rehab
HealthSouth of Western MA
New Bedford Rehab
Spaulding - Cape Cod
Spaulding Rehab
Whittier - Bradford
Whitter - Westborough
24.0
22.6
13.0
12.5
12.1
13.9
42.7
13.8
20.3
24.9
15.8
14.335,534
17,700
17,460
52,208
14,361
27,635
17,026
18,026
17,976
14,030
53,821
16,516
26,841
17,579
17,824
Fairlawn Rehab
Braintree Rehab
New England Rehab
HealthSouth of Western MA
New Bedford Rehab
Spaulding - Cape Cod
Spaulding Rehab
33,059
36,528
35,580
16,910
27,788
14,974
16,917
27,606
14,034
54,508
17,169
17,789
35,815
35,40534,500
$1,272
$1,234
$1,179
$1,177
$1,396
$1,296
$1,204
Whittier - Bradford
Whitter - Westborough
$1,373
$1,501
$1,425
$1,315
Fairlawn Rehab
FY10 FY11 FY12
$1,545
$1,250 $1,241 $1,230 $1,230
$1,017 $1,129
$1,655
$1,466
$1,506 $1,469 $1,497 $1,580
$1,222 $1,276 $1,290
$1,164 $1,278 $1,311 $1,355
FY14FY14FY13FY12FY11
$1,102
$1,563
$1,268 $1,299 $1,340
$1,248 $1,246 $1,304
7,851
39,003
13,924
112,983
13,756 13,227
39,055
109,884
9,979 10,809 12,599
FY12 FY13 FY14
$0.7 $0.9
158,985 179,678
37,520 40,235
11,493 12,186
156,417
38,763
$21.08
$9.6
$10.6
$3.1
$2.5
$8.9
$21.93
FY10 FY11
$11.6
$0.9
$3.0
$10.5
$0.7
$1.9
$3.2
$10.5
$0.7
Hospital information suppressed due to data concerns
$36.2
$129.2
$0.96
Operating Revenue
Total Revenue Costs Income
(Loss)
$45.1
$56.5
$48.5
$23.3
$31.0
$9.6
$4.3
$0.9
$13.0
$25.24 Spaulding Rehab
Whittier - Bradford
Whitter - Westborough
Fairlawn Rehab
Braintree Rehab
New England Rehab
HealthSouth of Western MA
$2.04
($13.55)
$2.30
$1.83
$31.0
$23.3
$48.5
$56.5
$45.1 $8.53
$9.60
$6.76
$3.31
$1.56
$27.0
$21.6$23.4
$29.3
$115.7
$38.3
$36.6
$41.7
$19.9
$29.4
Uti
lizat
ion
Tre
nd
s
Uti
lizat
ion
Tre
nd
s
Uti
lizat
ion
Tre
nd
s
Pat
ien
t R
even
ue
Tre
nd
s
Uti
lizat
ion
Tre
nd
s
Fin
anci
al P
erfo
rman
ce
November 2015
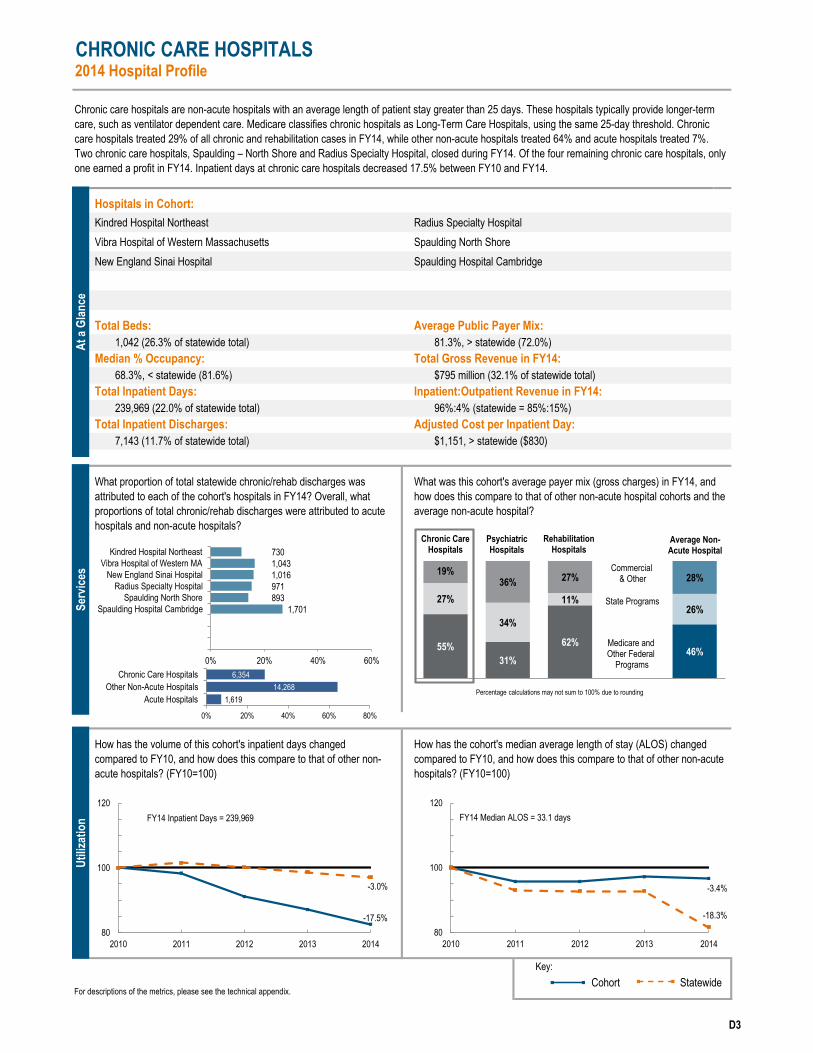
2014 Hospital Profile
Hospitals in Cohort:
Kindred Hospital Northeast Radius Specialty Hospital
Vibra Hospital of Western Massachusetts Spaulding North Shore
New England Sinai Hospital Spaulding Hospital Cambridge
Total Beds: Average Public Payer Mix:
1,042 (26.3% of statewide total) 81.3%, > statewide (72.0%)
Median % Occupancy: Total Gross Revenue in FY14:
68.3%, < statewide (81.6%) $795 million (32.1% of statewide total)
Total Inpatient Days: Inpatient:Outpatient Revenue in FY14:
239,969 (22.0% of statewide total) 96%:4% (statewide = 85%:15%)
Total Inpatient Discharges: Adjusted Cost per Inpatient Day:
7,143 (11.7% of statewide total) $1,151, > statewide ($830)
Key:
Cohort Statewide
CHRONIC CARE HOSPITALS
Chronic care hospitals are non-acute hospitals with an average length of patient stay greater than 25 days. These hospitals typically provide longer-term
care, such as ventilator dependent care. Medicare classifies chronic hospitals as Long-Term Care Hospitals, using the same 25-day threshold. Chronic
care hospitals treated 29% of all chronic and rehabilitation cases in FY14, while other non-acute hospitals treated 64% and acute hospitals treated 7%.
Two chronic care hospitals, Spaulding – North Shore and Radius Specialty Hospital, closed during FY14. Of the four remaining chronic care hospitals, only
one earned a profit in FY14. Inpatient days at chronic care hospitals decreased 17.5% between FY10 and FY14.
What proportion of total statewide chronic/rehab discharges was
attributed to each of the cohort's hospitals in FY14? Overall, what
proportions of total chronic/rehab discharges were attributed to acute
hospitals and non-acute hospitals?
What was this cohort's average payer mix (gross charges) in FY14, and
how does this compare to that of other non-acute hospital cohorts and the
average non-acute hospital?
For descriptions of the metrics, please see the technical appendix.
How has the volume of this cohort's inpatient days changed
compared to FY10, and how does this compare to that of other non-
acute hospitals? (FY10=100)
How has the cohort's median average length of stay (ALOS) changed
compared to FY10, and how does this compare to that of other non-acute
hospitals? (FY10=100)
1,619
14,268
6,354
0% 20% 40% 60% 80%
Acute Hospitals
Other Non-Acute Hospitals
Chronic Care Hospitals
At
a G
lan
ce
Ser
vice
s
1,701
893
971
1,016
1,043
730
0% 20% 40% 60%
Spaulding Hospital Cambridge
Spaulding North Shore
Radius Specialty Hospital
New England Sinai Hospital
Vibra Hospital of Western MA
Kindred Hospital Northeast
55%
31%
62% 46%
27%
34%
11% 26%
19% 36% 27% 28%
Commercial & Other
State Programs
Medicare and Other Federal
Programs
Uti
lizat
ion
-17.5%
-3.0%
80
85
90
95
100
105
110
115
120
2010 2011 2012 2013 2014
-3.4%
-18.3%
80
85
90
95
100
105
110
115
120
2010 2011 2012 2013 2014
FY14 Inpatient Days = 239,969 FY14 Median ALOS = 33.1 days
Rehabilitation Hospitals
Average Non-Acute Hospital
Psychiatric Hospitals
Chronic Care Hospitals
Percentage calculations may not sum to 100% due to rounding
D3

Volume of Inpatient Days Average Length of Stay (Days)
FY10
Volume of Outpatient Visits Net Patient Revenue per Inpatient Day
Total Net Outpatient Revenue (in millions) Total Revenue, Cost, and Profit (Loss) in FY2014
For descriptions of the metrics, please see the technical appendix.
($2.67)
$44.2
$32.5
$43.2
$55.3
$36.9 ($0.14)
$1.99
($2.18)
($2.88)
($8.47)
$71.1
$37.1
$45.4
$35.4
$52.7
$73.8
Operating
Revenue
Total
RevenueCosts
Income
(Loss)
$35.7
$55.3
$43.2
$32.5
$44.2
$0.0
$1.9
$0.0
$7.7
$0.0
Kindred Northeast
Vibra of Western MA
New England Sinai
$0.0
$6.9
$0.0
$2.2
$0.0
$0.2
$6.1
($4.7)
$3.4
$0.0
$0.1
$0.0
$0.0
$2.7
($5.1)
$5.1
$0.0
FY10 FY11 FY12 FY13 FY14
$0.1 $0.1
FY10
0
0
85,304
0
62,769
0 0
75,890 80,658
72,423
0
0 0 0
0 0
32,520 29,013
0
FY13 FY14FY14FY13FY12FY11
$949
$1,390
$980
$1,156 $1,244 $1,284 $1,350
$1,238 $1,251 $1,224
$1,275 $1,318 $1,393 $1,159
$1,048 $1,101 $1,012$1,007
$1,206
$910
$1,062
$971
$1,155
$1,064
Kindred Northeast
FY10 FY11 FY12
$945 $970
Kindred Northeast
Vibra of Western MA
New England Sinai
Radius Specialty
Spaulding - North Shore
Spaulding - Cambridge
34,555
54,367
44,873
30,625
39,262
49,507
36,038
41,143
44,798
47,481
55,614
37,47451,090
58,260
59,404
49,917
41,986
32,382
50,318
32,665
41,293
57,745
57,612
30,325
37,849
47,169
Kindred Northeast
Vibra of Western MA
New England Sinai
Radius Specialty
Spaulding - North Shore
Spaulding - Cambridge
46.2
52.9
34.9
31.2
22.6
27.7
48.6
38.3
28.2
21.7
28.2
FY12
31.6 31.1 30.7
23.0 23.3 22.7
54.2 51.2 48.0
36.8 34.4 34.8
Spaulding - North Shore
Spaulding - Cambridge
Kindred Northeast
Spaulding - North Shore
Radius Specialty
New England Sinai
Vibra of Western MAVibra of Western MA
New England Sinai
Radius Specialty
67,543
0
1,359 386 323
Kindred Northeast
Vibra of Western MA
New England Sinai
Radius Specialty
Spaulding - North Shore
Spaulding - Cambridge
$6.9
$0.0
$4.2
($6.4)
$0.4
$0.0
Radius Specialty
Spaulding - North Shore
Spaulding - Cambridge $71.1
2014 Hospital Profile
Total
Margin
Spaulding - Cambridge
-3.8%
-8.9%
-19.2%
0.0%
-5.0%
-0.4%
$53.3
$892 $864 $963 $916
74,504
249
94,938
0
0
282
25.4 26.8 26.5
35,467
FY13
46,258 33,984
55,175
43.941.344.3
CHRONIC CARE HOSPITALS
FY11FY10 FY14FY13FY12FY11
54.7
FY14
Uti
lizat
ion
Tre
nd
s
Uti
lizat
ion
Tre
nd
s
Uti
lizat
ion
Tre
nd
s
Pat
ien
t R
even
ue
Tre
nd
s
Uti
lizat
ion
Tre
nd
s
Fin
anci
al P
erfo
rman
ce
November 2015

2014 Hospital Profile
$0
Total
Revenue
$36
$32
$31
Operating
Revenue
$32
$31
$0
$0
$2.2
Non-Operating
Revenue
$0
$5.1$40
$38
$36
$29
CostsTotal
Profit/Loss
$2.0
Net Inpatient Service
Revenue per Day
Outpatient Revenue (millions)
Operating Margin
Total Margin
$665 $655 $642
What was the hospital's overall payer mix
(gross charges) and how does this hospital
compare to the average non-acute hospital's
payer mix?
Average Length of Stay
Inpatient Days
88,423 93,369 103,879 108,451 116,378
6.0
36,334
Outpatient Visits
$10.9
6.4% 6.9% 6.6% 12.6%
Revenue, Cost, & Profit/Loss (in millions)
FY
2010
2011 $30
2012
$35
$34
2013
$2.4
$4.8
$653 $644
12.8%
$6.8 $7.1 $9.0 $10.2
12.8%
6.4% 6.9% 6.5% 12.6%
Non-Acute Specialty Hospitals
Hebrew Rehabilitation Hospital is a non-profit specialty hospital
located in Boston. Hebrew Rehabilitation specializes in providing hospital and
community health care services to geriatric patients. It provides long-term
acute, rehabilitative, outpatient, adult day health, and home health care
services. It is also the healthcare facility for the Hebrew SeniorLife provider
organization, a provider of elder care. Outpatient visits increased 108.0% at
the hospital from FY10 to FY14. Hebrew Rehabilitation reported a loss from
FY10 through FY14, with a total margin of -7.5% and an operating margin of -
7.9% in FY14
Franciscan Hospital for Children is a non-profit specialty hospital
located in Brighton. It focuses on providing chronic care and rehabilitation
services to a pediatric population. It offers inpatient, residential, educational,
surgical, outpatient, and home care programs for children with special health
care needs. Between FY10 and FY14, inpatient days increased 25.5% at the
hospital, and outpatient visits increased 14.0%. In the five year period from
FY10 to FY14, Franciscan Hospital for Children reported a profit each year
except for FY12.
AdCare Hospital of Worcester is a for-profit specialty hospital located
in Worcester. It is the only private non-acute care hospital that concentrates
on substance abuse, which it focuses on exclusively. It provides detox and
inpatient services, as well as outpatient services. From FY10 to FY14,
inpatient days at AdCare increased 3.1%. Outpatient visits increased by
31.6%, while outpatient revenue increased by 60.0% during that period. From
FY10 to FY14, AdCare had positive operating and total margins, earning a
12.8% total margin in FY14.
2014
36,874 37,588 36,992 37,474
$40
$38
$0
FY10 FY11 FY12 FY13 FY14
6.0 6.0 6.1 5.9
$33
At a Glance
AdCare Hospital of Worcester Worcester, MA
Payer Mix
TOTAL STAFFED BEDS:
% OCCUPANCY:
INPATIENT DISCHARGES in FY14:
TAX STATUS:
PUBLIC PAYER MIX:
TOTAL REVENUE in FY14:
INPATIENT:OUTPATIENT REVENUE in FY14:
ADJUSTED COST PER INPATIENT DAY:
CHANGE in OWNERSHIP (FY10-FY14):
40% 46%
34% 26%
26% 28% Commercial
& Other
State Programs
Medicare and Other Federal
Programs
AdCare Hospital
Average Non- Acute Hospital
Percentage calculations may not sum to 100% due to rounding.
114
90.1%
6,203
74%
$40,042,950
For profit
67%:33%
$546
N/A
Franciscan Hospital for Children Hebrew Rehabilitation Hospital
D4

($8.7)2014 $116 $116 $0 $125
($10.2)
2013 $114 $114 $0 $125 ($10.0)
2012 $116 $116 $0 $127
$0 $122 ($9.3)
2010 $113 $113 $1 $124
Revenue, Cost, & Profit/Loss (in millions)
FYTotal
Revenue
Operating
Revenue
Non-Operating
RevenueCosts
Total
Profit/Loss
($11.0)
2011 $112 $112
-9.1% -9.1% -7.9%
Total Margin -9.7% -8.3% -8.7% -8.7% -7.5%
Outpatient Revenue (millions) $1.2 $2.5 $3.6 $2.3 $2.7
243,670 244,093
Outpatient Visits 24,453 36,309 46,552 47,298 50,859
Average Length of Stay 161.9 165.1 172.5 170.8 171.5
$2.8
FY10 FY11 FY12
Inpatient Days 244,927 247,779 248,385
Net Inpatient Service
Revenue per Day$397 $393 $392
Operating Margin -10.2% -8.7%
$399 $398
2014 $61 $61 $0 $58
($0.4)
2013 $56 $56 $0 $55 $0.7
2012 $52 $52 $0 $53
$0.3
2011 $51 $51 $0 $50 $0.5
2010 $48 $48 $0 $47
Revenue, Cost, & Profit/Loss (in millions)
FYTotal
Revenue
Operating
Revenue
Non-Operating
RevenueCosts
Total
Profit/Loss
4.6%
Total Margin 0.6% 0.9% -0.8% 1.3% 4.6%
Operating Margin 0.6% 0.9% -0.8% 1.3%
$815
Outpatient Revenue (millions) $16.8 $14.6 $15.6 $13.0 $13.2
Net Inpatient Service
Revenue per Day$1,023 $864 $847 $829
21,604
Outpatient Visits 49,155 57,323 52,668 54,920 56,018
Inpatient Days 17,219 20,389 20,802 21,235
Average Length of Stay 28.5 27.6 27.3 26.4 28.0
FY10 FY11 FY12 FY13 FY14 FY13 FY14
What was the hospital's overall payer mix
(gross charges) and how does this hospital
compare to the average non-acute hospital's
payer mix?
What was the hospital's overall payer mix
(gross charges) and how does this hospital
compare to the average non-acute hospital's
payer mix?
At a Glance
Franciscan Hospital for Children Brighton, MA
Payer Mix
TOTAL STAFFED BEDS:
% OCCUPANCY:
INPATIENT DISCHARGES in FY14:
TAX STATUS:
PUBLIC PAYER MIX:
TOTAL REVENUE in FY14:
INPATIENT:OUTPATIENT REVENUE in FY14:
ADJUSTED COST PER INPATIENT DAY:
CHANGE in OWNERSHIP (FY10-FY14): 1%
46%
63% 26%
36% 28% Commercial
& Other
State Programs
Medicare and Other Federal
Programs
Franciscan Hospital
Average Non- Acute Hospital
Percentage calculations may not sum to 100% due to rounding.
112
52.9%
772
64%
$60,723,738
Non-profit
57%:43%
$1,171
N/A
At a Glance
Hebrew Rehabilitation Hospital Boston, MA
Payer Mix
TOTAL STAFFED BEDS:
% OCCUPANCY:
INPATIENT DISCHARGES in FY14:
TAX STATUS:
PUBLIC PAYER MIX:
TOTAL REVENUE in FY14:
INPATIENT:OUTPATIENT REVENUE in FY14:
ADJUSTED COST PER INPATIENT DAY:
CHANGE in OWNERSHIP (FY10-FY14):
34% 46%
51% 26%
15% 28%
Commercial & Other
State Programs
Medicare and Other Federal
Programs
Hebrew Rehab Hospital
Average Non- Acute Hospital
Percentage calculations may not sum to 100% due to rounding.
717
93.3%
1,423
85%
$115,959,000
Non-profit
96%:4%
$461
N/A

NOVEMBER 2015
CHIAcenter
for healthinformation
and analysis
MASSACHUSETTS HOSPITAL P R O F I L E S
CENTER FOR HEALTH INFORMATION AND ANALYSIS
D A T A T H R O U G H FISCAL YEAR 2014
TECHNICAL APPENDIX


E-1
Technical Appendix Overview
Acute and non-acute hospitals included in Massachusetts Hospital Profiles- Data through Fiscal Year 2014 were profiled on service, payer mix, quality, utilization, revenue, and financial performance. Multi-acute hospital systems were profiled based on financial performance and utilization metrics. Details for each of these metrics are included in this technical appendix. The Center for Health Information and Analysis (CHIA) relied on the following primary data sources to present financial information: the DHCFP-403 Annual Hospital Cost Report (403 Cost Report), the Hospital Discharge Database (HDD), the Hospital Standardized Financial Statement Database, and Audited Financial Statements. Unless otherwise noted, metrics included in this report are based on financial data reported by acute and non-acute hospitals from Fiscal Year (FY) 2010 to FY14. Discharge data from FY14 included in the acute hospital analysis was reported by acute hospitals in the Hospital Discharge Database, unless otherwise noted. Descriptive acute and non-acute hospital information is from FY14. Hospital 403 Cost Report: The 403 Cost Report is submitted each year by acute and non-acute hospitals and it contains data on costs, revenues, and utilization statistics. Acute hospitals are required to complete the 403 Cost Report based on a fiscal year end of September 30 regardless of their actual fiscal year end. Non-acute hospitals complete the 403 Cost Report based on their actual year end. Hospital Discharge Database (HDD): HDD data is submitted quarterly by acute hospitals and it contains patient-level data identifying charges, days, and diagnostic information for all acute inpatient discharges. CHIA used FY14 HDD data for the service metrics, which includes discharges between October 1, 2013 and September 30, 2014 for all acute hospitals. Hospital Standardized Financial Statements: The Hospital Standardized Financial Statements are submitted quarterly and annually by acute hospitals. They contain information on the hospital’s assets, liabilities, revenues, expenses, and profits or losses. They reflect only the hospital’s financial information; they do not reflect financial information for any larger health system with which a hospital may be affiliated. Audited Financial Statements: Audited Financial Statements are submitted annually by hospitals (or their parent organizations, if applicable). In addition to the financial figures that are found in the Hospital Standardized Financial Statements, the Audited Financial Statements contain an opinion from an independent auditor as well as notes from hospital or system management that elaborate on the financial performance and standing of the hospital or system during the fiscal year. Audited Financial Statements were used as a source primarily for the multi-acute hospital system profiles. Quality Data Sources: To compile the hospital quality measures, CHIA relied on the following primary data sources: HDD, the Centers for Medicare & Medicaid Services (CMS) Hospital Compare database, and The Leapfrog Group. Data Verification: CHIA surveyed payer representatives, acute and non-acute provider representatives, and other state agencies, to refine profile metrics and overall products for this year’s publication. Each year’s Hospital 403 Cost Reports, hospital and multi-acute hospital system financial statements, Relative Price, and quality data reports were verified in accordance with respective reporting regulation requirements. Additional data verification forms that included each hospital’s reported financial data were sent to each acute and non-acute hospital for FY10-FY14.

E-2
Acute Hospitals
An acute hospital is a hospital that is licensed by the Massachusetts Department of Public Health and contains a majority of medical-surgical, pediatric, obstetric, and maternity beds. Multi-Acute Hospital System Affiliation and Location Massachusetts hospitals are generally affiliated with a larger health system. Health systems may include multiple hospitals and/or provider organizations while others may have only one hospital with associated providers or provider organizations. Multi-acute hospital system membership identifies those health systems with more than one acute hospital. This information was derived from Audited Financial Statements. Below is a list of Massachusetts multi-acute hospital systems and their acute hospital members as of the end of each system’s fiscal year 2014:
Multi-Acute Hospital System Acute Hospital Member
Baystate Health Baystate Franklin Medical Center Baystate Mary Lane Hospital Baystate Medical Center Baystate Wing Hospital
1
Berkshire Health Systems Berkshire Medical Center Fairview Hospital
Cape Cod Healthcare Cape Cod Hospital Falmouth Hospital
CareGroup Beth Israel Deaconess Hospital – Milton Beth Israel Deaconess Hospital – Needham Beth Israel Deaconess Hospital – Plymouth Beth Israel Deaconess Medical Center Mount Auburn Hospital New England Baptist Hospital
Heywood Healthcare Athol Hospital Heywood Hospital
Kindred Healthcare^ Kindred Hospital – Boston Kindred Hospital – Boston North Shore
Lahey Health System Lahey Hospital & Medical Center Northeast Hospital Winchester Hospital
Partners HealthCare System Brigham and Women’s Hospital Brigham and Women’s Faulkner Hospital Cooley Dickinson Hospital Martha’s Vineyard Hospital Massachusetts General Hospital Nantucket Cottage Hospital Newton-Wellesley Hospital North Shore Medical Center
Shriners Hospitals for Children^ Shriners Hospitals for Children – Boston Shriners Hospitals for Children – Springfield
Steward Health Care System2 Merrimack Valley Hospital
3
Morton Hospital
1 Baystate Wing Hospital (formerly Wing Memorial Hospital) joined Baystate Health effective September 1, 2014. For
the preceding October 1, 2013 through August 30, 2014 of FY14, Wing Memorial Hospital was a member of UMass Memorial Health Care. 2 Steward Health Care System information is based on its FY13 Audited Financial Statements.
3 Merrimack Valley Hospital merged with Steward Holy Family in August 2014.

E-3
Acute Hospitals
Nashoba Valley Medical Center Quincy Medical Center
4
Steward Carney Hospital Steward Good Samaritan Medical Center Steward Holy Family Hospital Steward Norwood Hospital Steward Saint Anne’s Hospital Steward St. Elizabeth’s Medical Center
UMass Memorial Health Care Clinton Hospital HealthAlliance Hospital Marlborough Hospital UMass Memorial Medical Center
Tenet Healthcare^ MetroWest Medical Center Saint Vincent Hospital
^ Kindred Healthcare, Inc., Tenet Healthcare Corporation, and Shriners Hospitals for Children are multi-state health systems with a large presence outside of Massachusetts. Each owns two acute hospitals in Massachusetts (Kindred owns Kindred Hospital – Boston and Kindred Hospital – Boston North Shore; Tenet owns MetroWest Medical Center and Saint Vincent Hospital; Shriners owns Shriners Hospitals for Children – Boston and Shriners Hospitals for Children - Springfield). Due to their broad presence outside of Massachusetts, CHIA did not include Kindred, Tenet, or Shriners in the multi-acute hospital system profiles chapter.
Regional Definitions The location for each acute hospital in this report was obtained, where possible, from hospital licensing information collected by the Massachusetts Department of Public Health (DPH). The hospital license includes information on a hospital’s campuses and satellite offices. The geographic regions presented in this report are derived from the Health Policy Commission (HPC) static geographic regions.
5 The HPC regions were rolled up into larger regions for this publication to
facilitate better comparison within each geographic area. The acute hospitals and the regions to which they were assigned are:
Massachusetts Region Acute Hospital Assigned to Region
Metro Boston Beth Israel Deaconess Hospital – Milton Beth Israel Deaconess Hospital – Needham Beth Israel Deaconess Medical Center Boston Children’s Hospital Boston Medical Center Brigham and Women’s Faulkner Hospital Brigham and Women’s Hospital Cambridge Health Alliance Dana-Farber Cancer Institute Hallmark Health Kindred Hospital- Boston Massachusetts Eye and Ear Infirmary Massachusetts General Hospital Mount Auburn Hospital New England Baptist Hospital Newton-Wellesley Hospital Shriners Hospitals for Children – Boston Steward Carney Hospital Steward St. Elizabeth’s Medical Center Tufts Medical Center
4 Quincy Medical Center closed in December 2014.
5 For descriptions of the regions, see http://www.mass.gov/anf/docs/hpc/2013-cost-trends-report-technical-appendix-
b3-regions-of-massachusetts.pdf (last accessed October 28, 2015).

E-4
Acute Hospitals
Northeastern Massachusetts Anna Jaques Hospital Emerson Hospital Kindred Hospital- Boston North Shore Lahey Hospital & Medical Center Lawrence General Hospital Lowell General Hospital Merrimack Valley Hospital
6
Nashoba Valley Medical Center North Shore Medical Center Northeast Hospital Steward Holy Family Hospital Winchester Hospital
Central Massachusetts Athol Hospital Clinton Hospital Harrington Memorial Hospital HealthAlliance Hospital Heywood Hospital Saint Vincent Hospital UMass Memorial Medical Center
Cape and Islands Cape Cod Hospital Falmouth Hospital Martha’s Vineyard Hospital Nantucket Cottage Hospital
Metro West Marlborough Hospital MetroWest Medical Center Milford Regional Medical Center Steward Norwood Hospital Sturdy Memorial Hospital
Western Massachusetts Baystate Franklin Medical Center Baystate Mary Lane Hospital Baystate Medical Center Baystate Noble Hospital Baystate Wing Hospital Berkshire Medical Center Cooley Dickinson Hospital Fairview Hospital Holyoke Medical Center Mercy Medical Center Shriners Hospitals for Children – Springfield
Metro South Beth Israel Deaconess Hospital – Plymouth Morton Hospital Quincy Medical Center
7
Signature Healthcare Brockton Hospital South Shore Hospital Steward Good Samaritan Medical Center
Southcoast Steward Saint Anne’s Hospital Southcoast Hospitals Group
6 Merrimack Valley Hospital merged with Steward Holy Family in August 2014.
7 Quincy Medical Center closed in December 2014.
E-5
Acute Hospitals
Public Payer Designations Certain acute hospitals in Massachusetts have a special status among public payers due to their rural or relatively isolated locations: Critical Access Hospital is a state designation given to hospitals that have no more than 25 acute beds, are located in a rural area, and are more than a 35-mile drive from the nearest hospital or more than a 15- mile drive in areas with mountainous terrains or secondary roads.
8 Critical Access Hospitals receive cost-
based payments from Medicare and MassHealth. Sole Community Hospital is a Medicare designation given to hospitals that are located in rural areas or are located in areas where it is difficult to access another hospital quickly. These hospitals are eligible to receive higher inpatient payments from Medicare than other hospitals.
9
8 In addition, Critical Access Hospitals include hospitals that were, prior to January 1, 2006, designated by the State
as a "necessary provider" of health care services to residents in the area. There are additional requirements to be
designated as a Critical Access Hospital, including length of stay requirements, staffing requirements, and other
provisions. See 42 CFR 485.601-647. 9 42 CFR 412.92.

E-6
Acute Hospital Cohorts
In order to develop comparative analytics, CHIA assigned hospitals to peer cohorts. The acute hospitals were assigned to one of the following cohorts according to the criteria below: Academic medical centers (AMCs) are a subset of teaching hospitals. AMCs are characterized by (1) extensive research and teaching programs and (2) extensive resources for tertiary and quaternary care, and are (3) principal teaching hospitals for their respective medical schools and (4) full service hospitals with case mix intensity greater than 5% above the statewide average. Teaching hospitals are those hospitals that report at least 25 full-time equivalent medical school residents per one hundred inpatient beds in accordance with Medicare Payment Advisory Commission (MedPAC) and do not meet the criteria to be classified as AMCs. Community hospitals are hospitals that are not teaching hospitals and have a public payer mix of less than 63%. Community-Disproportionate Share Hospitals (DSH)
10 are community hospitals that are
disproportionately reliant on public revenues by virtue of a public payer mix of 63% or greater. Public payers include Medicare, MassHealth and other government payers, including Commonwealth Care and the Health Safety Net. Specialty hospitals were not included in any cohort comparison analysis due the unique patient populations they serve and/or the unique sets of services they provide. Below is a list of acute hospital cohorts and the hospitals assigned to each, based on FY14 data:
Cohort Designation Acute Hospital
AMC Beth Israel Deaconess Medical Center Boston Medical Center Brigham and Women’s Hospital Massachusetts General Hospital Tufts Medical Center UMass Memorial Medical Center
Teaching Baystate Medical Center Berkshire Medical Center Brigham and Women’s Faulkner Hospital Cambridge Health Alliance Lahey Hospital & Medical Center Mount Auburn Hospital Saint Vincent Hospital Steward Carney Hospital Steward St. Elizabeth’s Medical Center
Community Anna Jaques Hospital Baystate Mary Lane Hospital Beth Israel Deaconess Hospital – Milton Beth Israel Deaconess Hospital – Needham Cooley Dickinson Hospital Emerson Hospital Hallmark Health MetroWest Medical Center Milford Regional Medical Center
10
M.G.L. c. 6D, Section 1 defines a Disproportionate Share Hospital (DSH) as a hospital with a minimum of 63% of
patient charges attributed to Medicare, Medicaid, and other government payers, including Commonwealth Care and
the Health Safety Net.

E-7
Acute Hospital Cohorts
Nantucket Cottage Hospital Newton-Wellesley Hospital Northeast Hospital South Shore Hospital Winchester Hospital
Community-DSH Athol Hospital Baystate Franklin Medical Center Baystate Noble Hospital Baystate Wing Hospital Beth Israel Deaconess Hospital – Plymouth^ Cape Cod Hospital Clinton Hospital Fairview Hospital Falmouth Hospital Harrington Memorial Hospital HealthAlliance Hospital Heywood Hospital Holyoke Medical Center Lawrence General Hospital Lowell General Hospital^ Marlborough Hospital Martha’s Vineyard Hospital Mercy Medical Center Merrimack Valley Hospital
11
Morton Hospital Nashoba Valley Medical Center^ North Shore Medical Center Quincy Medical Center
12
Signature Healthcare Brockton Hospital Southcoast Hospitals Group Steward Good Samaritan Medical Center Steward Holy Family Hospital Steward Norwood Hospital^ Sturdy Memorial Hospital Steward Saint Anne’s Hospital
Specialty Boston Children’s Hospital Dana-Farber Cancer Institute Kindred Hospital – Boston Kindred Hospital – Boston North Shore Massachusetts Eye and Ear Infirmary New England Baptist Hospital Shriners Hospitals for Children – Boston Shriners Hospitals for Children – Springfield
^These hospitals were in different cohorts in FY13.
11
Merrimack Valley Hospital merged with Steward Holy Family in August 2014. 12
Quincy Medical Center closed in December 2014.

E-8
Acute Hospital Profiles: At a Glance
Hospital system affiliation notes with which parent company, if any, the hospital is affiliated. Change in ownership notes change in ownership during the period of the analysis. In some cases, changes in ownership may have occurred subsequent to FY14. Total staffed beds are the average number of beds during the fiscal year that were in service and staffed for patient use. Inpatient occupancy rate is the average percent of staffed inpatient beds occupied during the reporting period. Percentage of occupancy is calculated as follows: Inpatient Days divided by Weighted Average Staffed Beds times 365 (or the number of days in the reporting period). Special public funding indicates whether the hospital received Delivery System Transformation Initiative (DSTI), Infrastructure and Capacity Building (ICB) or Community Hospitals Acceleration, Revitalization and Transformation (CHART) grants. Special public funding is grant money given to hospitals by the state or federal government. The amounts listed may be total grant allocations that will be disbursed over a period of time, or a portion of a grant that was disbursed in FY14. For more information please see the Special Public Funding notes contained in Exhibit C of this appendix. Trauma Center designation is determined by the Massachusetts Department of Public Health and the American College of Surgeons, with Level 1 being the highest designation given to tertiary care facilities. Facilities can be designated as Adult and/or Pediatric Trauma Centers.
13 While there are five levels of
trauma center designations recognized nationally, Massachusetts hospitals only fall under Levels 1, 2, and 3 for Adult and/or Levels 1 and 2 for Pediatric.
Level 1 Trauma Center is a comprehensive regional resource that is a tertiary care facility central to the trauma system. A Level 1 Trauma Center is capable of providing total care for every aspect of injury, from prevention through rehabilitation. Level 2 Trauma Center is able to initiate definitive care for all injured patients, and provide 24- hour immediate coverage by general surgeons, as well as coverage by the specialties of orthopedic surgery, neurosurgery, anesthesiology, emergency medicine, radiology and critical care. Level 3 Trauma Center has demonstrated an ability to provide prompt assessment, resuscitation, surgery, intensive care and stabilization of injured patients and emergency operations, including the ability to provide 24-hour immediate coverage by emergency medicine physicians and prompt availability of general surgeons and anesthesiologists.
Case mix index (CMI) is a relative value assigned to the hospital’s mix of inpatients to determine the overall acuity of the hospital’s patients and is compared with the CMI of peer hospitals and the statewide average CMI. CHIA calculated each hospital’s CMI by applying the 3M™ All Patient Refined (APR) grouper, version 30 with Massachusetts-specific baseline cost weights to each hospital’s HDD data. Hospitals validate their HDD data submissions annually with CHIA. The APR grouper and Massachusetts-specific baseline cost weights used in this year’s publication are consistent with those used in last year’s publication. All case mix information included in this report has been grouped under APR grouper, version 30. (Case Mix) Adjusted Cost per Discharge measures the hospital’s adjusted inpatient costs divided by the product of the number of the hospital’s discharges and its case mix index. Hospital costs were
13
American Trauma Society, Trauma Center Levels Explained. Available at:
http://www.amtrauma.org/?page=TraumaLevels (last accessed October 28, 2015).

E-9
Acute Hospital Profiles: At a Glance
adjusted to remove direct medical education and physician compensation from the calculation. This measure compares the hospital’s inpatient cost growth on a patient volume and severity adjusted basis. See Exhibit D of this appendix for more information about this calculation. Inpatient Net Patient Service Revenue (NPSR) per Case Mix Adjusted Discharge (CMAD) measures the hospital’s NPSR divided by the product of the hospital’s discharges and its case mix index. NPSR includes both net inpatient revenue and inpatient premium revenue.
Inpatient Net Revenue per CMAD growth rate for each hospital was calculated by dividing the hospital’s Net Patient Service Revenue (NPSR) by the total CMADs for FY13 and FY14 and determining the percent change.
Inpatient – outpatient revenue is derived from the amount of GPSR reported for inpatient and outpatient services in the hospital’s 403 Cost Report. Outpatient revenue is the hospital’s reported net revenue for outpatient services. Net outpatient service revenue includes both net outpatient revenue and outpatient premium revenue.
Outpatient Revenue growth rate for each hospital represents the percent change in a hospital's reported net revenue for outpatient services between FY13 and FY14. Note that this measure examines the growth in total outpatient revenue and is not adjusted for patient volume, severity or service mix.
Total revenue is the hospital’s total unrestricted revenue in FY14. Total surplus (loss) is the hospital’s reported profit/loss in FY14. Public payer mix is determined based upon the hospital’s reported Gross Patient Service Revenue (GPSR). See Payer Mix metric description in this appendix for more information. Commercial payer price level represents the hospital’s calendar year 2014 commercial composite relative price percentile. This percentile was derived by taking the simple average of the hospital’s blended (inpatient and outpatient) relative price percentiles across all payers. The composite percentile gives a sense of the rank of a provider’s relative price compared to other hospitals across all commercial payers. The relative price composite percentile is calculated from data submitted by the following commercial payers: Aetna, Blue Cross Blue Shield of MA, CeltiCare, Cigna – East, Cigna – West, Fallon Health, Harvard Pilgrim Health Care, Health New England, Minuteman Health, Network Health, Tufts Health Plan, UniCare, and United HealthCare. Data from Neighborhood Health Plan was excluded due to data quality issues. Top three commercial payers represent those with the largest percentage share of total commercial payments at that hospital. Inpatient discharges data was sourced from the 403 Cost Report. See the Inpatient Discharge metric for more information.
Inpatient discharges growth rate for each hospital measures the percent change in discharges for inpatient admissions between FY13 and FY14.
Emergency department visits include any visit by a patient to an emergency department that results in registration at the Emergency Department but does not result in an outpatient observation stay or the inpatient admission of the patient at the reporting facility. An Emergency Department visit occurs even if the only service provided to a registered patient is triage or screening.
Emergency department visits growth rate for each hospital measures the percent change in emergency department visits between FY13 and FY14.

E-10
Acute Hospital Profiles: At a Glance
Outpatient visits are the total outpatient visits reported by the hospital. Note that outpatient visits may not be uniformly reported across hospitals.
Outpatient visits growth rate for each hospital measures the percent change in total outpatient visits to a hospital between FY13 and FY14.
Readmission rate is calculated using the Hospital-Wide All-Cause Unplanned 30-day Readmission Measure developed by CMS and the Yale Center for Outcomes Research, and applied to the Massachusetts adult all-payer population. Readmissions are defined as an admission for any reason to the same or a different hospital within 30 days of a previous discharge. Obstetric, primary behavioral health, cancer, and rehabilitation discharges are excluded from the calculations. The raw readmissions rate is reported, which is the number of readmissions within 30 days divided by the total number of eligible discharges. Early elective deliveries rate measures the proportion of deliveries that were completed between 37 to 39 weeks gestation without medical necessity, following an induction or cesarean section. Thirty-two acute hospitals reported data for this indicator. All data were received from The Leapfrog Group as pre-calculated percentages. The patient population represents all payers and all ages, and the data period was 2014-2015. Participation in the Leapfrog survey is voluntary; where a hospital does not complete the survey or report on certain items in the survey, the measure is also not included in the profiles.
E-11
Acute Hospital Profiles: Metric Descriptions
Acute Hospital Profiles: Services Most common inpatient diagnosis related groups (DRGs) and the percentage of those DRGs treated at that hospital for the region.
Data Source: FY14 HDD data and the 3M™ APR-DRG 30 All Patient Refined Grouper
Hospital Calculation: Each discharge was grouped and ranked by DRG code. The subject hospital’s 10 most frequently occurring DRGs were identified and those DRGs were then summed for all hospitals in the region in order to calculate the percent of regional discharges that were treated at the subject hospital. The total number of the subject hospital’s discharges was compared to the sum of all hospital discharges in the region to determine the overall proportion of regional discharges.
For more information on DRGs, please see Exhibit B of this Appendix. Most common communities from where the hospital’s inpatient discharges originated, and the total percent of all discharges (from Massachusetts hospitals) from that community that went to that hospital.
Data Source: FY14 HDD data for discharge information; patient origin was determined by the zip codes from where the patients resided. In larger cities, the top communities may reflect postal code neighborhoods.
Hospital Calculation: The zip code for each patient discharge was matched with the USPS community name, and then grouped and ranked. The most frequently occurring communities were then summed for all hospitals in the region to calculate the percent of community discharges that went to the subject hospital.
A hospital’s top communities by inpatient origin were determined using a hospital’s FY14 discharge data from the HDD. Patient origin was determined by the reported zip code for each patient’s residence. In larger cities, communities may include multiple zip codes. These zip codes were rolled up to reflect postal code neighborhoods based on the United States Postal Service Database. For more information on the zip codes included within each region, please see the databook. For example, Boston zip codes were rolled up to the following designations: Boston (Downtown) includes: Back Bay, Beacon Hill, Downtown Boston, the Financial District, East Boston, Fenway/Kenmore, South Boston and South End. The remaining Boston communities with multiple zip codes were rolled up to these designations: Allston, Brighton, Charlestown, Dorchester, Dorchester Center, Hyde Park, Jamaica Plain, Mattapan, Mission Hill, Roslindale, Roxbury, and West Roxbury.
Acute Hospital Profiles: Quality Measures To compile provider quality performance information, CHIA relied on the following primary data sources: CHIA’s Hospital Discharge Database (HDD), the Centers for Medicare and Medicaid Services (CMS) Hospital Compare database, and The Leapfrog Group. Metrics are based on varied data periods due to differences in reporting time frames across the data sources. For each metric, the associated reporting time period is listed.
Health Care-Associated Infections of three different types are reported:
1. Central Line-Associated Blood Stream Infections (CLABSI): This measure captures the observed rate of health care-associated central line-associated bloodstream infections among patients in an inpatient acute hospital, compared to the expected number of infections based on the hospital’s characteristics and case mix.

E-12
Acute Hospital Profiles: Metric Descriptions
2. Catheter-Related Urinary Tract Infections (CAUTI): This measure captures the observed rate of health care-associated catheter-related urinary tract infections among patients in an inpatient acute hospital (excluding patients in Level II or III neonatal ICUs), compared to the expected number of infections based on the hospital’s characteristics and case mix.
3. Surgical Site Infections (SSI): Colon Surgery: This measure captures the observed rate of deep incisional primary or organ/space surgical site infections during the 30-day postoperative period following inpatient colon surgery, compared to the expected number of infections based on the hospital’s characteristics and case mix.
Data source: CMS Hospital Compare
Data Period: 2013
Hospital Calculation: These health care-associated infections are reported using the Standard Infection Ratio (SIR), which is the number of infections in a hospital compared to the number of expected infections. The SIR for CLABSI and CAUTI is risk adjusted for type of patient care locations, hospital affiliation with a medical school, and bed size. The SIR for SSI: Colon Surgery is risk adjusted for procedure-related factors, such as: duration of surgery, surgical wound class, use of endoscope, re-operation status, patient age, and patient assessment at time of anesthesiology.
All SIRs for Health Care-Associated Infections are retrieved from CMS Hospital Compare as pre-calculated SIRs.
Cohort Calculation: Not applicable
National Comparative: CMS Hospital Compare
Patient Population: All payers, Age 18+ Hospital Readmission rates are calculated using the Hospital-Wide All-Cause Unplanned 30-day Readmission Measure developed by CMS and the Yale Center for Outcomes Research, and applied to the Massachusetts adult all-payer population. Readmissions are defined as an admission for any reason to the same or a different hospital within 30 days of a previous discharge. Obstetric, primary behavioral health, cancer, and rehabilitation discharges are excluded from the calculations. The raw readmission rate is reported, which is the number of readmissions within 30 days divided by the total number of eligible discharges.
Data source: CHIA’s Hospital Discharge Database
Data Period: FY 2011, FY 2013
Hospital Calculation: The raw readmission rate reflects the number of unplanned readmissions within 30 days divided by the total number of eligible discharges during the designated time period.
Cohort Calculation: Not applicable
State Comparative: The method yields a statewide readmission rate across all the Commonwealth’s acute-care hospitals for the designated time period.
Patient Population: All payers, age 18+, excluding obstetric, primary psychiatric, cancer, and rehabilitation discharges.

E-13
Acute Hospital Profiles: Metric Descriptions
Acute Hospital Profiles: Utilization Trends Change in volume of inpatient discharges measures discharges for inpatient admissions.
Data Source: 403 Cost Report: Schedule 3, Row 22, Column 12
Hospital index calculation: Displays the percent change in the number of inpatient discharges for each year, using FY10 as the base year. FY11: (FY11- FY10)/FY10, FY12: (FY12-FY10)/FY10, FY13: (FY13-FY10)/FY10, FY14: (FY14-FY10)/FY10.
Cohort calculation: Represents the median of the percent change across all hospitals in the cohort for each year. For example: Cohort for FY10 = median of (% change for hospital A, % change for hospital B, % change for hospital C...)
Change in volume of outpatient visits measures total outpatient visits to a hospital. Note that outpatient visits may not be uniformly reported across hospitals.
Data Source: 403 Cost Report: Schedule 5a, Row 39, Column 2
Hospital index calculation: Calculate the percent change between each year, using FY10 as the base year. FY10: (FY11-FY10)/FY10, FY12: (FY12-FY10)/FY10, FY13: (FY13-FY10)/FY10, FY14: (FY14-FY10)/FY10.
Cohort calculation: Represents the median of the percent change across all hospitals in the cohort for each year. For example: Cohort for FY10 = median of (% change for hospital A, % change for hospital B, % change for hospital C...)
Acute Hospital Profiles: Patient Revenue Trends Net inpatient service revenue per case mix adjusted discharge (CMAD) measures the hospital’s net inpatient service revenue (NPSR) divided by the product of the number of the hospital’s discharges and its case mix index. NPSR includes both net inpatient revenue and inpatient premium revenue.
Data Source: NPSR and discharges were sourced from the 403 Cost Report; Case Mix Index (CMI) is sourced from HDD.
Hospital calculation: The hospital’s inpatient net revenue per CMAD was calculated by dividing NPSR by the total CMAD for each year.
Cohort calculation: The range of all revenue/CMAD values for cohort hospitals are represented by the vertical black line. The cohort value denotes the median revenue per CMAD for all cohort hospitals.
Variation in inpatient discharge counts: Hospitals may report different numbers of discharges on the 403 Cost Report and the HDD. Hospitals have explained that this is due to:
Timing – while HDD is accurate when submitted (75 days after the close of a quarter), a case may be reclassified as outpatient, usually due to a change in payer designation. Payers may have different clinical criteria for defining an inpatient and outpatient stay.
HDD edits – discharges reported by the hospital that did not pass HDD edits may have been excluded from the HDD but included in the 403 Cost Report;
Payer classification/status differences between the 403 Cost Report and HDD;

E-14
Acute Hospital Profiles: Metric Descriptions
Since a hospital’s case mix index is calculated using the HDD, which often includes a lower number of discharges than reported by the hospital on the 403 Cost Report, the calculation of a hospital’s total case mix adjusted discharges equals the number of discharges reported on the 403 Cost Report, multiplied by the case mix index. Change in total outpatient revenue measures a hospital's reported net revenue for outpatient services. Net outpatient service revenue includes both net outpatient revenue and outpatient premium revenue. Note that this measure examines the growth in total outpatient revenue and is not adjusted for patient volume, severity or service mix.
Data Source: 403 Cost Report: Schedule 5a, Rows 78.01 (net outpatient revenue) + 78.02 (outpatient premium revenue), Column 2
Hospital index calculation: Displays the percent change between each year, using FY10 as the base year. FY11: (FY11-FY10)/FY10, FY12: (FY12-FY10)/FY10, FY13: (FY13-FY10)/FY10, FY14: (FY14-FY10)/FY10.
Cohort calculation: Represents the median of the percent change across all hospitals in the cohort for each year. For example: Cohort for FY10 = median of (% change for hospital A, % change for hospital B, % change for hospital C...)
Acute Hospital Profiles: Financial Performance Total Revenue, Total Costs and Profit / Loss measure the amount of the subject hospital’s Total Revenue, Total Costs, and Total Profit or Loss for each year from 2010 through 2014.
Data Sources: Financial Statements: The line numbers for each data point are as follows: Total Unrestricted Revenue (row 65), Operating Revenue (row 57.2), Non-Operating Revenue (row 64.1), Total Expenses (row 73), and Profit / Loss (row 74).
Total Margin measures the subject hospital’s overall financial performance compared to the median total margin of the hospitals in its peer cohort.
Data Source: Financial Statements: Excess of Revenue, Gains, & Other Support (row 74) divided by Total Unrestricted Revenue (row 65)
Cohort Calculation: Calculated median for the cohort group. Operating Margin measures the subject hospital’s financial performance of its primary, patient care activities compared to the median operating margin of the hospitals in its peer cohort.
Data Source: Financial Statements: Operating Revenue (row 57.2) minus Total Expenses (row 73) divided by Total Unrestricted Revenue (row 65)
Cohort Calculation: Calculated median for the cohort group.
Note: Hospitals may have been assigned to different cohorts in previous years due to payer mix in that given year or other factors. To remain consistent in comparisons between cohorts across multiple years, hospitals were retroactively assigned to their FY14 cohort designations for all years examined. The number of hospitals included in a given cohort may vary from year to year due to hospital closures.

E-15
Acute Hospital Cohort Profile: Metric Descriptions
The acute hospital cohort profile measures the acute hospital cohorts as composites of the individual hospitals assigned to each cohort. In general, metrics were determined by aggregating the values of all hospitals assigned to the cohort. For comparison purposes, the individual cohorts are compared to one another and all hospitals statewide, including specialties.
14 The analytic metrics are largely the same as
the metrics used for the individual hospital profiles, except as noted below. Please see the descriptions and calculation methods described in the Acute Hospital Metric Description section for more information. Inpatient Severity Distribution measures the percentage of a cohort’s discharges that falls into each statewide severity quintile. This metric provides a way to compare the severity levels of the cohort’s patients to those of other acute hospitals in Massachusetts.
Data Source: Hospital Discharge Database (HDD).
Data Period: FY14
Cohort Calculation: Every discharge in the state has a Diagnosis Related Group (DRG) code associated with it. Severity quintiles were determined by ranking all possible DRG outputs by case-weight. The cohort calculation shows the percentage of a cohort’s aggregate discharges that falls into each quintile. These proportions were then compared with the proportions of aggregated discharges by severity quintile for all hospitals assigned to other cohorts.
In cases where metrics were similar to the acute hospital profile metrics, data was aggregated to determine cohort measures. For example: The most common inpatient DRGs for each subject cohort were determined by categorizing all of the hospitals’ discharges by cohort using the All Patient Refined Grouper (3M™ APR-DRG 30), which were then summed and ranked. Each of the subject cohort’s ten most frequently occurring DRGs were then divided by the statewide count per DRG to obtain the percent of discharges to the statewide total. The cohort comparison metric for payer mix is different from comparisons among acute hospitals: Payer mix was calculated differently from other measures due to the fact that the underlying charges that comprise GPSR differ across hospitals. For this measure, the cohort payer mix was first calculated for each hospital assigned to the cohort in the manner described in the Acute Hospital Profiles section of this Appendix. The mean of the individual cohort hospital’s experience was determined and is displayed here. The same method was used to determine the trend in outpatient visits for comparison to all other cohort hospitals.
14
Note that specialty hospitals are not assigned to any cohort due to their unique service mix and/or populations served.
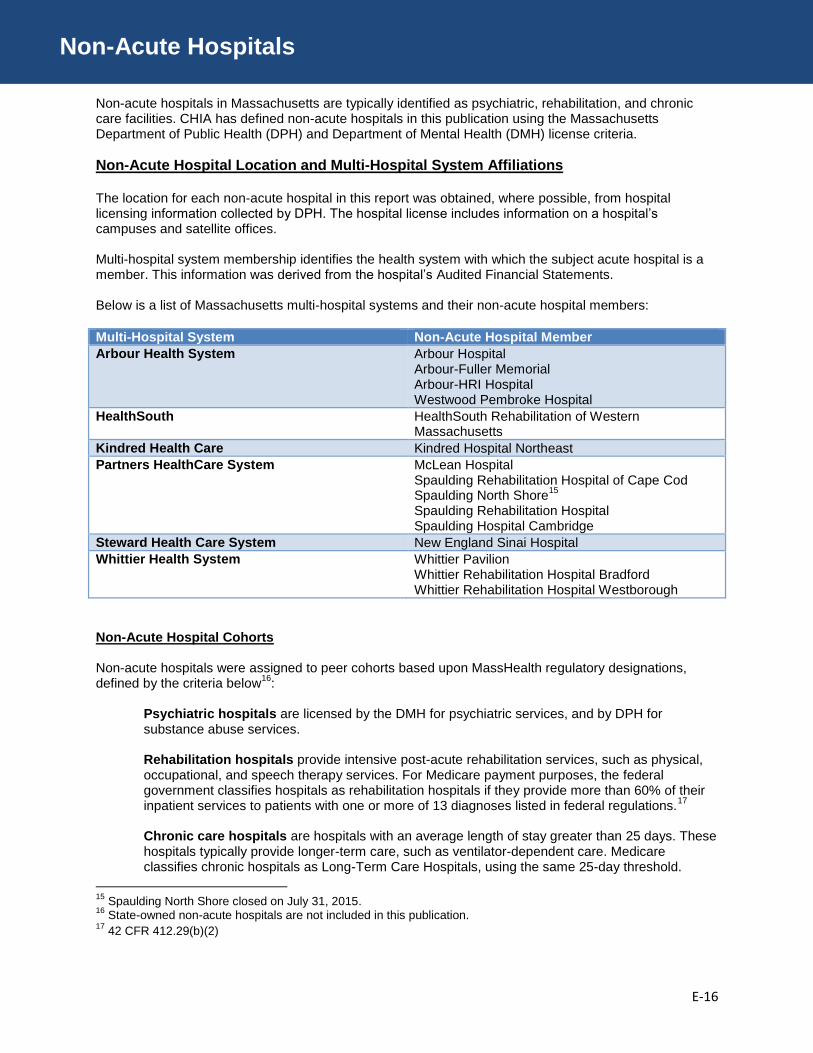
E-16
Non-Acute Hospitals
Non-acute hospitals in Massachusetts are typically identified as psychiatric, rehabilitation, and chronic care facilities. CHIA has defined non-acute hospitals in this publication using the Massachusetts Department of Public Health (DPH) and Department of Mental Health (DMH) license criteria.
Non-Acute Hospital Location and Multi-Hospital System Affiliations The location for each non-acute hospital in this report was obtained, where possible, from hospital licensing information collected by DPH. The hospital license includes information on a hospital’s campuses and satellite offices. Multi-hospital system membership identifies the health system with which the subject acute hospital is a member. This information was derived from the hospital’s Audited Financial Statements. Below is a list of Massachusetts multi-hospital systems and their non-acute hospital members:
Multi-Hospital System Non-Acute Hospital Member
Arbour Health System Arbour Hospital Arbour-Fuller Memorial Arbour-HRI Hospital Westwood Pembroke Hospital
HealthSouth HealthSouth Rehabilitation of Western Massachusetts
Kindred Health Care Kindred Hospital Northeast
Partners HealthCare System McLean Hospital Spaulding Rehabilitation Hospital of Cape Cod Spaulding North Shore
15
Spaulding Rehabilitation Hospital Spaulding Hospital Cambridge
Steward Health Care System New England Sinai Hospital
Whittier Health System Whittier Pavilion Whittier Rehabilitation Hospital Bradford Whittier Rehabilitation Hospital Westborough
Non-Acute Hospital Cohorts Non-acute hospitals were assigned to peer cohorts based upon MassHealth regulatory designations, defined by the criteria below
16:
Psychiatric hospitals are licensed by the DMH for psychiatric services, and by DPH for substance abuse services. Rehabilitation hospitals provide intensive post-acute rehabilitation services, such as physical, occupational, and speech therapy services. For Medicare payment purposes, the federal government classifies hospitals as rehabilitation hospitals if they provide more than 60% of their inpatient services to patients with one or more of 13 diagnoses listed in federal regulations.
17
Chronic care hospitals are hospitals with an average length of stay greater than 25 days. These hospitals typically provide longer-term care, such as ventilator-dependent care. Medicare classifies chronic hospitals as Long-Term Care Hospitals, using the same 25-day threshold.
15
Spaulding North Shore closed on July 31, 2015. 16
State-owned non-acute hospitals are not included in this publication. 17
42 CFR 412.29(b)(2)
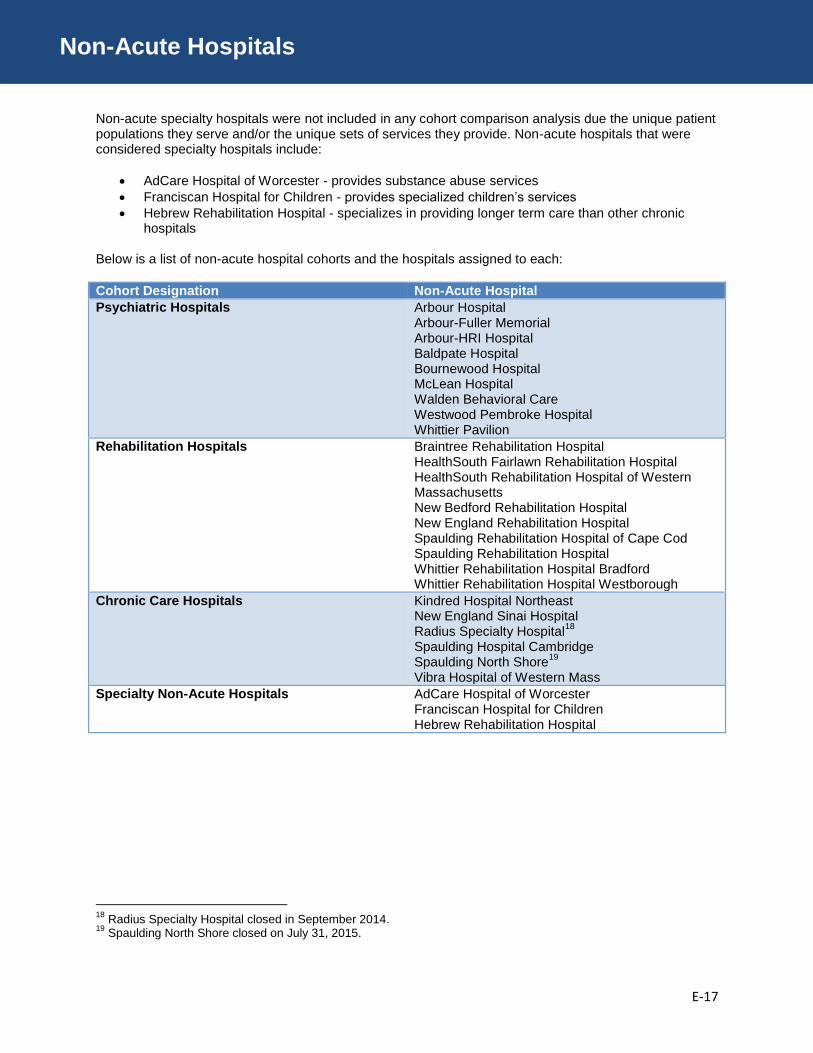
E-17
Non-Acute Hospitals
Non-acute specialty hospitals were not included in any cohort comparison analysis due the unique patient populations they serve and/or the unique sets of services they provide. Non-acute hospitals that were considered specialty hospitals include:
AdCare Hospital of Worcester - provides substance abuse services
Franciscan Hospital for Children - provides specialized children’s services
Hebrew Rehabilitation Hospital - specializes in providing longer term care than other chronic hospitals
Below is a list of non-acute hospital cohorts and the hospitals assigned to each:
Cohort Designation Non-Acute Hospital
Psychiatric Hospitals Arbour Hospital Arbour-Fuller Memorial Arbour-HRI Hospital Baldpate Hospital Bournewood Hospital McLean Hospital Walden Behavioral Care Westwood Pembroke Hospital Whittier Pavilion
Rehabilitation Hospitals Braintree Rehabilitation Hospital HealthSouth Fairlawn Rehabilitation Hospital HealthSouth Rehabilitation Hospital of Western Massachusetts New Bedford Rehabilitation Hospital New England Rehabilitation Hospital Spaulding Rehabilitation Hospital of Cape Cod Spaulding Rehabilitation Hospital Whittier Rehabilitation Hospital Bradford Whittier Rehabilitation Hospital Westborough
Chronic Care Hospitals Kindred Hospital Northeast New England Sinai Hospital Radius Specialty Hospital
18
Spaulding Hospital Cambridge Spaulding North Shore
19
Vibra Hospital of Western Mass
Specialty Non-Acute Hospitals AdCare Hospital of Worcester Franciscan Hospital for Children Hebrew Rehabilitation Hospital
18
Radius Specialty Hospital closed in September 2014. 19
Spaulding North Shore closed on July 31, 2015.
E-18
Non-Acute Hospital Profiles: At a Glance
Total staffed beds are the average number of beds during the fiscal year that were in service and staffed for patient use. Beds ordinarily occupied for less than 24 hours are usually not included. Percent occupancy rate is the median percent of staffed inpatient beds occupied during the reporting period. Percentage of occupancy is calculated as follows: Inpatient Days divided by Weighted Average Staffed Beds times 365 (or the number of days in the reporting period). Total inpatient days include all days of care for all patients admitted to each unit. Measure includes the day of admission but not the day of discharge or death. If both admission and discharge or death occur on the same day, the day is considered a day of admission and is counted as one patient day. Total inpatient discharge information was sourced from Schedule 3 of the 403 Cost Report. Public payer mix was determined based upon the hospital’s reported GPSR. See Payer Mix metric description for more information. Total revenue was sourced from the hospital’s 403 Cost Report. Inpatient – outpatient revenue is derived from the amount of GPSR reported for inpatient and outpatient services in the hospital’s 403 Cost Report. Adjusted cost per inpatient day measures the hospital’s adjusted inpatient costs divided by the hospital’s total patient days. Hospital costs were adjusted to remove direct medical education and physician compensation from the calculation. See Exhibit E for an example of the Inpatient Cost per Day calculation.

E-19
Non-Acute Hospital Profiles: Metric Descriptions
Non-Acute Hospital Profiles: Services Types of inpatient services are defined by Discharges.
Data Sources: 403 Cost Report; Schedule 3, Column 12, Rows 1 through 21.
Hospital calculation: Hospital’s absolute count by weighted average bed type.
Cohort calculation: Hospital’s absolute bed type count divided by cohort’s total discharges by that specific bed type.
Note: Psychiatric discharges do not include substance abuse discharges. Payer Mix measures the distribution of total GPSR for FY14 across the major payer categories. This provides information regarding the proportion of services, as measured by gross charges, which a hospital provides to patients from each category of payer.
Data Source: 403 Cost Report: Schedule 5a, Row 44, Columns 3 through 14
Payer Category Definitions: State Programs = Medicaid Managed + Medicaid Non-Managed + Commonwealth Care + Health Safety Net (HSN); Federal Programs = Medicare Managed + Medicare Non-Managed + Other Government; Commercial & Other = Managed Care + Non-Managed Care + Self Pay + Workers Comp + Other. Dividing each of the above by Total GPSR results in the percentages displayed for each of the three categories.
Cohort Calculation: Displays the mean of the percentages in each of the above payer categories across all hospitals in the cohort.
Average Hospital Calculation: Displays the mean of the percentages in each of the payer categories to get each of the component percentages for the average non-acute hospital.
o Note: “Average Hospital” group includes specialty hospitals.
Change in Volume of Inpatient Days includes all days of care for all patients admitted to each unit. Measure includes the day of admission but not the day of discharge or death. If both admission and discharge or death occur on the same day, the day is considered a day of admission and is counted as one patient day.
Data Sources: 403 Cost Report, Schedule 3, Column 6, Row 22
Hospital Index calculation: Calculated percent change in Inpatient Days for each year, using FY10 as the base year. FY11: (FY11-FY10)/FY10, FY12: (FY12-FY10)/FY10, FY13: (FY13- FY10)/FY10, FY14: (FY14-FY10)/FY10.
Cohort calculation: Represents the median of the percent change across all hospitals in the cohort for each year. For example Cohort for FY10 = median of (% change for hospital A, % change for hospital B, % change for hospital C…)
Median Average Length of Stay (ALOS) measures the average duration of an inpatient admission.
Data Sources: 403 Cost Report, Schedule 3, Column 13, Row 22
Cohort calculation: The growth in median ALOS for each cohort is calculated relative to FY10. FY11: (FY11-FY10)/FY10, FY12: (FY12-FY10)/FY10, FY13: (FY13-FY10)/FY10; FY14: (FY14-FY10)/FY10. This is plotted against the growth in median ALOS among all non-acute hospitals, including specialties, relative to FY10.

E-20
Non-Acute Hospital Profiles: Metric Descriptions
Non-Acute Hospital Profiles: Utilization
Volume of Inpatient Days includes all days of care for all patients admitted to each unit. Measure includes the day of admission but not the day of discharge or death. If both admission and discharge or death occur on the same day, the day is considered a day of admission and is counted as one patient day.
Data Sources: 403 Cost Report, Schedule 3, Column 6, Row 22
Average Length of Stay (ALOS) measures the average duration of an inpatient admission.
Data Sources: 403 Cost Report, Schedule 3, Column 13, Row 22 Volume of Outpatient Visits measures the total outpatient visits to a hospital.
Data Source: 403 Cost Report; Schedule 5a, Column 2, Row 39
Non-Acute Hospital Profiles: Patient Revenue Trends Inpatient Revenue per Day is the hospital’s net inpatient service revenue (NPSR) divided by its total inpatient days.
Data Source: NPSR was sourced from schedule 5a, column 2, rows 65.01 (net inpatient revenue) and 65.02 (inpatient premium revenue) of the 403 Cost Report. Inpatient days were sourced from Schedule 3, column 6, row 22 of the 403 Cost Report.
Total Outpatient Revenue measures a hospital's reported net revenue for outpatient services. Note that this measure examines the growth in total outpatient revenue and is not adjusted for patient volume. In addition, several non-acute hospitals do not provide outpatient services.
Data Source: 403 Cost Report; Schedule 5a, Column 2, Rows 78.01 (net outpatient revenue) and 78.02 (outpatient premium revenue)
Non-Acute Hospital Profiles: Financial Performance Operating Revenue, Total Revenue, Total Costs and Profit / Loss displays the amount of each hospital’s Total Revenue, Operating Revenue, Total Costs, and Total Profit or Loss for FY14.
Data Sources: 403 Cost Report, Schedule 23. The line numbers for each data point are as follows: Total Unrestricted Revenue (row 65), Operating Revenue (row 55 + row 56 + row 57+ row 60 + row 64), Total Expenses (row 73), and Profit / Loss: (row 74).
Total Margin measures the subject hospital’s overall financial performance.
Data Source: 403 Cost Report; Schedule 23, Column 2, Row 173
Note: Some for-profit hospitals are organized as S corporations. For-profit entities that are organized as S corporations, in accordance with Internal Revenue Code, do not pay federal income tax on their taxable income. Instead, the shareholders are liable for individual federal income taxes on their portion of the hospital’s taxable income. Therefore, these hospitals may have income that appears higher than hospitals organized as a C corporation, which are taxed separately from their owners.

E-21
Multi-Acute Hospital Systems
The Health System Profiles chapter consists of two sections: (1) a comparative graphic showing the nine multi-acute hospital systems in Massachusetts
20 drawn to scale based on operating revenue, and (2)
individual pages for each system detailing the organizations that comprise the system. The Comparative Overview is a proportional representation of the size of each system using operating revenue from the smallest system (Heywood Healthcare) as the base.
For example: in FY14, Berkshire Health Systems had approximately $472 million in operating revenue, which is 3.6 times greater than Heywood Healthcare’s approximately $132 million in operating revenue. Accordingly, Berkshire Health System’s circle is presented with an area 3.6 times larger than Heywood Healthcare’s circle.
Organizations within each system profile are grouped into the following categories:
Acute Hospitals: a hospital that is licensed by the Massachusetts Department of Public Health, which contains a majority of medical-surgical, pediatric, obstetric, and maternity beds.
Non-Acute Hospitals: typically identified as psychiatric, rehabilitation, and chronic care facilities. CHIA has defined non-acute hospitals in this publication using the Massachusetts Department of Public Health (DPH) and Department of Mental Health (DMH) license criteria.
Physician Organizations: A medical practice comprised of two or more physicians organized to provide patient care services.
Health Plans: An organization that contracts or offers to provide, deliver, arrange for, pay for, or reimburse any of the costs of health care services.
Other Health Care Providers: any organization within a system that is engaged in providing health care services and is not categorized as an acute hospital, a non-acute hospital, a physician organization, or a health plan.
Other Organizations: all organizations that are not hospitals, physician organizations, health plans, or other health care providers. Operating revenue and net asset values were derived by adding up values for any organization in the financial statements not already categorized in the profile as a health care-related organization.
Some system financial statements reported to CHIA included the names and descriptions of organizations but did not include financial information for them. These organizations are presented in the profiles in text format, rather than being displayed within a circle like the other organizations. Unless otherwise noted, metrics and descriptive information included in these profiles are based on financial data from FY14 reported by the systems. To compile the profiles, CHIA relied on the following primary data sources: consolidated system-level Audited Financial Statements, hospital Audited Financial Statements, and the 403 Cost Report.
20
These multi-acute system profiles exclude Kindred Healthcare, Inc., Tenet Healthcare Corporation, and Shriners
Hospitals for Children which are multi-state health systems with a large presence outside of Massachusetts. Each
owns two acute hospitals in Massachusetts (Kindred owns Kindred Hospital – Boston and Kindred Hospital – Boston
North Shore; Tenet owns MetroWest Medical Center and Saint Vincent Hospital; Shriners owns Shriners Hospitals for
Children – Boston and Shriners Hospitals for Children - Springfield). Due to their broad presence outside of
Massachusetts, CHIA did not include Kindred, Tenet, or Shriners system profiles.

E-22
Multi-Acute Hospital Systems
All revenue and net asset information is sourced from each system’s parent organization and affiliates’ FY14 consolidated Audited Financial Statements.
21
Unless otherwise noted, each system’s total Operating Revenue and Net Assets equal the sum of the components displayed in the individual system profiles, less any intercompany eliminations. Consolidating Eliminations are intercompany transactions that are eliminated during the financial consolidation process. Eliminations were totaled from operating revenue and net asset information in the Audited Financial Statement from each system. The total of the operating revenue and net assets after accounting for eliminations may not sum to the overall system operating revenue and net asset values displayed on each profile due to rounding.
22
Data Verification: Data verification reports including each system’s reported data were sent to each system. Changes made as a result of the data verification process include revisions to the descriptions of some organizations and additional financial information details for certain organizations.
21
Steward Health Care System’s revenue and net asset information is sourced from its FY13 consolidated Audited
Financial Statements, which is the most recent consolidated-level data available to CHIA. 22
Data used in Steward Health Care System’s organizational breakout only includes financial information from the
hospital entities and does not include consolidation eliminations.
E-23
Multi-Acute Hospital Systems: At a Glance
Operating revenue is revenue earned from services associated with patient care, including academic research. It excludes revenue earned from non-operating activities, such as gains associated with the sale of property or income from investments. Net assets reflect the difference between total assets and total liabilities. It is the not-for-profit equivalent of Owner’s Equity. Total profit/loss (often presented in hospital financial statements as “Excess of revenues over expenses”) and total margin are measures of the system’s overall financial performance, the former being in dollars and the latter a percentage. CHIA standardized the calculation of total margins to account for the varied presentation of financial statement reporting among health systems.
Total profit/loss was derived from “Excess of revenues over expenses” or “Net profit/loss” figures reported in each system’s consolidated Audited Financial Statements.
System calculation: Total Margin = Total Profit/Loss ÷ (Operating Revenue + Non-Operating Gains/Losses)
Employee statistics show the approximate number of employees in the system.

E-24
Multi-Acute Hospital Systems: Metric Descriptions
The Percentage of Massachusetts Acute Hospitals section shows the proportion of total discharges and inpatient/outpatient revenue at each system in relation to all acute hospitals in Massachusetts. Specialty hospitals were included when preparing these calculations. This information was calculated using data from annual 403 Cost Reports.
Percent of Discharges is the number of inpatient discharges.
Data Source: 403 Cost Report: Schedule 3, Column 12, Row 22
System Calculation: Discharge Percent = Total discharges across all acute hospitals in a system divided by total statewide acute hospitals’ discharges multiplied by 100
Percent of Inpatient Revenue
23 reflects each system’s inpatient net patient service revenue
(NPSR) as a percentage of total inpatient NPSR reported by Massachusetts acute hospitals in FY14.
Data Source: 403 Cost Report: Schedule 5a, Column 2, Rows 65.01
System Calculation: Inpatient NPSR Percent = Total inpatient NPSR across all acute hospitals in system divided by total statewide acute hospitals’ inpatient NPSR multiplied by 100
Percent of Outpatient Revenue reflects each system’s outpatient net patient service revenue (NPSR) as a percentage of total outpatient NPSR reported by Massachusetts acute hospitals in 2014.
Data Source: 403 Cost Report: Schedule 5a, Column 2, Rows 78.01
System Calculation: Outpatient NPSR Percent = Total outpatient NPSR across all acute hospitals in system divided by total statewide acute hospitals’ outpatient NPSR multiplied by 100
23
Inpatient and outpatient premium revenue were considered in calculating the system percentages of inpatient and outpatient revenue, but no difference was found in the rounded percentages when premium revenue was included compared to when premium revenue was not included.
E-25
Multi-Acute Hospital Systems: Other Organizations
Financial information for Other Organizations includes revenue and net assets from organizations that did not appear to fit into the other categories (acute hospital, non-acute hospital, health plan, etc.). It includes parent-level entities as well as the organizations listed below within each system. Descriptions for these organizations were sourced directly from Audited Financial Statements. Baystate Health, Inc.
Baystate Administrative Services, Inc., a management support entity
Baystate Total Home Care, Inc., a not-for-profit entity that holds, leases, and manages real estate on behalf of Baystate Medical Center
Baystate Health Foundation, Inc., a charitable organization
Baystate Health Insurance Company, Ltd., a captive insurance company
Ingraham Corporation, a holding company for Baystate Health Ambulance Berkshire Health Systems, Inc.
BHS Management Services, Inc., a corporation that provides management services to Berkshire’s affiliates
Berkshire Indemnity Company SPC, LTD., a segregated portfolio within Berkshire Insurance Company SPC, LTD., a captive insurance entity
Tri-State Medical Management Corporation, a corporation that manages a physician office location for the benefit of Fairview Hospital
Cape Cod Healthcare, Inc.
Cape Cod Hospital Medical Office Building, a for-profit provider of leased and subleased space to Cape Cod Hospital and related affiliations
Cape Cod Healthcare Foundation, Inc., a not-for-profit corporation organized to provide development and fundraising support to Cape Cod Healthcare
Cape Health Insurance Company, a captive insurance company CareGroup, Inc.
Jordan Health Systems, Inc., a not-for-profit management corporation
Atlantic Medical Management, Inc., a for-profit management corporation that existed through December 31, 2013
Milton Hospital Foundation, Inc., is the parent organization of Beth Israel Deaconess Hospital – Milton and Community Physician Associates
Jordan Community Accountable Care Organization, Inc., a for-profit accountable care organization
Heywood Healthcare, Inc.
Heywood Hospital Realty Corporation, a corporation that owns medical office buildings Lahey Health System, Inc.
Lahey Health Shared Services, Inc., a supporting corporation with the purpose of providing administrative support to the System and its affiliates
Lahey Clinic Foundation, Inc., a corporation organized to hold capital assets, investments, debt, and infrastructure costs
Winchester Community Accountable Care Organization, Inc. (WCACO), an accountable care organization
Northeast Health System, Inc., a corporation that functioned as the holding company for Northeast Hospital Corp. and the Northeast affiliates until July 1, 2014
Lahey Clinic Insurance Company, Ltd., a captive reinsurance company
Winchester Healthcare Enterprises, Inc., is an organization that owns and manages enterprises that complement and enhance the financial viability of the Winchester Healthcare system. Enterprise owns 50 percent of Winchester Highland Management LLC, which provides managed care information to Winchester Hospital, Highland Healthcare Associates IPA, Inc., and other
E-26
Multi-Acute Hospital Systems: Other Organizations
clients. Lahey Clinical Performance Network, LLC, a corporation organized to contract with payers on behalf of participating providers and/or care units that are part of the System
Lahey Clinical Performance Accountable Care Organization, LLC, a corporation organized to operate an accountable care organization and participate in the Federal Medicare Shared Savings Program
Lahey Clinic Canadian Foundation, a Canadian foundation that performs fundraising activities directed at citizens and residents of Canada
Addison Gilbert Society, Inc., a charitable organization
Lahey Physician Community Organization, Inc., a physician organization
Reading Nominee Trust, a company organized for the purposes of ownership and management of medical office condominiums
Winchester Hospital Foundation, Inc., a company organized for the purpose of fundraising and philanthropic activities
Winchester Healthcare Management, Inc., is the parent corporation of an integrated health care delivery system in Winchester, Massachusetts
Winchester Healthcare Indemnification LTD, a Winchester Hospital captive insurance company, which in FY15 is part of Lahey Clinic Insurance Company, Ltd.
Steward Health Care System, LLC
Steward Health Care Network, Inc., an accountable care organization that also negotiates and monitors managed care contracts
Tailored Risk Assurance Company, Ltd., a captive insurance company
Steward has partnered with two Massachusetts health plans to create community hospital network insurance products:
o Steward Community Care is a partnership with Fallon Community Health Plan o Steward Community Choice is a partnership with Tufts Health Plan
UMass Memorial Health Care, Inc.
UMass Memorial Health Ventures, Inc., a joint venture interest holder that includes UMass’s interest in Fairlawn Rehabilitation Hospital
UMass Memorial Realty, Inc., a real estate company
Marlborough Hospital’s Affiliate: Controlled Entity
HealthAlliance Realty, Inc., a company organized to manage and maintain real estate
Central New England HealthAlliance, Inc., the parent organization of HealthAlliance Hospitals, Inc.
UMass Memorial Hospitals, Inc., the sole corporate member of Central New England HealthAlliance, Inc., Clinton Hospital Association, and Marlborough Hospital

E-27
Technical Appendix:
Exhibit A. Hospital-Specific Information & Subsequent Events
Acute Hospitals Athol Hospital responded to the FY10 to FY14 data verification process for FY12 through FY14 data only. Beth Israel Deaconess Medical Center (BIDMC) reported Graduate Medical Education (GME) costs on more than one line in the 403 Cost Report, and the corresponding statistics for those GME costs in more than one column on Schedules IX and III, respectively, on the 403 Cost Report. To ensure inclusion of these additional reported fields, CHIA manually calculated total GME expenses for BIDMC. Beth Israel Deaconess Hospital- Plymouth (formerly Jordan Hospital) affiliated with Beth Israel Deaconess Medical Center effective January 1, 2014. The CareGroup system profile includes data for Beth Israel Deaconess Hospital –Plymouth prior to the affiliation with BIDMC in FY14 (October 1, 2013 through December 31, 2013). Boston Medical Center Outpatient metrics for Boston Medical Center (BMC) include information for the following freestanding community health centers:
1. East Boston Neighborhood Health Center 2. Codman Square Health Center 3. Dorchester House Multi-Service Center 4. South Boston Community Health Center
Kindred Hospitals have limited acute hospital information included in this report, as they are considered long-term acute care hospitals. Kindred Hospital- Boston and Kindred Hospital- Boston North Shore are acute hospitals; however, as their data does not align with the other acute hospitals, they are not included in the cohort analysis. Lowell General Hospital acquired Saints Medical Center effective July 1, 2012. For FY12, the Financial Statement data submitted by Lowell General Hospital includes 3 months of financial data for Saints Medical Center, in addition to 12 months of financial information for Lowell General Hospital. Saints Medical Center did not submit additional financial statement data for FY12. Each entity submitted a separate 403 Cost Report for FY09 through FY12. For FY14, both Financial Statement and 403 Cost Report data submitted by Lowell General Hospital includes Saints Medical Center data. On October 20, 2014, Tufts Medical Center and Lowell General Hospital combined under a new parent company (Wellforce) and created a new multi-acute hospital system. Mercy Hospital changed its fiscal year end date from December 31 to June 1 beginning July 1, 2013. Its 2013 Financial Statement filing reflects six months of data (January 1, 2013- June 30, 2013). Merrimack Valley Hospital, owned by Steward Health Care System, merged with Steward Holy Family Hospital, and became a campus of Steward Holy Family Hospital effective August 2014. North Adams Regional Hospital announced on March 25, 2014 a closure of the hospital and related health care businesses effective March 28, 2014. The hospital building is now operating as a satellite emergency department for Berkshire Medical Center. Noble Hospital was acquired by Baystate Health in June 2015. Noble Hospital was renamed Baystate Noble Hospital. Quincy Medical Center closed on December 26, 2014. The hospital building is now operating as a satellite emergency department for Steward Carney Hospital.

E-28
Technical Appendix:
Exhibit A. Hospital-Specific Information & Subsequent Events
Saints Medical Center submitted 403 Cost Report data for FY09 through FY14, but financial statements only for FY09 through FY11 due to a merger with Lowell General Hospital effective July 1, 2012. Shriners Hospitals for Children (both Boston and Springfield locations) began submitting data to CHIA in FY11. Profiles for the Shriners hospitals are included for the first time in this year’s publication. Steward Good Samaritan Medical Center is located in the Metro South region; however, one of its campuses is located in Metro West region. Information for the campus located in Metro West is included in the Steward Good Samaritan Medical Center metrics. Steward Health Care System: Fiscal year data for certain hospitals in the Steward Health Care System was annualized for comparison purposes. Steward Health Care acquired six hospitals in FY10:
1. Steward St. Elizabeth's Medical Center 2. Steward Saint Anne's Hospital 3. Steward Carney Hospital 4. Steward Good Samaritan Medical Center 5. Steward Norwood Hospital 6. Steward Holy Family Hospital
FY11 403 Cost Report data for these hospitals reflects a period of 329 days, while FY10 403 Cost Report data reflects a period of 401 days. To account for these variances, 403-sourced data was annualized for these two fiscal years. Winchester Hospital became a member of Lahey Health in July 2014.
Non-acute Hospitals Spaulding Hospital Cambridge (formerly Youville Hospital) did not submit 403 Cost Report data for FY09 due to a purchase transaction by Spaulding Hospital effective November 15, 2009. The 403 Cost Report submitted for FY10 reflects a partial year of 10.5 months. No adjustments were made to annualize as this was the first year of operations, and CHIA determined that the report would not materially distort the trend analysis. As of FY14, Spaulding Hospital Cambridge no longer provides outpatient services. Bournewood Hospital is a sub-chapter S corporation. Radius Specialty Hospital closed its Roxbury and Quincy rehabilitation facilities in October 2014. Whittier Pavilion began operations in FY09; therefore, FY09 data is not be comparable to its subsequent years. In addition, outpatient services began in FY14. FY14 outpatient data represents a partial year of operation for these services. Spaulding North Shore discontinued inpatient operations as of July 31, 2015.
Multi-Acute Hospital Systems Baystate Health, Inc.
In September 2014, UMass Memorial Health Care transferred ownership of Wing Memorial Hospital to Baystate Health.
In June 2015, Baystate Health acquired The Trustees of Noble Hospital, Inc. and Subsidiaries. Noble Hospital was renamed Baystate Noble Hospital.

E-29
Technical Appendix:
Exhibit A. Hospital-Specific Information & Subsequent Events
CareGroup, Inc.
The financial figures on CareGroup’s system profile were sourced separately from Audited Financial Statements for CareGroup, Inc. and Subsidiaries, Beth Israel Deaconess Medical Center, Inc. and Affiliates, Beth Israel Deaconess Hospital – Milton Foundation, Inc. and Affiliates, Beth Israel Deaconess Hospital – Plymouth, Inc. and Affiliates, Mount Auburn Hospital and Subsidiary, and New England Baptist Hospital and Affiliate. CareGroup notes that it operates under a “confederation model in which the affiliates jointly borrow and purchase common services such as information technology support, but otherwise operate on a largely autonomous basis.”
24
On January 1, 2014, Beth Israel Deaconess Medical Center became the sole corporate member of Jordan Health Systems, Inc. (Jordan). Jordan consists of Jordan Hospital, a local physicians’ practice (Jordan Physician Associates), and management entities. Jordan Hospital was renamed Beth Israel Deaconess Hospital – Plymouth (BID-Plymouth). In order to display BID-Plymouth as a separate entity within the organization, the CareGroup system profile includes financial data for BID-Plymouth for the three months prior to its affiliation with BIDMC in FY14 (October 1, 2013 through December 31, 2013).
Lahey Health System, Inc.
In October 2013, Winchester Healthcare Management, Inc. and Affiliates announced its intention to become a member of Lahey Health. The transaction went into effect in July 2014. Lahey’s system profile does not include Winchester’s financial information prior to the affiliation.
In July 2014, Lahey announced its intention to become the sole corporate member of the Visiting Nurse Association of Middlesex-East, Inc. (VNAME) and the parent of VNAME’s affiliate, Community Care, Inc. The transaction went into effect in October 2014.
Partners HealthCare System, Inc.
Effective February 1, 2015, Partners Community HealthCare, Inc. (PCHI) became Partners Community Physicians Organization (PCPO), which functions primarily as a physician organization.
Steward Health Care System, LLC
In March 2014, Steward announced its intention to make Merrimack Valley Hospital, which was already owned by Steward, a campus of Steward Holy Family Hospital. This event went into effect in August 2014.
On November 6th, 2014, Steward announced an imminent closure of Quincy Medical Center, which occurred on December 26, 2014. The hospital building is now operating as a satellite emergency department for Steward Carney Hospital.
UMass Memorial Health Care, Inc.
In September 2014, UMass Memorial Health Care transferred ownership of Wing Memorial Hospital to Baystate Health. In FY14, Wing recorded $74.9 million in revenue and $1.4 million in excess of revenue over expenses while still with UMass.
In June 2014, UMass Memorial Health Ventures, Inc. sold a portion of its share in Fairlawn Rehabilitation Hospital to New England Rehabilitation Management Co., LLC, which is a subsidiary of HealthSouth Corporation. UMass now has a 20% share of Fairlawn. Previously, Fairlawn had been operated as a 50-50 joint venture between UMass and HealthSouth.
Additional information on changes to health systems can be found on the Health Policy Commission’s website under Material Change Notices. Available at: www.mass.gov/anf/budget-taxes-and-procurement/oversight-agencies/health-policy-commission/material-change-notices-cost-and-market-impact-reviews (last accessed October 28, 2015).
24
See http://www.caregroup.org/CGOverview.asp (last accessed October 28, 2015).

E-30
Technical Appendix:
Exhibit B. Diagnosis Related Groups (DRGs)
Diagnosis Related Groups (DRGs) are used to classify the patient illnesses a hospital treats. The 10 most common DRGs for each hospital were determined by categorizing all of a hospital’s discharges into DRGs defined in the All Patient Refined Grouper (3M™ APR-DRG 30) and ranked by the total number of discharges. In most cases, it was necessary for CHIA to abbreviate the DRG name in order to fit the space available. Below is a list of abbreviated DRG descriptions that appear in the report, and the full name and APR-DRG 30 code for each DRG.
Abbreviated Description Description APR DRG v.30
3rd Degree Brn w Skn Grft Extensive 3rd Degree Burns w Skin Graft 841
Acute Leukemia Acute Leukemia 690
Acute Myocardial Infarct. Acute Myocardial Infarction 190
Adjust Dis/Neuroses exc DD Adjustment Disorders & Neuroses Except Depressive Diagnoses
755
Alcohol & Drug w/ Rehab Alcohol & Drug Dependence w Rehab Or Rehab/Detox Therapy
772
Alcohol Abuse & Dependence
Alcohol Abuse & Dependence 775
Angina Pectoris Angina Pectoris & Coronary Atherosclerosis 198
Appendectomy Appendectomy 225
Asthma Asthma 141
Bacterial Skin Infections Cellulitis & Other Bacterial Skin Infections 383
Bipolar Disorders Bipolar Disorders 753
Bone Marrow Transplant Bone Marrow Transplant 3
Bronchiolitis Pneumonia Bronchiolitis & RSV Pneumonia 138
Burns w/ or w/o Skin Grft Partial Thickness Burns w Or w/o Skin Graft 844
C. Spinal Fusion & Other Procs
Cervical Spinal Fusion & Other Back/Neck Proc Exc Disc Excis/Decomp
321
Card Cath - Heart Disease Cardiac Catheterization For Ischemic Heart Disease 192
Cardiac Arrhythmia Cardiac Arrhythmia & Conduction Disorders 201
Cardiac Valve w/o Cath Cardiac Valve Procedures w/o Cardiac Catheterization
163
CC W Circ Disord Exc IHD Cardiac Catheterization W Circ Disord Exc Ischemic Heart Disease
191
Cesarean Delivery Cesarean Delivery 540
Chemotherapy Chemotherapy 693
Chest Pain Chest Pain 203
Cleft Lip & Palate Repair Cleft Lip & Palate Repair 95
COPD Chronic Obstructive Pulmonary Disease 140
Craniotomy; exc Trauma Craniotomy Except For Trauma 21
CVA Occlusion w/ Infarct CVA & Precerebral Occlusion W Infarct 45
D&L Fusion exc Curvature Dorsal & Lumbar Fusion Proc Except For Curvature Of Back
304

E-31
Technical Appendix:
Exhibit B. Diagnosis Related Groups (DRGs)
D&L Fusion for Curvature Dorsal & Lumbar Fusion Proc For Curvature Of Back
303
Degen Nrvs Syst exc MS Degenerative Nervous System Disorders Exc Mult Sclerosis
42
Depression exc MDD Depression Except Major Depressive Disorder 754
Digestive Malignancy Digestive Malignancy 240
Diverticulitis/osis Diverticulitis & Diverticulosis 244
Drug/Alcohol Abuse, LAMA Drug & Alcohol Abuse Or Dependence, Left Against Medical Advice
770
Eye Procs except Orbit Eye Procedures Except Orbit 73
Factors Influ Hlth Status Signs, Symptoms & Other Factors Influencing Health Status
861
Foot & Toe Procedures Foot & Toe Procedures 314
Full Burns w/ Skin Graft Full Thickness Burns w Skin Graft 842
Hand & Wrist Procedures Hand & Wrist Procedures 316
Heart Failure Heart Failure 194
Hip & Femur; Non-Trauma Hip & Femur Procedures For Non-Trauma Except Joint Replacement
309
Hip Joint Replacement Hip Joint Replacement 301
Infects- Upper Resp Tract Infections Of Upper Respiratory Tract 113
Intervertebral Disc Excis Intervertebral Disc Excision & Decompression 310
Intestinal Obstruction Intestinal Obstruction 247
Kidney & UT Infections Kidney & Urinary Tract Infections 463
Knee & Lower Excpt Foot Knee & Lower Leg Procedures Except Foot 313
Knee Joint Replacement Knee Joint Replacement 302
Lymphoma & Non-Acute Leuk
Lymphoma, Myeloma & Non-Acute Leukemia 691
Maj Cranial/Facial Bone Major Cranial/Facial Bone Procedures 89
Maj HEM/IG Dx exc SCD Major Hematologic/Immunologic Diag Exc Sickle Cell Crisis & Coagul
660
Maj Larynx & Trachea Proc Major Larynx & Trachea Procedures 90
Maj Male Pelvic Procs Major Male Pelvic Procedures 480
Maj Resp & Chest Proc Major Respiratory & Chest Procedures 120
Maj Resp Infect & Inflam Major Respiratory Infections & Inflammations 137
Maj Sml & Lrg Bowel Procs Major Small & Large Bowel Procedures 221
Maj. Depressive Disorders Major Depressive Disorders & Other/Unspecified Psychoses
751
Malignancy- Hept/Pancreas Malignancy Of Hepatobiliary System & Pancreas 281
Mastectomy Procedures Mastectomy Procedures 362
Newborn Neonate Birthwt>2499G, Normal Newborn or Neonate w Other Problem
640
Non-Bact Gastro, Nausea Non-Bacterial Gastroenteritis, Nausea & Vomiting 249
O.R. Proc for Tx Comp O.R. Procedure For Other Complications Of Treatment
791
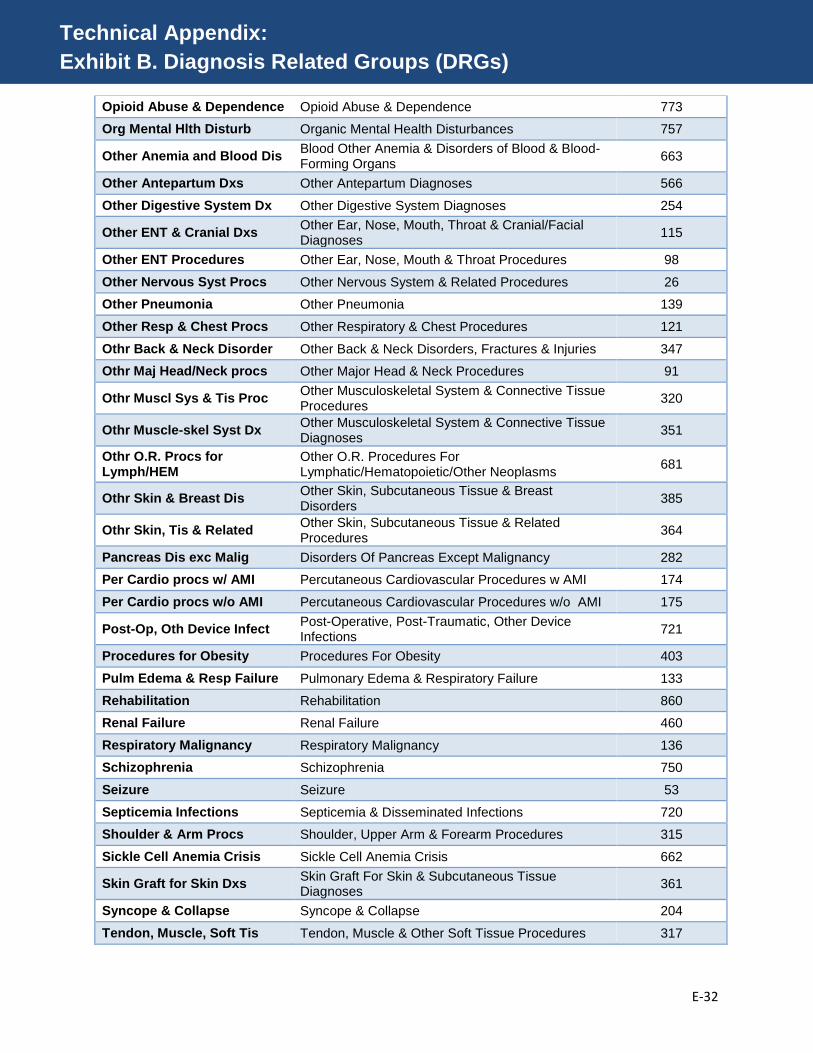
E-32
Technical Appendix:
Exhibit B. Diagnosis Related Groups (DRGs)
Opioid Abuse & Dependence Opioid Abuse & Dependence 773
Org Mental Hlth Disturb Organic Mental Health Disturbances 757
Other Anemia and Blood Dis Blood Other Anemia & Disorders of Blood & Blood-Forming Organs
663
Other Antepartum Dxs Other Antepartum Diagnoses 566
Other Digestive System Dx Other Digestive System Diagnoses 254
Other ENT & Cranial Dxs Other Ear, Nose, Mouth, Throat & Cranial/Facial Diagnoses
115
Other ENT Procedures Other Ear, Nose, Mouth & Throat Procedures 98
Other Nervous Syst Procs Other Nervous System & Related Procedures 26
Other Pneumonia Other Pneumonia 139
Other Resp & Chest Procs Other Respiratory & Chest Procedures 121
Othr Back & Neck Disorder Other Back & Neck Disorders, Fractures & Injuries 347
Othr Maj Head/Neck procs Other Major Head & Neck Procedures 91
Othr Muscl Sys & Tis Proc Other Musculoskeletal System & Connective Tissue Procedures
320
Othr Muscle-skel Syst Dx Other Musculoskeletal System & Connective Tissue Diagnoses
351
Othr O.R. Procs for Lymph/HEM
Other O.R. Procedures For Lymphatic/Hematopoietic/Other Neoplasms
681
Othr Skin & Breast Dis Other Skin, Subcutaneous Tissue & Breast Disorders
385
Othr Skin, Tis & Related Other Skin, Subcutaneous Tissue & Related Procedures
364
Pancreas Dis exc Malig Disorders Of Pancreas Except Malignancy 282
Per Cardio procs w/ AMI Percutaneous Cardiovascular Procedures w AMI 174
Per Cardio procs w/o AMI Percutaneous Cardiovascular Procedures w/o AMI 175
Post-Op, Oth Device Infect Post-Operative, Post-Traumatic, Other Device Infections
721
Procedures for Obesity Procedures For Obesity 403
Pulm Edema & Resp Failure Pulmonary Edema & Respiratory Failure 133
Rehabilitation Rehabilitation 860
Renal Failure Renal Failure 460
Respiratory Malignancy Respiratory Malignancy 136
Schizophrenia Schizophrenia 750
Seizure Seizure 53
Septicemia Infections Septicemia & Disseminated Infections 720
Shoulder & Arm Procs Shoulder, Upper Arm & Forearm Procedures 315
Sickle Cell Anemia Crisis Sickle Cell Anemia Crisis 662
Skin Graft for Skin Dxs Skin Graft For Skin & Subcutaneous Tissue Diagnoses
361
Syncope & Collapse Syncope & Collapse 204
Tendon, Muscle, Soft Tis Tendon, Muscle & Other Soft Tissue Procedures 317

E-33
Technical Appendix:
Exhibit B. Diagnosis Related Groups (DRGs)
Thyroid & Other Procs Thyroid, Parathyroid & Thyroglossal Procedures 404
Vaginal Delivery Vaginal Delivery 560

E-34
Technical Appendix:
Exhibit C. Special Public Funding
Delivery System Transformation Initiatives (DSTI) is a federal-state partnership that provides incentive payments to support and reward seven safety net hospitals in Massachusetts for investing in integrated care, quality innovations, and infrastructure to support alternative payment models. The DSTI amounts listed in the table below are to be distributed over a three year period. Infrastructure & Capacity Building (ICB) program is a federal and state-funded program administered by MassHealth to help hospitals transition to integrated delivery systems that provide more effective and cost-efficient care to patients in need. The ICB amounts listed below represent awards in FY14. The Community Hospital Acceleration, Revitalization, and Transformation Investment Program (CHART) is a four-year, $120M program funded by an industry assessment of select providers and insurers and administered by the Health Policy Commission that makes phased investments to promote efficient, effective care delivery in non-profit, non-teaching, lower cost community hospitals.
Hospital DSTI ICB (FY14)* CHART (Phase I)
CHART (Phase II)**
Anna Jaques Hospital $1,080,000 $333,500 $1,200,000
Athol Hospital $302,000 $484,128 Joint award. See below.
Baystate Franklin Medical Center $476,400 $1,800,000
Baystate Mary Lane Hospital $499,600
Baystate Medical Center $201,997 Ineligible Ineligible
Baystate Wing Hospital $357,000 $1,000,000
Berkshire Medical Center $620,000 Ineligible $3,000,000
Beth Israel Deaconess Hospital – Milton $261,200 $2,000,000
Beth Israel Deaconess Hospital – Needham
$300,000
Beth Israel Deaconess Hospital – Plymouth
$298,264 $245,818 $3,700,000
Beth Israel Deaconess Medical Center $809,302 Ineligible Ineligible
Boston Children’s Hospital Ineligible Ineligible
Boston Medical Center $310,700,000 Ineligible Ineligible
Brigham and Women’s Hospital Ineligible Ineligible
Cambridge Health Alliance $134,600,000 Ineligible Ineligible
Cape Cod Hospital Ineligible Ineligible
Clinton Hospital Ineligible Ineligible
Cooley Dickinson Hospital $109,950 Ineligible Ineligible
Dana-Farber Cancer Institute Ineligible Ineligible
Emerson Hospital $196,124 $202,575 $1,200,000
Fairview Hospital $584,402 Ineligible Ineligible
Falmouth Hospital Ineligible Ineligible
Brigham and Women’s Faulkner Hospital Ineligible Ineligible
Hallmark Health $749,360 $2,500,000
Harrington Memorial Hospital $442,303 $491,600 $3,500,000
HealthAlliance Hospital $410,000 $3,800,000
Heywood Hospital $543,647 $316,384 Joint award. See below.
Holyoke Medical Center $24,500,000 $500,000 $3,900,000
Kindred Hospital – Boston Ineligible Ineligible
Kindred Hospital – Boston North Shore Ineligible Ineligible
Lahey Hospital & Medical Center Ineligible Ineligible
Lawrence General Hospital $43,300,000 $100,000 $1,482,654
Lowell General Hospital $497,900 $1,000,000

E-35
Technical Appendix:
Exhibit C. Special Public Funding
Marlborough Hospital $352,157 $1,200,000
Martha’s Vineyard Hospital Ineligible Ineligible
Massachusetts Eye and Ear Infirmary Ineligible Ineligible
Massachusetts General Hospital Ineligible Ineligible
Mercy Medical Center $45,600,000 $233,134 $1,300,000
MetroWest Medical Center Ineligible Ineligible
Milford Regional Medical Center $403,753 $499,810 $1,300,000
Mount Auburn Hospital Ineligible Ineligible
Nantucket Cottage Hospital Ineligible Ineligible
New England Baptist Hospital
Newton-Wellesley Hospital Ineligible Ineligible
Noble Hospital $279,669 $344,665 $1,200,000
North Adams Regional Hospital $395,311 Ineligible
North Shore Medical Center Ineligible Ineligible
Northeast Hospital $620,000 $359,000 $3,769,057
Saint Vincent Hospital Ineligible
Shriners Hospital for Children – Boston
Shriners Hospital for Children – Springfield
Ineligible Ineligible
Signature Healthcare Brockton Hospital $50,100,000 $438,400 $3,500,000
South Shore Hospital Ineligible Ineligible
Southcoast Hospitals Group $1,183,357 Joint award. See below.
Steward Carney Hospital $19,200,000 Ineligible Ineligible
Steward Holy Family Hospital $343,467 Ineligible Ineligible
Steward Good Samaritan Medical Center $316,890 Ineligible Ineligible
Merrimack Valley Hospital $312,841 Ineligible Ineligible
Morton Hospital $357,666 Ineligible Ineligible
Nashoba Valley Medical Center $318,240 Ineligible Ineligible
Steward Norwood Hospital $318,358 Ineligible Ineligible
Quincy Medical Center $318,240 Ineligible Ineligible
Steward Saint Anne’s Hospital $207,795 Ineligible Ineligible
Steward St. Elizabeth’s Medical Center $117,030 Ineligible Ineligible
Sturdy Memorial Hospital $86,400 Ineligible Ineligible
Tufts Medical Center $1,227,708 Ineligible Ineligible
UMass Memorial Medical Center $3,025,357 Ineligible Ineligible
Winchester Hospital $286,500 $1,000,000
TOTAL $628,000,000 $13,793,560 $9,965,642 $43,351,711
*Franciscan Hospital for Children, a non-acute specialty hospital, received $429,995 in ICB funding for FY14
**CHART Phase II Joint Proposals were awarded to:
Athol Memorial Hospital, Heywood Hospital, and HealthAlliance Hospital: $2,900,000
Addison Gilbert Hospital, Beverly Hospital, Winchester Hospital, and Lowell General Hospital: $4,800,000
Southcoast Hospitals Group - Charlton Memorial Hospital, Tobey Hospital, and St. Luke's Hospital: $8,000,000
Hallmark Health - Melrose-Wakefield Hospital and Lawrence Memorial Hospital: $2,500,000
Baystate Franklin Medical Center, Baystate Mary Lane Hospital and Baystate Wing Hospital: $900,000
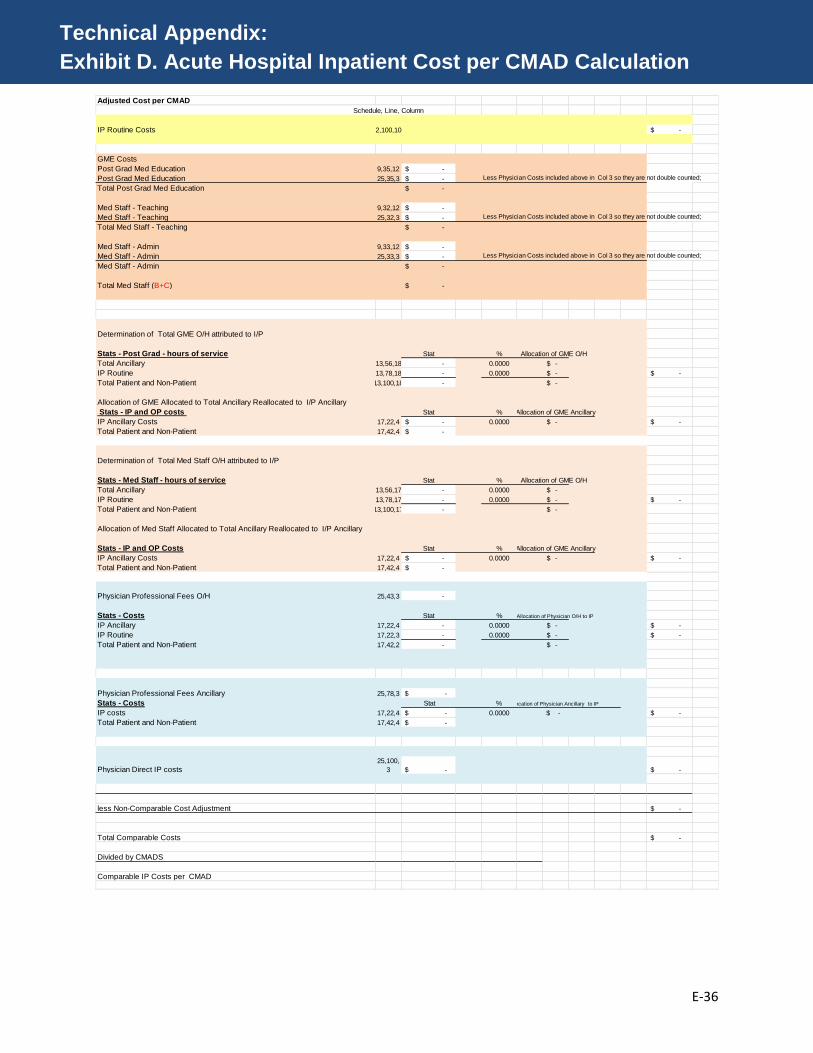
E-36
Technical Appendix:
Exhibit E. Acute Hospital Inpatient Cost per CMAD Calculation
Technical Appendix:
Exhibit F. Non-Acute Hospital Inpatient Cost per Day Technical Appendix:
Exhibit D. Acute Hospital Inpatient Cost per CMAD Calculation
Adjusted Cost per CMAD
Schedule, Line, Column
IP Routine Costs 2,100,10 -$
GME Costs
Post Grad Med Education 9,35,12 -$
Post Grad Med Education 25,35,3 -$ Less Physician Costs included above in Col 3 so they are not double counted;
Total Post Grad Med Education -$
Med Staff - Teaching 9,32,12 -$
Med Staff - Teaching 25,32,3 -$ Less Physician Costs included above in Col 3 so they are not double counted;
Total Med Staff - Teaching -$
Med Staff - Admin 9,33,12 -$
Med Staff - Admin 25,33,3 -$ Less Physician Costs included above in Col 3 so they are not double counted;
Med Staff - Admin -$
Total Med Staff (B+C) -$
Determination of Total GME O/H attributed to I/P
Stats - Post Grad - hours of service Stat % Allocation of GME O/H
Total Ancillary 13,56,18 - 0.0000 -$
IP Routine 13,78,18 - 0.0000 -$ -$
Total Patient and Non-Patient 13,100,18 - -$
Allocation of GME Allocated to Total Ancillary Reallocated to I/P Ancillary
Stats - IP and OP costs Stat % Allocation of GME Ancillary
IP Ancillary Costs 17,22,4 -$ 0.0000 -$ -$
Total Patient and Non-Patient 17,42,4 -$
Determination of Total Med Staff O/H attributed to I/P
Stats - Med Staff - hours of service Stat % Allocation of GME O/H
Total Ancillary 13,56,17 - 0.0000 -$
IP Routine 13,78,17 - 0.0000 -$ -$
Total Patient and Non-Patient 13,100,17 - -$
Allocation of Med Staff Allocated to Total Ancillary Reallocated to I/P Ancillary
Stats - IP and OP Costs Stat % Allocation of GME Ancillary
IP Ancillary Costs 17,22,4 -$ 0.0000 -$ -$
Total Patient and Non-Patient 17,42,4 -$
Physician Professional Fees O/H 25,43,3 -
Stats - Costs Stat % Allocation of Physician O/H to IP
IP Ancillary 17,22,4 - 0.0000 -$ -$
IP Routine 17,22,3 - 0.0000 -$ -$
Total Patient and Non-Patient 17,42,2 - -$
Physician Professional Fees Ancillary 25,78,3 $ -
Stats - Costs Stat % Allocation of Physician Ancillary to IP
IP costs 17,22,4 $ - 0.0000 $ - -$
Total Patient and Non-Patient 17,42,4 $ -
Physician Direct IP costs 25,100,
3 $ - -$
less Non-Comparable Cost Adjustment -$
Total Comparable Costs -$
Divided by CMADS
Comparable IP Costs per CMAD

E-37
Technical Appendix:
Exhibit E. Acute Hospital Inpatient Cost per CMAD Calculation
Technical Appendix:
Exhibit F. Non-Acute Hospital Inpatient Cost per Day Technical Appendix:
Exhibit E. Non-Acute Hospital Inpatient Cost per Day
Inpatient Cost per Day
Schedule, Line, Column
IP Routine Costs 2,100,10 -$
GME Costs
Post Grad Med Education 9,35,12 -$
Post Grad Med Education 25,35,3 -$ Less Physician Costs included above in Col 3 so they are not double counted;
Total Post Grad Med Education -$
Med Staff - Teaching 9,32,12 -$
Med Staff - Teaching 25,32,3 -$ Less Physician Costs included above in Col 3 so they are not double counted;
Total Med Staff - Teaching -$
Med Staff - Admin 9,33,12 -$
Med Staff - Admin 25,33,3 -$ Less Physician Costs included above in Col 3 so they are not double counted;
Med Staff - Admin -$
Total Med Staff (B+C) -$
Determination of Total GME O/H attributed to I/P
Stats - Post Grad - hours of service Stat % Allocation of GME O/H
Total Ancillary 13,56,18 - 0.0000 -$
IP Routine 13,78,18 - 0.0000 -$ -$
Total Patient and Non-Patient 13,100,18 - -$
Allocation of GME Allocated to Total Ancillary Reallocated to I/P Ancillary
Stats - IP and OP costs Stat % Allocation of GME Ancillary
IP Ancillary Costs 17,22,4 -$ 0.0000 -$ -$
Total Patient and Non-Patient 17,42,4 -$
Determination of Total Med Staff O/H attributed to I/P
Stats - Med Staff - hours of service Stat % Allocation of GME O/H
Total Ancillary 13,56,17 - 0.0000 -$
IP Routine 13,78,17 - 0.0000 -$ -$
Total Patient and Non-Patient 13,100,17 - -$
Allocation of Med Staff Allocated to Total Ancillary Reallocated to I/P Ancillary
Stats - IP and OP Costs Stat % Allocation of GME Ancillary
IP Ancillary Costs 17,22,4 -$ 0.0000 -$ -$
Total Patient and Non-Patient 17,42,4 -$
Physician Professional Fees O/H 25,43,3 -
Stats - Costs Stat % Allocation of Physician O/H to IP
IP Ancillary 17,22,4 - 0.0000 -$ -$
IP Routine 17,22,3 - 0.0000 -$ -$
Total Patient and Non-Patient 17,42,2 - -$
Physician Professional Fees Ancillary 25,78,3 $ -
Stats - Costs Stat % Allocation of Physician Ancillary to IP
IP costs 17,22,4 $ - 0.0000 $ - -$
Total Patient and Non-Patient 17,42,4 $ -
Physician Direct IP costs 25,100,3 $ - -$
less Non-Comparable Cost Adjustment -$
Total Comparable Costs -$
Divided by Days -$
Comparable IP Costs per Day

For more information, please contact:
CENTER FOR HEALTH INFORMATION AND ANALYSIS501 Boylston Street Boston, MA 02116617.701.8100
www.chiamass.gov
Publication Number 15-320-CHIA-01 Rev.01
CHIAcenter
for healthinformation
and analysis