mass transfer model of nanoparticle-facilitated contaminant transport in saturated porous media
TRANSCRIPT

w a t e r r e s e a r c h 4 4 ( 2 0 1 0 ) 1 0 2 8 – 1 0 3 7
Avai lab le at www.sc iencedi rect .com
journa l homepage : www.e lsev i er . com/ loca te /wat res
Mass transfer model of nanoparticle-facilitated contaminanttransport in saturated porous media
Wan Lutfi Wan Johari, Peter J. Diamessis, Leonard W. Lion*
School of Civil & Environmental Engineering, Hollister Hall, Cornell University, Ithaca, NY 14853, USA
a r t i c l e i n f o
Article history:
Received 7 July 2008
Received in revised form
19 November 2008
Accepted 16 March 2009
Available online 1 April 2009
Keywords:
Facilitated contaminant transport
Gamma distribution
Nanoparticle
* Corresponding author. Tel.: þ1 607 255 75E-mail address: [email protected] (L.W.
0043-1354/$ – see front matter ª 2009 Elsevidoi:10.1016/j.watres.2009.03.033
a b s t r a c t
A one-dimensional model has been evaluated for transport of hydrophobic contaminants,
such as polycyclic aromatic hydrocarbon (PAH) compounds, facilitated by synthetic
amphiphilic polyurethane (APU) nanoparticles in porous media. APU particles synthesized
from poly(ethylene glycol)-modified urethane acrylate (PMUA) precursor chains have been
shown to enhance the desorption rate and mobility of phenanthrene (PHEN) in soil.
A reversible process governed by attachment and detachment rates was considered to
describe the PMUA binding in soil in addition to PMUA transport through advection and
dispersion. Ultimately, an irreversible second-order PMUA attachment rate in which the
fractional soil saturation capacity with PMUA was a rate control was found to be adequate
to describe the retention of PMUA particles. A g-distributed site model (GS) was used to
describe the spectrum of physical/chemical constraints for PHEN transfer from solid to
aqueous phases. Instantaneous equilibrium was assumed for PMUA–PHEN interactions.
The coupled model for PMUA and PHEN behavior successfully described the enhanced
elution profile of PHEN by PMUA. Sensitivity analysis was performed to analyze the
significance of model parameters on model predictions. The adjustable parameter a in the
g-distribution shapes the contaminant desorption distribution profile as well as elution
and breakthrough curves. Model simulations show the use of PMUA can be also expected to
improve the release rate of PHEN in soils with higher organic carbon content. The
percentage removal of PHEN mass over time is shown to be influenced by the concentra-
tion of PMUA added and this information can be used to optimize cost and time require to
accomplish a desired remediation goal.
ª 2009 Elsevier Ltd. All rights reserved.
1. Introduction organic contaminant such as a polynuclear aromatic hydro-
Modeling of facilitated transport in the context of soil reme-
diation requires appropriate description of the soil transport
of the agent (or carrier) introduced to enhance contaminant
mobility (e.g. attachment/sorption, re-entrainment/desorp-
tion, equlibria and rates for these processes, size exclusion
from pores, etc) and of the desorptive release of the contam-
inant from soil. In this paper, we develop a model designed to
consider the case where the pollutant is a hydrophobic
71; fax: þ1 607 255 9004.Lion).er Ltd. All rights reserved
carbon (PAH) and the remediation agent is a synthetic nano-
particle designed to mimic a surfactant micelle with
a hydrophobic core and hydrophilic exterior. Laboratory data
for the facilitated transport of a model PAH, phenanthrene
(PHEN) by amphiphilic nanoparticles have been reported
previously (Tungittiplakorn et al., 2005, 2004) and provide
a test case for model evaluation.
Remediation of soil containing hydrophobic contaminants
such as PAH compounds is hindered by their slow desorption
.
w a t e r r e s e a r c h 4 4 ( 2 0 1 0 ) 1 0 2 8 – 1 0 3 7 1029
kinetics. Research has shown that sorption can take years to
reach equilibrium (Carroll et al., 1994; Coates and Elzerman,
1986). The persistence of PAHs in soil particles and their slow
desorption kinetics necessitate modeling approaches
amenable to simulation of long time scales. While several
models have been proposed to describe the mass transfer of
PAHs in porous media, we restrict consideration here to the
two-site model (TS) and g-distributed site model (GS). In a TS
model, the soil matrix is divided into two types of sorption
sites (van Genuchten and Wagenet, 1989). One site type is
assumed to be at instantaneous equilibrium with the aqueous
phase and the other site type is governed by a single mass
transfer coefficient. In the GS model, the rate constants for
mass transfer are assumed to follow a probability distribution
(Ahn et al., 1996; Connaughton et al., 1993; Culver et al., 1997;
Pedit and Miller, 1994) which is used to describe the spectrum
of physical (flow and diffusion) and chemical (site) constraints
on contaminant release from the stationary soil matrix to the
groundwater. For a contaminant with a known sorptive
distribution coefficient, both TS and GS models have two
adjustable parameters that can be changed to fit experimental
data. The flexibility of the GS model has allowed successful
prediction of the release rates of naphthalene from fresh and
aged contaminated soil samples (Ahn et al., 1996, 1999a),
predicted transport of volatile organic compounds in unsat-
urated soil (Lorden et al., 1998) and soil transport of transition
metals in the presence of a mobile metal-binding ligand
(Jensen-Spaulding et al., 2004b). Beyond its ability to fit
experimental results, the GS model has been shown to have
a predictive ability that the TS model lacked in comparative
tests (Ahn et al., 1996; Chen and Wagenet, 1995; Jensen-
Spaulding et al., 2004b; Lorden et al., 1998). Thus, the GS model
is selected for use in this evaluation for description of PAH
behavior in the presence and absence of a mobile amphiphilic
nanoparticle carrier.
Surfactant micelles have been used as mobile agents to
enhance the desorption rate of hydrophobic organic contam-
inants from soil particles and shorten the time required for
remediation (Abdul and Gibson, 1991; Ang and Abdul, 1994;
Deitsch and Smith, 1995; Grimberg et al., 1995, 1996; Rouse
et al., 1993). Micelles possess a hydrophobic core which serves
as sorbent matrix for the organic contaminants in soil and
a hydrophilic surface that facilitates the transport of surfac-
tant aggregate in porous media. However, micelles are not
stable and the surfactant molecules will also react with soil
surfaces (Abdul and Gibson, 1991; Rouse et al., 1993). The
structure of surfactant micelles can only be maintained when
the aqueous concentration of the surfactant monomers rea-
ches or exceeds the critical micelle concentration. Several
studies have been focused on the surfactant designs to mini-
mize losses due to breakage, to develop reuse and recycle
techniques and to eliminate toxicity effects on biodegradation
(Hasegawa et al., 1997; Lipe et al., 1996; McCray and Brusseau,
1998; Rouse et al., 1993).
Polymeric nanoparticles have been synthesized to produce
attributes similar to those of surfactant micelles and can be
used as an alternative carrier to enhance hydrophobic
contaminant transport in porous media. Amphiphilic poly-
urethane (APU) nano polymer particles were developed by
Kim et al. (2000) from polyurethane acrylate anionomer (UAA)
precursor chains. Unlike surfactants, the APU particle
precursor chains are cross-linked preventing the break up of
nanoparticle in soil. Thus, the stability of APU particles is
maintained regardless of precursor chain concentration.
The properties of APU particles can be controlled by using
alternative formulations and synthesis methods (Tung-
ittiplakorn et al., 2004). Nanoparticles with polar hydroxyl
surface functional groups are less susceptible than those with
carboxyl groups to coagulation by divalent cations (Tung-
ittiplakorn et al., 2004). Nanoparticles with an average size of
80� 15 nm synthesized from poly(ethylene glycol)-modified
urethane acrylate (PMUA) precursor chains have been shown
in laboratory experiments to improve the desorption rate of
PHEN from soil, facilitate the contaminant’s mobility in
porous media, and increase the bioavailability of PHEN to
microbial populations. In contrast, surfactant micelles can
inhibit PAH biodegradation rates (Chen et al., 2001; Kim and
Weber, 2003; Laha and Luthy, 1991).
The motivation of this study is to model the transport
behavior of PMUA nanoparticles in porous media and to
explore alternative ways to explain nanoparticle-facilitated
contaminant transport in the soil matrix. Below, a one-
dimensional model is developed by coupling use of the GS
model to describe the PHEN sorption and desorption as well as
alternative models for PMUA–soil interaction. Model param-
eters are fit to the experimental data of Tungittiplakorn et al.
(2004) and simulation results are compared to experimental
observations. Because of the long time scales involved in
PHEN desorption and rapid reaction of PHEN with PMUA
(Tungittiplakorn et al., 2004), instantaneous equilibrium is
assumed for PMUA–PHEN interactions. Coupling of a GS
contaminant sorption model with a colloid transport model
has not been exploited in prior attempts to model facilitated
transport. The resulting model is also utilized here to evaluate
the importance of selected parameters to PHEN and PMUA
behavior in porous media. Other researchers (Montas and
Shirmohammadi, 2004) have modeled the data presented by
Tungittiplakorn et al. (2004). However, the PHEN sorption
model employed in that case was a two region (TR) model,
which is mathematically equivalent to a TS model (van Gen-
uchten and Wagenet, 1989) and has been proven to be inad-
equate to describe the heterogeneity of sorption behavior of
PAH in the soil (Ahn et al., 1999b). The model of Montas and
Shirmohammadi also was unable to describe both PMUA BTCs
using the same constitutive equations with the final condition
for first application as the initial condition for the second
application. The limitation of this approach provided addi-
tional motivation for evaluation of an alternative model.
2. Methods
2.1. PMUA nanoparticle transport behavior
Four processes are considered in modeling the mass transfer
and transport of PMUA particles in porous media: advection,
dispersion, attachment (deposition) and detachment
(re-entrainment). The effluent concentration of PMUA parti-
cles, N [M/V], from a column of length L is modeled using
generalized colloid transport equation:
w a t e r r e s e a r c h 4 4 ( 2 0 1 0 ) 1 0 2 8 – 1 0 3 71030
vNvtþ r
nvNS
vt¼ v
vz
�DN
vNvz� uNN
�(1)
where NS is the concentration of PMUA particles attached to
the soil matrix [M/M], DN is the PMUA dispersion coefficient
[L2/T], uN is the average pore velocity of PMUA particles, r is
the bulk density of the porous media [M/V], n is soil porosity
[V/V], t is time [T] and z is length [L].
In the case where binding of nanoparticles to soil is
reversible, mass transfer of PMUA particles between the
aqueous and soil phases can be expressed by the difference
between the attachment and detachment rates:
vNS
vt¼ kanN� kdnNS (2)
where kan is the first-order PMUA particles attachment coef-
ficient [V/(MT)] and kdn is the first-order order detachment
coefficient [1/T] for soil-bound PMUA particles. kdn equals zero
if nanoparticle binding to soil is irreversible.
In many instances, a blocking phenomenon occurs when
the colloid concentration on the porous media approaches
maximum colloidal retention capacity. In these cases, the
attachment rate can be also described as dependent on
the fraction of porous medium available for deposition, J. The
attachment rate will approach to zero near the maximum
retention capacity and, at that point, colloidal particle trans-
port is no longer influenced by interaction with the soil phase.
The second-order kinetic equation that describes this
phenomenon is given by (Saiers et al., 1994):
vNS
vt¼ jkanN� kdnNS (3)
j ¼ 1� NS
NmaxS
(4)
where J is the dimensionless colloid retention function [�]
and NmaxS is the maximum solid-phase particle concentration
[M/M].
The TR model is used here as an alternative model to
describe the fate and transport of nanoparticles (van Gen-
uchten and Wagenet, 1989). The TR model is given by:
vNS
vt¼ fmKN
S
vNvtþ lm
rðN�N2Þ (5a)
lm
rðN�N2Þ ¼
h1þ
�1� fm
�rn
KNS
inr
vN2
vt(5b)
where fm is the fraction of mobile fluid, lm is the mass transfer
rate coefficient from mobile to immobile fluid [1/T], and N2 is
the PMUA concentration in the immobile region [M/M]. Poros-
ities in mobile and immobile regions are assumed to be equal.
2.2. PHEN transport behavior
PHEN transport in porous media can be described by one-
dimensional advection–dispersion–sorption equation (Ahn
et al., 1999b; Chen and Wagenet, 1995):
vCvtþ r
nvSvt¼ v
vz
�D
vCvz� uC
�(6)
where C is the PHEN concentration in aqueous phase [M/V], u is
the average pore-water velocity [L/T], D is the PHEN dispersion
coefficient [L2/T] and vS=vt is the PHEN mass transfer between
the aqueous phase and the solid matrix. In this analysis, a GS
model is used to describe vS=vt and the average pore velocity
for PHEN and PMUA are assumed to be equal.
In the GS model, a g distribution of first-order sorption/
desorption rate constants is used to account for the influence of
soil matrix heterogeneity on the dynamic interaction between
the soil matrix and a contaminant. PHEN is used as represen-
tative PAH for purposes of comparison to available data.
The change of the sorbed PHEN concentration, vCS=vt, in
a continuum of soil ‘‘compartments’’ differentiated by their
mass transfer coefficients, ki, is described by the following
kinetic expression for PHEN desorption from soil:
vCS;i
vt¼ �ki
�CS;i � KC
S C�
(7)
where CS;i is the PHEN concentration which is attached onto
the ith soil compartment [M/M], C is the aqueous PHEN
concentration [M/V], KCS is the distribution coefficient of PHEN
to the soil [V/M], ki is the rate constant for the ith compart-
ment [1/T] and k is described by a g-distribution density
function, where b is a scale parameter [T] and a is a shape
parameter [�]:
fðkÞ ¼ baka�1expð�bkÞ=gðaÞ (8)
where: gðaÞ ¼RN
0 xa�1expð�xÞdx. The expected value of the
distribution [1/T], E(k) is given by a=b. The total amount of
PHEN per unit amount of soil, S [M/M] and its time derivative
are given by:
S ¼ZN
0
CSðkÞfðkÞdk (9)
vSvt¼ZN
0
vCSðkÞvt
fðkÞdk ¼ a
bKC
S C�ZN
0
kCSðkÞfðkÞdk (10)
As comparison, a TS model is used to describe the soil-
sorbed PHEN (van Genuchten and Wagenet, 1989). The TS
model is given by:
vSvt¼ fKC
S
vCvtþ vS2
vt(11a)
vS2
vt¼ l�ð1� fÞKC
S C� S2
�(11b)
where f is the fraction of equilibrium sorption sites at
instantaneous equilibrium, l is the mass transfer rate coeffi-
cient [1/T], and S2 is the PHEN concentration in the time
dependent site [M/M]. van Genuchten and Wagenet, (1989)
introduced variables in dimensionless forms of Eqs. (5a), (5b),
(11a), and (11b) that are mathematically equivalent and
conveniently interchangeable between TS and TR models.
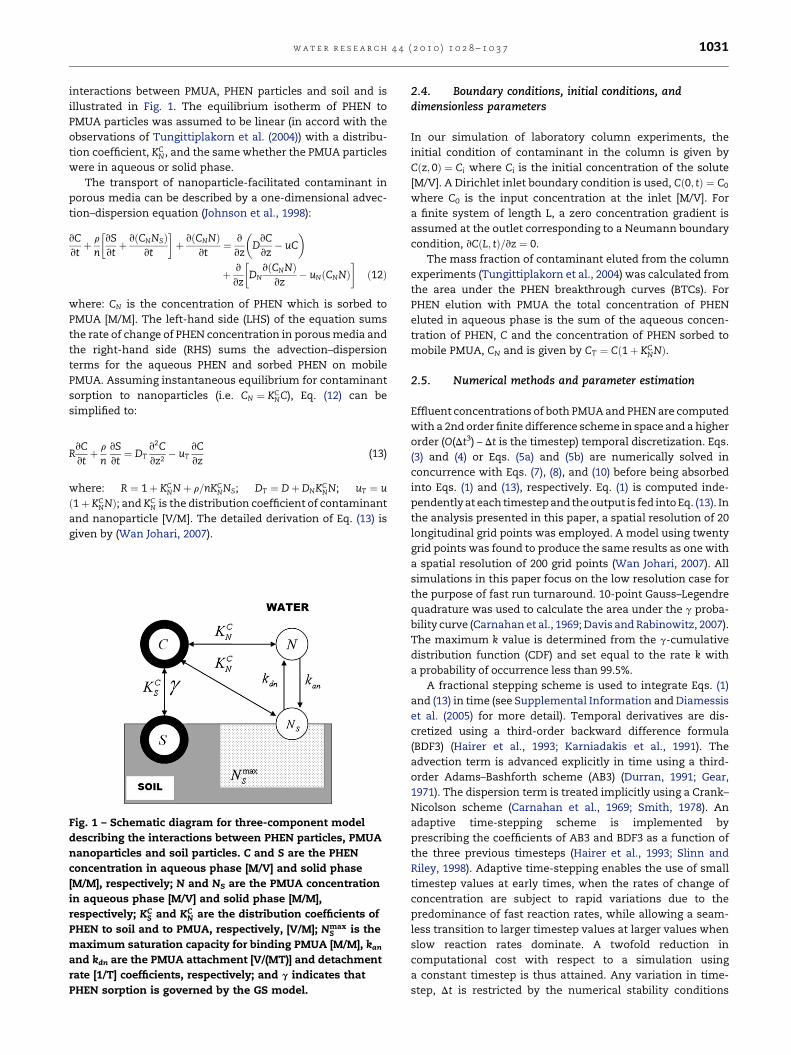
2.3. PMUA-facilitated PHEN transport
A three-component model has been used to describe the
enhancement of contaminant transport by mobile carriers in
porous media (Jensen-Spaulding et al., 2004a; Liu et al., 2001;
Magee et al., 1991). This model is used here to represent the
w a t e r r e s e a r c h 4 4 ( 2 0 1 0 ) 1 0 2 8 – 1 0 3 7 1031
interactions between PMUA, PHEN particles and soil and is
illustrated in Fig. 1. The equilibrium isotherm of PHEN to
PMUA particles was assumed to be linear (in accord with the
observations of Tungittiplakorn et al. (2004)) with a distribu-
tion coefficient, KCN, and the same whether the PMUA particles
were in aqueous or solid phase.
The transport of nanoparticle-facilitated contaminant in
porous media can be described by a one-dimensional advec-
tion–dispersion equation (Johnson et al., 1998):
vCvtþ r
n
�vSvtþ vðCNNSÞ
vt
þ vðCNNÞ
vt¼ v
vz
�D
vCvz� uC
�
þ v
vz
�DN
vðCNNÞvz
� uNðCNNÞð12Þ
where: CN is the concentration of PHEN which is sorbed to
PMUA [M/M]. The left-hand side (LHS) of the equation sums
the rate of change of PHEN concentration in porous media and
the right-hand side (RHS) sums the advection–dispersion
terms for the aqueous PHEN and sorbed PHEN on mobile
PMUA. Assuming instantaneous equilibrium for contaminant
sorption to nanoparticles (i.e. CN ¼ KCNC), Eq. (12) can be
simplified to:
RvCvtþ r
nvSvt¼ DT
v2Cvz2� uT
vCvz
(13)
where: R ¼ 1þ KCNNþ r=nKC
NNS; DT ¼ Dþ DNKCNN; uT ¼ u
ð1þ KCNNÞ; and KC
N is the distribution coefficient of contaminant
and nanoparticle [V/M]. The detailed derivation of Eq. (13) is
given by (Wan Johari, 2007).
Fig. 1 – Schematic diagram for three-component model
describing the interactions between PHEN particles, PMUA
nanoparticles and soil particles. C and S are the PHEN
concentration in aqueous phase [M/V] and solid phase
[M/M], respectively; N and NS are the PMUA concentration
in aqueous phase [M/V] and solid phase [M/M],
respectively; KCS and KC
N are the distribution coefficients of
PHEN to soil and to PMUA, respectively, [V/M]; NmaxS is the
maximum saturation capacity for binding PMUA [M/M], kan
and kdn are the PMUA attachment [V/(MT)] and detachment
rate [1/T] coefficients, respectively; and g indicates that
PHEN sorption is governed by the GS model.
2.4. Boundary conditions, initial conditions, anddimensionless parameters
In our simulation of laboratory column experiments, the
initial condition of contaminant in the column is given by
Cðz; 0Þ ¼ Ci where Ci is the initial concentration of the solute
[M/V]. A Dirichlet inlet boundary condition is used, Cð0; tÞ ¼ C0
where C0 is the input concentration at the inlet [M/V]. For
a finite system of length L, a zero concentration gradient is
assumed at the outlet corresponding to a Neumann boundary
condition, vCðL; tÞ=vz ¼ 0.
The mass fraction of contaminant eluted from the column
experiments (Tungittiplakorn et al., 2004) was calculated from
the area under the PHEN breakthrough curves (BTCs). For
PHEN elution with PMUA the total concentration of PHEN
eluted in aqueous phase is the sum of the aqueous concen-
tration of PHEN, C and the concentration of PHEN sorbed to
mobile PMUA, CN and is given by CT ¼ Cð1þ KCNNÞ.
2.5. Numerical methods and parameter estimation
Effluent concentrations of both PMUA and PHEN are computed
with a 2nd order finite difference scheme in space and a higher
order (O(Dt3) – Dt is the timestep) temporal discretization. Eqs.
(3) and (4) or Eqs. (5a) and (5b) are numerically solved in
concurrence with Eqs. (7), (8), and (10) before being absorbed
into Eqs. (1) and (13), respectively. Eq. (1) is computed inde-
pendently at each timestep and the output is fed into Eq. (13). In
the analysis presented in this paper, a spatial resolution of 20
longitudinal grid points was employed. A model using twenty
grid points was found to produce the same results as one with
a spatial resolution of 200 grid points (Wan Johari, 2007). All
simulations in this paper focus on the low resolution case for
the purpose of fast run turnaround. 10-point Gauss–Legendre
quadrature was used to calculate the area under the g proba-
bility curve (Carnahan et al., 1969; Davis and Rabinowitz, 2007).
The maximum k value is determined from the g-cumulative
distribution function (CDF) and set equal to the rate k with
a probability of occurrence less than 99.5%.
A fractional stepping scheme is used to integrate Eqs. (1)
and (13) in time (see Supplemental Information and Diamessis
et al. (2005) for more detail). Temporal derivatives are dis-
cretized using a third-order backward difference formula
(BDF3) (Hairer et al., 1993; Karniadakis et al., 1991). The
advection term is advanced explicitly in time using a third-
order Adams–Bashforth scheme (AB3) (Durran, 1991; Gear,
1971). The dispersion term is treated implicitly using a Crank–
Nicolson scheme (Carnahan et al., 1969; Smith, 1978). An
adaptive time-stepping scheme is implemented by
prescribing the coefficients of AB3 and BDF3 as a function of
the three previous timesteps (Hairer et al., 1993; Slinn and
Riley, 1998). Adaptive time-stepping enables the use of small
timestep values at early times, when the rates of change of
concentration are subject to rapid variations due to the
predominance of fast reaction rates, while allowing a seam-
less transition to larger timestep values at larger values when
slow reaction rates dominate. A twofold reduction in
computational cost with respect to a simulation using
a constant timestep is thus attained. Any variation in time-
step, Dt is restricted by the numerical stability conditions
w a t e r r e s e a r c h 4 4 ( 2 0 1 0 ) 1 0 2 8 – 1 0 3 71032
Cr< 1 and r ¼ D Dt=ðDzÞ2 < 0:5, where ½Cr ¼ uðDt=DzÞ� is the
Courant number and Dz is the spatial resolution (Smith, 1978).
The numerical model for the advective–dispersive transport
equation in the absence of a chemical reaction term has been
successfully validated against the corresponding analytical
solution (Cleary and Adrian, 1973; van Genuchten and Alves,
1982; Wan Johari, 2007).
Optimal values of unknown parameters were estimated
using a multiple nonlinear Marquardt method (Constantinides
and Mostoufi,1999; Marquardt, 1963).The method is flexible and
combines Gauss–Newton and steepest descent optimization
methods. The optimization was satisfied when the sum of
squared errors was minimized. Selected PMUA parameters,
such as DN; kan; kdn;NmaxS ; fm and lm, were optimized using the
experimental data (Tungittiplakorn, 2005). Three parameters
a;EðkÞ and KCS control the behavior of PHEN and these parame-
ters were optimized using the experimental data obtained over
thefirst10porevolumes(prior to introductionofPMUA) andalso
using all data, i.e., the combination of data obtained both prior
and subsequent to PMUA input in Fig. 7 of Tungittiplakorn et al.
(2004). The initial estimates for a;EðkÞ and KCS were determined
fromlaboratorybatch experiments (Tungittiplakorn etal.,2004;)
and a was constrained to values less than 1.
3. Results and discussion
3.1. Modeling and parameter estimation
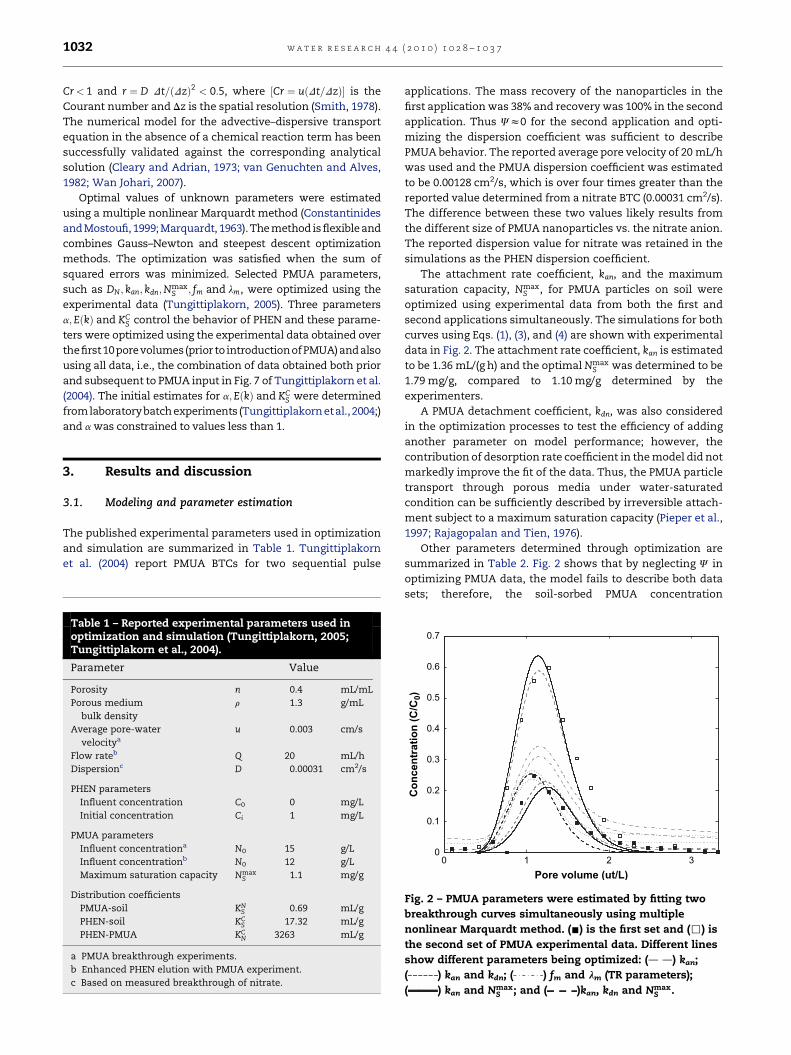
The published experimental parameters used in optimization
and simulation are summarized in Table 1. Tungittiplakorn
et al. (2004) report PMUA BTCs for two sequential pulse
Table 1 – Reported experimental parameters used inoptimization and simulation (Tungittiplakorn, 2005;Tungittiplakorn et al., 2004).
Parameter Value
Porosity n 0.4 mL/mL
Porous medium
bulk density
r 1.3 g/mL
Average pore-water
velocitya
u 0.003 cm/s
Flow rateb Q 20 mL/h
Dispersionc D 0.00031 cm2/s
PHEN parameters
Influent concentration C0 0 mg/L
Initial concentration Ci 1 mg/L
PMUA parameters
Influent concentrationa N0 15 g/L
Influent concentrationb N0 12 g/L
Maximum saturation capacity NmaxS 1.1 mg/g
Distribution coefficients
PMUA-soil KNS 0.69 mL/g
PHEN-soil KCS 17.32 mL/g
PHEN-PMUA KCN 3263 mL/g
a PMUA breakthrough experiments.
b Enhanced PHEN elution with PMUA experiment.
c Based on measured breakthrough of nitrate.
applications. The mass recovery of the nanoparticles in the
first application was 38% and recovery was 100% in the second
application. Thus Jz0 for the second application and opti-
mizing the dispersion coefficient was sufficient to describe
PMUA behavior. The reported average pore velocity of 20 mL/h
was used and the PMUA dispersion coefficient was estimated
to be 0.00128 cm2/s, which is over four times greater than the
reported value determined from a nitrate BTC (0.00031 cm2/s).
The difference between these two values likely results from
the different size of PMUA nanoparticles vs. the nitrate anion.
The reported dispersion value for nitrate was retained in the
simulations as the PHEN dispersion coefficient.
The attachment rate coefficient, kan, and the maximum
saturation capacity, NmaxS , for PMUA particles on soil were
optimized using experimental data from both the first and
second applications simultaneously. The simulations for both
curves using Eqs. (1), (3), and (4) are shown with experimental
data in Fig. 2. The attachment rate coefficient, kan is estimated
to be 1.36 mL/(g h) and the optimal NmaxS was determined to be
1.79 mg/g, compared to 1.10 mg/g determined by the
experimenters.
A PMUA detachment coefficient, kdn, was also considered
in the optimization processes to test the efficiency of adding
another parameter on model performance; however, the
contribution of desorption rate coefficient in the model did not
markedly improve the fit of the data. Thus, the PMUA particle
transport through porous media under water-saturated
condition can be sufficiently described by irreversible attach-
ment subject to a maximum saturation capacity (Pieper et al.,
1997; Rajagopalan and Tien, 1976).
Other parameters determined through optimization are
summarized in Table 2. Fig. 2 shows that by neglecting J in
optimizing PMUA data, the model fails to describe both data
sets; therefore, the soil-sorbed PMUA concentration
0 1 2 30
0.1
0.2
0.3
0.4
0.5
0.6
0.7
Pore volume (ut/L)
Co
ncen
tratio
n (C
/C
0)
Fig. 2 – PMUA parameters were estimated by fitting two
breakthrough curves simultaneously using multiple
nonlinear Marquardt method. (-) is the first set and (,) is
the second set of PMUA experimental data. Different lines
show different parameters being optimized: (d d) kan;
( ) kan and kdn; ( ) fm and lm (TR parameters);
( ) kan and NmaxS ; and ( )kan, kdn and Nmax
S .
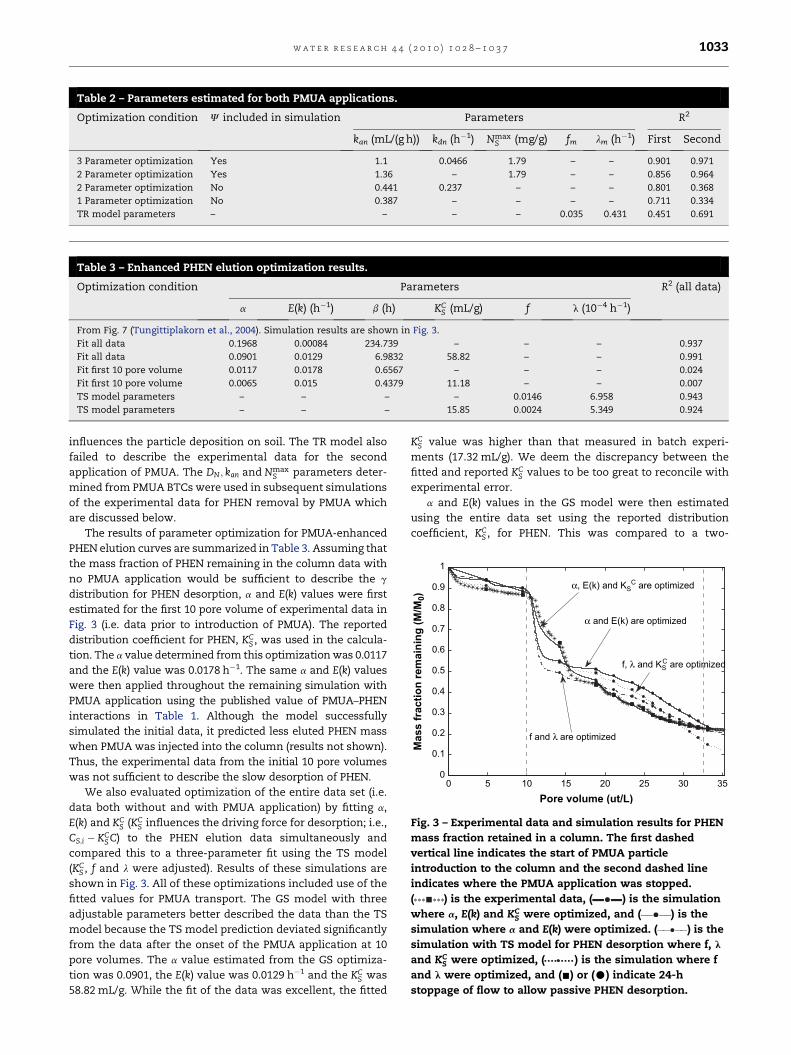
Table 2 – Parameters estimated for both PMUA applications.
Optimization condition J included in simulation Parameters R2
kan (mL/(g h)) kdn (h�1) NmaxS (mg/g) fm lm (h�1) First Second
3 Parameter optimization Yes 1.1 0.0466 1.79 – – 0.901 0.971
2 Parameter optimization Yes 1.36 – 1.79 – – 0.856 0.964
2 Parameter optimization No 0.441 0.237 – – – 0.801 0.368
1 Parameter optimization No 0.387 – – – – 0.711 0.334
TR model parameters – – – – 0.035 0.431 0.451 0.691
Table 3 – Enhanced PHEN elution optimization results.
Optimization condition Parameters R2 (all data)
a E(k) (h�1) b (h) KCS (mL/g) f l (10�4 h�1)
From Fig. 7 (Tungittiplakorn et al., 2004). Simulation results are shown in Fig. 3.
Fit all data 0.1968 0.00084 234.739 – – – 0.937
Fit all data 0.0901 0.0129 6.9832 58.82 – – 0.991
Fit first 10 pore volume 0.0117 0.0178 0.6567 – – – 0.024
Fit first 10 pore volume 0.0065 0.015 0.4379 11.18 – – 0.007
TS model parameters – – – – 0.0146 6.958 0.943
TS model parameters – – – 15.85 0.0024 5.349 0.924
0 5 10 15 20 25 30 350
0.1
0.2
0.3
0.4
0.5
0.6
0.7
0.8
0.9
1
Mass fractio
n rem
ain
in
g (M
/M
0)
Pore volume (ut/L)
α and E(k) are optimized
f and λ are optimized
α, E(k) and KSC are optimized
f, λ and KSC are optimized
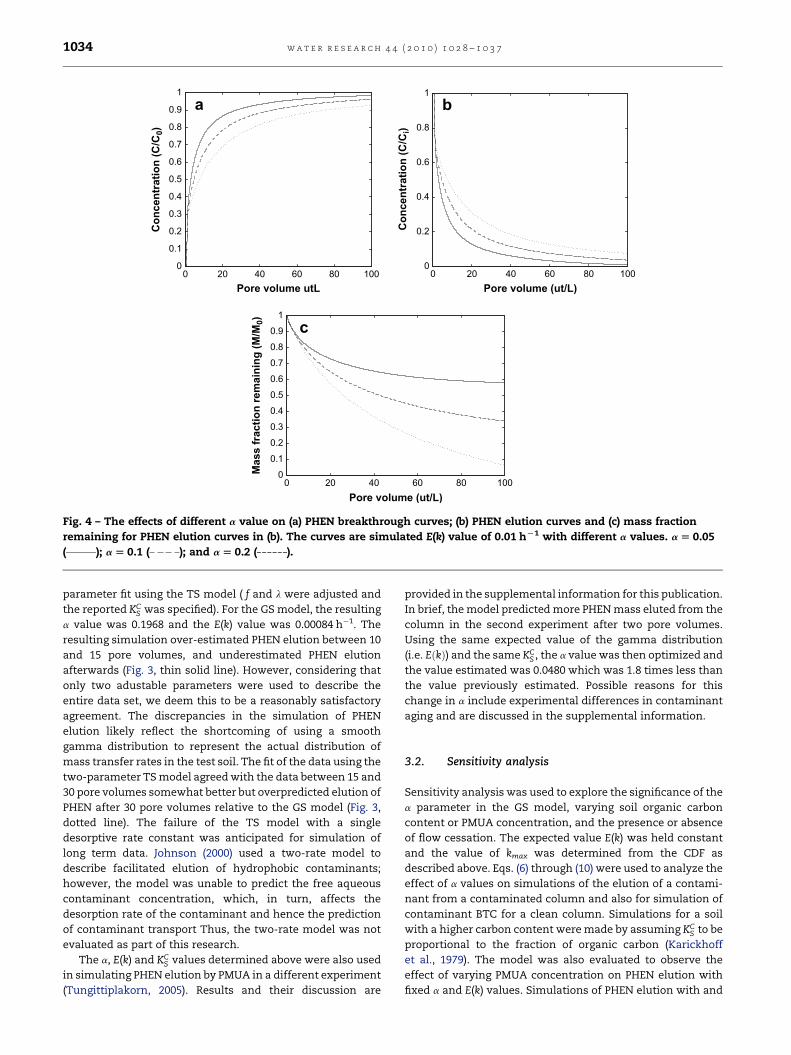
Fig. 3 – Experimental data and simulation results for PHEN
mass fraction retained in a column. The first dashed
vertical line indicates the start of PMUA particle
introduction to the column and the second dashed line
indicates where the PMUA application was stopped.
( ) is the experimental data, ( ) is the simulation
where a, E(k) and KCS were optimized, and ( ) is the
simulation where a and E(k) were optimized. ( ) is the
simulation with TS model for PHEN desorption where f, l
and KCS were optimized, ( ) is the simulation where f
and l were optimized, and (-) or (C) indicate 24-h
stoppage of flow to allow passive PHEN desorption.
w a t e r r e s e a r c h 4 4 ( 2 0 1 0 ) 1 0 2 8 – 1 0 3 7 1033
influences the particle deposition on soil. The TR model also
failed to describe the experimental data for the second
application of PMUA. The DN; kan and NmaxS parameters deter-
mined from PMUA BTCs were used in subsequent simulations
of the experimental data for PHEN removal by PMUA which
are discussed below.
The results of parameter optimization for PMUA-enhanced
PHEN elution curves are summarized in Table 3. Assuming that
the mass fraction of PHEN remaining in the column data with
no PMUA application would be sufficient to describe the g
distribution for PHEN desorption, a and E(k) values were first
estimated for the first 10 pore volume of experimental data in
Fig. 3 (i.e. data prior to introduction of PMUA). The reported
distribution coefficient for PHEN, KCS , was used in the calcula-
tion. The a value determined from this optimization was 0.0117
and the E(k) value was 0.0178 h�1. The same a and E(k) values
were then applied throughout the remaining simulation with
PMUA application using the published value of PMUA–PHEN
interactions in Table 1. Although the model successfully
simulated the initial data, it predicted less eluted PHEN mass
when PMUA was injected into the column (results not shown).
Thus, the experimental data from the initial 10 pore volumes
was not sufficient to describe the slow desorption of PHEN.
We also evaluated optimization of the entire data set (i.e.
data both without and with PMUA application) by fitting a,
E(k) and KCS (KC
S influences the driving force for desorption; i.e.,
CS;i � KCS C) to the PHEN elution data simultaneously and
compared this to a three-parameter fit using the TS model
(KCS , f and l were adjusted). Results of these simulations are
shown in Fig. 3. All of these optimizations included use of the
fitted values for PMUA transport. The GS model with three
adjustable parameters better described the data than the TS
model because the TS model prediction deviated significantly
from the data after the onset of the PMUA application at 10
pore volumes. The a value estimated from the GS optimiza-
tion was 0.0901, the E(k) value was 0.0129 h�1 and the KCS was
58.82 mL/g. While the fit of the data was excellent, the fitted
KCS value was higher than that measured in batch experi-
ments (17.32 mL/g). We deem the discrepancy between the
fitted and reported KCS values to be too great to reconcile with
experimental error.
a and E(k) values in the GS model were then estimated
using the entire data set using the reported distribution
coefficient, KCS , for PHEN. This was compared to a two-
0 20 40 60 80 1000
0.1
0.2
0.3
0.4
0.5
0.6
0.7
0.8
0.9
1
Pore volume utL
Co
ncen
tratio
n (C
/C
0)
a
0 20 40 60 80 1000
0.2
0.4
0.6
0.8
1
Pore volume (ut/L)
Co
ncen
tratio
n (C
/C
i)
b
0 20 40 60 80 1000
0.1
0.2
0.3
0.4
0.5
0.6
0.7
0.8
0.9
1
Mass fractio
n rem
ain
in
g (M
/M
0)
Pore volume (ut/L)
c
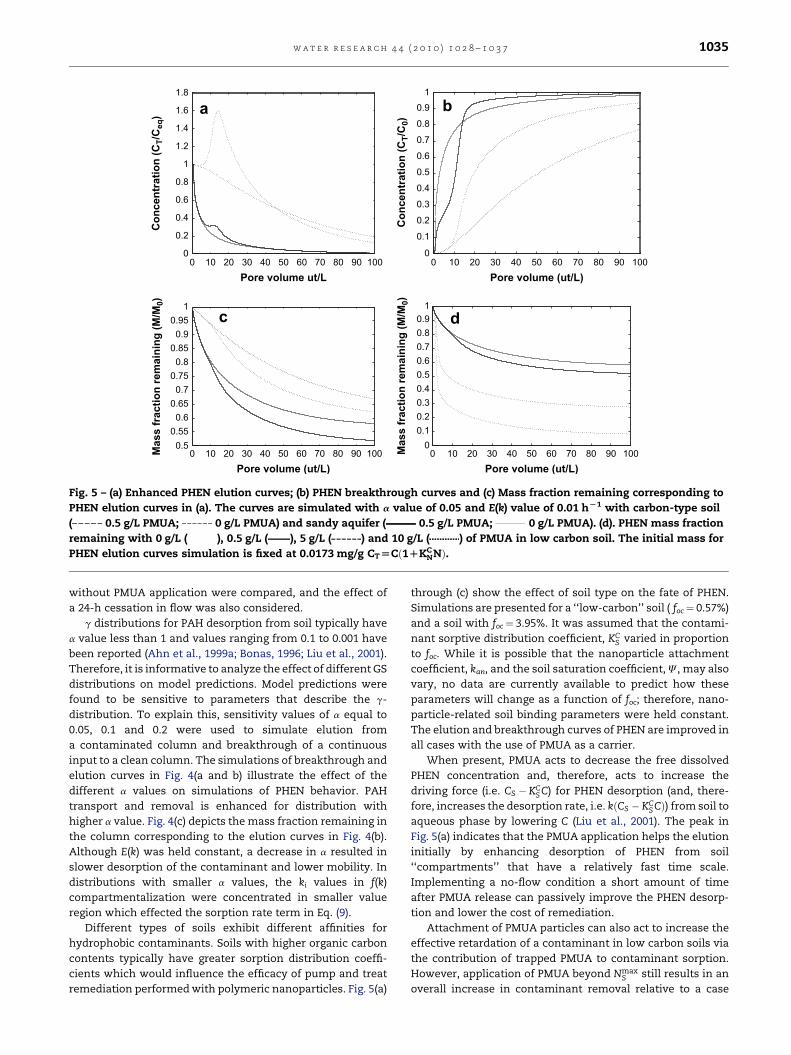
Fig. 4 – The effects of different a value on (a) PHEN breakthrough curves; (b) PHEN elution curves and (c) mass fraction
remaining for PHEN elution curves in (b). The curves are simulated E(k) value of 0.01 hL1 with different a values. a [ 0.05
( ); a [ 0.1 ( ); and a [ 0.2 ( ).
w a t e r r e s e a r c h 4 4 ( 2 0 1 0 ) 1 0 2 8 – 1 0 3 71034
parameter fit using the TS model ( f and l were adjusted and
the reported KCS was specified). For the GS model, the resulting
a value was 0.1968 and the E(k) value was 0.00084 h�1. The
resulting simulation over-estimated PHEN elution between 10
and 15 pore volumes, and underestimated PHEN elution
afterwards (Fig. 3, thin solid line). However, considering that
only two adustable parameters were used to describe the
entire data set, we deem this to be a reasonably satisfactory
agreement. The discrepancies in the simulation of PHEN
elution likely reflect the shortcoming of using a smooth
gamma distribution to represent the actual distribution of
mass transfer rates in the test soil. The fit of the data using the
two-parameter TS model agreed with the data between 15 and
30 pore volumes somewhat better but overpredicted elution of
PHEN after 30 pore volumes relative to the GS model (Fig. 3,
dotted line). The failure of the TS model with a single
desorptive rate constant was anticipated for simulation of
long term data. Johnson (2000) used a two-rate model to
describe facilitated elution of hydrophobic contaminants;
however, the model was unable to predict the free aqueous
contaminant concentration, which, in turn, affects the
desorption rate of the contaminant and hence the prediction
of contaminant transport Thus, the two-rate model was not
evaluated as part of this research.
The a, E(k) and KCS values determined above were also used
in simulating PHEN elution by PMUA in a different experiment
(Tungittiplakorn, 2005). Results and their discussion are
provided in the supplemental information for this publication.
In brief, the model predicted more PHEN mass eluted from the
column in the second experiment after two pore volumes.
Using the same expected value of the gamma distribution
(i.e. EðkÞ) and the same KCS , the a value was then optimized and
the value estimated was 0.0480 which was 1.8 times less than
the value previously estimated. Possible reasons for this
change in a include experimental differences in contaminant
aging and are discussed in the supplemental information.
3.2. Sensitivity analysis
Sensitivity analysis was used to explore the significance of the
a parameter in the GS model, varying soil organic carbon
content or PMUA concentration, and the presence or absence
of flow cessation. The expected value E(k) was held constant
and the value of kmax was determined from the CDF as
described above. Eqs. (6) through (10) were used to analyze the
effect of a values on simulations of the elution of a contami-
nant from a contaminated column and also for simulation of
contaminant BTC for a clean column. Simulations for a soil
with a higher carbon content were made by assuming KCS to be
proportional to the fraction of organic carbon (Karickhoff
et al., 1979). The model was also evaluated to observe the
effect of varying PMUA concentration on PHEN elution with
fixed a and E(k) values. Simulations of PHEN elution with and
0 10 20 30 40 50 60 70 80 900
0.2
0.4
0.6
0.8
1
1.2
1.4
1.6
1.8
Co
ncen
tratio
n (C
T/C
eq)
100Pore volume ut/L
0 10 20 30 40 50 60 70 80 90 1000
0.1
0.2
0.3
0.4
0.5
0.6
0.7
0.8
0.91
Co
ncen
tratio
n (C
T/C
0)
Pore volume (ut/L)
0 10 20 30 40 50 60 70 80 90 1000.5
0.550.6
0.650.7
0.750.8
0.850.9
0.951
Mass fractio
n rem
ain
in
g (M
/M
0)
Pore volume (ut/L)
010 20 30 40 50 60 70 80 90 1000
0.10.20.30.40.50.60.70.80.9
1
Mass fractio
n rem
ain
in
g (M
/M
0)
Pore volume (ut/L)
a b
c d
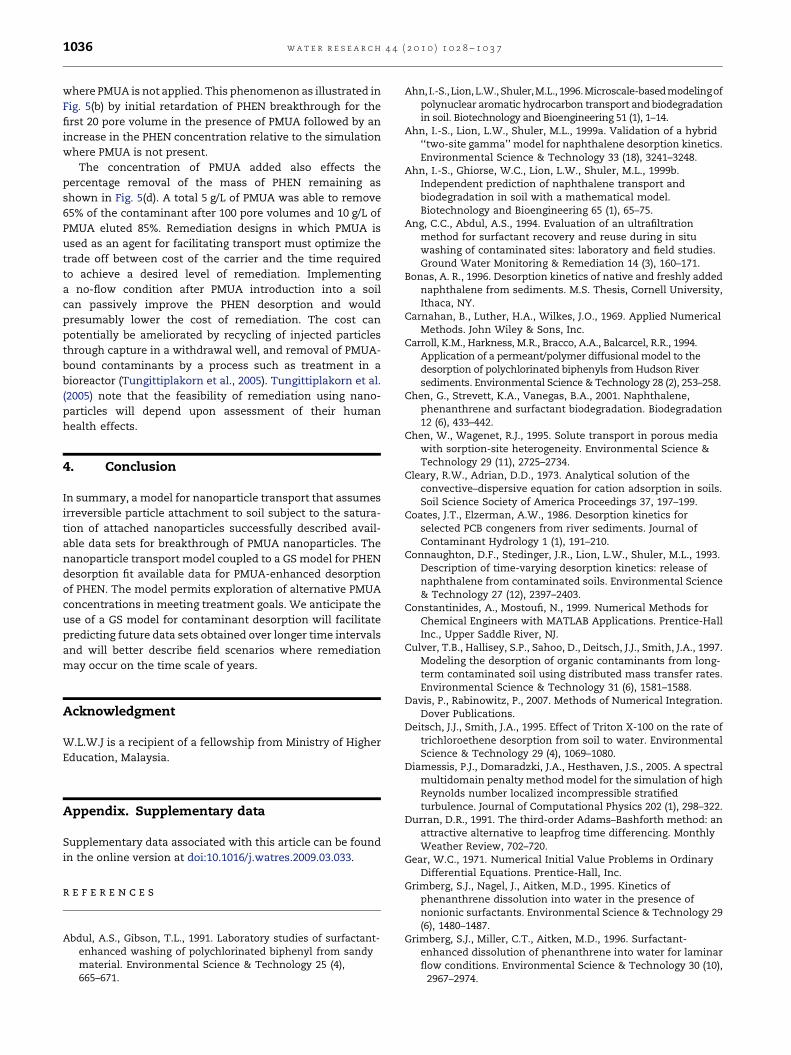
Fig. 5 – (a) Enhanced PHEN elution curves; (b) PHEN breakthrough curves and (c) Mass fraction remaining corresponding to
PHEN elution curves in (a). The curves are simulated with a value of 0.05 and E(k) value of 0.01 hL1 with carbon-type soil
( 0.5 g/L PMUA; 0 g/L PMUA) and sandy aquifer ( 0.5 g/L PMUA; 0 g/L PMUA). (d). PHEN mass fraction
remaining with 0 g/L ( ), 0.5 g/L ( ), 5 g/L ( ) and 10 g/L ( ) of PMUA in low carbon soil. The initial mass for
PHEN elution curves simulation is fixed at 0.0173 mg/g CT[Cð1DKCNNÞ.
w a t e r r e s e a r c h 4 4 ( 2 0 1 0 ) 1 0 2 8 – 1 0 3 7 1035
without PMUA application were compared, and the effect of
a 24-h cessation in flow was also considered.
g distributions for PAH desorption from soil typically have
a value less than 1 and values ranging from 0.1 to 0.001 have
been reported (Ahn et al., 1999a; Bonas, 1996; Liu et al., 2001).
Therefore, it is informative to analyze the effect of different GS
distributions on model predictions. Model predictions were
found to be sensitive to parameters that describe the g-
distribution. To explain this, sensitivity values of a equal to
0.05, 0.1 and 0.2 were used to simulate elution from
a contaminated column and breakthrough of a continuous
input to a clean column. The simulations of breakthrough and
elution curves in Fig. 4(a and b) illustrate the effect of the
different a values on simulations of PHEN behavior. PAH
transport and removal is enhanced for distribution with
higher a value. Fig. 4(c) depicts the mass fraction remaining in
the column corresponding to the elution curves in Fig. 4(b).
Although E(k) was held constant, a decrease in a resulted in
slower desorption of the contaminant and lower mobility. In
distributions with smaller a values, the ki values in f(k)
compartmentalization were concentrated in smaller value
region which effected the sorption rate term in Eq. (9).
Different types of soils exhibit different affinities for
hydrophobic contaminants. Soils with higher organic carbon
contents typically have greater sorption distribution coeffi-
cients which would influence the efficacy of pump and treat
remediation performed with polymeric nanoparticles. Fig. 5(a)
through (c) show the effect of soil type on the fate of PHEN.
Simulations are presented for a ‘‘low-carbon’’ soil ( foc¼ 0.57%)
and a soil with foc¼ 3.95%. It was assumed that the contami-
nant sorptive distribution coefficient, KCS varied in proportion
to foc. While it is possible that the nanoparticle attachment
coefficient, kan, and the soil saturation coefficient, J, may also
vary, no data are currently available to predict how these
parameters will change as a function of foc; therefore, nano-
particle-related soil binding parameters were held constant.
The elution and breakthrough curves of PHEN are improved in
all cases with the use of PMUA as a carrier.
When present, PMUA acts to decrease the free dissolved
PHEN concentration and, therefore, acts to increase the
driving force (i.e. CS � KCS C) for PHEN desorption (and, there-
fore, increases the desorption rate, i.e. kðCS � KCS CÞ) from soil to
aqueous phase by lowering C (Liu et al., 2001). The peak in
Fig. 5(a) indicates that the PMUA application helps the elution
initially by enhancing desorption of PHEN from soil
‘‘compartments’’ that have a relatively fast time scale.
Implementing a no-flow condition a short amount of time
after PMUA release can passively improve the PHEN desorp-
tion and lower the cost of remediation.
Attachment of PMUA particles can also act to increase the
effective retardation of a contaminant in low carbon soils via
the contribution of trapped PMUA to contaminant sorption.
However, application of PMUA beyond NmaxS still results in an
overall increase in contaminant removal relative to a case
w a t e r r e s e a r c h 4 4 ( 2 0 1 0 ) 1 0 2 8 – 1 0 3 71036
where PMUA is not applied. This phenomenon as illustrated in
Fig. 5(b) by initial retardation of PHEN breakthrough for the
first 20 pore volume in the presence of PMUA followed by an
increase in the PHEN concentration relative to the simulation
where PMUA is not present.
The concentration of PMUA added also effects the
percentage removal of the mass of PHEN remaining as
shown in Fig. 5(d). A total 5 g/L of PMUA was able to remove
65% of the contaminant after 100 pore volumes and 10 g/L of
PMUA eluted 85%. Remediation designs in which PMUA is
used as an agent for facilitating transport must optimize the
trade off between cost of the carrier and the time required
to achieve a desired level of remediation. Implementing
a no-flow condition after PMUA introduction into a soil
can passively improve the PHEN desorption and would
presumably lower the cost of remediation. The cost can
potentially be ameliorated by recycling of injected particles
through capture in a withdrawal well, and removal of PMUA-
bound contaminants by a process such as treatment in a
bioreactor (Tungittiplakorn et al., 2005). Tungittiplakorn et al.
(2005) note that the feasibility of remediation using nano-
particles will depend upon assessment of their human
health effects.
4. Conclusion
In summary, a model for nanoparticle transport that assumes
irreversible particle attachment to soil subject to the satura-
tion of attached nanoparticles successfully described avail-
able data sets for breakthrough of PMUA nanoparticles. The
nanoparticle transport model coupled to a GS model for PHEN
desorption fit available data for PMUA-enhanced desorption
of PHEN. The model permits exploration of alternative PMUA
concentrations in meeting treatment goals. We anticipate the
use of a GS model for contaminant desorption will facilitate
predicting future data sets obtained over longer time intervals
and will better describe field scenarios where remediation
may occur on the time scale of years.
Acknowledgment
W.L.W.J is a recipient of a fellowship from Ministry of Higher
Education, Malaysia.
Appendix. Supplementary data
Supplementary data associated with this article can be found
in the online version at doi:10.1016/j.watres.2009.03.033.
r e f e r e n c e s
Abdul, A.S., Gibson, T.L., 1991. Laboratory studies of surfactant-enhanced washing of polychlorinated biphenyl from sandymaterial. Environmental Science & Technology 25 (4),665–671.
Ahn, I.-S., Lion,L.W., Shuler,M.L., 1996.Microscale-based modelingofpolynuclear aromatic hydrocarbon transport and biodegradationin soil. Biotechnology and Bioengineering 51 (1), 1–14.
Ahn, I.-S., Lion, L.W., Shuler, M.L., 1999a. Validation of a hybrid‘‘two-site gamma’’ model for naphthalene desorption kinetics.Environmental Science & Technology 33 (18), 3241–3248.
Ahn, I.-S., Ghiorse, W.C., Lion, L.W., Shuler, M.L., 1999b.Independent prediction of naphthalene transport andbiodegradation in soil with a mathematical model.Biotechnology and Bioengineering 65 (1), 65–75.
Ang, C.C., Abdul, A.S., 1994. Evaluation of an ultrafiltrationmethod for surfactant recovery and reuse during in situwashing of contaminated sites: laboratory and field studies.Ground Water Monitoring & Remediation 14 (3), 160–171.
Bonas, A. R., 1996. Desorption kinetics of native and freshly addednaphthalene from sediments. M.S. Thesis, Cornell University,Ithaca, NY.
Carnahan, B., Luther, H.A., Wilkes, J.O., 1969. Applied NumericalMethods. John Wiley & Sons, Inc.
Carroll, K.M., Harkness, M.R., Bracco, A.A., Balcarcel, R.R., 1994.Application of a permeant/polymer diffusional model to thedesorption of polychlorinated biphenyls from Hudson Riversediments. Environmental Science & Technology 28 (2), 253–258.
Chen, G., Strevett, K.A., Vanegas, B.A., 2001. Naphthalene,phenanthrene and surfactant biodegradation. Biodegradation12 (6), 433–442.
Chen, W., Wagenet, R.J., 1995. Solute transport in porous mediawith sorption-site heterogeneity. Environmental Science &Technology 29 (11), 2725–2734.
Cleary, R.W., Adrian, D.D., 1973. Analytical solution of theconvective–dispersive equation for cation adsorption in soils.Soil Science Society of America Proceedings 37, 197–199.
Coates, J.T., Elzerman, A.W., 1986. Desorption kinetics forselected PCB congeners from river sediments. Journal ofContaminant Hydrology 1 (1), 191–210.
Connaughton, D.F., Stedinger, J.R., Lion, L.W., Shuler, M.L., 1993.Description of time-varying desorption kinetics: release ofnaphthalene from contaminated soils. Environmental Science& Technology 27 (12), 2397–2403.
Constantinides, A., Mostoufi, N., 1999. Numerical Methods forChemical Engineers with MATLAB Applications. Prentice-HallInc., Upper Saddle River, NJ.
Culver, T.B., Hallisey, S.P., Sahoo, D., Deitsch, J.J., Smith, J.A., 1997.Modeling the desorption of organic contaminants from long-term contaminated soil using distributed mass transfer rates.Environmental Science & Technology 31 (6), 1581–1588.
Davis, P., Rabinowitz, P., 2007. Methods of Numerical Integration.Dover Publications.
Deitsch, J.J., Smith, J.A., 1995. Effect of Triton X-100 on the rate oftrichloroethene desorption from soil to water. EnvironmentalScience & Technology 29 (4), 1069–1080.
Diamessis, P.J., Domaradzki, J.A., Hesthaven, J.S., 2005. A spectralmultidomain penalty method model for the simulation of highReynolds number localized incompressible stratifiedturbulence. Journal of Computational Physics 202 (1), 298–322.
Durran, D.R., 1991. The third-order Adams–Bashforth method: anattractive alternative to leapfrog time differencing. MonthlyWeather Review, 702–720.
Gear, W.C., 1971. Numerical Initial Value Problems in OrdinaryDifferential Equations. Prentice-Hall, Inc.
Grimberg, S.J., Nagel, J., Aitken, M.D., 1995. Kinetics ofphenanthrene dissolution into water in the presence ofnonionic surfactants. Environmental Science & Technology 29(6), 1480–1487.
Grimberg, S.J., Miller, C.T., Aitken, M.D., 1996. Surfactant-enhanced dissolution of phenanthrene into water for laminarflow conditions. Environmental Science & Technology 30 (10),
2967–2974.

w a t e r r e s e a r c h 4 4 ( 2 0 1 0 ) 1 0 2 8 – 1 0 3 7 1037
van Genuchten, M.T., Alves, W.J., 1982. Analytical Solutions of theOne-Dimensional Convective–Dispersive Solute TransportEquation. U.S. Salinity Laboratory, Reverside, CA.
van Genuchten, M.T., Wagenet, R.J., 1989. Two-site/Two-regionmodels for pesticide transport and degradation: theoreticaldevelopment and analytical solutions. Soil Science Society ofAmerica Journal 53 (5), 1303–1310.
Hairer, E., Nørsett, S.P., Wanner, G., 1993. Solving OrdinaryDifferential Equations I. Non-Stiff Problems. Springer Verlag,Berlin.
Hasegawa, M.A., Sabatini, D.A., Harwell, J.H., 1997. Liquid–liquidextraction for surfactant-contaminant separation andsurfactant reuse. Journal of Environmental Engineering 123(7), 691–697.
Jensen-Spaulding, A., Shuler, M.L., Lion, L.W., 2004a. Mobilizationof adsorbed copper and lead from naturally aged soil bybacterial extracellular polymers. Water Research 38 (5),1121–1128.
Jensen-Spaulding, A., Cabral, K., Shuler, M.L., Lion, L.W., 2004b.Predicting the rate and extent of cadmium and copperdesorption from soils in the presence of bacterialextracellular. Water Research 38 (9), 2230–2239.
Johnson, W.P., 2000. Sediment control of facilitated transport andenhanced desorption. Journal of Environmental Engineering126 (1), 47–50.
Johnson, W.P., Cabral, K., Lion, L.W., Corapcioglu, Y.M., 1998.Reconciliation of expressions for the modified retardationfactor and incorporation of non-linear contaminant sorptionto the stationary phase. Journal of Contaminant Hydrology 32(3–4), 247–266.
Karickhoff, S.W., Brown, D.S., Scott, T.A., 1979. Sorption ofhydrophobic pollutants on natural sediments. Water Research13 (3), 241–248.
Karniadakis, G.E., Israeli, M., Orszag, S.A., 1991. High-ordersplitting methods for the incompressible Navier–Stokesequations. Journal of Computational Physics 97 (2),414–443.
Kim, H.S., Weber, W.J., 2003. Preferential surfactant utilization bya PAH-degrading strain: effects on micellar solubilizationphenomena. Environmental Science & Technology 37 (16),3574–3580.
Kim, J.-Y., Cohen, C., Shuler, M.L., Lion, L.W., 2000. Use ofamphiphilic polymer particles for in situ extraction of sorbedphenanthrene from a contaminated aquifer material.Environmental Science & Technology 34 (19), 4133–4139.
Laha, S., Luthy, R.G., 1991. Inhibition of phenanthrenemineralization by nonionic surfactants in soil-water systems.Environmental Science & Technology 25 (11), 1920–1930.
Lipe, K.M., Sabatini, D.A., Hasegawa, M.A., Harwell, J.H., 1996.Micellar-enhanced ultrafiltration and air stripping forsurfactant-contaminant separation and surfactant reuse.Ground Water Monitoring & Remediation 16 (1), 85–92.
Liu, A., Ahn, I.-S., Mansfield, C., Lion, L.W., Shuler, M.L.,Ghiorse, W.C., 2001. Phenanthrene desorption from soil in thepresence of bacterial extracellular polymer: observations andmodel predictions of dynamic behavior. Water Research 35 (3),835–843.
Lorden, S.W., Chen, W., Lion, L.W., 1998. Experiments andmodeling of the transport of trichloroethene vapor inunsaturated aquifer material. Environmental Science &Technology 32 (13), 2009–2017.
Magee, B.R., Lion, L.W., Lemley, A.T., 1991. Transport of dissolvedorganic macromolecules and their effect on the transport ofphenanthrene in porous media. Environmental Science &Technology 25 (2), 323–331.
Marquardt, D.W., 1963. An algorithm for least-squares estimationof nonlinear parameters. Journal of the Society for Industrialand Applied Mathematics 11 (2), 431–441.
McCray, J.E., Brusseau, M.L., 1998. Cyclodextrin-enhanced in situflushing of multiple-component immiscible organic liquidcontamination at the field scale: mass removal effectiveness.Environmental Science & Technology 32 (9), 1285–1293.
Montas, H.J., Shirmohammadi, A., 2004. Modeling of soilremediation by nanoscale particles. Paper number 043053presented at the 2004 ASAE/CSAE Annual InternationalMeeting.
Pedit, J.A., Miller, C.T., 1994. Heterogeneous sorption processes insubsurface systems. 1. Model formulations and applications.Environmental Science & Technology 28 (12), 2094–2104.
Pieper, A.P., Ryan, J.N., Harvey, R.W., Amy, G.L., Illangasekare, T.H., Metge, D.W., 1997. Transport and recovery ofbacteriophage PRD1 in a sand and gravel aquifer: effect ofsewage-derived organic matter. Environmental Science &Technology 31 (4), 1163–1170.
Rajagopalan, R., Tien, C., 1976. Trajectory analysis of deep-bedfiltration with the sphere-in-cell porous media model. AIChEJournal 22 (3), 523–533.
Rouse, J.D., Sabatini, D.A., Harwell, J.H., 1993. Minimizingsurfactant losses using twin-head anionic surfactants insubsurface remediation. Environmental Science & Technology27 (10), 2072–2078.
Saiers, J.E., Hornberger, G.M., Liang, L., 1994. First- and second-order kinetics approaches for modeling the transport ofcolloidal particles in porous media. Water Resources Research30 (9), 2499–2506.
Slinn, D.N., Riley, J.J., 1998. A model for the simulation ofturbulent boundary layers in an incompressible stratified flow.Journal of Computational Physics 144 (2), 550–602.
Smith, G.D., 1978. Numerical Solution of Partial DifferentialEquations. Clarendon Press, Oxford.
Tungittiplakorn, W., 2005. Engineered polymericnanoparticles for remediation of polycyclic aromatichydrocarbon contaminated soils. Dissertation, CornellUniversity, Ithaca, NY.
Tungittiplakorn, W., Cohen, C., Lion, L.W., 2005. Engineeredpolymeric nanoparticles for bioremediation of hydrophobiccontaminants. Environmental Science & Technology 39 (5),1354–1358.
Tungittiplakorn, W., Lion, L.W., Cohen, C., Kim, J.-Y., 2004.Engineered polymeric nanoparticles for soil remediation.Environmental Science & Technology 38 (5), 1605–1610.
Wan Johari, W. L., 2007. Mass transfer model of nanoparticle-facilitated contaminant transport in saturated porous media.MS Thesis, Cornell University, Ithaca, NY.