mass of the coma cluster - arizona state university
TRANSCRIPT

Mass of the Coma Cluster
Simon PorterApril 4, 2008

Two Different Approaches
• Hughes 1989:– Fit to X-ray data from Einstein, EXOSAT,
and Tenma– Model based on star cluster with and
without extra dark matter term
• Kubo, Stebbins, Annis, Dell’Antonio, Lin, Khiabanian, and Frieman 2007– Fit to Sloan survey data– Fit to NFW galactic cluster model

Hughes’s Approach
• Assume the Coma cluster is spherical, with no subclumps– “I have chosen to ignore this
complication”
• Assume a virial mass in hydrostatic equilibrium
• Find mass distribution• Find temperature distribution• Estimate mass
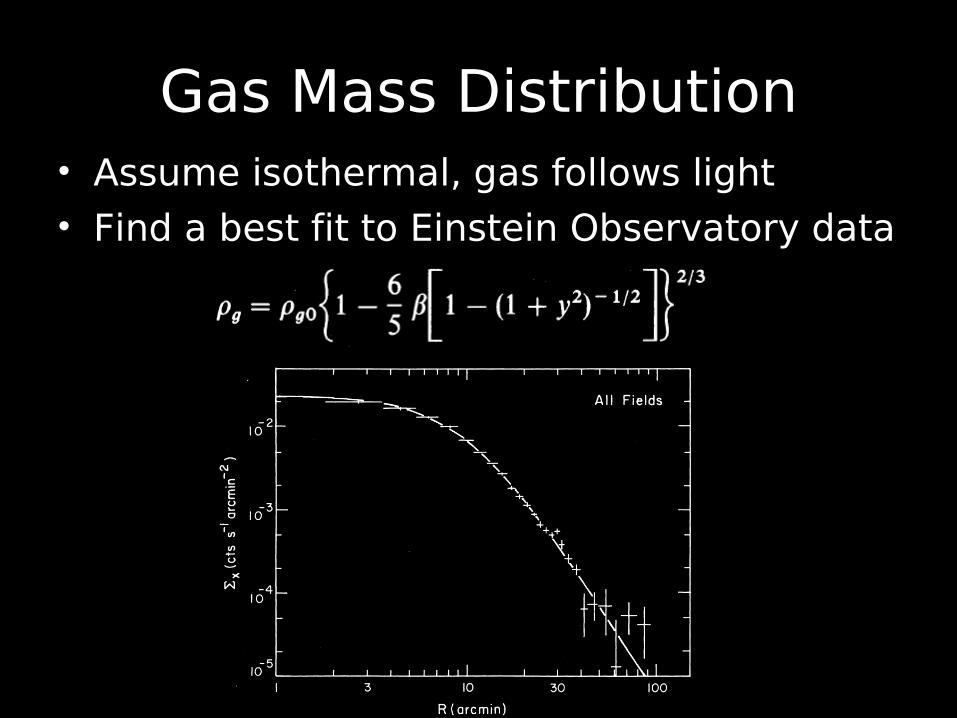
Gas Mass Distribution• Assume isothermal, gas follows light• Find a best fit to Einstein Observatory data
y = R/ Rc
β = 0.86
Rc = 5.5’

Hydrostatic Equilibrium
• Uniform density gas in equilibrium:
• Assume spherically symmetric and ideal gas:
Gas Pressure Dark Matter/ Galactic Gravity
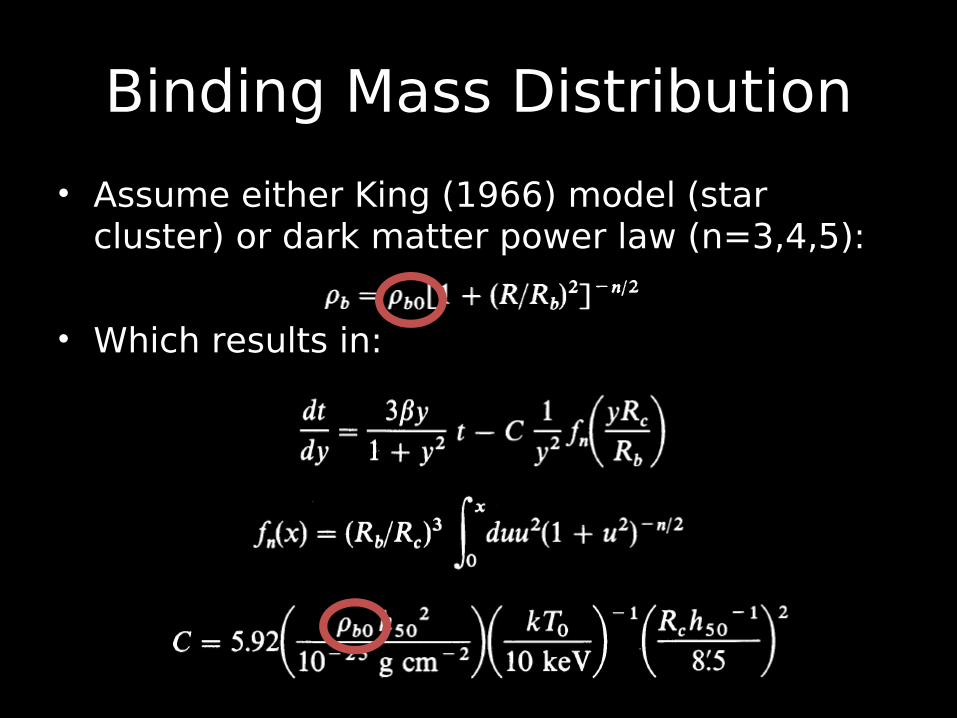
Binding Mass Distribution
• Assume either King (1966) model (star cluster) or dark matter power law (n=3,4,5):
• Which results in:
t = T/T0
h50 = hubble constant in 50 km s-1 Mpc-1
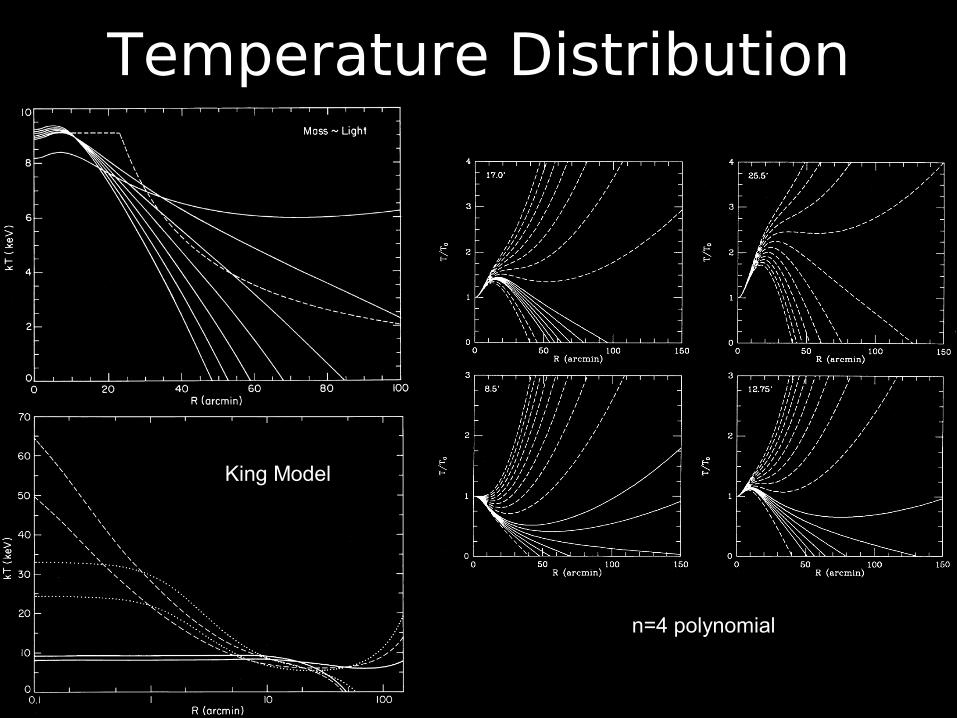
Temperature Distribution
King Model
n=4 polynomial

Mass Follows (X-Ray) Lightβ=0.86,Rc=5.5’ β=0.76,Rc=9.8’ β=0.63 Rc=7.6’
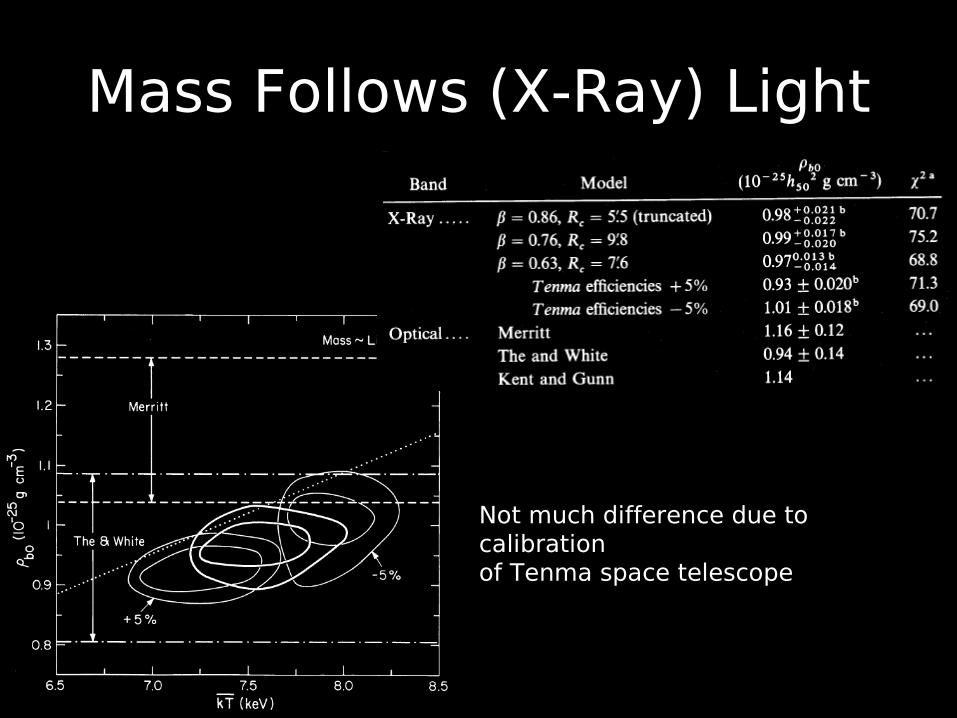
Mass Follows (X-Ray) Light
Not much difference due to calibrationof Tenma space telescope
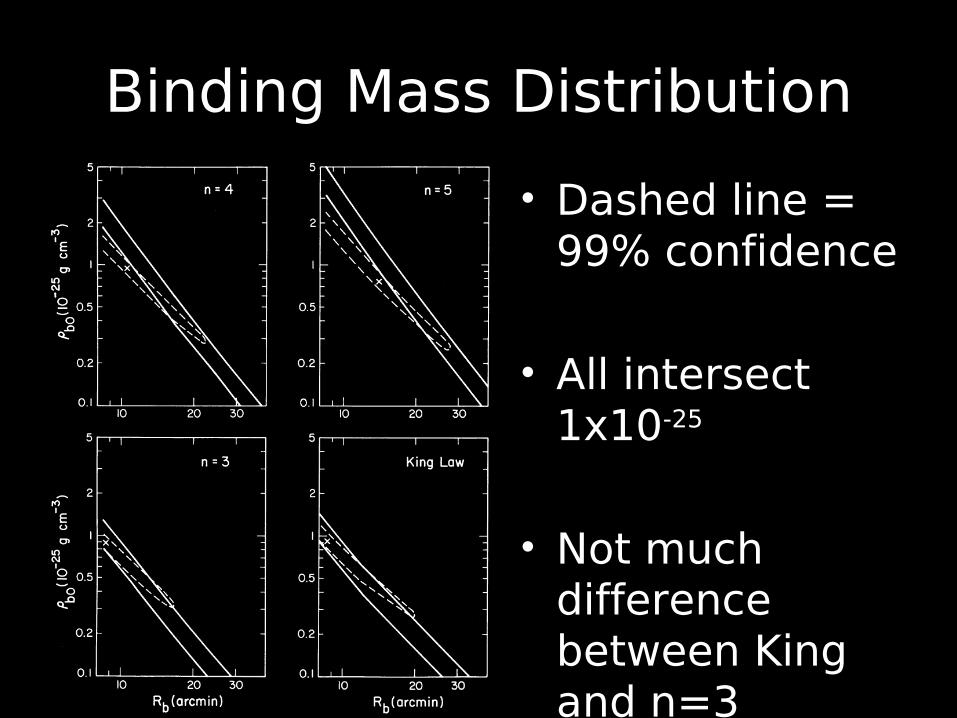
Binding Mass Distribution
• Dashed line = 99% confidence
• All intersect 1x10-25
• Not much difference between King and n=3
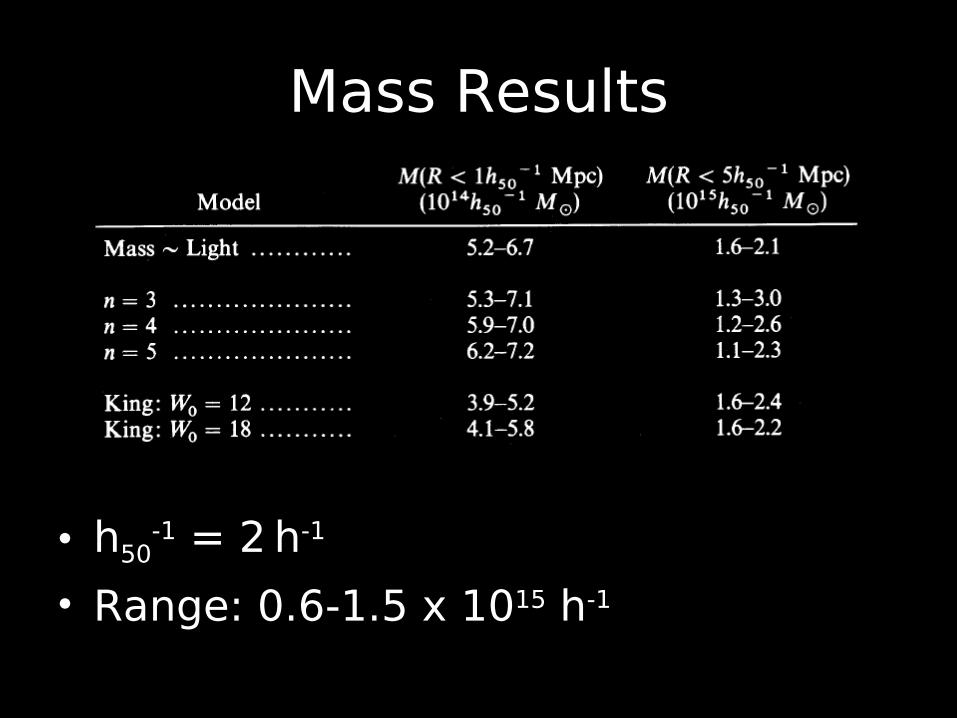
Mass Results
• h50-1 = 2 h-1
• Range: 0.6-1.5 x 10¹⁵ h-1

Kubo et al.’s Approach
• Select a set of galaxies from SDSS• Measure tangential shear across
those galaxies• Convert tangential shear to a surface
density• Fit that density to a Navarro, Frenk,
and White (NFW) profile• Convert the density profile to a virial
mass
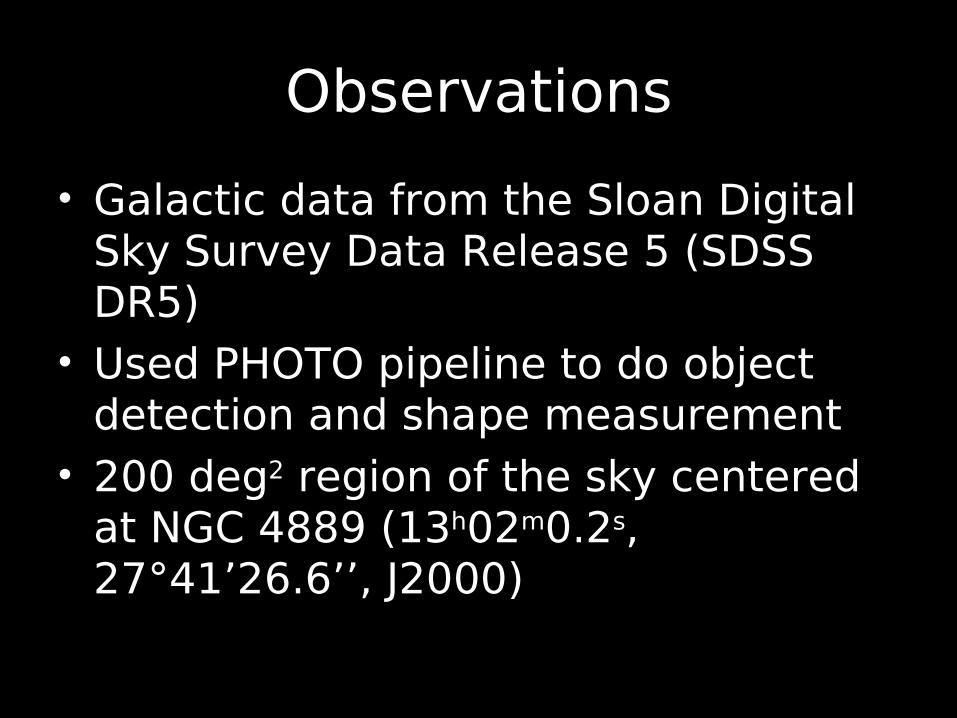
Observations
• Galactic data from the Sloan Digital Sky Survey Data Release 5 (SDSS DR5)
• Used PHOTO pipeline to do object detection and shape measurement
• 200 deg2 region of the sky centered at NGC 4889 (13h02m0.2s, 27°41’26.6’’, J2000)
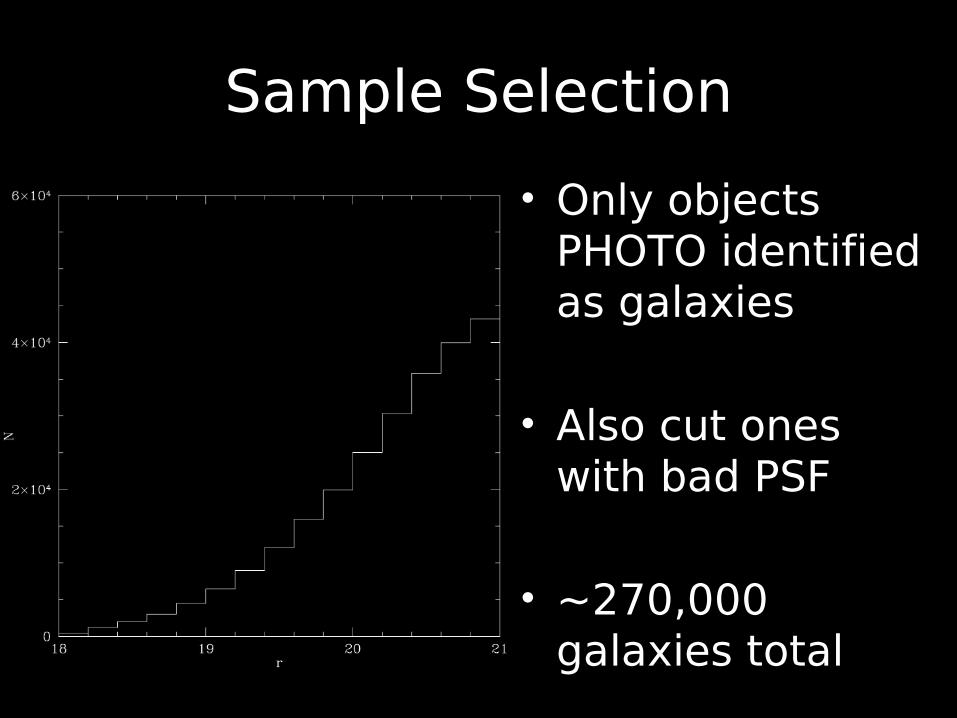
Sample Selection
• Only objects PHOTO identified as galaxies
• Also cut ones with bad PSF
• ~270,000 galaxies total

Tangential Shear
• Break into radial bins from 0.05-10.5 h-1 Mpc
• Use 1-D shear based on Castro et al. (2005):
• γt = tangential shear for bin, et = tangential ellipticity of bin, N = number in bin
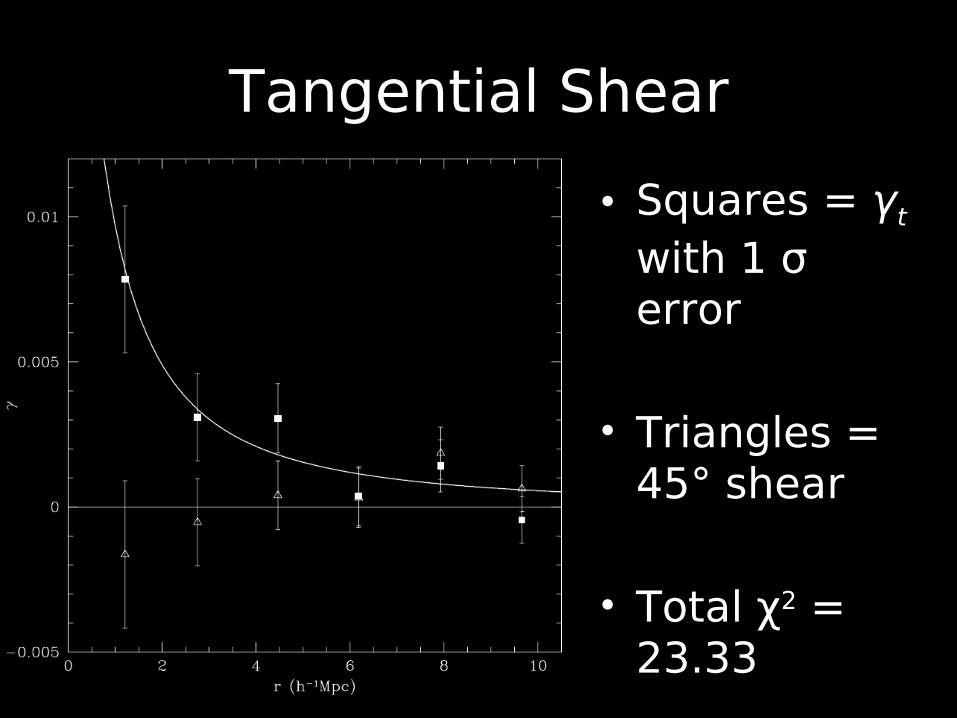
Tangential Shear
• Squares = γt with 1 σ error
• Triangles = 45° shear
• Total χ2 = 23.33

Surface Density
• Tangential shear relates to surface density:
• Ds, Dl angular diameter distance to source or lens; Dls angular distance from lens to source

NFW Profile
• Fit to profile from Navarro, Frenk, and White:
• The two parameters, rs and c can constrained by setting the virial radius r200 = c rs:
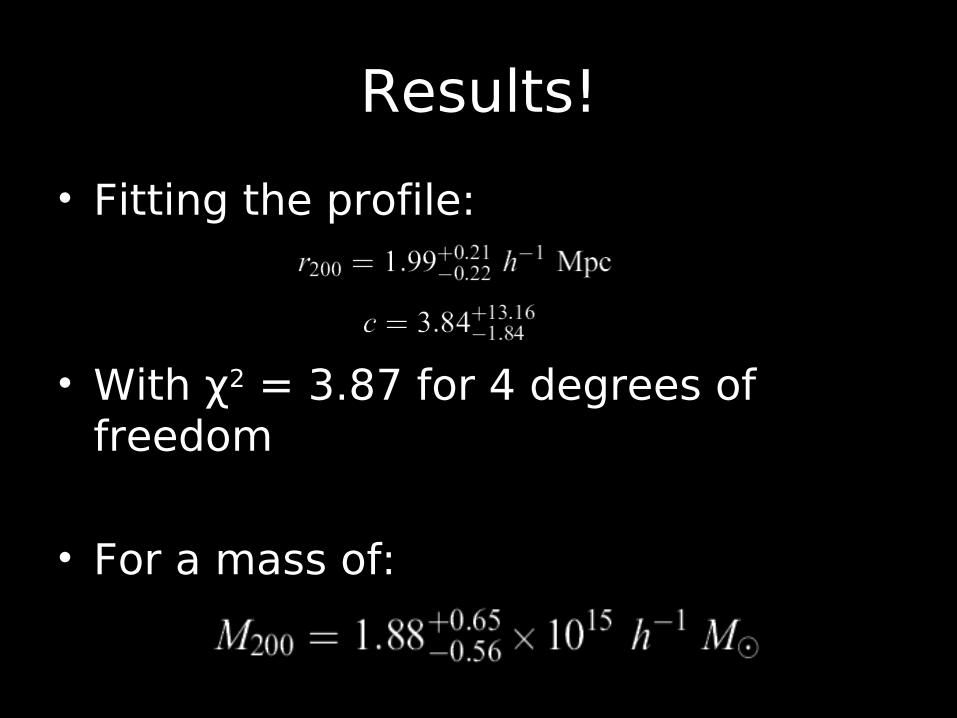
Results!
• Fitting the profile:
• With χ2 = 3.87 for 4 degrees of freedom
• For a mass of:

Cross-Comparison
1. Kubo et al. 20072. Geller et al.
1999
1. Hughes 19892. The & White
1986
Questions?