galaxy clusters & large scale structure ay 16, april 3, 2008 coma cluster =a1656
Post on 21-Dec-2015
213 views
TRANSCRIPT
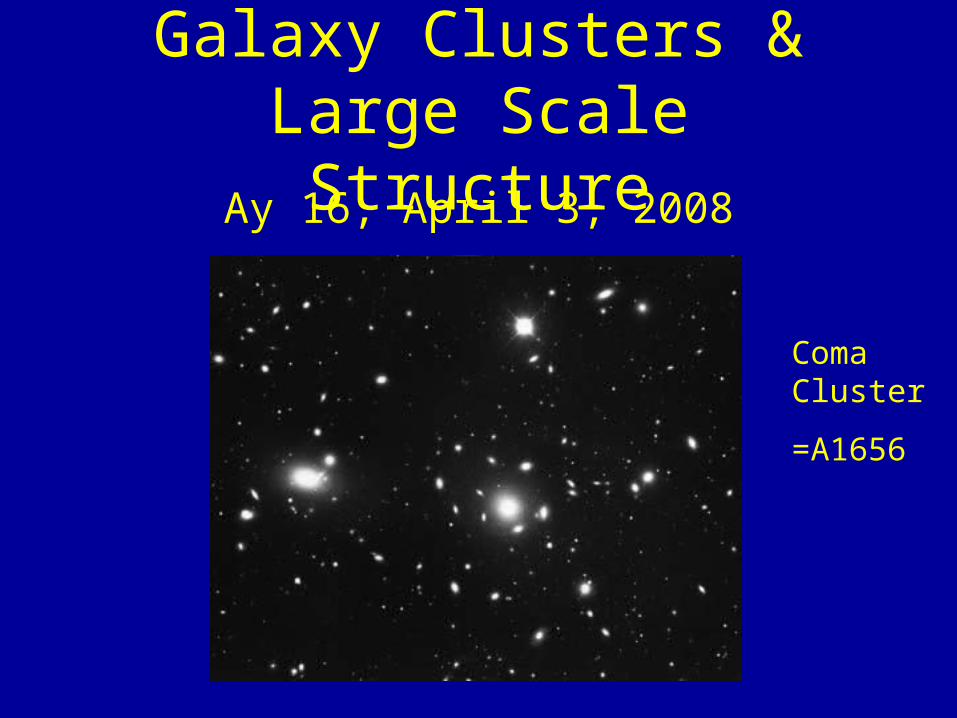
Galaxy Clusters & Large Scale Structure
Ay 16, April 3, 2008
Coma Cluster
=A1656

Galaxies Are Not Randomly Distributed in Space
Fundamental discovery (and debate) in the 20th century is that Galaxies cluster.
On small scales: Binaries ~100 kpc intermediate scales: Groups ~1 Mpc larger scales: Clusters few Mpc even larger scales: Superclusters 10’s Mpc largest seen: Voids + Cosmic Web ~50 Mpc

M51 = Whirlpool = NGC 5194+95
NOAO


Seyfert’s Sextet

Stefan’s Quintet
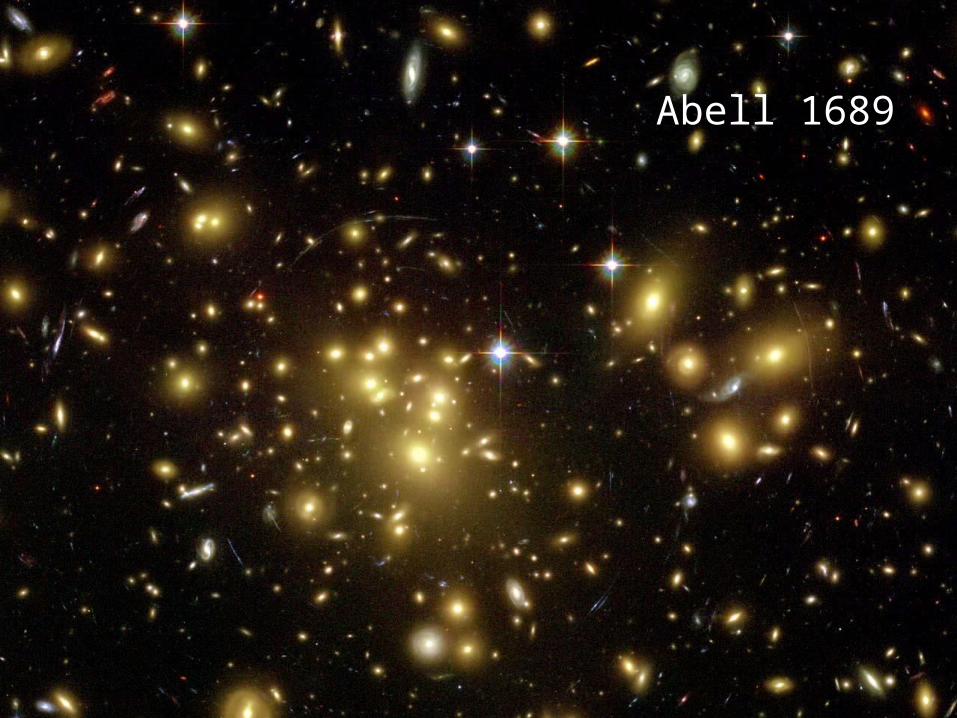
Abell 1689
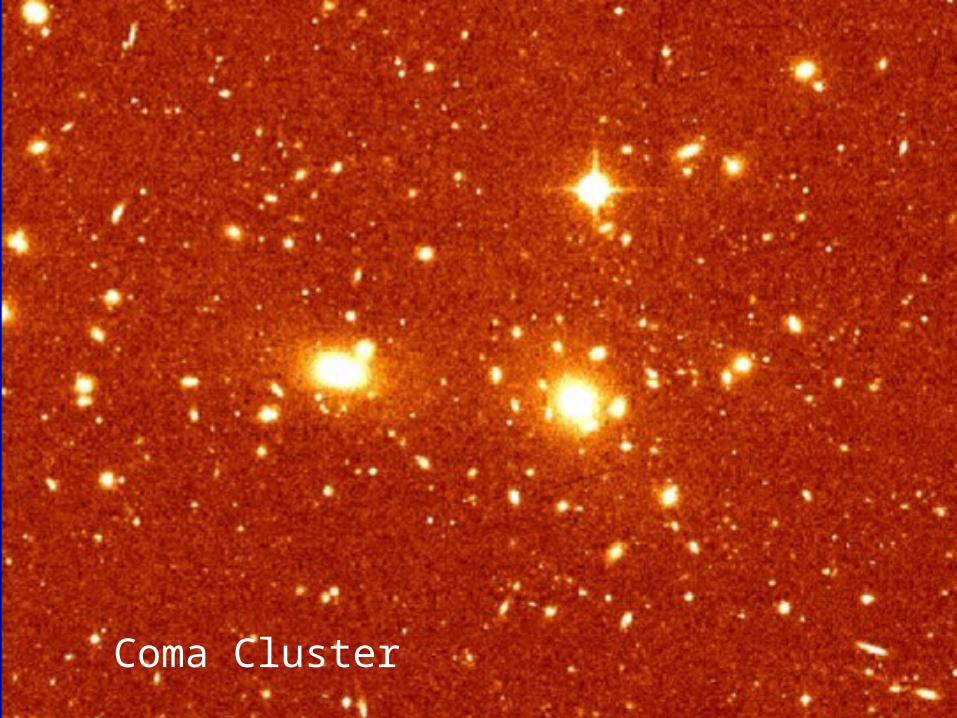
Coma Cluster
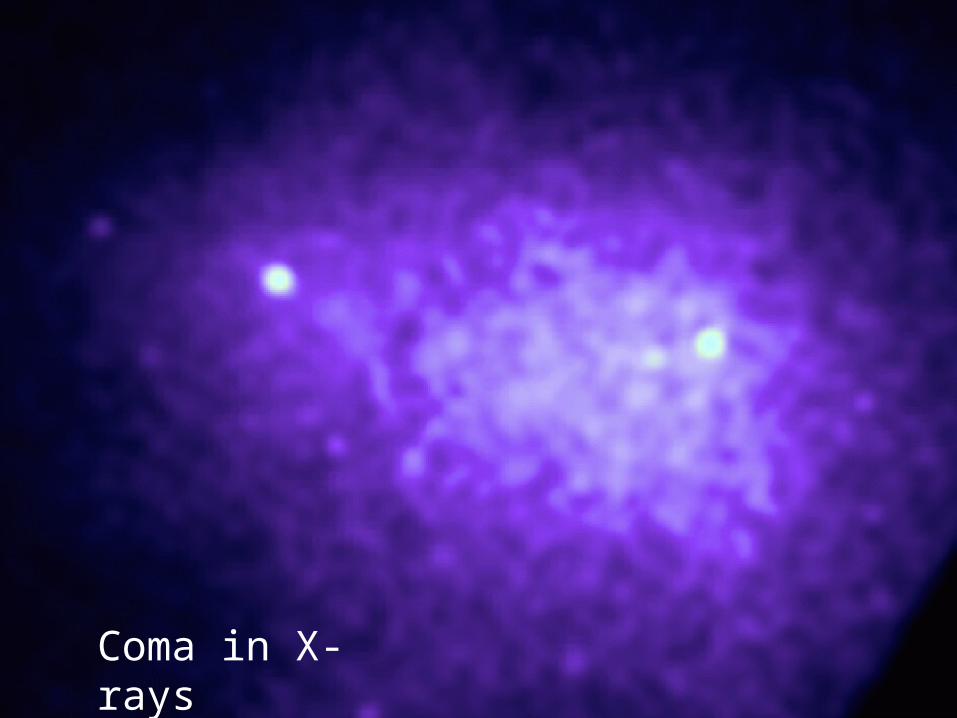
Coma in X-rays

Mass Estimators:
• MV =
• MP = Σ Ri (Vi-VG)2
with fPM =10.2 and γ = 1.5 (Heisler, Tremaine & Bahcall 1985, ApJ 298, 8)
3 π ΣσP2 RP
2 G
fPM
π G (N – γ)

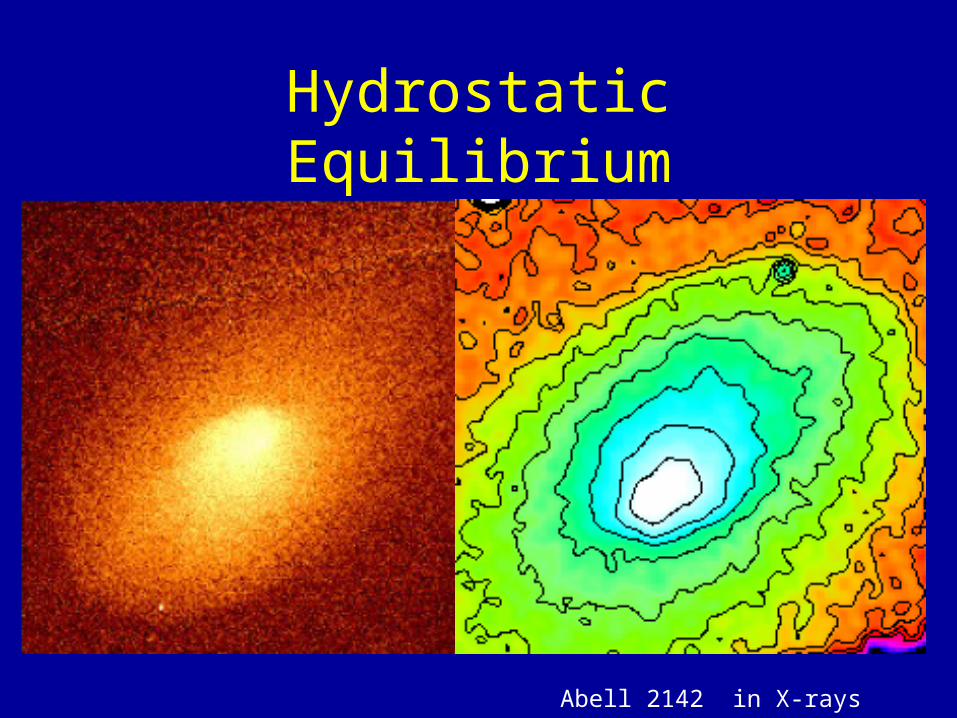
Hydrostatic Equilibrium
Abell 2142 in X-rays CXO
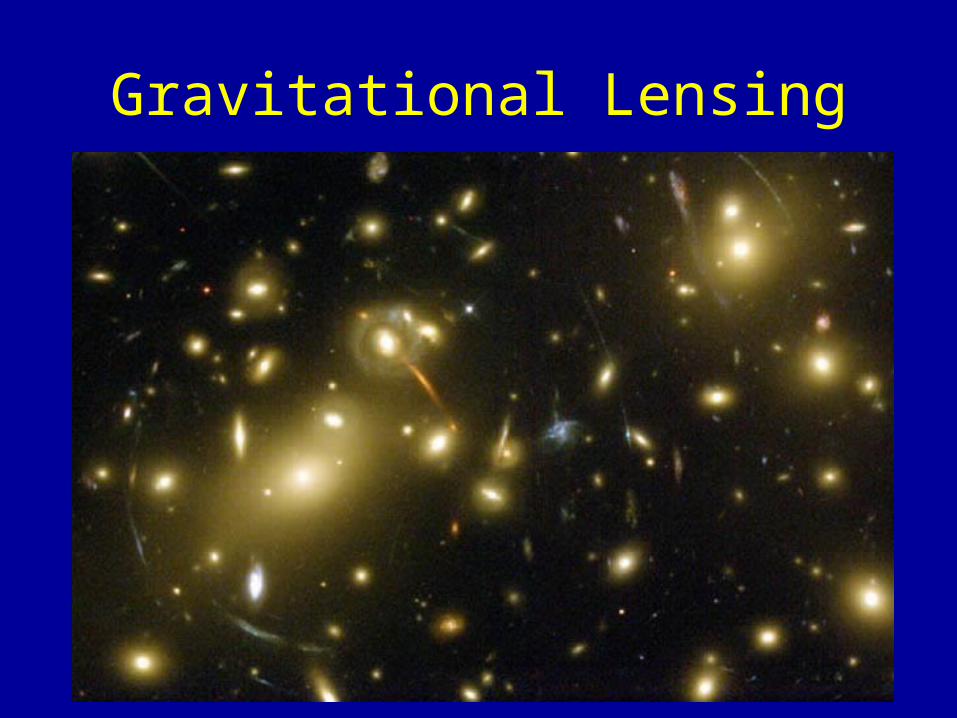
Gravitational Lensing

Cluster Mass Estimates
Now three techniques agree fairly well for the same clusters -- Galaxy Dynamics, Gas Hydrostatic Equilibrium + Gravitational Lensing masses give a mean M/L of around 300 in blue light (solar units) and 100 in infrared light. This is important for cosmology as it implies (1) that there’s lots of Dark Matter on large scales, and (2) that matter is ~ 0.25.
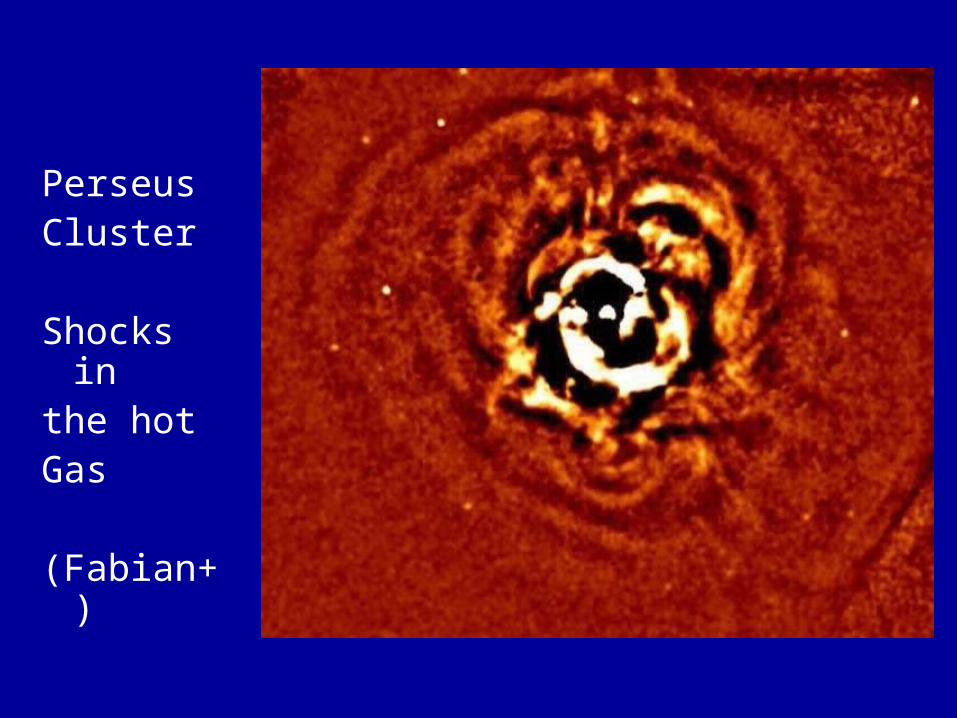
PerseusCluster
Shocks in the hotGas
(Fabian+)
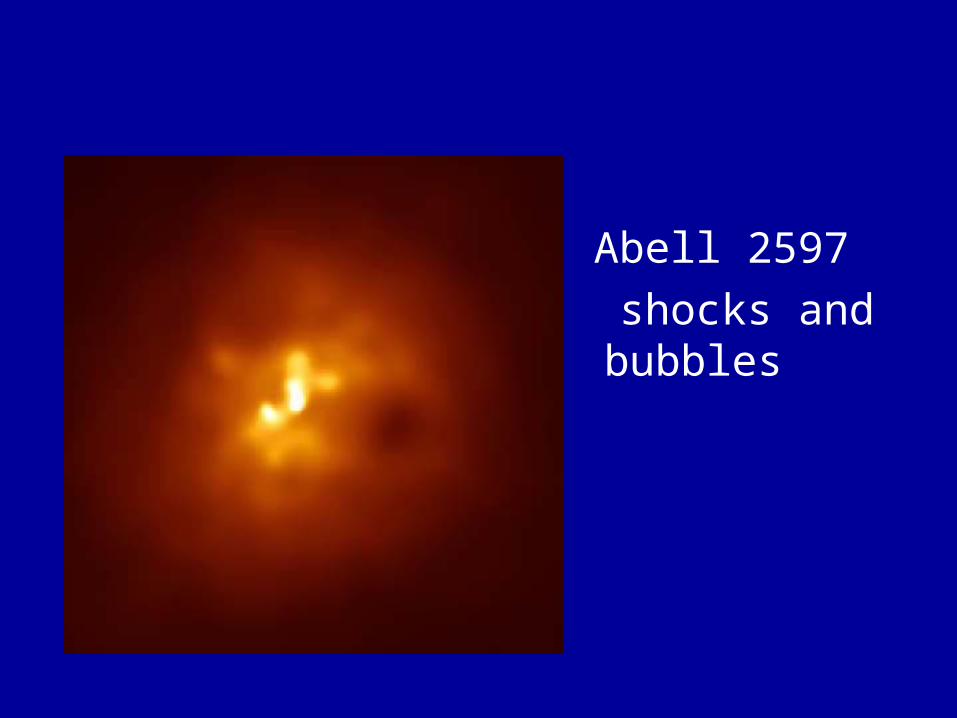
Abell 2597
shocks and bubbles

Large Scale Structure
The study of the galaxy distribution on large scales started out with maps.
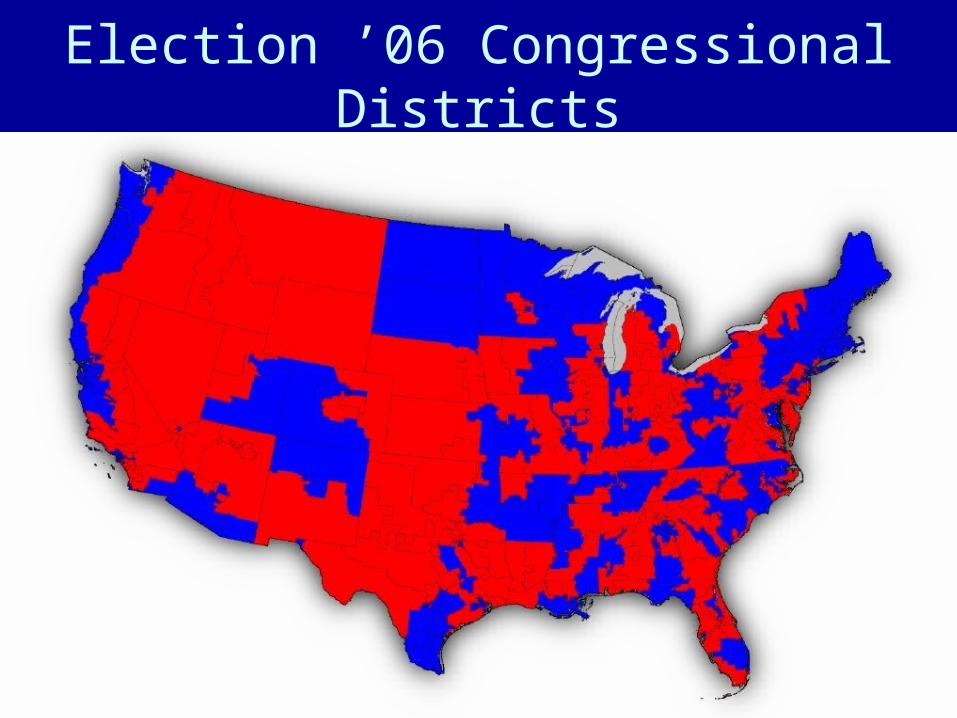
Election ’06 Congressional Districts

Its all in the display:
Election ’04
By County R/B
By County color range
By state scaled by population

Messier’s map:What do you see?
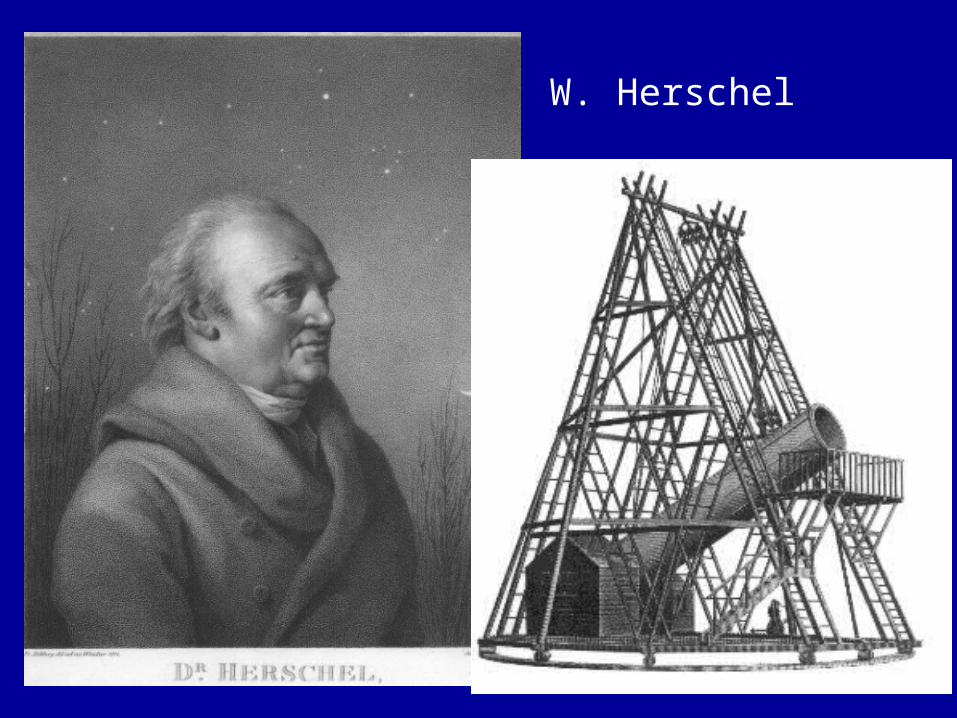
W. Herschel

New General Catalogue + Index Catalogues

Fritz Zwicky
et al.
CGCG

Zwicky’s Catalog
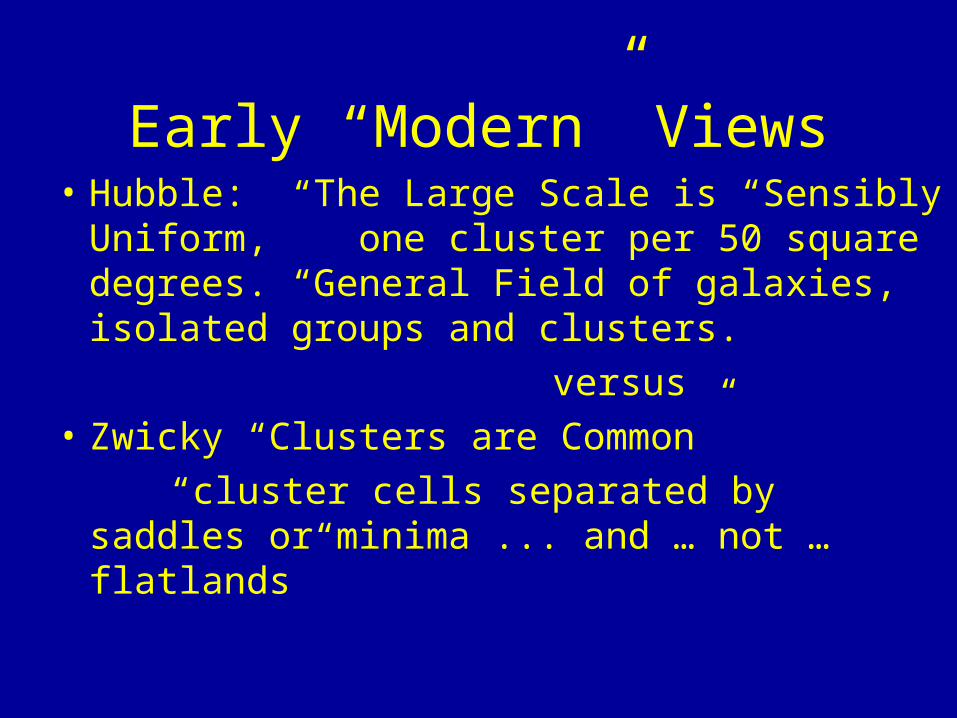
Early “Modern” Views• Hubble: The Large Scale is “Sensibly
Uniform,” one cluster per 50 square degrees. “General Field of galaxies, isolated groups and clusters.
versus
• Zwicky “Clusters are Common”
“cluster cells separated by saddles or minima ... and … not … flatlands”

Statistics of Clustering
Many different “statistical” measures.
Peebles and Totsuji & Kihara introduced the correlation function -- a measure of the excess probability of finding a galaxy near another galaxy --- in the early 1970’s.
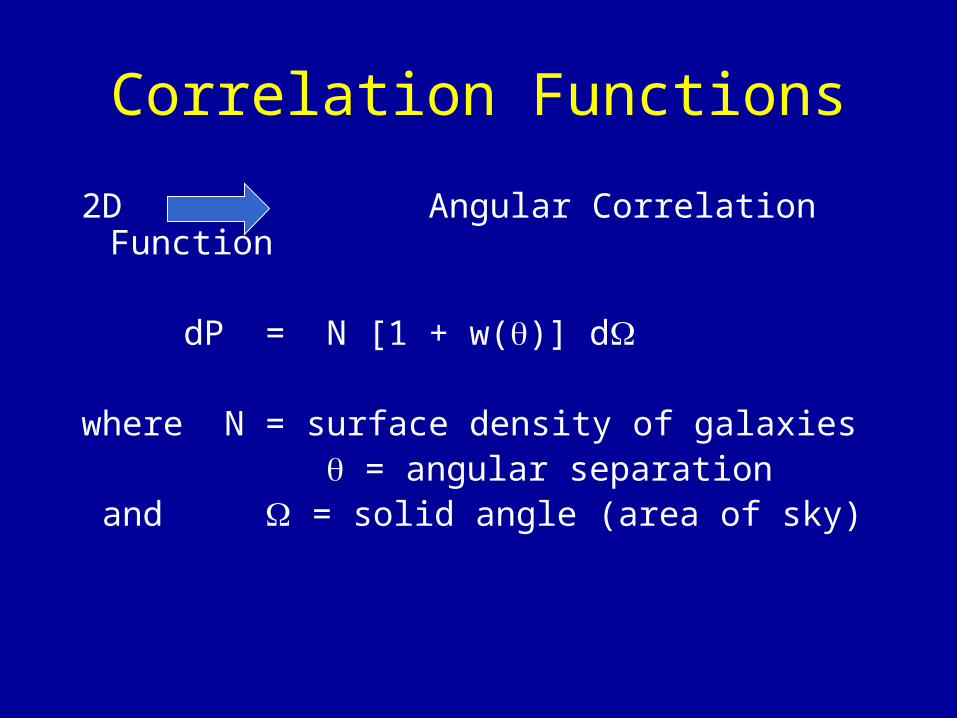
Correlation Functions
2D Angular Correlation Function
dP = N [1 + w()] d
where N = surface density of galaxies = angular separation and = solid angle (area of sky)

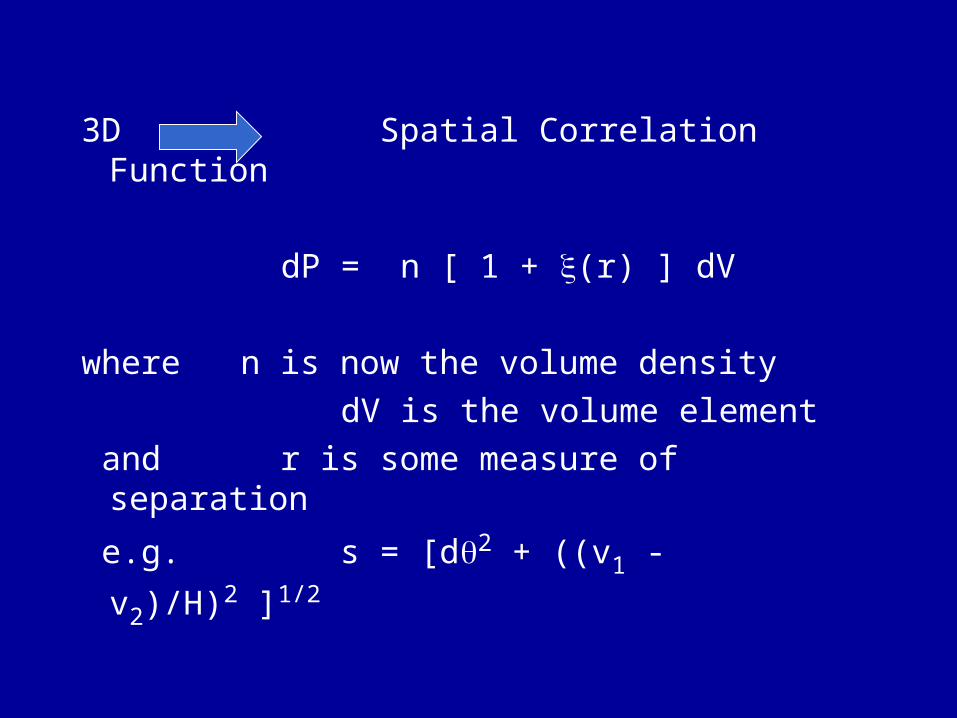
3D Spatial Correlation Function
dP = n [ 1 + (r) ] dV
where n is now the volume density
dV is the volume element
and r is some measure of separation
e.g. s = [d2 + ((v1 - v2)/H)2 ]1/2
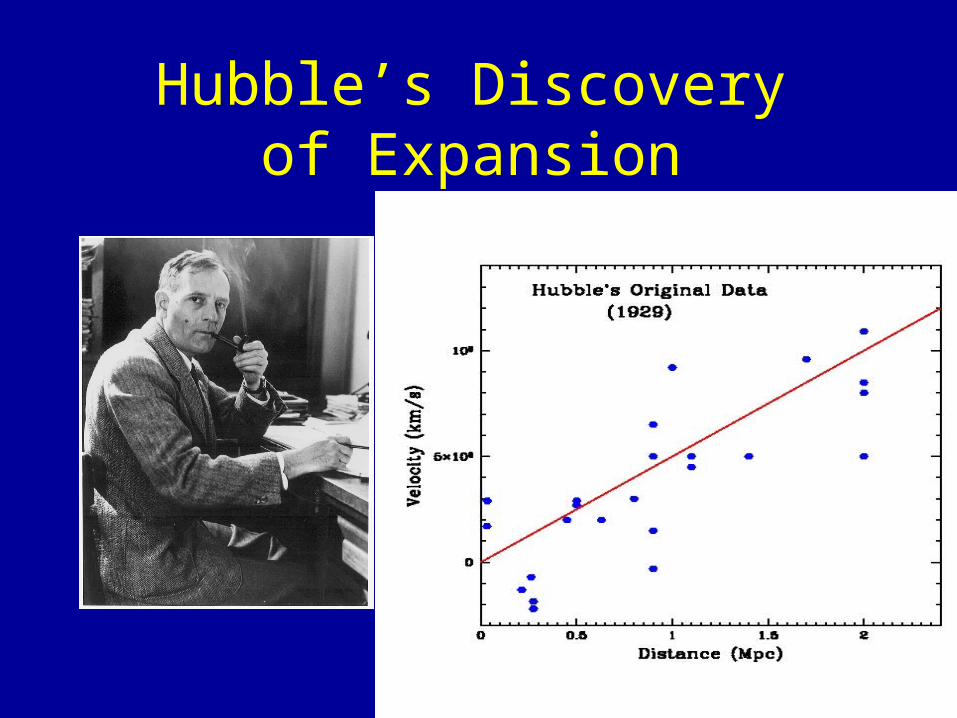
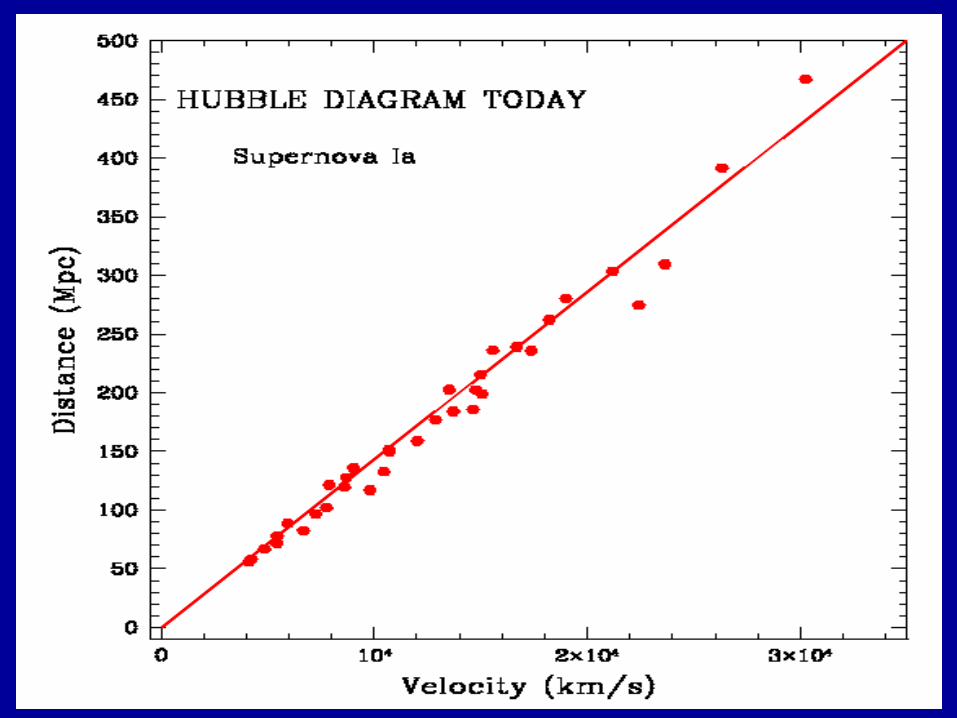
Hubble’s Discovery of Expansion

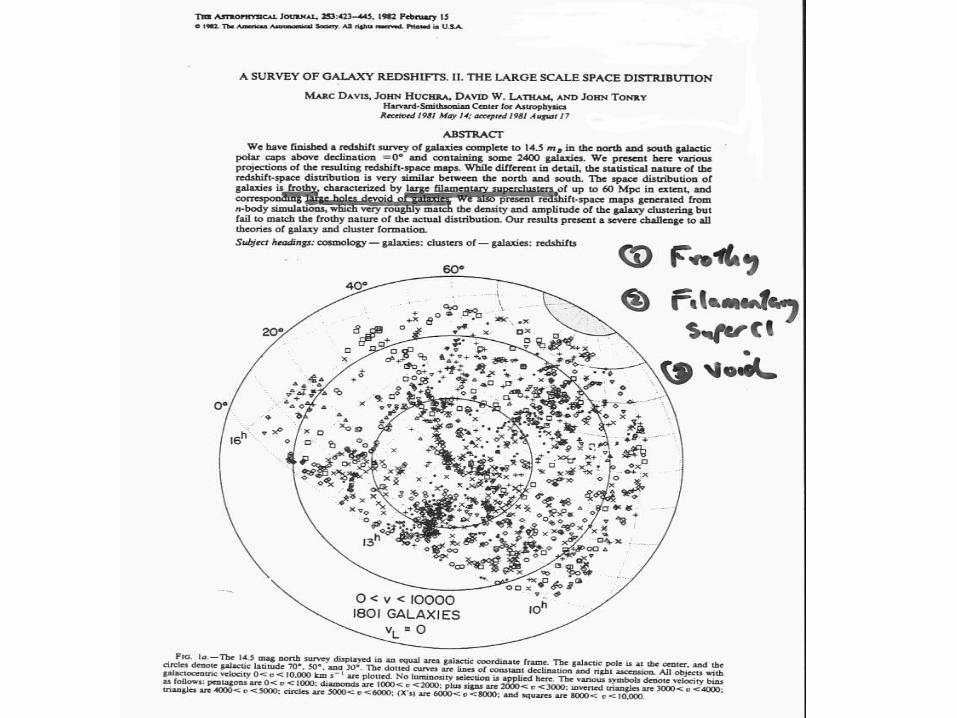
Redshift Surveys
3747 +/- 20 CfA Survey

3D Maps of the Local Universe
Not much progress until the mid 1970’s!
Catalogs existed from Photographic Surveys- 2D only (Zwicky++; Vorontosov-Velyaminov++)
In 1972 the largest “complete” galaxy redshift sample had only ~250 galaxies
Key was innovations in detector technology:
computers + digital detectors
sensitive radio receivers
Larson wasn’t quite right…

The
Little Telescope
that could.
Tillinghast
1.5-m

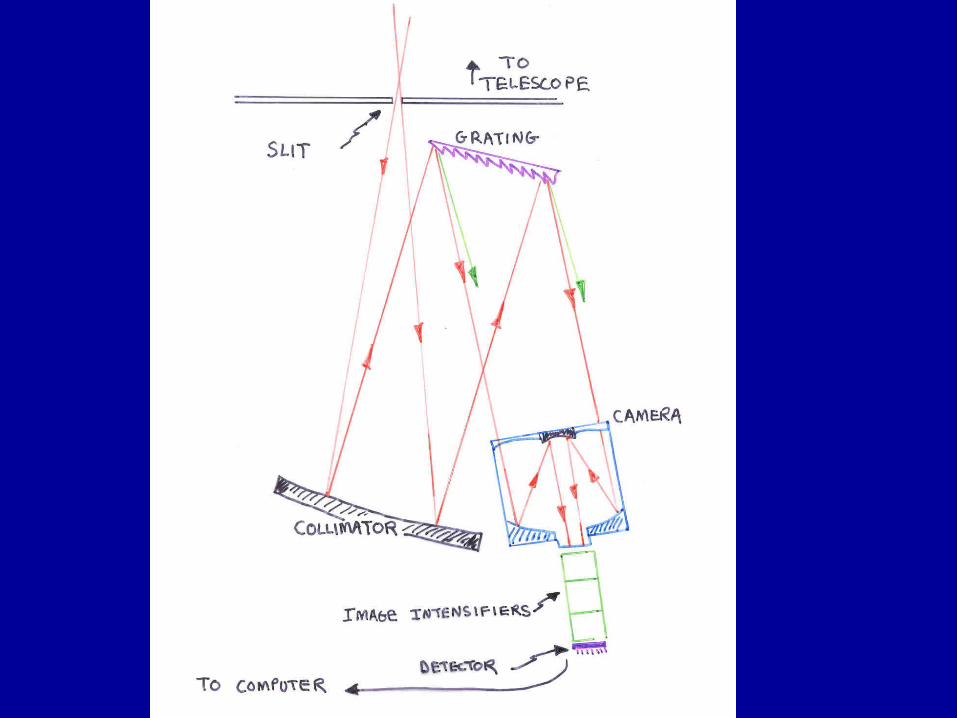
The Z Machine
Davis, Tonry, Latham & Huchra
Based on a concept by
Shectman & Gunn
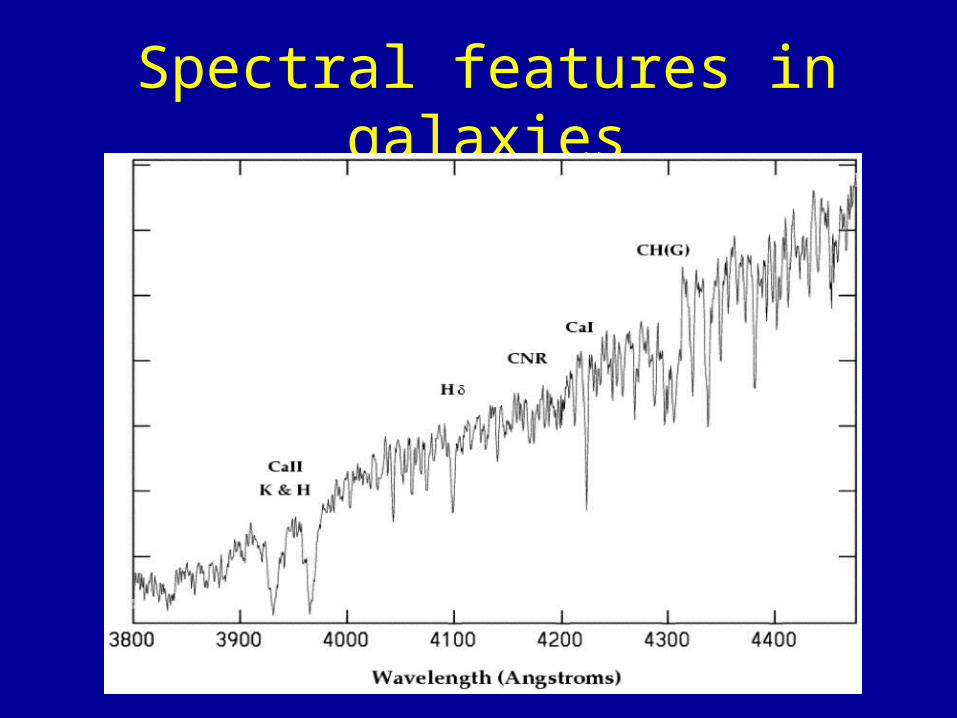
Spectral features in galaxies
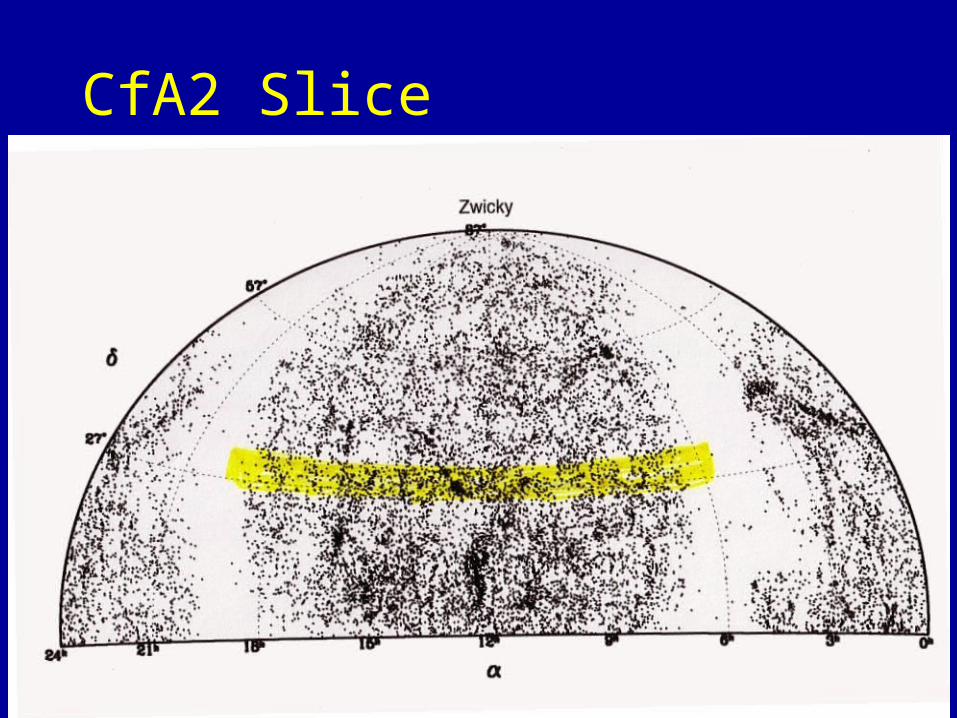
CfA2 Slice

1985 CfA 2 deLapparent, Geller & Huchra
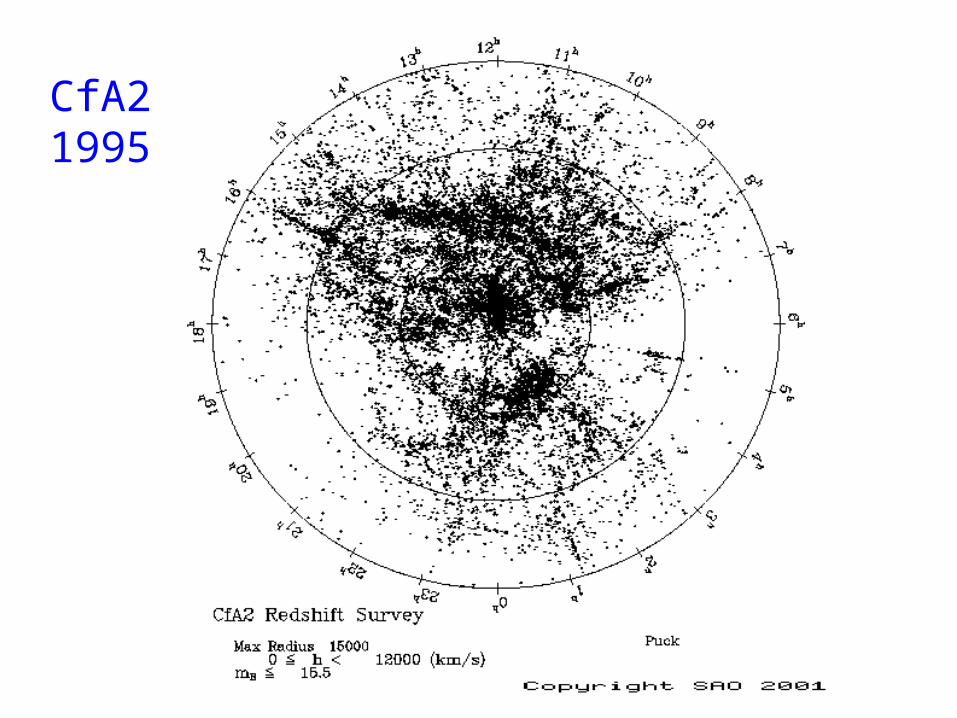
CfA2 1995
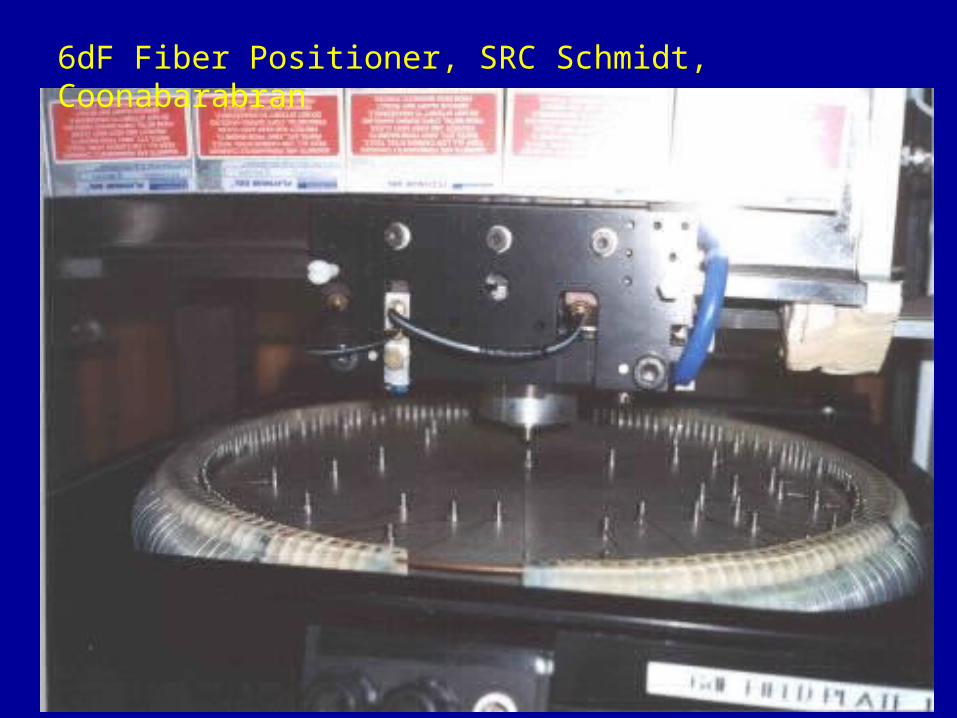
6dF Fiber Positioner, SRC Schmidt, Coonabarabran

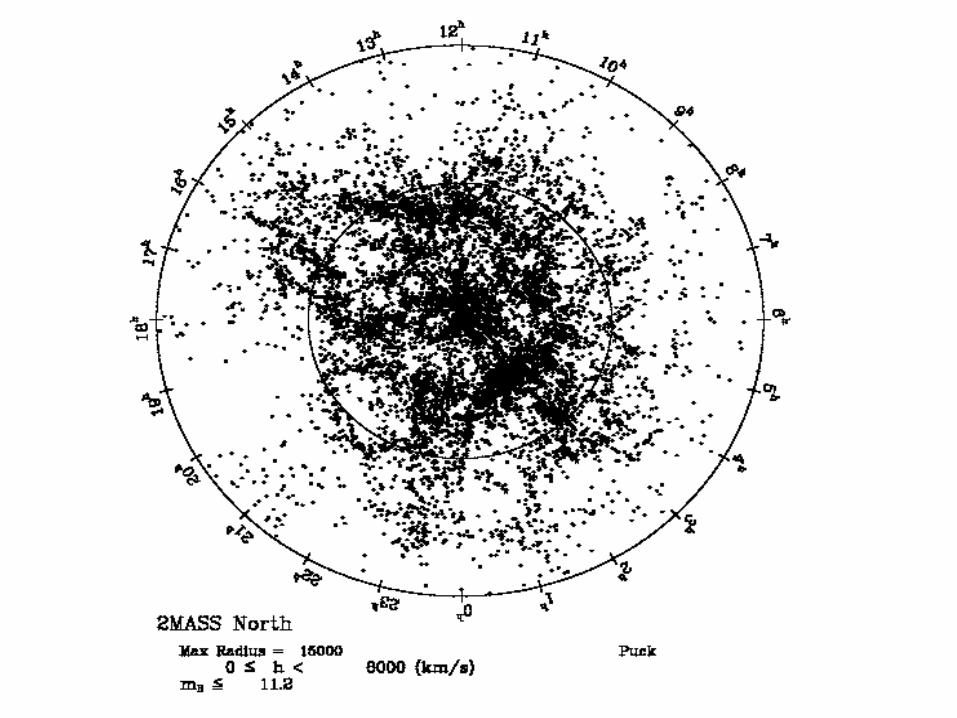
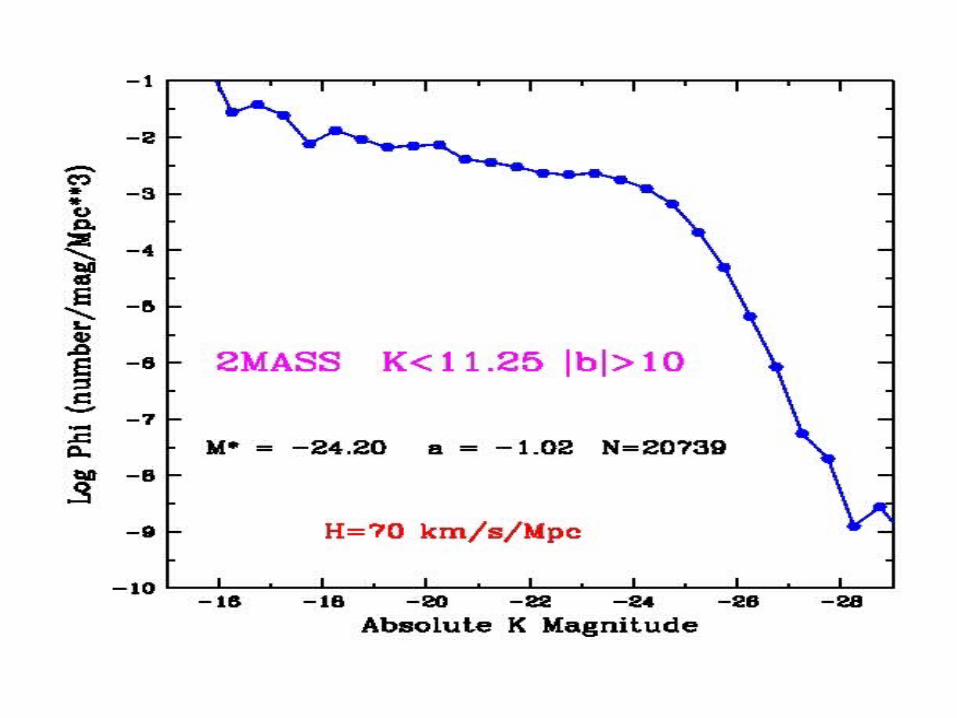
KS < 11.25
We are here
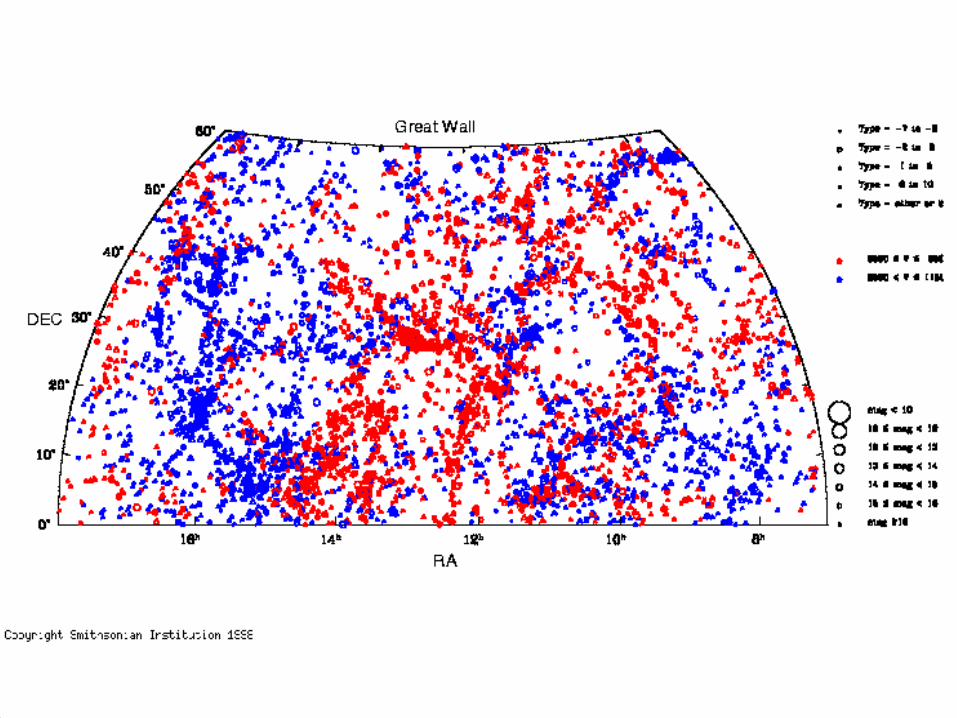
Great Wall
Pisces-Perseus
LSC

M. Westover
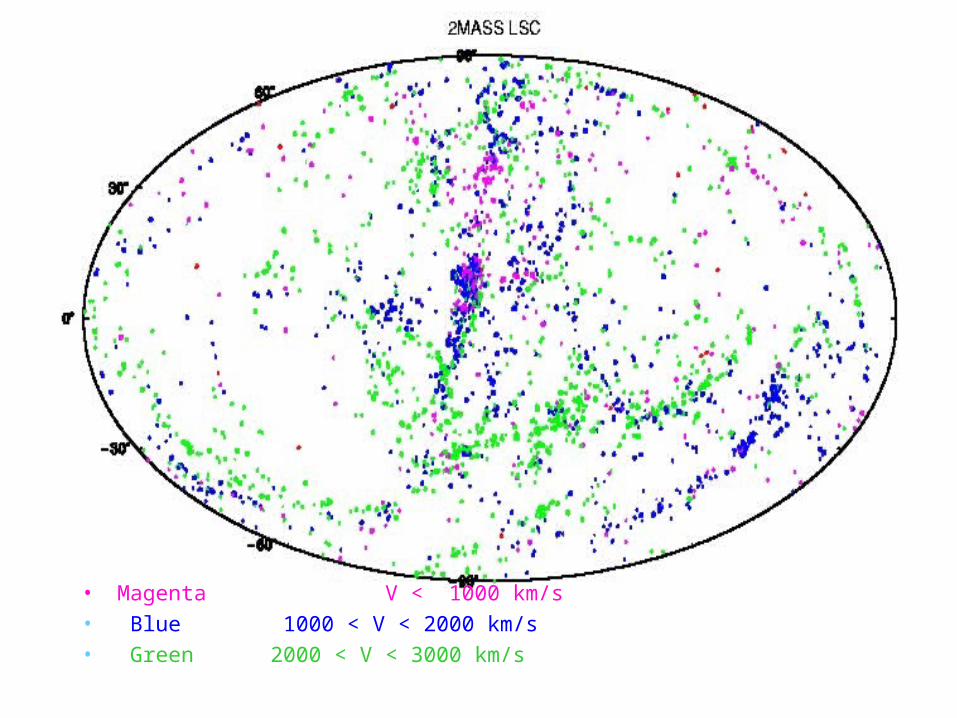
• Magenta V < 1000 km/s • Blue 1000 < V < 2000 km/s• Green 2000 < V < 3000 km/s
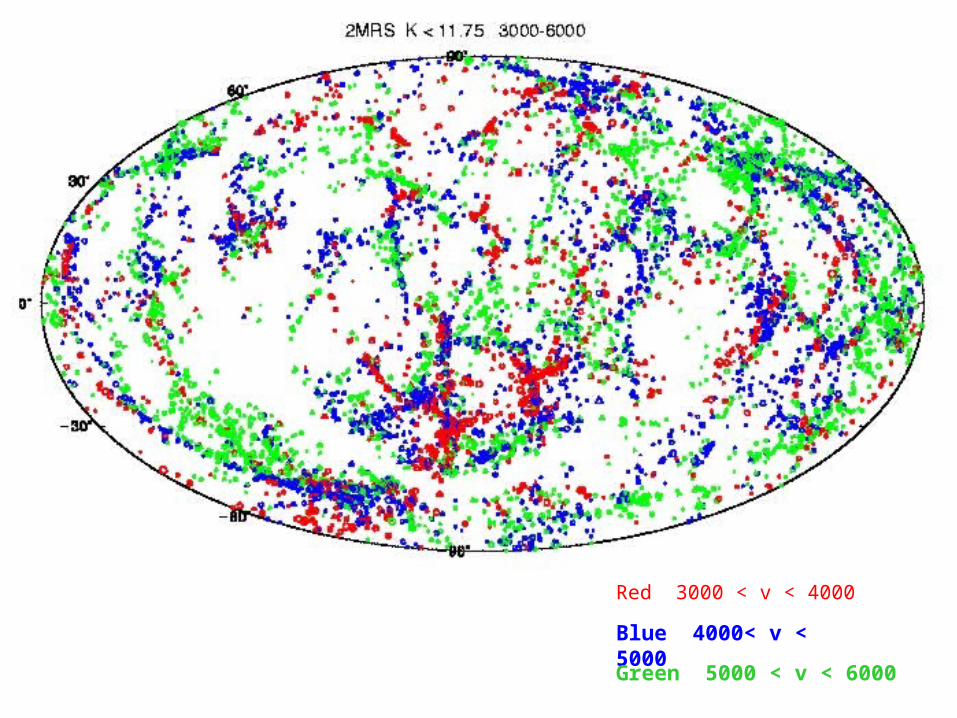
Red 3000 < v < 4000
Blue 4000< v < 5000
Green 5000 < v < 6000
Red 3000 < v < 4000
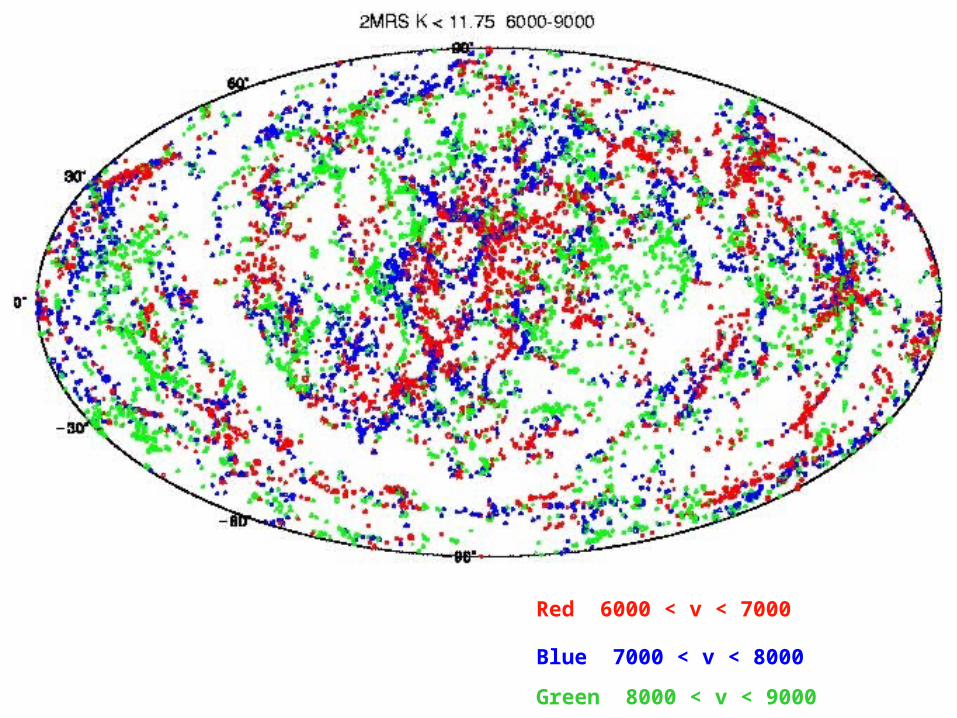
Red 6000 < v < 7000
Blue 7000 < v < 8000
Green 8000 < v < 9000

Red 9000 < v < 11000
Blue 11000 < v < 13000
Green 13000 < v < 15000

SCDM LCDM
Virgo Consortium: testing cosmological models with LSS. Obs vs Simulations

Red = DM from
Grav lensing
Blue = Hot
x-ray gas
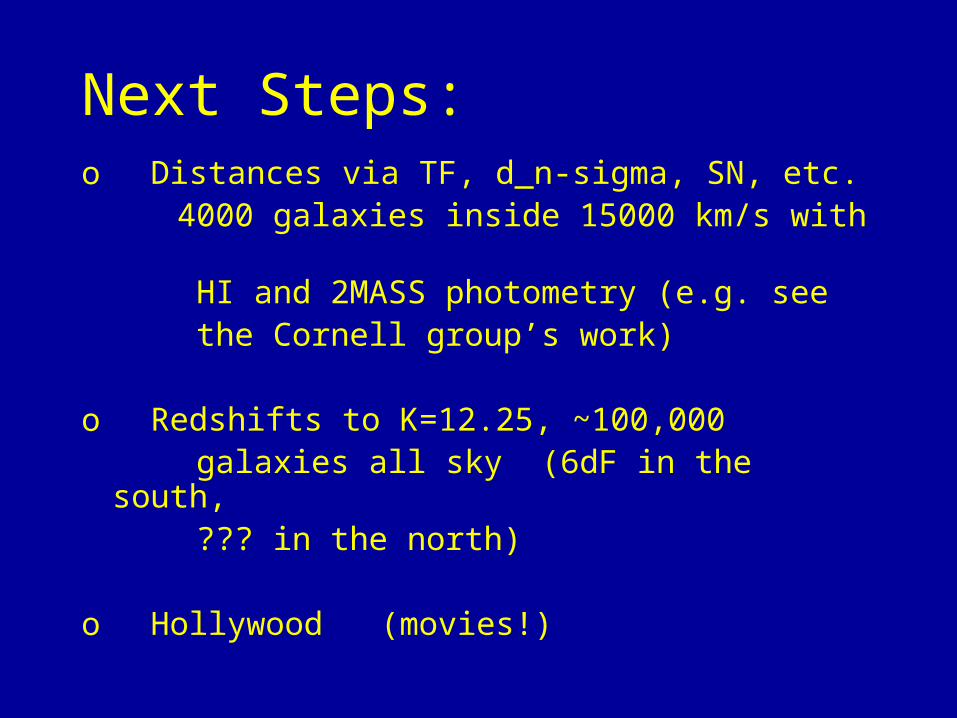
Next Steps:o Distances via TF, d_n-sigma, SN, etc. 4000 galaxies inside 15000 km/s with HI and 2MASS photometry (e.g. see the Cornell group’s work) o Redshifts to K=12.25, ~100,000 galaxies all sky (6dF in the south, ??? in the north)
o Hollywood (movies!)

Remember, This Is A Sphere!
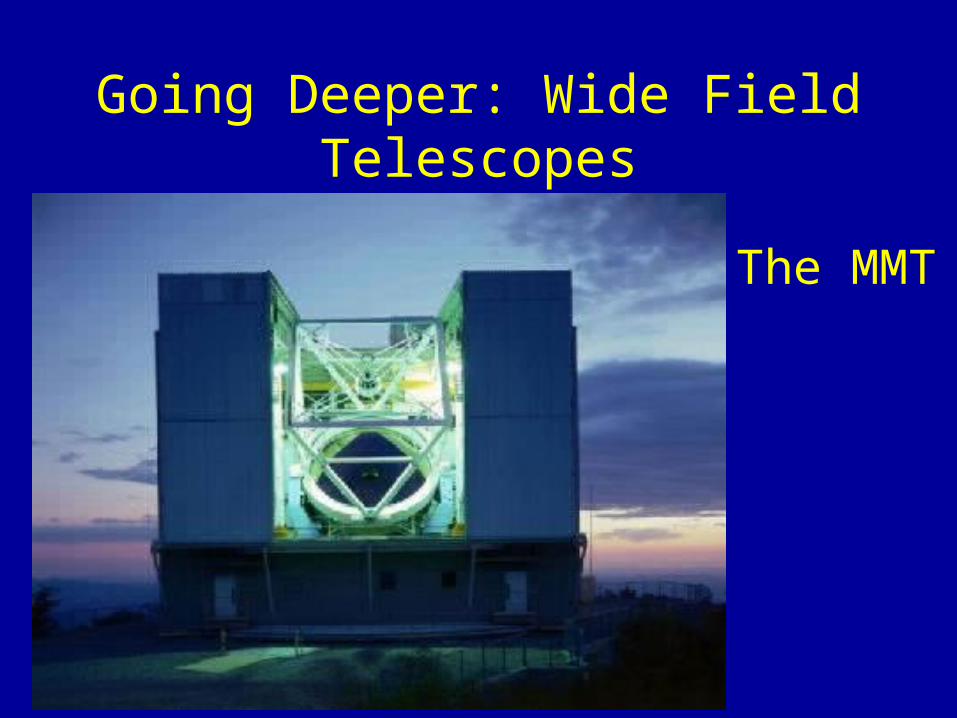
Going Deeper: Wide Field Telescopes
The MMT
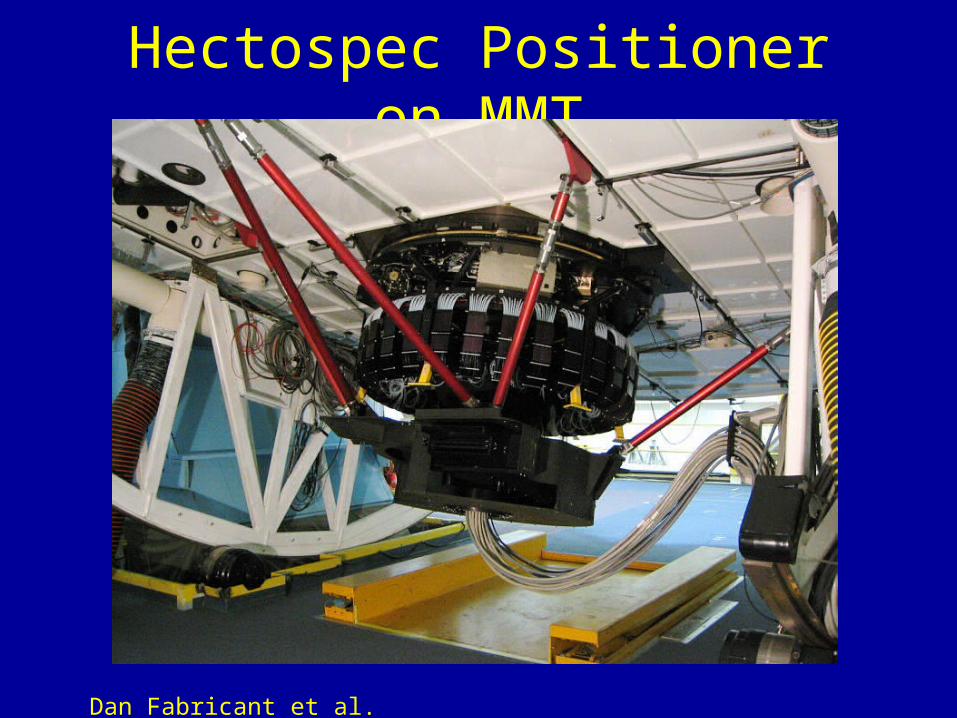
Hectospec Positioner on MMT
Dan Fabricant et al.

Hectospec Positioner on MMT
300 Fibers
covering a
1 degree field
of view
D. Fabricant

Large Synoptic Survey Telescope
•