mass incarceration in three midwestern states: origins and
TRANSCRIPT

Marquette University Law SchoolMarquette Law Scholarly Commons
Faculty Publications Faculty Scholarship
2013
Mass Incarceration in Three Midwestern States:Origins and TrendsMichael M. O'HearMarquette University Law School, [email protected]
Follow this and additional works at: http://scholarship.law.marquette.edu/facpubPart of the Law Commons
Publication InformationMichael M. O'Hear, Mass Incarceration in Three Midwestern States: Origins and Trends, 47 Val. U.L. Rev. 709 (2013)
This Article is brought to you for free and open access by the Faculty Scholarship at Marquette Law Scholarly Commons. It has been accepted forinclusion in Faculty Publications by an authorized administrator of Marquette Law Scholarly Commons. For more information, please [email protected].
Repository CitationO'Hear, Michael M., "Mass Incarceration in Three Midwestern States: Origins and Trends" (2013). Faculty Publications. Paper 645.http://scholarship.law.marquette.edu/facpub/645

709
MASS INCARCERATION IN THREE MIDWESTERN STATES: ORIGINS AND
TRENDS Michael M. O’Hear*
I. INTRODUCTION
As is well known, America’s incarceration rate has exploded to unprecedented heights in the past generation, with the national prison population quintupling in size since the late 1970s.1 But, if the fact of mass incarceration is beyond dispute, the cause is a matter of considerable uncertainty and debate. Several commentators have weighed in with a variety of thoughtful and intriguing theories,2 and there is doubtlessly a measure of truth to many of them—the American criminal justice “system” is a many-headed hydra, and its behavior over three decades is unlikely to be satisfactorily explained by any single, monolithic causal theory, whether that theory be racism, politics, the breakdown of the family, or anything else.
In any event, prior accounts of the rise of mass incarceration have generally focused on the nation as a whole.3 Such a national orientation seems natural enough: since all states have seen large increases in imprisonment over the past generation, it is hard to avoid the conclusion that the most important causes are national in character—broad changes in demographics, culture, politics, or law that have affected all regions of the country in a more-or-less uniform fashion. Yet, a national focus may * Associate Dean for Research and Professor, Marquette Law School. Editor, Federal Sentencing Reporter. Author, Life Sentences Blog. B.A., J.D. Yale University. I am grateful to Elana Olson and Garrett Soberalski for extremely helpful research assistance. I am also grateful to Valparaiso University Law School for hosting the stimulating conference that gave rise to the symposium issue of which this Article is a part. 1 John F. Pfaff, The Micro and Macro Causes of Prison Growth, 28 GA. ST. U. L. REV. 1239, 1239 (2012). 2 See, e.g., MICHELLE ALEXANDER, THE NEW JIM CROW: MASS INCARCERATION IN THE AGE OF COLORBLINDNESS 97–139 (2012) (emphasizing effects of racial bias and drug enforcement); WILLIAM J. STUNTZ, THE COLLAPSE OF AMERICAN CRIMINAL JUSTICE 252–74 (2011) (emphasizing crime rates, politics, and changes in legal doctrine); MICHAEL TONRY, THINKING ABOUT CRIME: SENSE AND SENSIBILITY IN AMERICAN PENAL CULTURE 97–139 (2004) (emphasizing the role of American social sensibilities, cycles, and moral panics); JAMES Q. WHITMAN, HARSH JUSTICE: CRIMINAL PUNISHMENT AND THE WIDENING DIVIDE BETWEEN AMERICA AND EUROPE 3–15 (2003) (emphasizing distinctively American attitudes toward social hierarchy and government); William Spelman, Crime, Cash, and Limited Options: Explaining the Prison Boom, 8 CRIMINOLOGY & PUB. POL’Y 29 (2009) (emphasizing crime rate, sentencing policy, and state revenue from 1977 to 2005). 3 There are some exceptions, however. See, e.g., W. David Ball, Tough on Crime (on the State’s Dime): How Violent Crime Does Not Drive California Counties’ Incarceration Rates—and Why It Should, 28 GA. ST. U. L. REV. 987 (2012).
O'Hear: Mass Incarceration in Three Midwestern States: Originas and Tren
Produced by The Berkeley Electronic Press, 2013

710 VALPARAISO UNIVERSITY LAW REVIEW [Vol. 47
miss an important reality: while mass incarceration has indeed come to all states, the timing, scale, and consequences of this phenomenon have varied in notable ways from state to state. Assessing these differences may help to enrich our understanding of the national trends and to better appreciate the significance of state-level policy choices.
In this Article, I describe how the mass incarceration story has played out in three medium-sized, Midwestern states: Indiana, Minnesota, and Wisconsin. The three stories are similar in many respects, but notable differences are also apparent. For instance, Minnesota’s imprisonment rate is less than half that of the other two states, while Indiana imprisons more than twice as many drug offenders as either of its peers. I attempt here to unpack these and other imprisonment trends and to relate them to crime and arrest data over time.
This Article is but a preliminary exploration of mass incarceration in the three states. I focus on the direct, easily quantifiable inputs to and outputs from the state criminal-justice systems. Among other things, a more complete analysis, which I hope to undertake in the future, would more systematically assess political culture, legal doctrine, and city-level policies and practices in the three states. In some respects, the present Article is intended not so much to provide definitive answers as to refine the questions for future research.
In doing so, the Article proceeds as follows. Part II surveys a few of the national-level explanatory theories of mass incarceration.4 Part III provides an overview of each of the three states, including their crime and imprisonment trends since the late 1950s.5 Part III also considers the role of violent crime in the mass incarceration story, while Part IV focuses on the war on drugs.6 Finally, Part V concludes.
II. NATIONAL-LEVEL THEORIES
I offer here a brief sampling of some of the scholarship on mass incarceration, focusing particularly on work that considers some of the same sorts of variables that I explore in the three states.
4 See infra Part II (introducing national-level theories used to explain mass incarceration). 5 See infra Part III (examining crime and imprisonment rates in Indiana, Minnesota, and Wisconsin). 6 See infra Part III and Part IV (analyzing the role of violent crimes and the war on drugs in mass incarceration rates).
Valparaiso University Law Review, Vol. 47, No. 3 [2013], Art. 2
http://scholar.valpo.edu/vulr/vol47/iss3/2

2013] Mass Incarceration in Three Midwestern States 711
A. Michelle Alexander and “The New Jim Crow”
Michelle Alexander’s best-selling book The New Jim Crow: Mass Incarceration in the Age of Colorblindness documents and sharply criticizes racial disparities in the American criminal-justice system.7 Central to her argument is the contention that the war on drugs, and not violent crime, drives mass incarceration.8 She notes, “In the federal system, for example, homicide offenders account for 0.4 percent of the past decade’s growth in the federal prison population, while drug offenders account for nearly 61 percent of that expansion.”9 As for state systems,
Only about a quarter of felony defendants in large urban counties were charged with a violent offense in 2006. In cities such as Chicago, criminal courts are clogged with low-level drug cases. In one study, 72 percent of criminal cases in Cook County (Chicago) had a drug charge . . . .10
The point is an important one for Alexander because drug enforcement is a crucial avenue through which discretion enters the criminal-justice system, and discretion is a crucial avenue through which racial bias enters. Specifically, she writes:
The ubiquity of illegal drug activity, combined with its consensual nature, requires a far more proactive approach by law enforcement than what is required to address ordinary street crime. It is impossible for law enforcement to identify and arrest every drug criminal. Strategic choices must be made about whom to target and what tactics to employ.11
Given the inevitability of discretion in drug enforcement, and in light of the powerful unconscious associations many people have between blackness and criminality—associations that were strengthened by the media coverage and political rhetoric accompanying President Reagan’s war on drugs—Alexander argues that racial disparities in drug
7 See generally ALEXANDER, supra note 2 (looking at the correlation between mass incarceration and race). 8 Id. at 102 (“The uncomfortable reality is that arrests and convictions for drug offenses—not violent crime—have propelled mass incarceration.”). 9 Id. at 101 (footnote omitted). 10 Id. at 102 (footnote omitted). 11 Id. at 104.
O'Hear: Mass Incarceration in Three Midwestern States: Originas and Tren
Produced by The Berkeley Electronic Press, 2013

712 VALPARAISO UNIVERSITY LAW REVIEW [Vol. 47
incarceration were also inevitable.12 She observes, “When the War on Drugs gained full steam in the mid-1980s, prison admissions for African Americans skyrocketed, nearly quadrupling in three years . . . .”13 Thus, she claims, “The racial bias inherent in the drug war is a major reason that 1 in every 14 black men was behind bars in 2006, compared with 1 in 106 white men.”14
B. William Stuntz and the War on Violence
The late William J. Stuntz provides a starkly different account of the relationship between violence, drug enforcement, and mass incarceration. Where Alexander is dismissive of the influence of violence on incarceration rates, Stuntz writes:
The policy justification [for the late twentieth-century imprisonment boom] was simple: by the early 1970s, punishment per unit crime had fallen massively, and crime had risen massively, especially in increasingly violent cities. Recovering the justice system’s ability and willingness to punish serious crimes was a legitimate goal, even a social necessity. Proof is impossible, but the low and falling prison populations of the 1960s and early 1970s probably contributed to rising levels of serious crime during those years . . . . Wherever the line is between a merciful justice system and one that abandons all serious effort at crime control, the nation had crossed it. A turn toward more punishment was natural.15
To be sure, although Stuntz believes that “the punitive turn . . . was inevitable” in light of increasing crime, he acknowledges that its unprecedented magnitude was not.16 He attributes the scale of contemporary mass incarceration to the interplay of several different factors, including politics, changes in legal doctrine, and the allocation of
12 Id. at 107. 13 Id. at 98. See generally Jeanne Bishop, Where the Rubber Meets the Road: Injecting Mercy into a System of Justice, 47 VAL. U. L. REV. 819 (2013) (illustrating the detrimental effects that the war on drugs has had on the African American community in Cook County, Illinois); Brian G. Gilmore & Reginald Dwayne Betts, Deconstructing Carmona: The U.S. War on Drugs and Black Men as Non-Citizens, 47 VAL. U. L. REV. 777 (2013) (investigating the effects of the war on drugs and explaining how it could have been avoided). 14 ALEXANDER, supra note 2, at 100. 15 STUNTZ, supra note 2, at 252. 16 Id. at 253.
Valparaiso University Law Review, Vol. 47, No. 3 [2013], Art. 2
http://scholar.valpo.edu/vulr/vol47/iss3/2

2013] Mass Incarceration in Three Midwestern States 713
funding responsibility for prisons.17 The latter cause is most pertinent for present purposes:
States pay for . . . penitentiaries, but local officials—chiefly prosecutors and trial judges—make the decisions that fill them. To the local voters who elect those officials, and hence to the officials they elect, prison sentences are nearly a free good. Meanwhile, local governments, not states, pay more than 90 percent of the tab for the local police forces that are responsible for the overwhelming majority of street-level law enforcement. . . . No wonder the number of urban police officers per unit population held steady in the 1970s and 1980s, while the imprisonment rate more than tripled.18
Although this funding system did not make mass incarceration inevitable, “the point is that once political pressure was brought to bear on local prosecutors to ramp up criminal punishment, as happened beginning in the mid-1970s, no force pushed in the opposite direction. Once the punitive turn got rolling, it kept rolling; there was nothing to stop it.”19
Despite Stuntz’s emphasis on the importance of rising violent crime rates as a trigger for the imprisonment boom, the war on drugs also plays an important, if secondary, role in his account. In his view, the war on drugs was really a war on violence by proxy. Although the numbers of prisoners and prison cells exploded in the late twentieth-century, the numbers of police, prosecutors, and trial judges did not.20 As these local actors faced increasing demand for punishment, they were forced to become more efficient—to find ways of sending growing numbers of violent offenders to prison more quickly and reliably. “For urban police looking to increase their arrest numbers and urban prosecutors seeking higher conviction rates, drug cases were a godsend.”21 In these cases, Stuntz observes, “Police investigation is cheap: a single street stop or buy-and-bust might produce multiple arrests, with many fewer man-hours than in a robbery or homicide investigation.”22 For their part, prosecutors are typically saved the difficult mens rea problems and the
17 Id. 18 Id. at 254–55 (footnote omitted). 19 Id. at 255. 20 See id. at 256–57 (noting increases in efficiency of police and prosecutors during imprisonment boom). 21 Id. at 270. 22 Id. at 271.
O'Hear: Mass Incarceration in Three Midwestern States: Originas and Tren
Produced by The Berkeley Electronic Press, 2013

714 VALPARAISO UNIVERSITY LAW REVIEW [Vol. 47
challenges of managing lay witnesses that often arise in conventional violent-crime prosecutions. But, in Stuntz’s view, although drug cases may not include any formal charges of violent crime, they are often intended to punish violence. “Even when the drug in question is marijuana,” Stuntz contends, “prosecutors regularly justify drug prosecutions as surrogates for violent crime charges.”23 The war on drugs thus became a convenient tool for local officials to satisfy the public’s growing demand for punishment of violent crime in the absence of concomitant increases in local criminal-justice resources.
Stuntz contends, moreover, that this theory of a proxy war on violence solves an important mystery highlighted by Alexander: Why are blacks punished for drug crimes at much higher rates than whites, when both races commit drug crimes at about the same rate?24 The answer, says Stuntz, is that blacks commit violent crimes much more frequently than whites, and the central thrust of drug enforcement is really against violence, not drug use per se.25
C. John Pfaff and the “Who” Question
John Pfaff has performed some of the most quantitatively sophisticated research on the causes of mass incarceration.26 Much of his work may be thought of as addressing the “who” question: Of all of the actors in the criminal-justice system—legislators, police, prosecutors, judges, parole officials, and so forth—which have played the key roles in fueling the imprisonment boom? Legislators often get the blame for enacting harsh new sentencing laws, of which there have undoubtedly been many over the past three decades.27 However, this view seems belied by Pfaff’s analysis of data from eleven states between the late 1980s and the early 2000s, which found little change in actual sentence lengths.28 Rather, Pfaff concludes, prison growth was driven by admissions growth—more people being sent to prison, but not necessarily for any longer periods of time.29
23 Id. at 269 (footnote omitted). 24 ALEXANDER, supra note 2, at 100. 25 STUNTZ, supra note 2, at 272. 26 See generally Pfaff, supra note 1 (discussing the influential actors and variables that led to the exploding incarceration rate); John Pfaff, FORDHAM UNIV. SCH. OF LAW, http://law.fordham.edu/faculty/3052.htm (last visited Apr. 3, 2013) (providing a list of selected publications by Professor Pfaff). 27 See generally Lynn Adelman, The Adverse Impact of Truth-in-Sentencing on Wisconsin’s Efforts to Deal with Low-Level Drug Offenders, 47 VAL. U. L. REV. 689 (2013) (discussing the effects of Wisconsin’s truth-in-sentencing laws). 28 Pfaff, supra note 1, at 1243. 29 Id. at 1244.
Valparaiso University Law Review, Vol. 47, No. 3 [2013], Art. 2
http://scholar.valpo.edu/vulr/vol47/iss3/2

2013] Mass Incarceration in Three Midwestern States 715
But who is responsible for driving admissions growth? Criminals themselves are, of course, part of the equation. Even assuming that all of the government actors do their jobs in the same way, an increase in the number of crimes committed might be sufficient to raise the number of prison admissions. However, even holding crimes constant, Pfaff finds evidence that one actor in the system, the prosecutor, has played an important, independent role in driving prison admissions. Based on data from thirty-four states between 1994 and 2008, Pfaff finds a remarkable concurrence between the rate of growth in felony filings by prosecutors (37.4%) and the rate of growth in prison admissions (40%).30 These parallel increases are particularly remarkable because the number of crimes and number of arrests actually fell sharply during this time period. Prosecutors, in other words, chose to file felony charges in a much larger percentage of cases presented to them after 1994.31 Since judges continued to produce new prison admissions per felony filing at about the same rate throughout the time period,32 the change in prosecutorial behavior could be blamed (or credited) with the admissions rise, and hence the overall imprisonment increase.33
D. William Spelman and the Importance of State-Level Decisions
Like Pfaff, William Spelman uses the analytical tools of econometrics to try to understand the causes of mass incarceration, but Spelman ultimately focuses more on the role of state-level decision making.34 Spelman has analyzed state prison population data from 1977–2005 and tested for correlations with more than thirty independent variables.35
30 Id. at 1250. 31 Id. at 1253. 32 Id. (“[A]dmissions per filing remain almost perfectly flat between 1994 and 2008, rising from 0.258 to 0.264 and peaking at 0.271 in 1999; these distinctions are fairly trivial.”). 33 We shouldn’t be too quick to let judges and legislators off the hook, however. The increased rate of felony filings per arrest suggests that prosecutors are pursuing prison sentences in increasingly marginal cases. The fact that judges continue to oblige prosecutors to the same extent as before may thus indicate growing judicial severity. Additionally, the availability of tough mandatory minimum sentencing laws—the product of legislative action—may contribute to the ability of prosecutors to obtain felony convictions in marginal cases: even if the mandatory minimums are not actually imposed very often in practice, prosecutors may obtain favorable plea deals simply by threatening to bring them to bear. See Mark Osler, Amoral Numbers and Narcotics Sentencing, 47 VAL. U. L. REV. 755, 755 (2013) (“[T]he arbitrary mandatory minimums and sentencing guidelines that rank-order the severity of crimes . . . have too often created broad and often tragic outcomes in our society.”). 34 See generally Spelman, supra note 2 (analyzing the effect of state fiscal and policy decisions on prison populations). 35 Id. at 37–39.
O'Hear: Mass Incarceration in Three Midwestern States: Originas and Tren
Produced by The Berkeley Electronic Press, 2013

716 VALPARAISO UNIVERSITY LAW REVIEW [Vol. 47
The most powerful predictors for state prison populations were crime rate, sentencing policy, and state spending patterns.36
Spelman’s finding on the importance of crime rate echoes Stuntz’s views. Among different crime types, the most powerful correlation was between violent crime and prison population; property crime does not seem to drive imprisonment in a statistically significant way, and drug arrests, while meeting the significance threshold, were a much less robust predictor than violent crime.37
Sentencing policy was not as good a predictor of prison population as crime rate, but was still statistically significant.38 In particular, a truth-in-sentencing policy (for example, i.e., no discretionary parole) was positively correlated with prison population, while the use of presumptive (for example, i.e., guidelines) sentencing displayed a negative correlation.39
Spelman also found a notable correlation between imprisonment and state spending. Higher levels of state spending in general were positively correlated with greater imprisonment, while higher levels of mandatory spending on other state services (for example, i.e., schools and roads) were negatively correlated.40 This suggests a somewhat different picture than Stuntz painted. Prison population growth does not follow inexorably from greater demand for prison space by prosecutors and other local officials. Rather, prison spending seems in some respects to be in competition with other types of state spending. When state revenues are growing, the rising tide lifts all boats: corrections, education, health, transportation, parks, and so forth.41 But when revenues are flat, or otherwise do not keep up with growth in spending in other areas, then corrections spending may be squeezed, and growth in the prison population may flatten or even be reversed.
Among the spending-related variables, Spelman finds an especially powerful relationship between capital spending on prisons and imprisonment rates.42 The data are suggestive of an “if you build it, they will come” effect; new prison capacity tends to be filled quickly. Spelman puts it this way: “Prison populations are largely driven by available capacity; when the money was available to increase capacity,
36 Id. at 60–61. 37 Id. at 57. 38 Id. at 60–61. 39 Id. at 57. 40 Id. at 58. 41 Id. at 63–64. 42 Id. at 60–61.
Valparaiso University Law Review, Vol. 47, No. 3 [2013], Art. 2
http://scholar.valpo.edu/vulr/vol47/iss3/2

2013] Mass Incarceration in Three Midwestern States 717
policy makers spent it; when the beds were available, criminal justice agencies filled them.”43
As noteworthy as the correlations Spelman found may be the correlations he did not find; once other variables were controlled for, the study found no statistically significant relationship between imprisonment and a multitude of economic and demographic factors, including poverty rate, unemployment rate, and racial and ethnic composition.44 Conservative or Republican leanings did predict prison-building, but did not otherwise predict utilization of prison capacity.45 Again, whatever drives prison-building—partisan politics, rising crime rates, overcrowding, or other possibilities—it does seem that once the prisons are built, powerful pressures will cause them to be filled quickly. “Like nature, correctional systems nationwide abhorred a vacuum.”46
III. OVERVIEW OF THE THREE STATES
All three states analyzed here are of a similar size, ranging from Minnesota’s 2011 population of 5,344,861 to Indiana’s population of 6,516,922.47 They also have similar levels of racial homogeneity, ranging from 86.8% white (Indiana) to 88.4% (Wisconsin).48 Poverty levels vary from Minnesota’s 11.0% to Indiana’s 14.1%.49
Indiana does stand out for its more conservative political leanings.50 Since 1960, Indiana has gone Republican in twelve of fourteen presidential elections.51 By contrast, Minnesota has been even more
43 Id. at 65. As Spelman notes, however, another possibility cannot be conclusively ruled out: prison-building may result from policymakers’ anticipation of future needs. “They did not come because we built it; we built it, knowing they were on the way, and they came right on schedule.” Id. Spelman concludes that this account is somewhat less consistent with the data than the former, although both are probably true to some extent. 44 Id. at 60. 45 Id. 46 Id. at 66. 47 State & County Quick Facts: Indiana, U.S. CENSUS, http://quickfacts.census.gov/qfd/ states/18000.html (last visited Apr. 3, 2013); State & County Quick Facts: Minnesota, U.S. CENSUS, http://quickfacts.census.gov/qfd/states/27000.html (last visited Apr. 3, 2013). 48 State & County Quick Facts: Indiana, supra note 47; State & County Quick Facts: Wisconsin, U.S. Census, http://quickfacts.census.gov/qfd/states/55000.html (last visited Apr. 3, 2013). 49 State & County Quick Facts: Indiana, supra note 47; State & County Quick Facts: Minnesota, supra note 47. 50 NARA: U.S. ELECTORAL COLLEGE, http://www.archives.gov/federal-register/ electoral-college/map/historic.html#2012 (last visited Apr. 3, 2013) (use the slider bar at the top of the page to see the election results between 1964 and 2012). 51 Historical Election Results: Electoral Votes, by State, NARA: U.S. ELECTORAL COLL., http://www.archives.gov/federal-register/electoral-college/votes/votes_by_state.html
O'Hear: Mass Incarceration in Three Midwestern States: Originas and Tren
Produced by The Berkeley Electronic Press, 2013

718 VALPARAISO UNIVERSITY LAW REVIEW [Vol. 47
reliably Democratic than Indiana has been Republican, favoring the Democratic candidate in thirteen of the past fourteen elections.52 Wisconsin’s voting pattern has been more complicated. From 1960 through 1984, Wisconsin looked like Indiana, going Republican in five of the seven elections.53 Since 1984, Wisconsin has looked like Minnesota, favoring the Democratic candidate in all seven elections.54
Figure 1 presents historical data on violent crime in the three states since 1957. Several aspects of the chart are noteworthy. First, Indiana has always led the three states in rate of violent crime, while Minnesota was consistently second until quite recently. Second, the pattern and timing of changes in violent crime are roughly similar in all three states. Rates were mostly stable or falling from 1957 to 1963. After 1963, violence rose steadily in all three states through a peak in 1975 and then stabilized or fell slightly for a time. Violence began to rise again in all three states in the 1980s, albeit at different times and by smaller percentages than during the 1963–1975 time period. New peaks were hit in the early to mid-1990s. Since the second peak, violence in Indiana and Minnesota has fallen sharply and remained low relative to the 1990s. Violence fell more modestly in Wisconsin and even hit a new peak in 2008. Finally, violent crime in all three states remains strikingly higher today than it was in 1960, with rates about four times greater in Indiana, five times greater in Minnesota, and seven times greater in Wisconsin.
(last visited Apr. 3, 2013) (follow the hyperlinks to see each state’s voting patterns from the last fourteen elections). 52 Id. 53 Id. 54 Id.
Valparaiso University Law Review, Vol. 47, No. 3 [2013], Art. 2
http://scholar.valpo.edu/vulr/vol47/iss3/2

2013] Mass Incarceration in Three Midwestern States 719
Figure 1. VIOLENT CRIME PER 100,000 RESIDENTS AT 3-YEAR INTERVALS, 1957–201155
All of the foregoing assumes that the violent-crime numbers
reported by local police agencies to the FBI are a reliable and consistent indicator of actual rates of violence. There have, however, been persistent concerns about the quality of this data.56 For this reason, it is helpful to compare Figure 1 with Figure 2, which sets forth just the more trustworthy homicide numbers.57 Figure 2 helps to confirm some aspects
55 See generally Uniform Crime Reports, FED. BUREAU OF INVESTIGATION, http://www.fbi.gov/about-us/cjis/ucr/ucr-publications#Crime (last visited Apr. 3, 2013) (providing crime data from as early as 1995); see also Uniform Crime Reports, LLMC DIGITAL L. LIBR., http://www.llmcdigital.org/titleresults.aspx?searchtype=0&set=80524&volume= &part=&page (last visited Jan. 11, 2013) (providing crime data from before 1995). 56 FRANKLIN E. ZIMRING, THE GREAT AMERICAN CRIME DECLINE 7 (2007). As Franklin Zimring observes, “Aggravated assault is the most frequent of the violent crimes used in the crime index. . . . The border between simple and aggravated assault is difficult to determine, and trends in aggravated assault are frequently a puzzle.” Id. (citation omitted). Moreover, in light of the uncertain line between aggravated assault, which is counted in the FBI violent crime statistics, and simple assault, which is not, there have been persistent concerns that police departments have been able to manipulate the violence statistics for political or fiscal reasons. See, e.g., Heather Ann Thompson, Why Mass Incarceration Matters: Rethinking Crisis, Decline, and Transformation in Postwar American History, 97 J. AM. HIST. 703, 727 (2010) (discussing distortions in violent-crime data after 1965 due to a federal grant program that awarded money to jurisdictions in which crime was on the rise). 57 In contrast to the uncertainties surrounding violent-crime statistics overall, the police-reported homicide numbers can be checked against an independent source, health-agency records. See, e.g., FRANKLIN E. ZIMRING, THE CITY THAT BECAME SAFE: NEW YORK’S LESSONS FOR URBAN CRIME AND ITS CONTROL 21 fig.1.7 (2012) (showing very close correspondence
O'Hear: Mass Incarceration in Three Midwestern States: Originas and Tren
Produced by The Berkeley Electronic Press, 2013

720 VALPARAISO UNIVERSITY LAW REVIEW [Vol. 47
of the story suggested by Figure 1, but casts doubt on others. For instance, Indiana is the clear “leader” in homicide, as it was in violent crime, but Wisconsin and Minnesota swap places for most of the time period. Also, the homicide numbers do not move up as decisively or dramatically in the 1960s as do the overall violence numbers. After 1969, however, homicide does rise markedly and, as with violence generally, reaches a peak in 1975. A second peak follows in the early to mid-1990s, with all three states then falling and remaining well below the second peak level up to the present. Indeed, Indiana and Minnesota have nearly returned to their 1960 homicide levels. Wisconsin remains about 80% higher.
Figure 2. HOMICIDES PER 100,000 RESIDENTS AT 3-YEAR INTERVALS, 1957–201158
Table 1 provides a more systematic comparison of the violence and
homicide data over three periods: the period of rising crime of 1963–1975; the period from the first crime peak (1975) to the second (1993); and the period of falling crime from 1993 to the present. With only one exception (Indiana from 1975–1993), the direction of change of homicide and violence is the same, but there are often large gaps in the magnitude of the change. Interestingly, when violence numbers go up, the homicide numbers invariably go up less, and when the violence numbers
from 1990 to 2008 between homicide numbers reported by the New York Police Department and New York Health Department). 58 See supra note 55 (citing information on reported crimes from 1957 to 2011).
0
2
4
6
8
10
1957 1966 1975 1984 1993 2002 2011
INMNWI
Valparaiso University Law Review, Vol. 47, No. 3 [2013], Art. 2
http://scholar.valpo.edu/vulr/vol47/iss3/2

2013] Mass Incarceration in Three Midwestern States 721
go down, the homicide numbers invariably go down more.59 It is possible, but by no means proven, that this reflects systemic problems or inconsistencies of some sort with the reporting of violent crime. For instance, it is possible that real increases in violence have been magnified, and real decreases in violence muffled, by changing social mores with respect to the reporting of violence since the 1960s. Thus, growing social intolerance of domestic violence may lead to higher levels of aggravated assault being reported. Similarly, victims of sexual assault may perceive diminished social stigma today than would have been the case a generation or two ago, which may increase the frequency with which sexual assaults are reported. In light of such concerns, one must use caution in viewing the patterns depicted in Figure 1 as a straightforward reflection of real-world behavioral trends in the three states. Still, the homicide numbers do help to confirm this basic story: by 1975, violence in the three states was occurring with much more frequency than it had in 1960; violence fell for a time after 1975, but then rose again to a new peak by the mid-1990s; and finally violence declined once more, but still remained consistently higher than 1960 levels.
Table 1. CHANGES IN VIOLENCE AND HOMICIDE RATES OVER THREE PERIODS
Indiana Minnesota Wisconsin Violence
Change Homicide Change
Violence Change
Homicide Change
Violence Change
Homicide Change
1963–1975
223% 204% 263% 175% 375% 94%
1975–1993
47% -18% 71% 3% 74% 33%
1993–2011
-32% -36% -38% -59% -10% -45%
Moving from crime to punishment, Figure 3 presents historical data
on imprisonment rates in the three states. As the graph indicates, Indiana has consistently had the highest imprisonment rate, and Minnesota the lowest. Indiana’s position is not surprising, given its persistently higher rates of homicide and reported violent crime, as well as its more conservative political leanings. What may seem more surprising is that Wisconsin has had considerably higher rates of 59 National victimization surveys also indicate that police data on violent crime understate the magnitude of the 1990’s crime drop. ZIMRING, supra note 56, at 8.
O'Hear: Mass Incarceration in Three Midwestern States: Originas and Tren
Produced by The Berkeley Electronic Press, 2013

722 VALPARAISO UNIVERSITY LAW REVIEW [Vol. 47
imprisonment than Minnesota (and, for a time, even Indiana), despite the fact that Wisconsin has generally had the lowest rates of reported violent crime among the three states.
Figure 3. IMPRISONMENT PER 100,000 RESIDENTS, 1957–201160
Focusing on trends over time, imprisonment rates were flat or falling
in all three states from 1960 to 1972. By about 1975, however, imprisonment rates were on the rise. In Indiana and Minnesota, the growth has continued with remarkable consistency up to the present. Wisconsin has followed a somewhat different pattern, with an unrivaled rate of growth until 2002, but then a substantial reduction over the past decade. Overall growth since 1972 varies from Minnesota’s 423% to Wisconsin’s 698%, with Indiana in between at 505%.
IV. IMPRISONMENT AND VIOLENCE
Stuntz characterizes the national imprisonment boom as primarily a response to a surge in urban violence (albeit a response that was amplified by various political, institutional, and legal factors). How well
60 See generally Publications & Products: Prisoners, BUREAU OF JUSTICE STATISTICS http://bjs.ojp.usdoj.gov/index.cfm?ty=pbse&sid=40 (last updated Mar. 5, 2013) (providing links to numerous publications with data on the number of prisoners in state and federal prisons from 1979 to 2011). For older data, see generally PATRICK A. LANGAN, JOHN V. FUNDIS, LAWRENCE A. GREENFELD & VICTORIA W. SCHNEIDER, U.S. DEP’T OF JUST., HISTORICAL STATISTICS ON PRISONERS IN STATE AND FEDERAL INSTITUTIONS, YEAREND 1925–86 (1988), https://www.ncjrs.gov/pdffiles1/digitization/111098ncjrs.pdf. The numbers do not include jail inmates. Since Indiana data is not available from 2005, the Indiana data from 2004 and 2006 have been averaged to supply an estimated number for 2005.
Valparaiso University Law Review, Vol. 47, No. 3 [2013], Art. 2
http://scholar.valpo.edu/vulr/vol47/iss3/2

2013] Mass Incarceration in Three Midwestern States 723
does this theory fit the three states’ data? In this Part, I first present a gross comparison between trends in violence and imprisonment in the three states, and then examine the changing composition of the states’ prison populations in an effort to more clearly isolate the role of violent crime in driving mass incarceration.
A. Broad Trends
Table 2 assembles the basic data showing broad trends. At first blush, the numbers are not very promising for the hypothesis that violence plays a key role in imprisonment. Between 1963 and 1975, rates of reported violent crime went up in all three states, but imprisonment rates went down. Likewise, between 1993 and the present, violence rates went down in all three states, but imprisonment rates went up. In the middle period, from 1975 to 1993, violence and imprisonment at least moved in the same direction, but, in all three states, the growth in imprisonment was much greater.
Table 2. CHANGES IN VIOLENT CRIME AND IMPRISONMENT RATES PER 100,000 RESIDENTS
Indiana Minnesota Wisconsin Violence
Change Prison Change
Violence Change
Prison Change
Violence Change
Prison Change
1963–1975
223% -27% 263% -14% 375% -6%
1975–1993
47% 248% 71% 121% 74% 168%
1993–2011
-32% 74% -38% 97% -10% 106%
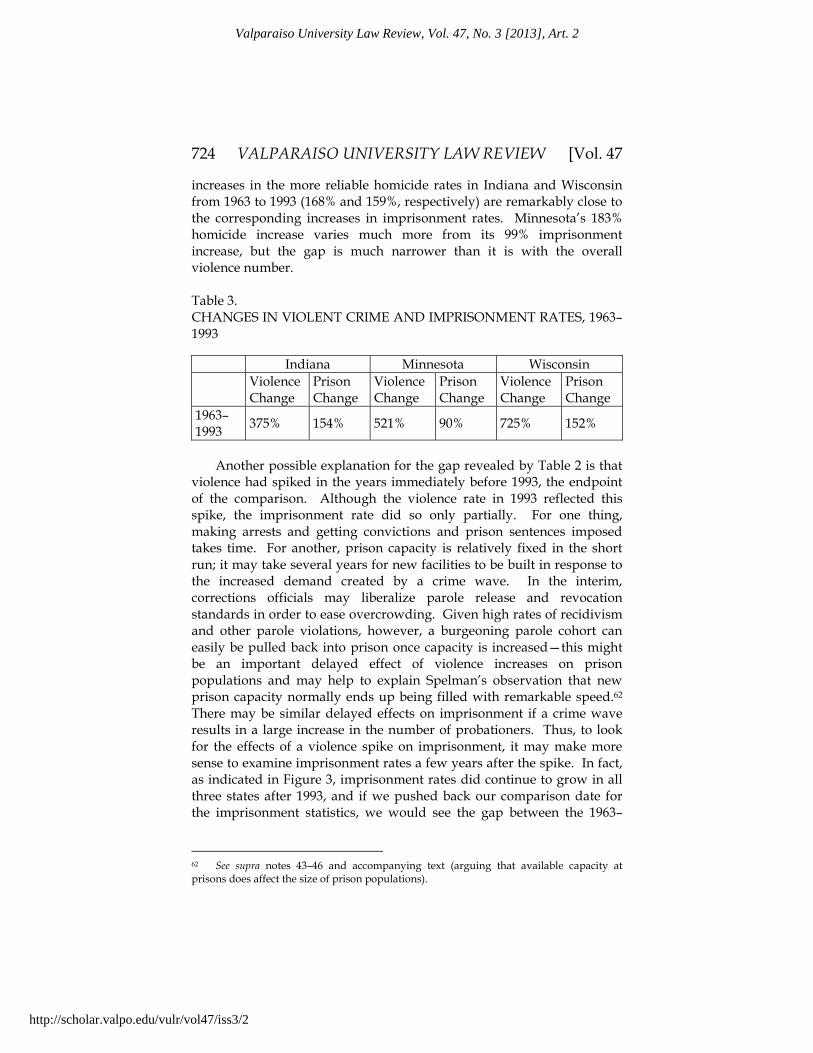
The picture changes a bit if we consider the entire 1963–1993 time
period together, as indicated in Table 3. We can now see sizeable net growth in the rates of both violence and imprisonment in all three states, but imprisonment growth still lags well behind the violence increases. What might account for this? One possibility, as suggested above, is that increases in violent crime were amplified by higher reporting rates;61 more consistency in reporting might have closed some of the gap between the violence and imprisonment growth numbers. Indeed, the
61 See supra text accompanying note 59 (highlighting fluctuations in violent crime and the reporting thereof).
O'Hear: Mass Incarceration in Three Midwestern States: Originas and Tren
Produced by The Berkeley Electronic Press, 2013
724 VALPARAISO UNIVERSITY LAW REVIEW [Vol. 47
increases in the more reliable homicide rates in Indiana and Wisconsin from 1963 to 1993 (168% and 159%, respectively) are remarkably close to the corresponding increases in imprisonment rates. Minnesota’s 183% homicide increase varies much more from its 99% imprisonment increase, but the gap is much narrower than it is with the overall violence number.
Table 3. CHANGES IN VIOLENT CRIME AND IMPRISONMENT RATES, 1963–1993
Indiana Minnesota Wisconsin Violence
Change Prison Change
Violence Change
Prison Change
Violence Change
Prison Change
1963–1993 375% 154% 521% 90% 725% 152%
Another possible explanation for the gap revealed by Table 2 is that
violence had spiked in the years immediately before 1993, the endpoint of the comparison. Although the violence rate in 1993 reflected this spike, the imprisonment rate did so only partially. For one thing, making arrests and getting convictions and prison sentences imposed takes time. For another, prison capacity is relatively fixed in the short run; it may take several years for new facilities to be built in response to the increased demand created by a crime wave. In the interim, corrections officials may liberalize parole release and revocation standards in order to ease overcrowding. Given high rates of recidivism and other parole violations, however, a burgeoning parole cohort can easily be pulled back into prison once capacity is increased—this might be an important delayed effect of violence increases on prison populations and may help to explain Spelman’s observation that new prison capacity normally ends up being filled with remarkable speed.62 There may be similar delayed effects on imprisonment if a crime wave results in a large increase in the number of probationers. Thus, to look for the effects of a violence spike on imprisonment, it may make more sense to examine imprisonment rates a few years after the spike. In fact, as indicated in Figure 3, imprisonment rates did continue to grow in all three states after 1993, and if we pushed back our comparison date for the imprisonment statistics, we would see the gap between the 1963–
62 See supra notes 43–46 and accompanying text (arguing that available capacity at prisons does affect the size of prison populations).
Valparaiso University Law Review, Vol. 47, No. 3 [2013], Art. 2
http://scholar.valpo.edu/vulr/vol47/iss3/2
2013] Mass Incarceration in Three Midwestern States 725
1993 violence increase and the lagged imprisonment increase progressively narrow over the next few years after 1993.
These same considerations may help to explain why the imprisonment rate did not start to rise in the three states until the mid-1970s—a full decade after rates of reported violent crime had started to grow. First, as suggested by the homicide data in Figure 2, the increase in actual violent crime may not have been as dramatic or sustained as the increase in reported violent crime. Second, to the extent that there really were more violent offenders to imprison, the capacity to imprison them could not increase immediately. Most obviously, this is a question of physical space to house inmates. However, capacity to imprison a growing number of violent offenders may also be thought of more broadly. For instance, absent improvements in efficiency, the number of police officers, prosecutors, and trial-court judges must also increase in order to keep up with a growing number of cases to process. If this is not done, then it seems inevitable that an increasing percentage of offenders will avoid apprehension, charging, and conviction. Increasing imprisonment capacity may thus require not only additional bricks-and-mortar investments on the back end of the criminal-justice system, but also additional personnel and/or the development of more efficient case-processing techniques on the front end.
Some evidence of lagging police and prosecutorial capacity can be seen in FBI data on clearance and charging rates. Thus, between 1960 (just before the spike in reported violence) and 1972 (after a decade of rising rates of reported violent crime, but flat or falling imprisonment), police clearance rates in the East North Central Region (which includes Indiana and Wisconsin) fell in six of eight crime categories, most precipitously for rape (from 64.7% to 51.7%).63 And police efficiency dropped even more markedly in the West North Central Region (which includes Minnesota), with clearance rates falling in seven of eight categories, and four by more than ten percentage points.64 Moreover,
63 Compare J. EDGAR HOOVER, FED. BUREAU OF INVESTIGATION, UNIFORM CRIME REPORTS FOR THE UNITED STATES 85 tbl.9 (1961) [hereinafter 1960 UCR] (providing data for known offenses in the East North Central Region in 1960), with CLARENCE M. KELLEY, FED. BUREAU OF INVESTIGATION, CRIME IN THE UNITED STATES 1972 109 tbl.15 (1973) [hereinafter 1972 UCR] (reporting data on known offenses in the East North Central Region for 1972). The FBI data does not break these numbers out by state. 64 To be sure, falling clearance and charging rates may be due, at least in part, to other factors besides what I identify here, i.e., basic capacity constraints not rising quickly enough to keep up with rising crime. For instance, the expansion of criminal procedure rights during the Warren Court era may have reduced police efficiency. Likewise, the social unrest in America’s inner cities that became dramatically apparent in the great riots of the late 1960s may have contributed by 1972 to diminished trust and cooperation between police and citizens in high-crime neighborhoods.
O'Hear: Mass Incarceration in Three Midwestern States: Originas and Tren
Produced by The Berkeley Electronic Press, 2013

726 VALPARAISO UNIVERSITY LAW REVIEW [Vol. 47
national data indicate that charging rates for violent crime fell even more significantly than clearance rates during the 1960–1972 time period.65
I suggest, in short, that delays in building various types of criminal-justice capacity may help to save the Stuntz hypothesis, which characterizes violence increases as the primary cause or trigger of mass incarceration, from the challenges implicit in Table 2.66
But even taking these delays into account, the tail end of our time period still seems problematic: imprisonment rates in all three states continued to grow for many years after the rates of violent crime began to drop. For instance, in Indiana, violent crime peaked in 1996 and then fell in eleven of the following fourteen years, settling on a long-term basis at a rate about 40% lower than the peak. Yet, during that same time period, the state’s imprisonment rate increased almost continuously. Given the lag time required to expand imprisonment capacity, it is plausible that a violence-driven prison expansion might continue for a few years after violence peaks. However, the Indiana expansion seems to go well beyond this lag effect and may point instead to real increases in system severity (as opposed to constant severity against a backdrop of historically high numbers of offenders).67
The Minnesota story is similar. After reported violence peaked in 1994, the rate dropped in twelve of the next sixteen years, settling at a rate about one-third lower than the peak. Yet, the imprisonment rate rose in fourteen of the next sixteen years, reaching a point more than eighty percent higher than the 1994 level.
Wisconsin also followed a similar pattern, at least at first. After violence peaked in 1995, violence went down and imprisonment went up in eight of the next nine years. After that, violence spiked again and remains well above the 2004 trough. Yet, perversely, 2004 also marked the imprisonment peak. Since then, imprisonment has gone down as violence has gone up—a seeming replay of the pattern in all three states in the late 1960s and early 1970s.
65 For each 100 offenses, the persons charged in rape cases fell from 74.2 to 47.2; in robbery cases from 42.8 to 29; and in aggravated assault cases from 63.3 to 45.4. Compare 1960 UCR, supra note 63, at 85, with 1972 UCR, supra note 63, at 115. The comparison cannot be made with respect to the fourth violent index crime, homicide, because of differences in the way that the data is presented. Regional and state-level data is not available at all for these numbers in 1972, which is why I resort here to national data. 66 See supra notes 15–25 and accompanying text (arguing that violence plays a large role in incarceration rates). 67 Recall, too, that the homicide numbers went down even more markedly than the violence numbers in this time period, which suggests that the continued rise in imprisonment may be even more anomalous than it first appears.
Valparaiso University Law Review, Vol. 47, No. 3 [2013], Art. 2
http://scholar.valpo.edu/vulr/vol47/iss3/2
2013] Mass Incarceration in Three Midwestern States 727
The messiness of the Wisconsin story notwithstanding, it does seem hard to characterize prison growth in the three states since the mid-1990s as largely driven by crime trends, however strong may have been the violence-incarceration link over the first two decades of the imprisonment boom.
B. Prison Composition
The relative importance of violent crime to mass incarceration in the three states can also be assessed by examining the composition of the prison populations over time. Unfortunately, there are a number of gaps and inconsistencies in the reporting of this data by the three state departments of corrections. However, the data, presented in Figures 4–12, nonetheless help to clarify the patterns identified above.
1. Indiana
The Indiana data in Figure 4 tell three quite different stories in three different time periods. First, between 1960 and 1974, the total prison population dropped, but the number of inmates imprisoned for violent crimes remained largely unchanged. The drop came almost entirely from a precipitous decline in the number of inmates imprisoned for property crime. It is not clear why this drop occurred, although it may result in part from the rise in violent crime that had taken hold by 1974; when violent crime is a major preoccupation, property crime may seem comparatively less important, and fewer resources may be available to investigate, prosecute, and punish such lesser offenses.68
68 The overall decline in Indiana’s prison population during this time period was associated with a decline in sentence severity. Compare FED. BUREAU PRISONS, NATIONAL PRISONER STATISTICS: CHARACTERISTICS OF STATE PRISONERS 59–60 (1960), https://www.ncjrs.gov/pdffiles1/Digitization/356NCJRS.pdf [hereinafter PRISON STATS 1960] (showing that in 1960 median maximum sentence for indeterminate sentences was 150.7 months and median time served of inmates was 21.5 months), with U.S. DEP’T OF JUST., CENSUS OF PRISONERS IN STATE CORRECTIONAL FACILITIES 1973 74 (1976) [hereinafter NCJI&SS] (showing that in 1973 median maximum sentence length was 10.6 years, about 127 months, and median time served was 20.2 months). It is not clear whether these severity changes were distributed across all offense types, or were driven by, for instance, a reduced emphasis on punishment of property crimes.
O'Hear: Mass Incarceration in Three Midwestern States: Originas and Tren
Produced by The Berkeley Electronic Press, 2013

728 VALPARAISO UNIVERSITY LAW REVIEW [Vol. 47
Figure 4. NUMBER OF INDIANA PRISONERS CONVICTED IN FOUR CATEGORIES OF OFFENSES69
69 Care must be used in interpreting these data because they come from three quite different sources, and it is possible that some offenses are categorized differently in different sources. See PRISON STATS 1960, supra note 68, at 58. For purposes of this chart, I have counted what are characterized as homicide, robbery, assault, and sex offenses as violent crimes; and burglary, larceny, auto theft, embezzlement, fraud, and forgery as property crimes. This likely over counts violent-crime inmates by a small margin, because the sex offenses category includes a number of offenses that are not violent in character, such as adultery and obscenity. For a listing of what is encompassed by the “sex offense” category, see id. at 8 & n.8. Unfortunately, no finer-grained breakdown is available for 1960, which leaves it unclear as to what extent inmates in the “sex offense” category should be grouped with those in the violent-crime category. I have chosen to treat all of the 1960 sex-offense inmates as violent in light of the finer-grained 1974 data, which indicates that the number of inmates convicted of sexual assault, a violent crime, dwarfs the number of inmates convicted of other sex offenses. INDIANA DEP’T OF CORR., A SURVEY OF POPULATION BY OFFENSE FOR THE ADULT INMATE POPULATION (1975). For purposes of this chart, I have treated “crimes against person” (homicide, kidnapping, sexual assault, robbery, and assault) as synonymous with violent crime. My “other” category is comprised of the offenses categorized in the source material as morals-decency crimes and public order crimes, save for the drug offenses. Beginning in 1997, the Indiana Department of Corrections began to produce biannual “Fact Cards,” which contain a breakdown of the adult inmate population by offense type. See IND. GOV’T, JANUARY 1, 1997 FACT CARD 1 (1997), http://www.in.gov/idoc/files/jan97.pdf [hereinafter 1997 FACT CARD] (providing the 1997 information used for this Article); see also IND. GOV’T, JANUARY 1, 2012 FACT CARD 1 (2012), http://www.in.gov/idoc/files/FACT_CARD_JANUARY_2012.pdf [hereinafter 2012 FACT CARD] (reporting the 2012 prison data used in this Article). I have treated what the Fact Cards characterize as “person” offenses as crimes of violence. Beginning in July 2008, the Fact Cards report sex offenses as a category, which had not been broken out previously. Based on a comparison between the January and July 2008 numbers, it appears that all or nearly all of the sex-offense inmates had previously been placed in the “person” category. For purposes of Figures 4 and 5, and in the interest of making valid comparisons between the Fact Card data from before and after July 2008, I have categorized the sex-offense inmates as violent. Finally, note that the Fact Cards make clear that inmates are categorized based on the most serious committing offense. The earlier sources used are not clear on whether inmates are categorized in this same way. See generally Jessica M. Eaglin, Neo-Rehabilitation and Indiana’s Sentencing Reform Dilemma, 47 VAL. U. L. REV. 867 (2013) (explaining that Indiana’s rising prison population is stressing the state’s budget).
Valparaiso University Law Review, Vol. 47, No. 3 [2013], Art. 2
http://scholar.valpo.edu/vulr/vol47/iss3/2

2013] Mass Incarceration in Three Midwestern States 729
In the second period, 1974–1997, overall imprisonment increased dramatically, and much of this growth was accounted for by violent offenders. The total number of inmates grew by 12,909, and about half of this increase (6,220) came from an increase in the number of violent-offense inmates. Although all categories of inmates saw increases between 1974 and 1997, no category grew by nearly as much in absolute terms as did the violent crime category. Given the large contemporaneous increase in violent crime rates, it is hard to avoid the conclusion that violent crime was a major, if not the major driver, of the imprisonment boom: growing numbers of violent crimes meant growing numbers of defendants convicted of violent crimes and eventually sentenced to prison terms.
This hypothesis seems borne out by the arrest data: between 1982, the first year in which the FBI began to report state arrest totals, and 1997, Indiana’s annual number of arrests for violent crimes more than doubled, from 3,373 to 8,543.70 Indeed, this rate of growth in arrests for violent crime rather neatly tracks the doubling of Indiana’s prison population over the same 1982–1997 time period, from 8,790 inmates to 17,903.
In the final period, 1997–2012, the prison population continued to grow, but the proportion of those imprisoned for violent offenses shrank. Although the absolute number of violent-offense inmates grew, the increase among the drug-offense inmates was much greater. Out of an overall inmate increase of 11,135, the violent-offense increase was only 3,042, or barely one quarter of the total.
Figure 5 provides a more fine-grained depiction of these post-1997 trends. Remarkably, despite a precipitous drop in the number of reported violent crimes between 1996 and 1999, and then a more gradual but steady decline from 2000 through 2005, the number of violent-offense inmates in Indiana prisons remained stable, and even began to creep up by the end of that time period. After 2005, violent crime ticked up modestly, but the number of violent-crime inmates grew even more swiftly.
70 Compare FED. BUREAU OF INVESTIGATION, UNIFORM CRIME REPORTS FOR THE UNITED STATES 1982, 239 tbl.66 (1983) [hereinafter 1982 UCR], with FED. BUREAU OF INVESTIGATION, CRIME IN THE UNITED STATES: 1997 UNIFORM CRIME REPORTS 280 tbl.69 (1998) [hereinafter 1997 UCR].
O'Hear: Mass Incarceration in Three Midwestern States: Originas and Tren
Produced by The Berkeley Electronic Press, 2013

730 VALPARAISO UNIVERSITY LAW REVIEW [Vol. 47
Figure 5. INDIANA VIOLENT CRIME AND PRISONERS BY OFFENSE TYPE, 1997=10071
The data beg the question: Why was there never a drop in the
number of violent-offense inmates to correspond with the large drop in reported violent crimes that occurred in the late 1990s? Although it is not surprising that there would be a lag in the effect of declining crime rates—it takes time for those who commit violent offenses during a crime wave to be apprehended, convicted, and sentenced, and then to complete what are apt to be multiyear terms—the complete absence of a large inmate drop after more than a decade of lower crime rates cries out for some additional explanation.
One possibility is that police and/or prosecutors became more efficient in responding to violent crime. Figure 6 provides some support for this hypothesis, showing that the number of arrests for violent crime continued to climb for about a decade after the number of reported violent crimes peaked. It is not clear why this would be so, but a number 71 The prison data come from the Indiana Department of Corrections Fact Cards. See 1997 FACT CARD, supra note 69 (detailing the percentage of inmates arrested for each type of offense). For each year, I used the January Fact Card for the prison numbers. The corresponding violent crime numbers come from the previous year. Thus, for instance, the numbers associated with 1997 on the graph are prisoner statistics as of January 1997 and the year-end 1996 crime data (absolute numbers, not rates per 100,000). See IND. GOV’T, JANUARY 1, 2000 FACT CARD (2000), http://www.state.in.us/idoc/files/jan00.pdf (reporting statistics on the percentage of inmates committing a wide range of offenses). See generally Statistical Data, IND. GOV’T, http://www.in.gov/idoc/2376.htm (last visited Apr. 4, 2013) to see Fact Cards for statistics from more recent years.
0
50
100
150
200
Violent Crimes
ViolentInmatesOther Inmates
Valparaiso University Law Review, Vol. 47, No. 3 [2013], Art. 2
http://scholar.valpo.edu/vulr/vol47/iss3/2

2013] Mass Incarceration in Three Midwestern States 731
of possibilities are apparent: more police resources, improved investigative techniques or technology, and improved efficiency as the crime wave of the late 1980s and early 1990s subsided and police were able to do more than just rush from crime scene to crime scene. Whatever the reason, the increased number of arrests through the mid-2000s seems a likely explanation for at least a portion of the increased number of violent-offense inmates over the same time period. It remains puzzling, though, why the inmate numbers did not eventually drop after the arrest numbers fell sharply between the mid- and late 2000s.
Figure 6. INDIANA VIOLENT CRIME, ARRESTS, AND PRISONERS, 1997=10072
72 For each year of prison data, the corresponding violent crime and arrest numbers come from the previous year. Arrest data come from the FBI’s Uniform Crime Reports. See generally Uniform Crime Reports, supra note 55 (providing crime statistics from 1995 to 2012). For the relevant numbers from Table 69 of each year, see 1997 UCR, supra note 70, at 280 tbl.69; FED. BUREAU OF INVESTIGATION, CRIME IN THE UNITED STATES 2000: UNIFORM CRIME REPORTS 274 tbl.69 (2001); FED. BUREAU OF INVESTIGATION, CRIME IN THE UNITED STATES 2003: UNIFORM CRIME REPORTS 330 tbl.69 (2004); Table 69: Arrests by State, 2006, FED. BUREAU OF INVESTIGATION (2007), http://www2.fbi.gov/ucr/cius2006/data/table_69.html; Table 69: Arrests by State, 2009, FED. BUREAU OF INVESTIGATION (2010), http://www2.fbi.gov/ucr/cius2009/data/table_69.html; Table 4: January to June 2012, Offenses Reported to Law Enforcement by State by City 100,000 and over in Population Illinois Through Missouri, FED. BUREAU OF INVESTIGATION, http://www.fbi.gov/about-us/cjis/ucr/crime-in-the-u.s/2012/preliminary-semiannual-uniform-crime-report-january -june-2012/data-tables/table-4-cuts/table_4_offenses_reported_to_law_enforcement_by_ state_illinois_through_missouri_2012.xls (last visited Apr. 8, 2013).
O'Hear: Mass Incarceration in Three Midwestern States: Originas and Tren
Produced by The Berkeley Electronic Press, 2013

732 VALPARAISO UNIVERSITY LAW REVIEW [Vol. 47
There is at least one additional potential explanation for why inmate numbers continued to grow and then remained high after first a crime drop and then an arrest drop: once in the system, defendants tended to be treated more harshly than they had been before the crime peak. There is, in fact, some evidence to support the suggestion of longer sentences during this time period. For instance, in 1997, 68% of Indiana inmates had sentences of longer than five years, 38% had sentences of longer than ten years, and 22% had sentences of longer than twenty years.73 By 2012, however, the percentage in each category had grown to 75%, 52%, and 29%, respectively.74
Besides sentencing, another post-arrest stage at which harshness can be ratcheted up is through more rigorous supervision of parolees, and there is some evidence that this has also happened recently in Indiana: between 2007 and 2011, the number of individuals returned to prison for parole violations increased from 2,734 to 8,23175—more than a threefold increase in just four years. During the same time period, new court commitments to prison fell from 14,919 to 9,915.76 Indeed, the drop in new court commitments seems to echo the similarly sized drop in arrests for violent crime that occurred between 2005 and 2008. The data are thus suggestive of a rather straightforward story: declining arrests for serious crime caused a decline in the number of defendants sentenced to prison; officials then offset the reduction in new commitments by drawing back
73 1997 FACT CARD, supra note 69. 74 2012 FACT CARD, supra note 69. 75 Compare E. ANN CARSON & WILLIAM J. SABOL, U.S. DEP’T OF JUST., PRISONERS IN 2011 30 (2012), with HEATHER C. WEST & WILLIAM J. SABOL, U.S. DEP’T OF JUST., PRISONERS IN 2007 17 (2008). 76 Compare CARSON & SABOL, supra note 75, at 30, with WEST & SABOL, supra note 75, at 17.
Valparaiso University Law Review, Vol. 47, No. 3 [2013], Art. 2
http://scholar.valpo.edu/vulr/vol47/iss3/2

2013] Mass Incarceration in Three Midwestern States 733
a growing number of parolees.77 This may be an illustration of Spelman’s observation that correctional systems abhor a vacuum.78
In any event, in addition to the failure of the number of violent-offense inmates to drop, another mystery of the post-1997 period is why the number of “non-violent” inmates grew so dramatically. As Figure 4 indicates, this growth came overwhelmingly in the drug category. But this observation only begs the question of why Indiana now imprisons drug offenders in so much higher numbers than it did fifteen years ago. As noted above, Stuntz argues that the war on drugs is a war on violence by proxy, but it is not clear why Indiana would have ramped up this proxy combat just as violence was falling.79 Moreover, against a backdrop of falling or stable rates of violent crime, the number of inmates convicted of violent crimes stayed constant or rose, which makes it hard to believe that a large share of the drug-convicted inmates were really prosecuted and punished for violent crime—Indiana seemed, if anything, to be growing more aggressive and efficient when it came to punishing violent crime through the traditional means.
The cause of the post-1997 explosion in drug incarceration thus remains uncertain. What seems more certain is that the steady increase in Indiana’s prison population for the past fifteen years has not been driven by violent crime in the same clear, direct way as was the 1974–1997 imprisonment boom.
77 To be sure, a growing number of returns does not necessarily mean that standards were made more rigorous. Indeed, given long-term increases in Indiana’s prison population, one would expect that returns would also increase over time. More prisoners means (eventually) more ex-prisoners being supervised in the community; more supervised people means more violations; and more violations means more returns to prison, even holding supervision standards constant. However, it does not seem likely that a tripling in the number of returns over just four years could be explained in this way; this is a far more dramatic growth rate than had been seen in the size of the prison population. Thus, while releases from prison did increase between 2007 and 2011, the rate of growth was much lower than it was for the returns to prison. Compare CARSON & SABOL, supra note 75, at 30 (showing 16,533 conditional releases in 2011), with WEST & SABOL, supra note 75, at 17 (showing 15,778 conditional releases in 2007). Another possible explanation for the increase in returns would, of course, be a higher frequency of violations by parolees. Again, though, it does not seem likely that parolee behavior would change so dramatically over such a short period of time as to explain entirely the growth in prison returns from 2007 to 2011. 78 Spelman, supra note 2, at 66 (“Like nature, correctional systems nationwide abhorred a vacuum.”). 79 See supra notes 20–25 and accompanying text (noting that the war on drugs is a convenient tool for prosecutors and police officers to arrest violent offenders, making it actually a war on violence by proxy).
O'Hear: Mass Incarceration in Three Midwestern States: Originas and Tren
Produced by The Berkeley Electronic Press, 2013

734 VALPARAISO UNIVERSITY LAW REVIEW [Vol. 47
2. Minnesota
Until recently, as depicted in Figure 7, the Minnesota trends have generally tracked Indiana’s (albeit with a much lower baseline imprisonment level). As in Indiana, the prison population dropped between 1960 and 1973, with most of the decline coming from the category of property offenders. The number of violent-offense inmates held relatively steady over the time period, although even this may be seen as surprising given the contemporaneous increase in the number of reported violent crimes. As noted above, this seems to have been a time when police and prosecutor efficiency dropped,80 perhaps due in part to insufficient capacity to handle crime’s rising tide. Declining clearance and charging rates may partly explain why the number of violent-offense inmates did not rise along with the number of reported violent crimes. Additionally, median sentence lengths and real time served dropped during this time period,81 which likely also contributed to the failure of inmate populations to keep pace with the crime rate.82 80 See supra notes 63–65 and accompanying text (explaining that police efficiency dropped during the 1960–1972 time period in the majority of the offense categories that were reported by the FBI). 81 Compare PRISON STATS 1960, supra note 68, at 59 tbl.p2 & 60 tbl.p3 (showing that in 1960 median maximum sentence for indeterminate sentences in Minnesota was 131.6 months and median time served of inmates was 17.8 months), with NCJI&SS, supra note 68, at 110 tbl.3 (showing that in 1973 median maximum sentence length was eight years (96 months) and median time served was 8.2 months). 82 Why severity decreased is an uncertain matter. This may have reflected changing attitudes toward crime or punishment within the criminal-justice system or in society more generally. However, the apparent decline in severity may also in part reflect the pressures put on the system by the spike in reported violent crime. For instance, docket pressures may have induced prosecutors and/or judges to provide greater sentencing breaks for defendants who pled guilty. (Plea bargaining in this time may also have been spurred on by its first overt endorsement by the U.S. Supreme Court in Brady v. United States, 397 U.S. 742 (1970), by the development of the constitutional right to appointment of counsel for indigent defendants in Gideon v. Wainwright, 372 U.S. 335 (1963), and by the development in cases like Miranda v. Arizona, 384 U.S. 436 (1966), of other new constitutional rights that gave criminal defendants enhanced litigation leverage.) It is less clear why time served would have dropped by an even greater proportion than median sentence length. If prisons were full, there would be reason for parole boards to loosen standards for parole release, but prison populations were less in 1973 than in 1960, which seems inconsistent with the hypothesis that overcrowding drove the drop in average time served. See supra note 69 (illustrating the decrease in prison populations). In any event, it is also possible that declining sentences and/or time served could reflect changing norms in reporting and prosecuting crime. I suggested in Part III above that certain classes of assault or rape incidents might have been increasingly likely to come into the system during the 1960s and 1970s. See supra Part III (providing an overview of prison trends in Indiana, Minnesota, and Wisconsin). Although changing social values might have caused more reporting of such incidents to the police, officials in the system with discretion—prosecutors, judges, parole board members—might have continued to see these crimes as of marginal
Valparaiso University Law Review, Vol. 47, No. 3 [2013], Art. 2
http://scholar.valpo.edu/vulr/vol47/iss3/2

2013] Mass Incarceration in Three Midwestern States 735
Figure 7. NUMBER OF MINNESOTA PRISONERS, BY OFFENSE CATEGORY83
seriousness and not worthy of lengthy prison terms. A flood of cases into the system that were regarded as marginal might help to explain declining average severity. 83 Caution should be used in interpreting the numbers to the extent that they are derived from dissimilar sources. See PRISON STATS 1960, supra note 68, at 58 tbl.p1 (providing Minnesota prison statistics for 1960); see also MINN. DEP’T. OF CORR., CHARACTERISTICS OF INSTITUTIONAL POPULATIONS JULY 1, 1964 TO JUNE 30, 1965, TABLE NUMBER, 34–36 (1966) (explaining the data for 1965). I included both prison and reformatory inmates. I characterized as violent offenses assault, kidnapping, manslaughter, murder, robbery, carnal knowledge, incest, indecent assault, rape, and sodomy. I followed the source’s categorization for property offenses. See MINN. DEP’T. OF CORR., CHARACTERISTICS OF POPULATIONS UNDER SUPERVISION OF THE INSTITUTIONS AND FIELD SERVICES JULY 1, 1969 TO JUNE 30, 1970 109 tbl.139 (1970) (providing criminal statistics of the Minnesota prison population in 1970). I counted as violent the homicides, crimes against person, incest, and sex offenses other than abortion. I placed thefts, forgery, and damage to property in the property category. See NCJI&SS, supra note 68, at 108 tbl.1 & 109 tbl.2 (providing data for 1973). I followed the source’s categorization of offenses as crimes of violence and crimes against property. See MINN. DEP’T. OF CORR., 1979–1980 BIENNIAL REPORT 20 (reporting data for 1980). I counted as violent assault, homicide, kidnapping, robbery, and sex offenses. I counted burglary, forgery, and larceny as property. See State Correctional Facility Populations, MINN. DEP’T. OF CORR., http://www.gda.state.mn.us/cj/doc.html (last visited Jan. 16, 2013) (select “adult” from the age category and “1985” from the designated year, then click the “submit” button; process can be repeated based on the desired year) (providing data for 1985–2000). The 1985 data does not break out drug offenses from “other.” I have estimated the 1985 figure by assuming a linear growth between 1980 and 1989, the closest years to 1985 for which data are available. See also MINN. DEP’T. OF CORR., ADULT INMATE PROFILE AS OF 01/01/2005 1 (2005) [hereinafter AIP 2005] (detailing statistical data for 2005); MINN. DEP’T CORR., ADULT INMATE PROFILE AS OF 01/01/2010 1 (2010) [hereinafter AIP 2010] (publishing correctional data for 2010).
0
2,000
4,000
6,000
8,000
10,000
12,00019
6019
6519
7019
7319
8019
8519
9019
9520
0020
0520
10
OtherDrugPropertyViolent
O'Hear: Mass Incarceration in Three Midwestern States: Originas and Tren
Produced by The Berkeley Electronic Press, 2013

736 VALPARAISO UNIVERSITY LAW REVIEW [Vol. 47
Between 1973 and 1995, the prison population rose dramatically, and, as in Indiana, this growth was driven primarily by defendants convicted of violent crimes. Indeed, the growth in violent-offense inmates (2,108) accounted for more than two-thirds of the overall growth (3,054)—an even larger proportion than in Indiana. Moreover, as in Indiana, there was a large increase in the number of arrests for violent crimes between 1982 and 1995 (153%) that roughly tracks the overall rate of growth in the prison population during the same time period (116%).
The Minnesota story diverges more markedly from the Indiana story after 1995. Even in this more recent time period, growth in the number of violent-offense inmates has remained the leading driver of overall growth in the prison population. As in Indiana, the number of drug-offense inmates has grown markedly in Minnesota since the mid-1990s, but the category has not yet emerged as the preeminent driver of overall growth. Thus, between 1995 and 2010, violent-offense inmates accounted for nearly 40% of the overall growth, as compared to the 27% attributable to drug-offense inmates. Another notable source of recent growth has been DWI-convicted inmates, who rose from 3.7% of the prison population to 7.1% in just five years between 2005 and 2010.
As with Indiana, the continued growth of the violent-offense category presents a puzzle against a backdrop of declining numbers of reported violent crime. Figure 8 depicts these and related trends in more detail.
Figure 8. MINNESOTA VIOLENT CRIME, ARRESTS, AND PRISONERS, 1997=10084
84 See 1982 UCR, supra note 70 (reporting crime and arrest data from the FBI); see also About the Department of Corrections, MINN. DEP’T OF CORR., http://www.doc.state.mn.us/ aboutdoc/stats (last visited Apr. 4, 2013) (providing links to post-2000 prisoner data, which are issued semiannually and published on the Department’s website); supra note 83 and accompanying text (listing prisoner data through 2000). For each year of prison data, the corresponding violent crime and arrest numbers come from the previous year.
050
100150200250300 Violent
CrimesViolentArrestsViolentInmatesOtherInmates
Valparaiso University Law Review, Vol. 47, No. 3 [2013], Art. 2
http://scholar.valpo.edu/vulr/vol47/iss3/2

2013] Mass Incarceration in Three Midwestern States 737
As Figure 8 indicates, the rate and pattern of growth in the violent-offense inmate population have been very similar in Minnesota and Indiana since 1997. The Minnesota data thus begs the same question raised by the Indiana data: Why, fifteen years after violent crime fell, has there still been no drop in the number of prisoners incarcerated for violent crimes? To be sure, the drop in reported violent crime in Minnesota was neither as sharp nor as sustained as it was in Indiana. Indeed, for a time in the mid-2000s, violence crept back up to about mid-1990s levels. On the other hand, and in contrast to Indiana, arrests for violent crime did drop in tandem with reports of violent crime. Part of the explanation for the continued rise in violent-offense inmates in Indiana was that violent-offense arrests increased for another decade after reported violent crime peaked. This sort of arrest-based explanation does not seem viable in Minnesota, at least for the time period before the mid-2000s arrest spike.
In order to account for rising incarceration across a decade of declining arrests, it seems likely that violent-offense suspects, once brought into the system, were treated more harshly at one or more of the subsequent stages of the criminal process. Figure 9 unpacks this a bit, revealing that the size of the Minnesota prison population has risen very closely in tandem with the number of new commitments to Minnesota prisons. If sentence lengths were growing longer, one would expect to see the overall population increasing at a faster rate than the new commitments.85 Thus, the 1997–2012 Minnesota data are consistent with Pfaff’s finding of an admissions-driven imprisonment boom in eleven states between the late 1980s and early 2000s (a data set that included Minnesota, but not Indiana or Wisconsin).86 The data are also consistent with Pfaff’s finding that increased toughness in the exercise of prosecutorial discretion has played a key role in imprisonment growth.87
85 Note, however, that consistent sentencing patterns may nonetheless reflect increased real sentencing severity if the seriousness of the cases diminishes at the same time. There is some reason to think that this may have happened in Minnesota: if the numbers of reported violent crimes and arrests for violent crimes fall, but new commitments to prison continue to increase, then it is possible that the “gap” is being covered by sending some defendants to prison who would have received a probationary sentence at an earlier time. 86 See supra notes 26–33 and accompanying text (arguing that the imprisonment boom was driven by admissions). 87 Alternatively, the data is also consistent with judges imposing prison sentences more aggressively, although it would be surprising if judges were growing more severe in their dispositional decisions (probation versus prison), but not in their durational decisions (length of prison term).
O'Hear: Mass Incarceration in Three Midwestern States: Originas and Tren
Produced by The Berkeley Electronic Press, 2013

738 VALPARAISO UNIVERSITY LAW REVIEW [Vol. 47
Figure 9. MINNESOTA PRISON POPULATION WITH NEW COMMITMENTS AND RETURNS, 1997=10088
One more aspect of Figure 9 bears note: the dramatic growth in the
number of returns to prison for violations of conditions of parole or supervised release. Indeed, the rate of growth in returns was much higher than the rate of growth in new commitments. Between 1997 and 2012, returns grew from less than a quarter of prison admissions to more than one-third. It is not clear why returns grew so much, although to some extent this would be an expected result of long-term increases in the prison population.89 However, the rate of growth in returns over the fifteen-year period was considerably higher than the rate of growth in new commitments to supervised release.90 The increase in returns may thus be due in part to higher rates of violations by supervised individuals and/or enhanced supervisory rigor by criminal-justice officials. As with Indiana, the growth in returns may to some extent reflect Spelman’s dictum about correctional systems and vacuums—tougher supervision helped to ensure that prison capacity remained fully utilized through periods of declining arrests for serious crime.91
3. Wisconsin
As depicted in Figure 10, Wisconsin’s story is a bit different than that of its sister states. In the initial 1960–1975 time period, the number of
88 For the sources of this data, see supra notes 83 and 84. Note that, for each year, the population is calculated as of January of that year, and the new commitments and returns are for the just-ended calendar year. 89 See supra notes 83–84 (providing annual trends on prison population in the Midwest). 90 In 2011, the number of commitments to supervised release was about 2.4 times higher than it had been in 1996, but the number of returns to prison was about 3.3 times greater. 91 See generally Part II.D (outlining Spelman’s arguments concerning rising prison populations).
050
100150200250300350
NewCommitmentsReturns
Population
Valparaiso University Law Review, Vol. 47, No. 3 [2013], Art. 2
http://scholar.valpo.edu/vulr/vol47/iss3/2

2013] Mass Incarceration in Three Midwestern States 739
violent-offense inmates in Wisconsin actually doubled, in contrast to the relative stability of this population in the other two states. It thus seems that Wisconsin was able to respond more rapidly to the pre-1975 rise in violent crime, whether due to more excess capacity at the start of the crime wave, faster expansion of capacity once the crime wave was underway, or something else. However, even as the violent-offense population exploded, the property-crime population held steady. Thus, in all three states, the 1960s and early 1970s were a time period in which the relative size of the violent-offense population grew substantially and eventually surpassed the size of the property-offense population—a pattern that seems to reflect a reorientation of the state criminal-justice systems away from property crime and toward violent crime in response to the wave of violence that peaked in the mid-1970s.92
92 Wisconsin’s median sentence length and time-served numbers grew during this time period, which helped the state to avoid the overall drop in imprisonment experienced in Indiana and Minnesota. Compare PRISON STATS 1960, supra note 68, at 59 tbl.p2 & 60 tbl.p3 (showing that in 1960 median sentence was 51.7 months and median time served was 9.4 months), with NCJI&SS, supra note 68, at 214 tbl.3 (showing that in 1973 median maximum sentence length was 5.5 years (66 months) and median time served was twelve months). It is not clear whether these changes reflect real increases in severity or the changing composition of the inmate population (many more violent offenders relative to property).
O'Hear: Mass Incarceration in Three Midwestern States: Originas and Tren
Produced by The Berkeley Electronic Press, 2013

740 VALPARAISO UNIVERSITY LAW REVIEW [Vol. 47
Figure 10. NUMBER OF WISCONSIN PRISONERS, BY OFFENSE CATEGORY93
93 Caution should be used in interpreting the numbers to the extent that they are derived from dissimilar sources. See Prison Stats 1960, supra note 68, at 58 tbl.P1 (providing Wisconsin data for 1960). See generally WIS. STATE DEP’T OF PUB. WELFARE, ADULT OFFENDERS IN DIVISION OF CORRECTIONS ADULT INSTITUTIONS (1965). As violent crimes, I counted murder, manslaughter, robbery, assault, rape, indecent behavior with child, statutory rape, and other sex offenses. For property crimes, I counted burglary, thefts, auto theft, fraud, embezzlement, forgery, and bad checks. I did not include inmates in the “juvenile delinquency” category. See generally WIS. DIV. OF CORR., OFFENDERS RESIDENT IN WISCONSIN ADULT CORRECTIONAL INSTITUTIONS ON DECEMBER 31, 1970 WITH FIVE-YEAR TRENDS FOR 1966–1970 (1971) (providing data for 1970); WIS. DIV. OF CORR., RESIDENTS IN WISCONSIN ADULT CORRECTIONAL INSTITUTIONS ON JUNE 30, 1975 (WITH FIVE-YEAR TRENDS FOR 1971–1975) 6–7 tbl.3 (1976) (providing data for 1975). For these sources, I used the same categorization criteria as for the 1965 source. See WIS. DIV. OF CORR., RESIDENTS IN WISCONSIN ADULT CORRECTIONAL INSTITUTIONS AND COMMUNITY CORRECTIONAL RESIDENTIAL CENTERS ON DECEMBER 31, 1979 WITH FIVE-YEAR TRENDS FOR 1975–1979 13–14 tbl.5 (1980) (providing data for 1980). I used the same categorization criteria as for the 1965 source, but some additional crimes are listed in 1980. I counted the battery and injury offenses as violent. I counted receiving stolen property, transfer of encumbered property, and arson as property. See WIS. DIV. OF CORR., RESIDENTS IN WISCONSIN ADULT CORRECTIONAL FACILITIES ON JUNE 30, 1986 WITH FIVE-YEAR TRENDS FOR 1982–1986, 8–11 tbl.3 (1987) (providing data for 1985). I used the same categorization criteria as for the 1980 source, but some additional crimes are listed in 1985. I counted mayhem and endangering safety as violent. I counted “other non-assaultive sex offenses” as “other.” I counted extortion as property. See WIS. DEP’T OF CORR., RESIDENTS IN WISCONSIN ADULT CORRECTIONAL FACILITIES ON JUNE 30, 1990 8–13 tbl.4 (1991) (providing data for 1990). This 1990 source presents the data differently than the previous sources. I counted all inmates with sex or assault convictions as violent. For my drug category, I counted the inmates with drug convictions exclusively. Thus, the twenty-seven inmates categorized by the source as “assault and drugs” are included in my “violent” count, but not my “drug” count. See WIS. DEP’T OF CORR., SPREADSHEET OF CORRECTIONS FOR 1995–2008 (on file with author) (providing data for 1995–2008). This spreadsheet uses the same categorization methodology as the 1990 source. For each year, I used the mid-year (June 30) count. I did not count “unsentenced” inmates at all. See infra note 98 (defining the term “unsentenced”).
0
5,000
10,000
15,000
20,000
25,000
1960
1965
1970
1975
1980
1985
1990
1995
2000
2004
2008
OtherDrugPropertyViolent
Valparaiso University Law Review, Vol. 47, No. 3 [2013], Art. 2
http://scholar.valpo.edu/vulr/vol47/iss3/2

2013] Mass Incarceration in Three Midwestern States 741
Between 1975 and 1995, Wisconsin’s violent-offense population grew at an even faster rate than during the first period, accounting for a full three-quarters of the overall growth in the state’s prison population—the largest such share among the three states. As in the other two states, this period saw a large increase in the number of violent-offense arrests (up 127% from 1982 to 1995), and the size of this increase closely tracked the overall growth in the state’s prison population (138% over the same thirteen years).
Since 1995, and to a much greater extent than in the other two states, violent crime has continued to drive growth in Wisconsin’s imprisoned population. Between 1995 and 2008, growth in the violent-offense population accounted for more than 60% of the overall growth. Figure 11 details trends in the more recent period.
Figure 11. WISCONSIN VIOLENT CRIME AND PRISONERS, 1996=10094
Once again, we have a mystery in the failure of the violent-offense
population to drop over a decade or so of declining rates of reported violent crime. There are some unfortunate gaps in the Wisconsin arrest 94 For each year of prison data, the corresponding violent crime number comes from the previous year. See Estimated Crime in Wisconsin, FED. BUREAU OF INVESTIGATION (last updated Mar. 29, 2010), http://ucrdatatool.gov/Search/Crime/State/StatebyState.cfm?No Variables=Y&CFID=18907905&CFTOKEN=36346d7267ad2b83-A8406417-DB8C-67B7-3939 F19D8BE0D58B (choose the “Wisconsin” and “number of violent crime” options and then submit query) (stating the crime data from 1996–2008). Prisoner data are courtesy of the Wisconsin Department of Corrections. See supra note 93 (noting the statistical publications used for Figure 10).
O'Hear: Mass Incarceration in Three Midwestern States: Originas and Tren
Produced by The Berkeley Electronic Press, 2013

742 VALPARAISO UNIVERSITY LAW REVIEW [Vol. 47
data, but, from what is available, it does not appear that Wisconsin followed Indiana’s pattern of sharply increased violent-crime arrests even as reported violent crime dropped. For instance, between 1996 and 2005, a low point for violent crime, the arrests also dropped from 9,335 to 4,240. By 2008, with violent crime back up again, the arrest number was still below the 1996 baseline at 8,050.
Thus, as in Minnesota, it seems likely that the growing size of the violent-offense population is due, at least in part, to greater severity at some post-arrest stage of the criminal process. Sentencing may be a significant culprit here, with average sentence lengths for inmates increasing between 1995 and 2008 for all six offense categories tracked by the Wisconsin Department of Corrections.95 For instance, in the most numerous category, assaults (accounting for more than one-third of Wisconsin inmates in 2008), the average sentence rose by 39%.96
Figure 12 further unpacks incarceration trends over just the past decade. In essence, releases from prison grew rapidly in number even as admissions to prison and average sentence length remained relatively steady. Working alone, these trends would tend to push the overall population down, but they were almost exactly offset by an increase in returns to prison, which ensured that the overall population would remain relatively flat. As in Indiana and Minnesota, the rate of growth in returns far outpaced the rate of growth in releases, which suggests a toughening of the requirements and/or supervision for the releases. Toward the end of the period, admissions did rise again, but this was conveniently offset by a sharper increase in releases and a drop in average sentence length, even as the rate of returns leveled off. Wisconsin thus seems to have achieved a stable equilibrium in its overall prison population, but this stability on the surface masks a more dynamic interplay of the underlying drivers of imprisonment. These patterns again seem consistent with the idea that corrections capacity, once created, will be filled by one means or another.97
95 The data were provided in the form of a spreadsheet on file with the author. 96 This presumably counts both the period of initial confinement and the period of “extended supervision” that Wisconsin judges also mandate at sentencing. See generally Thomas J. Hammer, The Long and Arduous Journey to Truth-in-Sentencing in Wisconsin, 15 FED. SENT’G REP. 15 (2002) (providing a description of the Wisconsin sentencing system). 97 Wisconsin’s capacity remained essentially unchanged between 2003 and 2010. Compare CHRISTINA D. CARMICHAEL, WIS. LEGIS. FISCAL BUREAU, ADULT CORRECTIONS PROGRAM 12 tbl.5 (2003) [hereinafter FISCAL BUREAU 2003] (showing the 2003 Wisconsin corrections operating capacity as 18,655, including capacity acquired through contract), with CHRISTINA D. CARMICHAEL, WIS. LEGIS. FISCAL BUREAU, ADULT CORRECTIONS PROGRAM 5 tbl.1 & 2 (2011) [hereinafter FISCAL BUREAU 2011] (showing for 2010 operating capacity of state-run institutions at 17,590, plus 955 contracted-for beds, for a total capacity of 18,585).
Valparaiso University Law Review, Vol. 47, No. 3 [2013], Art. 2
http://scholar.valpo.edu/vulr/vol47/iss3/2

2013] Mass Incarceration in Three Midwestern States 743
Figure 12. MOVEMENT IN AND OUT OF WISCONSIN PRISONS, 2002=10098
C. Conclusions: Imprisonment and Violence
Although its precise length and magnitude may be uncertain, there can be little doubt that a sizeable wave (or waves) of violent crime swept over Indiana, Minnesota, and Wisconsin between the 1960s and the 1990s. It also seems reasonably clear that this violence fueled much of the post-1960s imprisonment boom in the three states. In all three, 98 See FISCAL BUREAU 2011, supra note 97, at 10, 38 app.VI, 39 app.VII, 40 app.VIII (noting the average sentence length, inmate population, admissions, and releases of Wisconsin); see also CHRISTINA D. CARMICHAEL, WIS. LEGIS. FISCAL BUREAU, ADULT CORRECTIONS PROGRAM 10, 39 app.VI, 40 app.VII, 41 app.VIII (2009) [hereinafter FISCAL BUREAU 2009] (providing data on the average sentence length, inmate population, admissions, and releases); CHRISTINA D. CARMICHAEL, WIS. LEGIS. FISCAL BUREAU, ADULT CORRECTIONS PROGRAM 12, 40 app.VI, 41 app.VII, 42 app.VIII (2007) [hereinafter FISCAL BUREAU 2007] (publishing statistics on the average sentence length, inmate population, admissions, and releases); CHRISTINA D. CARMICHAEL, WIS. LEGIS. FISCAL BUREAU, ADULT CORRECTIONS PROGRAM 13, 36 app.VI, 37 app.VII, 38 app.VIII (2005) [hereinafter FISCAL BUREAU 2005] (noting the average sentence length, inmate population, admissions, and releases); FISCAL BUREAU 2003, supra note 97, at 5, 36 app.V, 37 app.VI, 38 app.VII (supplying data on the average sentence length, inmate population, admissions, and releases). Inmate populations are as of July 1 of the year in question. The other data are two-year totals. For instance, the 2002 figure for releases represents the total number of releases for 2001 and 2002. “Sentences” means average sentence length for new male prisoners admitted in the two-year period. Female sentence lengths tend to be lower, but follow similar trends. “Admissions” excludes inmates categorized in the reports as “unsentenced.” The unsentenced population is comprised of “individuals who are alleged to have violated their probation, parole, or extended supervision and offenders serving time in prison as an alternative to the revocation of probation, parole, [or] extended supervision.” FISCAL BUREAU 2003, supra note 97, at 5. It is this population that I am characterizing as the “returns” group.
0
50
100
150
200
250
300
2002 2004 2006 2008 2010
InmatesAdmissionsReturnsReleasesSentences
O'Hear: Mass Incarceration in Three Midwestern States: Originas and Tren
Produced by The Berkeley Electronic Press, 2013

744 VALPARAISO UNIVERSITY LAW REVIEW [Vol. 47
property crime accounted for a majority of prison inmates in 1960. Within fifteen years, violent crime had surpassed property crime as the leading source of prisoners, and violent crime remains the largest source to this day. The long-term, if rough, concordance between the increases in violent crime, arrests for violent crime, imprisonment for violent crime, and overall imprisonment make it hard to avoid the conclusion that the late twentieth-century crime wave played an important causal role in the growth of prison populations.
To be sure, Table 2 demonstrates that imprisonment rates do not respond immediately or precisely to changes in the rates of reported violence. Much of the disconnect can be accounted for by capacity constraints and inertia: it takes time for the system to build imprisonment (as well as apprehension and conviction) capacity in the face of a crime wave; then, once the capacity is built, there seems to be a tendency toward full utilization even after the crime wave subsides. The prisoner composition data suggest at least three ways that this may happen: tougher supervision of parolees, longer sentences, and a shift of criminal-justice attention to nontraditional offense categories, such as drugs and DWI. These sorts of phenomena have become more prominent drivers of imprisonment growth in the three states since the mid-1990s. Yet, even in this later period, violent crime still seems of critical importance in at least two respects. First, the number of inmates incarcerated for violent crimes has continued to grow in all three states, even if not as quickly as before. Second, it was the violent-crime wave that fueled a vast expansion of criminal-justice capacity in the late twentieth-century—capacity that can now be utilized to respond to quite different sorts of offenses.
To assert that the crime wave played an important causal role in driving the imprisonment boom is not to say that mass incarceration was inevitable. Faced with a rising tide of violence, the three states chose, in some sense, to increase criminal-justice capacity so as to restore something like the per-crime penal severity that existed prior to the crime wave. As a crude measure, consider this: in 1960, Indiana imprisoned 1.4 people for every violent crime; forty-five years later, after settling into a period of post-peak stability, the number of violent crimes was about five times higher than it had been in 1960 and so was the number of prisoners, with the ratio standing at 1.3 per violent crime. The restoration of this balance did not just happen; it required social decisions to build a lot more prison capacity and to establish the sort of legal and institutional framework that was necessary to effectuate a huge increase in arrests, convictions, and prison sentences. In principle, different decisions might have been made. For instance, Indiana might
Valparaiso University Law Review, Vol. 47, No. 3 [2013], Art. 2
http://scholar.valpo.edu/vulr/vol47/iss3/2

2013] Mass Incarceration in Three Midwestern States 745
have decided instead to ride out the crime wave with its existing criminal-justice capacity, implicitly accepting for a time the system of relative lenience that had emerged by 1975 (only 0.2 prisoners per violent crime). Or, rather than devoting ever-increasing resources to the criminal-justice system, Indiana could have chosen to respond to the crime wave by directing those same resources to education, addiction treatment, or other social programs that plausibly address the root causes of crime.
Thus, in and of itself, the violence surge did not logically require mass incarceration. However, as Stuntz suggests, it may be true that mass incarceration was inevitable when a crime wave emerged against the backdrop of certain political, legal, and institutional arrangements that had developed across the United States by the 1970s.99 Indeed, it is hard to avoid some sense of inevitability when one appreciates the extent to which mass incarceration hit not only high-crime, conservative Indiana, but also lower-crime, liberal Minnesota and Wisconsin.
Despite broad similarities, however, the three states have not followed precisely the same paths. To again use a crude measure, in 2005 both Minnesota and Wisconsin still had prisoner-to-violent-crime ratios that were much lower (i.e., more lenient) than in 1960.100 One particularly important area of differences has been in the war on drugs, the subject to which I turn next.
IV. WAR ON DRUGS
Michelle Alexander contends that violence is a red herring; drug enforcement has been the real driver of mass incarceration. Her characterization of the role of violence does not seem consistent with the three states’ data. How about her view of the role of drug enforcement?
As indicated in Figures 4, 7, and 10, there is an important timing problem for the drug-driver thesis: the post-1975 imprisonment boom had already been underway for a long time before drug offenders began to register as a significant share of the inmate populations. Figure 13 pulls the data together from the three states. Although the Indiana data are sketchy (not beginning until 2000 on the graph), it is clear that in the other two states the drug offenders remained a very small part of the prison population (five percent or less) a full decade into the era of mass incarceration. Even two decades in (1995), the numbers barely topped 99 See supra notes 15–25 and accompanying text (providing a summary of Stuntz’s arguments concerning mass incarceration). 100 Minnesota’s ratio fell from 1.4 to 0.6, while Wisconsin’s fell from 2.2 to 1.7. The 2005 figures, however, still represent a substantial rebound from 1975, when Minnesota’s ratio stood at 0.2 and Wisconsin’s at 0.4.
O'Hear: Mass Incarceration in Three Midwestern States: Originas and Tren
Produced by The Berkeley Electronic Press, 2013

746 VALPARAISO UNIVERSITY LAW REVIEW [Vol. 47
10%. Thereafter, the Minnesota (but not the Wisconsin) percentage rose sharply for a decade, but topped out at about one-quarter of the prison population. Wisconsin topped out at about 15%.
Figure 13. DRUG OFFENDERS AS A PERCENTAGE OF INMATE POPULATION101
The Indiana story, while not as complete, does not seem inconsistent
with that of the other two states. In 1974, on the eve of the imprisonment boom, only 6.5% of imprisoned Hoosiers were doing time for drug offenses.102 By 1997, more than two decades into the imprisonment boom, the number had risen only to 14.2%,103 which was about the same level that Minnesota and Wisconsin hit in 2000. By 2010, Indiana’s percentage was the largest, but still below one-quarter.
In short, most of the imprisonment growth associated with the era of mass incarceration (i.e., the growth from 1975 to 1995) was achieved with little direct contribution from the war on drugs. While the drug-offense
101 Sources are the same as for figures 4, 7, and 10, except that 2005 Wisconsin data comes from WIS. DEP’T. OF CORR., WIS. DIVISION OF ADULT INSTITUTIONS: FY05 PROFILE 2 (2006), and 2010 Wisconsin data comes from FISCAL BUREAU 2011, supra note 97, at 38 app.VI. 102 INDIANA DEP’T OF CORR., supra note 69 (providing statistical information from 1974). 103 See 1997 FACT CARD, supra note 69 (providing Indiana incarceration statistics for 1997).
0
5
10
15
20
25
30
1975 1980 1985 1990 1995 2000 2005 2010
INMNWI
Valparaiso University Law Review, Vol. 47, No. 3 [2013], Art. 2
http://scholar.valpo.edu/vulr/vol47/iss3/2

2013] Mass Incarceration in Three Midwestern States 747
populations became considerably more prominent after the violent crime drop of the late 1990s, they remain smaller than the violent offense populations to this day, and now even seem to be declining as a percentage of the overall prison population in Minnesota and Wisconsin. This is not a picture of an imprisonment boom driven by drug enforcement, except perhaps to a limited extent in Indiana and Minnesota from the mid-1990s to the mid-2000s.
To be sure, drug enforcement may also fuel imprisonment indirectly. Drug arrests may lead to revocations of probation or parole. Drug convictions, even if they do not lead immediately to sentences of imprisonment, become a permanent part of an offender’s criminal history and may be used as a basis for imposing more severe sentences in later cases. (This criminal history may also carry crimogenic collateral consequences, e.g., by making it much harder for the offender to obtain regular employment.) Drug arrests also lead to fingerprinting and other police records that can be used to facilitate apprehension and conviction in other cases.104 A drug conviction can later be used to impeach the defendant in another case, giving the prosecutor a litigation (and hence a plea-bargaining) advantage.105
These kinds of indirect effects are difficult to measure, but we may get some sense of their importance by examining arrest data. Figure 14 presents the data in four-year intervals from 1991, which is when the FBI began reporting state-by-state drug arrest numbers. (Note that Wisconsin data are unavailable for 1999.)
104 See ZIMRING, supra note 57, at 122–23 (describing New York Police Department strategy of using misdemeanor marijuana arrests as a pretext for obtaining fingerprints of individuals who fit profile for robbery or burglary). 105 See id. Additionally, drug charges can be appended to more serious charges, thus potentially boosting punishment for individuals who show up as violent offenders in my count, which is based only on the most serious offense of conviction.
O'Hear: Mass Incarceration in Three Midwestern States: Originas and Tren
Produced by The Berkeley Electronic Press, 2013

748 VALPARAISO UNIVERSITY LAW REVIEW [Vol. 47
Figure 14. ANNUAL DRUG ARRESTS IN FOUR-YEAR INTERVALS, 1991–2011106
As indicated in the graph, drug arrests rose sharply across the 1990s, and net growth continued thereafter in Indiana and Wisconsin (but not Minnesota). As a quick comparison with Figures 4, 7, and 10 will reveal, the number of drug arrests each year is considerably higher than the number of drug-convicted prisoners. Thus, the increased intensity in drug enforcement since 1991 has produced thousands of additional drug arrests each year that do not result directly in imprisonment but that undoubtedly have an indirect, downstream impact on imprisonment rates.
But the spike in drug arrests must be kept in perspective. Drug arrests (like arrests for violent crime) have remained a small percentage of overall arrests. Figure 15 offers Indiana as an illustration. Drug arrests would appear no more prominent in similar graphs of the Minnesota or Wisconsin arrest data. If the idea is that arrests for nonviolent crimes can in subtle, indirect ways contribute to subsequent imprisonment for violent crimes, it is not immediately clear why drug arrests, in particular, should be seen as playing a leading role in driving this phenomenon.
106 See generally supra note 55 and accompanying fig.1 (providing arrest data from 1991–2011).
Valparaiso University Law Review, Vol. 47, No. 3 [2013], Art. 2
http://scholar.valpo.edu/vulr/vol47/iss3/2

2013] Mass Incarceration in Three Midwestern States 749
Figure 15. ARRESTS IN INDIANA AT FOUR-YEAR INTERVALS, 1991–2011107
Then, too, there is the question of whether the stepped up drug enforcement activity should be seen as a “war on drugs” at all. Stuntz has argued (convincingly, I think) that the national patterns in drug enforcement cannot be reconciled with the notion that drug enforcement is genuinely intended to address the nation’s drug problems per se.108 So, what is the war on drugs really about?
Stuntz contends, of course, that the war on drugs is really a war on violence by proxy. This account seems a plausible enough explanation for rising rates of drug arrests and drug incarceration during the violence spike that occurred between the mid-1980s and mid-1990s. Indeed, as Figures 1 and 13 reveal, the violence spike coincides neatly with a sharp increase in the relative size of the drug-offense portion of the inmate populations.109 However, Stuntz’s account seems less persuasive when one focuses on the continued rise of drug arrests and drug incarceration after violence subsided in the mid-1990s. To be sure, we must be careful about assuming directions of causation. It seems
107 See supra note 72 and accompanying fig.6 (referencing a table that was generated by the author representing arrest data from Table 69 of the Uniform Crime Reports for the years 1995–2011, as well as Table 68 of the Uniform Crime Reports for 1991). 108 STUNTZ, supra note 2, at 272–73. 109 One may wonder, though, why drug enforcement did not play a more prominent role in the response to the violence spike of the 1970s. It does take time, however, to build capacity to fight a war on drugs. Elsewhere, for instance, I have described how innovations in federal forfeiture law in the 1980s led to a flood of new resources for state and local drug enforcement. Michael M. O’Hear, Federalism and Drug Control, 57 VAND. L. REV. 783, 815–20 (2004).
0
50,000
100,000
150,000
200,000
250,000
Total Arrests
ViolenceArrestsDrug Arrests
O'Hear: Mass Incarceration in Three Midwestern States: Originas and Tren
Produced by The Berkeley Electronic Press, 2013

750 VALPARAISO UNIVERSITY LAW REVIEW [Vol. 47
likely that violence was driven down in the late 1990s, at least in part, because the intensity of drug enforcement continued to climb.110 But, even at that, once violence settles into a new, lower equilibrium, drug enforcement should eventually deescalate (or at least level off) if the war on drugs really is just a war on violence by proxy. As suggested above, the post-1997 Indiana data seems particularly hard to square with the Stuntzian view.111 Minnesota and Wisconsin present less of a difficulty, since the violence drop in those two states was less sharp and sustained than it was in Indiana. Indeed, Figures 13 and 14 suggest that drug enforcement in both states peaked in the mid-2000s, which was roughly contemporaneous with a temporary resurgence of violent crime; when violence subsequently dropped, so did the intensity of drug enforcement.
But Stuntz’s account is certainly not the only facially plausible one based on national data. Alexander, for instance, sees the war on drugs as an expression of racial bias.112 In much the same spirit, Heather Ann Thompson argues that the war on drugs was part of a broader process of “criminalization of urban spaces of color” in response to the civil rights movement of the 1950s and 1960s.113 She analogizes this process to the criminalization of rural spaces of color that occurred in the South in response to the Civil War and Reconstruction114—shades of Alexander’s famous characterization of the war on drugs as the “new Jim Crow.” And there can’t be any serious question that the war on drugs has had a greatly disproportionate impact on the residents of poor, minority, inner-city neighborhoods relative to their rates of drug use and dealing.115 This fact, however, is not inconsistent with Stuntz’s view; as Stuntz argues, the communities particularly targeted by the war on drugs are also high-violence communities.116
The implicit debate over motive (control of violence versus control of people of color) defies easy resolution, and it seems likely that there is a measure of truth in both positions. In any event, at least one additional account of the war on drugs is suggested by the three states data, an
110 See Ilyana Kuziemko & Steven D. Levitt, An Empirical Analysis of Imprisoning Drug Offenders, 88 J. PUB. ECON. 2043, 2045 (2004) (concluding, based on econometric analysis, that rise in drug imprisonment likely contributed to reduction in violent crime). 111 See generally supra Part III.B.1 (noting how Stuntz’s theory is not accurate in regards to Indiana because inmate population increased steadily after the 1997 increase in enforcement). 112 See supra text accompanying notes 7–14 (discussing Alexander’s race-based theory). 113 Thompson, supra note 56, at 706–07. 114 Id. at 706. 115 Id. at 708–09. 116 STUNTZ, supra note 2, at 272.
Valparaiso University Law Review, Vol. 47, No. 3 [2013], Art. 2
http://scholar.valpo.edu/vulr/vol47/iss3/2

2013] Mass Incarceration in Three Midwestern States 751
account rooted in Spelman’s observation about the seemingly inevitable utilization of all available corrections capacity. Although this tendency did not likely play an important role in the early stages of the war on drugs, it may provide an important explanation for the continued expansion of the war on drugs after the crime decline of the mid to late-1990s. My analysis of the post-1997 data has already suggested as much.117 For police, prosecutors, and other criminal-justice officials looking to stay busy and justify their positions in the wake of a drop in “real crime,” drug enforcement must appear a fairly attractive option. There is no shortage of offenders to nab, and, as Stuntz suggests, the easy nature of the cases helps to ensure an impressive and gratifying winning percentage.118 So much the better if one’s efforts are directed at individuals who seem likely to be involved with “real crime” too.119
In sum, the war on drugs seems to have played a modest, but not trivial, role in the imprisonment boom, especially after the mid-1990s and more so in Indiana and Minnesota than Wisconsin. This role has likely included not only the direct imprisonment of a growing number of offenders on drug charges in all three states, but also the production of a variety of imprisonment-fueling indirect effects. What remains deeply uncertain is the extent to which the war on drugs ought to be regarded as a distinct criminal-justice (or social-control) phenomenon in its own right and to what extent it should instead be seen as an adjunct to the war on violence.
V. CONCLUSION
My analysis of mass incarceration in Indiana, Minnesota, and Wisconsin has largely been framed as an assessment of whether Alexander’s or Stuntz’s account of the national imprisonment boom better fits the data from these three specific states. Alexander is skeptical that violence actually explains mass incarceration, while Stuntz believes that a protracted national crime wave made the “punitive turn” inevitable. The three states’ data seems more consistent with Stuntz’s view that violent crime was a major—perhaps the major—driver of mass incarceration. Alexander’s competing hypothesis “that arrests and convictions for drug offenses—not violent crime—have propelled mass incarceration” finds less support in the experience of the three states
117 See, e.g., supra text following note 98 (illustrating that the average sentence in Wisconsin has risen considerably over time). 118 STUNTZ, supra note 2, at 270–71. 119 See ZIMRING, supra note 57, at 123–25 (describing a “very close fit” between demographic characteristics of individuals arrested by the New York Police Department on misdemeanor marijuana charges and individuals arrested for robbery or burglary).
O'Hear: Mass Incarceration in Three Midwestern States: Originas and Tren
Produced by The Berkeley Electronic Press, 2013

752 VALPARAISO UNIVERSITY LAW REVIEW [Vol. 47
under review here.120 While the war on drugs has in recent years played an increasingly important (if still well short of dominant) role in driving incarceration, the number of inmates imprisoned on drug charges started from a very low baseline and did not begin to move up decisively until the imprisonment boom was well underway.
These conclusions are not intended to be anything like a thoroughgoing repudiation of Alexander’s work. For one thing, they are limited to just three Midwestern states. For another, my focus has been on what drives the size of prison populations, while Alexander engages more generally with all manner of negative encounters with the criminal-justice system and their collateral consequences.121 It may be, even in my three states, that drug enforcement plays a much more important role than violent crime in drawing people into the clutches of the system and subjecting them to various forms of injury or insult—the system is clearly capable of damaging a much wider set of individuals than just those whom it imprisons. Finally, Alexander’s work performs a valuable function in highlighting the way that the criminal-justice system reinforces established patterns of socioeconomic disadvantage. One may agree with Stuntz that violent crime was a primary cause of mass incarceration, but also believe that mass incarceration was a misguided, unnecessary, and perhaps even malicious response to a real social problem.
In any event, if the three states’ data seem to support Stuntz’s emphasis on violent crime, they also suggest some qualification to some of his claims. For instance, as noted above, the post-1997 Indiana experience suggests that the war on drugs story may be more complicated, at least in some states at some times, than Stuntz indicates.122
Likewise, Stuntz may oversimplify in claiming that, in the 1960s, the nation “abandon[ed] all serious effort at crime control[.]”123 During this time of supposed “abandonment,” Wisconsin doubled its number of prisoners incarcerated for violent crimes. Meanwhile, Indiana and Minnesota held their violent-offense populations steady, even while drastically reducing their numbers of incarcerated property offenders, which seems a responsible reordering of priorities as the criminal-justice capacity struggled to keep pace with the accelerating crime wave.
Similarly, Stuntz depicts state officials as almost hopelessly at the mercy of local criminal-justice actors, who have wide discretion in
120 ALEXANDER, supra note 2, at 102. 121 See, e.g., id. at 74–78 (discussing violent drug raids by SWAT teams). 122 See supra notes 78–79 and accompanying text. 123 STUNTZ, supra note 2, at 252.
Valparaiso University Law Review, Vol. 47, No. 3 [2013], Art. 2
http://scholar.valpo.edu/vulr/vol47/iss3/2

2013] Mass Incarceration in Three Midwestern States 753
deciding how many offenders to send to prison. At the start of the crime-wave period, however, state-level control over parole release gave state officials the power to control the rate of growth of their prison populations.124 Later on, discretionary parole was abandoned, which did give local officials more effective power over incarceration rates—recall Spelman’s finding about the importance of truth-in-sentencing laws as a predictor of prison growth.125 Yet, even in a truth-in-sentencing environment, the recent three states’ data seem to highlight the malleability of revocation numbers; this may provide an important additional lever of state control to counterbalance local power over imprisonment, and complements Spelman’s findings about the importance of state-level fiscal and correctional capacity as determinants of incarceration rates.126
124 See Michael M. O’Hear, Beyond Rehabilitation: A New Theory of Indeterminate Sentencing, 48 AM. CRIM. L. REV. 1247, 1248 (2011) (describing national movement away from discretionary parole between 1970 and 2000). 125 Spelman, supra note 2, at 57. 126 Id. at 58.
O'Hear: Mass Incarceration in Three Midwestern States: Originas and Tren
Produced by The Berkeley Electronic Press, 2013