markets efficiency and behavioral biases during the u.s
TRANSCRIPT

Journal of Finance and Accountancy Volume 26
Markets Efficiency and Behavioral Biases, Page 1
Markets Efficiency and Behavioral Biases during the U.S. Financial
Crisis of 2008
Cristiano Manfre Pepperdine University
ABSTRACT
The Article investigates markets performance during the U.S. financial crisis of 2008. Specifically, we examined capital market efficiency and the reaction to good and bad news from 2006 through 2010 in order to test our hypothesis that before, during and after the crisis the market remained relatively efficient and the reaction to good and bad news continued to be consistent throughout the entire period. Such hypothesis was rejected, as our findings indicate that the markets did depart from EMH in a meaningful way, as we identified clear signs of asymmetrical reaction to news during different periods. Keywords: Behavioral, Finance, Crisis, Market, Efficiency Copyright statement: Authors retain the copyright to the manuscripts published in AABRI journals. Please see the AABRI Copyright Policy at http://www.aabri.com/copyright.html

Journal of Finance and Accountancy Volume 26
Markets Efficiency and Behavioral Biases, Page 2
1. INTRODUCTION
Many articles have attempted to explain the genesis of the financial crisis of 2008 or its effects to the real economy in triggering a global crisis and the Great Recession. The focus of this article, however, is not on the root causes of the financial crisis of 2008, but rather on the performance of capital markets once the crisis unfolded and whether such performance was in accordance with rational expectations and the Efficient Market Hypothesis, (“EMH”). For this purpose, we specifically tested both the weak version and the semi-strong version of the EMH. In the first instance, we verified whether the returns of financial time series were explained in a meaningful way by past returns and market behavior did resemble the pattern of the Brownian motion. With respect to the semi-strong version, where capital market prices are supposed to reflect historical information as well as new publicly available information, we examined the reaction to new information.
Since the early ’70, but at an increasing pace during the last 20 years, behavioral finance literature has suggested that it is possible that investors are influenced by psychological biases. Some of the most common biases include loss aversion, anchoring, confirmation bias, cognitive dissonance and over-optimism among others. Inefficiencies could also arise from incorrect mental models, incentive problems or difficulties in translating uncertainty into risk. Adding to the vast literature in behavioral finance, in this article we tested a few hypotheses with respect to market efficiency and reaction to news during the last U.S. Subprime financial crisis in order to understand whether markets became naïve during the crisis. Our findings suggest that instead of reestablishing market efficiency after a period of ‘irrational exuberance,’ quite contrary to conventional wisdom, the financial crisis itself represented a market ‘bubble,’ perhaps negative, in part fueled by behavioral biases. For this purpose, we used financial instruments from the equity and debt markets as dependent variables, and proxies for news and announcements as binary independent variables.
Our results indicate that during the crisis, markets departed from the weak version of EMH and did react to different types of news asymmetrically, where investors were paying more attention to bad news than good news. We opine that investors’ lopsided attention to bad news could have accentuated the market downturn during the crisis similar to what happened during other crisis like the European crisis of 2009 (see our study on the Italian crisis 2009-2013) while prolonging the decline and in some instances even pushing stocks and bonds below their fundamental value and the q-ratio in some cases. We observe that once a climate of optimism started to prevail again and the situation normalized, markets became less sensitive to bad news and started paying more attention again to good news.
The possibility of more attention to negative news during the crisis or under-reaction and overreaction to reliable news, can support prospect theory according to which investors would value gains and losses differently.1 Tversky and Kahneman argue that losses cause greater emotional impact on an individual than an equivalent amount of gains, so that if an investor is presented with two choices that provide the same expected utility, he/she will be more likely to
1 The theory was proposed for the first time in 1979, and then further developed in 1992 by Daniel Kahneman and Amos Tversky. Prospect theory suggests that decisions would deviate from what indicated by the expected utility theory since the weights are not the same as the true probabilities and utilities are assessed with a value function that considers a reference point that is determined by the subjective feelings of the individual investor each time.

Journal of Finance and Accountancy Volume 26
Markets Efficiency and Behavioral Biases, Page 3
choose the one that does not involve a loss. This aversion to losses can translate into a greater sensitivity to negative news and announcements and possibly a stronger reaction to them.
The U.S. crisis of 2008 is particularly interesting because U.S. capital markets represent the most liquid and efficient markets globally, therefore the anomalies that we identified in this study can hardly be blamed on markets imperfections such as illiquidity, absence of sophisticated investors, lack of regulatory supervision and other factors. Prima facie, this suggests a role for behavioral finance in the interpretation of the crisis and provides an opportunity to test it. The period reviewed in this study goes from the beginning of 2006 to the end of 2010. This allowed us to compare market responses before, during and after the crisis given that the problems related to the Subprime market became widely recognized in the latter part of 2007 and the market started normalizing in the end of 2009.
We have divided this article into four sections being Section 1 this introduction. Section 2 includes the presentation of the relevant theory and literature regarding both behavioral biases and the U.S. crisis. In the third Section, we provide a review of the data and methodology utilized in this study. In Section 4, we discuss respectively three hypotheses and our statistical findings: Hypothesis 1 tests the efficiency of the market based on autocorrelation tests and the Hurst exponent; Hypothesis 2 reviews the effect of positive and negative news as derived from the sentiment index by Thomson Reuters MarketPsych Indices (“TRMI”); for Hypothesis 3, we tested investors’ under-reaction and overreaction to new information. Our overall conclusion is in Section 5, where we gathered all the evidence presented throughout this article and discussed how the study can shed light on the existence of behavioral biases during the U.S. crisis and whether such biases could have even contributed to market inefficacies and worsening of the financial crisis.

Journal of Finance and Accountancy Volume 26
Markets Efficiency and Behavioral Biases, Page 4
2. LITERATURE REVIEW
Recent crises, including the Asian crisis, the U.S. Subprime mortgage crisis and the more recent European crisis have spurred new academic interest about market efficiency. With respect to methodologies that test the weak version of EMH, recent new studies have focused on statistical mechanics applications to financial time series that stress-test the Brownian motion process. When a time series follows a Brownian motion and therefore a continuous-time random walk, the market is considered to be efficient. Alvarez-Ramirez et al. (2008) used the detrended fluctuation analysis (DFA) method in order to compute the Hurst exponent of the Dow Jones (1928-2007) and the S&P 500 (1950-2007).2 Their results indicate that the Hurst exponents alternated between ‘persistent’ and ‘anti-persistent’ during different periods. After the 1987 Black Monday stock market crash, the Hurst exponent increased, which suggests the stabilization process was delayed. Eom et al. (2008) used the same methodology to calculate the Hurst exponent, and used it as an indication of financial market efficiency. They indicated that if 0 < H < 0.5, the time series has short-term memory; while if 0.5 < H < 1, the series has long-term memory. Their results showed a positive relationship between the Hurst exponent and degree of predictability in financial time-series. Cajueiro and Tabak (2004) examined the Hurst exponent over time to test the efficiency of both emerging markets and developed economies. They filtered the data by using AR(1)-GARCH(1,1), and then calculated the Hurst exponents using the rescaled range (R/S) method for the period that goes from January 1992 to December 2002. Chile, Indonesia, Malaysia, Korea, Argentina, Mexico, Philippines, India, Thailand, Taiwan, Japan and U.S. stock indexes all showed downward trends for the Hurst exponent, which implied that financial markets were becoming increasingly efficient. Meanwhile, compared to emerging markets, developed markets had smaller Hurst exponents, which could mean, as we would expect, that developed markets were more efficient compared to emerging markets. Anagnostidis, Varsakelis, and Emmanouilides (2016) empirically tested the influence of the 2008 financial crisis on the weak-form market efficiency of 12 Eurozone stock markets. Under the hypothesis that stock market daily returns follow an independent Brownian process, they used α-distribution to characterize the return series, and investigated the market efficiency by the Generalized Hurst Exponent method together with rolling window technique. The significant Hurst Exponents indicated relative market efficiency for certain countries and inefficiency for others. According to their result, Germany, the Netherlands, Greece and Italy held weak-form market efficiency both before and during the crisis; Belgium, Ireland, Portugal, Austria, Luxembourg and Finland became inefficient during the crisis; while France and Spain’s stock returns did not exhibit random walk character throughout the entire sample period. In addition, to the Hurst Exponent, we tested the weak from of efficiency by using the Dickey–Fuller test (1979), which tests the null hypothesis that a unit root is present in an autoregressive model.
Psychological biases such as over-optimism, anchoring and confirmation bias, and models of investors’ sentiment are likely to play a key role in the reaction of financial markets that are not perfectly in line with EMH and the Efficient Utility Theory (“EUT”) leading to market inefficiency at the semi-strong level. Although there is no consensus on the importance of behavioral forces in capital markets performance and as new theories such as the adaptive market
2 The Hurst exponent, H, is a statistical measure of the long-term memory of time series. 0:0 < H < 0:5 represents an anti-persistence process (negative autocorrelation), 0:5 < H < 1 represents a persistence process (positive autocorrelation), while H = 0:5 is an uncorrelated Brownian process.

Journal of Finance and Accountancy Volume 26
Markets Efficiency and Behavioral Biases, Page 5
hypothesis are emerging and questioning the behavioral finance tenets,3 the literature finds that the reaction to economic and political news emanating from both official and unofficial sources have an impact on the performance and evolution of equity markets as well as debt markets. Over the last couple of decades, from a methodological standpoint there is a well-established literature on how to link news announcement to capital markets as the mechanism through which information is incorporated by capital markets into securities prices has come increasingly under examination. We have applied these methodological tools to the U.S. case, including the paper of Dooley and Hutchison (2009), which studied news announcements and the spillover of the U.S. Subprime crisis to emerging markets. Traditional finance theory has established that the valuation impact of news is transmitted to the market through the revision of market participant’s expectations about future performance. Recent studies in behavioral finance, supported by empirical findings, have unveiled regular departures from the semi-strong EMH, where market participants either under-react or overreact to a series of positive or negative news and announcements. Daniel, et al. (1998), Hong and Stein (1999), and Barberis, Shleifer, and Vishny (1998), among others, have developed behavioral models that can account for both overreaction and under-reaction in asset prices. For example, according to Barberis, Shleifer, and Vishny, investors tend to under-react to sporadic news, but become very active when a security performs well and are inclined to overreact when bad news occur at the climax. Such literature tends to divide the way markets react to news and announcements into a “weak form” and a “strong form.” According to the former hypothesis, the market would react more strongly to negative news rather than to positive news during a crisis; while according to the latter, capital markets would react solely to bad news during a situation of panic and ignore good news. For example, the results of the study of Afonso, Furceri, and Gomes (2011) confirms the weaker form of crisis hypothesis, while Sophia Koch and Elisabeth Baeumler’s work on the news effect of credit downgrading and negative watches on the European government bond yields and stock markets (2013) corroborates the strong form hypothesis.
Despite the abundancy of studies on the Subprime mortgage crisis and the global crisis that followed, we have located only a small number of articles that analyze the effect on news on capital markets. That is, most articles explore the genesis of the crisis rather than market behavior during the crisis, or focus on markets other than the U.S. Of note, the article of Chira (2014) where the author investigates market reaction to negative reports regarding saving and commercial banks. The results show that such reports resulted in greater negative returns than during normal non-crisis times. In an analysis of the impact of good news and bad news on the U.S. market between 2007 and 2008, Chen and Ghysels (2010) observe that moderately good news lower volatility, while very good or very bad news increase volatility with the latter having a stronger impact. In this study, the asymmetric reaction to news is investigated on intra-day time series primarily for volatility forecast purposes.
With respect to market reactions to news, in a study about Greece, Mink and De Haan (2013) collected news as dummy variables about Greece and news about the intentions of other countries to bail out Greece. This study focused primarily on the effect of such news on banks’ stock returns. Their findings indicated that news about Greece did not lead to abnormal returns while news about a bailout did; this suggests that markets considered news about the bailout to be a signal of the inclination of European governments to use public funds to thwart the financial crisis. In an International Monetary Fund (“IMF”) working paper, Edda Zoli (2013) concludes that news (as derived from Bloomberg) on the euro-area debt crisis and country-specific events 3 See Lo (2017) “Adaptive Markets, Financial Evolution at the Speed of Thought.”
Journal of Finance and Accountancy Volume 26
Markets Efficiency and Behavioral Biases, Page 6
were important drivers of sovereign spreads and increase in volatility. However, Zoli does not consider the behavioral aspects of the transmission of news announcements into market prices; that is, she accepts news as an indication of sovereign risk and does not investigate whether the reaction to news was consistent with rationality or not.
An insightful study by Beetsma, Giuliodori, de Jong and Widijanto (2012) makes use of the Eurointelligence newsflash, an internet-based service for economic news and analysis of the Euro area, and finds that more news coverage on average raised the domestic interest spread of PIIGS and led to an increase in the spreads of other PIIGS countries and even non-PIIGS countries. This implies that the number of articles independently from their content tended to increase volatility. Nonetheless, the study focuses more on the quantity of news and does not differentiate between positive news and negative news as we do in our study.
Choudhry and Jayasekera (2014) studied market efficiency during the 2008 global financial crisis by testing the impact of asymmetric effect of news on time-varying betas of 13 large banks from Europe. According to their hypothesis, the firm’s beta asymmetrical changes with respect to news or shocks can be used to test market efficiency. They used the BEKK GARCH model to estimate the time-varying beta, and a linear regression model to estimate the asymmetric effects. When an asymmetric effect existed, they tried to determine whether it was caused by market or non-market shocks. Their results show a clear pattern of more volatile betas during financial crisis. Banks in France, Germany and Portugal exhibited unambiguous decline in market efficiency during the financial crisis, while those in Greece, Ireland, Italy and Spain did not have conclusive results.
From a methodological standpoint, our study does not differ substantially from previous studies that made use of the augmented Dickey-Fuller test and the Hurst exponent to test weak-form efficiency and news as binary independent variables in order to evaluate market responses to new information. However, differently from other papers, we have concentrated our effort exclusively on the U.S. financial markets, which are typically regarded as very efficient, allowing for a more in-depth analysis. Moreover, the identification of specific sub periods permitted us to compare market performance during different phases of the crisis. Our findings indicate that contrary to what very often conjectured, the beginning of the crisis did not reestablished market efficiency after the build-up of a ‘bubble,’ but quite the opposite represented the beginning of a period that was characterized by more profound inefficiencies and that led to what we consider irrational glumness.

Journal of Finance and Accountancy Volume 26
Markets Efficiency and Behavioral Biases, Page 7
3. DATA AND METHODOLOGY
We tested daily data of the TRMI Sentiment index and its effects on the S&P 500 index, and the 10-year Treasury bond between 2006 and 2010. The use of the sentiment index allowed for the inclusion of a larger number of news sources rather than a handful of paper or on-line publications. MarketPsych has been developing financial text-based data and investment models since 2004 through knowledge in natural language processing, cloud computing and behavioral economics. It has published research in academic journals, textbooks, and books and began collaborating exclusively with Thomson Reuters in 2011.4 TRMIs are evaluated on three different content sets: news, social media, and the combined content of news and social media. Reuters news comprises internet news and is restricted to top international and business news sources, top regional news sources, and leading industry sources. Three key types of indicator are provided:
• Emotional indicators such as ‘Anger,’ ‘Fear’ and ‘Joy;’ • Macroeconomic metrics including ‘Earnings Expectations’ and ‘Interest Rate Forecast;’ • Buzz metrics on the asset level, i.e., Buzz, and on market-moving topics for that asset,
such as Litigation, Mergers, and Volatility. The indicators are updated every minute for companies, sectors, regions, countries,
commodities and energy topics, indices and currencies, but are available also on a one-day basis, which is what was applied to this study. Typically, such indexes are translated directly into spreadsheets or charts that can be monitored by traders, risk managers or analysts. The social media collection contains finance-specific tweets and blogs. Using popularity ranks measured by incoming links, this includes generally the top 30 percent of blogs, microblogs, and other social media content. Such indices are marked as ranging from either -1 to 1 or from 0 to 1 corresponding respectively to bipolar and unipolar indices. For the purpose of our analysis, we used only the “Sentiment” index that counts overall positive references, net of negative references. This index was chosen because it is not asset specific and is likely to capture the news that affected overall market performance during the crisis. The use of this index as a proxy for news eliminated the problem of a potential bias in coding the news and the challenge of obtaining a broad set of news that were specifically related to the U.S. events. Furthermore, we eliminated the problem of not objectively designating the importance of different pieces of news or not knowing whether news in the press was fully unanticipated or not
As indicated in the previous section, we analyzed different time periods in order to segregate market performance before, during and after the crisis. These periods were identified based on key events that represented turning points in the unfolding of the crisis. The specific events were selected based on empirical observation of market performance as related to important news or announcements; although ex post, it is relatively easy to recognize the events that determined significant changes in the behavior of market participates, at the time the events occurred, it would have been challenging to assess their criticality. The Subprime mortgage crisis in the U.S. can be considered to have started on February 27, 2007, when Freddie Mac stopped buying Subprime mortgages. That day the S&P 500 Index fell by about 3.5 percent while the NASDAQ lost approximately 3.9 percent, the biggest loss since 9/11. At that time, the extent of the upcoming crisis was not fully understood by market participants or the general public. Nonetheless, new home sales dropped by 16 percent when compared to the previous year with a 4 Trading on sentiment, The Power of Minds of over Markets, by Richard L. Peterson. Market Psych, by Richard Peterson and Frank F. Murtha. Inside the Inventors’ Brain, by Richard L. Peterson.

Journal of Finance and Accountancy Volume 26
Markets Efficiency and Behavioral Biases, Page 8
decline of the median price of 3.1 percent. The same day a government report indicated the sale of durable goods had weakened by approximately 3 percent year over year. Other critical dates that we considered in our study include the purchase Countrywide by Bank of America on January 11, 2008, the drop of the federal fund rate by the FOMC on January 22, 2009 and Lehman Brothers bankruptcy on September 15, 2008. During the second part of 2008, the U.S. government took action in order to come to rescue to the financial system and reestablish trust in the U.S. economy. On September 17, 2008, the U.S. government bailed out Fannie Mae and Freddie Mac by authorizing the Treasury Department to purchase their preferred stock and assets backed securities (ABS) for up to $100 billion. The Federal Housing Finance Agency (FHFA) put these assets into conservatorship. The previous day the U.S. government bailed out American International Group, Inc. (AIG) -one of the largest publicly traded companies in the world - with an $85 billion capital injection in return of approximately 80 percent of AIG’s equity.
The normalization of market conditions occurred only gradually as confidence in the financial system was restored primarily by government intervention. Both the NASDAQ Composite Index and the S&P 500 index fell to the trough in March 2009. After this date, both indexes started growing again and reached prior crisis levels respectively in February 2011 and April 2013. On March 10, 2009, the CEO of Blackstone declared that that “up to 45 percent of the world’s wealth had been destroyed by the global credit crisis.” The same day, the market rallied and by the month of May of the same year, markets were up more than 150 percent. Although the rally was not tied to any fundamental news, the realization that so much wealth had been destroyed and that during the crisis prices seemed to have become somewhat disjointed from the economic fundamentals worked as a catalyst for a swift recovery. The recession in the U.S. lasted only a few more months after the recovery of capital markets, through the end of the third quarter of 2009 as the economy started displaying signals of growth already in October of the same year. Collecting data from the beginning of 2006 through 2010, allowed us observe market behavior prior to the crisis and once normal conditions were reestablished.
4. HYPOTHESES AND RESULTS
4.1 Hypothesis 1: during the crisis market performance was consistent with the weak
version of the EMH
Before turning to the effect of news on market performance, we tested market data for efficiency by using routine tests such as the unit route ADF tests. We ran several regressions for different time periods, based on different key events that we regarded as tuning points during the crisis. The following turning points correspond to key economic or financial events that profoundly affected market sentiment and performance due to their expected impact on the economy or systemic risk:
- Freddie MAC does not buy Subprime mortgages anymore, February 27, 2007; - Bank of America buys Countrywide, January 11, 2008; - Lehman Brothers Files for Chapter 11 bankruptcy protection, September 15, 2008; - Statement of Blackstone CEO. March 10, 2009 - During the London G20 Summit, World leaders commit to a $5 trillion fiscal expansion
and an additional $1.1 trillion to support the International Monetary Fund and other global institutions, April 2, 2009.
Journal of Finance and Accountancy Volume 26
Markets Efficiency and Behavioral Biases, Page 9
In this contest, we assumed that the financial crisis lasted approximately from the beginning of March 2007 through the end of March 2009. Specifically, we conducted the ADF test separately for each time period as illustrated in the table below. The lag used in each ADF test is based on a paper by Ng and Perron (1995), which takes into consideration both serial correlation and the power of the test.
As illustrated in the Table 1, according to test statistics and p-value in the parenthesis, we cannot reject the null hypothesis of the existence of unit root for all six periods at any significance level, indicating that daily stock adjusted prices are non-stationary. The same test was repeated for Treasury Bonds as illustrated in Table 2.
As shown in Table 2, for the 10-year Treasury Bond, we rejected the null hypothesis of the existence of unit root in the 4th time period at the 90% significance level and in the 5th time period at the 95% significance level. In all other time periods, we cannot reject the null hypothesis, indicating that bonds yield rates were non-stationary. Interestingly, these two periods occurred during market recovery. This suggests that the Treasury bond market became less efficient after the crisis rather than before or during the crisis.
As an alternative way to test the weak level market efficiency of both the equity and credit market we used the Hurst Exponent. The Hurst Exponent, H, is a statistical measure of the long-term memory of time series. The range 0:0 < H < 0:5 represents an anti-persistence process (negative autocorrelation), 0:5 < H < 1 represents a persistence process (positive autocorrelation), while H = 0:5 is an uncorrelated Brownian process. Carbone, Castelli, and Stanley (2004) presents two ways of calculating time-dependent Hurst exponents: the de-trending moving average (DMA) technique and de-trended fluctuation analysis (DFA) method. They claimed that DMA algorithm allows the calculation without a priori assumptions about the stochastic process and the probability distribution of the variable, therefore it is used in their research. Rasheed and Qian (2004) presents a way of calculating the Hurst exponent by rescaled range analysis (R/S analysis). For ease of calculation we used the latter in this study for the purpose of the testing the S&P 500 index and the 10-year Treasury bond. The table 3 illustrates the results for the S&P 500 index.
As shown in Table 3, for most periods, the stock price shows an anti-persistent property. Conversely, after the economy started recovering, the stock price shows a persistent property. Although at this stage news are not included in the analysis, we can speculate that these results entail that before the crisis and shortly after the crisis, market participants tended to overreact to either market performance or new information, while as the economy in conjunction with the markets started to recover, investors had the tendency to under-react. Differently from the S&P500, but still indicating an anomaly, for the 10-year Treasury bond we notice that before the crisis the Hurst exponent was greater than 0.5 to then decrease during the financial crisis as shown in the Table 4.
Overall, although the ADF tests did not unveil meaningful inefficiencies, the Hurst Exponent revealed some level of inefficiencies during the crisis mostly in the form of anti-persistent patterns. Form an empirical standpoint, it seems justifiable the different pattern between the S&P 500 equity index and the 10-Year Treasury Bond, since with the beginning of the crisis the FED became particularly active, which translated into an immediate effect on the YTM of treasury securities.

Journal of Finance and Accountancy Volume 26
Markets Efficiency and Behavioral Biases, Page 10
4.2 Hypothesis 2: during the crisis investors reacted similarly to negative sentiments/bad
news and positive sentiments/good news in a way that is consistent with the semi-strong
version of the EMH
This hypothesis was tested again on both the S&P 500 equity index and 10-Year Treasury Bond. As a proxy for the news we used the TRMI index, which originates from more than 2,000 online global news sources through a text recognition software virtually in real time, including the Wall Street Journal, the Financial Times, CNN, Google, Thomson Reuter, South China Morning Post and the New York Times among many others. News are both political as well economic in nature. In order to derive positive and negative news from various indexes, we considered whether the index for each day was increasing or decreasing; it follows that when the index was increasing, there were either good news or bad news based on the specific nature of the index and vice versa when it was declining. As mentioned in Section 3, in order to measure the effect of news, we specifically selected the Sentiment Index. Although the TRMI indexes are commonly used in the market place by traders as lead indicators of market performance and trends, in our study we utilized them to assess ex post whether U.S. capital markets reacted asymmetrically to positive and negative news during the crisis. Except for five days, the index remained negative for the entire period with an average of -0.097 and a standard deviation of 0.028. Since the index is bipolar from -1 to +1, the fact that for the most part it remained negative throughout the period indicates the prevalence of a bad news which translated into a negative sentiment already prior to the crisis as we collected data from the beginning of 2006. Seemingly, this is contrary to the alleged bullish attitude of market participants during the entire 2006 and the beginning of 2007;
In order to detect the impact of good and bad news, we employed a parsimonious Ordinary Least Squares (“OLS”) regression model with binary variables as follows:
����� = �1 �� + �2 �� + �� (1) ����� = �1 �� + �2 �� + �� (2)
where ����� in equation (1) is the return on the S&P500 equity index and ����� in equation (2) is the change in the yield to maturity of the 10-year T-Bond. With respect to the coefficients, β1 shows the effect of positive news on the dependent variable; β2 shows that the effect of negative news.5 Consistently, with our Hypothesis 1, we relied on the same turning points as we examined different periods in order to evaluate the type of market reactions during different phases of the crisis.
As shown in Table 5, for the S&P 500 index from the beginning of 2006 to the first turning point on February 27, 2007, a larger effect of positive news than negative news was found, 0.15 versus 0.05 percent with only the former being statistically significant. This indicates that during this period, market participants remained relatively optimistic with respect to the direction of the economy. However, with the announcement that Freddie MAC was not going to purchase Subprime mortgages anymore, all of the sudden we notice a larger effect of negative news, -0.37 versus 0.26 percent between the end of February 2007 and the beginning of April 2009. Similarly, for the period that goes from the acquisition of Countrywide by Bank of America through March 2009, only the coefficients on negative news remain statistically significant.
5 For the T-Bond the positive news should have a negative coefficient, while for the S&P 500 β1 should be positive in the presence of positive news.
Journal of Finance and Accountancy Volume 26
Markets Efficiency and Behavioral Biases, Page 11
With the G20 Summit on April 2, 2009, the coefficient for positive news became stronger again and statistically significant (0.32 percent versus -0.10 percent). By the time unemployment reached its peak, the economic conditions normalized and the attention to news, both positive and negative dropped significantly although only the coefficient for positive news remained statistically significant. Although the coefficients whether positive or negative do not appear to be very large, they are meaningful as they represent an average daily change during each period.
As illustrated in Table 5, the upticks and downticks of the Sentiment index remained fairly balanced during all periods. This suggests that the effect of the change in sentiment/number of news could not have been caused simply by the overpoweringly number of upticks versus downtick and vice versa, but rather by the reaction to such changes in sentiments as spurred by news. A stronger reaction to bad news during the crisis supports the loss aversion theory where investors departed from behaviors as predicted by the EUT and therefore tended to base their decisions on potential gains and losses instead of the likelihood of the outcome. However, other possible explanations that would be consistent with our results include a swing to excessive pessimism and confirmation bias if investors assumed that the situation was bad and therefore, they discounted positive news vis a vis negative news (and vice versa).
When we performed the same analysis for the 10-year T-Bond (results listed in Table 6), it transpired that only the two periods during the crisis exhibited coefficients that were statistically significant and moderately meaningful. However, the coefficients had a sign that was the opposite of what we expected since with bad news the yield dropped and with positive news the yield increased.
We believe this anomalous behavior of the YTM can be actually explained by the repeated intervention of the FED in the market place in the attempt of lowering systemic risk and create liquidity. Between August 2007 and December 2008, the Fed lowered interest rates 11 times with the federal fund rate dropping from 5.25 percent to -.25 percent. As result of the initial reaction of the FED, market participants might have then anticipated that the central bank would have intervened in order to avert a credit crunch.
Since the results of our Hypothesis 1 indicated that the market did not consistently display weak efficient characteristics, in order to isolate further the effect of news from other market forces, we included an autoregressive pattern in the analysis. This could also account for the possible effects of market participants ‘trading on momentum’ strategies at the time. Although other AR patterns were considered and tested, only the AR(1, 2) displayed results that were statically significant and meaningful. We employed the Ordinary Least Squares (“OLS”) regression with binary variables methodology; as follows:
����� = �1 �� + �2 �� + �3 ��1 + �4 ��2 + �� (3) ����� = �1 �� + �2 �� + �3 ��1 + �4 ��2 + �� (4)
where ����� in equation (3) is the return on the S&P500 index and ����� in equation (4) is the change in the yield to maturity of the 10-year Treasury Bond. With respect to the coefficients, β1 shows the effect of positive news on the dependent variable; β2 shows that the effect of negative news, β3 shows the effect of the return of the previous day and finally β4 indicates the effect of the returns two days prior.6
Based on the data displayed in Table 7, similarly to the results illustrated in Table 6, we notice that before the crisis only positive changes in the market sentiment were statistically significant while there are no signs of an autoregressive pattern. However, with the beginning of
6 For the YTM, the positive news should have a negative coefficient, while for the SPY β1 should be positive in the presence of positive news.

Journal of Finance and Accountancy Volume 26
Markets Efficiency and Behavioral Biases, Page 12
the crisis, both good news and negative news become meaningful and statistically significant and both AR 1 and AR 2 affect the dependent variable. As the crisis deepens, only negative news remains statistically significant with an even higher coefficients and the AR pattern strengthens as well. Once normal conditions are restored, positive changes in market sentiment as elicited by news, regain the role they played before the inception of the crisis. Similarly, the autoregressive pattern weakens to the then fully disappear.
4.3 Hypothesis 3: During U.S. financial crisis, there were no signs of under-reaction and
overreaction to new information as derived from the Sentiment index.
The results from our previous Hypotheses 1 and 2, suggest the presence of some
persistent and anti-persistent behavior as well as a stronger attention to negative news during the crisis. Thus, we suspect that other behavioral biases such as the phenomenon of under-reaction and overreaction could have been present at the time of the crisis. During the last two decades, empirical research in finance has identified examples of behavioral biases that can be responsible to make market depart from EMH that include under-reaction to reliable information (either good or bad) as well as overreaction to reliable or less reliable information (see De Bondt and Thaler, 1985 and 1987). We tested the presence of under-reaction and overreaction on the S&P 500 index and the 10-year Treasury Bond. Also in this case, a parsimonious OLS model was employed as follows:
����� = �1 ��� + �2 ���1 + �3 ���2 + �4 ���3 + �� (5) ����� = �1 ��� + �2 ���1 + �3 ���2 + �4 ���3 + �� (6)
where ����� in equation (5) is the return on the FTSE MIB and ����� in equation (6) is the change in yield to maturity. With respect to the coefficients, β1 measure the effect of current news (either positive or negative), while β2, β3 and β4 show the effect of the lagged news (either positive or negative) for the previous three periods (three days) on the dependent variables. Although many tests were performed by using a different number of lags (up to 10), the results indicated that beyond the third lag, the news had virtually no effect on the dependent variable. The analysis was performed for different periods in conjunction with the different turning points during the crisis as illustrated in the previous tests.
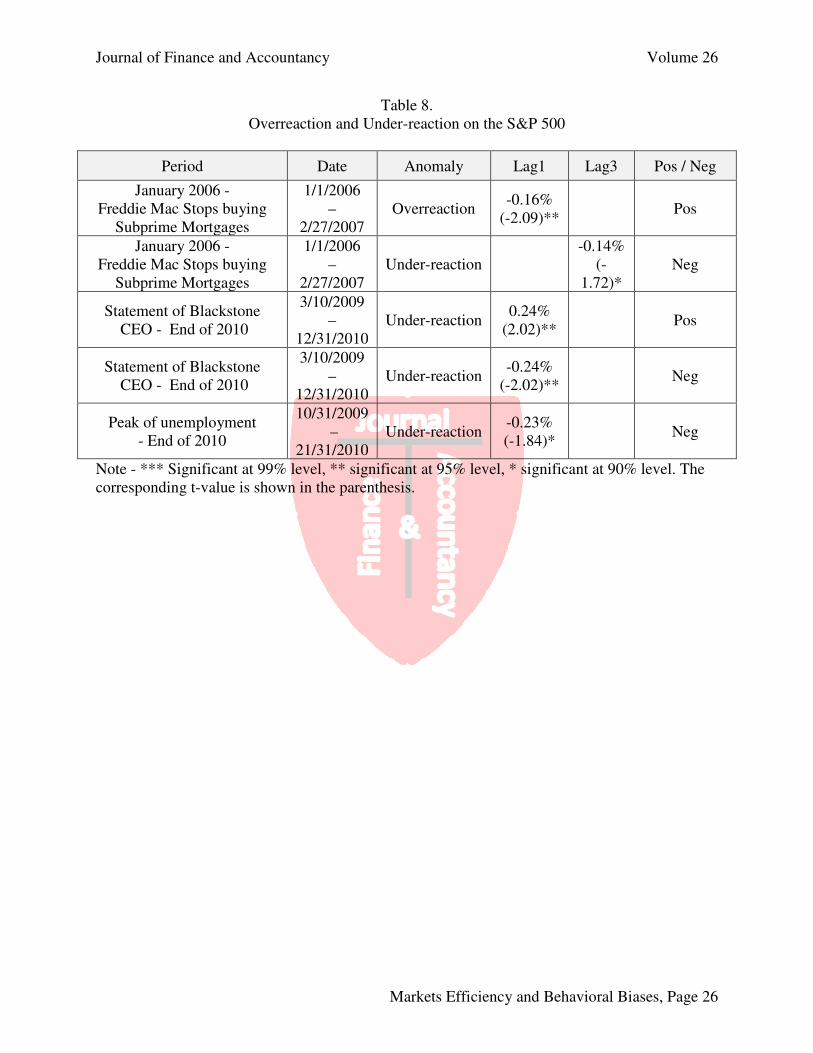
The Table 8 shows that for the period starting in January 2006 and ending with the announcement of Freddie MAC in February 2007, the equity market as represented by the S&P 500 index overreacted to positive news (Lag 1) and underreacted to negative news (Lag 3) with coefficient that were both meaningful and statistically significant.
Once the crisis started abating, we notice only signs of under reaction to both positive and negative news all for just Lag 1. The effect of Lag 1, however, appears less dependable as an indication of under-reaction since the timing of the release of the news could differ significantly depending on the type of news and the source because the piece of news could have been known one day prior, but for practical purposes could have appeared in the newspaper (and their electronic versions) with at least one day of delay.
The overreaction to good news and under-reaction to bad news that we observe for the period prior to the beginning of the crisis seems consistent with an over-optimism bias that typically characterizes periods of “irrational exuberance.” During the core period of the crisis that goes from February 2007 through March 2009, however, we do not observe signs of under-reaction or overreaction, suggesting a rather prompt investors’ response to positive and negative news that accompanied turbulent times.

Journal of Finance and Accountancy Volume 26
Markets Efficiency and Behavioral Biases, Page 13
Under-reaction can be typically explained by the conservatism bias, which means that new information is underweighted in updating a view of the world (see Barberis, Shleifer and Vishny, 1998). Although the size of the coefficients is relatively small and therefore does not explain a large portion of the market movements, our results indicate the presence of markets under-reaction above all towards the end of the crisis. This is not unusual as investors still in distress from the recent effects of the crisis would receive new information with a higher level of skepticisms.7 This could support the notion that although investors reacted immediately to negative news during the crisis, they were only moderately confident when normal conditions started being restored.8 It is also possible that once the situation started normalizing, investors preferred ‘riding losses’ and therefore became reluctant to sell on new negative information. The disposition effect (Fazzini, 2006) could also explain the under-reaction to positive news after the announcement of the CEO of Blackstone, since investors in the attempt to realize gains would have put downward pressure on market prices.
For the 10-Year Treasury Bond (see Table 9), there were no signs of overreaction or under-reaction prior to the crisis, however, from February 2007 to the end of the crisis, we noticed signs of overreaction for Lag 5 only to positive changes in sentiment. Post crisis, we identified overreaction for Lag 3 and 5 and under-reaction for Lag 3. Signs of overreaction to positive news during the crisis and after indicate once again an over-optimism bias perhaps due to expected intervention of the Fed.
5. CONCLUDING REMARKS
In this study of the 2008 U.S. financial crisis, we were able to identify weak-form inefficiencies as well as confirm the presence of several anomalies that can be associated with behavioral biases including loss aversion and under-reaction/overreaction among others. These conclusions suggest the crises per se did not contribute to reestablishing market efficiency after a period of unwarranted enthusiasm, but rather represented the beginning of a period where the market participants became even more emotional by perpetrating a negative predisposition.
Our findings as related to the Hurst exponent indicate that before, during and after the crisis, the markets were not weak efficient. In particular, before and during the crisis, stock prices showed an anti-persistent property, while after the crisis, stock prices displayed a persistent property. Additionally, we have found evidence for our hypothesis that: 1) the market responded asymmetrically to news and changes in sentiment during turbulent times as compared to normal market conditions; in particular, during the crisis investors appeared to react more strongly to negative news than to positive news; and 2) investors did not always react aptly to new reliable information leading in some cases to under-reaction and overreaction.
Our results regarding the impact of changes in sentiment as derived from news consistently indicate that from the moment Freddie Mac stopped buying Subprime mortgages in early 2007 through March 2009, negative news had a strongest effect on the U.S. equity market independently from the up ticks on down ticks in market sentiment. Conversely, both before the crisis and after the crisis, only good news and the related changes in sentiment had a meaningful impact on market performance. This is not consistent for equity markets and for T-bonds as we notice that the Fed intervened heavily during the crisis in order to lower interest rates. In
7 See our paper on the Italian crisis where we found similar effects. 8 This is in line with other studies that found that markets tend to underreact to positive news during bad times (see Veronesi 1999).

Journal of Finance and Accountancy Volume 26
Markets Efficiency and Behavioral Biases, Page 14
addition to observing a stronger reaction to negative news than positive news during the crisis, we also noticed that the investors’ level of attention to news in general increased during the crisis since the coefficient for bad news was almost three times larger than the one for positive news before the crisis and approximately 37 percent larger than after the crisis. Overall, this supports the existence of behavioral biases as assumed by prospect theory. It follows that investors reacted more strongly to negative news since they were afraid of losses more than they valued gains. Other explanations are however, possible since such asymmetrical market behavior can be justified simply by excessive pessimism or confirmations bias. Moreover, incorrect mental models and the inability to translate uncertainty into risk could have also been the cause of the greater attention to negative news or news in general during the crisis.
In testing the presence of other anomalies during the U.S. crisis, our results indicate the presence of under-reaction towards the end of the crisis and overreaction in the beginning of the crisis and also towards its end. The misalignment in terms of time and intensity between under-reaction and overreaction clearly indicates that contrary to Fama’s claim (1998) these phenomena do not cancel each other.
Overall, our findings support the idea that both the EMH as well as behavioral approaches should be part of any financial researcher’s toolset in order to understand market performance and market reaction to various events. As such, there should not be a strong division between the uses of one approach versus the other. It is possible that in our study the use of the TRMI Sentiment index misevaluated news and / or failed to consider news that accounted for a significant portion of the asset price volatility. Moreover, it is problematic to evaluate the relative importance of news or the change in sentiments and take into account whether the change in sentiment was solely driven by news. Overall, we have investigated only a few of the behavioral hypotheses that are being developed in the research on behavioral and neuro finance and we have not captured any evolutionary aspects per the adaptive market hypothesis also because the time span of our study was not sufficiently long. Thus, a great deal of further work can be done to test other hypotheses as well as considering different and more objective ways of capturing news items, different time periods, countries, and / or types of markets.
Journal of Finance and Accountancy Volume 26
Markets Efficiency and Behavioral Biases, Page 15
REFERENCES
Afonso, A., Furceri, D., Gomes, P. (2011). Sovereign Credit Rating and Financial Markets Linkages: Application to European Data. ECB Working Paper Series, no. 1347. Akerlof, G. A., & Shiller, R. J (2009). Animal spirits: How human psychology drives the economy, and why it matters for global capitalism. Princeton, NJ: Princeton University Press. Alsakka, R., Gwilym O. (2011, December). Rating agencies’ signals during the European sovereign debt crisis: market impact and spillovers. Journal of Economic Behavior &
Organization. Retrived from http://www.journals.elsevier.com/journal-of-economic-behavior-and-organization Anagnostidis, P, Varsakelis. C., and Emmanouilides, CJ. 2016. Has the 2008 financial crisis affected stock market efficiency? The case of Eurozone. Physica A: Statistical Mechanics and
its Applications 447:116–128. Bauer, M. (2014, January), Nominal Interest Rates and the News. Federal Reserve Bank of San
Francisco Working Paper 2011-20. Beetsma, R., De Jong, F., Giuliodori, M., Widijanto, D. (2013). Spread the news: The impact of news on the European sovereign bond markets during the crisis. Journal of International Money
and Finance 34 (0), 83-101. Beetsma, R., De Jong, F., Giuliodori, M., Widijanto, D. (2014). The Impact of News and the SMP on Realized (Co) Variances in the Eurozone Sovereign Debt Market. Working Paper
Series, European Central Bank, no. 1629. Beirne, J., Fratzscher, M. (2013). The pricing of sovereign risk and contagion during the European sovereign debt crisis. Journal of International Money and Finance 34 (0), 60-82. Bergman, M., Hutchison, M., Hougaard, S. (2012). Policy Actions in the Euro Area and Market Perceptions of Sovereign Default Risk. Claremont Graduate University. Bird, G., Du, W, and Willet T. (2016). Behavioral Finance and Efficient Markets, what does the Euro Crisis Tell Us? Claremont Graduate University. Brière, M., Ielpo, F. (2007). Yield curve reaction to macroeconomic news in Europe: disentangling the US influence. Buchel, K., (2013). Do words matter? The impact of communication on the PIIGS' CDS and bond yield spreads during Europe’s sovereign debt crisis. European Journal of Political
Economy 32 (0), 412-431. Burnham, T. (2005). Mean markets and lizard brains: How to profit from the new science of irrationality. Hoboken, NJ: John Wiley and Sons, Inc. Publishing.

Journal of Finance and Accountancy Volume 26
Markets Efficiency and Behavioral Biases, Page 16
Cantor, R., & Packer, F. (1996). Determinants and Impact of Sovereign Credit Ratings. Economic Policy Review 2 (2), 37-54. Chan, W. S. (2003). Stock price reaction to news and no-news: Drift and reversal after headlines. Journal of Financial Economics 70(2), 223-260. Choudhry, Taufiq and Ranadeva Jayasekera. 2014. Market efficiency during the global financial crisis: Empirical evidence from European banks. Journal of international Money and
Finance 49:299–318. Colemana, A., & Karagediklic, Ö. (2012). The relative size of exchange rate and interest rate responses to news: An empirical investigation. North American Journal of Economics
and Finance 23, 1– 19. Connolly, E., & Kohler, M., (2004). News and Interest Rate Expectations: A Study of Six Central Banks. Research Discussion Paper, Economic Group Reserve Bank of Australia. Corgnet, C., Kujal, P., Porter, D. (2103). Reaction to Public Information in Markets: How much does Ambiguity Matter? The Economic Journal, Volume 123, Issue 569, 699-737 D’Agostino, A., & Ehrmann, M., (2013). The pricing of G7 Sovereign Bond spreads-the Times, They Are A-Changin. ECB Working Paper Series (1520). De Grauwe, Paul. (2013). The European Central Bank as Lender of Last Resort in the Government Bond Markets. CESifo Economic Studies 59, (3), 520-535. Di Matteo, Tiziana, Tomaso Aste, and Michel M Dacorogna. (2005). Long-term memories of developed and emerging markets: Using the scaling analysis to characterize their stage of development." Journal of Banking & Finance 29 (4):827{851. Di Matteo, Tiziana, Tomaso Aste, and MM Dacorogna. (2003). \Scaling behaviors in differently developed markets." Physica A: Statistical Mechanics and its Applications 324 (12):183{188. Dooley, M., & Hutchinson, M. (2009). Transmission of the US Subprime crisis to emerging markets: Evidence of the decoupling –recouping hypothesis. Journal of International Money and
Finance 28, 1331-1349. Eaton, J., Gersovitz M., Stiglitz, J., (1986). The Pure Theory of Country Risk. European
Economic Review 30(3), 481-513. Ewing, B., & Yanochik, M., (1999). Budget Deficits and the Term Structure of interest In Italy. Applied Economics Letters, 6, 199-201. Falagiarda, M., & Stefan, R. (2013): “Announcements of ECB Unconventional Programs: Implications for the Sovereign Risk of Italy.” Kiel Working Paper, no. 1866.

Journal of Finance and Accountancy Volume 26
Markets Efficiency and Behavioral Biases, Page 17
Guegan, D. (2009). Further Evidence on the Impact of Economic news on Interest Rates. Frontiers in Finance and Economics. Volume 6, Issue 2, 1 - 45. Jo, G. J., & Willett, T. D. (2000). Currency market reactions to good and bad news during the Asian crisis. Seoul Journal of Economics, 13(4), 407-419. Retrieved from http://www.sje.ac.kr Kliesen, K., & Schmid F. (2006). Macroeconomic News and Real Interest Rates. Federal
Reserve Bank of St. Louis Review, 88(2), pp. 133-43. Koch, S., & Baeumler, E. (2013). The European Sovereign Debt Crisis and its Impact on Bond and Stock Markets: Market Considers it a Long-Term Crisis. Social Science Research Network
Working Papers Series. Kreuter, C., Gottschling, A., & Cornelius, P. (1998). The reaction of Exchange rates and Interest Rates to News releases. Deutsche Bank Research. Research Note Rn-98-2. June. Liang, P., Willett, T. D., & Zhang, N. (2010). The slow spread of the global crisis. Journal of
International Commerce, Economics And Policy, 1(1), 33-58. Lippi, M., & Thornton, D. L. (2004). A Dynamic Factor Analysis of the Response of U. S. Interest Rates to News. Working Paper, Federal Reserve Bank of St.Louis Research Division. McMenamin, I., Breen, M., & Munoz-Portillo, J. (2015). Austerity and credibility in the Eurozone. European Union Politics. Mendoza, E. G., &Yue, V. (2012). A General Equilibrium Model of Sovereign Default and Business Cycles. The Quarterly Journal of Economics 127 (2):889-946. Mink, M., & de Haan, J. (2013). Contagion during the Greek sovereign debt crisis. Journal of
International Money and Finance 34 (0):102-113. Mohl, P., & Sondermann, D. (2012). Has political communication during the crisis impacted sovereign bond spreads in the euro area? Applied Economics Letters 20 (1):48-61. Nautz, D., Wolters, J. The response of long-term interest rates to news about monetary policy actions: Empirical evidence for the US and Germany. Discussion Papers, Interdisciplinary
Research Project 373: Quantification and Simulation of Economic Processes, No. 1998, 78. Ng, Serena and Pierre Perron. 1995. Unit root tests in ARMA models with data-dependent methods for the selection of the truncation lag. Journal of the American Statistical Association 90 (429):268–281. Ramchander, S., Simpson, M., & Chaudhry, M. K. (2005). The Influence of Macroeconomic News On Term And Quality spreads. The Quarterly Review of Economics and Finance 45, 84–102.

Journal of Finance and Accountancy Volume 26
Markets Efficiency and Behavioral Biases, Page 18
Rose, A. K., & Spiegel, M. M. (2012): “Dollar illiquidity and central bank swap arrangements during the global financial crisis.” Journal of International Economics 88(2), pp.326-340. Savor, P., & Mungo, W. (2013). How Much Do Investors Care About Macroeconomic Risk? Evidence from Scheduled Economic Announcements. Journal of Financial and Quantitative
Analysis Vol. 48, No. 2, pp. 343–375. Shefrin, H. (2000). Beyond greed and fear: Understanding behavioral finance and the psychology of investing. Boston, MA: Harvard Business School Press. Shiller, J. R. (1993). Irrational Exuberance Edition 3. Sibbertsen, P., Wegener, C., & Basse, T. (2014). Testing for a break in the persistence in yield spreads of EMU government bonds. Journal of Banking & Finance 4, 109–118. Suk-Joong, K., & Jeffrey, S. (2000). International linkages and macroeconomic news effects on interest rate volatility — Australia and the US. Pacific-Basin Finance Journal, 85–113. Thaler, R. (1993). Advances in behavioral finance. Volume 2. Thorbecke, W. (1993). Why Deficit News Affects Interest Rates. Journal of Policy Modeling 15(I): 1 - 11. Zoli, E. (2013). Italian Sovereign spreads Their Determinants and Pass-through to Bank Funding Costs and lending Conditions. IMF Working Paper. WP/13

Journal of Finance and Accountancy Volume 26
Markets Efficiency and Behavioral Biases, Page 19
APPENDIX
Table 1 ADF Test on S&P 500 Daily Adjusted Close Price
Period Events Period
Lags in ADF Test Test Statistics
January 2006 - Freddie Mac Stops buying Subprime Mortgages
01/01/2006 to
02/27/2007 1
-2.00 3 (0.599)
Freddie Mac Stops buying Subprime Mortgages –
G20 Summit in London
02/27/2007 to
04/02/2009 3
0.557 (0.986)
Bank of America buys Countrywide - Statement of Blackstone CEO
01/11/2008 to
03/10/2009 3
-0.297 (0.926)
Statement of Blackstone CEO - End of 2010
03/10/2009 to
12/31/2010 2
-0.764 (0.829)
G20 Summit in London - End of 2010
04/02/2009 to
12/31/2010 2
-2.805 (0.195)
Peak of unemployment - End of 2010
10/30/2009 to
12/31/2010 3
-0.177 (0.941)
Note - *** Significant at 99% level, ** significant at 95% level, * significant at 90% level.

Journal of Finance and Accountancy Volume 26
Markets Efficiency and Behavioral Biases, Page 20
Table 2. ADF Test on 10-Year Treasury Bonds Yield Curve Rate
Period Events Period Lags in
ADF Test Test Statistics
January 2006 - Freddie Mac Stops buying Subprime Mortgages
01/01/2006 to
02/27/2007 1
-2.291 (0.1750)
Freddie Mac Stops buying Subprime Mortgages –
G20 Summit in London
02/27/2007 to
04/02/2009 3
-0.007 (0.9942)
Bank of America buys Countrywide - Statement of Blackstone CEO
01/11/2008 to
03/10/2009 3
-0.699 (0.9732)
Statement of Blackstone CEO - End of 2010
03/10/2009 to
12/31/2010 0
-0.147 (0.0956)*
G20 Summit in London - End of 2010
04/02/2009 to
12/31/2010 0
-3.893 (0.0124)**
Peak of unemployment - End of 2010
10/30/2009 to
12/31/2010 0
-2.070 (0.5629)
Note - *** Significant at 99% level, ** significant at 95% level, * significant at 90% level.

Journal of Finance and Accountancy Volume 26
Markets Efficiency and Behavioral Biases, Page 21
Table 3. Hurst Exponent of S&P 500 Adjusted Close Price
Period Events Period Generalized
Hurst Exponent
Standard Deviation of
Hurst E
January 2006 - Freddie Mac Stops buying Subprime Mortgages
01/01/2006 to
02/27/2007 0.3979 0.0482
Freddie Mac Stops buying Subprime Mortgages –
G20 Summit in London
02/27/2007 to
04/02/2009 0.4328 0.0129
Bank of America buys Countrywide - Statement of Blackstone CEO
01/11/2008 to
03/10/2009 0.3638 0.0195
Statement of Blackstone CEO - End of 2010
03/10/2009 to
12/31/2010 0.4764 0.0194
G20 Summit in London - End of 2010
04/02/2009 to
12/31/2010 0.4599 0.0331
Peak of unemployment - End of 2010
10/30/2009 to
12/31/2010 0.5240 0.0143

Journal of Finance and Accountancy Volume 26
Markets Efficiency and Behavioral Biases, Page 22
Table 4. Hurst Exponent of 10-Year Treasury Bond Yield Rate
Period Events Period Generalized
Hurst Exponent
Standard Deviation of
Hurst E
January 2006 - Freddie Mac Stops buying Subprime Mortgages
01/01/2006 to
02/27/2007 0.5123 0.0105
Freddie Mac Stops buying Subprime Mortgages –
G20 Summit in London
02/27/2007 to
04/02/2009 0.4719 0.0138
Bank of America buys Countrywide - Statement of Blackstone CEO
01/11/2008 to
03/10/2009 0.4372 0.0165
Statement of Blackstone CEO - End of 2010
03/10/2009 to
12/31/2010 0.4457 0.0283
G20 Summit in London - End of 2010
04/02/2009 to
12/31/2010 0.4549 0.0205
Peak of unemployment - End of 2010
10/30/2009 to
12/31/2010 0.4648 0.0221

Journal of Finance and Accountancy Volume 26
Markets Efficiency and Behavioral Biases, Page 23
Table 5. The Impact on the S&P 500 of Changes in the Sentiment Index
Period Period Positive News
Negative News
# Pos. News
# Neg.
News
January 2006 - Freddie Mac Stops buying
Subprime Mortgages
01/01/2006 to
02/27/2007
0.15% (2.85)**
-0.05% (-0.89)
136 153
Freddie Mac Stops buying Subprime Mortgages – G20 Summit in London
02/27/2007 to
04/02/2009
0.26% (1.76)*
-0.37% (-3.18)***
233 296
Bank of America buys Countrywide -
Statement of Blackstone CEO
01/11/2008 to
03/10/2009
0.14% (0.57)
-0.46% (-2.39)**
115 176
Statement of Blackstone CEO- End of 2010
03/10/2009 to
12/31/2010
0.39% (4.97)***
-0.10% (-1.22)
229 229
G20 Summit in London - End of 2010
04/02/2009 to
12/31/2010
0.32% (4.32)***
-0.10% (-1.32)
219 222
Peak of unemployment - End of 2010
10/30/2009 to
12/31/2010
0.21% (2.32)**
-0.07% (-0.80)
143 151
Note - *** Significant at 99% level, ** significant at 95% level, * significant at 90% level. The corresponding t-value is shown in the parenthesis.

Journal of Finance and Accountancy Volume 26
Markets Efficiency and Behavioral Biases, Page 24
Table 6. The Impact on the 10-Year T-Bond of Changes in the Sentiment Index
Period Period Positive News
Negative News
# Pos. News
# Neg. News
January 2006 - Freddie Mac Stops buying
Subprime Mortgages
01/01/2006 to
02/27/2007
0.03% (0.44)
-0.01% (-0.17)
136 153
Freddie Mac Stops buying Subprime Mortgages – G20 Summit in London
02/27/2007 to
04/02/2009
0.23% (1.47)
-0.31% (-2.29)**
233 296
Bank of America buys Countrywide -
Statement of Blackstone CEO
01/11/2008 to
03/10/2009
0.52% (2.01)**
-0.44% (-2.13)**
115 176
Statement of Blackstone CEO - End of 2010
03/10/2009 to
12/31/2010
0.12% (0.80)
-0.01% (-0.13)
229 229
G20 Summit in London - End of 2010
04/02/2009 to
12/31/2010
0.20% (1.33)
-0.06% (-0.41)
219 222
Peak of unemployment - End of 2010
10/30/2009 to
12/31/2010
-0.02% (0.12)**
-0.01% (-0.06)
143 151
Note - *** Significant at 99% level, ** significant at 95% level, * significant at 90% level. The corresponding t-value is shown in the parenthesis.

Journal of Finance and Accountancy Volume 26
Markets Efficiency and Behavioral Biases, Page 25
Table 7. The Impact on the S&P 500 of Changes in the Sentiment Index with AR Pattern
Period Period Positive News
Negative News
AR(1) AR(2)
# Pos. New
s
# Neg. News
January 2006 - Freddie Mac Stops buying Subprime
Mortgages
01/01/2006 to
02/27/2007
0.14% (2.48)**
-0.039% (-0.68)
9.94% (1.36)
14.8% (-1.64)
136 153
Freddie Mac Stops buying Subprime
Mortgages – G20 Summit in London
02/27/2007 to
04/02/2009
0.39% (2.92)**
*
-0.47% (4.18)**
*
-24.7% (-
6.82)***
-5.85% (-
2.25)** 233 296
Bank of America buys Countrywide -
Statement of Blackstone CEO
01/11/2008 to
03/10/2009
0.28% (1.23)
-0.57% (-
3.20)***
-26.6% (-
4.65)***
-9.48% (-
2.33)** 115 176
Statement of Blackstone CEO - End of 2010
03/10/2009 to
12/31/2010
0.46% (5.61)**
*
-0.18% (-1.90)*
-10.5% (-1.91)*
15.7% (3.11)**
* 229 229
G20 Summit in London - End of 2010
04/02/2009 to
12/31/2010
0.38% (4.78)**
*
-0.17% (-1.88)*
-8.62% (-1.43)
14.8% (2.67)**
* 219 222
Peak of unemployment - End of 2010
10/31/2009 to
12/31/2010
0.24% (2.46)**
-0.10% (-1.00)
-3.68% (-0.47)
9.80% (1.40)
143 151
Note - *** Significant at 99% level, ** significant at 95% level, * significant at 90% level. The corresponding t-value is shown in the parenthesis.
Journal of Finance and Accountancy Volume 26
Markets Efficiency and Behavioral Biases, Page 26
Table 8. Overreaction and Under-reaction on the S&P 500
Period Date Anomaly Lag1 Lag3 Pos / Neg
January 2006 - Freddie Mac Stops buying
Subprime Mortgages
1/1/2006 –
2/27/2007 Overreaction
-0.16% (-2.09)**
Pos
January 2006 - Freddie Mac Stops buying
Subprime Mortgages
1/1/2006 –
2/27/2007 Under-reaction
-0.14% (-
1.72)* Neg
Statement of Blackstone CEO - End of 2010
3/10/2009 –
12/31/2010 Under-reaction
0.24% (2.02)**
Pos
Statement of Blackstone CEO - End of 2010
3/10/2009 –
12/31/2010 Under-reaction
-0.24% (-2.02)**
Neg
Peak of unemployment - End of 2010
10/31/2009 –
21/31/2010 Under-reaction
-0.23% (-1.84)*
Neg
Note - *** Significant at 99% level, ** significant at 95% level, * significant at 90% level. The corresponding t-value is shown in the parenthesis.

Journal of Finance and Accountancy Volume 26
Markets Efficiency and Behavioral Biases, Page 27
Table 9. Overreaction and Under-reaction on the 10-Year T-Bond
Period Date Anomaly Lag3 Lag5 Pos / Neg
Freddie Mac Stops buying Subprime Mortgages – G20 Summit in London
2/27/2007 –
4/2/2009 Overreaction
0.21% (2.31)*
* Pos
Bank of America buys Countrywide -
Statement of Blackstone CEO
1/11/2008 –
3/10/2009 Overreaction
0.89% (2.69)*
** Pos
Statement of Blackstone CEO -
End of 2010
3/10/2009 –
12/31/2010 Overreaction
0.43% (2.01)**
Pos
Statement of Blackstone CEO -
End of 2010
3/10/2009 –
12/31/2010 Under-reaction
-0.44% (2.01)**
Neg
Peak of unemployment - End of 2010
10/31/2009 –
21/31/2010 Overreaction
0.46% (1.76)*
Neg
Note - *** Significant at 99% level, ** significant at 95% level, * significant at 90% level. The corresponding t-value is shown in the parenthesis.