abcs of trading: behavioral biases affect stock … of trading: behavioral biases affect stock...
TRANSCRIPT

ABCs of Trading: Behavioral Biases affect Stock Turnover and Value
Jennifer Itzkowitz*
Stillman School of Business Seton Hall University
400 South Orange Ave South Orange, NJ 07079
Jesse Itzkowitz Yeshiva University
Sy Syms School of Business 215 Lexington Ave
NY, NY 10016 [email protected]
Scott Rothbort
Stillman School of Business Seton Hall University
400 South Orange Ave South Orange, NJ 07079 [email protected]
Current Draft: August 2014
*Corresponding Author. For their valuable comments, we thank Paul Calluzzo and Eleanor Xu. All errors are our own.

2
Abstract
Psychological research suggests that individuals are satisficiers. That is, when confronted with a large number of options, individuals often choose the first acceptable option, rather than the best possible option (Simon 1957). Given the vast quantity of information available and the widespread convention of listing stocks in alphabetical order, we conjecture that investors are more likely to buy and sell stocks with early alphabet names. Consistent with this view, we find that early alphabet stocks are traded more frequently than later alphabet stocks and that alphabeticity also affects firm value. We also document how these effects have changed over time.

3
Before deciding which stocks to buy and sell, investors are confronted with a myriad of
information. Even the casual investor searching an investment website is presented with the
possibility of examining thousands of stocks. For each stock, there is substantial information to
consider (e.g., its ticker symbol, price, 52-week high/low price, year-to-date return, stock
volatility, etc.). Ideally, when making an investment, one should investigate all of the
information about each possible opportunity before deciding. However, due to limits inherent in
humans’ cognitive capacity, and given the vast quantity of options, full information search (and
information use) rarely occurs (Bettman, Luce, and Payne 1998; Simon 1957). Instead, decision-
makers use heuristics, or shortcuts, that simplify the decision process at the expense of using
complete information (Tversky and Kahneman 1973). In this paper, we consider how
information presentation interacts with investors’ information search and how the resultant
investor behavior manifests itself in stock market trading.
We hypothesize that because stock information is most frequently presented in
alphabetical order, stocks with names appearing early in the alphabet (“early alphabet stocks”)
will be traded more frequently than stocks with names that begin with letters that appear later in
the alphabet (“later alphabet stocks”).1 This increased trading results in greater liquidity for early
alphabet stocks, which then increases their valuation relative to later alphabet stocks.
Two behavioral heuristics contribute to the early alphabet effect: satisficing and the status
quo bias. Research in psychology and economics show that when individuals are confronted with
making a choice between a large number of options, each with different attributes, they satisfice,
whereby search ceases after an “acceptable” alternative is found, even if a better alternative
1 This is not the first paper to look at the effect of alphabetical order on decision making. Meer and Rosen (2011) hypothesize that alumni with later alphabet names donate less money because when phone calls are made soliciting donations, the alumni lists appear in alphabetical order. And, Richardson (2010) concludes that because researchers names are listed in alphabetical order in a prominent medical imaging journal, reviewers whose last name started with an A received almost double as many review invitations as their colleagues.

4
could be found through continued search (Caplin, Dean, and Martin 2011; Payne 1976; Simon
1956). Thus, when traders look through lists of stocks, they will be more likely to buy and sell
stocks appearing towards the beginning of the list. Therefore, initial ordering will significantly
affect which stocks are selected for purchase or sale.
Typically, stock information is presented in alphabetical order by firm name or ticker
symbol. When looking for stock information, retail investor websites (such as
Google.com/finance and Finance.yahoo.com) supply a “stock screener” that allows investors to
create a list of stocks meeting given criteria (i.e., market capitalization of $1B and with
headquarters located in the USA and with price below $50 per share). Once this list is generated,
the information is presented in alphabetical order for the user to sift through. Other times,
investors seek information from their portfolios which are are primarily listed in alphabetical
order.2,3 While online portfolios can easily be re-ordered, investors receive paper portfolio
updates in monthly, quarterly, and annual reports. For these print summaries, investments are
also listed in alphabetical order and cannot be resorted. Interviews with institutional investors
indicate that alphabetical presentation is the norm in proprietary databases as well.
It should be noted, that, for online lists, the user can often re-order the list based upon
individual stocks’ values upon a certain attribute (e.g., P/E Ratio, market cap, recent returns, etc.)
rather than using the default (status-quo) ordering. But, individuals most often rely on the default
options given to them (Kahneman, Knetsch, and Thaler 1991; Samuelson and Zechkauser 1988).
Therefore, we hypothesize that investors will focus on stocks with company names (and tickers)
2 Among others, Credit Suisse Securities, Fidelity Investments, Royal Alliance, Raymond James, Scottrade, TD Bank, UBS Financial Services, TD Waterhouse’s Internet trading platforms present customers’ stock holdings in alphabetical order as the default option (by name or ticker). 3 One exception is finance.yahoo.com on which the default is alphabetical order but by industry.

5
that begin with letters towards the front of the alphabet more than those with later alphabet
company names (and tickers).
Finally, as individuals encounter more information and greater numbers of choice options,
reliance upon the status quo, default option, increases (Baumeister, et. al. 1998; Dean 2008). The
advent of the Internet and online trading has increased the amount of information available and
the volume and frequency of trading. As a result, we further hypothesize that the alphabetical
order bias will only be significant following the advent and widespread use of the Internet. That
is, as investors have access to more information, they will tend to focus more on those that are at
the “top” of their lists: companies with early alphabet names.
We first investigate whether alphabetical order affects stock liquidity. Univariate tests
indicate that early alphabet stocks have higher trading volume than later alphabet stocks.
Multivariate tests further confirm our finding that, when ordered alphabetically, early alphabet
stocks have higher turnover, trade volume, and dollar volume, and lower levels of Amihud’s
(2002) illiquidity measure than later alphabet stocks. After controlling for other firm factors, we
find that early alphabet stock turnover is 1.7% higher than that of later alphabet stocks.
We then investigate differences over time. As the amount of information available and the
ease of accessing the information have increased as the result of Internet access and use, we find
that, over time, the trading frequency of early alphabet stocks is relatively greater than the stocks
of other companies. While there is no statistical difference between the trading volume of stocks
based on alphabetical order prior to 1999, as the Internet and online trading became more
widespread, bringing greater access to stock information, significant differences exist afterwards.
Next, we investigate the effects of alphabetical order on firm value. Our initial findings
show that early alphabet stocks are more liquid than later alphabet stocks. This increased

6
liquidity should affect stock value. Amihud and Mendelson (1986) show that firms with higher
levels of liquidity have lower required rates of returns and therefore higher firm values. We thus
expect that early alphabet stocks will have higher valuations than later alphabet stocks.
Consistent with this theory, we find that after 1999, early alphabet stocks have higher market-to-
book ratios and higher Tobin’s Q than later alphabet stocks, even after controlling for firm
characteristics.
We then examine whether our findings are robust to alternative psychological explanations.
One possibility is that investors search through all of the available information, but, due to the
characteristics of human memory, focus more on stocks at the very beginning and very end of
lists. Previous psychological work has shown that an items order in a list affects its
memorability, with greater memory for items that begin the list (primacy effect) and end the list
(recency effect) (Murdock 1962). Indeed, Hartzmark (2014) found that investors were most
likely to trade the first and last stocks in their portfolio regardless of the ordering technique used,
mirroring the serial position curve found in psychology. Our results do not support his finding.
While we find a similar pattern of high turnover and greater valuation for early list stocks (i.e.,
early alphabet stocks), we do not find a rebound in stock turnover or firm value for stocks at the
end of the alphabet. This implies that individuals are ceasing information search before
contemplating all investment options, consistent with satisficing search behavior.
Another possibility is that investors choose to pay close attention to early alphabet stocks
because they are more salient. There is a relatively large body of work in finance documenting
how information salience and investors’ limited attention causes stock mispricing.4,5 Like these
papers, we also show that investors do not use all of the information that is available to them.
4 See for example, Cohen and Frazzini (2008) and Barber and Odean (2006). 5 See for example, Hong and Stein (1999), Hirschleifer and Teoh (2003), and Peng and Xiong (2006).

7
But, rather than relying on the effects of informational salience or investors’ naïve beliefs about
which information “should” be attended to, we show how investors’ informational environments
biases which information is used. Our results are consistent with the idea that investors
demonstrate satisficing behavior and that there is a status-quo bias for information use. To this
end, we examine firm related factors that could increase that firm’s salience (and also
memorability) (e.g., firm age, firm size, and amount of advertising). Even after the inclusion of
these firm characteristics in our analyses, we still find an alphabetical order effect.
Finally, we test other factors that could increase a firm’s salience or memorability. Prior
work has shown that investors display a bias towards firms that have memorable ticker names
(Head, Smith, and Wilson, 2007) and companies with “fluent” names (Green and Jame, 2013).
Again, even after including these name and ticker characteristics in our analysis, an alphabetical
order effect still remains.
In addition to ruling out these alternative explanations, we also show that our results are
insensitive to other measures of alphabeticity, turnover, firm value, and alternate regression
specifications. In all cases, our results are robust. Early alphabet firms exhibit greater turnover
and firm value than later alphabet firms.
Our findings suggest that companies can take advantage of investors' biases. By selecting a
stock and ticker name that appears earlier in the alphabet, firms can improve trading volume and
firm value. We can see evidence of this in the historical data. For example, on September 16,
2003 Pioneer-Standard Electronics, Inc. (ticker: PIOS) became an early alphabet stock when it
changed its name to Agilysys, Inc. (ticker: AGYS).6 The name change was an effort to redefine
their identity and not the result of a merger, acquisition, corporate restructuring, or change in
6http://www.redorbit.com/news/technology/14411/pioneerstandard_electronics_inc_is_now_agilysys_inc/#d5xo3tGQLJ6cU619.99

8
business focus or strategy. The event period cumulative excess return (±5 days) is 1.2%.
Comparing August of 2003 to October 2003, we see a 19.9% increase in average daily trading
volume and a 49% increase in cumulative daily excess return over the S&P500. For Agilysys,
selecting an early alphabet name and ticker appeared to be a relatively low-cost method for
improving both trading volume and market value.
This paper broadens our understanding of the determinants of stock-level trading activity.
Factors that contribute to cross-sectional differences in trading volume are still not satisfactorily
known, as discussed in Chordia et. al. (2007). Extant work investigates various factors related to
investor recognition that positively correlate with stock turnover. Loughran and Schultz (2004)
explore the role of firm location. Grullon et al. (2004) focus on advertising expenditures, and
Chen et al. (2004) concentrate on index addition effects. Our demonstration of alphabetical order
effects on stock turnover deepens this literature.
Although satisficing and the status-quo bias have been well documented independently in
the behavioral sciences, our paper is one of the first to look at how these two biases interact.
Furthermore, our findings are distinct in that they show how these two biases affect information
search (rather than choice) behavior.
1. Data
Our goal is to determine if a firm’s name affects trading volume, and, as a result, firm
value. To test this hypothesis we collect data from a variety of sources. We begin with all firms
listed in Compustat between 1985 and 2012. From this initial sample, we select firms that have
data available from the Center for Research in Security Prices (CRSP). To reduce the effect of
outliers, we also exclude observations that have an annual average turnover ratio greater than
500 percent or a price below $5.
9
We obtain data on the company name (comnam) and ticker symbol (ticker) from CRSP.
Return volatility, firm age, average monthly stock return, average monthly share volume, and
share turnover are collected from CRSP. Return volatility is computed as the standard deviation
of daily returns (ret) over the year. Firm age is constructed as the number of years the firm has
existed on the CRSP database. Average monthly stock return is the annual average of monthly
stock returns (ret). Average monthly share volume is the annual average of monthly share
volumes (vol).7 Share turnover is the annual average of total monthly trading volume (vol)
divided by the number of shares outstanding (shrout).8
Additionally, we collect data on total assets (ta), share price (prc), number of shares
outstanding (csho), advertising expenses (xad), industry (siccd) and operating income before
depreciation (oibdp) from COMPUSTAT. The market value of the equity is equal to the number
of shares outstanding multiplied by the share price. Return on assets is defined as the operating
income before depreciation scaled by total assets.
Finally, we realize that one ideal way to test our hypotheses would be to examine firms
that have undergone name changes. We use the name change classification data from Green and
Jame (2013) for the period 2001 – 2008, graciously provided by Russell Jame. While there were
name changes that occurred, there are only a very small number of changes resulting in a firm
moving from an early to later name or vice versa with no other cofounds. The vast majority of
changes are the result of other confounding events such as mergers or acquisitions.
7 We follow the algorithm suggested by Gao and Ritter (2010) (as defined in Appendix B) for adjust NASDAQ trading volume so that it is comparable to NYSE and AMEX volume. 8 Variables are constructed using the same method as Grullon, Kanatas, and Weston (2013).

10
Unfortunately, after removing these firms, the sample was too small to conduct useful statistical
analyses.9
2. Empirical Results
The main question that we investigate is whether or not the stocks of early alphabet
companies are traded more frequently than the stocks of later alphabet companies. We find that
alphabetical order influences turnover. Figure 1 shows the average annual stock turnover for
companies based on their firm’s ticker symbol. Relative placement in each quintile is determined
on a yearly basis.10 The results show that higher turnover for early alphabet stocks relative to
later alphabet stocks is both economically and statistically significant, supporting our main
hypothesis.
We next test for other differences between early alphabet companies relative to later
alphabet companies. We find that alphabetical order does not affect most firm characteristics.
Table 1 shows comparative statistics for companies in the first alphabetical quintile each year
relative to the rest of the sample, providing several interesting insights. First, firms in the sample
are very diverse including companies with a market value of equity as low as almost $34 million
to as large as $4 billion. Second, while there are significant cross-sectional differences in firm
size, return, and trading volume, there are, not surprisingly, very few differences between early
and later alphabet firms. The only statistically significant difference between early and later
alphabet firms is turnover. This offers strong support for our main hypothesis.
9 Very few firms shift their alphabetical position during our sample period. After removing the firms that changed names due to acquisition or merger, there were thirteen firms left to analyze (9 changed from early alphabet to late alphabet and 4 changed from late alphabet to early alphabet). 10 Baker Hughes Inc., Baldor Electric Co., Ball Corp., Bally Technologies Inc., Bally Total Fitness Holding Corp., and Bard C. R. Inc. were all in the first decile of firms when ranked in alphabetical order in 2007, but were in the second decile in 2008.

11
2.1. Main Results
We begin by investigating changes in the stock market over time. The most significant
change during the sample period was the introduction of Internet trading and online access to
information, which occurred during the 1990s.11 Figure 2 depicts the dramatic increase in the
volume of shares traded over this period. Both greater trading per stock and larger numbers of
stocks available to trade contribute to this. In addition to there being more options to examine,
the Internet has also increased the amount of information available to traders about these stocks.
Furthermore, Internet trading platforms have increased the accessibility of trading for both
regular traders and less sophisticated traders increasing overall trading volume and frequency
(Barber and Odean 2002; Choi, Laibson, and Metrick 2002). Our hypothesis predicts that
investor behavior has changed over time such that alphabetical effects on turnover should grow
stronger as more information becomes available to the market.12 Figure 2 shows not only a
dramatic increase in average annual stock turnover but also that these changes affected early
alphabet stocks more than other stocks.
2.1.1. Trading Volume
We next analyze whether the relationship between firm name and stock turnover holds in a
multivariate framework that controls for other factors that could affect stock turnover. The
regression specification includes controls for a number of both firm and stock-related
characteristics. We control for the firm characteristics: market value of equity (ln(Market Cap)),
as a measure of size, age (ln(Age)), as a measure of risk, profitability (ROA), measured by
operating income before depreciation divided by total assets, and the overall dollar amount spent
11 In August 1994, Ameritrade became the first brokerage firm to offer online trading via its "WealthWEB". E*Trade Secutities’ webpage was launched in 1996 and allowed retail investors direct access to online trading. 12 For other ways in which investors have changed their behavior following the advent of internet trading see Barber and Odean, 2001.

12
on advertising (ln(Advertising)), as a measure of firm visibility (Grullon, Kanatas, and Weston,
2013). The stock-related characteristics that we control for include past stock performance
(Return), volatility (Volatility), as a proxy for risk, and the reciprocal of the price (1/Price), to
capture potential differences in informed versus uninformed traders (Easley, O’Hara, and Saar,
2001). In addition, to capture potential exogenous differences in trading volume, we control for
the main exchange that the stock trades on and whether the company is a technology firm (as
defined in Appendix D of Loughran and Ritter (2004)).
The results summarized in Table 2 Panel A divide the sample into four distinct time
periods to depict the effects of alphabetical order over time. From 1985 – 1998, there is no
statistical difference in the turnover of early alphabet stock relative to later alphabet stocks.
These dates correspond to the time period before widespread Internet use and online trading.
However, during the latter half of the sample, from 1999 – 2012, early alphabet stocks have
greater annual turnover than rest of the firms. This finding is both statistically and economically
significant. These tests support our hypothesis linking a larger availability of information to
greater susceptibility to satisficing and status quo effects.
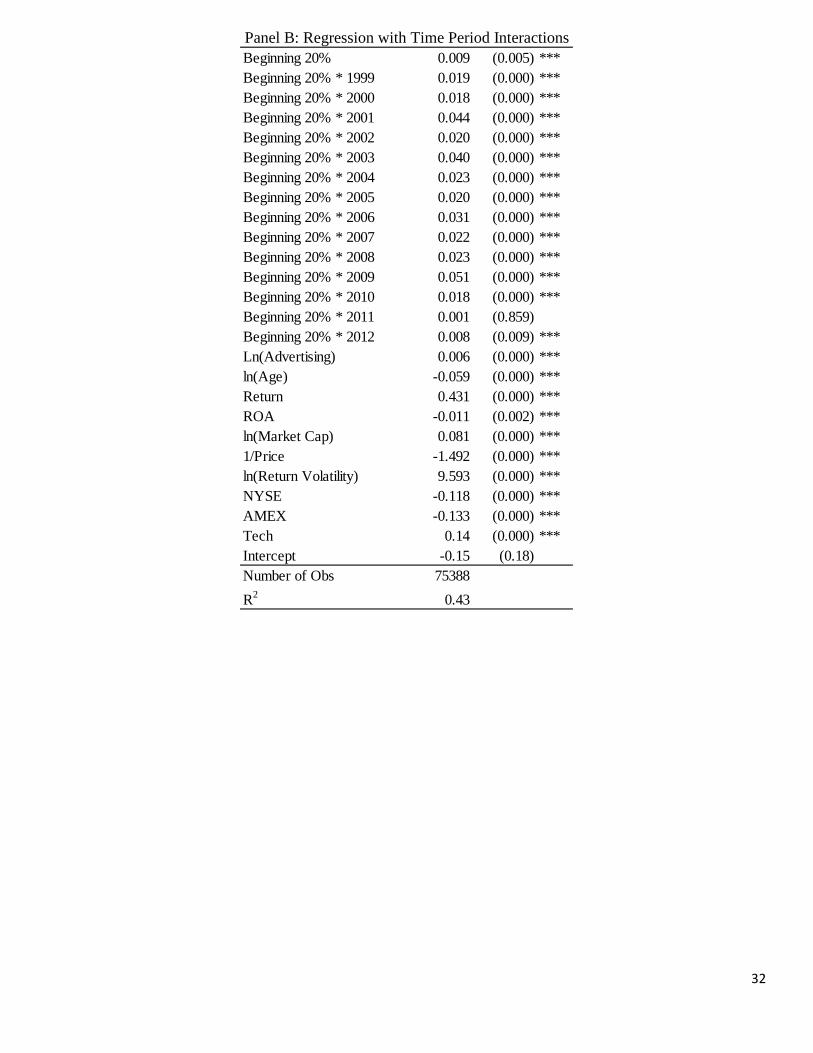
To confirm that there is a persistent difference in trading volume during the latter half of
the sample, we run a regression that includes all years in the sample, interacting the main
variable of interest with a year indicator for each year after 1999. The results, presented in Table
2 Panel B, indicate that on average early alphabet stocks have higher turnover than later alphabet
stocks. Further, in each year following 1999, early alphabet stocks have higher turnover than
they do prior to 1999.13
13 In 2011, the turnover of early alphabet stocks is not statistically different from the turnover of early alphabet stocks during the earlier time period.

13
2.1.2. Firm Value
We next test our hypothesis that alphabetical order also affects firm value by estimating
regressions where the dependent variable is the market-to-book equity ratio, a relative measure
of firm value. The regression specification includes control variables for a number firm
characteristics related to differences in growth opportunities, non-tangible assets, and agency
problems.14 To control for growth opportunities we include log (Age), and log (Total Revenues).
We also include a firm’s profitability (ROA) and whether the firm is in the technology business
(Tech). Advertising may increase firm value through improved recognition so we include
Advertising/Sales to control for this potential effect. To control for agency problems, we include
Leverage because lower cash flows could limit the manager’s ability to implement value
destroying investment decisions. We also control for whether the firm is listed on the NYSE or
AMEX since exchange membership may affect a firm’s investor base and liquidity. We also
include year dummies and industry.
We find greater liquidity for early alphabet stocks is a result of their increased visibility.
Visibility and liquidity have both been shown to increase valuation. Merton’s (1987) investor
recognition hypothesis suggests that low investor recognition leads to poor risk sharing, and the
added risk leads to lower valuations and higher investment returns. Similarly, Amihud and
Mendelson (1986) show that firms with higher levels of liquidity have lower required rates of
returns and therefore higher firm values. These support our hypothesis that early alphabet stocks
will have higher valuations relative to later stocks.
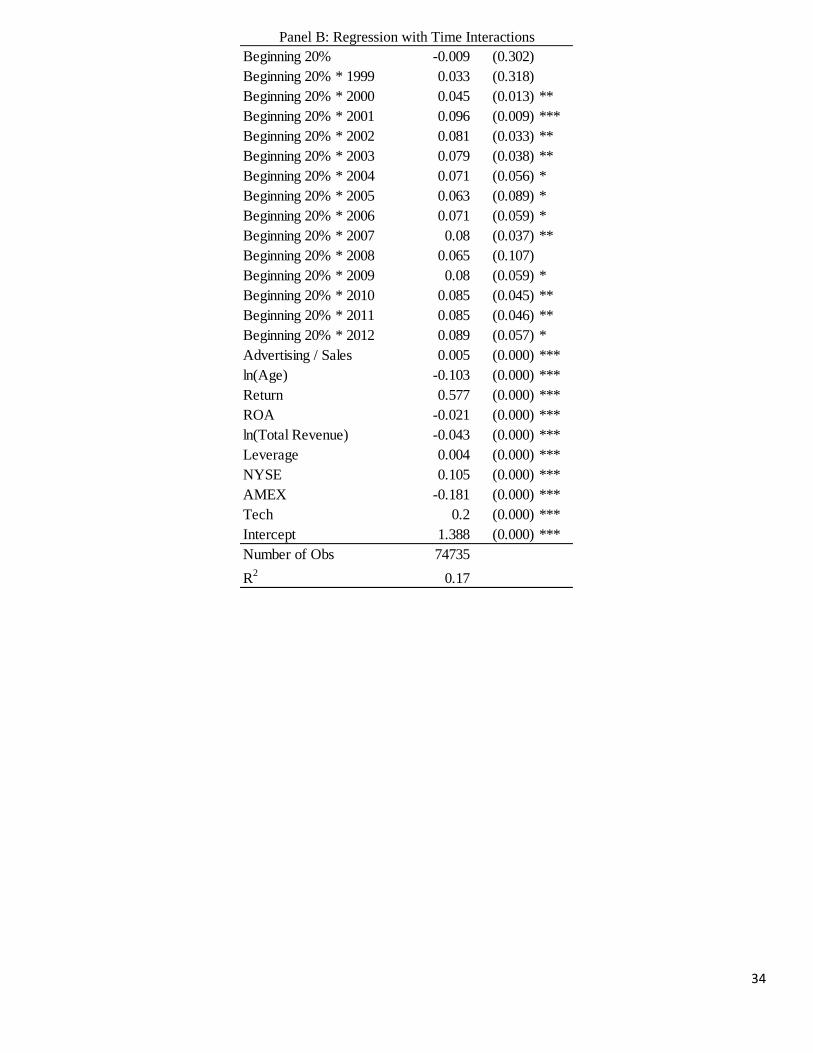
The results summarized in Table 3 divide the sample into four distinct time periods to
show how the effects of alphabetical order on firm value have changed over time. In each
14 The list of valuation controls is related to both Green and Jame (2014) and Edmans, Goldstein, and Jiang (2010) who also provide more detailed justifications.

14
regression, the dependent variable is the firm’s market-to-book (the ratio of market value of equity
to book value of equity). Early in the sample, from 1985 – 1998, there is no statistical difference
between the values of early alphabet stocks relative to others. However, during the latter half of
the sample, from 1999 – 2012, early alphabet stocks have a market-to-book ratio larger than later
alphabet firms. This confirms our main hypothesis as well as supporting our secondary
hypothesis that traders have changed their behavior over time.
The results suggest a new way in which psychological factors influence firm value. This
bias allows companies to take advantage of traders’ biased behavior. Overvalued early-alphabet
companies can potentially issue stock to the market at inflated prices. This would be beneficial to
the firm, and the shift of economic value from the market participants to the company would be a
clear harm to investors.
2.2. Alternative Behavioral Explanations
We perform several tests to rule out alternative behavioral explanations for the alphabetical
order effect. It is possible that our effects are driven by a stocks salience and resultant
memorability rather than being a function of investors’ search processes. Indeed, the effects of
serial order on salience and memorability are well documented. Due to attention and memory
decay processes, people best remember the items that begin a list (primacy) and the items that
conclude a list (recency), with recency being a stronger predictor of recall than primacy
(Murdock 1962). If our effects are memory based, then not only should we see greater turnover
of early alphabet stocks compared to middle alphabet stocks, there should be also greater
turnover of the later alphabet stocks compared to both early and middle alphabet stocks.
Consistent with this pattern of a memory-based effect, Hartzmark (2014) shows greater
turnover for stocks at the beginning and the end of lists among individual investors’ online stock

15
portfolios. This mirrors the typical pattern of human memory where there is enhanced
memorability for items that begin a list (primacy effect) and those that conclude the list (recency
effect). Indeed, Hartzmark (2014) claims that there is greater memorability of the first and last
items due to the attention paid to them during initial search.
We test if the serial position memory effects shown by Hartzmark also account for our
finding. To do this, we include a variable indicating if a stock is in the last 20% of firms when
listed alphabetically. Because our results are only significant after 1999, we limit tests to this
time period. The results can be found in columns 1 and 2 of Table 4. We find no difference
between the trading pattern of the last 20% of firms and their peers, ruling out a memory-based
effect. Thus, our results do not support the process described by Hartzmark (2014).15 While we
find greater turnover for firms at the beginning of the alphabet, we find no rebound in turnover at
the end of the alphabet. This supports a satisficing account, but not one based on stock
memorability or salience.
Another possibility is that early alphabet stocks more memorable or salient for reasons
unrelated to their position in the alphabet. We test a variety of firm and stock characteristics to
provide further evidence that the alphabetical order effect is neither salience nor memory-based
in origin. Table 5 separates the sample into different subsamples to examine the effect of the mix
of other firm characteristics. Because these factors should impact a firm’s salience and/or
memorability, ruling them out further establishes that the alphabetical order effect is due to
15 Our results may also differ from Hartzmark (2014), due to the length of the lists utilized in both studies. Hartzmark (2014) studies trades made from the existing portfolios of online, retail investors. These portfolios had, on average, eight total investments. For these lists of trivial size, where investors are already familiar with many of the investment details, it would not be surprising if every investment were studied. Furthermore, the number of stocks to remember is well within the capacity of investors’ working memory (Miller 1956). Together these factors would facilitate finding effects related to memory and reduce the probability of finding evidence for satisficing. We believe that by examining the entire range of investments possible to an investor (i.e., all stocks in the market), we provide a more real-world and conservative test of both psychological explanations.

16
satisficing search behavior, rather than attention or memorability. Specifically, we confirm that
regardless of firm age, firm size, and advertising budget, our main results still hold.
We first test firm age. One might argue that older firms are more memorable or more
salient and, as a result, our results are simply an artifact of finding a young firm effect. To test
this, we divide firms according to firm age as determined by the number of years that a firm is
listed in CRSP. We consider a firm to be young (old) if it is below (above) the median sample
firm age. We find that, regardless of firm age, companies with early alphabet names have higher
stock turnover than the stocks of later alphabet firms.
Next, we test firm size. One possibility is that larger firms are better known than smaller
firms and that our results just capture a small firm effect. To test this, we measure firm size using
both total assets and market value of equity. A firm is considered small (large) if it is below
(above) the median firm size. In untabulated results, we replicate the tests for firms considered
small (large) if it is below (above) the 25th (75th) percentile of firm size. Again, even with firm
size included in our analyses, an alphabetical order bias persists.
Previous findings have also shown that a firm’s visibility, as measured by its advertising
expenditures, is associated with greater liquidity of their common stock (Grullon, Kanatas, and
Weston 2013).16 This also suggests a salience or memory effect. If a firm is more visible, it
should be more salient and memorable as well. Again, even after accounting for advertising
expenditures, we find that firms with early alphabet names have higher stock turnover than firms
at the end of the alphabet.
In addition to serial position and firm characteristics, factors related to a stock’s ticker
itself could also influence salience and memorability. We examine this possibility in several
ways. First, prior work by Head, Smith, and Wilson (2007) has shown that investors display a 16 If a firm does not list the amount spent on advertising, we assume that no money is spent.

17
bias towards firms with clever ticker names. To account for this, we include the indicator
variable created by Head, Smith, and Wilson (2007). The results are presented in Table 4 column
3. We find that firms with clever tickers do not have higher turnover and that even after
controlling for clever tickers, early alphabet stocks still trade more than later alphabet stocks.
Next, research from the behavioral sciences has shown that words that are more easily
processed are more salient and memorable than words that are harder to process. These easy to
process words are known as being “fluent”. To this end, work by Green and Jame (2013) show
that there is greater turnover for stocks that have “fluent” ticker names. As a proxy for ticker
fluency, we include an indicator for whether a ticker is a real word identified in the dictionary
(similar to Anderson and Larkin (2012)). The results are presented in column 4 of Table 4. We
find that firms with real word tickers do not have higher turnover compared to nonsense tickers.
And, even after the inclusion of this variable, evidence showing greater turnover for early
alphabet stocks still persists.
To confirm the efficacy of our results, we run several additional tests. In untabulated tests,
we replicate all of the tests in Table 4 and Table 5, using the specification in Table 2to
investigate the effects of satisficing and other behavioral bias on firm valuation. We find that
firms with tickers at the end of the alphabet do not trade at higher valuations that either middle of
the alphabet or beginning of the alphabet firms. This confirms that satisficing, not serial position,
is the driver of investors’ behavior. Next we break the firms up by subgroups based on firm age,
size, and advertising expenses. Regardless of the subsample tested, early alphabet firms still
retain relatively higher valuations than later alphabet firms. Finally, we find that stocks
possessing clever tickers or “word” do not trade at higher valuations than other stocks. Taken

18
together these results support the hypothesis that early alphabet stocks are traded more frequently
and at higher valuations due to investors’ satisficing search behavior.
2.3. Robustness
2.3.1. Additional Tests of Trade Frequency
We test alternate measures of stock trading frequency to confirm the robustness of earlier
tests. The results are summarized in Table 6.17 The first panel reports cross-sectional OLS
regressions including year and industry dummies where the standard errors are clustered by firm
and year. The second panel reports regressions based on the method presented in Fama and
MacBeth (1973). Using this approach, for each year, a cross-sectional regression is estimated.18
This method effectively treats each year as an independent cross-section, eliminating the
problem of cross-sectional correlation in the residuals.
The first column of each panel in Table 6 presents a regression in which turnover
(ln(Turnover)) is the dependent variable. The tests confirm our earlier finding. Firms with early
alphabet names have higher stock turnover relative to later alphabet stocks. Being in the
beginning of the alphabet, rather than later in the alphabet, results in 1.7% greater stock turnover.
In Table 6, columns 2 and 3 of each panel present results where trading volume and dollar
volume are the dependent variables, respectively. In each case, the results confirm the main
hypothesis and the results presented in column 1; stocks of firms with names that appear at the
beginning of the alphabet trade more frequently than other stocks.
17 Because we only see a difference when comparing early alphabet stocks to later alphabet stocks during 1999 – 2012, robustness tests are limited to this time frame. 18 The coefficients and standard errors based on the Fama-MacBeth method are estimated using the Stata code associated with Petersen (2009).

19
In Table 6, column 4 we use Amihud’s (2002) measure of illiquidity as the dependent
variable. Here, we show that our finding of greater turnover is unrelated to private information. If
higher turnover of early alphabet stocks is related to private information, then having a name that
occurs early in the alphabet would increase adverse selection costs, leading to higher price
impacts. However, if the turnover we show is unrelated to private information, then early
alphabet stocks would have smaller price impacts. To address this issue, we use the Amihud’s
(2002) illiquidity measure as a proxy for the impact of order flow on prices. Because stock
volume and liquidity are related, the same control variables are used. The results indicate smaller
price impacts (greater liquidity) for early alphabet firms. Taken together, the tests in this table
confirm that our measure of stock turnover is robust. And despite alternative specifications, the
results are consistent with our main hypothesis that investors satisfice and that early alphabet
stocks trade more frequently due to investors’ use of heuristics rather than the use of private
information.
2.3.2. Additional Tests of Firm Value
We also test an alternate measure of value, Tobin’s Q, which is the ratio of enterprise value
(debt plus market equity) to book value (debt plus book equity). The results are summarized in
Table 7. The first panel reports cross-sectional OLS regressions including year and industry
dummies and standard errors that are clustered by firm and year. The second panel reports
regressions based on the method presented in Fama and MacBeth (1973). Regardless of the
dependent variable or the regression specification, the main result holds. During the time period
from 1999 to 2012, following dramatic changes in the market, early alphabet stocks have higher
valuation than their later alphabet peers. This confirms the robustness of our measure of firm
value.

20
2.3.3. Alternate measures of “Early Alphabet”
Table 8 presents the results of regressions where alternative measures of alphabeticity are
considered. Panels A and B shows the results of regressions in which the dependent variables are
stock turnover and stock value, respectively. For the sake of brevity, only the main coefficient of
interest is shown in the table. Initially, a company was considered “early alphabet” if its ticker
was in the first 20% when ordered alphabetically. However, 20% is a relative measure, varying
by year. Instead, we begin by considering absolute rather than relative cutoffs. We first consider
the actual letter that begins a firm’s ticker rather than its relative position. We then look at firm’s
name rather than its ticker.19 Next, we classify firms as an early alphabet stock if it is one of the
first 200 or 300 firms, respectively. We also consider other relative cutoffs for “early
alphabeticity” where a firm is considered to be at the beginning of the alphabet if it is in the first
10% of firms by ticker. And again, we repeat the tests for companies in the top 10% and 20%
when ordered by company name as opposed to ticker. Finally, in untabulated results, we run all
of the regressions presented in Table 8 using the Fama-MacBeth specification. For all of these
additional tests, results are robust to the alternate definitions and specifications and again support
the main finding. Early alphabet stocks have greater turnover and higher valuations than later
alphabet stocks.
Finally, we test whether our results are spurious; driven by a few key outliers. To do so,
we sort the stocks by year and trading volume. Despite the ease with which we can think of high
volume early alphabet stocks (e.g. Apple, Boeing, Chrysler), we find that high volume stocks do
not cluster at the beginning of the alphabet. Only 10% of the top 10 firms each year by volume
19 Ninety-eight percent of firm’s names begin with the same letter that their ticker symbol begins with.

21
fall in the top 20% of firms in alphabetical order each year.20 When we test our results again,
removing the stocks with the highest volume, the main effect becomes even stronger. To remove
the effect of large stocks, we repeat this test for high turnover stocks (in which volume is divided
by shares outstanding). Again, the 10 highest turnover stocks each year are not early alphabet
stocks and their removal from our analyses further strengthens the main effect.
3. Conclusion
This paper demonstrates that investors’ satisficing behavior and their susceptibility to the
status quo bias affects the stock market. Investors’ internal biases interact with the way that
information is presented to them (which is typically alphabetical). Consistent with our
hypotheses, we find that early alphabet stocks are traded more frequently and have higher
valuations than stocks that begin with letters later in the alphabet. We also document a time
trend. As more information has become available to the market (i.e., through information
technology), investors have become more likely to focus on early alphabet stocks. Together, the
findings indicate that the widespread convention of sorting stocks alphabetically dramatically
affects investor behavior, stock turnover, and firm valuation.
Our findings contribute to the growing literature demonstrating the interaction between
investors’ behavioral factors and their informational environments. We show that investors focus
on early alphabet stocks due to the result of two behavioral heuristics: satisficing and the status
quo bias. Specifically, our results show that when investors search through stock information,
they satisfice. That is, rather than investigating each and every stock in the list, their search
ceases after an “acceptable” alternative is found or when they tire of the information search
process (Caplin, Dean, and Martin 2011; Payne 1976; Simon 1956). So, when traders look 20 Later alphabet high volume stocks include Dell, Exxon Mobile, Ford Motor, General Electric, Hewlett-Packard, Intel, IBM, Motorola, Merck, Microsoft, Pepsi, Pfizer, Sears, Sun Microsystems, Texaco, Time Warner, Unisys, Wal-Mart, and Yahoo.

22
through lists of stocks, those appearing towards the beginning of the list garner more attention
than those that appear towards the end. This means that the initial ordering will significantly
affect the stocks selected for trade. And, because, investors rely on the default option (Samuelson
and Zeckhauser 1988), and because stock information is presented alphabetically, investors
should move through the list in an alphabetical order rather than resorting it or searching in a
random manner. Thus, early alphabet stocks should trade more than later alphabet stocks, which
is the exact finding of this work.
We also provide other evidence that supports a satisficing account. Previous work in
psychology has shown that reliance on the default option increases as individuals encounter more
information (Baumeister, Bratslavsky, Muraven, and Tice 1998; Dean 2008). Thus as investors
have access to more information, they will tend to focus more on those that are at the “top” of
their lists (i.e., those that begin with letters appearing early in the alphabet). As a result, we
expect the alphabetical order bias to gain in strength over time in correspondence with the
increased informational access the Internet provides.
Our evidence supports this hypothesis. First, we document changes over time. As the
amount of information available has expanded as a result of Internet access, we find that, over
time, greater turnover for early alphabet firms increases. Whereas there are no differences in
turnover based on alphabetical order in the pre-Internet era (prior to 1999), differences develop
as Internet use became standard. This fits a satisficing account of trading behavior, but not a
memory-based one, where the amount of available information should not affect the
memorability of early (or late) items.
Other recent work has also examined the role of ordering on stock turnover, but as the result
of a different psychological process (Hartzmark 2014). Our findings do not support the process

23
described by Hartzmark (2014). While we find greater turnover for firms at the beginning of the
alphabet, we find no rebound in turnover at the end of the alphabet. This supports a satisficing
account, but not one based on stock memorability.
Additionally, we test a number of other factors that could increase a firm’s salience (and
memorability) due to the nature of the firm (e.g., firm age, firm size, amount of firm advertising)
and due to the nature of the firm’s ticker (e.g., memorable ticker names, ticker names that are
words, and “fluent” tickers). In every case, an alphabetical order effect persists. Together, the
lack of a rebound in stock turnover for items at the end of the list and the persistence of our result
even when accounting for other factors related to salience and memorability provide evidence of
a search-based satisficing process.
We also provide further robustness for our results using other univariate and multivariate
tests that include different proxies for trade frequency: stock turnover, trade volume, dollar
volume, and Amihud’s (2002) illiquidity measure. These tests also show that even after
controlling for other factors, the effect holds.
Finally, we find evidence that this bias has implications for firms and the stock market. We
show that early alphabet stocks have higher valuation than later alphabet stocks. Again,
additional analyses demonstrate that the results are robust to different measures of value,
alternative measure of “early alphabet”, and other regressions specifications.
Together, these findings contribute to the growing literature within finance that documents
how irrational investor behavior affects firm value. We show a novel interaction between the
structure of investors’ informational environments and two behavioral heuristics. These findings
provide a new addition to the extant behavioral literature as well. We show that status-quo bias
does not only affect individuals’ choices, but also their manner of information search.

24
The research presented here also poses some interesting questions for future research. From
a behavioral standpoint, it would be interesting to determine the boundary conditions of
individuals’ use of the status-quo bias in information search. That is, does it matter how much
information is presented to the investor before they use the default search order? It would also be
useful to determine if the biases shown here affected other types of business behavior as well.
Because many business decisions require sifting through large amounts of information, it seems
likely that order effects could prevail in other domains with varying consequences.

25
References Amihud, Y., 2002, Illiquidity and Stock Returns: Cross Section and Time Series Affects. Journal
of Financial Markets 5, 31–56.
Amihud, Y., and H. Mendelson, 1986, Asset pricing and the bid-ask spread, Journal of Financial Economics 17, 223–249.
Anderson, Alyssa and Yelena Larkin, 2012, Does Non-Informative Text affect Investor Behavior? Working paper.
Barber, Brad and Terrance Odean, 2001, The Internet and the Investor, Journal of Economic Perspectives 15, 41 – 45.
Barber, Brad and Terrance Odean,, 2002, Online investors: Do the slow die first?, Review of Financial Studies 15, 455 - 487.
Barber, Brad, and Terrance Odean, 2006, All that glitters: The effect of attention and news on the buying behavior of individual and institutional investors, Review of Financial Studies 21, 785–818.
Baumeister, Roy F., Ellen Bratslavsky, Mark Muraven, and Dianne M. Tice, 1998, Ego
depletion: Is the active self a limited resource?, Journal of Personality and Social Psychology 74, 1252 - 1265.
Bettman, James R., Mary Francis Luce, and John W. Payne, 1998, Constructive consumer choice preferences, Journal of Consumer Research 25, 187-217.
Caplin, Andrew, Mark Dean, and Daniel Martin, 2011, Search and satisficing, The American Economic Review 101, 2899-2922.
Chen, H., G. Noronha, and V. Singal, 2004, The price response to SP 500 index additions and deletions: Evidence of asymmetry and a new explanation, Journal of Finance 59, 1901–1929.
Choi, James J., David Laibson, and Andrew Metrick, 2002, How does the internet affect trading? Evidence from investor behavior in 401(k) plans, Journal of Financial Economics 64, 397 - 421.
Chordia, Tarun, Richard Roll, and Avanidhar Subrahmanyam, 2002, Order imbalance, liquidity, and market returns, Journal of Financial Economics 65, 111-130.
Cohen, Lauren, and Andrea Frazzini, 2008, Economic Links and Predictable Returns, The Journal of Finance 63: 1977 – 2011.
Dean, Mark, 2008, Status quo bias in large and small choice sets, Working paper. Easley, David, Maureen O’Hara, and Gideon Saar, 2001, How stock splits affect trading: A
microstructure approach, Journal of Financial and Quantitative Analysis 36, 25-51.

26
Edmans, Alex and Diego Garcio, and Oyvind Norli, 2007, Sports sentiment and stock returns, Journal of Finance 62, 1967 - 1998.
Fama, E.F. and J.D. Macbeth., 1973, Risk, return, and equilibrium: Empirical tests, Journal of Political Economy 81, 607 - 636.
Gao, Xiaohui and Jay Ritter, 2010, The Marketing of Seasoned Equity Offerings, Journal of Financial Economics 97, 33 – 52.
Green. T. Clifton and Russell Jame, 2013, Company name fluency, investor recognition, and firm value, Journal of Financial Economics 109, 813-834.
Grullon, Gustavo, George Kanatas, and James P. Weston, 2004, Advertising, breadth of ownership, and liquidity, Review of Financial Studies 17, 439-461.
Hirshleifer, David, Sonya Lim, and Siew Hong Teoh. 2011. Limited Investor Attention and Stock Market Misreactions to Accounting Information. Review of Asset Pricing Studies 1(1): 35-73.
Head, Alex, Gary Smith, and Julia Wilson, 2009, Would a stock by any other ticker smell as
sweet? Quarterly Review of Economics and Finance 49, 551-561.
Hirshleifer, David and Siew Hong Teoh 2009. Driven to Distraction: Extraneous Events and Underreaction to Earnings News. Journal of Finance 64:2289–325.
Hong, Harrison, and Jeremy Stein, 1999, A unified theory of underreaction, momentum trading,
and overreaction in asset markets, The Journal of Finance 54, 2143–2184. Kahneman, Daniel, Jack L. Knetsch, and Richard H. Thaler, 1991, Anomalies: The endowment
effect, loss aversion, and status quo bias, The Journal of Economic Perspectives 5, 193-206.
Loughran, T., and P. Schultz, 2004, Weather, stock returns, and the impact of localized trading
behavior, Journal of Financial and Quantitative Analysis 39, 343–364. Loughran, Tim and Jay Ritter, 2004, Why Has IPO Underpricing Changed Over Time?
Financial Management 33, 5 – 37. Meer, J., and H. S. Rosen, 2011, The ABCs of Charitable Solicitation, Journal of Public
Economics 95, 363 - 371. Merton, R. C., 1987, A Simple Model of Capital Market Equilibrium with Incomplete
Information, Journal of Finance, 42, 483–510. Murdock, Bennet B., 1962, The serial position effect of free recall, Journal of Experimental
Psychology, 64, 482-488.
27
Payne, John W., 1976, Task complexity and contingent processing in decision making: An information search and protocol analysis. Organizational behavior and human performance, 16, 366-387.
Peng, L., and W. Xiong. 2006. Investor Attention, Overconfidence, and Category Learning.
Journal of Financial Economics 80:563–602. Petersen, M. A., 2009, Estimating standard errors in finance panel data sets: Comparing
approaches, Review of Financial Studies, 22, 435–480. Richardson, M. L., 2010, Alphabetic bias in the selection of reviewers for the American Journal
of Roentgenology, American Journal of Roentgenology, 191, 213–216. Samuelson, William, and Richard Zeckhauser, 1988, Status quo bias in decision making, Journal
of Risk and Uncertainty 1, 7-59. Simon, Herbert A., 1956, Rational choice and structure of the environment, Psychological
Review 63, 129-138. Simon, Herbert A., 1957, Models of Man: Social and Rational. New York: John Wiley and Sons,
Inc. Tversky, Amos and Daniel Kahneman, 1973, Availability: A heuristic for judging frequency and
probability. Cognitive Psychology 5, 207-232.

28
Figure 1 – Average Stock Turnover by Alphabetic Quintile
This figure compares the effect of alphabetical order based on the first letter of the firm’s ticker. Annual stock turnover is the average of total monthly trading volume divided by the number of shares outstanding. Quintile 1 is statistically different from each of quintiles 2 through 5 at the 1% level.

29
Figure 2 – Average Stock Turnover over Time
This figure compares the effect of alphabetical order based on the first letter of the firm’s ticker over time. Mean turnover is the average of total monthly trading volume divided by the number of shares outstanding.
0
0.5
1
1.5
2
2.5
3
1985
1986
1987
1988
1989
1990
1991
1992
1993
1994
1995
1996
1997
1998
1999
2000
2001
2002
2003
2004
2005
2006
2007
2008
2009
2010
2011
2012
Stock Turnover
Early Alphabet Firms Later Alphabet firms

30
Table 1 – Alphabetical Order and Firm Characteristics
This table presents univariate statistics comparing the effect of alphabetical order based on the first letter of the firm’s ticker on a variety of firm characteristics for firms from 1985 - 2012. Age (Years) is the number of years since the firm first appeared in the CRSP database. Market Value of Equity is the firm’s market cap. ROA is measured as operating income before depreciation divided by total assets. Stock Price is the stock’s closing price at the end of the year. Return is the average of the monthly returns for each stock. Return Volatility is the standard deviation of daily returns over each year. Advertising is the total amount of money spent on advertising.
Mean P 10 Median P 90 Mean P 10 Median P 90Turnover 1.36 0.20 0.83 2.89 1.27 0.18 0.78 2.75Market Value of Equity 2104849 34928 260714 3830164 2463481 32561 244431 3232061Age 12.96 1 8 31 13.07 1 8 32Price 21.78 6.28 15.71 44.99 21.33 6.22 15.14 43.57Advertising / Sales 0.02 0 0 0 0.02 0 0 0Return 0.03 -0.04 0.02 0.10 0.03 -0.03 0.02 0.10Return Volatility 0.03 0.02 0.03 0.05 0.03 0.02 0.03 0.06Leverage 2.36 0.19 0.84 3.03 2.13 0.19 0.83 2.85Revenue / Total Assets 1.20 0.32 1.05 2.19 1.21 0.35 1.06 2.16
Alphabetical Quintiles 2 - 5Alphabetical Quintile 1
N = 54691N = 13623

31
Table 2 – The Effect of Alphabetical Order on Stock Turnover over Time
Table 2 reports OLS regressions for four different time periods. The dependent variable in every regression the natural log of turnover defined as the average of total monthly trading volume divided by the number of shares outstanding. Beginning 20% is an indicator for whether the stock ticker is in the first 20% when ordered alphabetically. Advertising is the total amount of money spent on advertising. Age is the number of years since the firm first appeared in the CRSP dataset. Return is the average of the monthly returns for each stock. ROA is measured as operating income before depreciation divided by total assets. Market Value of Equity is the firm’s market cap Price is the stock’s closing price at the end of the year. Return Volatility is the standard deviation of daily returns over each year. NYSE and AMEX indicate the primary exchange that the stock is traded on. Tech indicates whether the firm is in technology. All models include unreported industry and year effects and the standard errors are clustered by firm and year. The standard errors in Panel B are not clustered by year. P-values are shown in parentheses. The symbols ***, **, and * indicate statistical significance at the 1%, 5%, and 10% levels, respectively.
Panel A: Regressions by Time Period
Beginning 20% 0.007 0.015 0.032 *** 0.029 *(0.539) (0.127) (0.004) (0.061)
Ln(Advertising) 0.004 0 0.003 0.009 *(0.219) (0.941) (0.606) (0.056)
ln(Age) -0.060 *** -0.088 *** -0.040 ** -0.013(0.000) (0.000) (0.019) (0.225)
Return 0.595 *** 0.601 *** 0.420 *** 0.236(0.000) (0.000) (0.004) (0.104)
ROA -0.016 *** -0.015 ** -0.012 * -0.004(0.009) (0.021) (0.093) (0.668)
ln(Market Cap) 0.053 *** 0.064 *** 0.090 *** 0.128 ***(0.000) (0.000) (0.000) (0.000)
1/Price -0.695 *** -1.132 *** -2.155 *** -1.197 ***(0.003) (0.000) (0.000) (0.002)
ln(Return Volatility) 5.968 *** 5.478 *** 9.966 *** 14.428 ***(0.000) (0.000) (0.000) (0.000)
NYSE -0.057 *** -0.185 *** -0.187 *** -0.045 **(0.000) (0.000) (0.000) (0.02)
AMEX -0.107 *** -0.173 *** -0.191 *** -0.234 ***(0.000) (0.000) (0.000) (0.000)
Tech 0.157 *** 0.201 *** 0.140 *** 0.068 ***(0.000) (0.000) (0.000) (0.000)
Intercept -0.151 ** -0.008 -0.346 ** -1.102 ***(0.014) (0.932) (0.038) (0.000)
Number of Obs 13705 22686 19352 14736R2 0.26 0.33 0.42 0.33
2006 - 20121999 - 20051992 - 19981985 - 1991
32
Panel B: Regression with Time Period Interactions
Beginning 20% 0.009 (0.005) ***Beginning 20% * 1999 0.019 (0.000) ***Beginning 20% * 2000 0.018 (0.000) ***Beginning 20% * 2001 0.044 (0.000) ***Beginning 20% * 2002 0.020 (0.000) ***Beginning 20% * 2003 0.040 (0.000) ***Beginning 20% * 2004 0.023 (0.000) ***Beginning 20% * 2005 0.020 (0.000) ***Beginning 20% * 2006 0.031 (0.000) ***Beginning 20% * 2007 0.022 (0.000) ***Beginning 20% * 2008 0.023 (0.000) ***Beginning 20% * 2009 0.051 (0.000) ***Beginning 20% * 2010 0.018 (0.000) ***Beginning 20% * 2011 0.001 (0.859)Beginning 20% * 2012 0.008 (0.009) ***Ln(Advertising) 0.006 (0.000) ***ln(Age) -0.059 (0.000) ***Return 0.431 (0.000) ***ROA -0.011 (0.002) ***ln(Market Cap) 0.081 (0.000) ***1/Price -1.492 (0.000) ***ln(Return Volatility) 9.593 (0.000) ***NYSE -0.118 (0.000) ***AMEX -0.133 (0.000) ***Tech 0.14 (0.000) ***Intercept -0.15 (0.18)Number of Obs 75388R2 0.43

33
Table 3 – The Effect of Alphabetical Order on Stock Value over Time
Table 3 reports OLS regressions for four different time periods. The dependent variable the market value of equity divided by the book value of equity. Advertising/Sales is the amount of money spent on advertising divided by total sales. Age is the number of years since the firm first appeared in the CRSP dataset. Return is the average of the monthly returns for each stock. ROA is measured as operating income before depreciation divided by total assets. Ln(Total Revenue) is the natural log of total revenue. Leverage is a ratio of debt to total assets. NYSE and AMEX indicate the primary exchange that the stock is traded on. Tech indicates whether the firm is in technology. Regressions include unreported year and industry fixed effects and the standard errors are clustered by firm and year. The standard errors in Panel B are not clustered by year. P-values are shown in parentheses. The symbols ***, **, and * indicate statistical significance at the 1%, 5%, and 10% levels, respectively.
Panel A: Regression by Time Period
Beginning 20% -0.029 0.018 0.054 ** 0.071 ***(0.262) (0.396) (0.028) (0.008)
Advertising / Sales 0.669 * 0.729 *** 0.001 0.483 *(0.094) (0.001) (0.136) (0.098)
ln(Age) -0.095 *** -0.108 *** -0.101 *** -0.073 ***(0.000) (0.000) (0.000) (0.000)
Return 1.05 *** 0.446 *** 0.592 *** 0.632 ***(0.000) (0.000) (0.000) (0.002)
ROA 0.004 -0.01 -0.037 *** -0.012(0.747) (0.321) (0.003) (0.476)
ln(Total Revenue) -0.041 *** -0.056 *** -0.035 *** -0.025 ***(0.000) (0.000) (0.006) (0.004)
Leverage 0.014 *** 0.005 *** 0.003 ** 0.003 ***(0.000) (0.005) (0.013) (0.003)
NYSE 0.143 *** 0.174 *** 0.039 0.042(0.000) (0.000) (0.251) (0.169)
AMEX -0.186 *** -0.133 *** -0.191 *** -0.187 ***(0.000) (0.001) (0.000) (0.003)
Tech 0.159 *** 0.239 *** 0.27 *** 0.042(0.000) (0.000) (0.002) (0.201)
Intercept 0.963 *** 1.335 *** 1.281 *** 1.219 ***(0.000) (0.000) (0.000) (0.000)
Number of Obs 13673 22469 19170 14518R2 0.16 0.16 0.14 0.11
1985 - 1991 1992 - 1998 1999 - 2005 2006 - 2012
34
Panel B: Regression with Time Interactions
Beginning 20% -0.009 (0.302)Beginning 20% * 1999 0.033 (0.318)Beginning 20% * 2000 0.045 (0.013) **Beginning 20% * 2001 0.096 (0.009) ***Beginning 20% * 2002 0.081 (0.033) **Beginning 20% * 2003 0.079 (0.038) **Beginning 20% * 2004 0.071 (0.056) *Beginning 20% * 2005 0.063 (0.089) *Beginning 20% * 2006 0.071 (0.059) *Beginning 20% * 2007 0.08 (0.037) **Beginning 20% * 2008 0.065 (0.107)Beginning 20% * 2009 0.08 (0.059) *Beginning 20% * 2010 0.085 (0.045) **Beginning 20% * 2011 0.085 (0.046) **Beginning 20% * 2012 0.089 (0.057) *Advertising / Sales 0.005 (0.000) ***ln(Age) -0.103 (0.000) ***Return 0.577 (0.000) ***ROA -0.021 (0.000) ***ln(Total Revenue) -0.043 (0.000) ***Leverage 0.004 (0.000) ***NYSE 0.105 (0.000) ***AMEX -0.181 (0.000) ***Tech 0.2 (0.000) ***Intercept 1.388 (0.000) ***Number of Obs 74735R2 0.17

35
Table 4 – Ruling Out Alternative Behavioral Explanations
Table 4 reports OLS regressions in which the dependent variable is the natural log of turnover defined as the average of total monthly trading volume divided by the number of shares outstanding. Beginning (Ending) 20% is an indicator for whether the stock ticker is in the first (last) 20% when ordered alphabetically. Advertising is the total amount of money spent on advertising. Age is the number of years since the firm first appeared in the CRSP dataset. Return is the average of the monthly returns for each stock. ROA is measured as operating income before depreciation divided by total assets. Market Value of Equity is the firm’s market cap. Price is the stock’s closing price at the end of the year. Return Volatility is the standard deviation of daily returns over each year. NYSE and AMEX indicate the primary exchange that the stock is traded on. Tech indicates whether the firm is in technology. All models include unreported industry and year effects and the standard errors are clustered by firm and year. P-values are shown in parentheses. The symbols ***, **, and * indicate statistical significance at the 1%, 5%, and 10% levels, respectively.
Beginning 20% 0.033 *** 0.066 *** 0.060 **(0.008) (0.004) (0.016)
Ending 20% -0.005 0.003(0.719) (0.803)
Clever Ticker 0.097(0.517)
Word 0.019(0.623)
Ln(Advertising) 0.005 0.006 0.002 0.009(0.257) (0.222) (0.802) (0.309)
ln(Age) -0.027 ** -0.027 ** -0.072 *** -0.089 ***(0.028) (0.028) (0.003) (0.000)
Return 0.422 *** 0.422 *** 0.694 *** 0.344(0.005) (0.005) (0.002) (0.253)
ROA -0.007 -0.007 -0.010 -0.022(0.315) (0.324) (0.448) (0.116)
ln(Market Cap) 0.111 *** 0.111 *** 1.229 *** 1.153 ***(0.000) (0.000) (0.000) (0.000)
1/Price -1.72 *** -1.721 *** -3.025 *** 9.308 ***(0.000) (0.000) (0.000) (0.000)
ln(Return Volatility) 12.016 *** 12.009 *** 19.603 *** 20.499 ***(0.000) (0.000) (0.000) (0.000)
NYSE -0.107 *** -0.107 *** 0.013 0.031(0.000) (0.000) (0.840) (0.672)
AMEX -0.206 *** -0.207 *** -0.389 *** -0.497 ***(0.000) (0.000) (0.000) (0.000)
Tech 0.097 *** 0.097 *** 0.190 *** 0.215 ***(0.000) (0.000) (0.000) (0.000)
Intercept -0.705 *** -0.708 *** -3.003 *** -5.781 ***(0.000) (0.000) (0.000) (0.000)
Number of Obs 30755 30755 30755 30755R2 0.37 0.37 0.89 0.82
(4)(3)(2)(1)

36
Table 5 – The Effect of Alphabetical Order on Stock Turnover for Subgroups of Firms
Table 5 reports OLS regressions for stocks from 1999 - 2012. The dependent variable in every regression the natural log of turnover defined as the average of total monthly trading volume divided by the number of shares outstanding. Beginning 20% is an indicator for whether the stock ticker is in the first 20% when ordered alphabetically. Advertising is the total amount of money spent on advertising. Age is the number of years since the firm first appeared in the CRSP dataset. Return is the average of the monthly returns for each stock. ROA is measured as operating income before depreciation divided by total assets. Market Value of Equity is the firm’s market cap. Price is the stock’s closing price at the end of the year. Return Volatility is the standard deviation of daily returns over each year. NYSE and AMEX indicate the primary exchange that the stock is traded on. Tech indicates whether the firm is in technology. All models include unreported industry and year effects and the standard errors are clustered by firm and year. P-values are shown in parentheses. The symbols ***, **, and * indicate statistical significance at the 1%, 5%, and 10% levels, respectively.
Beginning 20% 0.035 ** 0.031 * 0.028 * 0.03 * 0.022 ** 0.038 ** 0.026 * 0.039 *(0.024) (0.1) (0.063) (0.086) (0.038) (0.024) (0.097) (0.064)
Ln(Advertising) 0.016 *** 0.002 0.025 *** 0.009 ** 0.03 *** 0.01 *** 0.001(0.006) (0.734) (0.002) (0.018) (0.000) (0.005) (0.884)
ln(Age) 0.048 *** -0.172 *** -0.013 0.012 -0.034 *** 0.042 *** -0.009 -0.053 ***(0.000) (0.000) (0.103) (0.107) (0.000) (0.000) (0.188) (0.000)
Return 0.541 *** -0.102 0.701 *** 0.15 * 0.673 *** 0.259 *** 0.482 *** 0.305 *(0.000) (0.559) (0.000) (0.091) (0.000) (0.008) (0.000) (0.062)
ROA -0.002 -0.012 0.003 -0.005 0 0.011 -0.007 0(0.804) (0.242) (0.759) (0.542) (0.956) (0.204) (0.319) (0.994)
ln(Market Cap) 0.138 *** 0.109 *** 0.198 *** 0.044 *** 0.183 *** 0.019 *** 0.122 *** 0.1 ***(0.000) (0.000) (0.000) (0.000) (0.000) (0.005) (0.000) (0.000)
1/Price -1.791 *** -1.156 *** -0.688 *** -2.151 *** -0.578 *** -1.88 *** -1.465 *** -2.075 ***(0.000) (0.000) (0.000) (0.000) (0.000) (0.000) (0.000) (0.000)
ln(Return Volatility) 10.395 *** 17.483 *** 7.912 *** 21.654 *** 8.343 *** 19.502 *** 12.905 *** 10.519 ***(0.000) (0.000) (0.000) (0.000) (0.000) (0.000) (0.000) (0.000)
NYSE -0.174 *** 0.068 *** -0.101 *** -0.129 *** -0.066 *** -0.164 *** -0.114 *** -0.098 ***(0.000) (0.001) (0.000) (0.000) (0.000) (0.000) (0.000) (0.000)
AMEX -0.123 *** -0.132 *** -0.102 *** -0.389 *** -0.095 *** -0.498 *** -0.172 *** -0.261 ***(0.000) (0.000) (0.000) (0.000) (0.000) (0.000) (0.000) (0.000)
Tech 0.088 *** 0.1 *** 0.078 *** 0.115 *** 0.092 *** 0.072 *** 0.091 *** 0.102 ***(0.000) (0.000) (0.000) (0.000) (0.000) (0.000) (0.000) (0.000)
Intercept -1.12 *** -0.484 *** -1.877 *** 0.034 -1.645 *** 0.355 *** -0.949 *** -0.423 **(0.000) (0.000) (0.000) (0.76) (0.000) (0.001) (0.000) (0.02)
Number of Obs 18724 11054 15330 15425 14948 15801 18523 12232R2 0.37 0.46 0.37 0.45 0.34 0.4 0.4 0.33
= $0 > $0< 15 Years > 15 Years Small Large Small LargeFirm Age Firm Size (Assets) Firm Size (Market Cap) Advertising

37
Table 6 – Alternate Measures and Robustness of Stock Liquidity
Table 6 reports OLS and Fama-Mac-Beth regressions for stocks from 1999 - 2012. Turnover is the natural log of the average of total monthly trading volume divided by the number of shares outstanding. Volume is the natural log of annual average of monthly share volumes. Dollar Volume is the natural log of annual average of share volume times the yearly close price. Illiquidity is measured as the natural log of the Amihud (2002) illiquidity ratio. Advertising is the total amount of money spent on advertising. Age is the number of years since the firm first appeared in the CRSP dataset. Return is the average of the monthly returns for each stock. ROA is measured as operating income before depreciation divided by total assets. Market Value of Equity is the firm’s market cap. Price is the stock’s closing price at the end of the year. Return Volatility is the standard deviation of daily returns over each year. All models include unreported industry effects. NYSE and AMEX indicate the primary exchange that the stock is traded on. Tech indicates whether the firm is in technology. OLS regressions also include unreported year fixed effects and standard errors are clustered by firm and year. P-values are shown in parentheses. The symbols ***, **, and * indicate statistical significance at the 1%, 5%, and 10% levels, respectively.

38
Dependent VariableBeginning 20% 0.032 *** 0.060 ** 0.067 *** -0.065 ** 0.030 *** 0.056 *** 0.064 *** -0.063 ***
(0.008) (0.016) (0.004) (0.01) (0.000) (0.000) (0.000) (0.000)Ln(Advertising) 0.006 0.009 0.002 -0.004 0.005 ** 0.01 ** 0.003 -0.003
(0.223) (0.301) (0.797) (0.667) (0.013) (0.014) (0.282) (0.511)ln(Age) -0.027 ** -0.089 *** -0.072 *** -0.007 -0.025 ** -0.094 *** -0.076 *** 0.004
(0.028) (0.000) (0.003) (0.778) (0.012) (0.000) (0.001) (0.851)Return 0.422 *** 0.343 0.695 *** -0.939 *** 0.373 *** 0.094 0.601 *** -0.787 ***
(0.005) (0.253) (0.002) (0.000) (0.007) (0.679) (0.003) (0.000)ROA -0.007 -0.022 -0.01 0.012 -0.008 ** -0.024 *** -0.012 * 0.016 *
(0.327) (0.119) (0.438) (0.444) (0.043) (0.002) (0.077) (0.07)ln(Market Cap) 0.111 *** 1.153 *** 1.229 *** -1.395 *** 0.116 *** 1.164 *** 1.238 *** -1.401 ***
(0.000) (0.000) (0.000) (0.000) (0.000) (0.000) (0.000) (0.000)1/Price -1.721 *** 9.309 *** -3.026 *** 3.023 *** -1.803 *** 8.911 *** -3.355 *** 3.264 ***
(0.000) (0.000) (0.000) (0.000) (0.000) (0.000) (0.000) (0.000)ln(Return Volatility) 12.009 *** 20.494 *** 19.596 *** -4.945 *** 13.981 *** 26.525 *** 24.553 *** -7.53 ***
(0.000) (0.000) (0.000) (0.000) (0.000) (0.000) (0.000) (0.000)NYSE -0.107 *** 0.032 0.013 0.024 -0.103 *** 0.035 0.019 0.022
(0.000) (0.667) (0.843) (0.438) (0.000) (0.594) (0.736) (0.139)AMEX -0.207 *** -0.497 *** -0.389 *** 0.420 *** -0.203 *** -0.499 *** -0.394 *** 0.426 ***
(0.000) (0.000) (0.000) (0.000) (0.000) (0.000) (0.000) (0.000)Tech 0.097 *** 0.214 *** 0.190 *** -0.199 *** 0.09 *** 0.194 *** 0.17 *** -0.18 ***
(0.000) (0.000) (0.000) (0.000) (0.000) (0.000) (0.000) (0.000)Number of Obs 30755 30755 30755 30755 30755 30755 30755 30755R2 0.37 0.82 0.89 0.89 0.3 0.76 0.86 0.87
Dollar Volume IlliquidityTurnover Volume Dollar Volume Illiquidity Turnover VolumeOLS Regressions Fama-MacBeth Regressions

39
Table 7 – Alternate Measures and Robustness of Firm Value
Table 7 reports OLS and Fama-MacBeth regressions. M/B is the market value of equity divided by the book value of equity. Q represents an approximation of Tobins Q measured as the market value of equity plus debt divided by the book value of assets. Advertising is the total amount of money spent on advertising. Age is the number of years since the firm first appeared in the CRSP dataset. Return is the average of the monthly returns for each stock. ROA is measured as operating income before depreciation divided by total assets. Market Value of Equity is the firm’s market cap. Price is the stock’s closing price at the end of the year. Return Volatility is the standard deviation of daily returns over each year. NYSE and AMEX indicate the primary exchange that the stock is traded on. Tech indicates whether the firm is in technology. All models include unreported industry effects. OLS regressions also include unreported year fixed effects and standard errors are clustered by firm and year. The symbols ***, **, and * indicate statistical significance at the 1%, 5%, and 10% levels, respectively.
Beginning 20% 0.066 *** 0.026 ** 0.07 *** 0.027 ***(0.004) (0.011) (0.000) (0.000)
Advertising / Sales 0.002 ** 0.001 ** 1.211 *** 0.86 ***(0.03) (0.021) (0.000) (0.000)
ln(Age) -0.086 *** -0.069 *** -0.07 *** -0.056 ***(0.000) (0.000) (0.000) (0.000)
Return 0.455 *** 0.228 *** 0.576 *** 0.34 ***(0.000) (0.000) (0.001) (0.008)
ROA -0.026 * -0.029 ** -0.014 * -0.018 **(0.057) (0.019) (0.073) (0.026)
ln(Total Revenue) -0.032 *** -0.057 *** -0.032 *** -0.055 ***(0.001) (0.000) (0.000) (0.000)
Leverage 0.003 *** 0 0.011 *** 0(0.000) (0.912) (0.001) (0.479)
NYSE 0.031 -0.023 0.027 *** -0.024 ***(0.255) (0.227) (0.004) (0.001)
AMEX -0.185 *** -0.165 *** -0.192 *** -0.157 ***(0.000) (0.000) (0.000) (0.000)
Tech 0.149 ** 0.17 *** 0.141 *** 0.154 ***(0.024) (0.000) (0.009) (0.001)
Intercept 1.305 *** 1.102 *** 1.225 *** 1.044 ***(0.000) (0.000) (0.000) (0.000)
Number of Obs 30382 30382 30382 30382R2 0.11 0.18 0.03 0.03
Fama-MacBeth RegressionsOLS RegressionsMtB Q MtB Q

40
Table 8 – Alternate Measures of Early Alphabet Companies
Table 8 reports only the main coefficient of interest for eight different OLS regressions per panel for stocks from 1999 - 2012. The dependent variable in each regression in Panel A is the natural log of turnover defined as the average of total monthly trading volume divided by the number of shares outstanding. In each case the coefficient of interest represents a different way of measuring early alphabet stocks. The rest of the variables are not tabulated. Advertising is the total amount of money spent on advertising. Age is the number of years since the firm first appeared in the CRSP dataset. Return is the average of the monthly returns for each stock. ROA is measured as operating income before depreciation divided by total assets. Market Value of Equity is the firm’s market cap. Price is the stock’s closing price at the end of the year. Return Volatility is the standard deviation of daily returns over each year. NYSE and AMEX indicate the primary exchange that the stock is traded on. Tech indicates whether the firm is in technology. The dependent variable in each of the regressions in Panel B is the market value of equity divided by the book value of equity. Advertising/Sales is the amount of money spent on advertising divided by total sales. Age is the number of years since the firm first appeared in the CRSP dataset. Return is the average of the monthly returns for each stock. ROA is measured as operating income before depreciation divided by total assets. Ln(Total Revenue) is the natural log of total revenue. Leverage is a ratio of debt to total assets. NYSE and AMEX indicate the primary exchange that the stock is traded on. Tech indicates whether the firm is in technology. Regressions include unreported year and industry fixed effects and the standard errors are clustered by firm and year. P-values are shown in parentheses. The symbols ***, **, and * indicate statistical significance at the 1%, 5%, and 10% levels, respectively.
Panel A: Dependent Variable is Stock Turnover
Ticker begins with A 0.031 *(0.054)
Ticker begins with A or B 0.031 **(0.026)
Ticker begins with A, B or C 0.026 **(0.025)
First 200 Stocks 0.026 **(0.045)
First 300 Stocks 0.019 **(0.011)
Beginning 10% 0.027 *(0.071)
Beginning 10% by Company Name 0.027 *(0.087)
Beginning 20% by Company Name 0.022 *(0.072)
Number of Obs 30755R2 0.37

41
Panel B: Dependent Variable is Market to Book Value
Ticker begins with A 0.059 *(0.061)
Ticker begins with A or B 0.061 **(0.018)
Ticker begins with A, B or C 0.049 **(0.024)
First 200 Stocks 0.07 ***(0.008)
First 300 Stocks 0.059 ***(0.008)
Beginning 10% 0.066 **(0.03)
Beginning 10% by Company Name 0.071 **(0.021)
Beginning 20% by Company Name 0.055 **(0.016)
Number of Obs 30382R2 0.11