market outlook 080113web.angelbackoffice.com/research_contentmanagement/pdf_report/market... ·...
TRANSCRIPT
Market Outlook January 8, 2013
www.angelbroking.com
Market Outlook January 8, 2013
Dealer’s Diary The Indian market is expected to open flat to negative tracking the flat opening of SGX Nifty. Most of the Asian markets are trading in the red.
US stocks saw moderate weakness during trading on Monday, giving away some ground after moving sharply higher last week. However, the selling pressure was relatively subdued, and the market held on to the bulk of its recent gains. The major averages ended the day in negative territory but well off their lows for the session. The European markets finished in negative territory on Monday, as investors took profits following the strong gains at the end of the previous trading week. Investors are continuing to evaluate the potential impact of the debt ceiling situation in the US and are preparing for the beginning of the US earnings season.
Indian shares fell on Monday, with selling accelerating late in the session, weighed down by weakness in other Asian markets and European stocks as investors moved to the sidelines awaiting cues from central bank meetings in Europe and the UK this week and the fourth-quarter U.S. earnings season.
Markets Today The trend deciding level for the day is 19,734 / 6,003 levels. If NIFTY trades above this level during the first half-an-hour of trade then we may witness a further rally up to 19,814 – 19,936 / 6,028 – 6,068 levels. However, if NIFTY trades below 19,734 / 6,003 levels for the first half-an-hour of trade then it may correct up to 19,612 – 19,532 / 5,963 – 5,938 levels.
Indices S2 S1 PIVOT R1 R2 SENSEX 19,532 19,612 19,734 19,814 19,936 NIFTY 5,938 5,963 6,003 6,028 6,068
News Analysis Government imposes 20% import duty on some Chinese flat steel products Marico announces business, corporate and organization restructuring Bajaj Auto launches new 100cc vehicle, Discover 100T FI’s turn down Glaxo’s open offer price Bank of Maharashtra to consider raising capital
Refer detailed news analysis on the following page
Net Inflows (January 04, 2013) ` cr Purch Sales Net MTD YTD FII 3,189 1,937 1,251 4,900 4,900 MFs 473 779 (307) (357) (357)
FII Derivatives (January 07, 2013) ` cr Purch Sales Net Open Interest
Index Futures 649 834 (185) 7,588 Stock Futures 1,107 1,474 (367) 32,883
Gainers / Losers Gainers Losers
Company Price (`) chg (%) Company Price (`) chg (%)
Indiabulls Fin 330 6.1 L&T 1,589 (2.4)
HPCL 329 4.8 United Brew-$ 905 (2.3)
SAIL 100 4.6 Strides Arco 1,049 (2.3)
Mangalore Ref 68 4.2 REC 260 (2.1)
ADANI POWER 65 3.8 Jaiprakash Asso 99 (2.1)
Domestic Indices Chg (%) (Pts) (Close)
BSE Sensex (0.5) (92.7) 19,691
Nifty (0.5) (27.7) 5,988
MID CAP 0.2 17.4 7,332
SMALL CAP 0.5 41.7 7,657
BSE HC 0.4 33.3 8,239
BSE PSU 0.0 0.4 7,598
BANKEX (0.6) (91.7) 14,603
AUTO 0.4 43.3 11,634
METAL 0.9 106.5 11,396
OIL & GAS 0.2 19.2 8,875
BSE IT 0.2 11.8 5,810
Global Indices Chg (%) (Pts) (Close)
Dow Jones (0.4) (50.9) 13,384
NASDAQ (0.1) (2.8) 3,099
FTSE (0.4) (25.3) 6,065
Nikkei (0.8) (89.1) 10,599
Hang Seng (0.0) (1.3) 23,330 Straits Times (0.1) (0.4) 3,223 Shanghai Com 0.4 8.4 2,285
Indian ADR Chg (%) (Pts) (Close)
INFY 1.4 0.6 $43.3
WIT 0.6 0.0 $9.0
IBN (0.3) (0.1) $44.9
HDB (0.9) (0.4) $40.8
Advances / Declines BSE NSE
Advances 1,617 841
Declines 1,318 683
Unchanged 131 67
Volumes (` cr)
BSE 2,649
NSE 12,365
www.angelbroking.com
Market Outlook January 8, 2013
Government imposes 20% import duty on some Chinese flat steel products
Bloomberg has reported that the government has imposed 20% import duty on some of the flat steel products from China in order to protect domestic steel mills from threat of imports. During January- September 2012, total steel imports by India have increased by 46.3% yoy to 5.9mn tonne. The duty imposed is expected to be effective for a period of 200 days. Steel stocks rose by 2-5% post this announcement. Iron and steel imports together constitute about 2.5% - 3.0% of India’s total imports and we note that the recent rise in steel imports by India have been originating mainly from FTA countries (South Korea, Japan etc) which attract very low import duty. We do not expect a meaningful rise in domestic steel prices due to the import duty. Further, we also believe that the move is unlikely to have any material impact on curbing overall imports in the economy. Thus, we maintain our estimates and ratings on the stocks.
Marico announces business, corporate and organization restructuring
The Board of Directors of Marico has approved the restructuring of businesses, corporate entities and organization involving a) the demerger of Kaya Skin Care Solutions into a separate company by name Marico Kaya Enterprises Ltd (MAKE) and b) formation of a unified FMCG business with operations in India and abroad headed by a single CEO. The restructuring plan would be effective from April 1, 2013.
As per the proposed Kaya demerger plan, MAKE will become the holding company of Kaya Ltd (India) and Kaya entities in the Middle East and South East. Currently the promoters of Marico have a 60% stake in Marico and post demerger the shareholding structure of MAKE will be identical to Marico’s current shareholding structure. Shareholders of Marico will be allotted one share of MAKE for every 50 shares held in Marico. The equity shares of MAKE will be listed in both BSE and NSE after all the statutory approvals are obtained.
Marico currently has three business verticals namely a) Indian Consumer products business b) International FMCG business and c) Kaya Skin Care Solutions (Kaya) with operations in India and abroad. Post the restructuring, Kaya Skin Care solutions would operate as a separate listed entity (MAKE). The Indian and International FMCG businesses which were till date headed by two different CEOs will be unified and will be headed by a single CEO.
Kaya has been a loss making venture for Marico. During FY2012, it made a loss of `29cr at the PBIT level on net sales of `279cr (a loss of `33cr in FY2011). Demerger of the loss making venture would result in better return ratios for Marico. At the CMP, Marico is trading at 28x FY2014E earnings. We maintain a Neutral on Marico.
Bajaj Auto launches new 100cc vehicle, Discover 100T
Bajaj Auto (BJAUT) has launched a new 100cc motorcycle, Discover 100T at a price of `50,500 ex. showroom Delhi. The new motorcycle will be powered by the company’s DTS-i technology and is likely to deliver 10.2PS of power and offer a fuel efficiency of 87kmpl. The Discover 100T is based on the all new Discover platform through which Discover 125ST has already been launched. The new
www.angelbroking.com
Market Outlook January 8, 2013
motorcycle has been positioned by the company at the upper end of the less than 110cc segment. We expect the launch of Discover 100T along with the existing, Discover 100 to strengthen BJAUT’s positioning in the less than 110cc segment. Currently, BJAUT has ~20% market share in the segment which is dominated by Hero MotoCorp (~70% market share) through its flagship models Splendor and Passion. BJAUT is targeting a market share of ~30% in the less than 110cc segment over the next two years. We believe that the new launch will enable BJAUT to further ramp up its domestic volumes going ahead. The company is already benefitting from the new launches of Discover 125ST (July 2012) and Pulsar 200NS (June 2012) which accounts for ~15% of the company’s motorcycle volumes. At the CMP of `2,194 the stock is trading at 17.3x FY2014E earnings which is slightly higher than its historical average. Hence, we maintain our Neutral rating on the stock.
FI’s turn down Glaxo’s open offer price
As per media reports financial institutions, led by Life Insurance Corporation, have declined to participate in the open offer announced by GlaxoSmithKline (GSK) for its Indian subsidiary GlaxoSmithKline Consumer Healthcare (GSK consumer) in November 2012. The institutions, which jointly hold 32% stake believe the open offer price of `3,900/share is unattractive. The tendering period for open offer is expected to begin from January 17th 2013. At the CMP GSK consumer is trading at P/E of 32.5x FY2014E estimates. We maintain a Neutral view on GSK consumer.
Bank of Maharashtra to consider raising capital
The board of Bank of Maharashtra is scheduled to meet on January 10, 2013 to consider the proposal to raise capital by issuing equity shares upto 20cr by means of FPO and/or rights issue and/or QIP in FY2014. As of 2QFY2013, CAR for Bank of Maharashtra remained one among the lowest at 10.7%, with tier-I at 7.1%. At CMP, the issue would aid the company to raise a sum of upto `1,280cr, thereby aiding its tier-I capital adequacy by nearly 200bps. Recently the bank had also successfully issued tier-II bonds worth `1,000cr. After the recent run up in stock price, the stock now trades at 0.8x FY2014E ABV and hence, we recommend neutral view on the stock.
Quarterly Bloomberg Brokers Consensus Estimate
IndusInd Bank (09/01/2013) Particulars (` cr) 3QFY13E 3QFY12 y-o-y (%) 2QFY13 q-o-q (%)
Net profit 262 206 27 193 36

www.angelbroking.com
Market Outlook January 8, 2013
Economic and Political News
Disinvestment in Oil India, NTPC soon: DK Mittal Round 2 of spectrum auction on March 11 Govt kick starts process of CIL restructuring
Corporate News
Tata Motors introduces 4-yr warranty on heavy truck range REpower signs contracts for wind farm in UK Opto to supply medical devices to Chicago transit system
Source: Economic Times, Business Standard, Business Line, Financial Express, Mint
Date Company
January 09, 2013 IndusInd Bank
January 10, 2013 Sintex, Cera Sanitaryware Ltd
January 11, 2013 Infosys
January 12, 2013
January 13, 2013 Petronet LNG
January 14, 2013 TCS, Electrosteel Castings
January 15, 2013 Axis Bank, South Ind.Bank
January 16, 2013 Bajaj Auto
January 17, 2013 Hero Motocorp, HCL Tech, Exide Industries, Federal Bank, Infotech Enterprises
January 18, 2013 HDFC Bank, M&M, Mindtree
January 19, 2013 Force Motors
January 20, 2013
January 21, 2013 HDFC, Asian Paints, Alembic Pharma
Source: Bloomberg, Angel Research
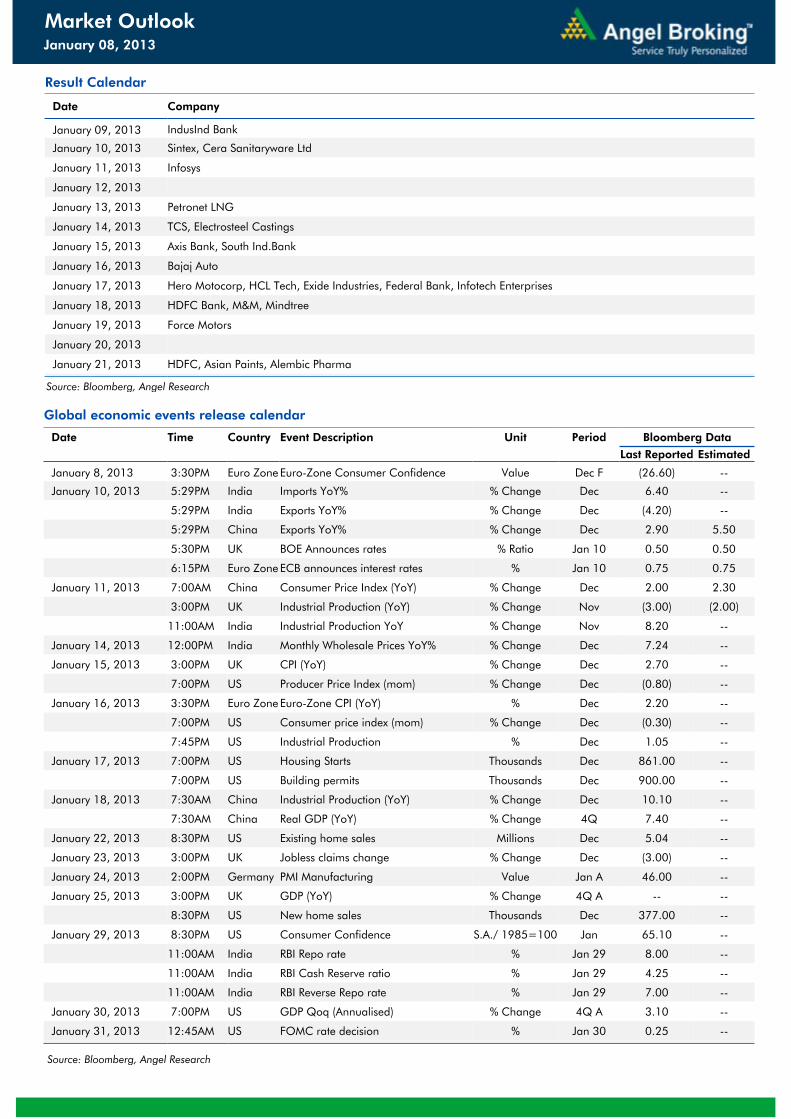
Result Calendar
Global economic events release calendar
Date Time Country Event Description Unit Period Bloomberg Data
Last Reported Estimated
January 8, 2013 3:30PM Euro Zone Euro-Zone Consumer Confidence Value Dec F (26.60) --
January 10, 2013 5:29PM India Imports YoY% % Change Dec 6.40 --
5:29PM India Exports YoY% % Change Dec (4.20) --
5:29PM China Exports YoY% % Change Dec 2.90 5.50
5:30PM UK BOE Announces rates % Ratio Jan 10 0.50 0.50
6:15PM Euro Zone ECB announces interest rates % Jan 10 0.75 0.75
January 11, 2013 7:00AM China Consumer Price Index (YoY) % Change Dec 2.00 2.30
3:00PM UK Industrial Production (YoY) % Change Nov (3.00) (2.00)
11:00AM India Industrial Production YoY % Change Nov 8.20 --
January 14, 2013 12:00PM India Monthly Wholesale Prices YoY% % Change Dec 7.24 --
January 15, 2013 3:00PM UK CPI (YoY) % Change Dec 2.70 --
7:00PM US Producer Price Index (mom) % Change Dec (0.80) --
January 16, 2013 3:30PM Euro Zone Euro-Zone CPI (YoY) % Dec 2.20 --
7:00PM US Consumer price index (mom) % Change Dec (0.30) --
7:45PM US Industrial Production % Dec 1.05 --
January 17, 2013 7:00PM US Housing Starts Thousands Dec 861.00 --
7:00PM US Building permits Thousands Dec 900.00 --
January 18, 2013 7:30AM China Industrial Production (YoY) % Change Dec 10.10 --
7:30AM China Real GDP (YoY) % Change 4Q 7.40 --
January 22, 2013 8:30PM US Existing home sales Millions Dec 5.04 --
January 23, 2013 3:00PM UK Jobless claims change % Change Dec (3.00) --
January 24, 2013 2:00PM Germany PMI Manufacturing Value Jan A 46.00 --
January 25, 2013 3:00PM UK GDP (YoY) % Change 4Q A -- --
8:30PM US New home sales Thousands Dec 377.00 --
January 29, 2013 8:30PM US Consumer Confidence S.A./ 1985=100 Jan 65.10 --
11:00AM India RBI Repo rate % Jan 29 8.00 --
11:00AM India RBI Cash Reserve ratio % Jan 29 4.25 --
11:00AM India RBI Reverse Repo rate % Jan 29 7.00 --
January 30, 2013 7:00PM US GDP Qoq (Annualised) % Change 4Q A 3.10 --
January 31, 2013 12:45AM US FOMC rate decision % Jan 30 0.25 --
Source: Bloomberg, Angel Research
January 08, 2013
Market Outlook
Market Outlook January 08, 2013
www.angelbroking.com
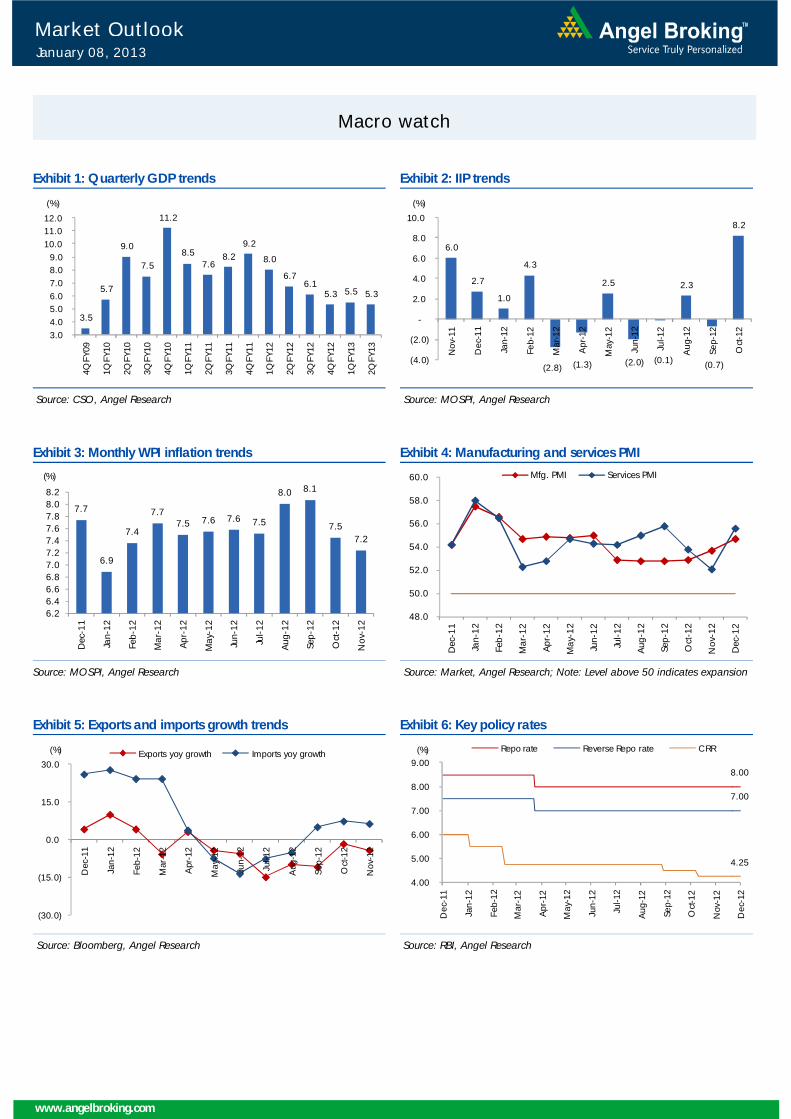
Macro watch
Exhibit 1: Quarterly GDP trends
Source: CSO, Angel Research
Exhibit 2: IIP trends
Source: MOSPI, Angel Research
Exhibit 3: Monthly WPI inflation trends
Source: MOSPI, Angel Research
Exhibit 4: Manufacturing and services PMI
Source: Market, Angel Research; Note: Level above 50 indicates expansion
Exhibit 5: Exports and imports growth trends
Source: Bloomberg, Angel Research
Exhibit 6: Key policy rates
Source: RBI, Angel Research
3.5
5.7
9.0
7.5
11.2
8.5 7.6
8.2 9.2
8.0
6.7 6.1
5.3 5.5 5.3
3.0 4.0 5.0 6.0 7.0 8.0 9.0
10.0 11.0 12.0
4QFY
09
1QFY
10
2QFY
10
3QFY
10
4QFY
10
1QFY
11
2QFY
11
3QFY
11
4QFY
11
1QFY
12
2QFY
12
3QFY
12
4QFY
12
1QFY
13
2QFY
13
(%)
6.0
2.7
1.0
4.3
(2.8) (1.3)
2.5
(2.0) (0.1)
2.3
(0.7)
8.2
(4.0)
(2.0)
-
2.0
4.0
6.0
8.0
10.0
Nov
-11
Dec
-11
Jan-
12
Feb-
12
Mar
-12
Apr
-12
May
-12
Jun-
12
Jul-1
2
Aug
-12
Sep-
12
Oct
-12
(%)
7.7
6.9
7.4
7.77.5 7.6 7.6 7.5
8.0 8.1
7.57.2
6.26.46.66.87.07.27.47.67.88.08.2
Dec
-11
Jan-
12
Feb-
12
Mar
-12
Apr
-12
May
-12
Jun-
12
Jul-
12
Aug
-12
Sep-
12
Oct
-12
Nov
-12
(%)
48.0
50.0
52.0
54.0
56.0
58.0
60.0
Dec
-11
Jan-
12
Feb-
12
Mar
-12
Apr
-12
May
-12
Jun-
12
Jul-
12
Aug
-12
Sep-
12
Oct
-12
Nov
-12
Dec
-12
Mfg. PMI Services PMI
(30.0)
(15.0)
0.0
15.0
30.0
Dec
-11
Jan-
12
Feb-
12
Mar
-12
Apr
-12
May
-12
Jun-
12
Jul-1
2
Aug
-12
Sep-
12
Oct
-12
Nov
-12
Exports yoy growth Imports yoy growth(%)
8.00
7.00
4.25
4.00
5.00
6.00
7.00
8.00
9.00
Dec
-11
Jan-
12
Feb-
12
Mar
-12
Apr
-12
May
-12
Jun-
12
Jul-1
2
Aug
-12
Sep-
12
Oct
-12
Nov
-12
Dec
-12
Repo rate Reverse Repo rate CRR (%)
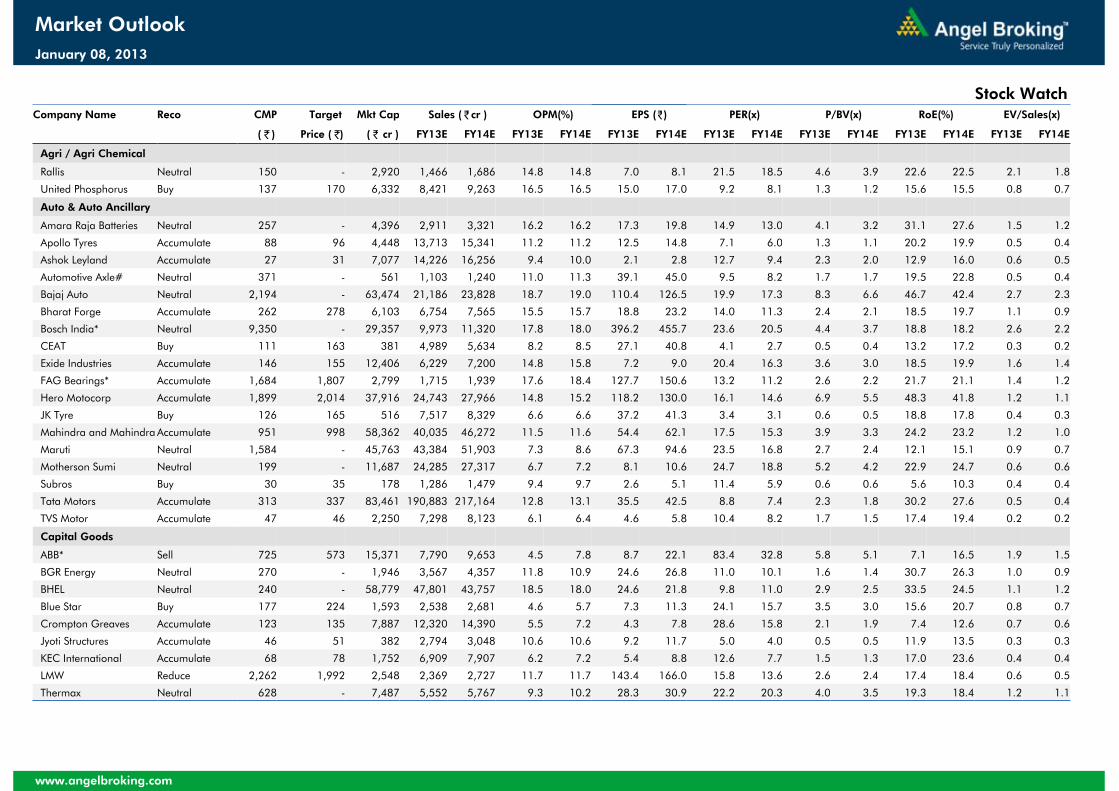
Company Name Reco CMP Target Mkt Cap Sales ( ₹cr ) OPM(%) EPS (₹) PER(x) P/BV(x) RoE(%) EV/Sales(x)
( ₹ ) Price ( ₹) ( ₹ cr ) FY13E FY14E FY13E FY14E FY13E FY14E FY13E FY14E FY13E FY14E FY13E FY14E FY13E FY14E
Agri / Agri Chemical
Rallis Neutral 150 - 2,920 1,466 1,686 14.8 14.8 7.0 8.1 21.5 18.5 4.6 3.9 22.6 22.5 2.1 1.8
United Phosphorus Buy 137 170 6,332 8,421 9,263 16.5 16.5 15.0 17.0 9.2 8.1 1.3 1.2 15.6 15.5 0.8 0.7
Auto & Auto Ancillary
Amara Raja Batteries Neutral 257 - 4,396 2,911 3,321 16.2 16.2 17.3 19.8 14.9 13.0 4.1 3.2 31.1 27.6 1.5 1.2
Apollo Tyres Accumulate 88 96 4,448 13,713 15,341 11.2 11.2 12.5 14.8 7.1 6.0 1.3 1.1 20.2 19.9 0.5 0.4
Ashok Leyland Accumulate 27 31 7,077 14,226 16,256 9.4 10.0 2.1 2.8 12.7 9.4 2.3 2.0 12.9 16.0 0.6 0.5
Automotive Axle# Neutral 371 - 561 1,103 1,240 11.0 11.3 39.1 45.0 9.5 8.2 1.7 1.7 19.5 22.8 0.5 0.4
Bajaj Auto Neutral 2,194 - 63,474 21,186 23,828 18.7 19.0 110.4 126.5 19.9 17.3 8.3 6.6 46.7 42.4 2.7 2.3
Bharat Forge Accumulate 262 278 6,103 6,754 7,565 15.5 15.7 18.8 23.2 14.0 11.3 2.4 2.1 18.5 19.7 1.1 0.9
Bosch India* Neutral 9,350 - 29,357 9,973 11,320 17.8 18.0 396.2 455.7 23.6 20.5 4.4 3.7 18.8 18.2 2.6 2.2
CEAT Buy 111 163 381 4,989 5,634 8.2 8.5 27.1 40.8 4.1 2.7 0.5 0.4 13.2 17.2 0.3 0.2
Exide Industries Accumulate 146 155 12,406 6,229 7,200 14.8 15.8 7.2 9.0 20.4 16.3 3.6 3.0 18.5 19.9 1.6 1.4
FAG Bearings* Accumulate 1,684 1,807 2,799 1,715 1,939 17.6 18.4 127.7 150.6 13.2 11.2 2.6 2.2 21.7 21.1 1.4 1.2
Hero Motocorp Accumulate 1,899 2,014 37,916 24,743 27,966 14.8 15.2 118.2 130.0 16.1 14.6 6.9 5.5 48.3 41.8 1.2 1.1
JK Tyre Buy 126 165 516 7,517 8,329 6.6 6.6 37.2 41.3 3.4 3.1 0.6 0.5 18.8 17.8 0.4 0.3
Mahindra and Mahindra Accumulate 951 998 58,362 40,035 46,272 11.5 11.6 54.4 62.1 17.5 15.3 3.9 3.3 24.2 23.2 1.2 1.0
Maruti Neutral 1,584 - 45,763 43,384 51,903 7.3 8.6 67.3 94.6 23.5 16.8 2.7 2.4 12.1 15.1 0.9 0.7
Motherson Sumi Neutral 199 - 11,687 24,285 27,317 6.7 7.2 8.1 10.6 24.7 18.8 5.2 4.2 22.9 24.7 0.6 0.6
Subros Buy 30 35 178 1,286 1,479 9.4 9.7 2.6 5.1 11.4 5.9 0.6 0.6 5.6 10.3 0.4 0.4
Tata Motors Accumulate 313 337 83,461 190,883 217,164 12.8 13.1 35.5 42.5 8.8 7.4 2.3 1.8 30.2 27.6 0.5 0.4
TVS Motor Accumulate 47 46 2,250 7,298 8,123 6.1 6.4 4.6 5.8 10.4 8.2 1.7 1.5 17.4 19.4 0.2 0.2
Capital Goods
ABB* Sell 725 573 15,371 7,790 9,653 4.5 7.8 8.7 22.1 83.4 32.8 5.8 5.1 7.1 16.5 1.9 1.5
BGR Energy Neutral 270 - 1,946 3,567 4,357 11.8 10.9 24.6 26.8 11.0 10.1 1.6 1.4 30.7 26.3 1.0 0.9
BHEL Neutral 240 - 58,779 47,801 43,757 18.5 18.0 24.6 21.8 9.8 11.0 2.9 2.5 33.5 24.5 1.1 1.2
Blue Star Buy 177 224 1,593 2,538 2,681 4.6 5.7 7.3 11.3 24.1 15.7 3.5 3.0 15.6 20.7 0.8 0.7
Crompton Greaves Accumulate 123 135 7,887 12,320 14,390 5.5 7.2 4.3 7.8 28.6 15.8 2.1 1.9 7.4 12.6 0.7 0.6
Jyoti Structures Accumulate 46 51 382 2,794 3,048 10.6 10.6 9.2 11.7 5.0 4.0 0.5 0.5 11.9 13.5 0.3 0.3
KEC International Accumulate 68 78 1,752 6,909 7,907 6.2 7.2 5.4 8.8 12.6 7.7 1.5 1.3 17.0 23.6 0.4 0.4
LMW Reduce 2,262 1,992 2,548 2,369 2,727 11.7 11.7 143.4 166.0 15.8 13.6 2.6 2.4 17.4 18.4 0.6 0.5
Thermax Neutral 628 - 7,487 5,552 5,767 9.3 10.2 28.3 30.9 22.2 20.3 4.0 3.5 19.3 18.4 1.2 1.1
www.angelbroking.com
Market Outlook
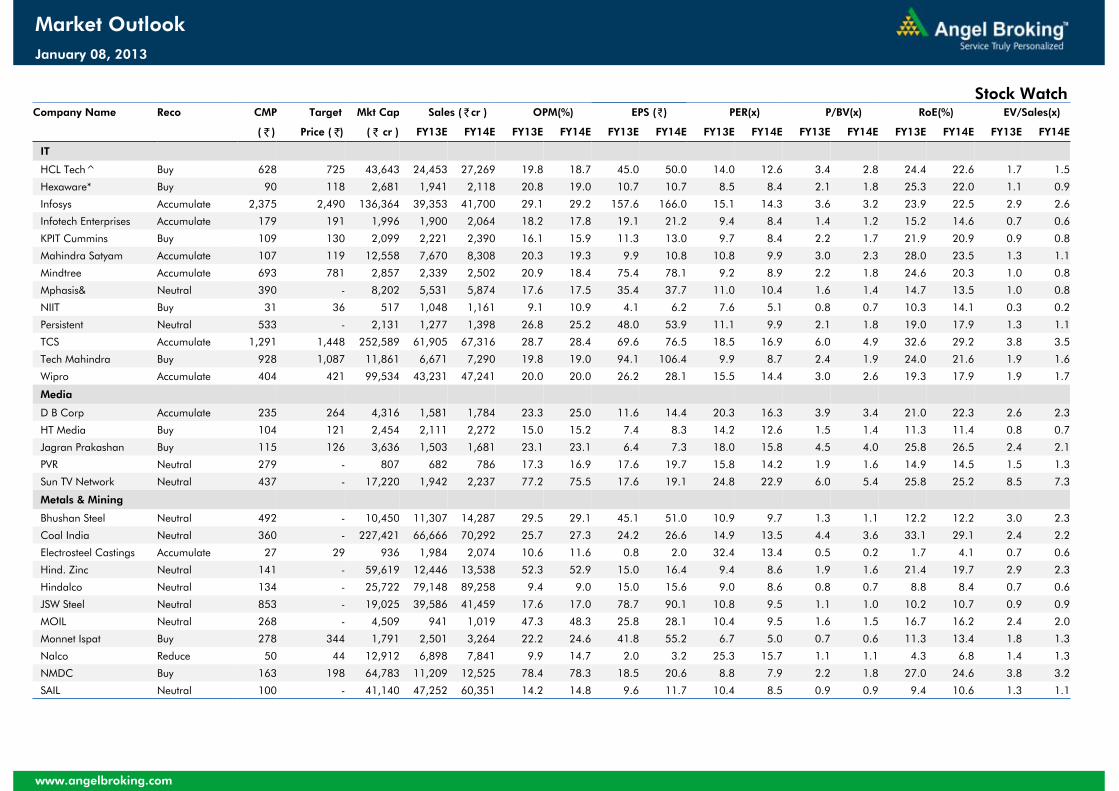
Stock Watch
January 08, 2013
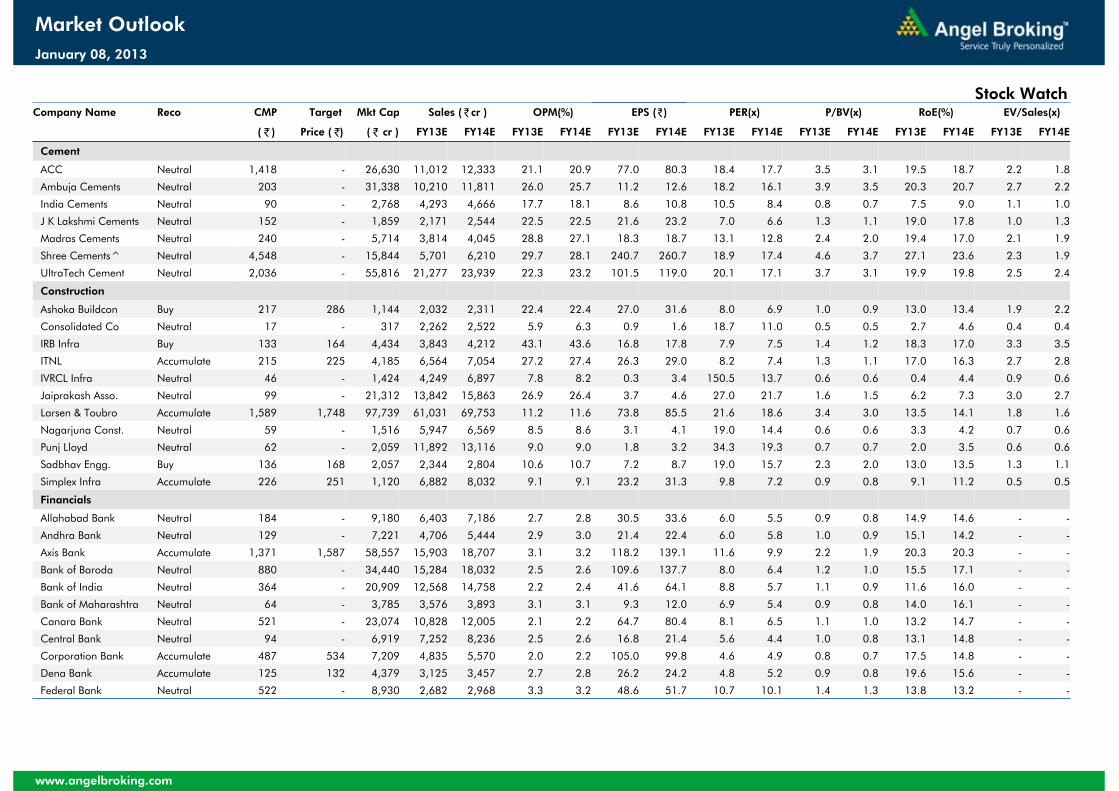
Company Name Reco CMP Target Mkt Cap Sales ( ₹cr ) OPM(%) EPS (₹) PER(x) P/BV(x) RoE(%) EV/Sales(x)
( ₹ ) Price ( ₹) ( ₹ cr ) FY13E FY14E FY13E FY14E FY13E FY14E FY13E FY14E FY13E FY14E FY13E FY14E FY13E FY14E
Cement
ACC Neutral 1,418 - 26,630 11,012 12,333 21.1 20.9 77.0 80.3 18.4 17.7 3.5 3.1 19.5 18.7 2.2 1.8
Ambuja Cements Neutral 203 - 31,338 10,210 11,811 26.0 25.7 11.2 12.6 18.2 16.1 3.9 3.5 20.3 20.7 2.7 2.2
India Cements Neutral 90 - 2,768 4,293 4,666 17.7 18.1 8.6 10.8 10.5 8.4 0.8 0.7 7.5 9.0 1.1 1.0
J K Lakshmi Cements Neutral 152 - 1,859 2,171 2,544 22.5 22.5 21.6 23.2 7.0 6.6 1.3 1.1 19.0 17.8 1.0 1.3
Madras Cements Neutral 240 - 5,714 3,814 4,045 28.8 27.1 18.3 18.7 13.1 12.8 2.4 2.0 19.4 17.0 2.1 1.9
Shree Cements^ Neutral 4,548 - 15,844 5,701 6,210 29.7 28.1 240.7 260.7 18.9 17.4 4.6 3.7 27.1 23.6 2.3 1.9
UltraTech Cement Neutral 2,036 - 55,816 21,277 23,939 22.3 23.2 101.5 119.0 20.1 17.1 3.7 3.1 19.9 19.8 2.5 2.4
Construction
Ashoka Buildcon Buy 217 286 1,144 2,032 2,311 22.4 22.4 27.0 31.6 8.0 6.9 1.0 0.9 13.0 13.4 1.9 2.2
Consolidated Co Neutral 17 - 317 2,262 2,522 5.9 6.3 0.9 1.6 18.7 11.0 0.5 0.5 2.7 4.6 0.4 0.4
IRB Infra Buy 133 164 4,434 3,843 4,212 43.1 43.6 16.8 17.8 7.9 7.5 1.4 1.2 18.3 17.0 3.3 3.5
ITNL Accumulate 215 225 4,185 6,564 7,054 27.2 27.4 26.3 29.0 8.2 7.4 1.3 1.1 17.0 16.3 2.7 2.8
IVRCL Infra Neutral 46 - 1,424 4,249 6,897 7.8 8.2 0.3 3.4 150.5 13.7 0.6 0.6 0.4 4.4 0.9 0.6
Jaiprakash Asso. Neutral 99 - 21,312 13,842 15,863 26.9 26.4 3.7 4.6 27.0 21.7 1.6 1.5 6.2 7.3 3.0 2.7
Larsen & Toubro Accumulate 1,589 1,748 97,739 61,031 69,753 11.2 11.6 73.8 85.5 21.6 18.6 3.4 3.0 13.5 14.1 1.8 1.6
Nagarjuna Const. Neutral 59 - 1,516 5,947 6,569 8.5 8.6 3.1 4.1 19.0 14.4 0.6 0.6 3.3 4.2 0.7 0.6
Punj Lloyd Neutral 62 - 2,059 11,892 13,116 9.0 9.0 1.8 3.2 34.3 19.3 0.7 0.7 2.0 3.5 0.6 0.6
Sadbhav Engg. Buy 136 168 2,057 2,344 2,804 10.6 10.7 7.2 8.7 19.0 15.7 2.3 2.0 13.0 13.5 1.3 1.1
Simplex Infra Accumulate 226 251 1,120 6,882 8,032 9.1 9.1 23.2 31.3 9.8 7.2 0.9 0.8 9.1 11.2 0.5 0.5
Financials
Allahabad Bank Neutral 184 - 9,180 6,403 7,186 2.7 2.8 30.5 33.6 6.0 5.5 0.9 0.8 14.9 14.6 - -
Andhra Bank Neutral 129 - 7,221 4,706 5,444 2.9 3.0 21.4 22.4 6.0 5.8 1.0 0.9 15.1 14.2 - -
Axis Bank Accumulate 1,371 1,587 58,557 15,903 18,707 3.1 3.2 118.2 139.1 11.6 9.9 2.2 1.9 20.3 20.3 - -
Bank of Baroda Neutral 880 - 34,440 15,284 18,032 2.5 2.6 109.6 137.7 8.0 6.4 1.2 1.0 15.5 17.1 - -
Bank of India Neutral 364 - 20,909 12,568 14,758 2.2 2.4 41.6 64.1 8.8 5.7 1.1 0.9 11.6 16.0 - -
Bank of Maharashtra Neutral 64 - 3,785 3,576 3,893 3.1 3.1 9.3 12.0 6.9 5.4 0.9 0.8 14.0 16.1 - -
Canara Bank Neutral 521 - 23,074 10,828 12,005 2.1 2.2 64.7 80.4 8.1 6.5 1.1 1.0 13.2 14.7 - -
Central Bank Neutral 94 - 6,919 7,252 8,236 2.5 2.6 16.8 21.4 5.6 4.4 1.0 0.8 13.1 14.8 - -
Corporation Bank Accumulate 487 534 7,209 4,835 5,570 2.0 2.2 105.0 99.8 4.6 4.9 0.8 0.7 17.5 14.8 - -
Dena Bank Accumulate 125 132 4,379 3,125 3,457 2.7 2.8 26.2 24.2 4.8 5.2 0.9 0.8 19.6 15.6 - -
Federal Bank Neutral 522 - 8,930 2,682 2,968 3.3 3.2 48.6 51.7 10.7 10.1 1.4 1.3 13.8 13.2 - -
www.angelbroking.com
Market Outlook
Stock Watch
January 08, 2013
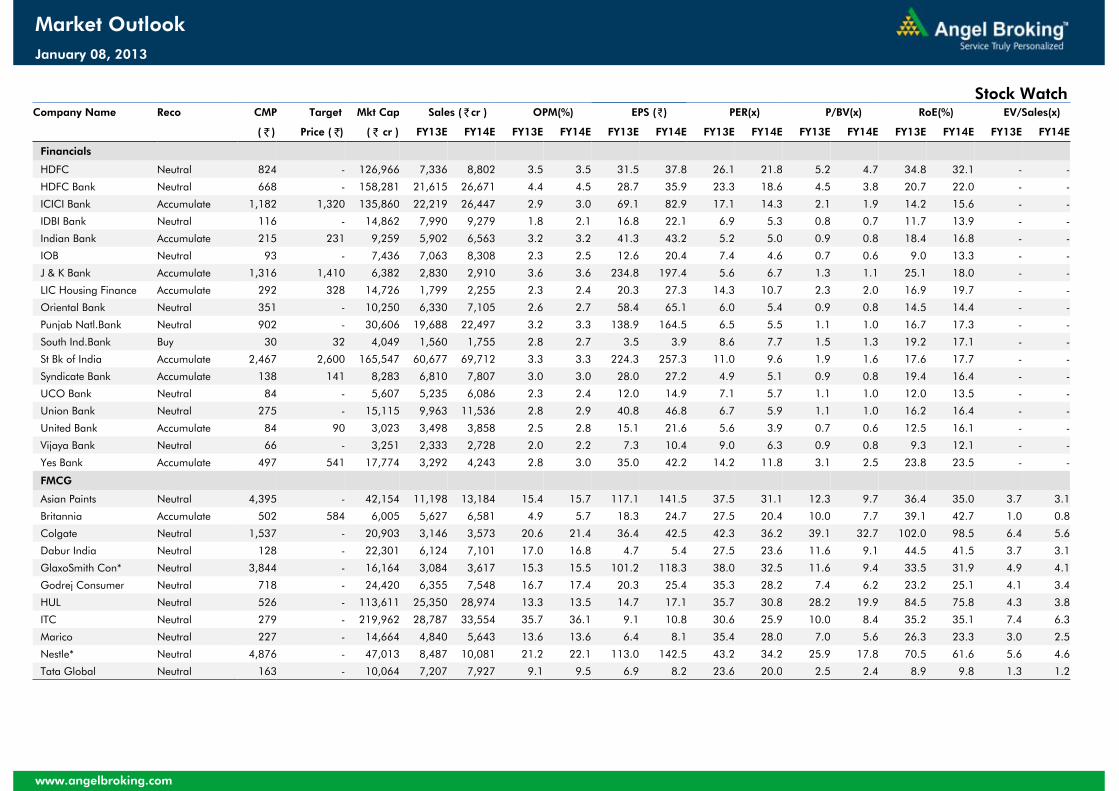
Company Name Reco CMP Target Mkt Cap Sales ( ₹cr ) OPM(%) EPS (₹) PER(x) P/BV(x) RoE(%) EV/Sales(x)
( ₹ ) Price ( ₹) ( ₹ cr ) FY13E FY14E FY13E FY14E FY13E FY14E FY13E FY14E FY13E FY14E FY13E FY14E FY13E FY14E
Financials
HDFC Neutral 824 - 126,966 7,336 8,802 3.5 3.5 31.5 37.8 26.1 21.8 5.2 4.7 34.8 32.1 - -
HDFC Bank Neutral 668 - 158,281 21,615 26,671 4.4 4.5 28.7 35.9 23.3 18.6 4.5 3.8 20.7 22.0 - -
ICICI Bank Accumulate 1,182 1,320 135,860 22,219 26,447 2.9 3.0 69.1 82.9 17.1 14.3 2.1 1.9 14.2 15.6 - -
IDBI Bank Neutral 116 - 14,862 7,990 9,279 1.8 2.1 16.8 22.1 6.9 5.3 0.8 0.7 11.7 13.9 - -
Indian Bank Accumulate 215 231 9,259 5,902 6,563 3.2 3.2 41.3 43.2 5.2 5.0 0.9 0.8 18.4 16.8 - -
IOB Neutral 93 - 7,436 7,063 8,308 2.3 2.5 12.6 20.4 7.4 4.6 0.7 0.6 9.0 13.3 - -
J & K Bank Accumulate 1,316 1,410 6,382 2,830 2,910 3.6 3.6 234.8 197.4 5.6 6.7 1.3 1.1 25.1 18.0 - -
LIC Housing Finance Accumulate 292 328 14,726 1,799 2,255 2.3 2.4 20.3 27.3 14.3 10.7 2.3 2.0 16.9 19.7 - -
Oriental Bank Neutral 351 - 10,250 6,330 7,105 2.6 2.7 58.4 65.1 6.0 5.4 0.9 0.8 14.5 14.4 - -
Punjab Natl.Bank Neutral 902 - 30,606 19,688 22,497 3.2 3.3 138.9 164.5 6.5 5.5 1.1 1.0 16.7 17.3 - -
South Ind.Bank Buy 30 32 4,049 1,560 1,755 2.8 2.7 3.5 3.9 8.6 7.7 1.5 1.3 19.2 17.1 - -
St Bk of India Accumulate 2,467 2,600 165,547 60,677 69,712 3.3 3.3 224.3 257.3 11.0 9.6 1.9 1.6 17.6 17.7 - -
Syndicate Bank Accumulate 138 141 8,283 6,810 7,807 3.0 3.0 28.0 27.2 4.9 5.1 0.9 0.8 19.4 16.4 - -
UCO Bank Neutral 84 - 5,607 5,235 6,086 2.3 2.4 12.0 14.9 7.1 5.7 1.1 1.0 12.0 13.5 - -
Union Bank Neutral 275 - 15,115 9,963 11,536 2.8 2.9 40.8 46.8 6.7 5.9 1.1 1.0 16.2 16.4 - -
United Bank Accumulate 84 90 3,023 3,498 3,858 2.5 2.8 15.1 21.6 5.6 3.9 0.7 0.6 12.5 16.1 - -
Vijaya Bank Neutral 66 - 3,251 2,333 2,728 2.0 2.2 7.3 10.4 9.0 6.3 0.9 0.8 9.3 12.1 - -
Yes Bank Accumulate 497 541 17,774 3,292 4,243 2.8 3.0 35.0 42.2 14.2 11.8 3.1 2.5 23.8 23.5 - -
FMCG
Asian Paints Neutral 4,395 - 42,154 11,198 13,184 15.4 15.7 117.1 141.5 37.5 31.1 12.3 9.7 36.4 35.0 3.7 3.1
Britannia Accumulate 502 584 6,005 5,627 6,581 4.9 5.7 18.3 24.7 27.5 20.4 10.0 7.7 39.1 42.7 1.0 0.8
Colgate Neutral 1,537 - 20,903 3,146 3,573 20.6 21.4 36.4 42.5 42.3 36.2 39.1 32.7 102.0 98.5 6.4 5.6
Dabur India Neutral 128 - 22,301 6,124 7,101 17.0 16.8 4.7 5.4 27.5 23.6 11.6 9.1 44.5 41.5 3.7 3.1
GlaxoSmith Con* Neutral 3,844 - 16,164 3,084 3,617 15.3 15.5 101.2 118.3 38.0 32.5 11.6 9.4 33.5 31.9 4.9 4.1
Godrej Consumer Neutral 718 - 24,420 6,355 7,548 16.7 17.4 20.3 25.4 35.3 28.2 7.4 6.2 23.2 25.1 4.1 3.4
HUL Neutral 526 - 113,611 25,350 28,974 13.3 13.5 14.7 17.1 35.7 30.8 28.2 19.9 84.5 75.8 4.3 3.8
ITC Neutral 279 - 219,962 28,787 33,554 35.7 36.1 9.1 10.8 30.6 25.9 10.0 8.4 35.2 35.1 7.4 6.3
Marico Neutral 227 - 14,664 4,840 5,643 13.6 13.6 6.4 8.1 35.4 28.0 7.0 5.6 26.3 23.3 3.0 2.5
Nestle* Neutral 4,876 - 47,013 8,487 10,081 21.2 22.1 113.0 142.5 43.2 34.2 25.9 17.8 70.5 61.6 5.6 4.6
Tata Global Neutral 163 - 10,064 7,207 7,927 9.1 9.5 6.9 8.2 23.6 20.0 2.5 2.4 8.9 9.8 1.3 1.2
www.angelbroking.com
Market Outlook
Stock Watch
January 08, 2013
Company Name Reco CMP Target Mkt Cap Sales ( ₹cr ) OPM(%) EPS (₹) PER(x) P/BV(x) RoE(%) EV/Sales(x)
( ₹ ) Price ( ₹) ( ₹ cr ) FY13E FY14E FY13E FY14E FY13E FY14E FY13E FY14E FY13E FY14E FY13E FY14E FY13E FY14E
IT
HCL Tech^ Buy 628 725 43,643 24,453 27,269 19.8 18.7 45.0 50.0 14.0 12.6 3.4 2.8 24.4 22.6 1.7 1.5
Hexaware* Buy 90 118 2,681 1,941 2,118 20.8 19.0 10.7 10.7 8.5 8.4 2.1 1.8 25.3 22.0 1.1 0.9
Infosys Accumulate 2,375 2,490 136,364 39,353 41,700 29.1 29.2 157.6 166.0 15.1 14.3 3.6 3.2 23.9 22.5 2.9 2.6
Infotech Enterprises Accumulate 179 191 1,996 1,900 2,064 18.2 17.8 19.1 21.2 9.4 8.4 1.4 1.2 15.2 14.6 0.7 0.6
KPIT Cummins Buy 109 130 2,099 2,221 2,390 16.1 15.9 11.3 13.0 9.7 8.4 2.2 1.7 21.9 20.9 0.9 0.8
Mahindra Satyam Accumulate 107 119 12,558 7,670 8,308 20.3 19.3 9.9 10.8 10.8 9.9 3.0 2.3 28.0 23.5 1.3 1.1
Mindtree Accumulate 693 781 2,857 2,339 2,502 20.9 18.4 75.4 78.1 9.2 8.9 2.2 1.8 24.6 20.3 1.0 0.8
Mphasis& Neutral 390 - 8,202 5,531 5,874 17.6 17.5 35.4 37.7 11.0 10.4 1.6 1.4 14.7 13.5 1.0 0.8
NIIT Buy 31 36 517 1,048 1,161 9.1 10.9 4.1 6.2 7.6 5.1 0.8 0.7 10.3 14.1 0.3 0.2
Persistent Neutral 533 - 2,131 1,277 1,398 26.8 25.2 48.0 53.9 11.1 9.9 2.1 1.8 19.0 17.9 1.3 1.1
TCS Accumulate 1,291 1,448 252,589 61,905 67,316 28.7 28.4 69.6 76.5 18.5 16.9 6.0 4.9 32.6 29.2 3.8 3.5
Tech Mahindra Buy 928 1,087 11,861 6,671 7,290 19.8 19.0 94.1 106.4 9.9 8.7 2.4 1.9 24.0 21.6 1.9 1.6
Wipro Accumulate 404 421 99,534 43,231 47,241 20.0 20.0 26.2 28.1 15.5 14.4 3.0 2.6 19.3 17.9 1.9 1.7
Media
D B Corp Accumulate 235 264 4,316 1,581 1,784 23.3 25.0 11.6 14.4 20.3 16.3 3.9 3.4 21.0 22.3 2.6 2.3
HT Media Buy 104 121 2,454 2,111 2,272 15.0 15.2 7.4 8.3 14.2 12.6 1.5 1.4 11.3 11.4 0.8 0.7
Jagran Prakashan Buy 115 126 3,636 1,503 1,681 23.1 23.1 6.4 7.3 18.0 15.8 4.5 4.0 25.8 26.5 2.4 2.1
PVR Neutral 279 - 807 682 786 17.3 16.9 17.6 19.7 15.8 14.2 1.9 1.6 14.9 14.5 1.5 1.3
Sun TV Network Neutral 437 - 17,220 1,942 2,237 77.2 75.5 17.6 19.1 24.8 22.9 6.0 5.4 25.8 25.2 8.5 7.3
Metals & Mining
Bhushan Steel Neutral 492 - 10,450 11,307 14,287 29.5 29.1 45.1 51.0 10.9 9.7 1.3 1.1 12.2 12.2 3.0 2.3
Coal India Neutral 360 - 227,421 66,666 70,292 25.7 27.3 24.2 26.6 14.9 13.5 4.4 3.6 33.1 29.1 2.4 2.2
Electrosteel Castings Accumulate 27 29 936 1,984 2,074 10.6 11.6 0.8 2.0 32.4 13.4 0.5 0.2 1.7 4.1 0.7 0.6
Hind. Zinc Neutral 141 - 59,619 12,446 13,538 52.3 52.9 15.0 16.4 9.4 8.6 1.9 1.6 21.4 19.7 2.9 2.3
Hindalco Neutral 134 - 25,722 79,148 89,258 9.4 9.0 15.0 15.6 9.0 8.6 0.8 0.7 8.8 8.4 0.7 0.6
JSW Steel Neutral 853 - 19,025 39,586 41,459 17.6 17.0 78.7 90.1 10.8 9.5 1.1 1.0 10.2 10.7 0.9 0.9
MOIL Neutral 268 - 4,509 941 1,019 47.3 48.3 25.8 28.1 10.4 9.5 1.6 1.5 16.7 16.2 2.4 2.0
Monnet Ispat Buy 278 344 1,791 2,501 3,264 22.2 24.6 41.8 55.2 6.7 5.0 0.7 0.6 11.3 13.4 1.8 1.3
Nalco Reduce 50 44 12,912 6,898 7,841 9.9 14.7 2.0 3.2 25.3 15.7 1.1 1.1 4.3 6.8 1.4 1.3
NMDC Buy 163 198 64,783 11,209 12,525 78.4 78.3 18.5 20.6 8.8 7.9 2.2 1.8 27.0 24.6 3.8 3.2
SAIL Neutral 100 - 41,140 47,252 60,351 14.2 14.8 9.6 11.7 10.4 8.5 0.9 0.9 9.4 10.6 1.3 1.1
www.angelbroking.com
Market Outlook
Stock Watch
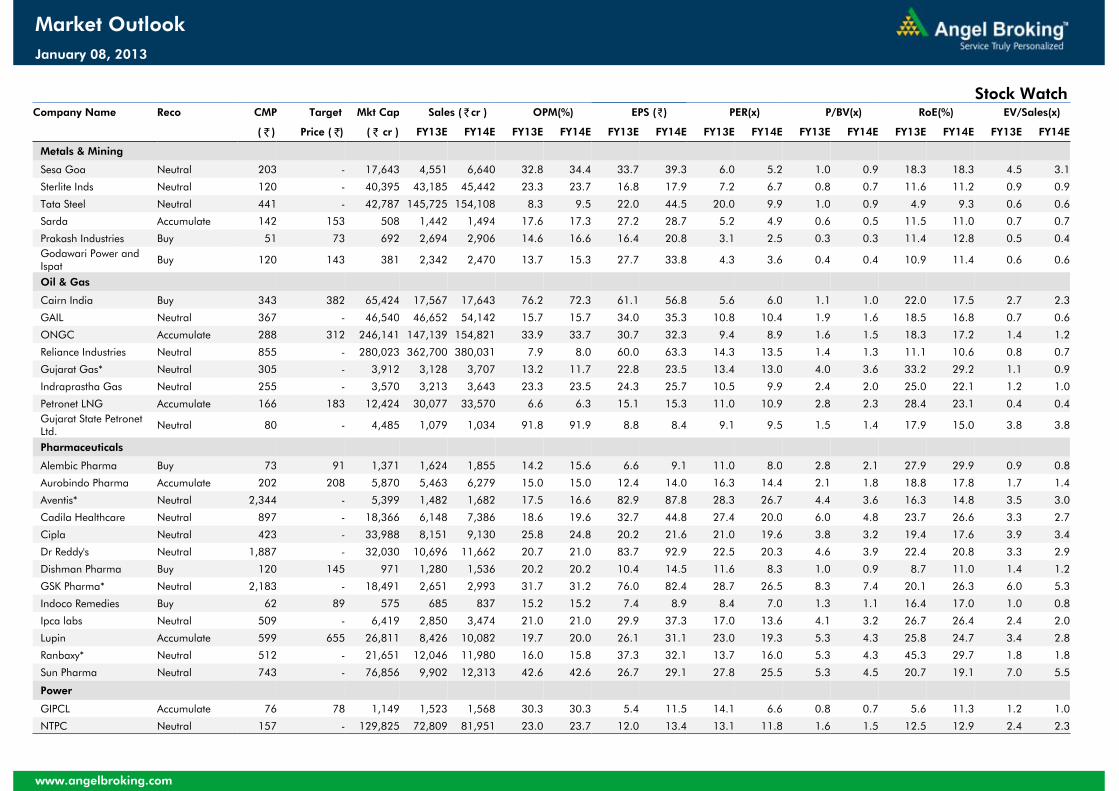
January 08, 2013
Company Name Reco CMP Target Mkt Cap Sales ( ₹cr ) OPM(%) EPS (₹) PER(x) P/BV(x) RoE(%) EV/Sales(x)
( ₹ ) Price ( ₹) ( ₹ cr ) FY13E FY14E FY13E FY14E FY13E FY14E FY13E FY14E FY13E FY14E FY13E FY14E FY13E FY14E
Metals & Mining
Sesa Goa Neutral 203 - 17,643 4,551 6,640 32.8 34.4 33.7 39.3 6.0 5.2 1.0 0.9 18.3 18.3 4.5 3.1
Sterlite Inds Neutral 120 - 40,395 43,185 45,442 23.3 23.7 16.8 17.9 7.2 6.7 0.8 0.7 11.6 11.2 0.9 0.9
Tata Steel Neutral 441 - 42,787 145,725 154,108 8.3 9.5 22.0 44.5 20.0 9.9 1.0 0.9 4.9 9.3 0.6 0.6
Sarda Accumulate 142 153 508 1,442 1,494 17.6 17.3 27.2 28.7 5.2 4.9 0.6 0.5 11.5 11.0 0.7 0.7
Prakash Industries Buy 51 73 692 2,694 2,906 14.6 16.6 16.4 20.8 3.1 2.5 0.3 0.3 11.4 12.8 0.5 0.4Godawari Power and Ispat Buy 120 143 381 2,342 2,470 13.7 15.3 27.7 33.8 4.3 3.6 0.4 0.4 10.9 11.4 0.6 0.6
Oil & Gas
Cairn India Buy 343 382 65,424 17,567 17,643 76.2 72.3 61.1 56.8 5.6 6.0 1.1 1.0 22.0 17.5 2.7 2.3
GAIL Neutral 367 - 46,540 46,652 54,142 15.7 15.7 34.0 35.3 10.8 10.4 1.9 1.6 18.5 16.8 0.7 0.6
ONGC Accumulate 288 312 246,141 147,139 154,821 33.9 33.7 30.7 32.3 9.4 8.9 1.6 1.5 18.3 17.2 1.4 1.2
Reliance Industries Neutral 855 - 280,023 362,700 380,031 7.9 8.0 60.0 63.3 14.3 13.5 1.4 1.3 11.1 10.6 0.8 0.7
Gujarat Gas* Neutral 305 - 3,912 3,128 3,707 13.2 11.7 22.8 23.5 13.4 13.0 4.0 3.6 33.2 29.2 1.1 0.9
Indraprastha Gas Neutral 255 - 3,570 3,213 3,643 23.3 23.5 24.3 25.7 10.5 9.9 2.4 2.0 25.0 22.1 1.2 1.0
Petronet LNG Accumulate 166 183 12,424 30,077 33,570 6.6 6.3 15.1 15.3 11.0 10.9 2.8 2.3 28.4 23.1 0.4 0.4Gujarat State Petronet Ltd. Neutral 80 - 4,485 1,079 1,034 91.8 91.9 8.8 8.4 9.1 9.5 1.5 1.4 17.9 15.0 3.8 3.8
Pharmaceuticals
Alembic Pharma Buy 73 91 1,371 1,624 1,855 14.2 15.6 6.6 9.1 11.0 8.0 2.8 2.1 27.9 29.9 0.9 0.8
Aurobindo Pharma Accumulate 202 208 5,870 5,463 6,279 15.0 15.0 12.4 14.0 16.3 14.4 2.1 1.8 18.8 17.8 1.7 1.4
Aventis* Neutral 2,344 - 5,399 1,482 1,682 17.5 16.6 82.9 87.8 28.3 26.7 4.4 3.6 16.3 14.8 3.5 3.0
Cadila Healthcare Neutral 897 - 18,366 6,148 7,386 18.6 19.6 32.7 44.8 27.4 20.0 6.0 4.8 23.7 26.6 3.3 2.7
Cipla Neutral 423 - 33,988 8,151 9,130 25.8 24.8 20.2 21.6 21.0 19.6 3.8 3.2 19.4 17.6 3.9 3.4
Dr Reddy's Neutral 1,887 - 32,030 10,696 11,662 20.7 21.0 83.7 92.9 22.5 20.3 4.6 3.9 22.4 20.8 3.3 2.9
Dishman Pharma Buy 120 145 971 1,280 1,536 20.2 20.2 10.4 14.5 11.6 8.3 1.0 0.9 8.7 11.0 1.4 1.2
GSK Pharma* Neutral 2,183 - 18,491 2,651 2,993 31.7 31.2 76.0 82.4 28.7 26.5 8.3 7.4 20.1 26.3 6.0 5.3
Indoco Remedies Buy 62 89 575 685 837 15.2 15.2 7.4 8.9 8.4 7.0 1.3 1.1 16.4 17.0 1.0 0.8
Ipca labs Neutral 509 - 6,419 2,850 3,474 21.0 21.0 29.9 37.3 17.0 13.6 4.1 3.2 26.7 26.4 2.4 2.0
Lupin Accumulate 599 655 26,811 8,426 10,082 19.7 20.0 26.1 31.1 23.0 19.3 5.3 4.3 25.8 24.7 3.4 2.8
Ranbaxy* Neutral 512 - 21,651 12,046 11,980 16.0 15.8 37.3 32.1 13.7 16.0 5.3 4.3 45.3 29.7 1.8 1.8
Sun Pharma Neutral 743 - 76,856 9,902 12,313 42.6 42.6 26.7 29.1 27.8 25.5 5.3 4.5 20.7 19.1 7.0 5.5
Power
GIPCL Accumulate 76 78 1,149 1,523 1,568 30.3 30.3 5.4 11.5 14.1 6.6 0.8 0.7 5.6 11.3 1.2 1.0
NTPC Neutral 157 - 129,825 72,809 81,951 23.0 23.7 12.0 13.4 13.1 11.8 1.6 1.5 12.5 12.9 2.4 2.3
www.angelbroking.com
Market Outlook
Stock Watch
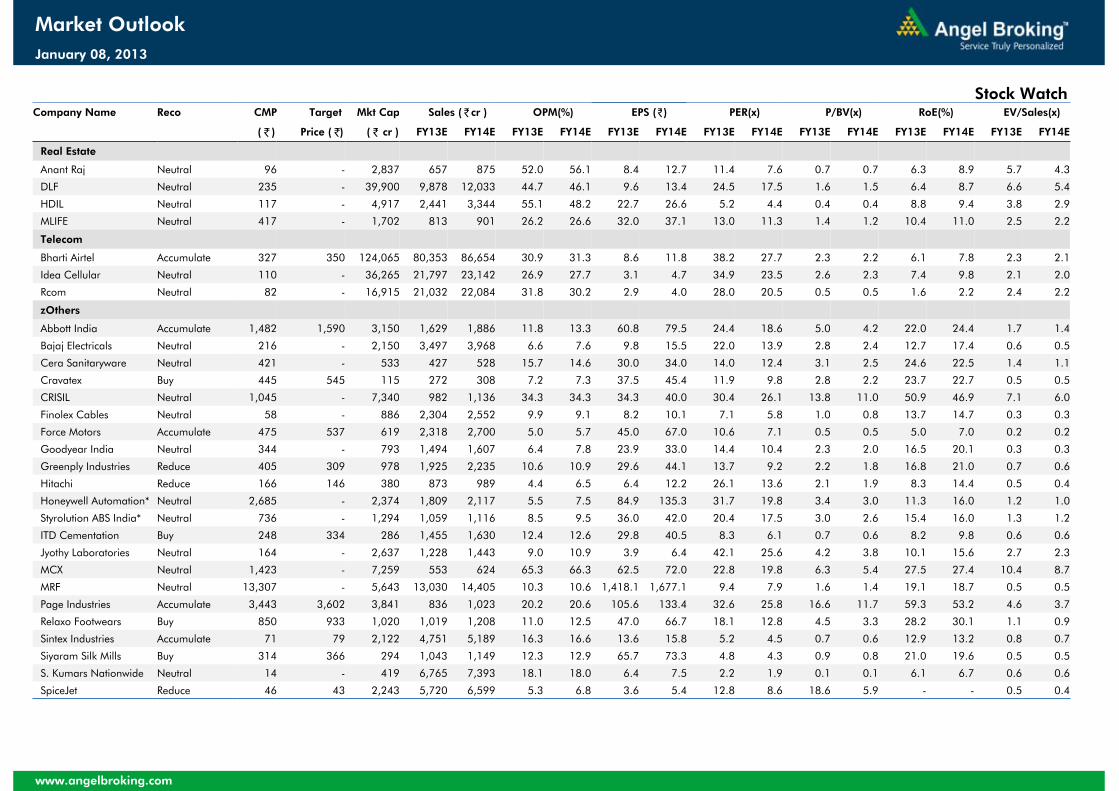
January 08, 2013
Company Name Reco CMP Target Mkt Cap Sales ( ₹cr ) OPM(%) EPS (₹) PER(x) P/BV(x) RoE(%) EV/Sales(x)
( ₹ ) Price ( ₹) ( ₹ cr ) FY13E FY14E FY13E FY14E FY13E FY14E FY13E FY14E FY13E FY14E FY13E FY14E FY13E FY14E
Real Estate
Anant Raj Neutral 96 - 2,837 657 875 52.0 56.1 8.4 12.7 11.4 7.6 0.7 0.7 6.3 8.9 5.7 4.3
DLF Neutral 235 - 39,900 9,878 12,033 44.7 46.1 9.6 13.4 24.5 17.5 1.6 1.5 6.4 8.7 6.6 5.4
HDIL Neutral 117 - 4,917 2,441 3,344 55.1 48.2 22.7 26.6 5.2 4.4 0.4 0.4 8.8 9.4 3.8 2.9
MLIFE Neutral 417 - 1,702 813 901 26.2 26.6 32.0 37.1 13.0 11.3 1.4 1.2 10.4 11.0 2.5 2.2
Telecom
Bharti Airtel Accumulate 327 350 124,065 80,353 86,654 30.9 31.3 8.6 11.8 38.2 27.7 2.3 2.2 6.1 7.8 2.3 2.1
Idea Cellular Neutral 110 - 36,265 21,797 23,142 26.9 27.7 3.1 4.7 34.9 23.5 2.6 2.3 7.4 9.8 2.1 2.0
Rcom Neutral 82 - 16,915 21,032 22,084 31.8 30.2 2.9 4.0 28.0 20.5 0.5 0.5 1.6 2.2 2.4 2.2
zOthers
Abbott India Accumulate 1,482 1,590 3,150 1,629 1,886 11.8 13.3 60.8 79.5 24.4 18.6 5.0 4.2 22.0 24.4 1.7 1.4
Bajaj Electricals Neutral 216 - 2,150 3,497 3,968 6.6 7.6 9.8 15.5 22.0 13.9 2.8 2.4 12.7 17.4 0.6 0.5
Cera Sanitaryware Neutral 421 - 533 427 528 15.7 14.6 30.0 34.0 14.0 12.4 3.1 2.5 24.6 22.5 1.4 1.1
Cravatex Buy 445 545 115 272 308 7.2 7.3 37.5 45.4 11.9 9.8 2.8 2.2 23.7 22.7 0.5 0.5
CRISIL Neutral 1,045 - 7,340 982 1,136 34.3 34.3 34.3 40.0 30.4 26.1 13.8 11.0 50.9 46.9 7.1 6.0
Finolex Cables Neutral 58 - 886 2,304 2,552 9.9 9.1 8.2 10.1 7.1 5.8 1.0 0.8 13.7 14.7 0.3 0.3
Force Motors Accumulate 475 537 619 2,318 2,700 5.0 5.7 45.0 67.0 10.6 7.1 0.5 0.5 5.0 7.0 0.2 0.2
Goodyear India Neutral 344 - 793 1,494 1,607 6.4 7.8 23.9 33.0 14.4 10.4 2.3 2.0 16.5 20.1 0.3 0.3
Greenply Industries Reduce 405 309 978 1,925 2,235 10.6 10.9 29.6 44.1 13.7 9.2 2.2 1.8 16.8 21.0 0.7 0.6
Hitachi Reduce 166 146 380 873 989 4.4 6.5 6.4 12.2 26.1 13.6 2.1 1.9 8.3 14.4 0.5 0.4
Honeywell Automation* Neutral 2,685 - 2,374 1,809 2,117 5.5 7.5 84.9 135.3 31.7 19.8 3.4 3.0 11.3 16.0 1.2 1.0
Styrolution ABS India* Neutral 736 - 1,294 1,059 1,116 8.5 9.5 36.0 42.0 20.4 17.5 3.0 2.6 15.4 16.0 1.3 1.2
ITD Cementation Buy 248 334 286 1,455 1,630 12.4 12.6 29.8 40.5 8.3 6.1 0.7 0.6 8.2 9.8 0.6 0.6
Jyothy Laboratories Neutral 164 - 2,637 1,228 1,443 9.0 10.9 3.9 6.4 42.1 25.6 4.2 3.8 10.1 15.6 2.7 2.3
MCX Neutral 1,423 - 7,259 553 624 65.3 66.3 62.5 72.0 22.8 19.8 6.3 5.4 27.5 27.4 10.4 8.7
MRF Neutral 13,307 - 5,643 13,030 14,405 10.3 10.6 1,418.1 1,677.1 9.4 7.9 1.6 1.4 19.1 18.7 0.5 0.5
Page Industries Accumulate 3,443 3,602 3,841 836 1,023 20.2 20.6 105.6 133.4 32.6 25.8 16.6 11.7 59.3 53.2 4.6 3.7
Relaxo Footwears Buy 850 933 1,020 1,019 1,208 11.0 12.5 47.0 66.7 18.1 12.8 4.5 3.3 28.2 30.1 1.1 0.9
Sintex Industries Accumulate 71 79 2,122 4,751 5,189 16.3 16.6 13.6 15.8 5.2 4.5 0.7 0.6 12.9 13.2 0.8 0.7
Siyaram Silk Mills Buy 314 366 294 1,043 1,149 12.3 12.9 65.7 73.3 4.8 4.3 0.9 0.8 21.0 19.6 0.5 0.5
S. Kumars Nationwide Neutral 14 - 419 6,765 7,393 18.1 18.0 6.4 7.5 2.2 1.9 0.1 0.1 6.1 6.7 0.6 0.6
SpiceJet Reduce 46 43 2,243 5,720 6,599 5.3 6.8 3.6 5.4 12.8 8.6 18.6 5.9 - - 0.5 0.4
www.angelbroking.com
Market Outlook
Stock Watch
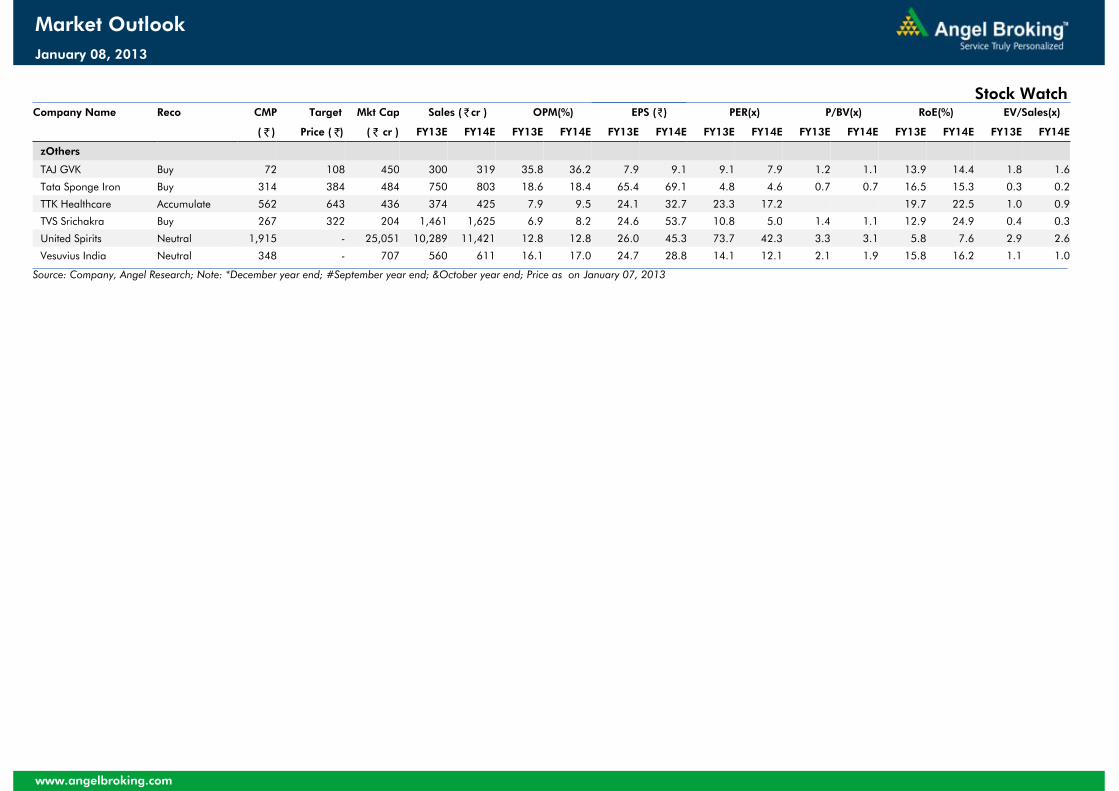
January 08, 2013
Company Name Reco CMP Target Mkt Cap Sales ( ₹cr ) OPM(%) EPS (₹) PER(x) P/BV(x) RoE(%) EV/Sales(x)
( ₹ ) Price ( ₹) ( ₹ cr ) FY13E FY14E FY13E FY14E FY13E FY14E FY13E FY14E FY13E FY14E FY13E FY14E FY13E FY14E
zOthers
TAJ GVK Buy 72 108 450 300 319 35.8 36.2 7.9 9.1 9.1 7.9 1.2 1.1 13.9 14.4 1.8 1.6
Tata Sponge Iron Buy 314 384 484 750 803 18.6 18.4 65.4 69.1 4.8 4.6 0.7 0.7 16.5 15.3 0.3 0.2
TTK Healthcare Accumulate 562 643 436 374 425 7.9 9.5 24.1 32.7 23.3 17.2 19.7 22.5 1.0 0.9
TVS Srichakra Buy 267 322 204 1,461 1,625 6.9 8.2 24.6 53.7 10.8 5.0 1.4 1.1 12.9 24.9 0.4 0.3
United Spirits Neutral 1,915 - 25,051 10,289 11,421 12.8 12.8 26.0 45.3 73.7 42.3 3.3 3.1 5.8 7.6 2.9 2.6
Vesuvius India Neutral 348 - 707 560 611 16.1 17.0 24.7 28.8 14.1 12.1 2.1 1.9 15.8 16.2 1.1 1.0
Source: Company, Angel Research; Note: *December year end; #September year end; &October year end; Price as on January 07, 2013
www.angelbroking.com
Market Outlook
Stock Watch
January 08, 2013
www.angelbroking.com
Market OutlookJanuary 08, 2013