market outlook 16 12 2016 1 -...
TRANSCRIPT

www.angelbroking.com
Market Outlook December 16, 2016
Market Cues
Indian markets are expected to open flat tracking the SGX Nifty.
US Markets rose on Thursday as a post-election rally resumed, while investors digested a slew of economic data and the Federal Reserve's decision to raise interest rates.
The European markets ended Thursday's session in the green after a series of announcements from central banks. Banks were among the strongest performing stocks after yesterday's decision by the Federal Reserve to hike interest rates by a quarter point.
Indian markets closed lower on Thursday in a volatile session after the U.S. Federal Reserve raised its key interest rate for the first time in 2016 and also hinted at a more aggressive pattern of rate increases next year. Higher U.S. interest rates could result in dollar outflows from emerging markets towards the U.S.
News Analysis Bajaj launches Dominar 400 at `1.5 lakh
Detailed analysis on Pg2
Investor’s Ready Reckoner
Key Domestic & Global Indicators
Stock Watch: Latest investment recommendations on 150+ stocks
Refer Pg5 onwards
Top Picks Company Sector Rating
CMP(`)
Target(`)
Upside (%)
Amara Raja Batt. Auto & Auto Ancill. Buy 909 1,167 28.4
Alkem Laboratories Pharmaceuticals Buy 1,636 1,989 21.6
HCL Tech IT Buy 832 1,000 20.2
Power Grid Corp. Power Buy 183 223 21.6
Navkar Corp. Others Buy 174 265 52.7More Top Picks on Pg3
Key Upcoming Events Date Region Event Description
PreviousReading
Consensus Expectations
Dec 16 UK BOE Announces rates 0.25 0.25Dec 16 US Building permits 1,260.00 1,240.00Dec 16 Euro Zone Euro-Zone CPI (YoY) 0.60 0.60Dec 21 Euro Zone Euro-Zone Consumer Confidence (6.10) --
Dec 21 US Existing home sales 5.60 5.52
More Events on Pg4
Domestic Indices Chg (%) (Pts) (Close)
BSE Sensex (0.3) (84) 26,519
Nifty (0.4) (29) 8,154
Mid Cap (0.0) (0) 12,241
Small Cap 0.2 25 12,143
Bankex 0.3 61 21,100
Global Indices Chg (%) (Pts) (Close)
Dow Jones 0.3 60 19,852
Nasdaq 0.4 20 5,457
FTSE 0.7 50 6,999
Nikkei 0.1 20 19,274
Hang Seng (1.8) (397) 22,059
Shanghai Com (0.7) (23) 3,118
Advances / Declines BSE NSE
Advances 1,283 781
Declines 1,331 805
Unchanged 182 87
Volumes (` Cr)
BSE 2,582
NSE 17,108
Net Inflows (` Cr) Net Mtd Ytd
FII (477) (376) 26,902
MFs (222) 411 38,596
Top Gainers Price (`) Chg (%)
Hathway 36 5.4
Ifci 27 4.6
Igl 907 4.3
Jswenergy 62 4.2
Mphasis 555 4.1
Top Losers Price (`) Chg (%)
Nationalum 61 (7.8)
Sunpharma 649 (4.4)
Unitech 5 (3.6)
Intellect 160 (3.5)
Edelweiss 88 (3.3) As on December 15, 2016

www.angelbroking.com
Market Outlook December 16, 2016
News Analysis
Bajaj Auto launches Dominar 400 at `1.5 lakh
Bajaj Auto on Thursday launched its latest sports bike Dominar 400 priced up to `1.5 lakh (ex-showroom Delhi) as it looks to challenge segment leader Royal Enfield in the `1-2 lakh category. The Dominar 400, powered by a 373cc engine will be available with ABS and disc brake versions which are priced at `1.5 lakh and `1.36 lakh, respectively.
The company is targeting about 20 per cent of the segment and if achieve that the Dominar will be a $1 billion brand in the next 12-18 months. Initially the company is looking at selling around 10,000 units in the domestic market even as it will start exporting the new product to the global markets from February 2017.
Further, the company has plan to export to Europe, ASEAN countries like Indonesia, Malaysia and the Philippines besides Latin America.The company on Thursday opened the booking for the Dominar 400 online with an amount of `9,000 and deliveries will begin by January.
Economic and Political News
Withdrawal limit may ease after 80% new notes re-channelised
Smart city initiatives to benefit 50% of citizens across the globe: Gartner
Fortis to add two hospitals through operations and management contracts
Corporate News
US-based Baxter to acquire Claris Injectables for `4,237cr
Maruti Suzuki to launch premium hatchback Ignis on Jan 13
IVRCL Q2 net loss at `354cr

www.angelbroking.com
Market Outlook December 16, 2016
Top Picks ★★★★★ Large Cap Company
Market Cap (` Cr)
CMP(`)
Target (`)
Upside (%)
Rationale
Amara Raja Batteries 15,529 909 1,167 28.4 To outpace battery industry growth due to better technological products leading to market share gains in both the automotive OEM and replacement segments.
Alkem Laboratories 19,561 1,636 1,989 21.6 Strong growth in domestic business due to its leadership in acute therapeutic segment. Alkem expects to launch more products in USA, which bodes for its international business.
HCL Tech 1,17,370 832 1,000 20.2 The stock is trading at attractive valuations and is factoring all the bad news.
Infosys 2,28,144 993 1,249 25.7 Back on the growth trend; expect a long term growth of 14% to be a US$20bn in FY2020.
Larsen & Tourbo 1,26,681 1,358 1,634 20.3 Strong order backlog and improvement in execution would trigger the growth for the L&T
Lupin 66,769 1,479 1,809 22.3
One of the largest pharma companies with strong international presence. It has a rich pipeline of ANDAs which is also one of the largest among the generic companies.
Power Grid Corporation 95,921 183 223 21.6 Going forward, we expect the company to report strong top-line CAGR of ~16% and bottom-line CAGR of ~19% over FY16-18 on back of strong capitalization guidance
Source: Company, Angel Research
Mid Cap Company
Market Cap(` Cr)
CMP (`)
Target(`)
Upside (%)
Rationale
Asian Granito 638 212 351 65.4We expect the company would report strong profitabilityowing to better product mix, higher B2C sales andamalgamation synergy.
Bajaj Electricals 2,211 219 274 25.2Among the top 4 players in the consumer durables segment.Improved profitability backed by turn around in E&Psegment. Strong order book lends earnings visibility.
Blue Star 4,429 464 634 36.7Favourable outlook for AC industry augurs well for Coolingproducts business which is outgrowing the market. EMPPACdivision's is likely to turn around on improving economy
Dewan Housing Finance 7,625 244 350 43.7With a focus on the low and medium income (LMI)consumer segment, the company has increased its presencein tier-II & III cities where the growth opportunity is immense.
Equitas Holdings 5,153 154 235 52.9
Strong loan growth backed by diversified loan portfolio andadequate CAR. ROE & ROA likely to remain decent as risk ofdilution remains low. Attractive valuations consideringgrowth.
Jagran Prakashan 5,368 164 225 37.0
Economic recovery to have favourable impact on advertising& circulation revenue growth. Further, the acquisition of aradio business (Radio City) would also boost the company'srevenue growth.
Mahindra Lifespace 1,477 360 522 45.0Speedier execution and speedier sales, strong revenuevisibilty in short-to-long run, attractive valuations
Mirza International 985 82 107 30.7
We expect the company to report strong growth on back ofhealthy growth in domestic branded sales (owing toaggressive ad spend and addition in the number of EBOs &multi-brand outlets [MBOs]) and healthy export revenues.
Navkar Corporation 2,474 174 265 52.7 Massive capacity expansion along with rail advantage atICD as well CFS augurs well for the company.
Siyaram Silk Mills 1,130 1,205 1,605 33.2Strong brands and distribution network would boost growthgoing ahead. Stock currently trades at an inexpensivevaluation.
TV Today Network 1,655 277 385 38.8
Market leadership in Hindi news genre and no. 2 viewershipranking in English news genre, exit from the radio business,and anticipated growth in ad spends by corporate to benefitthe stock.
Source: Company, Angel Research

h
Market Outlook December 16, 2016
www.angelbroking.com www.angelbroking.com
Key Upcoming Events
Global economic events release calendar
Date Time Country Event Description Unit Period Bloomberg Data
Last Reported Estimated
Dec 16, 2016 5:30 PM UK BOE Announces rates % Ratio Dec 15 0.25 0.25
7:00 PM US Building permits Thousands Nov 1,260.00 1,240.00
3:30 PM Euro Zone Euro-Zone CPI (YoY) % Nov F 0.60 0.60
Dec 21, 2016 8:30 PM Euro Zone Euro-Zone Consumer Confidence Value Dec A (6.10)
8:30 PM US Existing home sales Million Nov 5.60 5.52
Dec 22, 2016 7:00 PM US GDP Qoq (Annualised) % Change 3Q T 3.20 3.30
Dec 23, 2016 3:00 PM UK GDP (YoY) % Change 3Q F 2.30
8:30 PM US New home sales Thousands Nov 563.00 575.00
Dec 27, 2016 8:30 PM US Consumer ConfidenceS.A./ 1985=100 Dec 107.10 107.00
Jan 01, 2017 6:30 AM China PMI Manufacturing Value Dec 51.70
Jan 03, 2017 2:25 PM Germany Unemployment change (000's) Thousands Dec (5.00)
3:00 PM UK PMI Manufacturing Value Dec 53.40
Jan 06, 2017 7:00 PM US Change in Nonfarm payrolls Thousands Dec 178.00 169.00
7:00 PM US Unnemployment rate % Dec 4.60 4.70
Jan 08, 2017 China Exports YoY% % Change Dec 0.10
Jan 09, 2017 China Consumer Price Index (YoY) % Change Dec 2.30
Jan 11, 2017 3:00 PM UK Industrial Production (YoY) % Change Nov (1.10)
Jan 12, 2017 5:30 PM India Industrial Production YoY % Change Nov (1.90)
Jan 13, 2017 US Producer Price Index (mom) % Change Dec -
Jan 16, 2017 12:00 PM India Monthly Wholesale Prices YoY% % Change Dec 3.15
Jan 17, 2017 China Industrial Production (YoY) % Change Dec 6.20
China Real GDP (YoY) % Change 4Q 6.70
3:00 PM UK Jobless claims change % Change Dec 2.40
Jan 18, 2017 3:00 PM UK CPI (YoY) % Change Dec 1.20
7:45 PM US Industrial Production % Dec (0.44)
Source: Bloomberg, Angel Research
h
1
Market Outlook
December 16, 2016
www.angelbroking.com www.angelbroking.com
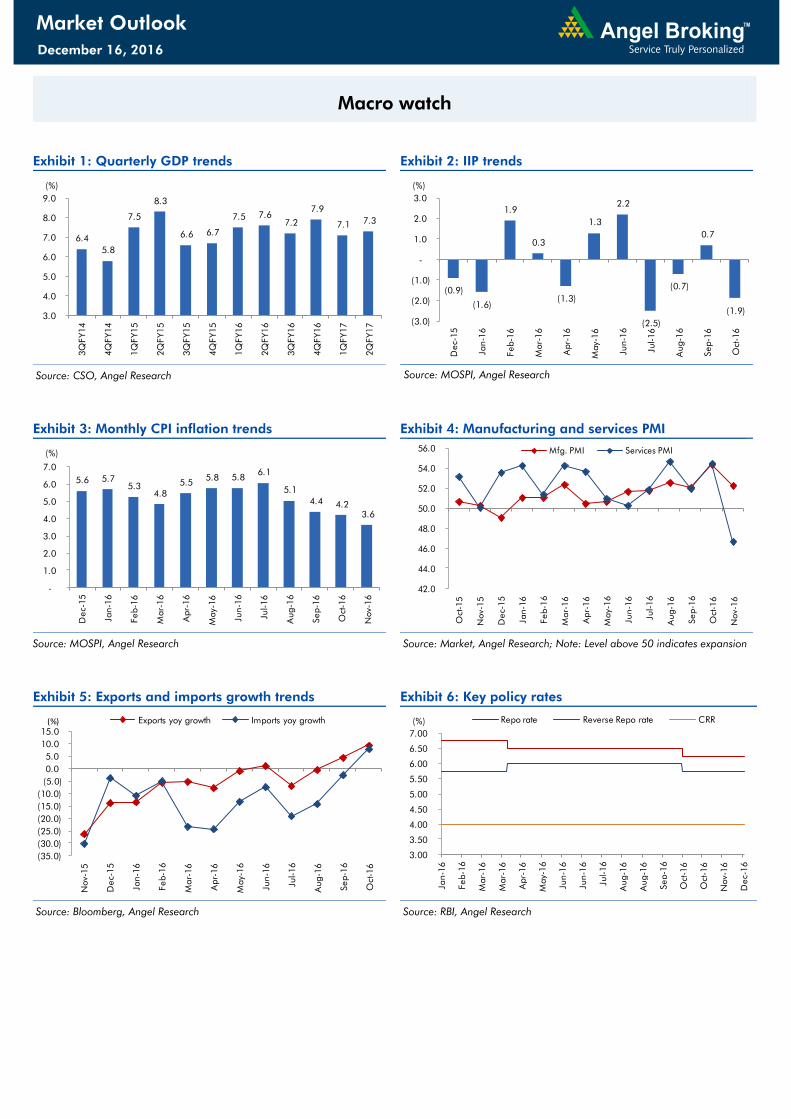
Macro watch
Exhibit 1: Quarterly GDP trends
Source: CSO, Angel Research
Exhibit 2: IIP trends
Source: MOSPI, Angel Research
Exhibit 3: Monthly CPI inflation trends
Source: MOSPI, Angel Research
Exhibit 4: Manufacturing and services PMI
Source: Market, Angel Research; Note: Level above 50 indicates expansion
Exhibit 5: Exports and imports growth trends
Source: Bloomberg, Angel Research
Exhibit 6: Key policy rates
Source: RBI, Angel Research
6.4
5.8
7.5
8.3
6.6 6.7
7.5 7.6
7.2
7.9
7.1 7.3
3.0
4.0
5.0
6.0
7.0
8.0
9.0
3Q
FY14
4Q
FY14
1Q
FY15
2Q
FY15
3Q
FY15
4Q
FY15
1Q
FY16
2Q
FY16
3Q
FY16
4Q
FY16
1Q
FY17
2Q
FY17
(%)
(0.9)
(1.6)
1.9
0.3
(1.3)
1.3
2.2
(2.5)
(0.7)
0.7
(1.9)
(3.0)
(2.0)
(1.0)
-
1.0
2.0
3.0
Dec-15
Jan-16
Feb-16
Mar-16
Apr-16
May-16
Jun-16
Jul-16
Aug-16
Sep-16
Oct-16
(%)
5.6 5.7
5.3
4.8
5.5 5.8 5.8
6.1
5.1
4.4 4.2
3.6
-
1.0
2.0
3.0
4.0
5.0
6.0
7.0
Dec-15
Jan-16
Feb-16
Mar-16
Apr-16
May-16
Jun-16
Jul-16
Aug-16
Sep-16
Oct-16
Nov-16
(%)
42.0
44.0
46.0
48.0
50.0
52.0
54.0
56.0
Oct-15
Nov-15
Dec-15
Jan-16
Feb-16
Mar-16
Apr-16
May-16
Jun-16
Jul-16
Aug-16
Sep-16
Oct-16
Nov-16
Mfg. PMI Services PMI
(35.0)
(30.0)
(25.0)
(20.0)
(15.0)
(10.0)
(5.0)
0.0
5.0
10.0
15.0
Nov-15
Dec-15
Jan-16
Feb-16
Mar-16
Apr-16
May-16
Jun-16
Jul-16
Aug-16
Sep-16
Oct-16
Exports yoy growth Imports yoy growth(%)
3.00
3.50
4.00
4.50
5.00
5.50
6.00
6.50
7.00
Jan-16
Feb-16
Mar-16
Mar-16
Apr-16
May-16
Jun-16
Jun-16
Jul-16
Aug-16
Aug-16
Sep-16
Oct-16
Oct-16
Nov-16
Dec-16
Repo rate Reverse Repo rate CRR (%)

h
2
Market Outlook
December 16, 2016
www.angelbroking.com www.angelbroking.com
Global watch
Exhibit 1: Latest quarterly GDP Growth (%, yoy) across select developing and developed countries
Source: Bloomberg, Angel Research
Exhibit 2: 2016 GDP Growth projection by IMF (%, yoy) across select developing and developed countries
Source: IMF, Angel Research
Exhibit 3: One year forward P-E ratio across select developing and developed countries
Source: IMF, Angel Research
(2.9)
(0.4)
5.3
6.7
0.7
5.0
4.3
3.2
2.3
1.6 1.5 1.1 1.1
(4.0)
(2.0)
-
2.0
4.0
6.0
8.0
Brazil
Russia
India
China
South A
frica
Indonesia
Malaysia
Thailand
UK
USA
Germ
any
France
Japan
(%)
(3.3)
(0.8)
7.6
6.6
0.1
4.9
4.3
3.2
1.8 1.6 1.7
1.3
0.5
(4.0)
(2.0)
-
2.0
4.0
6.0
8.0
10.0
Brazil
Russia
India
Chin
a
South
Afr
ica
Indonesia
Mala
ysia
Thailand
UK
USA
Germ
any
France
Japan
(%)
12
.2
7.8
16
.5
13
.5
15
.2
17
.5
16
.4
14
.0
15
.5
16
.9
13
.5
15
.1
15
.5
-
2.0
4.0
6.0
8.0
10.0
12.0
14.0
16.0
18.0
20.0
Brazil
Russia
India
China
South
Africa
Indonesia
Malaysia
Thailand
UK
USA
Germ
any
France
Japan
(x)

h
3
Market Outlook
December 16, 2016
www.angelbroking.com www.angelbroking.com
Exhibit 4: Relative performance of indices across globe
Returns (%)
Country Name of index Closing price 1M 3M 1YR
Brazil Bovespa 58,212 (1.6) (0.6) 26.3
Russia Micex 2,229 10.1 11.2 27.4
India Nifty 8,182 0.6 (6.4) 7.1
China Shanghai Composite 3,141 (2.8) 0.8 (11.9)
South Africa Top 40 44,052 1.6 (3.7) 0.1
Mexico Mexbol 46,221 2.2 (0.5) 7.7
Indonesia LQ45 883 3.0 (2.9) 13.3
Malaysia KLCI 1,643 0.6 (2.6) (1.7)
Thailand SET 50 950 1.4 2.3 10.5
USA Dow Jones 19,793 5.0 9.7 11.5
UK FTSE 6,949 2.9 3.3 13.9
Japan Nikkei 19,254 10.8 13.5 (1.3)
Germany DAX 11,245 5.4 8.5 6.7
France CAC 4,769 5.9 10.9 3.0
Source: Bloomberg, Angel Research

Company Name Reco CMP Target Mkt Cap Sales ( ₹cr ) OPM(%) EPS (₹) PER(x) P/BV(x) RoE(%) EV/Sales(x)
( ₹ ) Price ( ₹) ( ₹ cr ) FY17E FY18E FY17E FY18E FY17E FY18E FY17E FY18E FY17E FY18E FY17E FY18E FY17E FY18E
Agri / Agri Chemical
Rallis Accumulate 197 209 3,839 1,937 2,164 13.3 14.3 9.0 11.0 21.9 18.0 3.8 3.3 18.4 19.8 2.0 1.8
United Phosphorus Accumulate 646 684 32,752 15,176 17,604 18.5 18.5 37.4 44.6 17.3 14.5 3.4 2.8 21.4 21.2 2.3 1.9
Auto & Auto Ancillary
Ashok Leyland Buy 78 111 22,141 22,407 26,022 10.6 10.6 5.2 6.4 14.9 12.1 3.4 2.9 23.6 24.7 1.1 0.9
Bajaj Auto Neutral 2,675 - 77,396 25,093 27,891 19.5 19.2 143.9 162.5 18.6 16.5 5.2 4.5 30.3 29.4 2.8 2.5
Bharat Forge Neutral 975 - 22,689 7,726 8,713 20.5 21.2 35.3 42.7 27.6 22.8 5.1 4.6 18.9 20.1 3.0 2.6
Eicher Motors Neutral 21,515 - 58,529 16,583 20,447 17.5 18.0 598.0 745.2 36.0 28.9 12.3 9.4 41.2 38.3 3.4 2.7
Gabriel India Buy 107 130 1,538 1,544 1,715 9.0 9.3 5.4 6.3 19.8 17.0 3.7 3.3 18.9 19.5 1.0 0.8
Hero Motocorp Accumulate 3,168 3,541 63,264 30,958 34,139 15.7 15.7 193.6 208.3 16.4 15.2 6.4 5.3 34.2 30.5 1.9 1.7
Jamna Auto Industries Neutral 170 - 1,354 1,486 1,620 9.8 9.9 15.0 17.2 11.3 9.9 2.5 2.1 21.8 21.3 1.0 0.9
L G Balakrishnan & Bros Neutral 601 - 943 1,302 1,432 11.6 11.9 43.7 53.0 13.8 11.3 1.9 1.8 13.8 14.2 0.8 0.7
Mahindra and Mahindra Neutral 1,182 - 73,432 46,534 53,077 11.6 11.7 67.3 78.1 17.6 15.2 2.9 2.5 15.4 15.8 1.6 1.3
Maruti Buy 5,152 6,006 155,624 68,057 82,958 15.8 15.5 212.1 261.2 24.3 19.7 4.8 4.0 19.8 20.3 2.0 1.5
Minda Industries Neutral 322 - 2,554 2,728 3,042 9.0 9.1 68.2 86.2 4.7 3.7 1.1 0.9 23.8 24.3 1.0 0.9
Motherson Sumi Neutral 321 - 45,028 45,896 53,687 7.8 8.3 13.0 16.1 24.6 19.9 7.9 6.3 34.7 35.4 1.1 0.9
Rane Brake Lining Neutral 990 - 783 511 562 11.3 11.5 28.1 30.9 35.2 32.0 5.4 4.9 15.3 15.0 1.7 1.5
Setco Automotive Neutral 37 - 495 741 837 13.0 13.0 15.2 17.0 2.4 2.2 0.4 0.4 15.8 16.3 1.1 1.0
Tata Motors Neutral 463 - 133,807 300,209 338,549 8.9 8.4 42.7 54.3 10.9 8.5 1.7 1.5 15.6 17.2 0.6 0.5
TVS Motor Neutral 378 - 17,965 13,390 15,948 6.9 7.1 12.8 16.5 29.6 22.9 7.4 5.8 26.3 27.2 1.4 1.1
Amara Raja Batteries Buy 909 1,167 15,529 5,504 6,605 17.6 17.5 33.4 40.9 27.2 22.2 6.0 4.9 22.1 22.0 2.8 2.3
Exide Industries Neutral 174 - 14,816 7,439 8,307 15.0 15.0 8.1 9.3 21.5 18.7 3.0 2.7 14.3 16.7 1.6 1.4
Apollo Tyres Buy 200 235 10,191 12,877 14,504 14.3 13.9 21.4 23.0 9.3 8.7 1.5 1.3 16.4 15.2 1.0 0.9
Ceat Accumulate 1,282 1,450 5,188 7,524 8,624 13.0 12.7 131.1 144.3 9.8 8.9 1.8 1.5 19.8 18.6 0.8 0.7
JK Tyres Neutral 119 - 2,700 7,455 8,056 15.0 15.0 21.8 24.5 5.5 4.9 1.1 0.9 22.8 21.3 0.5 0.4
Swaraj Engines Neutral 1,358 - 1,687 660 810 15.2 16.4 54.5 72.8 24.9 18.7 7.8 7.1 31.5 39.2 2.4 1.9
Subros Neutral 161 - 965 1,488 1,681 11.7 11.9 6.4 7.2 25.1 22.4 2.7 2.4 10.8 11.4 0.9 0.8
Indag Rubber Neutral 177 - 466 286 326 19.8 16.8 11.7 13.3 15.2 13.3 2.6 2.4 17.8 17.1 1.3 1.1
Capital Goods
ACE Neutral 48 - 473 709 814 4.1 4.6 1.4 2.1 34.1 22.8 1.4 1.3 4.4 6.0 0.8 0.7
BEML Neutral 927 - 3,862 3,451 4,055 6.3 9.2 31.4 57.9 29.5 16.0 1.8 1.6 6.3 10.9 1.2 1.0
Bharat Electronics Neutral 1,439 - 32,147 8,137 9,169 16.8 17.2 58.7 62.5 24.5 23.0 3.8 3.4 44.6 46.3 2.9 2.6
www.angelbroking.com
December 16, 2016
Stock Watch

Company Name Reco CMP Target Mkt Cap Sales ( ₹cr ) OPM(%) EPS (₹) PER(x) P/BV(x) RoE(%) EV/Sales(x)
( ₹ ) Price ( ₹) ( ₹ cr ) FY17E FY18E FY17E FY18E FY17E FY18E FY17E FY18E FY17E FY18E FY17E FY18E FY17E FY18E
Capital Goods
Voltas Buy 324 407 10,712 6,511 7,514 7.9 8.7 12.9 16.3 25.1 19.9 4.5 4.0 16.7 18.5 1.4 1.2
BGR Energy Neutral 117 - 844 16,567 33,848 6.0 5.6 7.8 5.9 15.0 19.8 0.9 0.8 4.7 4.2 0.2 0.1
BHEL Neutral 125 - 30,693 28,797 34,742 - 2.8 2.3 6.9 54.5 18.2 0.9 0.9 1.3 4.8 0.7 0.5
Blue Star Buy 464 634 4,429 4,283 5,077 5.9 7.3 14.9 22.1 31.2 21.0 6.1 5.1 20.4 26.4 1.1 0.9
Crompton Greaves Neutral 59 - 3,704 5,777 6,120 5.9 7.0 3.3 4.5 17.9 13.1 0.8 0.8 4.4 5.9 0.6 0.5
Greaves Cotton Neutral 124 - 3,027 1,755 1,881 16.8 16.9 7.8 8.5 15.9 14.6 3.2 3.0 20.6 20.9 1.4 1.3
Inox Wind Neutral 204 - 4,537 5,605 6,267 15.7 16.4 24.8 30.0 8.2 6.8 2.3 1.7 25.9 24.4 0.9 0.7
KEC International Neutral 141 - 3,635 9,294 10,186 7.9 8.1 9.9 11.9 14.3 11.9 2.1 1.8 15.6 16.3 0.6 0.6
Thermax Neutral 824 - 9,813 5,421 5,940 7.3 7.3 25.7 30.2 32.0 27.3 3.9 3.5 12.2 13.1 1.7 1.6
VATech Wabag Buy 478 681 2,606 3,136 3,845 8.9 9.1 26.0 35.9 18.4 13.3 2.3 2.0 13.4 15.9 0.7 0.6
Cement
ACC Neutral 1,315 - 24,695 11,225 13,172 13.2 16.9 44.5 75.5 29.6 17.4 2.8 2.6 11.2 14.2 2.2 1.9
Ambuja Cements Neutral 202 - 40,100 9,350 10,979 18.2 22.5 5.8 9.5 34.8 21.3 2.9 2.6 10.2 12.5 4.3 3.7
India Cements Neutral 113 - 3,463 4,364 4,997 18.5 19.2 7.9 11.3 14.3 10.0 1.0 1.0 8.0 8.5 1.6 1.4
JK Cement Neutral 693 - 4,846 4,398 5,173 15.5 17.5 31.2 55.5 22.2 12.5 2.7 2.3 12.0 15.5 1.7 1.4
J K Lakshmi Cement Buy 354 565 4,160 2,913 3,412 14.5 19.5 7.5 22.5 47.1 15.7 2.9 2.4 12.5 18.0 2.0 1.7
Orient Cement Buy 124 215 2,543 2,114 2,558 18.5 20.5 8.1 11.3 15.3 11.0 2.3 1.9 9.0 14.0 1.8 1.4
UltraTech Cement Neutral 3,268 - 89,705 25,768 30,385 21.0 23.5 111.0 160.0 29.4 20.4 3.8 3.3 13.5 15.8 3.6 3.0
Construction
ITNL Neutral 103 - 3,373 8,946 10,017 31.0 31.6 8.1 9.1 12.7 11.3 0.5 0.5 4.2 5.0 3.7 3.4
KNR Constructions Buy 169 802 2,374 1,385 1,673 14.7 14.0 41.2 48.5 4.1 3.5 0.8 0.7 14.9 15.2 1.8 1.5
Larsen & Toubro Buy 1,358 1,634 126,681 111,017 124,908 11.0 11.0 61.1 66.7 22.2 20.4 2.7 2.5 13.1 12.9 2.2 2.0
Gujarat Pipavav Port Neutral 141 - 6,817 705 788 52.2 51.7 5.0 5.6 28.2 25.2 2.8 2.5 11.2 11.2 9.3 7.9
Nagarjuna Const. Neutral 83 - 4,631 8,842 9,775 9.1 8.8 5.3 6.4 15.7 13.0 1.2 1.1 8.2 9.1 0.7 0.6
PNC Infratech Buy 106 143 2,717 2,350 2,904 13.1 13.2 9.0 8.8 11.8 12.0 0.4 0.4 15.9 13.9 1.3 1.0
Simplex Infra Neutral 282 - 1,393 6,829 7,954 10.5 10.5 31.4 37.4 9.0 7.5 0.9 0.9 9.9 13.4 0.6 0.5
Power Mech Projects Neutral 453 - 667 1,801 2,219 12.7 14.6 72.1 113.9 6.3 4.0 1.2 1.0 16.8 11.9 0.4 0.3
Sadbhav Engineering Accumulate 274 298 4,700 3,598 4,140 10.3 10.6 9.0 11.9 30.4 23.0 3.2 2.8 9.9 11.9 1.6 1.4
NBCC Neutral 223 - 13,398 7,428 9,549 7.9 8.6 8.2 11.0 27.2 20.3 1.4 1.1 28.2 28.7 1.5 1.1
MEP Infra Neutral 38 - 624 1,877 1,943 30.6 29.8 3.0 4.2 12.8 9.1 6.2 4.2 0.6 0.6 1.7 1.5
SIPL Neutral 90 - 3,158 1,036 1,252 65.5 66.2 (8.4) (5.6) 3.4 3.8 (22.8) (15.9) 11.3 9.4
www.angelbroking.com
December 16, 2016
Stock Watch

Company Name Reco CMP Target Mkt Cap Sales ( ₹cr ) OPM(%) EPS (₹) PER(x) P/BV(x) RoE(%) EV/Sales(x)
( ₹ ) Price ( ₹) ( ₹ cr ) FY17E FY18E FY17E FY18E FY17E FY18E FY17E FY18E FY17E FY18E FY17E FY18E FY17E FY18E
Construction
Engineers India Neutral 305 - 10,266 1,725 1,935 16.0 19.1 11.4 13.9 26.7 21.9 3.7 3.6 13.4 15.3 4.9 4.4
Financials
Axis Bank Buy 477 630 114,083 46,932 53,575 3.5 3.4 32.4 44.6 14.8 10.7 1.9 1.7 13.6 16.5 - -
Bank of Baroda Neutral 160 - 36,855 19,980 23,178 1.8 1.8 11.5 17.3 13.9 9.3 1.6 1.3 8.3 10.1 - -
Canara Bank Neutral 305 - 16,542 15,225 16,836 1.8 1.8 14.5 28.0 21.0 10.9 1.5 1.2 5.8 8.5 - -
Dewan Housing Finance Buy 244 350 7,625 2,225 2,688 2.9 2.9 29.7 34.6 8.2 7.0 1.3 1.1 16.1 16.8 - -
Equitas Holdings Buy 154 235 5,153 939 1,281 11.7 11.5 5.8 8.2 26.5 18.7 2.3 2.0 10.9 11.5 - -
Federal Bank Neutral 69 - 11,941 9,353 10,623 2.9 2.9 4.4 5.8 15.8 12.0 1.5 1.3 9.5 11.0 - -
HDFC Neutral 1,260 - 199,320 11,475 13,450 3.4 3.4 45.3 52.5 27.8 24.0 5.4 4.7 20.2 20.5 - -
HDFC Bank Accumulate 1,177 1,350 300,373 46,097 55,433 4.5 4.5 58.4 68.0 20.2 17.3 3.5 3.0 18.8 18.6 - -
ICICI Bank Buy 260 315 151,526 42,800 44,686 3.1 3.3 18.0 21.9 14.5 11.9 2.0 1.8 11.1 12.3 - -
Lakshmi Vilas Bank Buy 143 174 2,565 3,339 3,799 2.7 2.8 11.0 14.0 13.0 10.2 1.4 1.2 11.2 12.7 - -
LIC Housing Finance Accumulate 556 630 28,054 3,712 4,293 2.6 2.5 39.0 46.0 14.3 12.1 2.7 2.3 19.9 20.1 - -
Punjab Natl.Bank Neutral 126 - 26,866 23,532 23,595 2.3 2.4 6.8 12.6 18.6 10.0 2.9 2.0 3.3 6.5 - -
RBL Bank Neutral 356 - 13,154 1,783 2,309 2.6 2.6 12.7 16.4 28.0 21.7 3.1 2.7 12.8 13.3 - -
South Ind.Bank Neutral 21 - 2,866 6,435 7,578 2.5 2.5 2.7 3.1 7.9 6.8 1.0 0.9 10.1 11.2 - -
St Bk of India Neutral 265 - 205,714 88,650 98,335 2.6 2.6 13.5 18.8 19.6 14.1 1.9 1.6 7.0 8.5 - -
Union Bank Neutral 139 - 9,552 13,450 14,925 2.3 2.3 25.5 34.5 5.5 4.0 0.8 0.7 7.5 10.2 - -
Yes Bank Neutral 1,186 - 50,157 8,978 11,281 3.3 3.4 74.0 90.0 16.0 13.2 3.0 2.6 17.0 17.2 - -
FMCG
Asian Paints Neutral 906 - 86,884 17,128 18,978 16.8 16.4 19.1 20.7 47.4 43.8 16.5 15.6 34.8 35.5 5.0 4.5
Britannia Buy 2,920 3,626 35,041 9,594 11,011 14.6 14.9 80.3 94.0 36.4 31.1 15.0 11.6 41.2 - 3.5 3.0
Colgate Accumulate 910 995 24,740 4,605 5,149 23.4 23.4 23.8 26.9 38.2 33.8 21.2 16.5 64.8 66.8 5.3 4.7
Dabur India Accumulate 272 304 47,887 8,315 9,405 19.8 20.7 8.1 9.2 33.6 29.6 9.3 7.8 31.6 31.0 5.4 4.8
GlaxoSmith Con* Neutral 5,071 - 21,325 4,350 4,823 21.2 21.4 179.2 196.5 28.3 25.8 7.5 6.4 27.1 26.8 4.3 3.8
Godrej Consumer Neutral 1,455 - 49,557 10,235 11,428 18.4 18.6 41.1 44.2 35.4 32.9 7.9 6.6 24.9 24.8 4.9 4.3
HUL Neutral 817 - 176,865 35,252 38,495 17.8 17.8 20.7 22.4 39.6 36.5 37.8 32.4 95.6 88.9 4.9 4.4
ITC Buy 230 284 278,503 40,059 44,439 38.3 39.2 9.0 10.1 25.6 22.7 7.1 6.2 27.8 27.5 6.5 5.8
Marico Buy 253 300 32,605 6,430 7,349 18.8 19.5 6.4 7.7 39.5 32.8 11.9 10.0 33.2 32.5 4.9 4.2
Nestle* Neutral 6,167 - 59,455 10,073 11,807 20.7 21.5 124.8 154.2 49.4 40.0 20.3 18.2 34.8 36.7 5.7 4.9
Tata Global Neutral 124 - 7,854 8,675 9,088 9.8 9.8 7.4 8.2 16.8 15.2 1.9 1.8 7.9 8.1 0.8 0.8
www.angelbroking.com
December 16, 2016
Stock Watch

Company Name Reco CMP Target Mkt Cap Sales ( ₹cr ) OPM(%) EPS (₹) PER(x) P/BV(x) RoE(%) EV/Sales(x)
( ₹ ) Price ( ₹) ( ₹ cr ) FY17E FY18E FY17E FY18E FY17E FY18E FY17E FY18E FY17E FY18E FY17E FY18E FY17E FY18E
FMCG
Procter & Gamble Hygiene Accumulate 6,986 7,369 22,677 2,939 3,342 23.2 23.0 146.2 163.7 47.8 42.7 107.0 102.6 25.3 23.5 7.3 6.3
IT
HCL Tech^ Buy 832 1,000 117,370 49,242 57,168 20.5 20.5 55.7 64.1 14.9 13.0 3.0 2.3 20.3 17.9 2.2 1.8
Infosys Buy 993 1,249 228,144 68,350 77,326 27.0 27.0 62.5 69.4 15.9 14.3 3.4 3.1 21.3 21.6 2.8 2.4
TCS Buy 2,260 2,620 445,218 119,025 133,308 27.6 27.6 131.2 145.5 17.2 15.5 5.6 5.1 32.4 33.1 3.5 3.1
Tech Mahindra Buy 478 600 46,493 29,673 32,937 15.5 17.0 32.8 39.9 14.6 12.0 2.9 2.5 19.6 20.7 1.3 1.1
Wipro Buy 467 590 113,424 55,440 60,430 18.1 18.1 35.9 39.9 13.0 11.7 2.3 2.1 19.0 19.3 1.8 1.6
Media
D B Corp Neutral 354 - 6,503 2,297 2,590 27.4 28.2 21.0 23.4 16.8 15.1 3.9 3.4 23.7 23.1 2.6 2.3
HT Media Neutral 72 - 1,678 2,693 2,991 12.6 12.9 7.9 9.0 9.1 8.0 0.8 0.7 7.8 8.3 0.2 0.1
Jagran Prakashan Buy 164 225 5,368 2,355 2,635 28.0 28.0 10.8 12.5 15.2 13.1 3.3 2.9 21.7 21.7 2.3 2.0
Sun TV Network Neutral 497 - 19,572 2,850 3,265 70.1 71.0 26.2 30.4 19.0 16.3 4.9 4.3 24.3 25.6 6.5 5.5Hindustan Media Ventures Neutral 266 - 1,955 1,016 1,138 24.3 25.2 27.3 30.1 9.8 8.9 1.9 1.7 16.2 15.8 1.2 1.1
TV Today Network Buy 277 385 1,655 637 743 27.5 27.5 18.4 21.4 15.1 13.0 2.6 2.2 17.4 17.2 2.2 1.8
Metals & Mining
Coal India Neutral 290 - 180,170 84,638 94,297 21.4 22.3 24.5 27.1 11.9 10.7 4.9 4.7 42.6 46.0 1.6 1.5
Hind. Zinc Neutral 285 - 120,506 14,252 18,465 55.9 48.3 15.8 21.5 18.1 13.3 2.9 2.6 17.0 20.7 8.5 6.5
Hindalco Neutral 176 - 36,393 107,899 112,095 7.4 8.2 9.2 13.0 19.2 13.6 0.9 0.9 4.8 6.6 0.9 0.8
JSW Steel Neutral 1,632 - 39,447 53,201 58,779 16.1 16.2 130.6 153.7 12.5 10.6 1.7 1.5 14.0 14.4 1.5 1.3
NMDC Neutral 130 - 41,131 6,643 7,284 44.4 47.7 7.1 7.7 18.3 16.9 1.6 1.5 8.8 9.2 4.0 3.6
SAIL Neutral 53 - 21,889 47,528 53,738 (0.7) 2.1 (1.9) 2.6 20.4 0.6 0.6 (1.6) 3.9 1.3 1.2
Vedanta Neutral 236 - 69,996 71,744 81,944 19.2 21.7 13.4 20.1 17.6 11.8 1.5 1.4 8.4 11.3 1.4 1.1
Tata Steel Neutral 419 - 40,708 121,374 121,856 7.2 8.4 18.6 34.3 22.5 12.2 1.4 1.3 6.1 10.1 1.0 1.0
Oil & Gas
Cairn India Neutral 261 - 48,969 9,127 10,632 4.3 20.6 8.8 11.7 29.7 22.3 1.0 0.9 3.3 4.2 6.8 5.7
GAIL Neutral 417 - 52,908 56,220 65,198 9.3 10.1 27.1 33.3 15.4 12.5 1.4 1.3 9.3 10.7 1.1 1.0
ONGC Neutral 206 - 264,942 137,222 152,563 15.0 21.8 19.5 24.1 10.6 8.6 0.9 0.9 8.5 10.1 2.2 2.0
Indian Oil Corp Neutral 298 - 144,609 373,359 428,656 5.9 5.5 54.0 59.3 5.5 5.0 0.9 0.8 16.0 15.6 0.5 0.5
Reliance Industries Neutral 1,054 - 341,940 301,963 358,039 12.1 12.6 87.7 101.7 12.0 10.4 1.2 1.1 10.7 11.3 1.6 1.3
Pharmaceuticals
Alembic Pharma Neutral 618 - 11,644 3,483 4,083 20.2 21.4 24.3 30.4 25.4 20.3 5.8 4.6 25.5 25.3 3.3 2.7
Alkem Laboratories Ltd Buy 1,636 1,989 19,561 6,043 6,893 18.7 19.3 80.5 88.8 20.3 18.4 4.5 3.7 22.3 20.3 3.2 2.7
Aurobindo Pharma Buy 695 877 40,661 15,720 18,078 23.7 23.7 41.4 47.3 16.8 14.7 4.4 3.4 29.6 26.1 2.8 2.4
Aventis* Neutral 4,284 - 9,867 2,277 2,597 17.3 18.3 149.4 172.0 28.7 24.9 4.8 3.8 25.1 28.8 4.0 3.3
www.angelbroking.com
December 16, 2016
Stock Watch

Company Name Reco CMP Target Mkt Cap Sales ( ₹cr ) OPM(%) EPS (₹) PER(x) P/BV(x) RoE(%) EV/Sales(x)
( ₹ ) Price ( ₹) ( ₹ cr ) FY17E FY18E FY17E FY18E FY17E FY18E FY17E FY18E FY17E FY18E FY17E FY18E FY17E FY18E
Pharmaceuticals
Cadila Healthcare Neutral 381 - 39,046 10,429 12,318 22.6 22.0 16.9 19.2 22.6 19.9 5.7 4.6 28.5 25.7 3.7 3.1
Cipla Reduce 562 490 45,168 15,378 18,089 17.4 18.4 21.6 27.2 26.0 20.7 3.4 2.9 13.7 15.2 3.1 2.6
Dr Reddy's Neutral 3,115 - 51,605 16,043 18,119 20.8 22.4 112.4 142.9 27.7 21.8 3.7 3.2 14.1 15.9 3.2 2.8
Dishman Pharma Neutral 221 - 3,574 1,718 1,890 22.7 22.8 9.5 11.3 23.3 19.6 2.3 2.0 10.1 10.9 2.5 2.2
GSK Pharma* Neutral 2,726 - 23,090 3,000 3,312 15.4 20.6 46.5 60.8 58.6 44.8 14.1 14.0 26.3 30.6 7.4 6.8
Indoco Remedies Reduce 264 240 2,435 1,112 1,289 16.2 18.2 11.6 16.0 22.8 16.5 3.6 3.1 17.0 20.1 2.3 1.9
Ipca labs Accumulate 537 613 6,770 3,303 3,799 15.3 15.3 17.3 19.7 31.0 27.2 2.7 2.5 9.1 9.4 2.2 1.9
Lupin Buy 1,479 1,809 66,769 15,912 18,644 26.4 26.7 58.1 69.3 25.5 21.4 5.0 4.1 21.4 20.9 4.3 3.5
Sun Pharma Buy 649 847 155,817 31,129 35,258 32.0 32.9 30.2 35.3 21.5 18.4 3.5 2.9 20.0 20.1 4.6 3.8
Power
Tata Power Neutral 78 - 21,137 36,916 39,557 17.4 27.1 5.1 6.3 15.3 12.4 1.4 1.2 9.0 10.3 1.6 1.4
NTPC Neutral 160 - 132,175 86,605 95,545 17.5 20.8 11.8 13.4 13.6 12.0 1.4 1.3 10.5 11.1 2.9 2.9
Power Grid Buy 183 223 95,921 25,315 29,193 88.2 88.7 14.2 17.2 13.0 10.7 2.0 1.7 15.2 16.1 8.4 7.6
Real Estate
Prestige Estate Buy 168 210 6,294 4,707 5,105 25.2 26.0 10.3 13.0 16.3 12.9 1.3 1.2 10.3 10.2 2.5 2.2
MLIFE Buy 360 522 1,477 1,152 1,300 22.7 24.6 29.9 35.8 12.0 10.1 0.9 0.8 7.6 8.6 2.0 1.7
Telecom
Bharti Airtel Neutral 318 - 127,297 105,086 114,808 34.5 34.7 12.2 16.4 26.1 19.4 1.8 1.7 6.8 8.4 2.1 1.8
Idea Cellular Neutral 77 - 27,730 40,133 43,731 37.2 37.1 6.4 6.5 12.0 11.9 1.0 0.9 8.2 7.6 1.7 1.5
zOthers
Abbott India Neutral 4,680 - 9,945 3,153 3,583 14.1 14.4 152.2 182.7 30.8 25.6 151.0 128.9 25.6 26.1 2.9 2.5
Asian Granito Buy 212 351 638 1,071 1,182 12.1 12.4 12.7 16.0 16.7 13.3 1.6 1.4 9.5 10.7 0.9 0.8
Bajaj Electricals Buy 219 274 2,211 4,801 5,351 5.7 6.2 10.4 13.7 21.0 16.0 2.6 2.3 12.4 14.5 0.5 0.4
Banco Products (India) Neutral 191 - 1,366 1,353 1,471 12.3 12.4 14.5 16.3 13.2 11.7 18.2 16.4 14.5 14.6 0.9 101.7Coffee Day Enterprises Ltd Neutral 197 - 4,065 2,964 3,260 20.5 21.2 4.7 8.0 - 24.7 2.3 2.1 5.5 8.5 1.8 1.6
Competent Automobiles Neutral 166 - 102 1,137 1,256 3.1 2.7 28.0 23.6 5.9 7.0 31.9 28.8 14.3 11.5 0.1 0.1
Elecon Engineering Neutral 59 - 664 1,482 1,660 13.7 14.5 3.9 5.8 15.2 10.2 3.6 3.3 7.8 10.9 0.8 0.7
Finolex Cables Neutral 424 - 6,489 2,883 3,115 12.0 12.1 14.2 18.6 29.9 22.8 15.9 13.9 15.8 14.6 1.9 1.8
Garware Wall Ropes Neutral 625 - 1,367 873 938 14.3 14.3 35.2 37.5 17.8 16.7 3.1 2.7 17.5 15.9 1.5 1.4
Goodyear India* Neutral 711 - 1,640 1,598 1,704 10.4 10.2 49.4 52.6 14.4 13.5 66.4 58.3 18.2 17.0 0.7 98.7
Hitachi Neutral 1,450 - 3,943 2,081 2,433 8.8 8.9 33.4 39.9 43.4 36.3 35.0 29.2 22.1 21.4 1.9 1.6
HSIL Neutral 281 - 2,035 2,384 2,515 15.8 16.3 15.3 19.4 18.4 14.5 18.3 15.7 7.8 9.3 1.0 0.9
Interglobe Aviation Neutral 830 - 29,986 21,122 26,005 14.5 27.6 110.7 132.1 7.5 6.3 44.8 32.0 168.5 201.1 1.4 1.1
www.angelbroking.com
December 16, 2016
Stock Watch

Company Name Reco CMP Target Mkt Cap Sales ( ₹cr ) OPM(%) EPS (₹) PER(x) P/BV(x) RoE(%) EV/Sales(x)
( ₹ ) Price ( ₹) ( ₹ cr ) FY17E FY18E FY17E FY18E FY17E FY18E FY17E FY18E FY17E FY18E FY17E FY18E FY17E FY18E
zOthers
Jyothy Laboratories Neutral 357 - 6,475 1,440 2,052 11.5 13.0 8.5 10.0 42.0 35.7 10.2 9.4 18.6 19.3 4.8 3.3Kirloskar Engines India Ltd Neutral 325 - 4,701 2,554 2,800 9.9 10.0 10.5 12.1 31.0 26.9 13.0 12.2 10.7 11.7 1.5 1.3
Linc Pen & Plastics Neutral 234 - 346 382 420 9.3 9.5 13.5 15.7 17.4 14.9 3.0 2.6 17.1 17.3 1.0 0.9
M M Forgings Neutral 435 - 525 546 608 20.4 20.7 41.3 48.7 10.5 8.9 59.6 52.7 16.6 17.0 0.8 0.7
Manpasand Bever. Neutral 566 - 3,238 836 1,087 19.6 19.4 16.9 23.8 33.5 23.8 4.0 3.5 12.0 14.8 3.6 2.7
Mirza International Buy 82 107 985 987 1,106 18.0 18.0 6.5 7.6 12.5 10.8 2.0 1.7 15.9 15.7 1.2 1.1
MT Educare Neutral 122 - 486 366 417 17.7 18.2 9.4 10.8 13.0 11.3 2.9 2.5 22.2 22.3 1.2 1.1
Narayana Hrudaya Neutral 338 - 6,908 1,873 2,166 11.5 11.7 2.6 4.0 127.8 85.3 7.8 7.1 6.1 8.3 3.8 3.3
Navkar Corporation Buy 174 265 2,474 369 561 42.9 42.3 7.2 11.5 24.0 15.1 1.8 1.6 7.4 10.5 7.7 5.1
Navneet Education Neutral 109 - 2,587 1,062 1,147 24.0 24.0 6.1 6.6 17.8 16.4 3.7 3.2 20.6 19.8 2.5 2.3
Nilkamal Neutral 1,329 - 1,983 1,995 2,165 10.7 10.4 69.8 80.6 19.0 16.5 76.0 66.0 16.6 16.5 1.0 0.9
Page Industries Neutral 13,689 - 15,269 2,450 3,124 20.1 17.6 299.0 310.0 45.8 44.2 304.9 232.7 47.1 87.5 6.3 5.0
Parag Milk Foods Neutral 267 - 2,247 1,919 2,231 9.3 9.6 9.5 12.9 28.3 20.7 4.4 3.6 15.5 17.5 1.3 1.1
Quick Heal Neutral 276 - 1,932 408 495 27.3 27.0 7.7 8.8 35.6 31.4 3.3 3.3 9.3 10.6 3.9 3.2
Radico Khaitan Buy 116 147 1,541 1,667 1,824 13.0 13.2 6.7 8.2 17.4 14.2 1.6 1.4 9.0 10.2 1.3 1.2
Relaxo Footwears Neutral 399 - 4,793 2,085 2,469 9.2 8.2 7.6 8.0 52.8 50.2 20.5 17.5 17.9 18.8 2.4 2.0
S H Kelkar & Co. Neutral 290 - 4,198 1,036 1,160 15.1 15.0 6.1 7.2 47.5 40.4 5.1 4.7 10.7 11.5 3.9 3.5
Siyaram Silk Mills Accumulate 1,205 1,605 1,130 1,733 1,948 11.6 11.7 96.6 114.7 12.5 10.5 1.9 1.7 15.3 15.7 0.9 0.8
Styrolution ABS India* Neutral 583 - 1,025 1,440 1,537 9.2 9.0 40.6 42.6 14.4 13.7 36.7 33.3 12.3 11.6 0.7 0.6
Surya Roshni Neutral 179 - 785 3,342 3,625 7.8 7.5 17.3 19.8 10.4 9.1 19.7 15.8 10.5 10.8 0.5 0.4
Team Lease Serv. Neutral 890 - 1,522 3,229 4,001 1.5 1.8 22.8 32.8 39.1 27.1 4.2 3.6 10.7 13.4 0.4 0.3
The Byke Hospitality Neutral 167 - 669 287 384 20.5 20.5 7.6 10.7 22.0 15.6 4.6 3.7 20.7 23.5 2.4 1.7Transport Corporation of India Neutral 169 - 1,297 2,671 2,911 8.5 8.8 13.9 15.7 12.2 10.8 1.7 1.5 13.7 13.8 0.6 0.5
TVS Srichakra Neutral 3,222 - 2,467 2,304 2,614 13.7 13.8 231.1 266.6 13.9 12.1 362.1 285.1 33.9 29.3 1.1 0.9
UFO Moviez Neutral 418 - 1,153 619 685 33.2 33.4 30.0 34.9 13.9 12.0 1.9 1.7 13.8 13.9 1.6 1.2
Visaka Industries Neutral 186 - 295 1,051 1,138 10.3 10.4 21.0 23.1 8.8 8.0 23.8 22.3 9.0 9.2 0.5 0.5
VRL Logistics Neutral 266 - 2,426 1,902 2,119 16.7 16.6 14.6 16.8 18.3 15.8 4.0 3.5 21.9 22.2 1.4 1.2
Wonderla Holidays Neutral 349 - 1,969 287 355 38.0 40.0 11.3 14.2 30.8 24.5 4.4 3.9 21.4 23.9 6.5 5.3
Source: Company, Angel Research; Note: *December year end; #September year end; &October year end; Price as on December 15, 2016
www.angelbroking.com
December 16, 2016
Stock Watch

Research Team Tel: 022 - 39357800 E-mail: [email protected] Website: www.angelbroking.com
DISCLAIMER
Angel Broking Private Limited (hereinafter referred to as “Angel”) is a registered Member of National Stock Exchange of India Limited,Bombay Stock Exchange Limited and Metropolitan Stock Exchange Limited. It is also registered as a Depository Participant with CDSL and Portfolio Manager with SEBI. It also has registration with AMFI as a Mutual Fund Distributor. Angel Broking Private Limited is a registered entity with SEBI for Research Analyst in terms of SEBI (Research Analyst) Regulations, 2014 vide registration number INH000000164. Angel or its associates has not been debarred/ suspended by SEBI or any other regulatory authority for accessing /dealing in securities Market. Angel or its associates/analyst has not received any compensation / managed or co-managed public offering of securities of the company covered by Analyst during the past twelve months.
This document is solely for the personal information of the recipient, and must not be singularly used as the basis of any investmentdecision. Nothing in this document should be construed as investment or financial advice. Each recipient of this document should make such investigations as they deem necessary to arrive at an independent evaluation of an investment in the securities of the companies referred to in this document (including the merits and risks involved), and should consult their own advisors to determine the merits and risks of such an investment.
Reports based on technical and derivative analysis center on studying charts of a stock's price movement, outstanding positions andtrading volume, as opposed to focusing on a company's fundamentals and, as such, may not match with a report on a company'sfundamentals. Investors are advised to refer the Fundamental and Technical Research Reports available on our website to evaluate the contrary view, if any.
The information in this document has been printed on the basis of publicly available information, internal data and other reliablesources believed to be true, but we do not represent that it is accurate or complete and it should not be relied on as such, as thisdocument is for general guidance only. Angel Broking Pvt. Limited or any of its affiliates/ group companies shall not be in any wayresponsible for any loss or damage that may arise to any person from any inadvertent error in the information contained in this report.Angel Broking Pvt. Limited has not independently verified all the information contained within this document. Accordingly, we cannottestify, nor make any representation or warranty, express or implied, to the accuracy, contents or data contained within this document.While Angel Broking Pvt. Limited endeavors to update on a reasonable basis the information discussed in this material, there may beregulatory, compliance, or other reasons that prevent us from doing so.
This document is being supplied to you solely for your information, and its contents, information or data may not be reproduced,redistributed or passed on, directly or indirectly.
Neither Angel Broking Pvt. Limited, nor its directors, employees or affiliates shall be liable for any loss or damage that may arise fromor in connection with the use of this information.
www.angelbroking.com
Market OutlookDecember 16, 2016