market insights - immunities.co.il · global economy o the nine-year economic recovery continues as...
TRANSCRIPT

Market Insights
June 2018

Global Economy
o The nine-year economic recovery continues as global economy is expected to grow at 3.9% for 2018. The US economy
is the engine behind the robust growth as the rest of the world struggle to keep up
o The differences between monetary policies of the US and the rest of the world are getting sharper as the Fed continues
to tighten .This could further increase volatility in global financial markets
o Political turmoil from Turkey to Italy and Spain is adding to the burden investors face as they grapple with the end of
easy money conditions
o After trade war fears eased due to postponement of tariffs, Trump’s revival of a plan to slap tariffs on $50 billion of
Chinese imports has cast the talks between two country's into turmoil
o Higher borrowing costs in the US and USD appreciation expose weaknesses in emerging markets, as big chunk of their
debt is denominated in USD
o Oil retreated last month after Saudi Arabia and Russia said they are discussing reviving output

United Stateso US real GDP growth in Q1 was revised down to 2.2% from 2.3%. This deceleration in GDP growth was mainly due to
weak consumer spending and residential investment. However, it was a strong quarter for business, with
investment perhaps getting a boost from this year's corporate tax cut
o Inflation is stabilizing as the core PCE deflator, the fed preferred gauge of inflation, rose 0.2% in April and 1.8%
YOY. The Federal Open Market Committee minutes of its last meeting emphasized that a little overshooting is still
consistent with their policy, hence the fed in no hurry to accelerate the pace of rate hikes
o The labor market is strong as Nonfarm payroll rose 223K in May while the unemployment rate moves down to a
new expansion low of 3.8%. Average hourly earnings was up 0.3% and 2.7% YOY. It seems like available slack in the
labor force is disappearing and in turn raising the potential of wage inflation
o The Dollar Index has advanced more than 4 percent through April and May, on track for the best two-month run
since November 2016
o Dollar funding costs eased a little bit as rising demand for short-term debt has been fueled by inflation concerns
that promoted investors to ETF and money market funds

Core Economic IndicatorUSA
Economic Indicator Latest Figure Reference Period
Growth Rate 2.2% Q1-2018
Unemployment Rate 3.8% May-2018
Inflation Rate (Core PCE, YoY) 1.8% April-2018
FED Funds Target Range 1.5%-1.75% June-2018
10 Year Treasury Yield to Maturity 2.9% June-2018
Ratio of Current Account Balance to GDP -2.36% Q4-2017
Ratio of Public Debt to GDP 103.74% October-2017

Economic Growth GDP (Annualized)
1.4
-2.7
2
-1.9
-8.2
-5.4
-0.5
1.3
3.9
1.7
3.9
2.7 2.5
-1.5
2.9
0.8
4.6
2.7
1.9
0.50.1
2.8
0.8
3.1
4
-0.9
4.6
5.2
2
3.22.7
1.6
0.5 0.6
2.2
2.8
1.8
1.2
3.1 3.22.9
2.2
-9.0
-8.0
-7.0
-6.0
-5.0
-4.0
-3.0
-2.0
-1.0
0.0
1.0
2.0
3.0
4.0
5.0
2007 2008 2009 2010 2011 2012 2013 2014 2015 2016 2017

Economic SentimentManufacturing and Non-Manufacturing PMI
30
35
40
45
50
55
60
65
2007 2008 2009 2010 2011 2012 2013 2014 2015 2016 2017
Manufacturing Non- Manufacturing

Labor MarketUnemployment Rate (Left) and Under Unemployment Rate (Right)
6
8
10
12
14
16
18
3.5
4.5
5.5
6.5
7.5
8.5
9.5
10.5
12-07 06-08 12-08 06-09 12-09 06-10 12-10 06-11 12-11 06-12 12-12 06-13 12-13 06-14 12-14 06-15 12-15 06-16 12-16 06-17 12-17
Unemployment U6- Unemployment

InflationCore PCE (YoY) and 5Y Inflation Forecast
-1.0
-0.5
0.0
0.5
1.0
1.5
2.0
2.5
3.0
12-07 06-08 12-08 06-09 12-09 06-10 12-10 06-11 12-11 06-12 12-12 06-13 12-13 06-14 12-14 06-15 12-15 06-16 12-16 06-17 12-17
US Breakeven 5 Year Inflation Core PCE Rate (YoY) Inflation Target
Fed Inflation Target
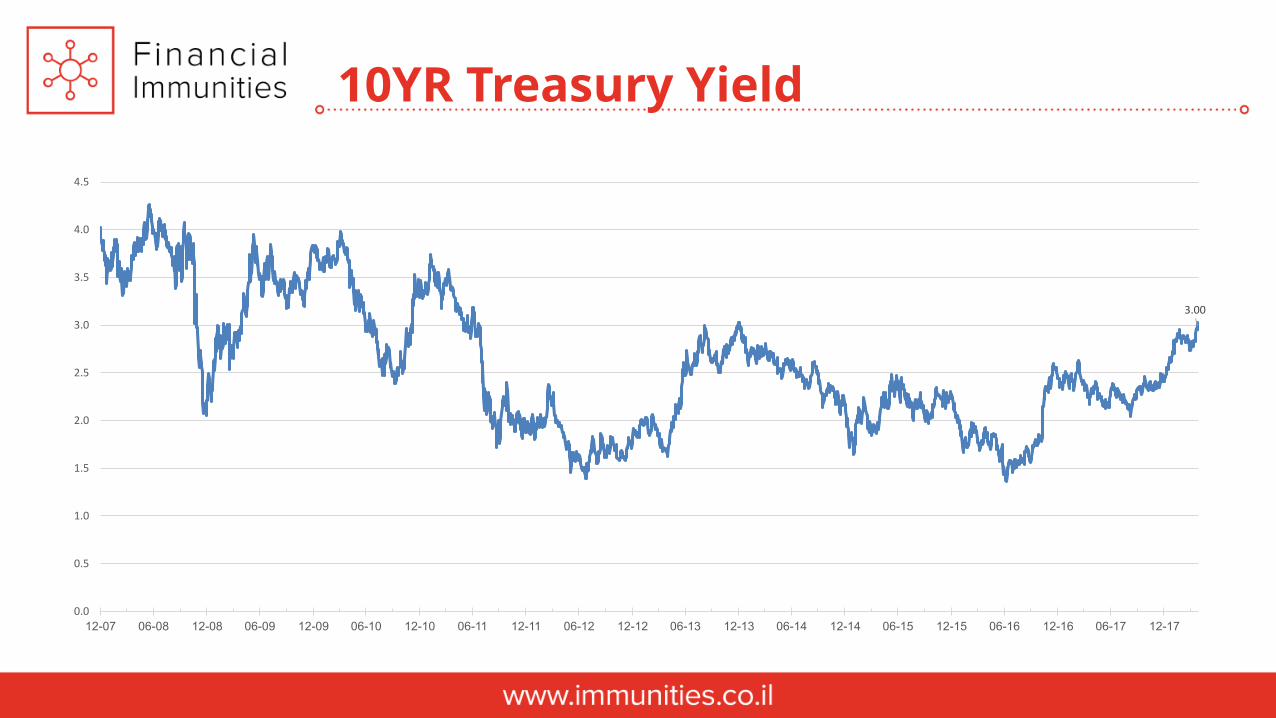
10YR Treasury Yield
3.00
0.0
0.5
1.0
1.5
2.0
2.5
3.0
3.5
4.0
4.5
12-07 06-08 12-08 06-09 12-09 06-10 12-10 06-11 12-11 06-12 12-12 06-13 12-13 06-14 12-14 06-15 12-15 06-16 12-16 06-17 12-17

US Treasury Yield Curve
0
0.5
1
1.5
2
2.5
3
0Y 2Y 4Y 6Y 8Y 10YCurrent 3-Months Ago 6-Months Ago

Fed Funds Projection
1.00%
1.50%
2.00%
2.50%
3.00%
3.50%
2018 2019 2020
FOMC Dots Median OIS - Latest Value

Probability of a 4th FED Funds Hike in 2018
0.00%
5.00%
10.00%
15.00%
20.00%
25.00%
30.00%
35.00%
40.00%
45.00%
5/31/20185/15/20184/27/20184/11/20183/26/20183/8/20182/20/20182/2/20181/17/20181/1/201812/14/2017

US Dollar Index (DXY)
75.0
80.0
85.0
90.0
95.0
100.0
105.0
12-12 06-13 12-13 06-14 12-14 06-15 12-15 06-16 12-16 06-17 12-17

Citi Economic Surprise
-100
-80
-60
-40
-20
0
20
40
60
80
100
12-12 03-13 06-13 09-13 12-13 03-14 06-14 09-14 12-14 03-15 06-15 09-15 12-15 03-16 06-16 09-16 12-16 03-17 06-17 09-17 12-17 03-18

o Economic growth in Europe lost further momentum in the past month. Hopes that the first quarter cooling in GDP
would prove short-lived are looking increasingly optimistic
o The Eurozone labor market continues to tighten as unemployment rate fell to 8.5%. Although, there are Signs of
some pick-up in wage growth further advances will probably be needed for wages growth to pick up significantly
o Euro-area inflation hit the fastest pace in more than a year at 1.9% YOY. The reading was 0.7% above April reading
and much stronger than expected. The core measure rose to 1.1%, also better than anticipated
o Political uncertainty in Italy and Spain revives memories of the debt crisis and sent financial markets into turmoil.
The change at the top of the euro region’s third and fourth-biggest economies calmed the markets, although the
new government in Italy threatens to further challenge the EU on budget rules and immigration
o The central bank is likely to remain quite cautious in its updated economic forecasts at the next policy meeting
scheduled June 14. The inflation report may increase the chances of ending the asset purchase program in
September but it certainly does not guarantee it
Eurozone

Core Economic IndicatorEurozone
Economic Indicator Latest Figure Reference Period
Growth Rate (YoY) 1.6% Q1-2018
Unemployment Rate 8.5% April-2018
Inflation Rate (Core, YoY) 1.1% May-2018
Central Bank deposit rate 0.00% April-2018
10 Year Government Bond Yield (Germany) 0.38% June-2018
Ratio of Surplus in Current Account to GDP 3.51% Q4-2017
Ratio of Public Debt to GDP 86.7% Q4-2017
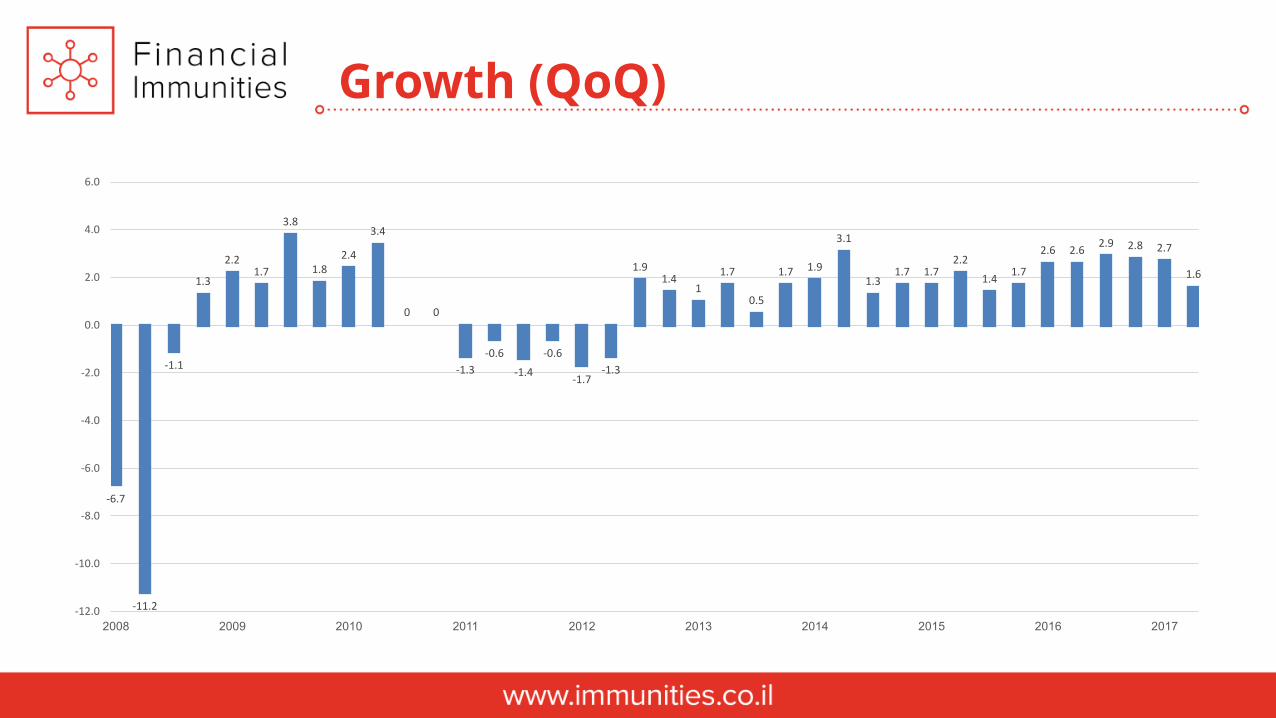
Growth (QoQ)
-6.7
-11.2
-1.1
1.3
2.21.7
3.8
1.82.4
3.4
0 0
-1.3
-0.6
-1.4
-0.6
-1.7-1.3
1.91.4
1
1.7
0.5
1.7 1.9
3.1
1.31.7 1.7
2.2
1.41.7
2.6 2.62.9 2.8 2.7
1.6
-12.0
-10.0
-8.0
-6.0
-4.0
-2.0
0.0
2.0
4.0
6.0
2008 2009 2010 2011 2012 2013 2014 2015 2016 2017

Economic SentimentManufacturing and Non-Manufacturing PMI
48.0
50.0
52.0
54.0
56.0
58.0
60.0
62.0
08-15 11-15 02-16 05-16 08-16 11-16 02-17 05-17 08-17 11-17 02-18 05-18
Manufacturing Non-Manufacturing

Labor MarketUnemployment Rate
6.0
6.5
7.0
7.5
8.0
8.5
9.0
9.5
10.0
10.5
11.0
11.5
12.0
12.5
12-07 06-08 12-08 06-09 12-09 06-10 12-10 06-11 12-11 06-12 12-12 06-13 12-13 06-14 12-14 06-15 12-15 06-16 12-16 06-17 12-17
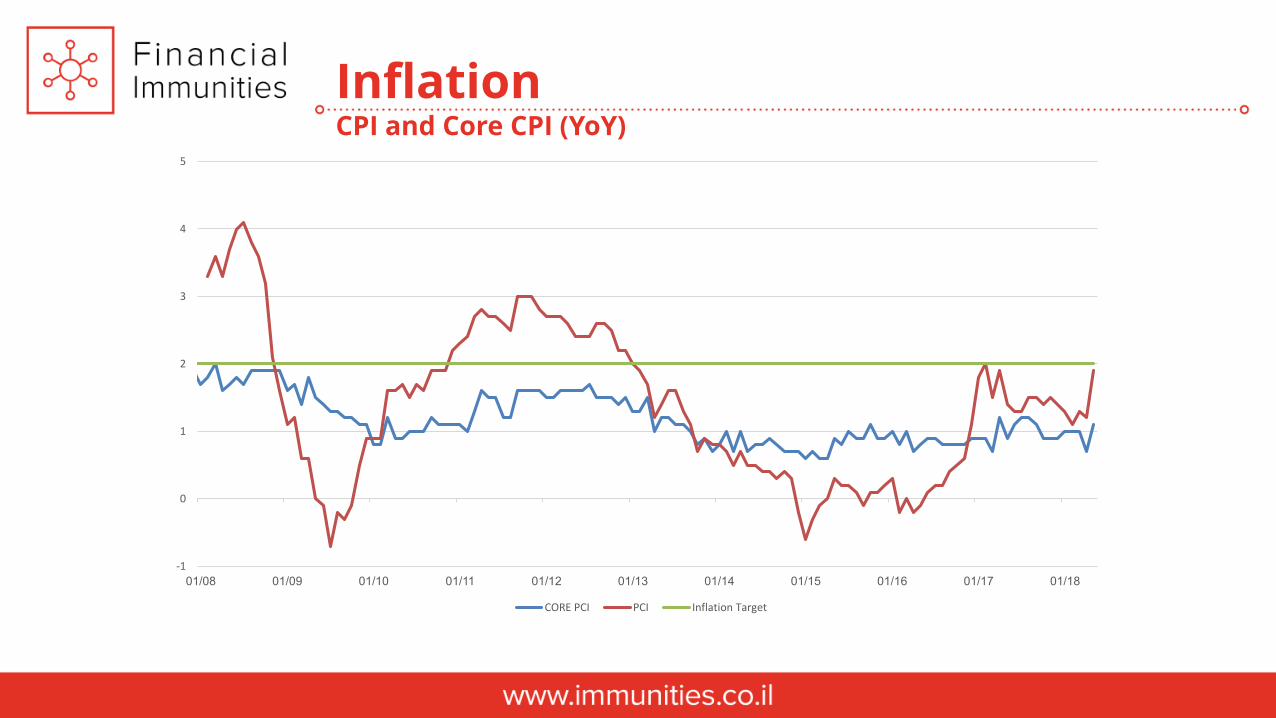
InflationCPI and Core CPI (YoY)
-1
0
1
2
3
4
5
01/08 01/09 01/10 01/11 01/12 01/13 01/14 01/15 01/16 01/17 01/18
CORE PCI PCI Inflation Target
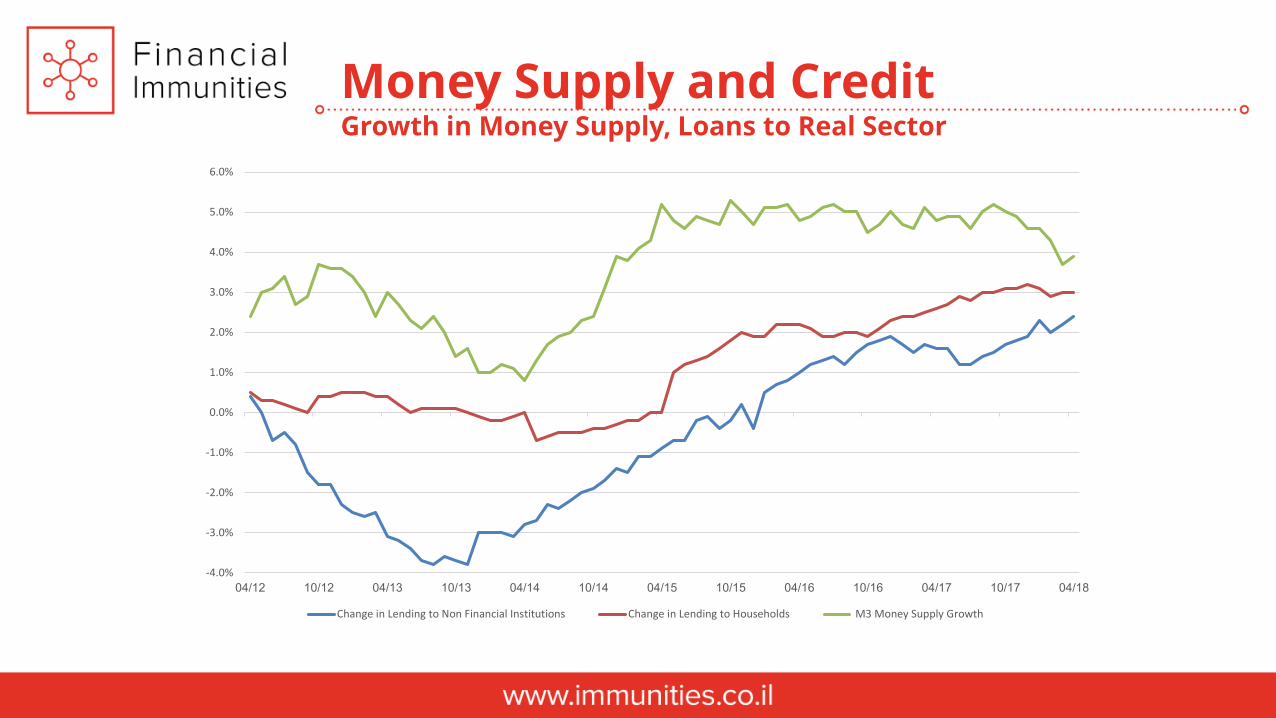
Money Supply and CreditGrowth in Money Supply, Loans to Real Sector
-4.0%
-3.0%
-2.0%
-1.0%
0.0%
1.0%
2.0%
3.0%
4.0%
5.0%
6.0%
04/12 10/12 04/13 10/13 04/14 10/14 04/15 10/15 04/16 10/16 04/17 10/17 04/18
Change in Lending to Non Financial Institutions Change in Lending to Households M3 Money Supply Growth

10YR Government Bond Yield
-0.5
0.5
1.5
2.5
3.5
4.5
12-13 03-14 06-14 09-14 12-14 03-15 06-15 09-15 12-15 03-16 06-16 09-16 12-16 03-17 06-17 09-17 12-17 03-18
Germany Italy France Spain

Exchange RateEuro Index (Right) EURUSD (Left)
1
1.05
1.1
1.15
1.2
1.25
1.3
1.35
1.4
1.45
75
80
85
90
95
100
31/12/2012 30/06/2013 31/12/2013 30/06/2014 31/12/2014 30/06/2015 31/12/2015 30/06/2016 31/12/2016 30/06/2017 31/12/2017
Euro Index EURUSD

Citi Economic Surprise
-150
-100
-50
0
50
100
12-12 03-13 06-13 09-13 12-13 03-14 06-14 09-14 12-14 03-15 06-15 09-15 12-15 03-16 06-16 09-16 12-16 03-17 06-17 09-17 12-17 03-18

o The economy continues to grow at a rate slightly higher than 4%
o The unemployment rate is at 3.9%, reflecting a slight increase for the first time since last September
o The inflation rate continues to rise, supported by increasing commodity prices and wages, but it is still
below the target
o The Monetary Committee decided to leave the interest rate unchanged at 0.1% and it is expected to
remain unchanged at least until the beginning of 2019
o The stagnation in housing market continues as house prices fell by 2.7% on the last 6 months
o During the last month, interest rate differential between the USD and ILS continued to widen to 2.7%
(close to 1,000 pips)
o The divergence between local and US monetary policy is expected to deepen. This will further
extend the interest rates differential and make ILS financial assets less attractive
Israel

Core Economic IndicatorIsrael
Economic Indicator Latest Figure Reference Period
Growth Rate 4.2% Q1-2018
Unemployment Rate 3.9% April-2018
Inflation Rate (YoY) 0.4% April-2018
Central Bank Interest Rate 0.1% June-2018
10 Year Government Bond Yield 1.84% June-2018
Ratio of Surplus in Current Account to GDP 2.94% Q4-2017
Ratio of Public Debt to GDP 59.5% Q4-2017

Economic Growth (Annualized)
5.3
2.9
10.8
-2.4
0.3
3.6
55.4
66.3
3.7
5.9
6.4
5.1
6.6
1.7
00.2
4.13.9
4.3
6.8
3.7
2.3
3.73.3
1.8
6.2
2.2
0.2
1.5
4.24.5
5.5
4.1
4.6
0.8
2.9
4.3 4.44.2
-4.0
-2.0
0.0
2.0
4.0
6.0
8.0
12-07 06-08 12-08 06-09 12-09 06-10 12-10 06-11 12-11 06-12 12-12 06-13 12-13 06-14 12-14 06-15 12-15 06-16 12-16 06-17 12-17
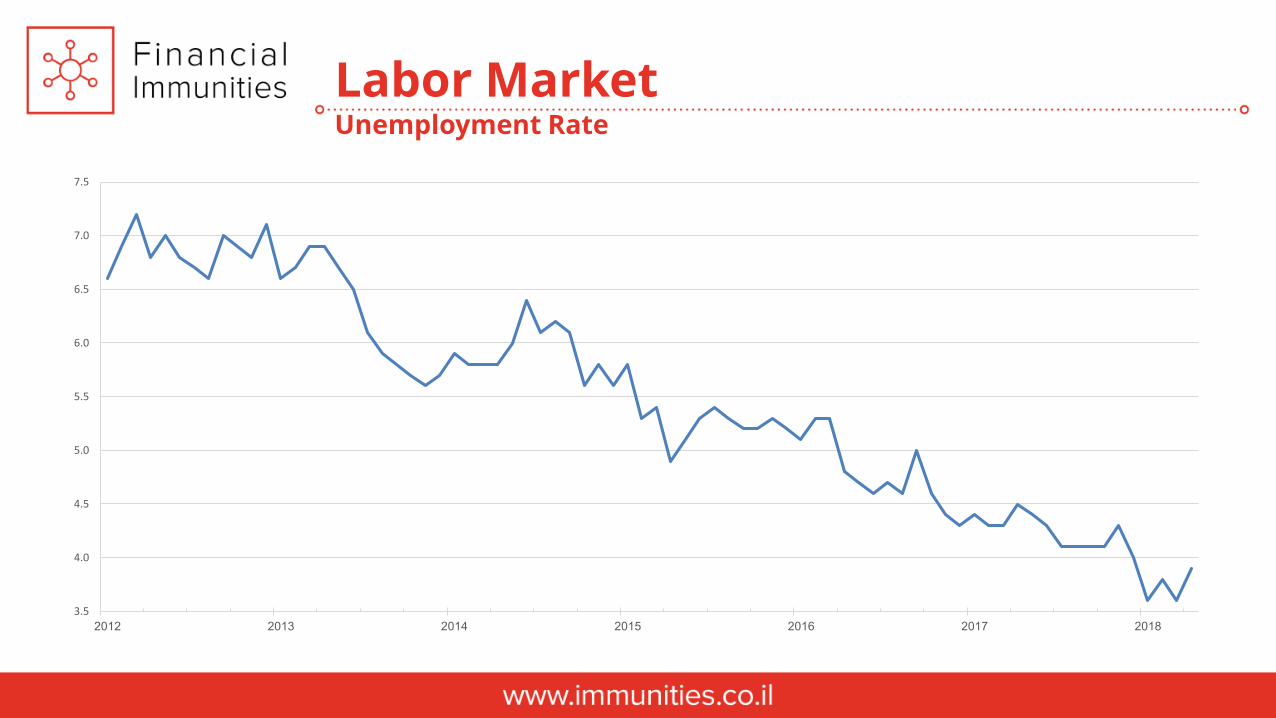
Labor MarketUnemployment Rate
3.5
4.0
4.5
5.0
5.5
6.0
6.5
7.0
7.5
2012 2013 2014 2015 2016 2017 2018

InflationCPI (YoY)
0.4
-2.0
-1.0
0.0
1.0
2.0
3.0
4.0
5.0
6.0
2007 2008 2009 2010 2011 2012 2013 2014 2015 2016 2017
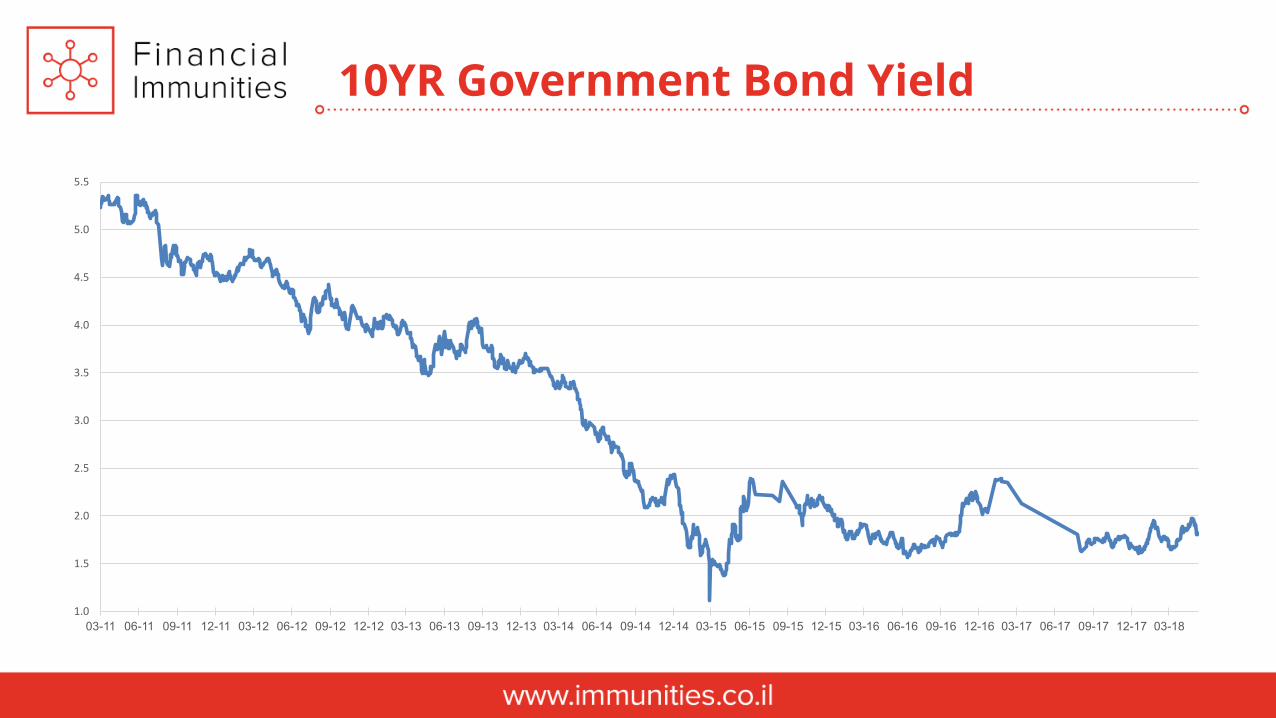
10YR Government Bond Yield
1.0
1.5
2.0
2.5
3.0
3.5
4.0
4.5
5.0
5.5
03-11 06-11 09-11 12-11 03-12 06-12 09-12 12-12 03-13 06-13 09-13 12-13 03-14 06-14 09-14 12-14 03-15 06-15 09-15 12-15 03-16 06-16 09-16 12-16 03-17 06-17 09-17 12-17 03-18

Government Bond Yield Curve
0
0.5
1
1.5
2
2.5
0Y 1Y 2Y 3Y 4Y 5Y 6Y 7Y 8Y 9Y 10Y
Current 3-Months Ago 6-Months Ago

Hedging CostsUSDILS 1YR Forward Premium
-3.00%
-2.00%
-1.00%
0.00%
1.00%
2.00%
3.00%

Exchange RateUSDILS (Left) BOI Nominal Effective Rate (Right)
75
80
85
90
95
100
105
01-13 07-13 01-14 07-14 01-15 07-15 01-16 07-16 01-17 07-17 01-18
3
3.2
3.4
3.6
3.8
4
4.2
USDILS BoI Nominal Effective Exchange Rate
