desynchronising global economy
TRANSCRIPT
7/31/2019 Desynchronising Global Economy
http://slidepdf.com/reader/full/desynchronising-global-economy 1/40
2012 Global Outlook:
De-synchronizing the Global Economy
December 2011
Neal M. Soss, Managing Director
Chief Economist
212-325-3335
ANALYST CERTIFICATIONS AND IMPORTANT DISCLOSURES ARE IN THE DISCLOSURE APPENDIX. FOR OTHER IMPORTANT
DISCLOSURES, PLEASE REFER TO https://firesearchdisclosure.credit-suisse.com.
7/31/2019 Desynchronising Global Economy
http://slidepdf.com/reader/full/desynchronising-global-economy 2/40
2
7/31/2019 Desynchronising Global Economy
http://slidepdf.com/reader/full/desynchronising-global-economy 3/40
3
Chasm: Monetary Policy versus Credit Stress
Monetary policy responseThe financial system is in a fragile state. Some institution, market, or
instrument seems always at the edge of breaking down – or just over that
edge. Very low interest rates throughout the developed world pose a
significant challenge to the profitability of traditional financial business models
by reducing the rewards of maturity transformation. New regulatory initiatives,
including especially higher capital-to-asset ratio requirements on ever more
strictly construed asset classifications, inhibit the volume and profitability of credit transformation. (No surprise there – that’s what deleveraging the
developed economies is all about.)
7/31/2019 Desynchronising Global Economy
http://slidepdf.com/reader/full/desynchronising-global-economy 4/40
4
Ultra-low interest rates tend to be more persistent than ultra-high ones.
This partly reflects the asymmetry in the efficiency of monetary policy in
stimulating versus restraining economic activity. It also partly reflects the
arithmetic of fiscal sustainability: low interest rates suppress the debt service
cost entry for debtor governments, while high interest rates contribute to
explosive debt-to-GDP dynamics. Finally, the exit from ultra-low interest ratesis higher interest rates – that is, a bear market in bonds. Bear markets tend to
expose and magnify financial fragilities; therefore, human nature tends to
incline the monetary authorities to a more cautious pace of raising interest
rates.
While ultra-low interest rates are still performing their corrosive role on
the profitability of the financial sector business model, the sector is also
trying to accommodate an emergent regulatory environment.
7/31/2019 Desynchronising Global Economy
http://slidepdf.com/reader/full/desynchronising-global-economy 5/40
5
One dimension of that regime is clear enough in outline. Banks and other
financial intermediaries will be required to hold more capital per unit of assets
– that is, to deleverage. There are two ways to raise a capital-asset ratio: add
capital or subtract assets. Raising capital has the potentially undesirable
feature of diluting existing shareholders. So banks will seek to accomplish at
least some of their deleveraging by shedding assets. But when all (or a large
subset of all) financial intermediaries are seeking to disgorge assets, market
prices will tend to weaken, bid-ask spreads to widen, liquidity to evaporate,
perceived counter-party risk to rise, term funding to run for the hills – in sum,
the syndrome that has manifested repeatedly since the summer of 2007.
When this syndrome of financial fragility is present, the only balance
sheet adequate to absorb the orphaned assets is the central bank’s –
hence QE.
7/31/2019 Desynchronising Global Economy
http://slidepdf.com/reader/full/desynchronising-global-economy 6/40
6
The Bank of Japan has been at this longest and has gone furthest – to the
point of buying ETFs on its own stock market. The Bank of England and the
US Fed have undertaken significant QE, arguably with more of a focus on aportfolio balance effect to encourage holding of riskier assets. The ECB has so
far dipped its toe tentatively into these waters, but we expect considerable
expansion of its efforts, at least selectively, toward Europe’s troubled
sovereigns.
The bottom line is that QE is probably a necessary component of
managing the ongoing restructuring of the global financial system.
That’s the First World central bank response. For the rest of the world, more
conventional monetary policy responses are still available (because policy
rates are still well above zero). Central banks in Australia and Brazil havealready begun to cut rates to counter the risks to global economic growth and
financial stability. We expect more of the same from them and expect others,
such as India and Thailand, to join the easing policy posture soon enough.
7/31/2019 Desynchronising Global Economy
http://slidepdf.com/reader/full/desynchronising-global-economy 7/40
7/31/2019 Desynchronising Global Economy
http://slidepdf.com/reader/full/desynchronising-global-economy 8/40
8
At the same time, the ECB under President Draghi has proved to be more
active than expected, already cutting rates by 50 bps to 1.00%. We expect
more. In our view, this greater activism may augur well for more forcefulinterventions from the ECB in government bond markets. The ECB must be
viewed as being in an asymmetrical posture whereby the cash rate for euros
could come down but cannot be expected to rise while the public finances of
much of the Continent are in tatters and the growth outlook ranges fromanemic to something worse.
The familiar workings of the Capital Asset Pricing Model imply that the
variance (or volatility) of capital asset prices includes the expected variance of the rate of interest on cash over the expected holding period of the asset plus
twice the covariance of that cash rate with the remaining market risks.
When the central bank effectively puts the variance and the covariance
to zero, the volatility of all capital asset prices should be suppressed,putting a bullish underpinning to risk asset markets of all kinds –
whether longer-dated bonds or credit instruments or equities. That's the
monetary conditions contribution.
7/31/2019 Desynchronising Global Economy
http://slidepdf.com/reader/full/desynchronising-global-economy 9/40
9
Credit conditions are different. The quarter-century from 1982 to 2007
featured ever-easier access to credit, whether for US homeowners or Greek
citizens. That credit boom allowed for more consumption-smoothing than
would otherwise have occurred, suppressing the volatility of real economic
performance in what came to be called the Great Moderation. It is patently
clear that the terms and standards of access to credit are no longer in a
secular easing – just ask American homeowners or Greek public-sector
workers or, if reports are to be believed, certain euro zone banks seeking term
funding. Credit underwriting standards now fluctuate around a tighter meanthan prevailed in 2007, with little sense that Basel 3 and other regulatory
innovations will allow for, let alone encourage, renewed secular easing.
7/31/2019 Desynchronising Global Economy
http://slidepdf.com/reader/full/desynchronising-global-economy 10/40
10
That implies less consumption-smoothing by households or investment-
smoothing by businesses or even counter-cyclical fiscal operations by (many)
governments than was possible during the Great Moderation. And that, in turn,
implies a more volatile fundamental economic backdrop for risk assets. That
volatility has perhaps already begun to manifest itself in the inadequate
recovery from the last recession experienced by nearly all First World
countries and by the repeated pattern of alternating speed-up and slowdown
scares in the last few years. This is a force for increasing the volatility –
and correlation – of capital asset prices, whether manifested in yield curveshapes, credit spreads, or equities prices. In the context of an efficient-frontier
tradeoff between risk and return, this should be a force suppressing risk asset
prices.

7/31/2019 Desynchronising Global Economy
http://slidepdf.com/reader/full/desynchronising-global-economy 11/40
11
Meanwhile, the low level of interest rates anchoring the North Atlantic region
has episodically pushed more capital flows to emerging equity and bond
markets. Juxtaposing with the rising capital flow is the increased volatility. We
observed heavier outflow from the emerging markets this year at times when
risk aversion was driven by slowdown scares in the emerging economy or
fears of European debt contagion. The more volatile capital flows pose a
significant threat to both financial market and economic stability of the
emerging markets.
2012 is likely to be buffeted by these two conflicting forces, just as 2011
has been. The most likely outcome, in our view, is that the monetary
conditions force will predominate most of the time, with occasional
volatility outbursts as the underlying fundamental/credit conditions force
becomes visible. Longer-term averages for volatility should be forced
down by the monetary conditions force, while episodic surges in
volatility should be expected while the credit conditions force is still
evolving toward its new equilibrium.
7/31/2019 Desynchronising Global Economy
http://slidepdf.com/reader/full/desynchronising-global-economy 12/40
12
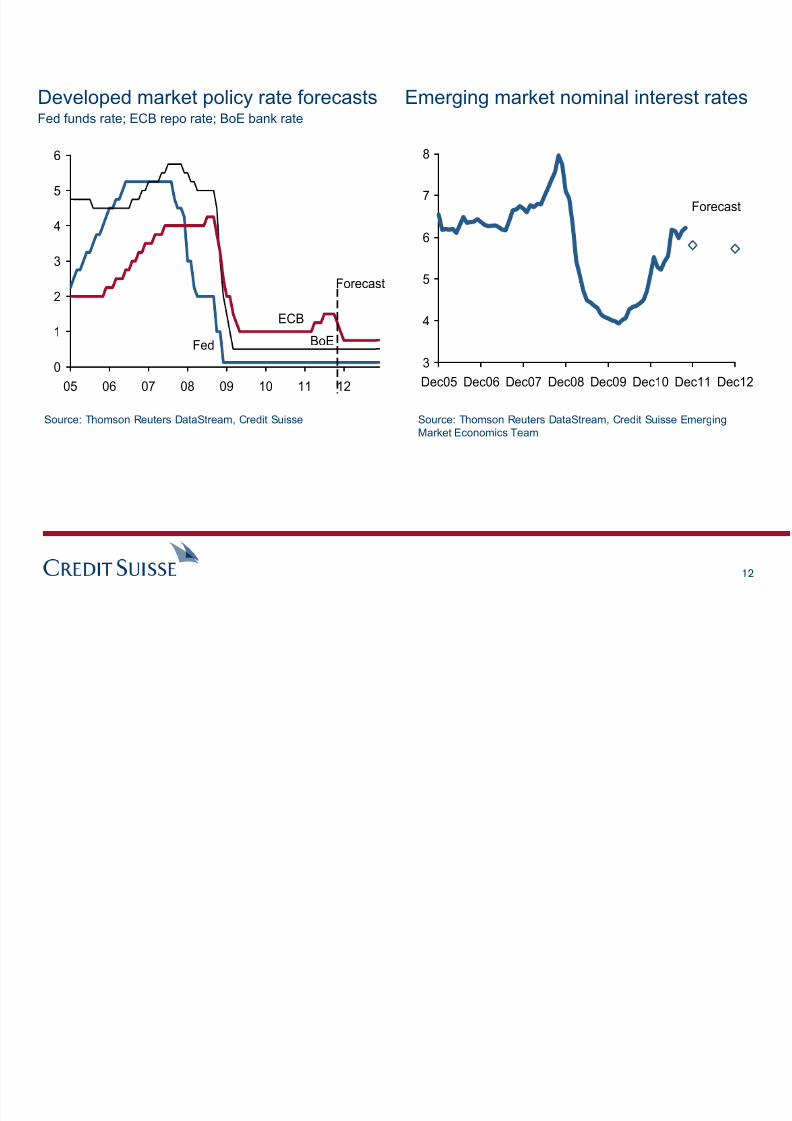
Developed market policy rate forecastsFed funds rate; ECB repo rate; BoE bank rate
Emerging market nominal interest rates
0
1
2
3
4
5
6
05 06 07 08 09 10 11 12
Forecast
ECBBoEFed
3
4
5
6
7
8
Dec05 Dec06 Dec07 Dec08 Dec09 Dec10 Dec11 Dec12
Forecast
Source: Thomson Reuters DataStream, Credit Suisse Source: Thomson Reuters DataStream, Credit Suisse Emerging
Market Economics Team
7/31/2019 Desynchronising Global Economy
http://slidepdf.com/reader/full/desynchronising-global-economy 13/40
13
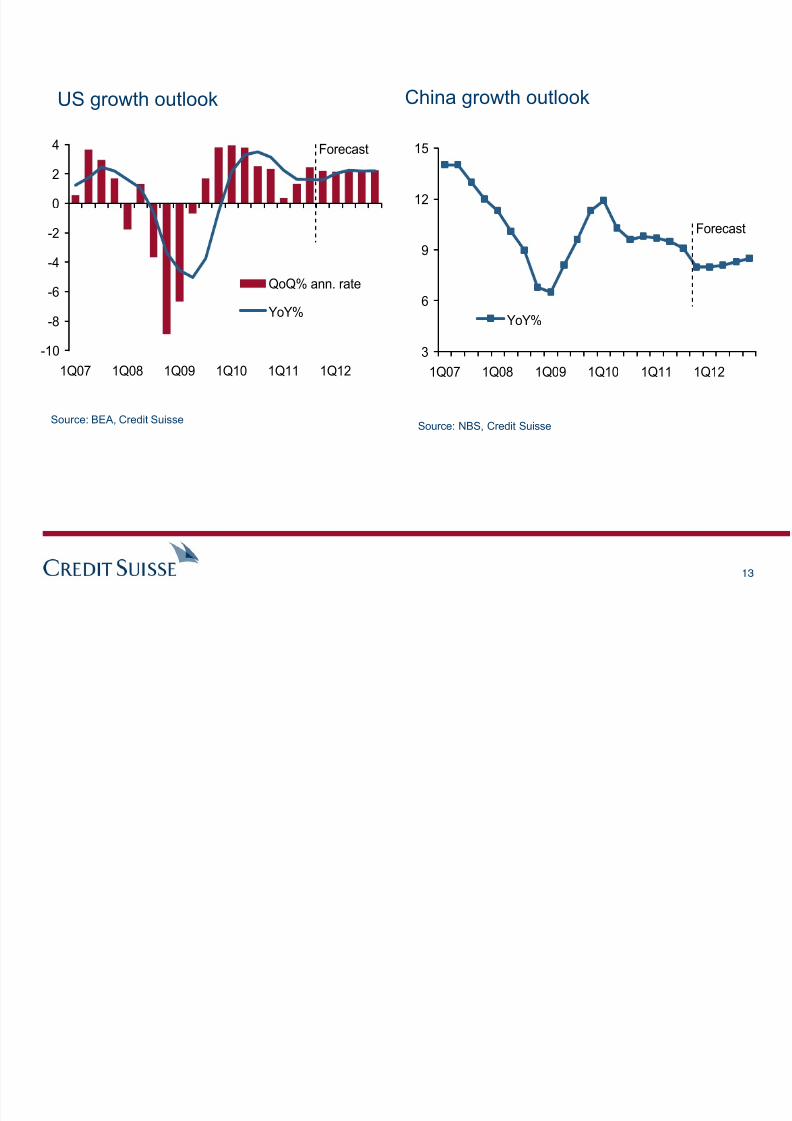
US growth outlookChina growth outlook
Source: BEA, Credit Suisse
Source: NBS, Credit Suisse
-10
-8
-6
-4
-2
0
2
4
1Q07 1Q08 1Q09 1Q10 1Q11 1Q12
QoQ% ann. rate
YoY%
Forecast
3
6
9
12
15
1Q07 1Q08 1Q09 1Q10 1Q11 1Q12
YoY%
Forecast

7/31/2019 Desynchronising Global Economy
http://slidepdf.com/reader/full/desynchronising-global-economy 14/40
14
Euro area growth outlookUK growth outlook
Source: Thomson Reuters DataStream, Credit Suisse Source: Thomson Reuters DataStream, Credit Suisse
-12
-10
-8
-6
-4
-2
0
2
4
1Q07 1Q08 1Q09 1Q10 1Q11 1Q12
QoQ% ann. rate
YoY%
Forecast
-10
-8
-6
-4
-2
0
2
4
6
1Q07 1Q08 1Q09 1Q10 1Q11 1Q12
QoQ% ann. rate
YoY%
Forecast
7/31/2019 Desynchronising Global Economy
http://slidepdf.com/reader/full/desynchronising-global-economy 15/40
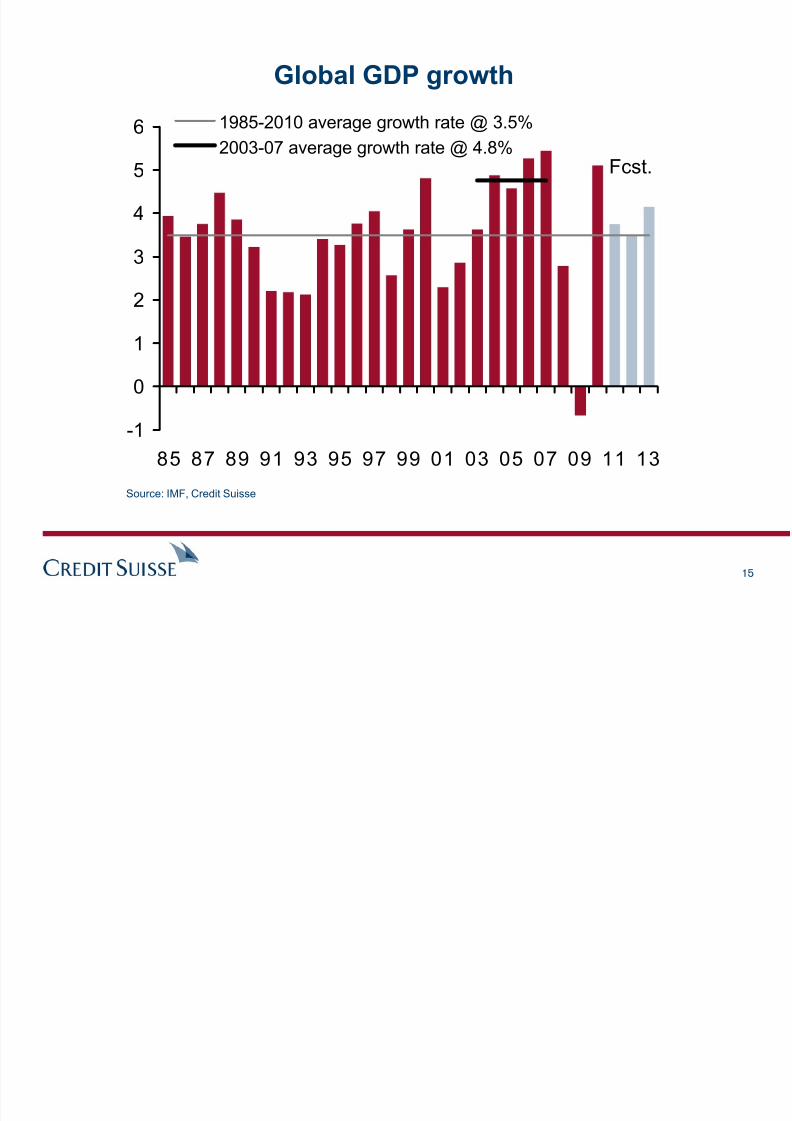
15
-1
0
1
2
3
4
5
6
85 87 89 91 93 95 97 99 01 03 05 07 09 11 13
1985-2010 average growth rate @ 3.5%
2003-07 average growth rate @ 4.8%Fcst.
Global GDP growth
Source: IMF, Credit Suisse
7/31/2019 Desynchronising Global Economy
http://slidepdf.com/reader/full/desynchronising-global-economy 16/40
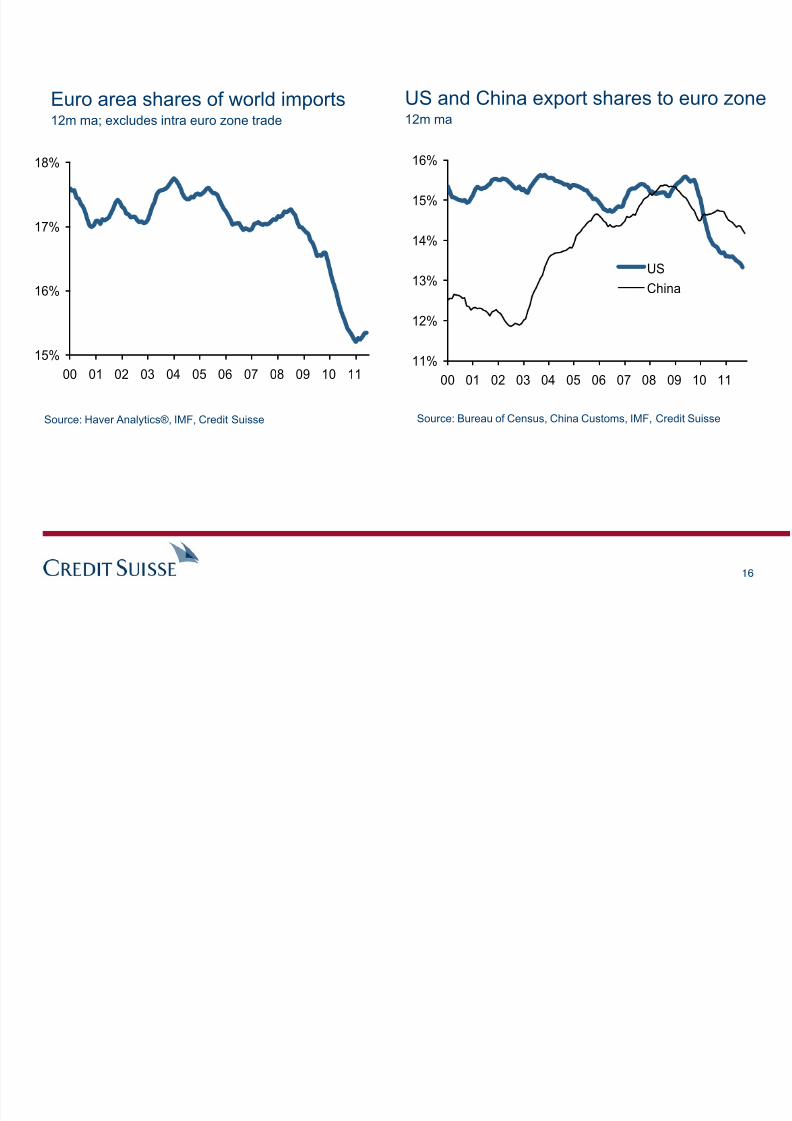
16
Euro area shares of world imports12m ma; excludes intra euro zone trade
Source: Haver Analytics®, IMF, Credit Suisse Source: Bureau of Census, China Customs, IMF, Credit Suisse
US and China export shares to euro zone12m ma
15%
16%
17%
18%
00 01 02 03 04 05 06 07 08 09 10 1111%
12%
13%
14%
15%
16%
00 01 02 03 04 05 06 07 08 09 10 11
US
China
7/31/2019 Desynchronising Global Economy
http://slidepdf.com/reader/full/desynchronising-global-economy 17/40
17
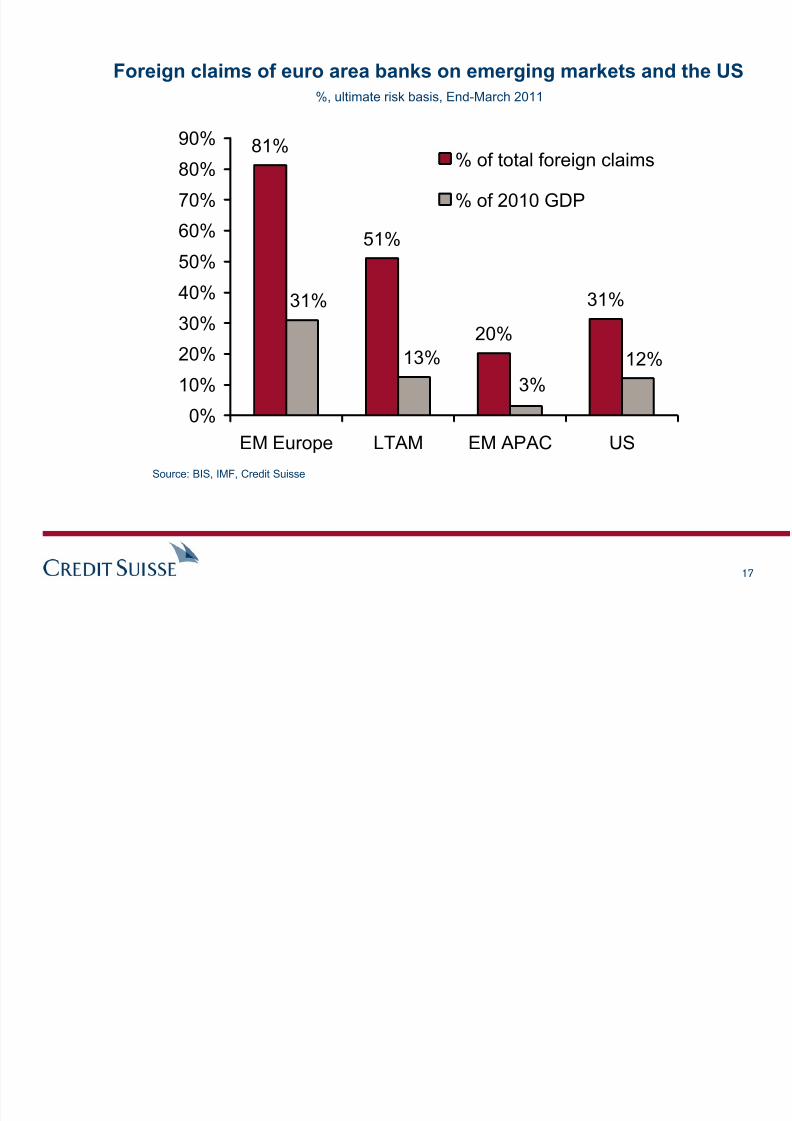
Foreign claims of euro area banks on emerging markets and the US
%, ultimate risk basis, End-March 2011
Source: BIS, IMF, Credit Suisse
81%
51%
20%
31%
12%
3%
13%
31%
0%
10%
20%
30%
40%
50%
60%
70%
80%
90%
EM Europe LTAM EM APAC US
% of total foreign claims
% of 2010 GDP
7/31/2019 Desynchronising Global Economy
http://slidepdf.com/reader/full/desynchronising-global-economy 18/40
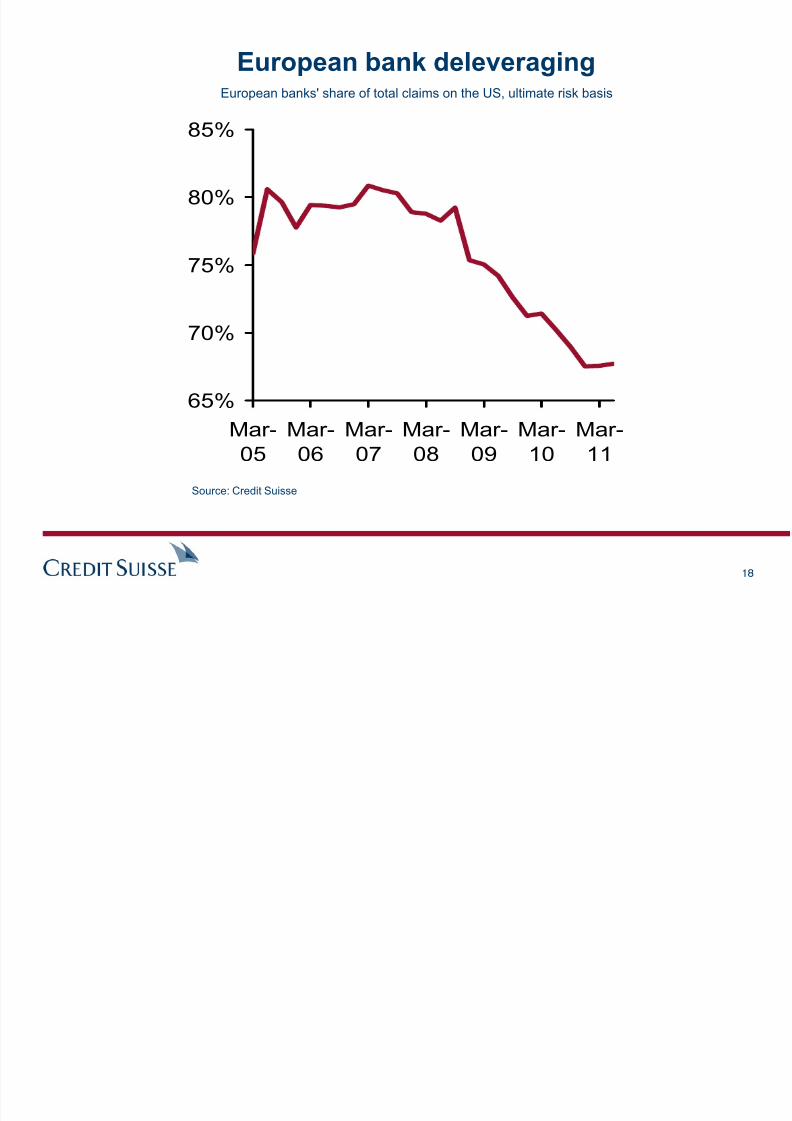
18
European bank deleveragingEuropean banks' share of total claims on the US, ultimate risk basis
Source: Credit Suisse
65%
70%
75%
80%
85%
Mar-05
Mar-06
Mar-07
Mar-08
Mar-09
Mar-10
Mar-11
7/31/2019 Desynchronising Global Economy
http://slidepdf.com/reader/full/desynchronising-global-economy 19/40
19
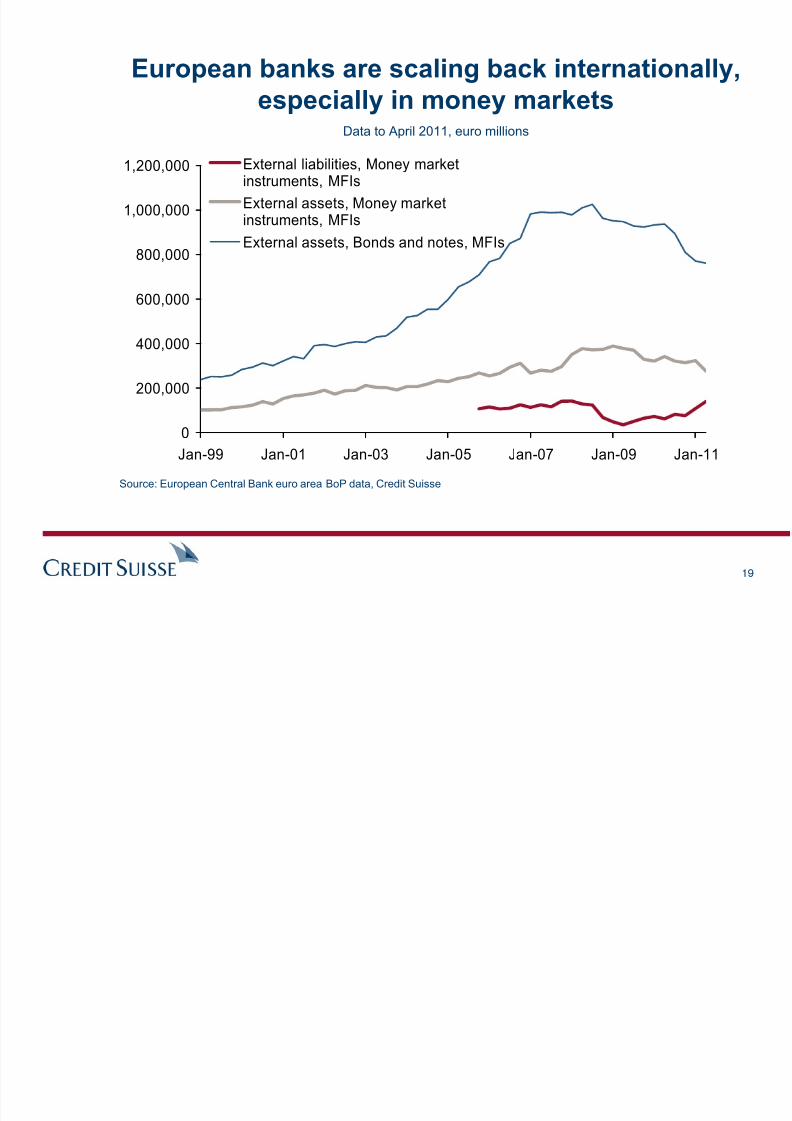
European banks are scaling back internationally,
especially in money marketsData to April 2011, euro millions
Source: European Central Bank euro area BoP data, Credit Suisse
0
200,000
400,000
600,000
800,000
1,000,000
1,200,000
Jan-99 Jan-01 Jan-03 Jan-05 Jan-07 Jan-09 Jan-11
External liabilities, Money marketinstruments, MFIs
External assets, Money market
instruments, MFIs
External assets, Bonds and notes, MFIs
7/31/2019 Desynchronising Global Economy
http://slidepdf.com/reader/full/desynchronising-global-economy 20/40
20
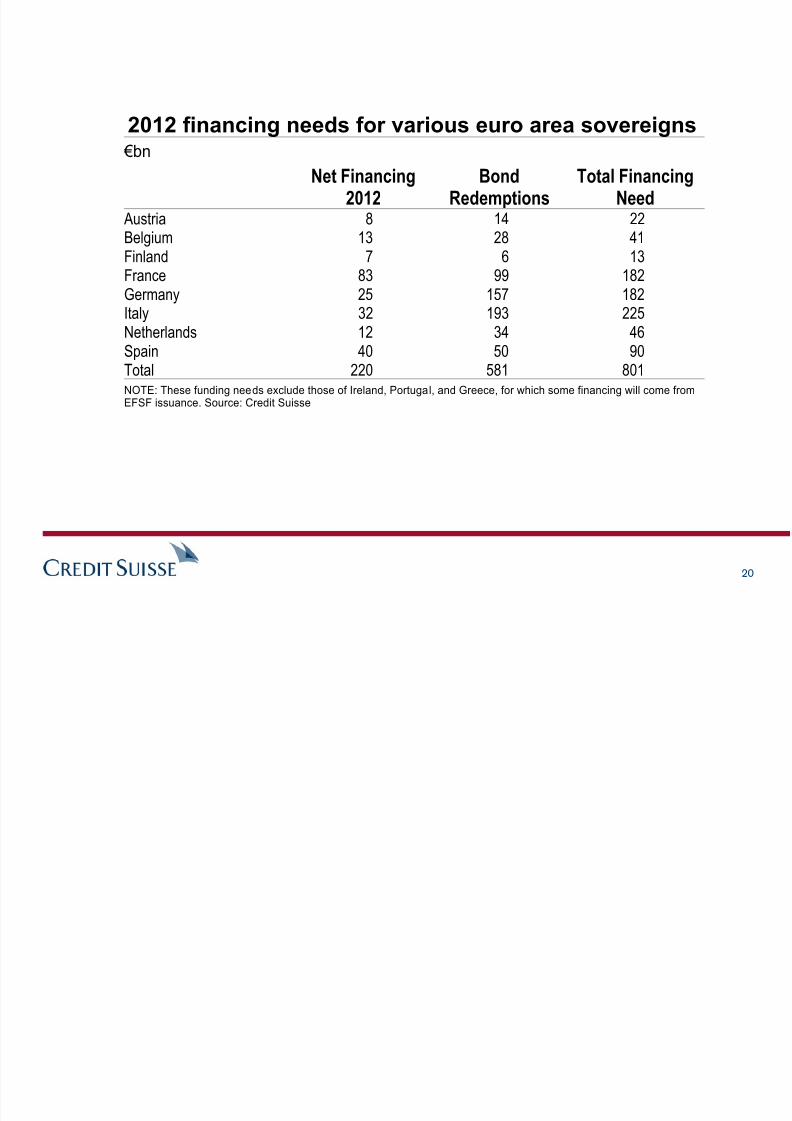
2012 financing needs for various euro area sovereigns €bn
Net Financing2012
BondRedemptions
Total FinancingNeed
Austria 8 14 22Belgium 13 28 41Finland 7 6 13France 83 99 182Germany 25 157 182Italy 32 193 225Netherlands 12 34 46Spain 40 50 90Total 220 581 801NOTE: These funding needs exclude those of Ireland, Portugal, and Greece, for which some financing will come fromEFSF issuance. Source: Credit Suisse
7/31/2019 Desynchronising Global Economy
http://slidepdf.com/reader/full/desynchronising-global-economy 21/40
21
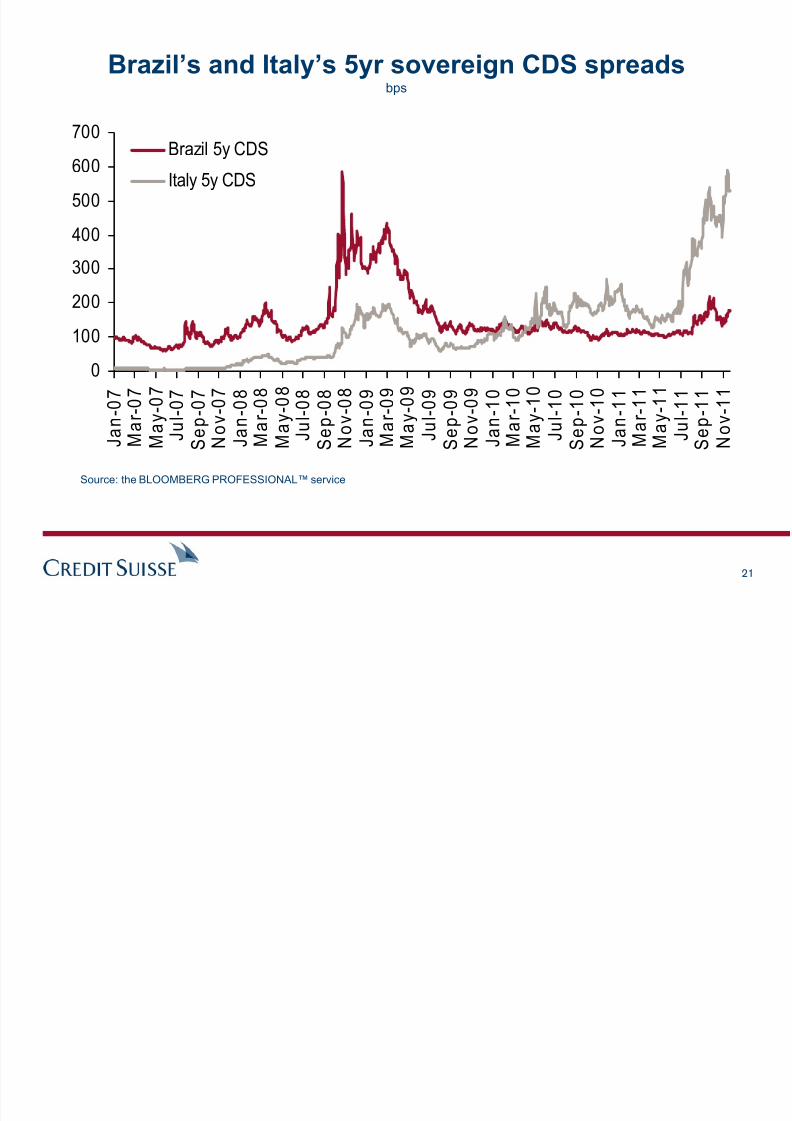
Brazil’s and Italy’s 5yr sovereign CDS spreadsbps
Source: the BLOOMBERG PROFESSIONAL™ service
0
100
200
300
400
500
600
700
J a
n - 0 7
M
a r - 0 7
M a
y - 0 7
J u l - 0 7
S e
p - 0 7
N o
v - 0 7
J a
n - 0 8
M
a r - 0 8
M a
y - 0 8
J u l - 0 8
S e
p - 0 8
N o
v - 0 8
J a
n - 0 9
M
a r - 0 9
M a
y - 0 9
J u l - 0 9
S e
p - 0 9
N o
v - 0 9
J a
n - 1 0
M
a r - 1 0
M a
y - 1 0
J u l - 1 0
S e
p - 1 0
N o
v - 1 0
J a
n - 1 1
M
a r - 1 1
M a
y - 1 1
J u l - 1 1
S e
p - 1 1
N o
v - 1 1
Brazil 5y CDS
Italy 5y CDS
7/31/2019 Desynchronising Global Economy
http://slidepdf.com/reader/full/desynchronising-global-economy 22/40
22
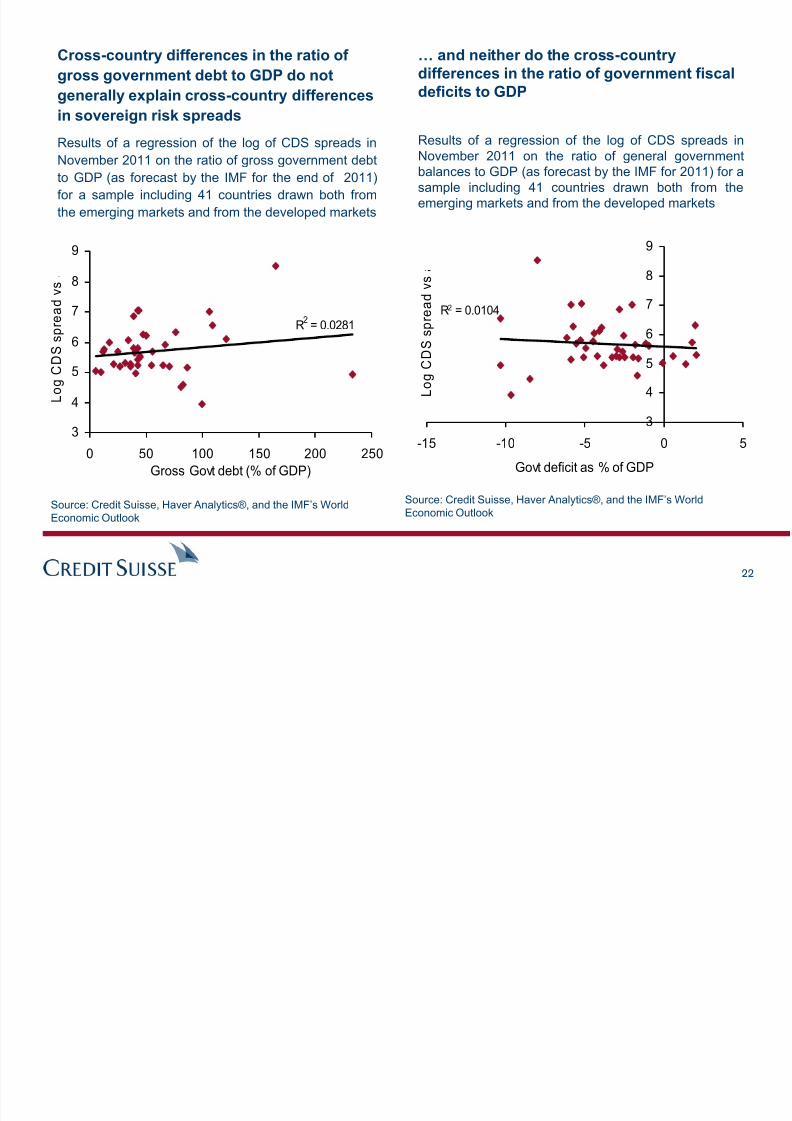
Cross-country differences in the ratio of
gross government debt to GDP do not
generally explain cross-country differences
in sovereign risk spreads
Results of a regression of the log of CDS spreads in
November 2011 on the ratio of gross government debt
to GDP (as forecast by the IMF for the end of 2011)
for a sample including 41 countries drawn both from
the emerging markets and from the developed markets
Source: Credit Suisse, Haver Analytics®, and the IMF’s WorldEconomic Outlook
Source: Credit Suisse, Haver Analytics®, and the IMF’s WorldEconomic Outlook
R2
= 0.0281
3
4
5
6
7
8
9
0 50 100 150 200 250
Gross Govt debt (% of GDP)
L o g C D S
s p r
e a d v s
R2 = 0.0104
3
4
5
6
7
8
9
-15 -10 -5 0 5
Govt deficit as % of GDP
L o g C D S
s p
r e a d v s
… and neither do the cross-country
differences in the ratio of government fiscal
deficits to GDP
Results of a regression of the log of CDS spreads inNovember 2011 on the ratio of general governmentbalances to GDP (as forecast by the IMF for 2011) for asample including 41 countries drawn both from theemerging markets and from the developed markets
7/31/2019 Desynchronising Global Economy
http://slidepdf.com/reader/full/desynchronising-global-economy 23/40
23
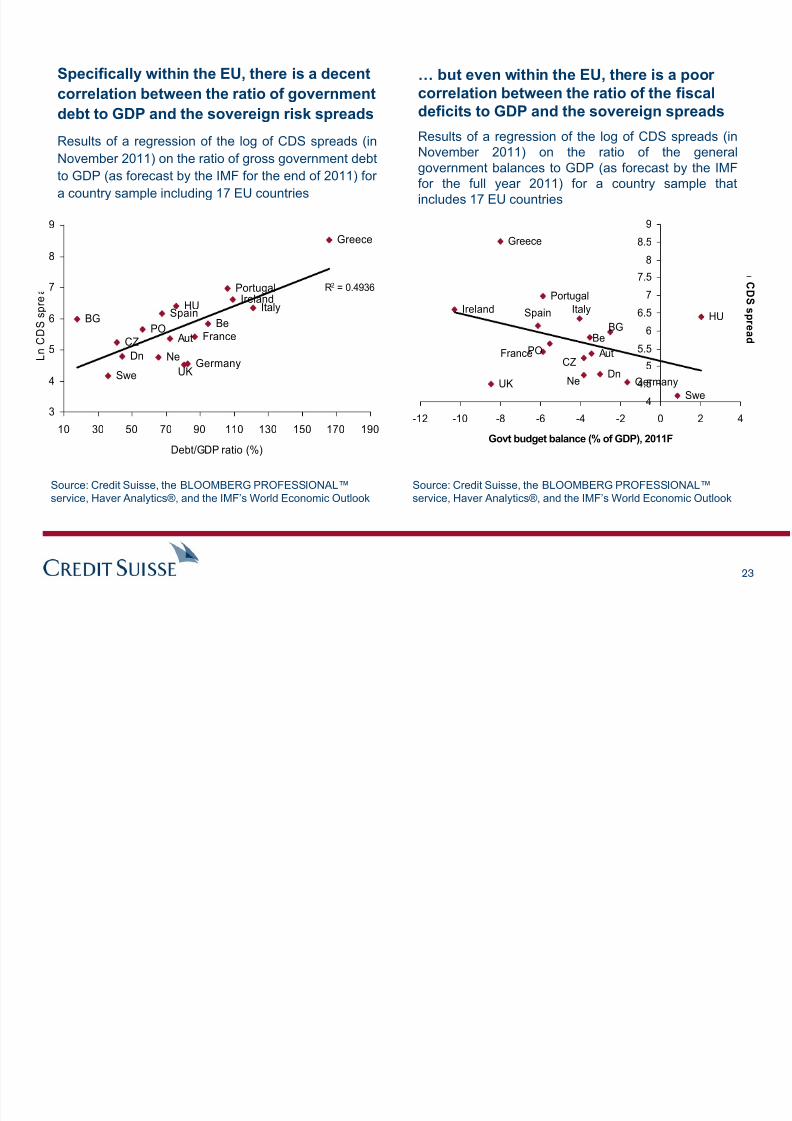
Specifically within the EU, there is a decent
correlation between the ratio of government
debt to GDP and the sovereign risk spreads
Results of a regression of the log of CDS spreads (in
November 2011) on the ratio of gross government debt
to GDP (as forecast by the IMF for the end of 2011) for
a country sample including 17 EU countries
Source: Credit Suisse, the BLOOMBERG PROFESSIONAL™service, Haver Analytics®, and the IMF’s World Economic Outlook
Source: Credit Suisse, the BLOOMBERG PROFESSIONAL™service, Haver Analytics®, and the IMF’s World Economic Outlook
… but even within the EU, there is a poor
correlation between the ratio of the fiscal
deficits to GDP and the sovereign spreadsResults of a regression of the log of CDS spreads (inNovember 2011) on the ratio of the generalgovernment balances to GDP (as forecast by the IMFfor the full year 2011) for a country sample thatincludes 17 EU countries
France
Germany
Greece
IrelandItaly
Portugal
Spain
UK
CZ
HU
POBG
AutBe
Dn Ne
Swe
R2 = 0.4936
3
4
5
6
7
8
9
10 30 50 70 90 110 130 150 170 190Debt/GDP ratio (%)
L n C D S
s p r e
Swe
NeDn
Be
Aut
BG
PO
HU
CZ
UK
Spain
Portugal
ItalyIreland
Greece
Germany
France
4
4.5
5
5.5
6
6.5
7
7.5
8
8.5
9
-12 -10 -8 -6 -4 -2 0 2 4
Govt budget balance (% of GDP), 2011F
C D S s p
r e a d
7/31/2019 Desynchronising Global Economy
http://slidepdf.com/reader/full/desynchronising-global-economy 24/40
24
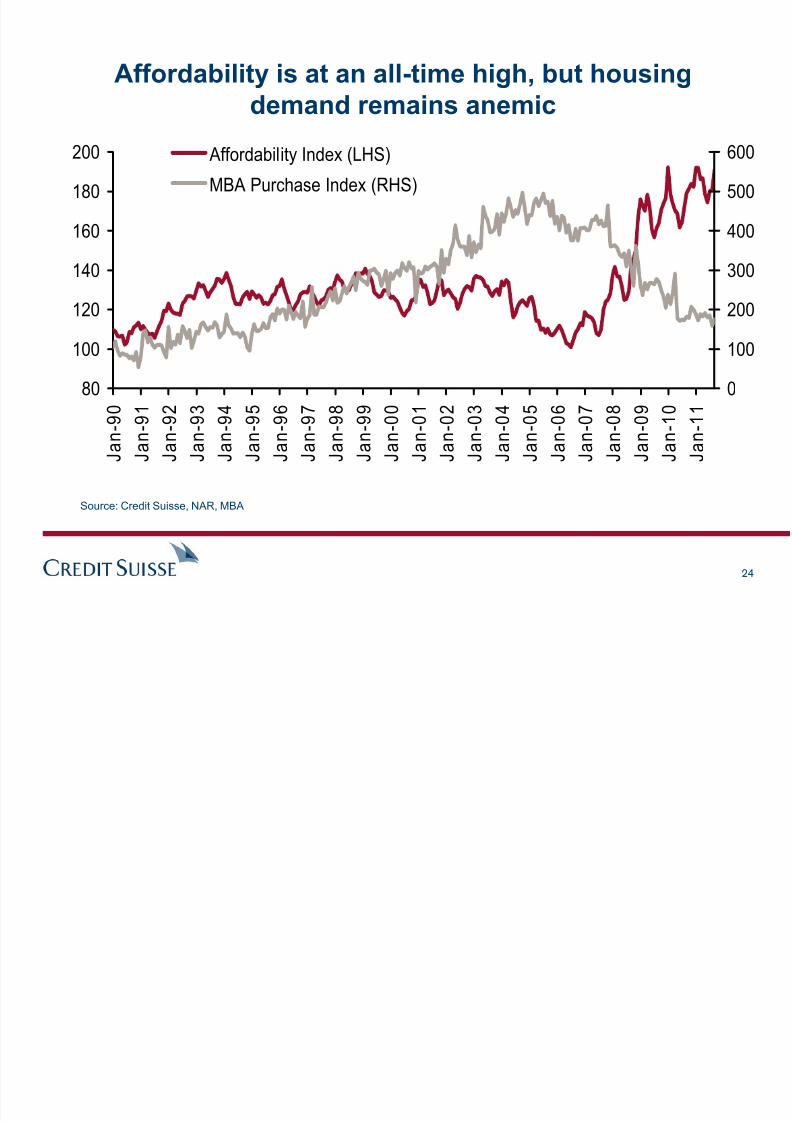
Affordability is at an all-time high, but housing
demand remains anemic
Source: Credit Suisse, NAR, MBA
80
100
120
140
160
180
200
J a n - 9 0
J a n - 9 1
J a n - 9 2
J a n - 9 3
J a n - 9 4
J a n - 9 5
J a n - 9 6
J a n - 9 7
J a n - 9 8
J a n - 9 9
J a n - 0 0
J a n - 0 1
J a n - 0 2
J a n - 0 3
J a n - 0 4
J a n - 0 5
J a n - 0 6
J a n - 0 7
J a n - 0 8
J a n - 0 9
J a n - 1 0
J a n - 1 1
0
100
200
300
400
500
600 Affordability Index (LHS)
MBA Purchase Index (RHS)

7/31/2019 Desynchronising Global Economy
http://slidepdf.com/reader/full/desynchronising-global-economy 25/40
25
Household formation is running below trend by almost
3 million
Source: Credit Suisse
101,000
103,000
105,000
107,000
109,000
111,000
113,000
115,000
117,000
A p r - 0
0
O c t - 0
0
A p r - 0
1
O c t - 0
1
A p r - 0
2
O c t - 0
2
A p r - 0
3
O c t - 0
3
A p r - 0
4
O c t - 0
4
A p r - 0
5
O c t - 0
5
A p r - 0
6
O c t - 0
6
A p r - 0
7
O c t - 0
7
A p r - 0
8
O c t - 0
8
A p r - 0
9
O c t - 0
9
A p r - 1
0
O c t - 1
0
A p r - 1
1
Number of Households, (Ths., NSA)
1 std Dev (based on 2000 -2005 trend)
-1 std Dev (based on 2000 -2005 trend)
Trend Rate
7/31/2019 Desynchronising Global Economy
http://slidepdf.com/reader/full/desynchronising-global-economy 26/40
26
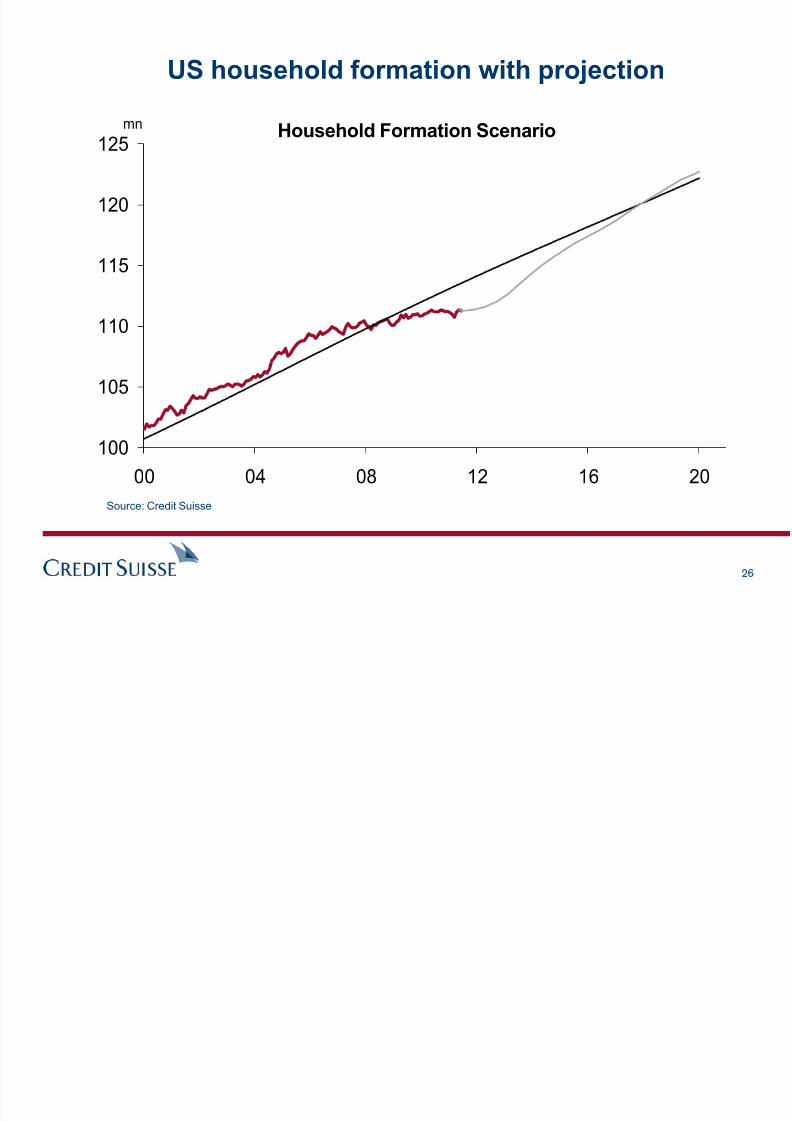
US household formation with projection
Source: Credit Suisse
Household Formation Scenario
100
105
110
115
120
125
00 04 08 12 16 20
mn
7/31/2019 Desynchronising Global Economy
http://slidepdf.com/reader/full/desynchronising-global-economy 27/40
27
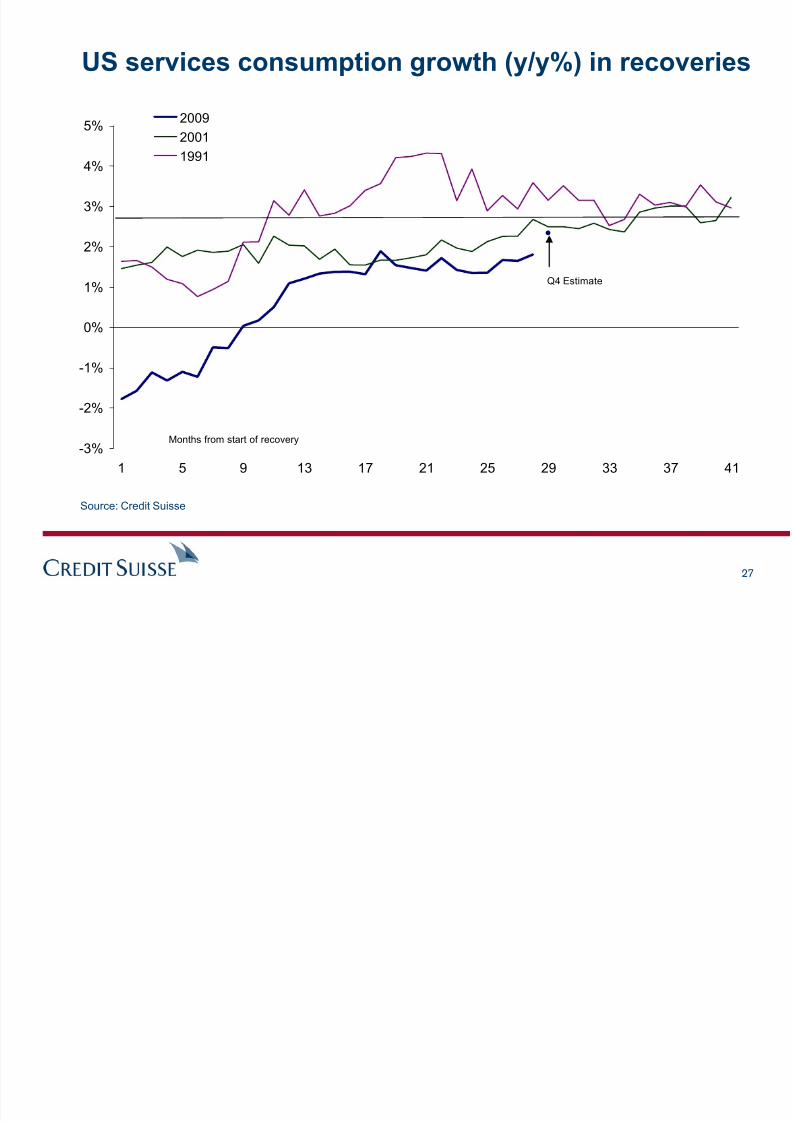
US services consumption growth (y/y%) in recoveries
Source: Credit Suisse
-3%
-2%
-1%
0%
1%
2%
3%
4%
5%
1 5 9 13 17 21 25 29 33 37 41
2009
2001
1991
Months from start of recovery
Q4 Estimate
7/31/2019 Desynchronising Global Economy
http://slidepdf.com/reader/full/desynchronising-global-economy 28/40
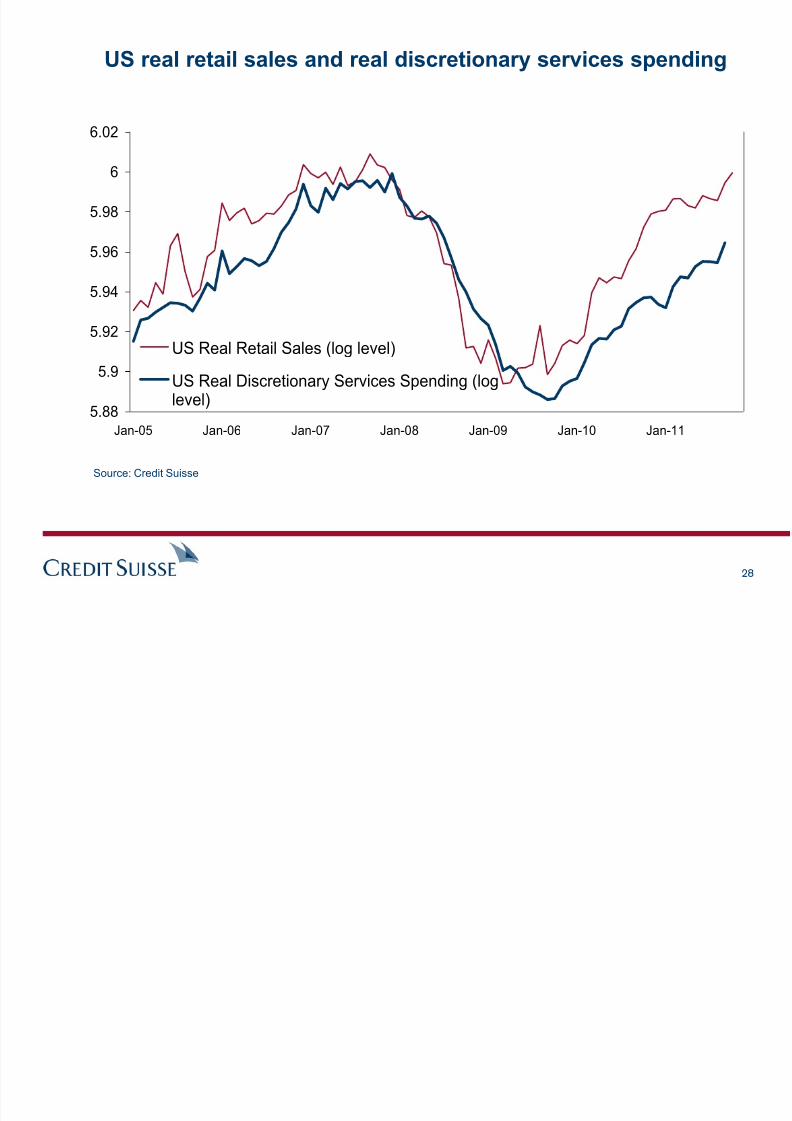
28
US real retail sales and real discretionary services spending
Source: Credit Suisse
5.88
5.9
5.92
5.94
5.96
5.98
6
6.02
Jan-05 Jan-06 Jan-07 Jan-08 Jan-09 Jan-10 Jan-11
US Real Retail Sales (log level)
US Real Discretionary Services Spending (loglevel)
7/31/2019 Desynchronising Global Economy
http://slidepdf.com/reader/full/desynchronising-global-economy 29/40
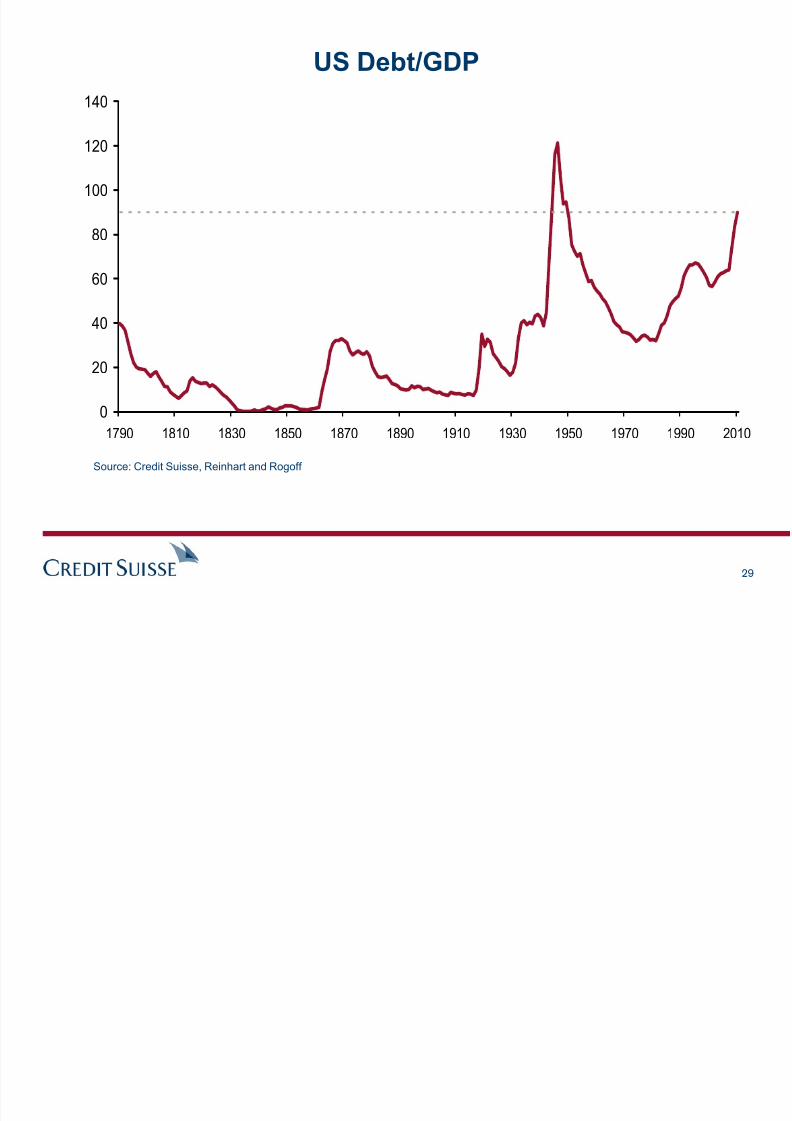
29
US Debt/GDP
Source: Credit Suisse, Reinhart and Rogoff
0
20
40
60
80
100
120
140
1790 1810 1830 1850 1870 1890 1910 1930 1950 1970 1990 2010
7/31/2019 Desynchronising Global Economy
http://slidepdf.com/reader/full/desynchronising-global-economy 30/40
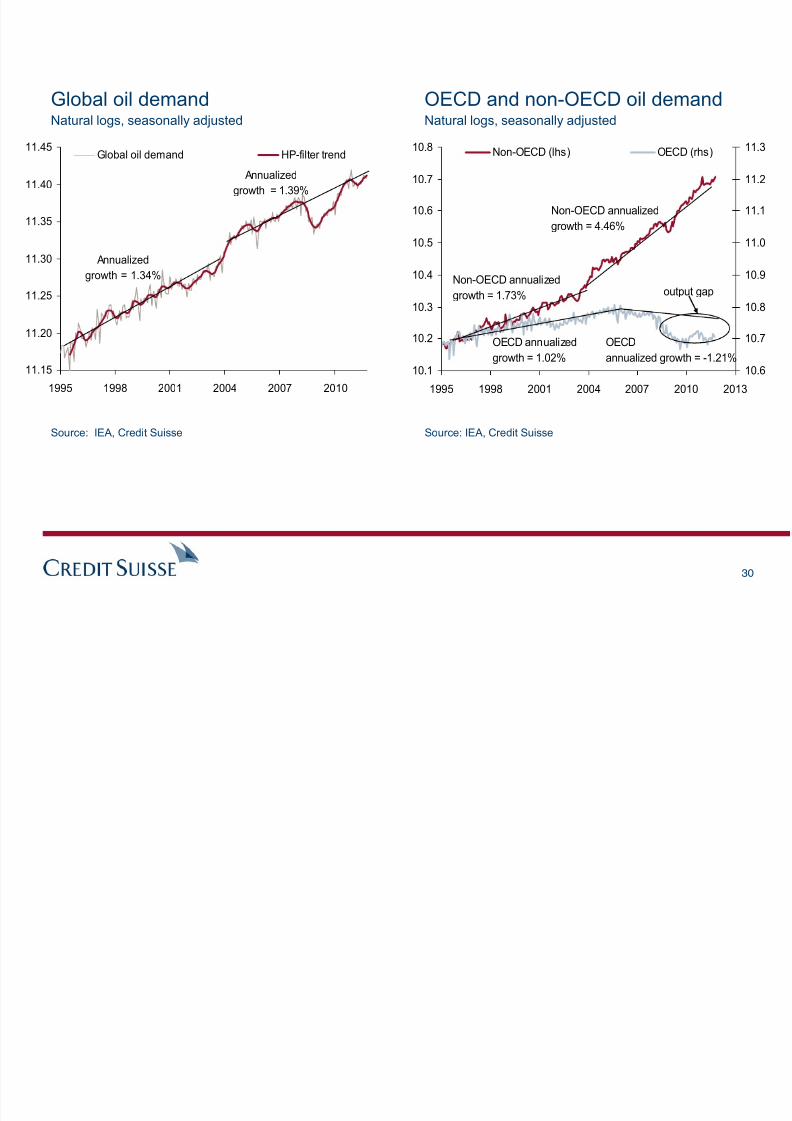
30
Global oil demandNatural logs, seasonally adjusted
Source: IEA, Credit Suisse Source: IEA, Credit Suisse
OECD and non-OECD oil demandNatural logs, seasonally adjusted
11.15
11.20
11.25
11.30
11.35
11.40
11.45
1995 1998 2001 2004 2007 2010
Global oil demand HP-filter trend
Annualized
growth = 1.39%
Annualized
growth = 1.34%
10.1
10.2
10.3
10.4
10.5
10.6
10.7
10.8
1995 1998 2001 2004 2007 2010 2013
10.6
10.7
10.8
10.9
11.0
11.1
11.2
11.3Non-OECD (lhs) OECD (rhs)
Non-OECD annualized
growth = 4.46%
OECD annualized
growth = 1.02%
Non-OECD annualized
growth = 1.73%
OECD
annualized growth = -1.21%
output gap
C f
7/31/2019 Desynchronising Global Economy
http://slidepdf.com/reader/full/desynchronising-global-economy 31/40
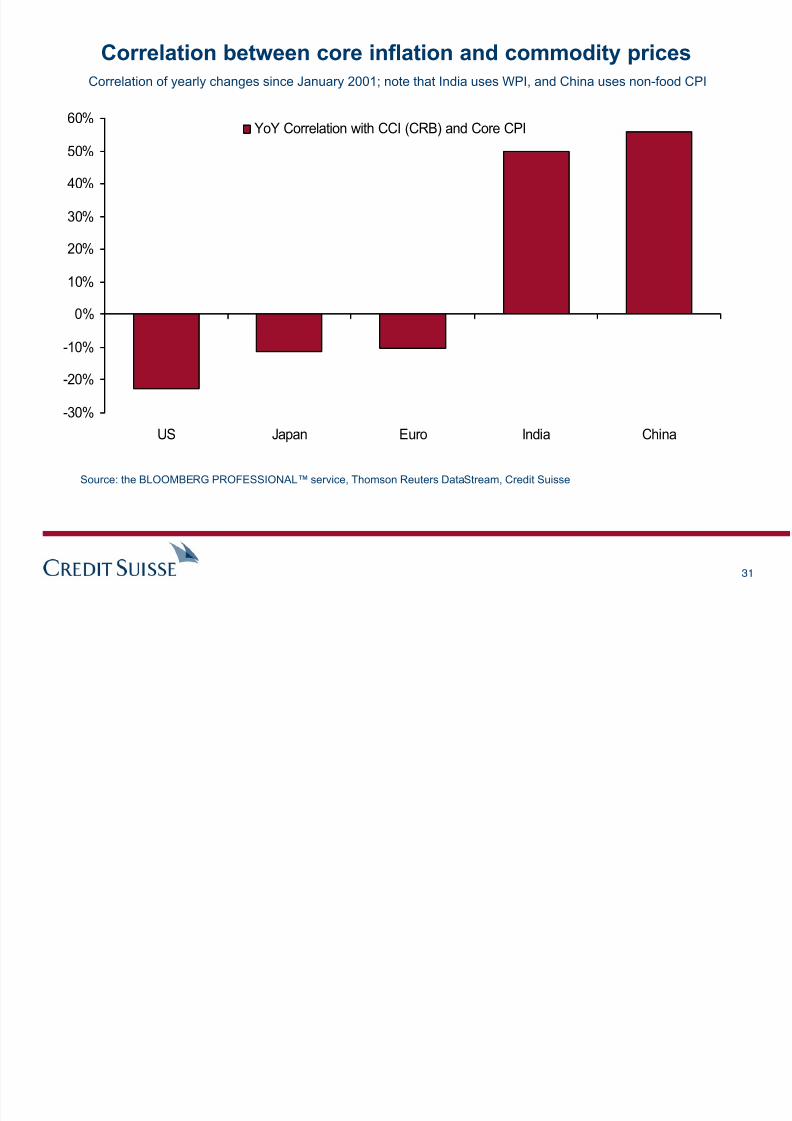
31
Correlation between core inflation and commodity pricesCorrelation of yearly changes since January 2001; note that India uses WPI, and China uses non-food CPI
Source: the BLOOMBERG PROFESSIONAL™ service, Thomson Reuters DataStream, Credit Suisse
-30%
-20%
-10%
0%
10%
20%
30%
40%
50%
60%
US Japan Euro India China
YoY Correlation with CCI (CRB) and Core CPI
7/31/2019 Desynchronising Global Economy
http://slidepdf.com/reader/full/desynchronising-global-economy 32/40
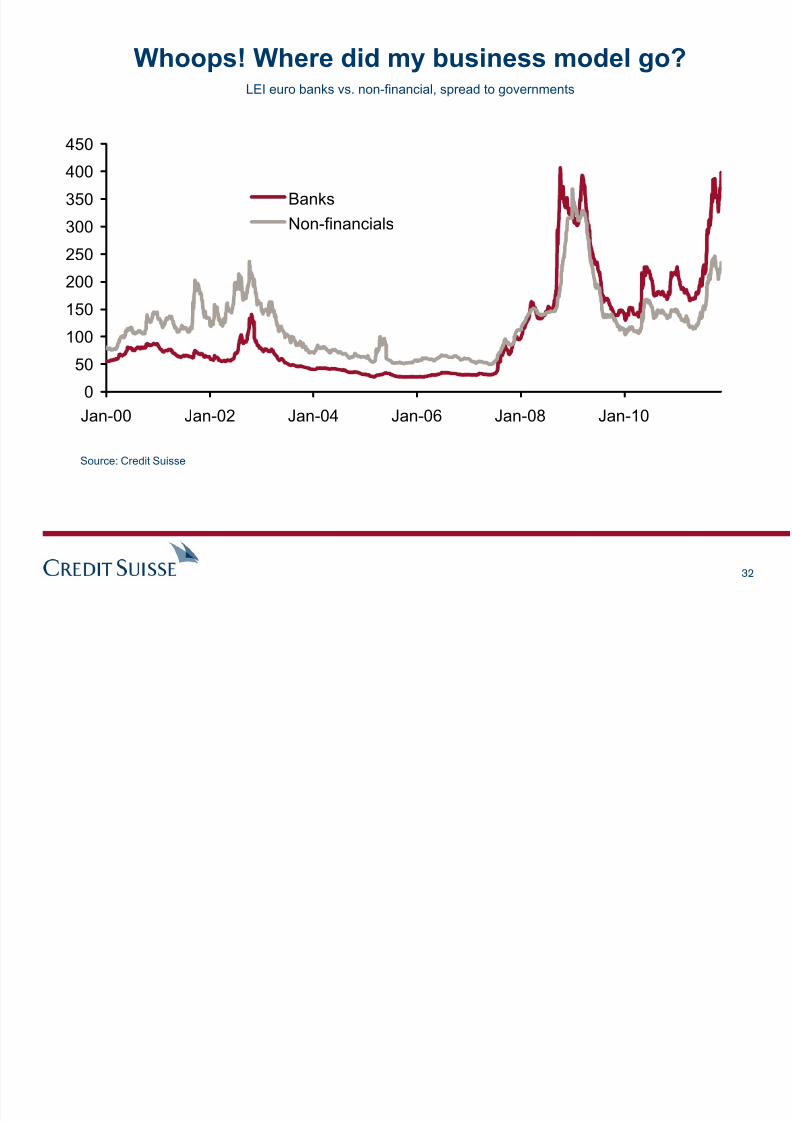
32
Whoops! Where did my business model go?LEI euro banks vs. non-financial, spread to governments
Source: Credit Suisse
0
50
100
150
200
250
300
350
400
450
Jan-00 Jan-02 Jan-04 Jan-06 Jan-08 Jan-10
Banks
Non-financials
7/31/2019 Desynchronising Global Economy
http://slidepdf.com/reader/full/desynchronising-global-economy 33/40
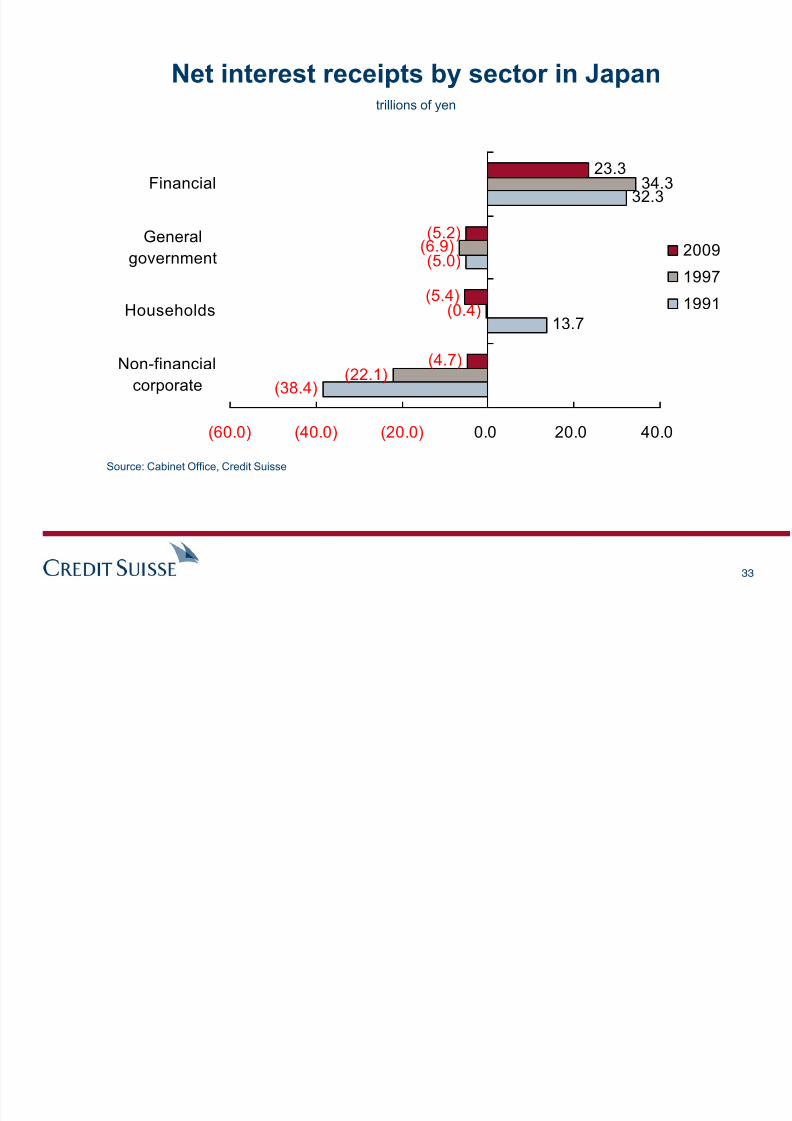
33
Net interest receipts by sector in Japantrillions of yen
Source: Cabinet Office, Credit Suisse
(38.4)
13.7
(5.0)
32.3
(22.1)
(0.4)
(6.9)
34.3
(4.7)
(5.4)
(5.2)
23.3
(60.0) (40.0) (20.0) 0.0 20.0 40.0
Non-financial
corporate
Households
General
government
Financial
2009
1997
1991
7/31/2019 Desynchronising Global Economy
http://slidepdf.com/reader/full/desynchronising-global-economy 34/40
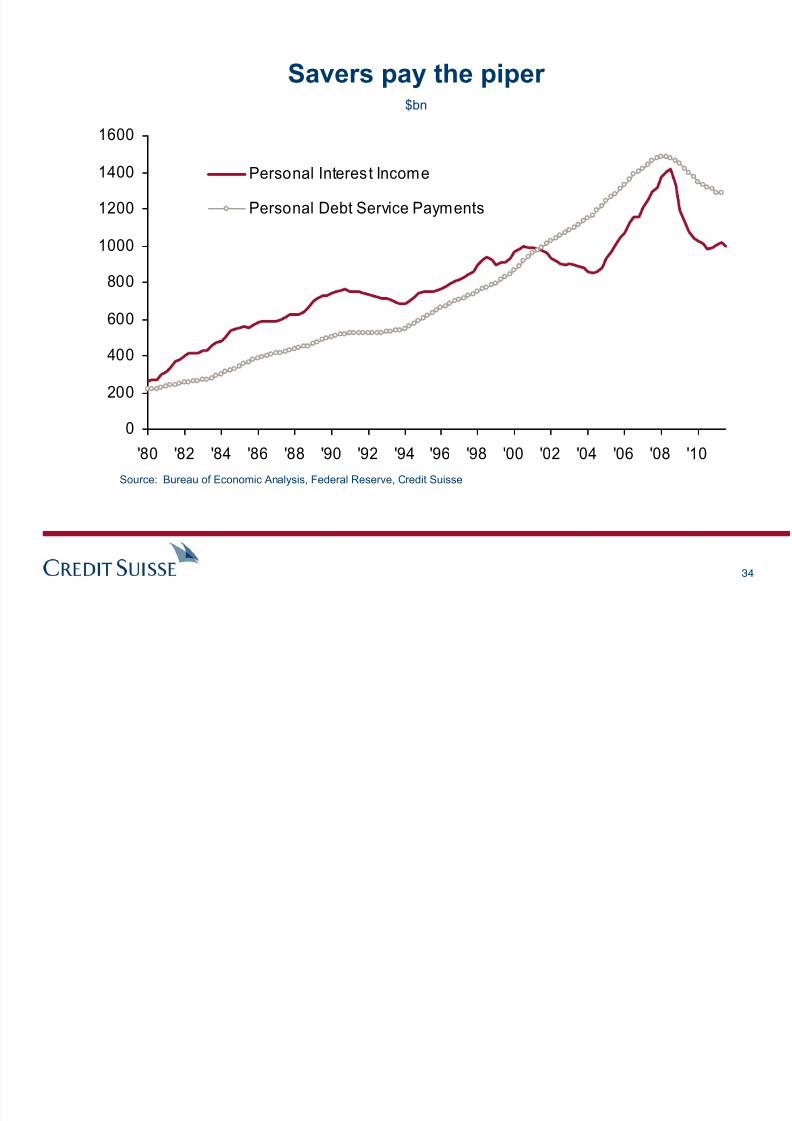
34
Savers pay the piper $bn
Source: Bureau of Economic Analysis, Federal Reserve, Credit Suisse
0
200
400
600
800
1000
1200
1400
1600
'80 '82 '84 '86 '88 '90 '92 '94 '96 '98 '00 '02 '04 '06 '08 '10
Personal Interest Income
Personal Debt Service Payments
7/31/2019 Desynchronising Global Economy
http://slidepdf.com/reader/full/desynchronising-global-economy 35/40
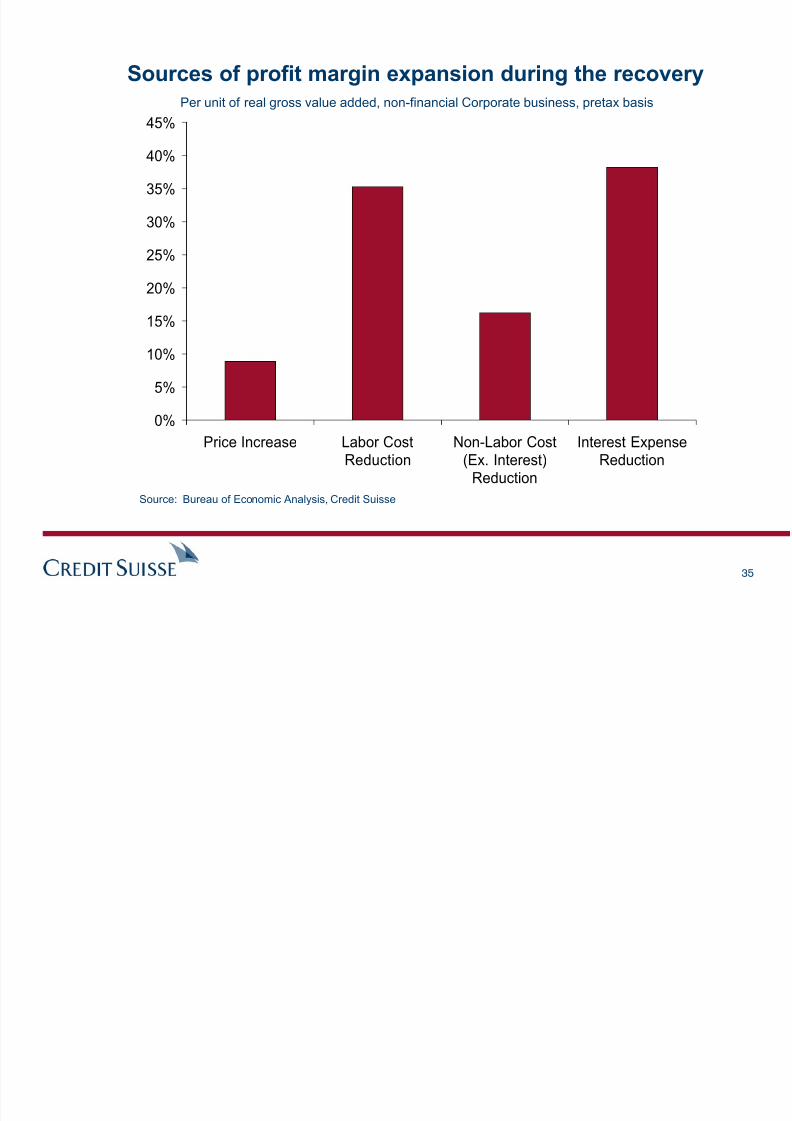
35
Sources of profit margin expansion during the recoveryPer unit of real gross value added, non-financial Corporate business, pretax basis
Source: Bureau of Economic Analysis, Credit Suisse
0%
5%
10%
15%
20%
25%
30%
35%
40%
45%
Price Increase Labor CostReduction
Non-Labor Cost(Ex. Interest)
Reduction
Interest ExpenseReduction
7/31/2019 Desynchronising Global Economy
http://slidepdf.com/reader/full/desynchronising-global-economy 36/40
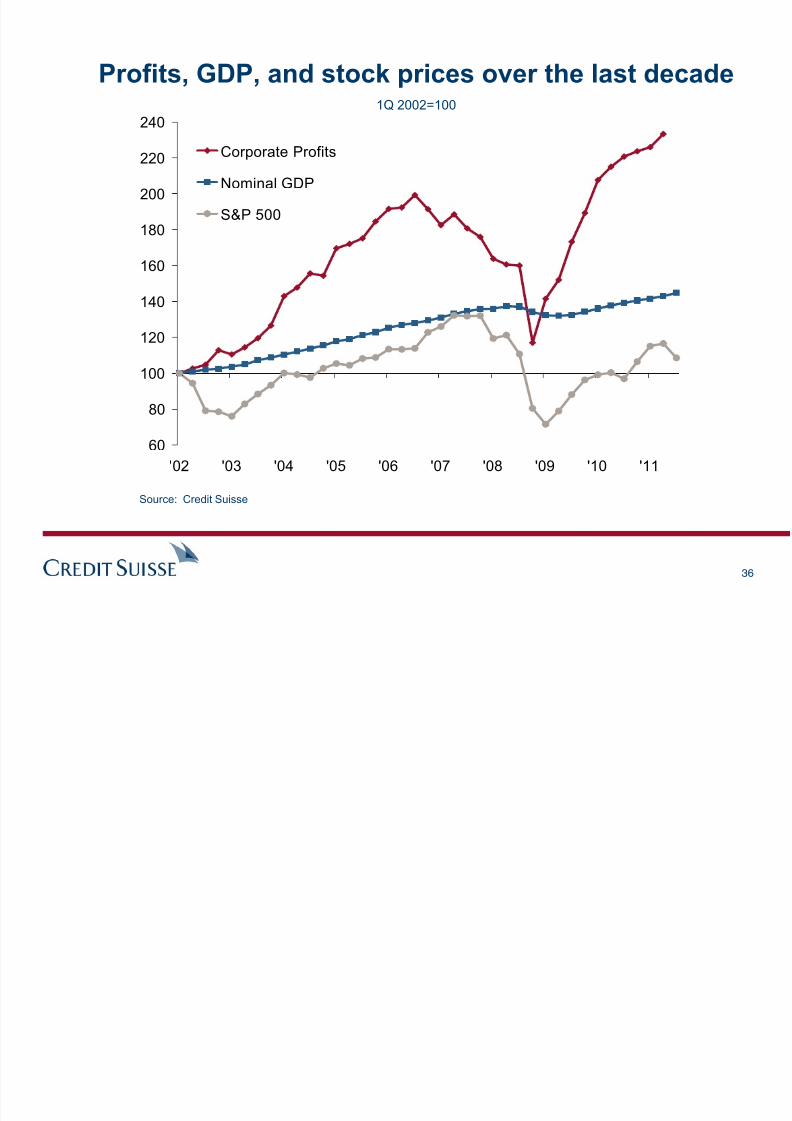
36
Profits, GDP, and stock prices over the last decade1Q 2002=100
Source: Credit Suisse
60
80
100
120
140
160
180
200
220
240
'02 '03 '04 '05 '06 '07 '08 '09 '10 '11
Corporate Profits
Nominal GDP
S&P 500
7/31/2019 Desynchronising Global Economy
http://slidepdf.com/reader/full/desynchronising-global-economy 37/40
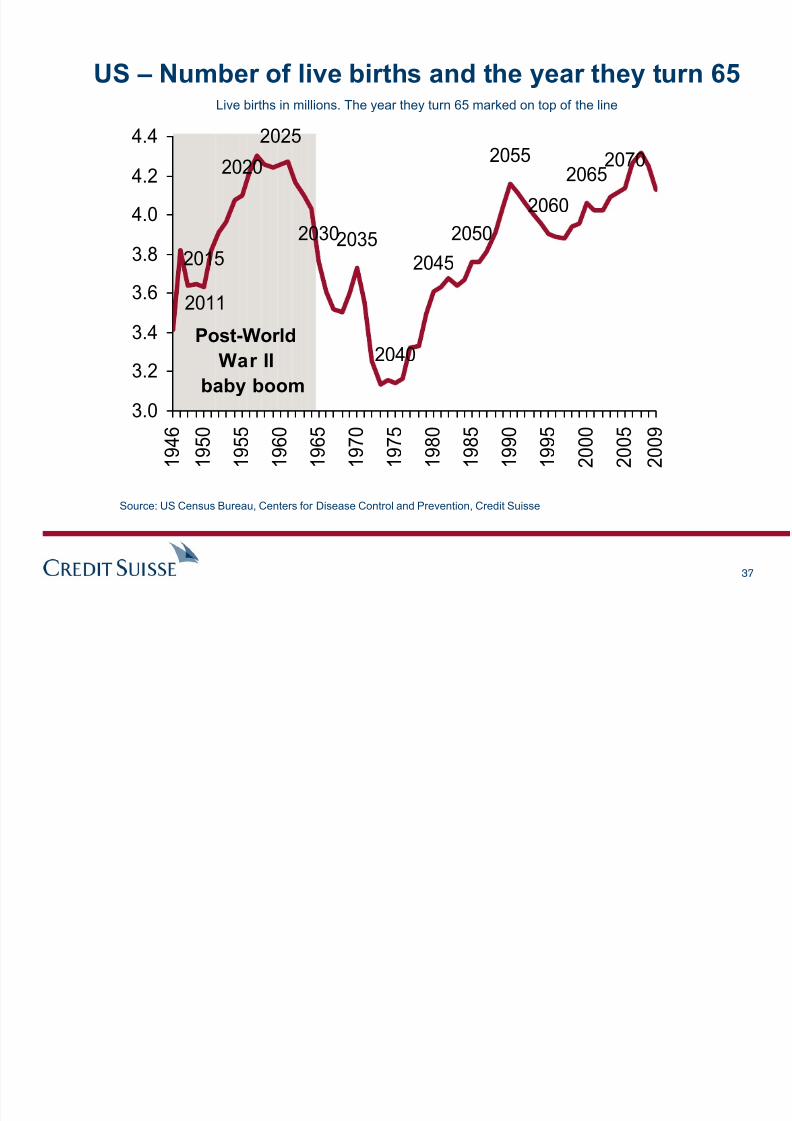
37
US – Number of live births and the year they turn 65Live births in millions. The year they turn 65 marked on top of the line
Source: US Census Bureau, Centers for Disease Control and Prevention, Credit Suisse
2015
2020
2025
20302035
2040
2045
2050
2055
2060
20652070
2011
3.0
3.2
3.4
3.6
3.8
4.0
4.2
4.4
1 9 4 6
1 9 5 0
1 9 5 5
1 9 6 0
1 9 6 5
1 9 7 0
1 9 7 5
1 9 8 0
1 9 8 5
1 9 9 0
1 9 9 5
2 0 0 0
2 0 0 5
2 0 0 9
Post-World
War II
baby boom
7/31/2019 Desynchronising Global Economy
http://slidepdf.com/reader/full/desynchronising-global-economy 38/40
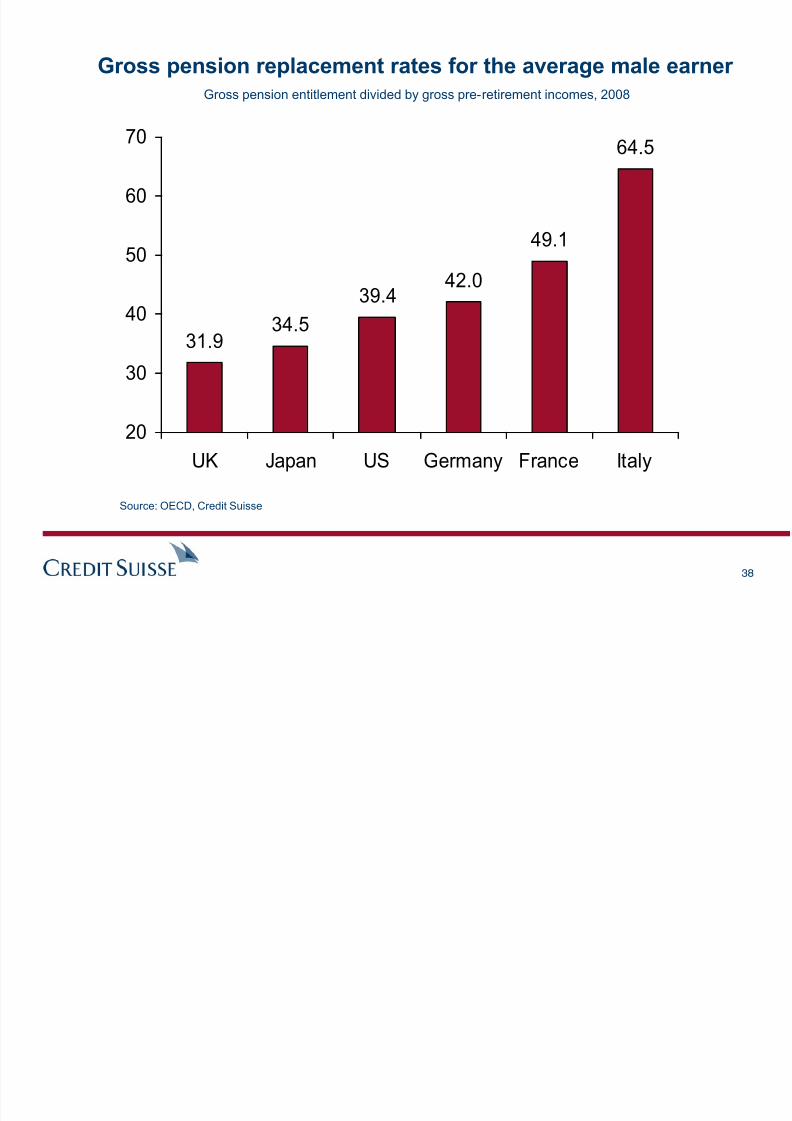
38
Gross pension replacement rates for the average male earner Gross pension entitlement divided by gross pre-retirement incomes, 2008
Source: OECD, Credit Suisse
31.9 34.5
39.442.0
49.1
64.5
20
30
40
50
60
70
UK Japan US Germany France Italy
7/31/2019 Desynchronising Global Economy
http://slidepdf.com/reader/full/desynchronising-global-economy 39/40
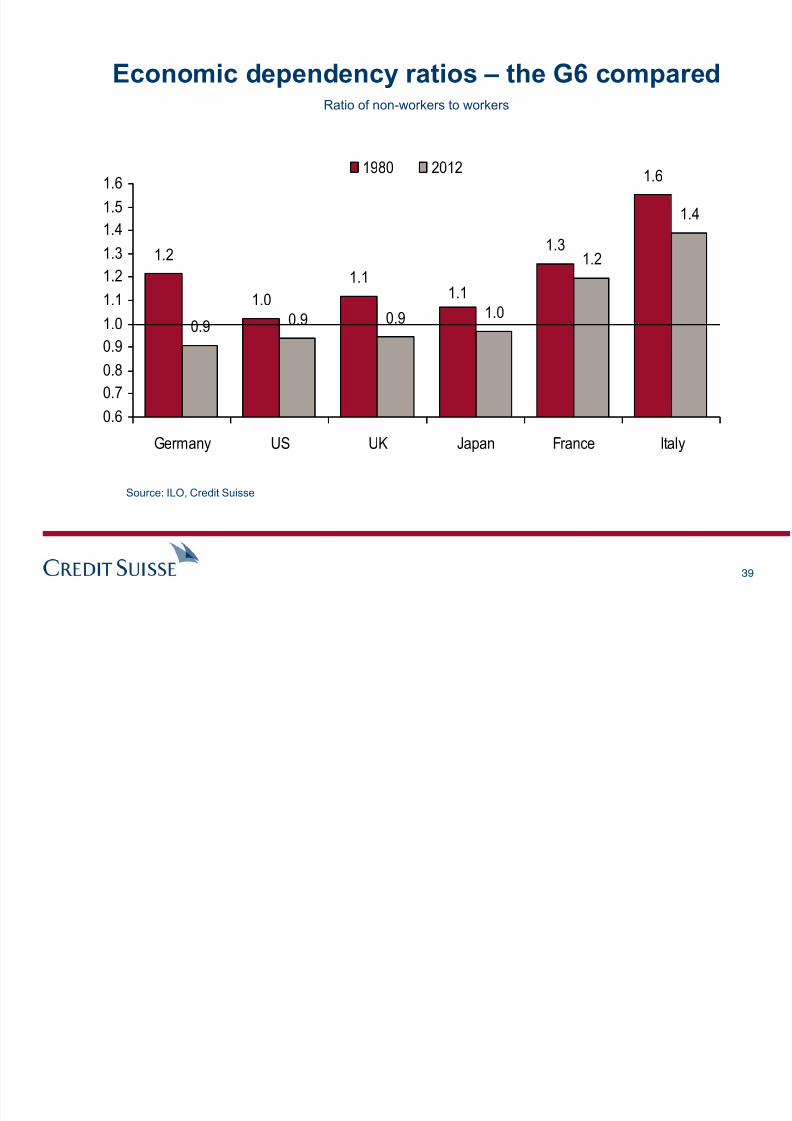
39
Economic dependency ratios – the G6 comparedRatio of non-workers to workers
Source: ILO, Credit Suisse
1.2
1.0
1.1
1.3
1.6
0.90.9 0.9 1.0
1.2
1.4
1.1
0.6
0.7
0.8
0.91.0
1.1
1.2
1.3
1.4
1.5
1.6
Germany US UK Japan France Italy
1980 2012
7/31/2019 Desynchronising Global Economy
http://slidepdf.com/reader/full/desynchronising-global-economy 40/40