market implications of public policy … interventions paper... · 3 risky insurance markets,...
TRANSCRIPT
1
MARKET IMPLICATIONS OF PUBLIC POLICY INTERVENTIONS: THE CASE OF FLORIDA’S PROPERTY INSURANCE MARKET
Lorilee A. Medders* Charles M. Nyce J. Bradley Karl
Florida Catastrophic Storm Risk Management Center College of Business, Room 112 RBB
Florida State University Tallahassee, FL 32306-1110
*Phone: 850-645-8393 Fax: 850-645-8391 [email protected]
The authors wish to thank Patrick F. Maroney and Sue Ellen Smith for their valuable contributions to this article. Last updated: March 2, 2012

2
MARKET IMPLICATIONS OF PUBLIC POLICY INTERVENTIONS: THE CASE OF FLORIDA’S PROPERTY INSURANCE MARKET
Abstract This article asserts that the market for property insurance, particularly homeowners insurance, in the State of Florida currently is experiencing a number of failures, and that a combination of market problems, externalities and interventions unique to Florida led to these failures. The authors provide a narrative description of the market events, problems and policies preceding the market failures and present data that evidence the market failures. Recommendations for a return to risk-based pricing and incentives for appropriate mitigation are made.
Introduction
Florida’s heavy geographic exposure to catastrophic tropical windstorms is clear, but this
single market factor is only one of myriad factors that impact Florida’s market. The availability
of private capital to support catastrophic windstorm exposure is contingent upon regulatory and
legislative directives intended to ease market pressures and stabilize pricing. We submit that
recent government interventions in the state’s property insurance market have suppressed prices
and increased long-term state market pressures that create questions of market sustainability.
The paper consists of four sections. Section 1 contains a discussion of the prior literature
relevant to insurance market problems, capacity constraints, market performance and their
relationship to government interventions. Section 2 describes the structure of Florida’s
homeowners insurance market as well as its current condition, and compares Florida’s market
with markets in other states. Section 3 examines specific market problems in Florida and
negative externalities created by government responses to these problems that the authors assert
all have contributed to the market’s present condition. Section 4 offers concluding thoughts and
avenues of future research.

3
Risky Insurance Markets, Capacity Constraints and Government Interventions
Prior research into the nature of insurance market capacity and its relationship to market
performance and market interventions is abundant. What follows is a discussion of the existing
relevant literature.
Problems in High-Risk (Catastrophe) Insurance Markets
Both on the demand and supply side, insurance markets experience a number of well-
known difficulties, from seller-buyer informational problems to seller constraints on capacity.
Markets that include high potential for catastrophic industry losses especially are subject to these
problems. Thus, the relationships between demand-supply efficiencies, resulting market
performance and aggregate market capacity are important in the study of catastrophe-exposed
markets. Arrow (1971) and Dionne and Harrington (1992) describe basic models for insurance
demand by individuals, and Kunreuther (1998) describes the special effects of catastrophic risk
on these models. Several studies, such as Ehrlich and Becker (1972), Kunreuther (1978), Dionne
and Eeckhoudt (1985), Hiebert (1989), Kunreuther and Kleffner (1992), Kunreuther (1996) and
Kleffner and Kelly (2001), have established the individual insurance purchase in the face of
disaster potential as being, to some extent, a choice between loss mitigation (self-insurance) and
risk transfer (insurance).1 Additional research has found evidence of an inverse relationship
between expectations of government disaster relief and both structural mitigation and insurance
demand. The findings of Kaplow (1991), Kelly and Kleffner (2003) and Kunreuther and Pauly
1 The findings of research regarding the actual relationship between the availability/pricing of insurance and personal investments in risk-reducing activities are mixed; while insurance transfers risk of financial loss from the individual to the insurance company it inherently creates an incentive for insurance companies to develop a pricing scheme that rewards policyholders who mitigate. So while the availability of insurance reduces the incentive to make mitigation expenditures, all else the same, insurance prices can be adequately high to encourage mitigation. See Kleindorfer and Klein (2003) for mathematical illustration and additional literature pertaining to the relationship between insurance and mitigation.

4
(2006) are consistent with the idea that disaster assistance reduces incentives for individuals to
invest in risk reduction or private risk transfer.
The literature on supply-side problems in markets shows us that solvency constraints
limit the available capacity of the marketplace.2 Herring and Vankudre (1987) and Greenwald
and Stiglitz (1990) contend that insurers may view solvency concerns in light of the transactions
costs of insolvency and the franchise value of the firm as a going concern. Klein and Kleindorfer
(2003) extend the model to the case of markets with industry-wide disaster potential, such as the
Florida property insurance market.
Stone (1973) and Cummins, Doherty and Lo (2002) find that market insurance capacity is
at a maximum when there is either one monopolistic insurer or when all insurers participate in
some proportion of every risk. Segmentation by line therefore reduces market capacity.
Furthermore, capacity for catastrophic insurance will increase if: there is a shift toward greater
risk bearing; data related to catastrophes improves; catastrophic insurance rates increase; or
segmentation is reduced. Doherty (1980) develops a model wherein capital market structure
determines capacity, and specifically market capacity differs with choice of reinsurance. Doherty
(1983) builds on this capital structure theory to model capacity as a measure of the risk-return
performance of an insurer’s asset-liability portfolio. Market capacity, in all of these models, is
the aggregation of capacity of all individual firms in the market. Nielson (1984) analyzes the
interrelationships among surplus, investment risk, underwriting risk and expenses with regard to
how they relate to capacity. Nielson (1984) expresses the capacity of the insurance industry as a
relationship between policyholders’ surplus, investment risk, total assets, rate of return,
underwriting expenses and insurer-specific capital needs and premiums.
2 Stone (1973) and Herring and Vankudre (1987), followed by Grace, Klein and Kleindorfer (1999) lay out the capacity issues faced by insurers when considering risk-taking in problematic markets.

5
Prior literature pertaining to the underwriting cycle offers insight into factors that impact
insurance availability as well. Gron (1994) evaluates the validity of arbitrage theory and the
capacity constraint hypothesis as explanations for the underwriting cycle and finds support for
the capacity constraint hypothesis. Gron (1994) finds evidence of a negative relationship
between fluctuations in insurer capacity and insurer profitability. Gron (1994) also points out that
guarantee fund associations may exacerbate capacity crises by reducing solvent insurers’ net
worth through assessments. Doherty and Garven (1995) extend Gron’s (1994) work to include
the impact of interest rates on underwriting profits, with findings that suggest a relationship
exists between insurer capacity and asset-liability management.
Government Intervention and Market Performance
A variety of studies have analyzed the relationship between legislative-regulatory
intervention and market performance. Building on the prior work of Stigler (1971), Herring and
Vankudre (1987), Greenwald and Stiglitz (1990) and Klein (1998), Klein and Kleindorfer (2003)
develop a theoretical illustration of the negative externalities, and ultimately market failures, that
can result from decreases in the price ceiling within catastrophe-prone markets. Grace and Klein
(2009) likewise provide further descriptive evidence of the impact of government choices on
catastrophe markets. The choice by private insurers to decrease market exposure, and thus
decrease capacity in the highest-risk zones, as a result of interventions is of particular interest to
this research.3
3 Meier (1991) asserts the goals of insurance regulation should be viewed, not solely in terms of alleviating market problems or correcting market failures, but also as partially a function of political externalities. Meier (1991) goes on to argue that the degree of involvement of the parties involved in the regulatory process is determined by the importance and complexity of each issue at hand. That is, as the importance and complexity of the issue increases, so does the likelihood that members of the regulatory process will become involved in the act of regulating insurance. However, Meier (1991) asserts that as the complexity of the issue at hand increases, so does the incentive for members of the regulatory process to generalize and simplify the regulated issue. As an illustration of such simplification, Meir (1991) notes that California, rather than dealing with the technicalities of prior rate approval regulation, proposed to implement an overarching 20 percent premium reduction.

6
Several empirical studies examine the dynamic relation between regulation and the
insurance industry. Dumm, Liebenberg, Liebenberg and Ruhland (2010) consider the stock
market’s reaction to a special legislative session on insurance regulation in Florida in 2006. Prior
to the call for the special legislative session, Florida had experienced unprecedented property
insurance rate increases and state lawmakers had promised to take measures to artificially curtail
the rising cost of insurance for Floridians. Dumm et al (2010) hypothesize that the call for the
special legislative session would be viewed by the market as political risk and Dumm et al
(2010) test their hypothesis using an event study methodology. In support of their hypothesis,
Dumm et al (2010) find that publicly traded insurers with homeowners and commercial multiple
peril business exposure in Florida experienced a negative stock price reaction as a result of the
special legislative session. We find the work of Dumm et al (2010) important because it
demonstrates the far reaching impact of regulation on insurance industry performance.
Other empirical studies of regulation and insurance industry performance have focused
on specific lines of business such as automobile insurance (e.g. Grabowski, Viscusi, and Evans,
1989) or workers compensation insurance (e.g. Harrington and Danzon, 2000). Grabowski et al
(1989) examine the effects of automobile insurance regulation among 30 states from 1974 -
1981. They find that, consistent with the political objective of regulation, regulatory intervention
lowers the price of insurance. Grabowski et al (1989) also find, however, that in highly regulated
states, larger numbers of drivers are thrust into the residual market with the result that unsafe
drivers receive larger subsidies in highly regulated states. Also of importance is that Grabowski
et al (1989) find a large drop in the price of insurance in states which deregulated during the
sample period. The work of Grabowski et al (1989) is important to our study because it

7
illustrates that while regulation may accomplish the goal of reducing the price of insurance,
regulation may also result in negative market externalities.
Another automobile insurance regulation study of importance is that of Harrington and
Doerpinghaus (1993) who examine the consequences of restrictions on rate classification in
automobile insurance markets. The authors note that many states place restrictions on the rating
information to be used by insurers, such as age, sex, marital status, territory, etc., and note that
the purpose of these restrictions is to prevent rating practices that are arbitrary or unfair.
Harrington and Doerpinghaus (1993) consider both the direct and indirect effects of rate
classification restriction and find that classification restrictions could greatly increase the cost of
risk due to the indirect costs associated with large involuntary markets and reduced political
pressure for control of costs. We rely on Harrington and Doerpinghaus (1993) because this study
documents additional negative externalities resulting from regulation in insurance markets. 4
There are also line-of-business specific studies outside of automobile insurance markets
that analyze the role insurance regulation plays in industry performance. For example,
Harrington and Danzon (2000) examine the effects of rate suppression in workers compensation
insurance on the propensity to implement loss control techniques. Harrington and Danzon (2000)
hypothesize that rate regulations, which prevent insurers from charging rates that reflect
4 Other studies that examine the impact of regulation in auto insurance markets specifically consider the role that regulation plays in loss costs. For example, Cummins, Weiss, and Philips (2001) examine the incentive effects that result from the presence of no-fault automobile insurance and provide theoretical evidence that no-fault is likely to lead to an increase in accidents. Cummins et al (2001) also perform an empirical analysis of the automobile insurance markets of all 50 states for the period 1982 – 1994 in which they control for the possible endogenous nature of no-fault laws. The empirical results of Cummins et al (2001) indicate that, compared to tort states, fatality rates are 5.5 to 9.9 percent higher in no-fault states and this result suggests that no-fault laws may impact loss costs. In another relevant study, Weiss, Tennyson and Regan (2010) examine the effects of automobile insurance rate regulation in the US for the period 1981 – 1998 and, similar to Cummins et al (2001), control for the potential endogenous nature of states’ regulatory selections. Weiss et al (2010) find that rate regulation, as well as measures of regulatory stringency, positively and significantly increase loss costs and claims frequencies in automobile insurance markets. The studies of Cummins et al (2001) and Weiss et al (2010) are particularly valuable to our work because they highlight another important way which regulation impacts insurance industry performance – increased loss costs.

8
expected loss costs, reduce the loss control incentives for employers, employees, and insurers.
Harrington and Danzon (2000) test their hypothesis using data from the National Council on
Compensation Insurance (NCCI) for the years 1984 – 1990 and find support for their hypothesis.
More specifically, Harrington and Danzon (2000) find a positive and significant relation between
loss growth and two separate lagged measures of rate suppression, indicating that workers
compensation insurance regulation led to increased loss costs form 1984 - 1990.5 In our study,
the Harrington and Danzon (2000) findings are important because they document another line of
business, outside of the automobile insurance market, where regulation leads to increased loss
costs.
The next section examines the structure of Florida’s homeowners insurance market as
well as its present state, and provides a descriptive comparative analysis of Florida’s market with
that of other Atlantic and Gulf coastal states. The examination is narrative, using available data
to build a case for caution in implementing market interventions.6
Evidence of Market Failures in Florida
This section includes information on the structure of the Florida residential property
insurance market and provides a descriptive evaluation of market performance, including
comparisons to the markets of nearby coastal states.
Market Structure
The Florida residential property insurance market structure has changed over time,
especially since Hurricane Andrew hit the coast in 1992. Today, it consists of a unique 5 The two measures of rate suppression used by Harrington and Danzon (2000) are: 1) filed rate increases versus approved rates increases and 2) residual market share. 6 Empirical analysis in this paper is limited to t-testing; future studies may enjoy sufficient data, and thus degrees of freedom for event analysis to be worthwhile.
9
combination of private and residual insurers grappling with increasing demand- and supply-side
economic pressures in the face of high-density development near high-risk coastlines.
Florida’s Primary Insurance Market Participants
The primary insurance tier of Florida’s residential property insurance market includes both
private (national insurers, national insurer subsidiaries specially designed for the Florida market,
independent insurers domiciled and specializing in Florida risk) and a state-run entity (Citizens).
The private market for primary insurance includes insurers admitted by the Florida Office of
Insurance Regulation (FLOIR) to compete in Florida for standard business as well as non-
admitted insurers selling only in the surplus lines. Data on the premiums collected and the
amount of exposure currently being insured in the surplus lines market are unavailable. The
current research focuses on admitted and residual market insurers and partitions the Florida
property insurance market into four segments of primary insurers.
Citizens Property Insurance Corporation (Citizens).Originally developed as a residual
market entity for Florida residential property, Citizens now insures more than 1.4 million
policyholders. This residual insurer is described more fully in a later section.
Florida domestic insurers (“domestics”).Florida-domiciled insurers who write primarily
Florida property insurance make a significant contribution to the supply of property insurance.
Many of these domestics commenced operations since Hurricane Andrew.
National company subsidiaries (“pups”).Florida-domiciled subsidiaries of national insurers
are focused solely on property insurance in Florida while still members of the parent’s insurance
group. The subsidiary structure allows national insurers to isolate the parent’s assets from
Florida’s catastrophic property exposure.

10
National insurers and others. These insurers are not Florida-based and do not fall in any of
the above categories. Most are traditional national insurers with a multi-line focus.
Florida’s private, admitted market collected approximately $6.2 billion in homeowners
insurance premiums in 2010. Citizens collected nearly $2 billion in residential property
premiums in 2010.
Florida’s Residual Insurance Market Participants
Residual markets exist to address government concerns about insurance availability and
many states have residual market mechanisms7. Since 1970, when the Florida Windstorm
Underwriting Association (FWUA) was enacted by the Florida Legislature to offer “wind only”
coverage in Monroe County and the Florida Keys, three entities have evolved with expressly
different purposes: Citizens Property Insurance Corporation, the Florida Hurricane Catastrophe
Fund and the Florida Insurance Guaranty Association. Each is briefly introduced here. 8
Citizens. After Hurricane Andrew in 1992, several Florida insurers became insolvent, and
others were concerned about increased insolvency risks. In a special session, The Florida
Legislature addressed the need for homeowners insurance policies that provided “full” (multi-
peril) coverage rather than wind-only policies offered by the FWUA by creating the Florida
Residential Property and Casualty Joint Underwriting Association (FRPCJUA) or (JUA). The
JUA was later combined with the residual market mechanism that insured commercial residential
(the Florida Property Casualty Joint Underwriting Association), creating Citizens Property
7 Residual markets are intended to offer basic insurance coverage for substandard risks at rates higher than those available for coverage of standard and preferred risks in the private insurance market but lower than the private market rates may indicate for the substandard risks. In property insurance, residual markets tend to have one of two purposes:1) FAIR plans (Fair Access to Insurance Requirements): provide insurance coverage in typically urban areas underserved by private insurers; and 2) Catastrophe-focused programs, such as wind plans, coastal plans, beach plans, earthquake funds and Citizens Insurance: provide property coverage (single or multi-peril) in catastrophe-prone areas. Several states have developed mechanisms to provide coverage specifically to property owners who reside on or near the coast and Appendix A provides information on the nature of these markets. 8 For a complete discussion of residual market mechanisms and their development in Florida see Florida Catastrophic Storm Risk Management Center (2011), Newman (2010) and Newman (2009).

11
Insurance Corporation (Citizens) effective August 1, 2002. Citizens has three distinct accounts:
the Personal Lines Account, the Commercial Lines Account, and the Coastal (formerly High-
Risk) Account. The Coastal Account consists of policies from the FWUA territories.
When any of these three accounts has a deficit, Citizens may levy assessments. These
assessments are not only against its policyholders but also against the policyholders of private
insurers in almost all lines of property casualty insurance.
The Florida Hurricane Catastrophe Fund (FHCF). Created by the Florida Legislature in
1993 to provide additional insurance capacity and help stabilize the property insurance market in
Florida (Fla. Stat. s. 215.555(1)), the FHCF provides reimbursement for a portion of a property
insurer’s hurricane losses above the amount retained by the insurers. Insurers enter into contracts
with the FHCF and pay a premium. The FHCF is able to accumulate premium payments on a
tax- free basis as it is exempt from federal income taxation. In the event that the FHCF’s losses
exceed its surplus, the FHCF is authorized to collect assessments on policyholders in almost all
lines of property casualty insurance. The amount of coverage available from the FHCF, the cost
of the coverage and the potential assessments are significant factors in the state of the insurance
market.
Florida Insurance Guaranty Association (FIGA). The FIGA was created by the Florida
Legislature in 1970 to address concerns about the adverse effects of insolvent insurers. Its
specific purpose is to “provide a mechanism for the payment of covered claims under certain
insurance policies to avoid excessive delay in payment and to avoid financial loss to claimants or
policyholders because of the insolvency of an insurer.” (Section 631.51(1), F.S.) FIGA does not
accumulate funds in advance of an insurer’s insolvency, but similar to Citizens and the FHCF

12
obtains funds through pro-rata assessments levied by the Office of Insurance Regulation on
companies subject to assessment.
Exposure
The exposure levels in Florida’s property insurance market have remained relatively
stagnant in recent years. As shown in Chart 1, the total number of residential policies demanded
by Florida’s market remained highly consistent at about 5.7 million between 2005Q4 and
2011Q2. According to Chart 2, insured exposure values decreased slightly over the last two
years, from $2.1 trillion in 2009Q2 to $2.0 trillion in 2011Q29, and population growth has
slowed significantly over the last few years coinciding with the drastic changes in the Florida
housing markets.10
[Insert Chart 1: Residential Property Insurance Policies in Force]
The housing depression in Florida has resulted in slack markets and only slow inflation in
replacement costs since 2007Q2. The path of statewide insured values is shown in Chart 2.
[Insert Chart 2: Trend in Florida Personal Residential Property Insured Values (2005-2011)]
The net rise since the Second Quarter of 2007 to just under $1.9 trillion in insured value
likely reflects insurer efforts to improve insurance-to-value (i.e., reduce the coinsurance
problem). Since the personal lines policy count has hovered near 5.7 million (plus or minus
100,000) in recent years, the increase in exposures is almost certainly due to increases in the
insured value of existing properties rather than population growth.11
9 From OIR QUASRng reports 2009Q2 and 2011Q2. 10 See University of Florida Study on Florida Population at http://www.bebr.ufl.edu/bebr-products/series/Florida%20County%20Population%20Projections. 11 It is important to remember that insurance provides replacement cost coverage on structures, so market value of property is not a good measure of exposure. While construction costs (and therefore replacement costs) vary, they do not necessarily move with housing market prices. The table in Appendix B shows that construction costs since

13
The State of the Florida Property Insurance Market
The number of carriers that choose to do business in the state, the structure of these
participants, their premium sales volume and their policyholders’ surplus are all important
elements of availability and capacity. This section explores the admitted, private homeowners
insurance market in the State of Florida according to these four aspects of the market, and
compares the market in Florida to the market for homeowners insurance nationally as well as in
other Atlantic and Gulf Coastal states. 12 Specifically, states selected for comparison are
Alabama, Georgia, Louisiana, Mississippi, North Carolina, South Carolina, Texas and Virginia
since these states face hurricane risk similar in nature to Florida’s, even if not to the same degree.
Performance data primarily are taken from the National Association of Insurance Commissioners
(NAIC) Annual Statements and the Florida Office of Insurance Regulation (FLOIR)’s Quarterly
Supplemental Reports (QUASR). The statistics and analysis here focus on statewide figures and
conclusions.
For comparison, Florida’s private homeowners insurance supply is segmented by company
structure type in two ways:
1) whether an insurance “decision center” behaves in the market as an independent company
or as a group interest; and
2008 have increased only slightly. This, combined with slow construction, implies exposure, as measured by replacement costs, has remained relatively stagnant during this time period. 12 Since information regarding the activity and performance of surplus lines insurers is not readily available, the discussion here focuses on admitted insurers in these states.

14
2) whether an insurer is a national carrier, a pup company (established by a national carrier
separate from its other non-Florida or non-Florida-property business), or a domestic
Florida company.
First, a common distinction in insurance is between independent (i.e., stand-alone)
companies and those insurance companies that are members of a group of insurers. In this
analysis all insurance companies that are members of a group (e.g., State Farm, Allstate,
Progressive) are considered to be a single entity or “decision center.” This is an attempt to
recognize that these companies may work in conjunction to achieve the group’s goal, rather than
competing as individual entities. Each independent company is considered its own decision
center. This allows for an apples-to-apples comparison across states since the definition of
independent and group companies will remain consistent across all states.
The second distinction between national carriers, pup companies and domestics is unique to
Florida. It is more reflective of the true Florida homeowners insurance market to evaluate
segment size by sorting according to the national, domestic and pup categories. Other states do
not have a sufficient number and size of domestic and pup companies to make such
categorization possible; these are important distinctions within Florida.13
Evidence of Market Failure: Market Composition and Capitalization
Three vital elements of the market’s health are the number of companies active in the
marketplace, their Direct Premiums Written (DPW) and Policyholder Surplus (PHS). Chart 3 and
13 The importance of these categorizations is related to the ability of a company to 1) raise capital and 2) diversify its business, and thus also its risks. These categorizations are notably different from the independent versus group manner of segmenting company structure type. Two examples of the difference are easily described. First, most group companies are considered national in scope, so the parallel between these two categories is close. All pups, however, are also considered group companies such that the national-to-group parallel is, at best, imprecise. Second, most domestics are set up as independent companies although, again, the parallel is imperfect. Some domestics are, in fact, group companies.
15
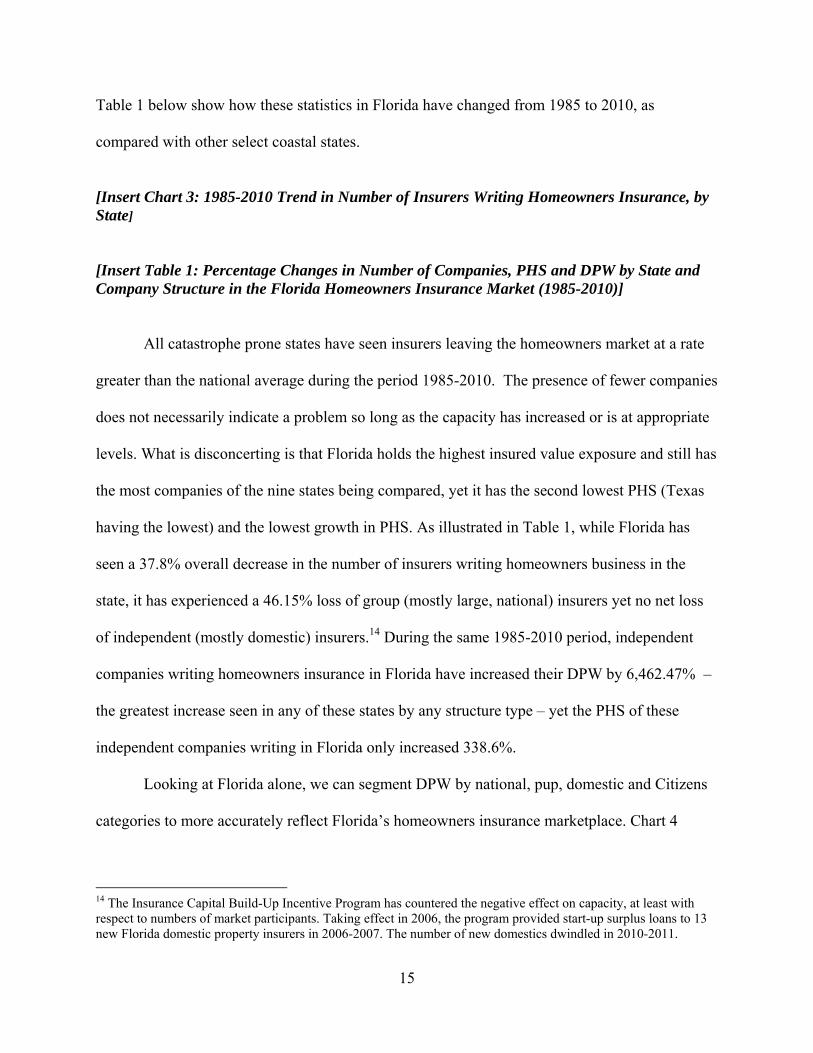
Table 1 below show how these statistics in Florida have changed from 1985 to 2010, as
compared with other select coastal states.
[Insert Chart 3: 1985-2010 Trend in Number of Insurers Writing Homeowners Insurance, by State] [Insert Table 1: Percentage Changes in Number of Companies, PHS and DPW by State and Company Structure in the Florida Homeowners Insurance Market (1985-2010)]
All catastrophe prone states have seen insurers leaving the homeowners market at a rate
greater than the national average during the period 1985-2010. The presence of fewer companies
does not necessarily indicate a problem so long as the capacity has increased or is at appropriate
levels. What is disconcerting is that Florida holds the highest insured value exposure and still has
the most companies of the nine states being compared, yet it has the second lowest PHS (Texas
having the lowest) and the lowest growth in PHS. As illustrated in Table 1, while Florida has
seen a 37.8% overall decrease in the number of insurers writing homeowners business in the
state, it has experienced a 46.15% loss of group (mostly large, national) insurers yet no net loss
of independent (mostly domestic) insurers.14 During the same 1985-2010 period, independent
companies writing homeowners insurance in Florida have increased their DPW by 6,462.47% –
the greatest increase seen in any of these states by any structure type – yet the PHS of these
independent companies writing in Florida only increased 338.6%.
Looking at Florida alone, we can segment DPW by national, pup, domestic and Citizens
categories to more accurately reflect Florida’s homeowners insurance marketplace. Chart 4
14 The Insurance Capital Build-Up Incentive Program has countered the negative effect on capacity, at least with respect to numbers of market participants. Taking effect in 2006, the program provided start-up surplus loans to 13 new Florida domestic property insurers in 2006-2007. The number of new domestics dwindled in 2010-2011.

16
displays the DPW in Florida for homeowners insurance policies, categorized by insurer type, for
the years 1985-2010.
[Insert Chart 4: Florida Homeowners Insurance Direct Premiums Written by Insurer Type, 1985-2010]
Chart 4 illustrates the substantial growth in Citizens, the domestic insurers and the pups
in recent years as the premium size of the national insurers in the Florida homeowners insurance
market has remained flat. This change in the composition of the marketplace is concerning since
national companies typically have more capacity to pay claims and write additional business than
do the other types of companies. Despite their large capacity, the large, national insurers have
chosen to limit their exposure to the Florida homeowners insurance market.
As of year-end 2010, there were 79 total private market decision centers writing
homeowners insurance in Florida, more than in any of the other coastal states used for
comparison. As indicated by Table 2 below, no other coastal state boasted more than 69 total
insurers writing homeowners insurance (Texas).15 Compared to the national total of 403, the
amount of competitive interest in the Florida market appears relatively high.
Segmenting the private marketplace into independent companies and group interests,
however, Table 2 reveals that the comparatively large supply of homeowners insurers doing
business in Florida is largely attributable to independent companies. Relative to the states
compared, independent insurers contribute significantly more to the total homeowners insurance
supply in Florida. The 23 independent insurers writing homeowners insurance business in
15 Florida’s count of 79 decision centers makes it a statistical outlier even among the states compared, at a 0.01 significance level.

17
Florida represent not only a higher absolute number than in any of the other states but also a
higher portion of the total number of decision centers in the state.16
[Insert Table 2: Number of Homeowners Insurance Decision Centers by State in 2010]
The high number of independent companies is an important statistic regarding the nature
of available homeowners insurance in Florida relative to other states and the nation. Generally,
group companies are larger and have a larger geographic reach than independents and, therefore,
tend not only to produce higher premium sales volume than their independent counterparts but
also achieve greater geographic diversity of their business risks. For Florida, this dependence on
independent insurers may create a level of constraint on capacity not observed in the other states.
Table 3 shows the number of insurers in each state whose business, as measured DPW, is
90% or higher concentrated within that state. Forty-seven companies doing business in Florida
had concentrated at least 90% of that business in Florida as of year-end 2010.17 It is notable that
all 23 of the independent companies operating in the Florida homeowners insurance market
concentrated at least 90% of their business in the 1) homeowners insurance line and 2) in
Florida. This lack of diversification in the Florida property insurance market indicates a capacity
disadvantage consistent with Stone (1973).
[Insert Table 3: Number of Companies with 90% or More of Total DPW in the State in 2010]
This concentration of business effectively requires an insurer to heavily reinsure the risk
taken to ensure solvency in the event of catastrophic losses. It is fair to say that each of the 23
16Florida domestic insurers represent slightly more than 29% of the total decision centers writing homeowners insurance in the State, significantly different from the mean (approximately 15.5%) of the compared states, at a 0.01 significance level. As additional information, Florida’s 23 independent companies represent more than 10% of the entire nation’s 203 independents. 17 Both in terms of raw number of companies and percentage of total, the concentration of business within the State among Florida homeowners insurers is significantly different from the other states examined, at a 0.01 significance level.

18
insurers conducting homeowners business independently in Florida are either highly sensitive to
reinsurance rate volatility, highly sensitive to one large loss event (or several smaller loss events
occurring within the same year), or both.
Table 4 displays the year-end 2010 DPW by company type for each state. Florida
comprises nearly 10% of the nation’s total DPW in homeowners insurance.
[Insert Table 4: Direct Premiums Written (DPW) in $ Millions for Homeowners Insurance by Structure Type and State in 2010]
Table 4 also indicates that Florida premiums are more heavily dependent on independent
insurer business than are the other states examined.18 Selling a quarter of the State’s DPW in
private homeowners insurance, Florida’s independent insurers are responsible for a substantial
portion of privately sold homeowners risk in the State. It is likewise notable that approximately
56% of Florida’s $6 billion in 2010 DPW for private market homeowners insurance is
attributable to Florida domestic companies ($3.37 billion in DPW), with pups and national
companies each representing approximately 22% of the market (at $1.31 billion and 1.33 billion
in DPW, respectively).19
The picture of policyholders’ surplus (PHS) in Table 5 reflects an especially
disconcerting difference between Florida and other states. Despite its relatively large market size,
Florida’s year-end 2010 PHS, at just under $95 billion, was lower than any of the other
hurricane-exposed states. And despite their one-quarter market share of premiums, independent
companies in Florida contributed only slightly more than one-tenth of the State’s total PHS, at
slightly over $985 million.20
18 Florida is statistically different at a 0.01 level of significance. 19 Bear in mind that while some domestic insurers are group companies, most are independent. 20 Policyholder surplus is used to support all operations, not just homeowners insurance in the state of Florida.

19
[Insert Table 5: Policyholders’ Surplus (PHS) in $ Billions by Structure Type and State in 2010]
If a more Florida-centric picture of PHS is drawn, segmenting companies by national,
domestic and pup types, the reason for concern regarding the capacity of the Florida market to
pay claims is more easily evident. Florida’s PHS of almost $95 billion in 2010 is largely
attributable to large, national insurers, representing more than $91.5 billion of the total PHS
available. Unfortunately, these national insurers are not heavily exposed in Florida relative to
their domestic and pup peers, who account for less than $1.5 billion and $2 billion in PHS,
respectively. The issue is more clearly evidenced in Charts 5 a-d below.
[Insert Charts 5 a-d: Frequency Histogram for Florida Private Homeowners Insurers’
Premium-to-Surplus Ratios
Looking at Chart 5(a), one sees nearly all Florida homeowners insurers enjoyed a
premium-surplus ratio of ≤ 1.0 in 1985 (well before Andrew hit), indicating a claims-paying
ability of at least $1 PHS to every $1 DPW. As of 1994 (two years post-Andrew),Chart 5(b)
shows the vast majority of insurers still held their premium-surplus ratios at or below 1.0, with
just a handful of companies potentially over-extending their capitalization. Chart 5(c) suggests a
turning point from 1994-2003 in the capitalization of Florida homeowners insurers as 22 insurers
saw their premium-surplus ratios above 1.0, and three companies experienced ratios in the 6.0 –
7.0 range. Such an abrupt change within a 10-year period may be attributable to two drivers: the
formation of Florida pups by national insurers; and the entrance of domestic insurers to the
Florida homeowners market. Between 1996 and 2000, Travelers, Allstate, State Farm and
Nationwide all formed pup companies, limiting the capital they placed at risk to underwrite
Florida homeowners. Plus, 23 domestic insurers started-up during the 1996-2003 timeframe,

20
several of which were arguably undercapitalized. Capitalization among Florida homeowners
insurers was even worse by 2010 after the 2004-2005 storm seasons depleted substantial PHS of
many insurers and regulatory-legislative interventions increased pricing pressures on all insurers.
By this time, thirty-two companies had ratios in excess of 1.0, two of them above 7.0.
The current picture of private homeowners insurance availability and capacity in Florida
describes a market with heavy dependence on small companies with limited capitalization and
risk diversification capabilities. Although Florida attracts a high number of insurers relative to
other coastal states, many of these insurers (more than in any other state) are independent, mostly
small domestic Florida companies. These independents make up one-fourth of Florida’s private
homeowners premium volume, and domestics (based on OIR’s QUASR data that includes both
the independent and group-based domestics) represent more than half the private insurance
premium at 56%.
Despite the high number of insurers and the relatively high total premium amounts sold
in Florida, the State’s private homeowners insurance market has the worst level of capitalization
(as measured by PHS) of any catastrophe-prone state other than Texas. Given the large number
of homeowners insurance companies concentrating most of their business in Florida and the
large Florida homeowners insurance premium base attributable to domestics having relatively
small stores of PHS, the existing level of capitalization may be insufficient should a major storm
hit Florida.
Evidence of Market Failure: Underwriting Profitability, Capitalization and Volume
Table 6 below displays the average loss ratio (losses and loss-adjustment expense as a
proportion of direct premiums earned) and the variability of these ratios for the private insurance

21
industry in each of the nine states across 1985-2010. Both the average loss ratio for Florida, as
well as its standard deviation, is the highest of the nine states.
[Insert Table 6: Average Loss Ratio, Standard Deviation and Coefficient of Variation by State
(1985-2010)]
The 97.31% average loss ratio indicates that Florida insurers needed 97.31% of the
premiums earned simply to pay losses and loss adjustment expenses, leaving less than 3% of
premiums available to cover all other business expenses.21 The 193.37% standard deviation
indicates an extremely high level of volatility within Florida’s loss ratio over the time period
examined. Therefore, within Florida, insurers not only experienced the worst performance of any
of these states but they have a measurable reason to have less confidence in the Florida market to
perform in a stable manner than any of the other states.
It is notable that in the years since the 2004-2005 storm seasons, the Florida private
homeowners insurance market has enjoyed relatively low loss ratios. Attributable to an absence
of major storms, Table 7 reveals the underwriting profitability of the overall market has
improved during this time.
[Insert Table 7: Loss Ratios (%) in the Private Homeowners Insurance Market from 2004-2010 by State]
The risk of a major storm, and the volatility of loss ratios resulting from these storms,
explains why, during such a period of seeming profitability, the Florida market’s DPW and PHS
have contracted and the composition of its participants has changed while losses stayed well
below total premium levels. Reserves held to pay for catastrophic losses – due to future events as
21 The average loss ratio is calculated as the average of the annual loss ratios for the years provided.

22
well as loss development from prior events22 deplete PHS and downward pressures on DPW (to
be discussed in detail in a later section) cause industry participants who can to divert capital from
the market to other markets that hold less volatility.
Evidence of Market Failure: Market Concentration
The changing composition of the Florida homeowners insurance marketplace during the
past 25 years, is evidenced in Chart 4 although the chart only indicates changing market share,
with no information about market concentration. In contrast, Chart 6 shows the Herfindahl
indices plotted over time for each state in the sample. The Herfindahl index is a measure of how
concentrated an industry is. Any marketplace where a few competitors hold most of the market
share will have a high Herfindahl index (high level of concentration), while a market with many
competitors, or relatively equal market share among competitors, will have a low Herfindahl
index (low concentration).23 As a general rule, a Herfindahl index below 0.1 signals low
concentration, while a Herfindahl index above 0.18 signals high concentration. Between 0.1 and
0.18 an industry is moderately concentrated.
[Insert Chart 6: Homeowners Insurance Market Concentration Levels by State, 1985-2010]
22 Property insurance claims have traditionally been considered short-tailed. Property claims associated with catastrophes may have generally longer tails than ordinary property claims since it takes more time to settle catastrophe claims because of the overwhelming nature of the catastrophe and the strain it puts on the claims process. Even with catastrophes, however, the amount of time it takes to settle property claims traditionally is relatively short compared with longer-tail lines of insurance. In Florida, the tail on property claims, especially catastrophe claims, has significantly increased in the last four years. Between March 2008 and June 2009, for example, Citizens opened or re-opened 14,997 catastrophe claims (7,299 new claims and 7,698 re-opened claims) related to the 2004-2005 storms. This represents approximately 5% of all Citizens claims related to those storms. This type of claims activity significantly lengthens the tail of the claims distribution and substantially impacts the loss costs associated with property insurance. 23 The Herfindahl index measures concentration as the sum of the squared market share of each firm in the industry. For example, consider an industry with six competitors, with respective market share of 30%, 20%, 20%, 10%, 10% and 10% the Herfindahl index will be (0.3*0.3) + (0.2*0.2) + (0.2*0.2) + (0.1*0.1) + (0.1*0.1) + (0.1*0.1) = 0.09 + 0.04 + 0.04 + 0.01+0.01 + 0.01 = 0.2.

23
At first glance, the Florida market appears to have a low market concentration relative to
other coastal states, hovering around 0.15 for the most recent years. Bear in mind that the data
being measured include only the private market. Since Citizens insures nearly 25% of the 5.7
million residential insurance policies in Florida, the true market has been more highly
concentrated since at least 2007 when Citizens was encouraged to compete with the private
marketplace for standard risk policies. Table 8 shows the growth in Citizens policy count from
end-of-year 2003 to September, 2011.
[Insert Table 8: Citizens Property Insurance Corporation Personal Residential Policy Counts]
As of September 2011, Citizens insured in excess of 1.4 million Florida personal
residential policies. Nearly 1 million of these policies were in the multi-peril Personal Lines
Account category, meaning they covered non-coastal properties and were not limited to
windstorm coverage only. Further evidence of the demand effect of price competition from
Citizens can be seen in Table 9, showing that Citizens is the primary writer of new insurance
policies in Florida. Indeed, Citizens’ total number of new policies is greater than the combined
total of the other 9 companies in the Top 10.
[Insert Table 9: Top 25 - New Policies Written]
A Note on Reinsurance Usage
Chart 7 indicates the percentage of risk retained by Florida homeowners insurers over the
time period 1985-2010.
[Insert Chart 7: Percentage of Direct Premiums Written Retained by Florida Homeowners Insurers (1985-2010)]

24
Immediately post-Andrew, Florida homeowners insurers decreased their usage of reinsurance,
commensurate with sharp increases in reinsurance rates-on-line (prices) during that time. Since
2007, however, insurers in Florida have held their risk retentions at around 40%, reinsuring the
remainder. Their ability to do so may, in large part, be aided by a lack of catastrophic storms
during 2007-2010, accompanied by softening reinsurance prices and the availability of FCHF
reinsurance. It can never be known whether catastrophic storms, and resultant higher reinsurance
prices, might have resulted in company decisions to increase their retentions once again.
Market Summary
As of the end of 2010, Citizens wrote 50% of Florida’s dwelling/fire coverage, 85% of
Allied Lines coverage (where wind-only policies reside) and 15% of Regular Homeowners
coverage. It writes a combined total of 23% of Florida’s personal residential marketplace, not
including mobile homes. Citizens now insures more than 1.4 million policyholders (a 42%
increase since December 2009) and is adding 3,000 to 5,000 new policyholders each week.
Meanwhile, the private portion of the market has shifted from one dominated by large
national insurers, whether utilizing Florida subsidiaries (pups) or not, to a fragmented market
dominated by smaller Florida-based insurers (domestics). Domestic insurers’ premium market
share has increased from 30% at year-end 2005 to 46% at year-end 2010, while the national
insurers and pups have reduced their exposure from 52% to 30% of the premium base. The
current picture of private homeowners insurance availability in Florida illustrates a market with
heavy dependence on small, start-up companies generally having limited capitalization and risk
diversification capabilities. The relatively low PHS and high concentration of business within
Florida’s private market for homeowners insurance effectively requires heavy dependence on

25
reinsurance of the risk taken to ensure both claims-paying capacity and future solvency in the
event of catastrophic losses.
The evidence from the observed data points to multiple areas of market failure, indicating
a market composed largely of undiversified young companies and the residual insurer, both in
terms of number of companies and business volume (DPW), with increased solvency constraints
(restrictions on rate ceilings) and decreased capitalization (PHS). The efficiency of the primary
market’s ability to respond to changes in the reinsurance market really cannot be known since
inexpensive reinsurance has been made available through government policy (via the FHCF) ,
stabilizing and fortifying what might otherwise be a primary market heavily dependent on
volatile reinsurance rates on line.
Factors Leading to Florida’s Property Insurance Market Failures
The story of Florida’s recent property insurance market failures is a narrative of market
problems, followed by government responses that resulted in negative externalities. The purpose
of this section is to connect this narrative to the evidence related to market failures revealed in
the prior sections.
Market Problems
Exposure to tropical storms is the primary driver of property loss costs, and thus property
insurance rates, in the State of Florida. The three major ways in which the exposure poses market
problems are through under-investment in mitigation, informational problems in the estimation
of loss costs and the market power of the reinsurance market. We established in the review of
prior research that individuals may treat insurance and mitigation efforts as substitutes.
Uncertainty regarding storm loss costs stems from multiple sources: the dependence on

26
(inherently sensitive) loss models; the difficult-to-model loss impacts of demand surge; and the
imperfect information regarding mitigation features of insured properties. The availability and
pricing of reinsurance and other catastrophe capital create another challenge for the property
insurance industry in Florida. Volatility in insurance rates over the last decade, including a
relatively high 15% increase occurring between year-end 2005 and 2007, primarily are due to
increased reinsurance rates on line following the busy 2004-2005 storm season.24
Under-investment in Mitigation
Evidence indicates that proper mitigation against hurricanes does indeed result in risk
reduction. For instance, Fronstin and Holtman (1994) find that older homes suffered
proportionally less damage than newer homes as a result of Hurricane Andrew. Additionally,
research conducted by Risk Management Solutions (RMS), following the 2004 and 2005
hurricanes in Florida, demonstrates that lower losses were suffered by structures built in
compliance with the most up-to-date building codes.25 Substantial evidence indicates that
mitigation increases the value of the home, decreases expected losses, and decreases the burden
placed on the public in the event of a catastrophic event (Kleindorfer and Kunreuther, 1999a,
1999b). Fronstin and Holtman (1994), however, reviewing the damage following Andrew, find
that “… consumers have substituted homeowners insurance for structurally sound homes that are
built to withstand hurricanes.” The State of Florida recognizes the problem and since Andrew
has commissioned multiple task forces, working groups and studies to attempt to address the
24 Guy Carpenter (2009). 25 Risk Management Solutions (2009), page 5.

27
problem.26 Policy and industry studies have indicated repeatedly that cost is the primary reason
Florida property owners provide for why they do not engage in structural mitigation27
Catastrophe Models
Because of the nature of the hurricane peril in particular (i.e., frequency, intensity and
correlation of exposures), traditional estimation methods have been replaced largely in Florida
by catastrophe models (Nyce and Maroney, 2010).28 The role of model verification and data
credibility/reliability become critical as questions about predictive analytics and granularity are
increasingly asked. It is important to note, for instance, that even seemingly small differences in
model input parameters and their values (many of which are assumptions largely based on
differences in expert opinion) can result in widely different model outputs. Thus, the models can
be quite sensitive. Indeed, the variation across models (Cole, McCullough and Macpherson,
2010; Rollins, 2011) and the volatility found from one version to the next (Rollins, 2011) are
problematic.
Demand Surge
Separate from uncertainty around the estimates of storm frequency, intensity and
structural vulnerability, demand surge can increase loss costs once a windstorm occurs. Demand
surge is defined by the Actuarial Standards Board as “a sudden and usually temporary increase in
the cost of materials, services, and labor due to the increased demand for them following a
catastrophe.” However, Olsen and Porter (2011) note that there is “no consensus on what specific
material and labor costs contribute to demand surge.” The most common way of quantifying
26 Florida Catastrophic Storm Risk Management Center (2010a, 2010b). 27 See Peacock (2003), International Hurricane Research Center (2004), Florida Catastrophic Storm Risk Management Center (2010a, 2010b) and Medders (2011). 28 Although catastrophe models can generate AALs at the property level, rating plans filed by insurers (in Florida and other states) still rely on territorial rating for homeowners and wind-only property coverage. The potential for switching to property-level rate making exists, but consideration of such a granular approach raises a number of questions as to the appropriate role of the catastrophe models in setting wind rates.

28
demand surge is through catastrophe models that increase the calculated first-dollar losses by
some demand surge multiplier. Olsen and Porter (2011) note that the multiplier is typically
between 1.0 and 1.6, which is a significant range. In other words, losses could be up to 60%
greater than what was modeled solely based on demand surge. There has been some research
attempting to quantify demand surge in recent disasters. Hallegatte (2008) found a 13% cost of
demand surge following Katrina in Louisiana.
Unknown Mitigation Features
A crucial element in estimation of windstorm loss costs is the identification of property
features important in determining the amount of damage a structure will sustain during a
windstorm. These features can be related to construction (e.g., roof shape), maintenance (e.g.,
age and condition of the roof covering) or site (e.g., terrain). These relevant property features can
be risk (and thus loss cost) reducing, and ideally are included in insurance ratings. Information
regarding the existence of (or need for) mitigation features must be known for catastrophe
models and insurers to incorporate them in the estimation of loss costs. While some of these
features can be drawn from public records and building schematics, many cannot. And even the
information available publicly may be incorrect or outdated. The most reliable method of
verification is physical inspection; time and labor intensive, this mechanism adds substantial
costs to the property insurance marketplace.
Reinsurance
Reinsurers are the primary link between Florida property insurance companies and the
broader capital markets that may be interested in making capital investments in the catastrophe
risk market. The reliance on reinsurance impacts rates and premiums in Florida in two ways.
First, reinsurers can set risk-based rates using their choice of catastrophe models, while primary

29
companies are restricted to using only one model from the list approved by the Florida
Commission on Hurricane Loss Projection Methodology (Commission). Given the models used
by reinsurers may be outside the list of those approved by the Commission and they may be
blended, or weighted, significantly different rate indications may result than from those used by
Florida primary property insurers. Second, as the link between Florida windstorm risk and the
capital markets, reinsurers are the best indicator of the cost of capital needed to entice investors
to Florida’s catastrophe risk market. Because this cost of capital is dependent on market
conditions and other investment opportunities to which investors have access, it can fluctuate
widely and have significant impact on rates, premiums, and private market insurance stability in
Florida.
Other Market Problems
Although the windstorm problem is Florida’s greatest homeowners insurance challenge,
Florida is not without non-windstorm problems. Two insurance coverage issues in particular are
notable for exacerbating the market problems already discussed. Citizens’ standard of providing
residual market coverage at high limits on an all-risks basis and the sinkhole and subsidence
coverage unique to the state are both discussed below.
Citizens’ coverage standard. The insured value of property in the state of Florida has
been estimated to be over $3 trillion dollars with 79% or $2.5 trillion being coastal property. The
only state that approaches the coastal insured value of Florida is New York with around $2.4
trillion in coastal exposure.29 Contributing significantly to insured values is the fact that Citizens,
the residual property primary insurer, offers the same depth and breadth of coverages as do the
primary insurers in the private market. The standard is a HO-3 contract with a maximum policy
limit of $1 million for Coverage A (structure) alone, meaning that the claims settlement values in 29 AIR Worldwide, 2008.

30
the event of a total loss (i.e., after paying for losses to other structures, contents and additional
expenses) effectively can be much higher than the nominal $1 million.30 Citizens does not
differentiate between the voluntary and residual market policies in provision of this all-risks,
replacement cost value coverage; all insured properties are covered to this standard. This runs
counter to the usual practices found in other residual markets and counter to mitigation
incentives.31
Sinkhole and subsidence coverage. Florida is the only state in the nation that requires
insurers to provide coverage for property losses related to sinkholes and subsidence. In other
states, all-risks insurance policy wording specifically excludes sinkholes and subsidence from
coverage, even within the residual market. In 2010, Citizens earned approximately $32 million in
sinkhole premium and is expecting to pay out approximately $245 million in losses and loss
related expenses ($19.6 million and $84 million respectively in 2009).32 Furthermore, there is
evidence the significant increase in sinkhole claims is at least partially due to policyholder
incentivizes to file claims because they can keep the cash proceeds from the claim instead of
effectuating repairs to their home or remediating the land.33
Government Intervention and Negative Market Externalities
Often, government intervention is used to ease market problems, such as the ones
described here. Such intervention in the insurance market can make economic and social sense
30 The maximum Citizens policy limit was reduced from $2 million, effective February 1, 2012. 31 Dionne and Harrington (1992), Kunreuther et al (2009). 32 Private insurers have seen their sinkhole claims and costs rise by double and triple-digit percentages over the past several years. According to the OIR Data Call report, the total reported sinkhole claims increased from 2,360 in 2006 to 6,694 in 2010. Over that time period, there were 24,671 total sinkhole claims for approximately $1.4 billion. 33 See Florida Catastrophic Storm Risk Management Center (2011) for a more thorough discussion of the problem. During the 2011 Florida Legislative Session, legislation specifically designed to address sinkhole insurance issues passed. It is too early to quantify the effects of SB408 on sinkhole loss trends. While it is likely safe to assume that the changes effected by SB408 will reduce sinkhole claims, the magnitude of the reduction is difficult to quantify.

31
when planned and implemented in ways that improve industry solvency, market conduct and/or
incentivize an increased private supply of capital. In Florida’s residential property insurance
market, however, a focus on price-reducing legislation and regulation has led to increased
solvency constraints and negative first-order effects on private industry capacity. Such legislation
and regulatory actions impacting Florida’s property insurance market create significant
uncertainty to private insurers and add to the cost of doing business in Florida. Appendix C
shows the timeline of major legislative and regulatory changes in Florida’s residential property
insurance market since 1970. The focus in this section is on the specific implemented legislation
and regulation that have resulted in negative market externalities leading to market failures. We
contend two state government policies in particular – House Bill 1A and the Windstorm
Mitigation Discount program – are the primary, direct drivers of the failures noted earlier.34
House Bill 1A and Subsequent “Glidepath” Legislation
House Bill 1A (HB1A), passed in the 2007 Session of the Florida Legislature, rolled back
Citizens rates, froze rates going forward, allowed policyholders to purchase Citizens policies
without first being rejected by the admitted market and expanded the capacity of the FHCF.35 By
the time of the 2009 Legislative Session, Florida lawmakers effectively began a slow reversal of
pivotal parts of HB1A, setting Citizens on a gradual “glidepath” to higher rates, effective 2010.36
Despite its intent to reverse the premium-reducing policies of 2006-2007, this legislation limited
34 The Florida Catastrophic Storm Risk Management Center, in its State of Florida’s Property Insurance Market (2011) provides a thorough treatment of these, and preceding, state government policies impacting the market for property insurance in Florida. 35 Prior to HB1A a policyholder had to be rejected in the private market or show that admitted insurers were charging 25% more or higher than Citizens to be eligible for Citizens coverage. HB1A removed the requirement that a policyholder must be rejected by the private admitted insurance market to be eligible for Citizens coverage. After the passage of HB1A, the minimum premium difference requirement for Citizens eligibility was reduced from 25% to 15%. 36 It is important to note, however, that Citizens’ 2011 rate filing had a greater than 10% rate indication from 2010. In other words, the glidepath may not be enough to allow for year over year rate indications let alone allowing Citizens to “catch-up” on underpriced properties.

32
premium increases on any individual Citizens policy to 10% per year, a restriction that is
estimated to keep rates actuarially inadequate for at least five years.
Windstorm Mitigation Discount Program
Originally intended, at least in part, to incentivize mitigation, Florida’s Wind Mitigation
Discounts (credits) and the My Safe Florida Home policies became premium-reduction
programs.37 Since 1993, the Florida Legislature has required residential property insurers to
include appropriate discounts, credits, or other rate differentials (or appropriate reductions in
deductibles) for properties on which fixtures have been installed that are actuarially
demonstrated to reduce the amount of loss in a windstorm. Since 2000, the discounts, credits, or
other rate differentials, or appropriate reductions in deductibles must be “actuarially reasonable.”
In 2003, the FLOIR effectively determined that the program would operate strategically as a
premium-reduction policy when it made the weakest structure the base house for adjusting base
rates for loss relativities.38 Using the weakest house as the base for mitigation credits, the results
of applying mitigation rate differentials were premium neutral or resulted in premium decreases,
not premium increases. Credits were tempered by 50% initially. The mitigation credit structure
was 100% implemented in 2006-2007 without allowing insurers to adjust their base rates to
37 Indeed, the My Safe Florida Home 2007 Annual Report (http://edocs.dlis.state.fl.us/fldocs/dfs/disaster/safehome/ar/2007.pdf) stated the program’s goals were to: “1. Help Floridians better protect their property and assets. 2. Help Floridians save money on their insurance premiums. 3. Promote public education and awareness of the financial and safety benefits of mitigation.” 38 This was accomplished by rescaling results of an Applied Research Associates mitigation credit study from the average structure being the base house to the weakest structure being the base house, thus ensuring that most inspected homes can be eligible for a mitigation credit, and being a worse than average risk results in no surcharges. See Florida Catastrophic Storm Risk Management Center (2010b, 2011).

33
reflect the weakest structure as the base house. (Insurers typically use the average house as their
base structure to compute their base rates.)
The rate effect of these legislative and regulatory actions on the private property insurance
market was immediate and significant. Homeowners insurance rates in the admitted market
declined in 2007 below year-end 2005 levels, and still remain more than 12% below that baseline
on a statewide average basis. Rate levels for domestic companies and Citizens are generally even
farther below the 2007 baseline. Premium base erosion combined with growing or even stagnant
insured values implies significant erosion in the statewide average rate level, as shown in Chart
8.
[Insert Chart 8: Trend in Florida Personal Residential Property Insurance Rate Levels (2005-2011)]
During the MSFH program period, 401,372 free home inspections were conducted at a
total cost to the State of nearly $58.5 million. Only 33,547 of these homes were retrofitted as a
result of the program (at a total cost to the State of approximately $111.2 million and $3,317, on
average, per home).39 According to the MSFH Annual Reports, an estimated 55 percent of the
homes awarded mitigation credits stemming from the MSFH program were “eligible for
insurance savings without making a single improvement” (i.e., no improvement in fortification
of the home from what existed before the MSFH program).40
39 DFS reimbursed 24,486 in grants to homeowners while 525 were direct pay grants issued to low income homeowners. Some 6,203 grants were issued through non-profit partnerships and local government partnerships issued 2,333 grants. See Florida Catastrophic Storm Risk Management Center (2010a). 40 See the My Safe Florida Home 2008 Annual Report and McChristian (2009). Even more disconcerting, testimony received in the public hearings conducted by the Florida Commission on Hurricane Loss Projection Methodology indicates extremely high error rates on the Florida OIR 1802 (mitigation inspection) forms. The Florida Association of Insurance Agents presented error rates as high as 55-80% depending on the region of the state. AmeriPro Inspection Corporation reported error rates between 68 and 78%. See “Windstorm Mitigation Discounts Report,” Florida Commission on Hurricane Loss Projection Methodology, February 1, 2010.

34
The Mitigation Discounts program continues, although the MSFH program ended in mid-
2009. We cannot state with certainty that homeowners are dis-incented to mitigate under this
program; we can, however, observe insurer behavior as a guide to what the industry believes.
One area of evidence lies within the Citizens take-out policies. The Legislature has charged the
FLOIR with the task to help Citizens reduce (depopulate) its homeowners insurance policy count
over time. An admitted Florida insurer can apply to be a “take-out company,” meaning it can
submit a proposal to take away homeowners policies of its choosing from Citizens if the
company is approved by the FLOIR to participate in the take-out program. Interestingly, only
eight insurers currently participate in the program. And the anecdotal evidence indicates that
across all eight companies, there is a preference to take out un-inspected homes. If this is true,
that is a strong indication insurers either do not: think that inspected homes earning mitigation
credits against their wind premiums constitute premiums adequate to sustain a profitable book of
business; trust that the inspection is correct; or both. In other words, it would indicate that
insurers view the inspections as resulting in excessive or unwarranted credits.41
The volatility of the rate level – the key factor determining financial profitability for
insurers – is worth noting. Rates rose approximately 15% statewide in 2006, while insured values
rose nearly twice that percentage. Rates then declined precipitously, stabilizing well below year-
end 2005 levels in almost every region of the state. 42 Since that time, average rate levels have
remained below year-end 2005 levels in nearly every region of the state.
41 This potential problem of skewed take-out demand can be considered a negative externality on its own; since the evidence is merely anecdotal thus far, the authors do not go so far as to assert the externality exists. Regardless, the issue is of interest, and needs scrutiny. 42 The only notable exception is Tampa Bay; the most severely impacted include the Keys and Southeast regions. Source: FLOIR QUASR data, 2010-2011.

35
Externality 1: Non-risk-based rates and cross subsidies among property insurance
policyholders43
Florida, like many catastrophe-prone states, hosts multiple types of subsidies within its
risk financing system. These can be seen both in pre-loss and post-loss financing. Despite the use
of catastrophe models by insurers, rate and premium differentials that are still based on wide
(zip-code level) territories can result in a failure to capture the precise risk base in the insurance
rate. Thus, two homeowners’ insurance policies within the same pricing territory can be charged
the same insurance rate despite one having a higher risk of loss. Further, the implementation of
mitigation premium credits, if actuarially unbalanced such that no risk premiums are increased,
may create rate subsidies among houses on the same street.
Externality 2: Cost shifting from current homeowners insurance policyholders to future
policyholders and policyholders in other lines of business44
Post-loss financing can create subsidies depending on the structure of post-loss
assessments. If assessments are not purely risk based, it is possible that lower-risk policyholders
pay larger post-loss assessments relative to their exposure than do higher-risk policyholders. In
particular, assessments levied as a flat percentage of total premiums (such as Florida’s FHCF,
Citizens, and FIGA assessments) propagate the same relative degree of subsidy that exists in the
up-front premiums among risks. Additional assessments are levied on most lines of property-
casualty insurance. Subsidies may not be restricted to differences in hurricane risk. They also
may result from timing in the sense that new policyholders, while required to pay assessments
for the prior losses of other homeowners, did not receive the benefit of below-market rates prior
to the catastrophe. This outcome is dangerous for an economy dependent largely on net
43 Florida Catastrophic Storm Risk Management Center (2009). 44 See Cole, Macpherson, Maroney, McCullough, Newman and Nyce (2011) for a detailed treatment of the subsidies across insurance lines and across time that are embedded within the state’s post-loss assessment system.

36
migration to the state. Finally, subsidies may exist between the private and state-run entities,
since the residual market mechanisms may be able to assess both their policyholders as well as
policyholders in the private market.
Externality 3: Mitigation disincentives
We established in the discussion of prior research that mitigation can be a substitute for
insurance. We also established that a major property insurance market problem in the State of
Florida has been under-investment in risk-reduction efforts. Rather than reducing the market
problem of under-investment in mitigation, the joint effect of the implementation of the two
mitigation policy efforts discussed here appears to be the opposite. The Florida Catastrophic
Storm Risk Management Center (2010b) and the Florida Commission on Hurricane Loss
Projection Methodology (2010) provide ample anecdotal evidence that the programs, via
exaggerated insurance discounts for existing mitigation features, actually discouraged further
expenditure on mitigation efforts for most Florida homeowners. Carson, McCullough and Pooser
(2012) find that the insurance subsidies within the Florida property insurance market are
correlated with statistically significant reductions in mitigation practices.
Conclusions and Avenues for Future Research
Florida provides lessons for states around the nation as policy makers struggle with the
task of making financial preparations for the likelihood of catastrophic events. As the only state
that requires catastrophe models (simulation-based modeling of hurricanes) be used to price
residential property insurance, Florida is ahead of its U.S. peers in developing a financial market
for catastrophes based on a forward-looking view of the risk. At the same time, legislative and
regulatory interventions in the Florida insurance and reinsurance markets have resulted in
externalities, such as suppressed property insurance prices, cost shifting from one policyholder to

37
another (via non-risk-based pricing) and from current to future policyholders (via a system of
assessments), and disincentives for homeowners to engage in mitigation activities.
Since the implementation of the rate rollbacks and mitigation credits in 2006 and 2007, the
claims-paying ability (PHS) of Florida’s homeowners insurers has declined as large, well-
capitalized (and diversified) insurers exit the market, being replaced by small, domestic (many of
which are monoline) homeowners insurers and the residual insurer (Citizens). Market stability
today is contingent on two factors: the continued ability to purchase inexpensive reinsurance
from the state’s “reinsurance” entity (FHCF); and suffering no major storms. The authors
contend the legislative and regulatory interventions in recent years are directly responsible for
these market failures despite their likely good intentions of protecting the public good. And
although recent legislative activity has begun to reverse the trajectory of rates and the population
of Citizens, these efforts may not be enough to repair the market before the next major storm.
Additional avenues of research are warranted. Empirical examination of capitalization by
company and company type is important to understanding more thoroughly the transition the
Florida homeowners insurance market has made in a short period of time. A study of the
relationship between 1) rates and 2) company diversification and capacity (e.g., number of
companies, capitalization) is needed. Empirical analysis of the precise correlation between the
mitigation credits (discounts) program and actual mitigation performed is critical information for
use by policy makers as they design future incentives programs for policyholders and
homeowners. Furthermore, although Florida’s capacity to “pay for the big one” has been subject
to much scrutiny in recent years, the national market has not been studied as closely. Updated
studies of the adequacy of insurance market capacity nationally to pay for either an extreme
event or multiple events experienced close together are needed.

38

39
References
AIR Worldwide (2008) The Coastline at Risk: 2008 Update to the Estimated Insured Value of US Coastal Properties, Boston, Massachusetts <http://www.air-worldwide.com/_public/images/pdf/AIR2008_Coastline_at_Risk.pdf > Arrow, Kenneth J. (1971) Essays in the Theory of Risk Bearing, Markham Publishing Co.: Chicago Carson, James M. Kathleen A. McCullough, and David M. Pooser (2010) “Deciding Whether to Invest in Mitigation Measures: Evidence from Florida” Journal of Risk and Insurance, Forthcoming Christoplos, Ian, John Mitchell and Anna Liljelund (2001) “Re-framing risk: The Changing Context of Disaster Mitigation and Preparedness” Disasters, 25(3) Cole, Cassandra, David Macpherson and Kathleen McCullough (2010) “Comparison of Hurricane Loss Models” (2010) Journal of Insurance Issues, Spring
Cole, Cassandra R., David A. Macpherson, Patrick F. Maroney, Kathleen A. McCullough, James W. (Jay) Newman, Jr. and Charles Nyce (2011) “The Use of Postloss Financing of Catastrophic Risk” Risk Management and Insurance Review, 14(2): 265-298
Cummins, J. David, Mary A. Weiss and Richard D. Phillips (2001) “Incentive Effects of No Fault Automobile Insurance” Journal of Law and Economics, 44: 427 – 464 Cummins, J. David, Neil Doherty and Anita Lo (2002) “Can Insurers Pay for the Big One? Measuring the Capacity of the Insurance Market to Respond to Catastrophic Losses” Journal of Banking and Finance 26: 557 – 583 Dionne, G. and L. Eeckhoudt (1985) “Self-insurance, Self-protection and Increased Risk Aversion” Economic Letters, 17, pp. 39-42
Dionne, Georges and Scott Harrington, Editors (1992) Foundations of Insurance Economics, Kluwer, Boston Doherty, Neil A (1980) “A Portfolio Theory of Insurance Capacity” Journal of Risk and Insurance 47(3): 405 – 420 Doherty, Neil A (1983) “The Measurement of Firm and Market Capacity” Journal of Risk and Insurance 50(2): 224 – 234 Doherty, Neil A and James R. Garven (1995) “Insurance Cycles: Interest Rates and the Capacity Constraint Model” The Journal of Business 68(3): 383 – 404 Dumm, Randy E. Andre P. Liebenberg, Ivonne A. Liebenberg and Joseph Ruhland (2010) “Market Reaction to Regulatory Capture and Political Risk in a Highly-Salient Environment” Journal of Insurance Regulation, 29(6): 141 – 167

40
Ehrlich, I. and G. Becker (1972) “Market Insurance, Self-insurance and Self-protection” Journal of Political Economy, 80, pp. 623-648 Florida Catastrophic Storm Risk Management Center (2009) “Pre-loss Subsidies in the Florida Insurance Market” White paper, The Florida State University, Tallahassee, Florida
Florida Catastrophic Storm Risk Management Center (2010a) Hurricane Mitigation Inspection System Study: Final Report, The Florida State University, Tallahassee, Florida, Submitted to the Florida Department of Financial Services Florida Catastrophic Storm Risk Management Center (2010b) Mitigation Credit Study: Final Report, The Florida State University, Tallahassee, Florida, Submitted to the Florida Department of Financial Services Florida Catastrophic Storm Risk Management Center (2011) The State of Florida’s Property Insurance Market, The Florida State University, Tallahassee, Florida, Submitted to the Florida State Legislature Florida Commission on Hurricane Loss Projection Methodology (2010) Wind Mitigation Discounts Report, The Florida State Board of Administration, Tallahassee, Florida, Submitted to the Governor’s Cabinet Fronstin and Holtman (1994) “The Determinants of Residential Property Damage Caused by Hurricane Andrew. Southern Economic Journal, 61: 387–397 Grabowski, Henry, W. Kip Viscusi and William N. Evans (1989) “Price and Availability Tradeoffs of Automobile Insurance Regulation” Journal of Risk and Insurance, 56(2): 275 – 299 Grace, Martin, Robert W. Klein and Paul R. Kleindorfer (1999) “The Supply of Catastrophe Insurance under Regulatory Constraint” Working Paper, Wharton Managing Catastrophic Risks Project, December Grace, Martin F. and Robert W. Klein (2009) “The Perfect Storm: Hurricanes, Insurance and Regulation” Risk Management and Insurance Review, 12(1): 81-124 Greenwald, Bruce C. and Joseph E. Stiglitz (1990) “Asymmetric Information and the New Theory of the Firm: Financial Constraints and Risk Behavior” American Economic Review, 80: 106-165. Gron, Anne (1994) “Capacity Constraint in Property-Casualty Insurance Markets” The RAND Journal of Economics 25(1): 110 – 127 Guy Carpenter and Company, LLC (2009) World Catastrophe Reinsurance Market 2008 Hallegatte, S. (2008) “An Adaptive Regional Input-Output Model and its Application to the

41
Assessment of the Economic Cost of Katrina” Risk Analysis, 28(3). Harrington, Scott E. and Helen I. Doerpinghaus (1993) “The Economics and Politics of Automobile Insurance Rate Classification” Journal of Risk and Insurance, 60(1): 59 – 84 Harrington, Scott E. and Patricia M. Danzon (2000) “Rate Regulation, Safety Incentives, and Loss Growth in Workers’ Compensation Insurance” Journal of Business, 73(4): 569 – 595 Herring, Richard J. and Prashant Vankudre (1987) “Growth Opportunities and Risk-Taking by Financial Intermediaries” The Journal of Finance, 42(3): 583-599 Hiebert, L. D. (1989) “Optimal Loss-reduction and Increases in Risk Aversion” Journal of Risk and Insurance, 56, pp. 300-305 International Hurricane Research Center (2004) Hurricane Loss Reduction for Housing in Florida: Final Report to the Florida Department of Community Affairs, Florida International University Kaplow (1991) “Incentives and Government Relief for Risk” Journal of Risk and Uncertainty, 4, pp. 167-175 Kelly, Mary and Anne E. Kleffner (2003) “Optimal Loss Mitigation and Contract Design” The Journal of Risk and Insurance, 70(1), pp. 53-72 Kleffner, Anne E. and Mary Kelly (2001) “The Impact of Insurance on the Level of Optimal Loss Mitigation” Northwest Journal of Business and Economics, pp. 29-42 Klein, Robert W. (1998) “Regulation and Catastrophe Insurance” in Howard Kunreuther and Richard Roth, Sr., Editors, Paying the Price: The Status and Role of Insurance Against Natural Disasters in the United States, Joseph Henry Press, Washington, D.C., 171-208. Klein, Robert W. and Paul R. Kleindorfer (2003) “Regulation and Markets for Catastrophe Insurance” in Murat R. Sertel and Semih Koray, Editors, Advances in Economic Design, Springer-Verlag, Berlin Kleindorfer, Paul R. and Howard Kunreuther (1999a) “Challenges Facing the Insurance Industry in Managing Catastrophic Risks” in Kenneth Froot, Editors, The Financing of Catastrophe Risks, University of Chicago Press, Chicago Kleindorfer, Paul R. and Howard Kunreuther (1999b) “The Complementary Roles of Mitigation and Insurance in Managing Catastrophic Risks” Risk Analysis, Vol. 19, No. 4, 1999 Kleindorfer, Paul R. and Sertel, Murat R., Editors (2001) Mitigation and Financing of Catastrophe Risks: Turkish and International Perspectives, Kluwer, Doordrecht Kunreuther, Howard et al. (1978) Disaster Insurance Protection: Public Policy Lessons, New York: Wiley Press

42
Kunreuther, Howard and Anne E. Kleffner (1992) “Should Earthquake Mitigation Measures be Voluntary or Required?” Journal of Regulatory Economics 4: 321-333 Kunreuther, Howard (1996) “Mitigating Disaster Losses through Insurance” Journal of Risk and Uncertainty 12: 171-187 Kunreuther, Howard (1998) “The Role of Insurance in Dealing With Catastrophic Risks from Natural Disasters” in Robert W. Klein, editor, Alternative Approaches to Insurance Regulation, National Association of Insurance Commissioners, Kansas City, MO Kunreuther, Howard and Richard Roth, Sr. (1998) The Status and Role of Insurance Against Natural Disasters in the United States, Joseph Henry Press, Washington, D.C. Kunreuther, Howard and Mark Pauly (2006) Insurance Decision Making and Market Behavior Now Publishers Kunreuther, Howard and Erwann O. Michel-Kerjan, with Neil A. Doherty, Martin F. Grace, Robert W. Klein and Mark V. Pauly (2009) At War with the Weather: Managing Large-Scale Risks in a New Era of Catastrophes MIT Press, Cambridge, MA McChristian, Lynne (2009) “Mitigation Discounts – Are They ‘On the Money’?” Florida Underwriter September: 14 Medders, Lorilee (2011) “Improving the Affordability of Property Mitigation: Innovative Ideas from the Energy Sector” CPCU eJournal, 64(8) Meier, Kenneth J. (1991) “The Politics of Insurance Regulation” Journal of Risk and Insurance, 58(4): 700 – 713 Newman, James (Jay) W. (2009) “Residual Market Subsidies in Florida’s Property Insurance Market” White paper, Florida Catastrophic Storm Risk Management Center, The Florida State University, Tallahassee, Florida Newman, James (Jay) W. (2010) “Insurance Residual Markets: Historical and Public Policy Perspectives” White paper, Florida Catastrophic Storm Risk Management Center, The Florida State University, Tallahassee, Florida Nielson, Norma (1984) “Capacity of the Property-Casualty Insurance Industry” Journal of Risk and Insurance 51(3): 393 – 411
Nyce, Charles M. and Patrick Maroney “Are Territorial Rating Models Outdated in Residential Property Insurance Markets? Evidence from the Florida Property Insurance Market” Risk Management and Insurance Review, 14(2): 201-232 Olsen, Anna H. and Keith A. Porter (2011) “What We Know about Demand Surge: Brief Summary” Natural Hazards Review 12(2)

43
Peacock, Walter Gillis. 2003 “Hurricane Mitigation Status and Factors Influencing Mitigation Status among Florida’s Single-Family Homeowners” Natural Hazards Review, 4(3): 1-10 Risk Management Solutions (2009) RMS Special Report Analyzing the Effects of the My Safe Florida Home Program on Florida Insurance Risk, Risk Management Solutions Rollins, John W. (2011) “Comparison of AIR and RMS Modeled Loss Cost Estimates” Rollins Analytics, Inc. Stigler, George J. (1971) “The Theory of Economic Regulation” The Bell Journal of Economics and Management Science, 2(1): 3 – 21 Stone, James M (1973) “A Theory of Capacity and the Insurance of Catastrophe Risk (Part II)” Journal of Risk and Insurance 40(3): 339 – 355 Weiss, Mary A., Sharon Tennyson and Laureen Regan (2010) “The Effects of Regulated Premium Subsidies on Insurance Costs: An Empirical Analysis of Automobile Insurance” Journal of Risk and Insurance, 77(3) 597 – 624

44
Chart 1: Residential Property Insurance Policies in Force
Source: Florida Office of Insurance Regulation Quarterly Supplemental Reporting (QUASR) system
0
1
2
3
4
5
6
7
Dec‐05
Mar‐06
Jun‐06
Sep‐06
Dec‐06
Mar‐07
Jun‐07
Sep‐07
Dec‐07
Mar‐08
Jun‐08
Sep‐08
Dec‐08
Mar‐09
Jun‐09
Sep‐09
Dec‐09
Mar‐10
Jun‐10
Sep‐10
Dec‐10
Mar‐11
Jun‐11
Millions
Florida Personal Residential Property Insurance
Trend in Policies in Force by Type of Insurer
Citizens Domestic Other Pup

45
Chart 2: Trend in Florida Personal Residential Property Insured Values (2005-2011)
0
200,000
400,000
600,000
800,000
1,000,000
1,200,000
1,400,000
1,600,000
1,800,000
2,000,000Dec‐05
Mar‐06
Jun‐06
Sep‐06
Dec‐06
Mar‐07
Jun‐07
Sep‐07
Dec‐07
Mar‐08
Jun‐08
Sep‐08
Dec‐08
Mar‐09
Jun‐09
Sep‐09
Dec‐09
Mar‐10
Jun‐10
Sep‐10
Dec‐10
Mar‐11
Jun‐11
Millions
Florida Personal Residential Property InsuranceTrend in Structure Insured Value by Type of Insurer
Citizens Domestic Other PupSource: Florida Office of Insurance Regulation Quarterly Supplemental

46
Chart 3: 1985-2010 Trend in Number of Insurers Writing Homeowners Insurance, by State
Table 1: Percentage Changes in Number of Companies, PHS and DPW by State and Company Structure in the Florida Homeowners Insurance Market (1985-2010)
1985-2010
Total Decision Centers Groups
Ind. Cos.
Total PHS
Group PHS
Ind. Cos. PHS
Total DPW
Group DPW
Ind. Cos. DPW
Nat’l -19.40% -27.27% -9.78% 431.80% 429.60% 536.14% 364.74% 354.95% 628.60% AL -34.18% -34.25% -33.33% 300.75% 298.65% 1613.27% 420.60% 421.38% 227.04% FL -37.80% -46.15% 0.00% 145.54% 144.41% 338.60% 849.12% 638.04% 6462.47% GA -35.58% -37.63% -18.18% 364.18% 362.45% 1110.49% 473.17% 486.44% 83.60% LA -46.99% -53.33% 12.50% 283.14% 281.53% 1282.99% 357.19% 323.81% 1092.75% MS -38.03% -39.39% -20.00% 306.98% 304.58% 2160.90% 405.20% 430.07% -86.12% NC -31.87% -41.98% 50.00% 425.35% 424.64% 591.78% 500.20% 502.51% 408.59% SC -24.44% -29.27% 25.00% 275.23% 272.95% 1125.98% 509.62% 503.54% 767.25% TX -40.00% -44.90% -11.76% 154.61% 152.11% 1579.91% 381.37% 369.22% 1097.66% VA -36.63% -39.13% -11.11% 331.74% 329.85% 927.39% 500.24% 493.79% 4081.72%
Number of Companies Writing HO
0
20
40
60
80
100
120
140
1985
1986
1987
1988
1989
1990
1991
1992
1993
1994
1995
1996
1997
1998
1999
2000
2001
2002
2003
2004
2005
2006
2007
2008
2009
2010
Year
# o
f D
ecis
ion
Cen
ters
AL
FL
GA
LA
MS
NC
SC
TX
VA

47
Chart 4: Florida Homeowners Insurance Direct Premiums Written by Insurer Type, 1985-2010
Table 2: Number of Homeowners Insurance Decision Centers by State in 2010
Type | State Nat’l AL FL GA LA MS NC SC TX VA Group 200 48 56 58 35 40 47 58 54 56 Independent 203 4 23 9 9 4 15 10 15 8 Total 403
52 79 67 44 44 62 68 69 64
Table 3: Number of Companies with 90% or More of Total DPW in the State in 2010
AL FL GA LA MS NC SC TX VA # of companies 2 47 8 7 2 11 1 24 3
Table 4: Direct Premiums Written (DPW) in $ Millions for Homeowners Insurance by Structure Type and State in 2010 Type Nat'l AL FL GA LA MS NC SC TX VA Group 58348 1185 4508 1732 1113 650 1708 1031 3862 1409 Independent 3467 3 1507 18.47 142.09 0.9 36.45 34.95 167.17 17.89 Total 61815 1188 6015 1750.47 1255.09 650.9 1744.45 1065.95 4029.17 1426.89
Table 5: Policyholders’ Surplus (PHS) in $ Billions by Structure Type and State in 2010 Type Nat'l AL FL GA LA MS NC SC TX VA Group 299.3 137.5 94 172.2 123.7 131.1 183.3 129.1 88 156 Independent 7.59 0.948 0.985 1.04 0.722 0.948 1.02 1.14 1.03 1.19 Total 306.89 138.448 94.985 173.24 124.422 132.048 184.32 130.24 89.03 157.19
$‐
$2,000,000,000
$4,000,000,000
$6,000,000,000
$8,000,000,000
$10,000,000,000
$12,000,000,000
1985
1986
1987
1988
1989
1990
1991
1992
1993
1994
1995
1996
1997
1998
1999
2000
2001
2002
2003
2004
2005
2006
2007
2008
2009
2010
Citizens
Domestics
Pups
Nationals

48
Chart 5: Frequency Histogram for Florida Private Homeowners Insurers’ Premium-to-Surplus Ratios
(a) 1985 (b)1994
(c)2003 (d)2010
Table 6: Average Loss Ratio, Standard Deviation and Coefficient of Variation by State (1985-2010)
AL FL GA LA MS NC SC TX VA Average
Loss Ratio 74.55 97.31 71.25 92.50 90.73 69.79 75.69 71.94 64.99 Standard Deviation 20.17 193.37 19.41 160.36 119.77 37.00 100.04 27.75 24.36
Coefficient of Variation 0.2706 1.9871 0.2725 1.7336 1.3201 0.5301 1.3217 0.3858 0.3748
0
20
40
60
80
100
120
140
0‐1 1‐2 2‐3 3‐4 4‐5 5‐6 6‐7 7‐8
Premium to Surplus Distrubution ‐ 1985
Number of Insurers
Premium‐SurplusRatio
0
10
20
30
40
50
60
70
80
90
100
0‐1 1‐2 2‐3 3‐4 4‐5 5‐6 6‐7 7‐8
Premium to Surplus Distrubution ‐ 1994
Number of Insurers
Premium‐SurplusRatio
0
10
20
30
40
50
60
70
80
0‐1 1‐2 2‐3 3‐4 4‐5 5‐6 6‐7 7‐8
Premium to Surplus Distrubution ‐ 2003
Number of Insurers
Premium‐SurplusRatio
0
5
10
15
20
25
30
35
40
45
50
0‐1 1‐2 2‐3 3‐4 4‐5 5‐6 6‐7 7‐8
Premium to Surplus Distrubution ‐ 2010
Number of Insurers
Premium‐SurplusRatio

49
Table 7: Loss Ratios (%) in the Private Homeowners Insurance Market from 2004-2010 by State LR %| State AL FL GA LA MS NC SC TX VA 2004 146.5 302.6 59.1 35.3 46.8 43.8 40.9 30.0 35.8 2005 92.3 153.3 67.1 855.3 660.2 39.4 35.6 50.1 30.7 2006 62.0 32.8 58.7 * 43.0 41.9 34.0 35.5 38.5 2007 57.0 24.2 63.7 * 41.5 41.9 31.1 37.9 40.5 2008 62.8 33.2 114.5 166.6 69.2 54.2 47.0 130.2 51.1 2009 93.8 37.5 144.4 11.0 46.7 57.6 45.7 65.0 46.9 2010 64.9 37.0 71.7 25.4 60.9 59.7 58.1 48.6 56.5
Chart 6: Homeowners Insurance Market Concentration Levels by State, 1985-2010
0
0.05
0.1
0.15
0.2
0.25
0.3
0.35
1985
1986
1987
1988
1989
1990
1991
1992
1993
1994
1995
1996
1997
1998
1999
2000
2001
2002
2003
2004
2005
2006
2007
2008
2009
2010
Herfindahl Indices for HO Insurance
ALFLGALAMSNCSCTXVA

50
Table 8: Citizens Property Insurance Corporation Personal Residential Policy Counts PLA
(Multi-peril) Coastal
(Wind Only) Coastal
(Multi-peril) Total Personal
Residential Policy Count Sep. 2011 992,002 246,832 172,651 1,411,485 Dec. 2010 829,406 248,328 154,663 1,232,397 Dec. 2009 609,652 251,287 114,561 975,500 Dec. 2008 629,467 328,775 67,672 1,025,914 Dec. 2007 845,857 421,505 24,676 1,292,038 Dec. 2006 743,592 403,509 1,147,101 Dec. 2005 407,387 399,418 806,805 Dec. 2004 416,529 453,765 870,294 Dec. 2003 383,280 433,056 816,336

51
Table 9: Top 25 - New Policies Written (First 6 months 2011) Personal & Commercial Residential45
Rank Insurer Name # of New Policies
Type of Insurer
1 Citizens Property Insurance Corporation 139,532
State Run Residual Market
2 Universal Property & Casualty Insurance Company 41,724 Florida Domestic
3 American Bankers Insurance Company of Florida 17,273 Other
4 Security First Insurance Company 17,046 Florida Domestic
5 Castle Key Indemnity Company 12,320 Florida Pup
6 St. Johns Insurance Company, Inc. 11,106 Florida Domestic
7 United Property & Casualty Insurance Company 10,266 Florida Domestic
8 Ark Royal Insurance Company 10,244 Florida Domestic
9 American Integrity Insurance Company of Florida 9,652 Florida Domestic
10 Tower Hill Prime Insurance Company 9,466 Florida Domestic
11 Florida Peninsula Insurance Company 9,018 Florida Domestic
12 American Modern Insurance Company of Florida 8,676 Florida Domestic
13 ASI Preferred Insurance Corporation 8,364 Florida Domestic
14 Safe Harbor Insurance Company 6,678 Florida Domestic
15 Cypress Property & Casualty Insurance Company 6,590 Florida Domestic
16 Olympus Insurance Company 6,014 Florida Domestic
17 Federated National Insurance Company 5,966 Florida Domestic
18 Tower Hill Select Insurance Company 5,296 Florida Domestic
19 Florida Family Insurance Company 5,013 Florida Domestic
20 Gulfstream Property and Casualty Insurance 4,835 Florida Domestic
21 Tower Hill Preferred Insurance Company 4,693 Florida Domestic
22 First Protective Insurance Company 4,433 Florida Domestic
23 Auto Club Insurance Company of Florida 4,245 Other
24 Modern USA Insurance Company 3,789 Florida Domestic
25 Prepared Insurance Company 3,622 Florida Domestic
Top 25 Total 365,861
45 Data are taken from the OIR’s Quarterly Supplemental Reporting System (QUASR).

52
Chart 7: Percentage of Direct Premiums Written Retained by Florida Homeowners Insurers (1985-2010)

53
Chart 8: Trend in Florida Personal Residential Property Insurance Rate Levels (2005-2011)
3.00
4.00
5.00
6.00
7.00
8.00
9.00
10.00
Dec‐05
Mar‐06
Jun‐06
Sep‐06
Dec‐06
Mar‐07
Jun‐07
Sep‐07
Dec‐07
Mar‐08
Jun‐08
Sep‐08
Dec‐08
Mar‐09
Jun‐09
Sep‐09
Dec‐09
Mar‐10
Jun‐10
Sep‐10
Dec‐10
Mar‐11
Jun‐11
Florida Personal Residential Property InsuranceTrend in Average Premium per $1,000 Value by Type of
InsurerSource: Florida Office of Insurance Regulation Quarterly Supplemental
Citizens
Domest
Other
Pup

54
APPENDIX A Premiums and Exposure of Residual Markets
State Premiums Written (PW) in 000’s
Premiums Earned (PE) in
000’s
Exposure (000,000’s)
PW to Exposure
PE to Exposure
Alabama $37,769 $15,006 $3,335 11.325 4.500 Florida $2,604,265 $1,971,649 $508,520 5.121 3.877
Louisiana $209,946 $154,738 $26,675 7.871 5.801 Mississippi $79,082 $7,024 11.26
North Carolina
$ 303,258 $302,197 $68,000 4.460 4.444
South Carolina
$97,127 $12,099 $14,493 6.702 0.838
Texas $304,393 $76,971 3.955 Alabama, Mississippi, South Carolina, and Texas wind-only. Alabama as of November, 2010; Louisiana Exposure as of March, 2010; Texas as of September, 2011; Others as of December, 2010.
APPENDIX B
Historical Construction Cost Index R.S. Means 2011
Year Index Value % Change 2011* 185 0.82% 2010 183.5 1.89% 2009 180.1 -0.17% 2008 180.4 6.49% 2007 169.4 4.57% 2006 162 6.86% 2005 151.6 5.50% 2004 143.7
* Jan. 2011 Estimate

55
APPENDIX C
Figure 1: Timeline of Legislative and Regulatory Changes Impacting Florida Residential Property Insurance 1970 1992 1993 2002 2003 2004 2005 2006 2007 2008 2009 2010 2011
Significant Weather Events
Hurricane Andrew
Hurricanes Charley, Frances, Ivan, Jeanne
Hurricanes Dennis, Katrina, Rita, Wilma
Legislative Activity
Florida Insurance Guaranty Association Formed Florida Windstorm Underwriting Association Formed
Joint Underwriting Association Formed
Florida Hurricane Catastrophe Fund Formed
Citizens Property Insurance Corporation Formed (merger of JUA & FWJUA)
CS/SB 1486 signed: Created S. 627.711 F.S.; Required insurers to notify policyholders of construction options and cost impact
CS/CS/SB 1980 signed: Required OIR to Reevaluate Mitigation Credits; Panhandle Exemption to SBC removed
FL Legislature: CS/HB 1A signed; froze Citizens rates; created optional coverage for FHCF CS/HB7057: creates My Safe Florida Home (MSFH) Windstorm Mitigation Study Commission created
MSFH program expires HB1495 passed: sets Citizens glidepath for rate increases
Citizens glidepath begins
SB 408 signed: Citizens sinkhole rates not subject to glidepath
Regulatory Activity
ARA Mitigation Credit Study Statewide Building Code Adopted First legislated mitigation premium credits implemented
Informational Memorandum 03‐001M issued: Rescaled ARA tables to make weakest home the base
Southern Building Code (SBC) updated
Informational Memorandum OIR‐05‐22M issued: Form explains actions needed to obtain discounts
Property & Casualty Insurance Reform Committee: Requires notice to insureds detailing credits and savings; Mitigation credits doubled
OIR disapproves ISO Advisory Rate System Informational Memorandum 07‐03M issued: Insurers cannot adjust base rates
ARA conducts second mitiga‐tion credit study

56
APPENDIX D
1992 1996 1997 1998 1999 2000 2001 2002 2003 2004 2005 2006 2007 2008 2009 2010 2011
Weather Events
Hurricane Andrew
Hurricanes Charley, Frances, Ivan, Jeanne
Hurricanes Dennis, Katrina, Rita, Wilma
Pup Formation
Travelers of Florida established (First Floridian Auto & Home) Allstate Floridian established (Castle Key Insurance)
State Farm Florida established Nationwide Insurance Company of Florida established
Encompass Floridian established (Allstate)
Capital Incentive Programs
Insurance Capital Build‐Up Incentive Program
Domestic Insurer Entries
3 3 8 5 2 1 1 4 8 6 9 4 1
Domestic Insurer Insolvencies
Atlantic Preferred Ins. Co. (Poe Group) Florida Preferred Property Ins. Co. Southern Family Ins. Co.
Vanguard Fire & Casualty
Coral Ins. Co. Magnolia Ins. Co. Northern Capital Ins. Co.
Homewise Preferred Ins. Co. (receivership)