maritime technology and research - thaiscience
TRANSCRIPT

Maritime Technology and Research 2020; 2(3): 131-158
https://doi.org/10.33175/mtr.2020.224159
Maritime Technology and Research 2020; 2(3)
131
Maritime Technology and Research
https://so04.tci-thaijo.org/index.php/MTR
Research Article Comparison of the vertical deflection of loaded T and RSF stiffeners of marine structures Ratthakrit Reabroy1,*1and Ke Sun2 1Faculty of International Maritime Studies, Kasetsart University, Chonburi 20230, Thailand 2College of Shipbuilding Engineering, Harbin Engineering University, Harbin 15000, China Article information Abstract Received: November 5, 2019 Revised: January 27, 2020 Accepted: February 22, 2020 Keywords Rectangular Support Flange Stiffener (RSF), Beam deflection, Simply supported beam, Non-conventional stiffener, Stiffened plate
This work aims to compare the vertical deflection between perfect T and Rectangular Support Flange (RSF) stiffeners when subjected to forces and pressures. The geometry of stiffener models comprises the conventional T stiffener model design, used in double hull oil tankers, and the RSF stiffener, which is of a modified type whose design is based on T stiffener specifications. The deflection theories of simply supported beam were studied by the double integral method. Finite Element Analysis (FEA) is used to design and simulate the vertical deflection and the maximum equivalent stress of stiffeners when subjected to force and pressure under the same boundary condition. Various stiffener models are studied, and the FEA results presented graphically. The theoretical and FEA results are in good agreement. The load-deflection curves show that the performance of the RSF stiffener is superior to that of the conventional T stiffener.
All rights reserved 1. Introduction
Maritime safety is important for the protection of marine life, the environment, and property. A naval architect aims to design and construct a marine structure that can withstand loads from waves and turbulent currents in the ocean. Ship and offshore hull structures are subjected to longitudinal bending by external forces and pressure, such as wave and current loads, loading cargo, and installed equipment and machinery weight. Generally, hull structures are built up of a combination of plates, girders, stiffeners, columns, and other reinforcements in transverse and longitudinal framing systems to increase the strength of the hull structure. The deformation of a stiffened plate with conventional stiffeners has been studied. A typical steel stiffened plate structure can be studied in 3 levels: the entire structure level, the stiffened panel level, and the bare plate level (Paik & Kim, 2002). Furthermore, local damage-induced imperfections existing in stiffeners have been investigated by Witkowska and Soares (2009). The strength of the plates of hull girders is increased by using conventional stiffeners, which are steel sections of various types, e.g., flange bars, T sections, and angle sections. Each type of stiffener has different dimensions in order to allow its proper installation at a given position on the hull girder (Badran et al., 2007). Non-conventional stiffeners have also been used in ship and offshore structure design and construction for many years, e.g., rectangular box stiffeners, Hat stiffeners, and N and M stiffeners. Moreover,
*Corresponding author: Faculty of International Maritime Studies, Kasetsart University, Chonburi 20230, Thailand E-mail address: [email protected]

Deflection of loaded T and RSF stiffeners of marine structure Ratthakrit Reabroy and Ke Sun https://so04.tci-thaijo.org/index.php/MTR
Maritime Technology and Research 2020; 2(3) 132
new types of non-conventional stiffeners have been studied and applied in a midship section of a double-hull oil tanker to simulate the ultimate strength, which is defined as the Y-stiffener type, as shown in Figure 1(a) (Badran et al., 2013). The study obtained a comparison of the displacement result between T stiffeners and Y-stiffeners subjected to lateral loads. Both stiffeners had the same applied load and section modulus. The result of the load-displacement curves of the Y-stiffener was greater than that of the T stiffener. This indicated the strength of the structure. The Y-stiffener models have a specific geometry, which adds a trapezoid part called the “Hat” between the bottom plate and the T stiffener, as shown in Figure 1(b). Moreover, designs of Y-stiffeners have been optimized and investigated in the way of replacement conventional stiffeners by applying the International Association Classification Society-Common Structural Rules (IACS-CSR) (Badran et al., 2009; Leheta et al., 2016).
Beam theories were used in this paper (Beer et al., 2013; Pytel & Singer, 1981; Roark & Young, 1989). The deflection of simply supported beam in composite material structure, thin-walled, rectangular cross-section beams under pure bending condition were investigated by Rasheed et al. (2017); also, the bending of the simply supported beam at 2 fixed positions when subjected to vertically concentrated force and distributed loading was presented by Li and Kang (2015). Finite Element Analysis (FEA) was used to calculate the value of displacement and the longitudinal structural maximum stress of the stiffener model. ANSYS software has been used to design the plates of a ship, and static numerical analysis has been done based on nonlinear finite element theory (Saad-Eldeen et al., 2016). The material properties of the stiffener models were defined by Badran et al. (2013). The response of Euler-Bernoulli beams and stiffen panels with a given Young’s modulus and Poisson ratio have been analysed (Sofi & Muscolino, 2015; Tanaka et al., 2014; Xu et al., 2017). The boundary conditions were defined for the girder in a finite element model (FEM) by simply supported beam conditions (Azmi et al., 2017), i.e., pin and roller. For the pin support, the girder was fixed against the displacements in the x, y, and z directions, and the roller support only allowed displacement in the z-direction. The load-deflection curve of unstiffen and stiffen panels has been studied, and a comparison made between the ultimate load result from the FEM and the ultimate load result from EN 1993-1-5 (Timmers & Lener, 2016). Moreover, Dundar et al. (2015) focused on the mid-span location and generated load-midspan deflection curve.
The main aims of this paper are firstly: the concentrated and distributed loads subjected on the flange of the stiffener models in a negative y-direction, then comparison of the deflection result with theoretical values; secondly: the stiffener model subjected to force and pressure at the nodes at the bottom of the plate in a positive y- direction, to get the result of the load-deflection curve.
2. Stiffener geometry
The purpose of this paper is to present a comparison of the displacement result between Rectangular Support Flange (RSF) and T stiffener subjected to concentrated and distributed loads. The standard of T stiffener as referred to in a ship hull structure is shown in Figure 1(a). The characteristics of the RSF stiffener are different from a conventional T stiffener, since the top part of the RSF stiffener has a rectangular part between the web and flange.
The stiffener model in this research is classified into 5 types, with different structural dimensions. The RSF stiffener dimensions are selected to replace T stiffeners, based on the same weight, section area, and bottom plate dimension. The geometry of the standard T stiffeners and RFS stiffeners are shown in Figures 2 and 3, respectively. Moreover, Tables 1 and 2 show the basic dimensions of T and RSF stiffeners with the plate.

Deflection of loaded T and RSF stiffeners of marine structure Ratthakrit Reabroy and Ke Sun https://so04.tci-thaijo.org/index.php/MTR
Maritime Technology and Research 2020; 2(3)
133
(a)
(b)
Figure 1 Midship section of double-hull oil tanker and geometry of Y-stiffener (Badran et al., 2013).

Deflection of loaded T and RSF stiffeners of marine structure Ratthakrit Reabroy and Ke Sun https://so04.tci-thaijo.org/index.php/MTR
Maritime Technology and Research 2020; 2(3) 134
Figure 2 Geometry of T stiffeners.
Figure 3 Geometry of RSF stiffeners. Table 1 Dimension of the standard T stiffener. Model bp tp hw tw bf tf HT T1 850 15.5 300 12 150 15 330.5 T2 850 15 360 12 150 18 393 T3 850 17.5 400 12 150 18 435.5 T4 850 16.5 380 12 150 18 414.5 T5 850 15.5 330 12 150 15 360.5 Note: the unit of all dimensions are in millimeters (mm)

Deflection of loaded T and RSF stiffeners of marine structure Ratthakrit Reabroy and Ke Sun https://so04.tci-thaijo.org/index.php/MTR
Maritime Technology and Research 2020; 2(3)
135
Table 2 Dimension of the RSF stiffener. Model bp tp hw tw br tr hr1 tr1 RSF1 850 15.5 280 10 100 10 30 10 RSF2 850 15 350 10 80 10 40 10 RSF3 850 17.5 360 10 100 9 30 8 RSF4 850 16.5 380 8 100 10 40 12 RSF5 850 15.5 330 10 80 10 30 8 Model hr2 tr2 bf tf HT RSF1 30 10 145 10 345.5 RSF2 40 10 160 12 427
RSF3 30 8 140 18 434.5 RSF4 40 12 150 15 461.5 RSF5 30 8 160 10 395.5 Note: HT is the total height of stiffener. The unit of all dimensions are in millimeters (mm) 3. Beam theory A beam is a structural longitudinal member designed to support lateral loads applied at various points along the member. In this study, the loads (concentrated & distributed) are perpendicular to the axis of the beam. Beams are categorized according to the way of support and the longitudinal distance is called the span as follows:
(a) Simply supported beam (d) Continuous beam (b) Overhanging beam (e) Propped cantilever beam (c) Cantilever beam (f) Fixed beam
This paper will assume a simply supported beam for studying the stiffeners, because this
kind of beam has 2 supports and undergoes shearing and bending, and is one of the simplest structure elements in existence. Validation will be done using the beam deflection theories for a ship and offshore structure component welded onto a small steel part connected with the main structure.
3.1 Deflection of beam The determination of the deflection of beam is vital for beam analysis. There are several
methods that can be used to validate beam deflections accurately. Even though these methods are based on the same principles, this paper considered the deflection of a vertically loaded beam by using the Double Integration Method (Macaulay’s method), which was simplified and broadened for calculation. The maximum deformation of T and RSF stiffeners was calculated by this method. Two kinds of loads were applied (in the vertically downward direction) on the surface flange area of the stiffener; concentrated load applied on the transverse line at the mid-span of the flange part, and distributed load applied to the whole top area of the stiffener flange.
The elastic flexure formulas were used to determine the maximum flexure stress, mσ , by the following equation (Beer et al., 2013):
IMc
m =σ (1)

Deflection of loaded T and RSF stiffeners of marine structure Ratthakrit Reabroy and Ke Sun https://so04.tci-thaijo.org/index.php/MTR
Maritime Technology and Research 2020; 2(3) 136
where M is the maximum bending moment, c is the greatest distance from the neutral surface of the member, and I is the moment of inertia or second moment of area of the cross-section.
And the deformation of the member caused by the bending moment, M, measured by the curvature, ρ , of the neutral surface is given by:
1 Mρ EI= (2)
where ρ is the radius of curvature and E is the modulus of elasticity.
3.1.1 Macaulay’s or double integration method The elastic curve of the beam can be determined by the equation of the vertical displacement
y of any location in terms of x coordinate. In Figure 4, the value of the slope tanθ dy dx= , so 2 2dθ dx d y dx= . Let ρ be the radius of curvature over the arc length on a neutral surface, so
2 21 ρ d y dx= . Substituting the value of 1 ρ in Eq. (2) will get the differential equation of the elastic curve of a beam:
2
2
d y Mdx EI
= (3)
Figure 4 Elastic curve (Pytel & Singer, 1981).
Integrating the above equation twice gives the beam deflection equation of the elastic curve
of the y-direction in any x distance (assuming the flexural rigidity EI is constant value):
1 21
xy Mdxdx C CEI
= + +∫∫ (4) where C1, C2 are constants which are evaluated from the boundary condition of a beam support and loading.
Deflection of loaded T and RSF stiffeners of marine structure Ratthakrit Reabroy and Ke Sun https://so04.tci-thaijo.org/index.php/MTR
Maritime Technology and Research 2020; 2(3)
137
T and RSF stiffeners with length 5 m were analyzed by simply supported beam theory, which were subjected to concentrated and distributed load, respectively. The calculation of the maximum deflection compared the results of both stiffener types.
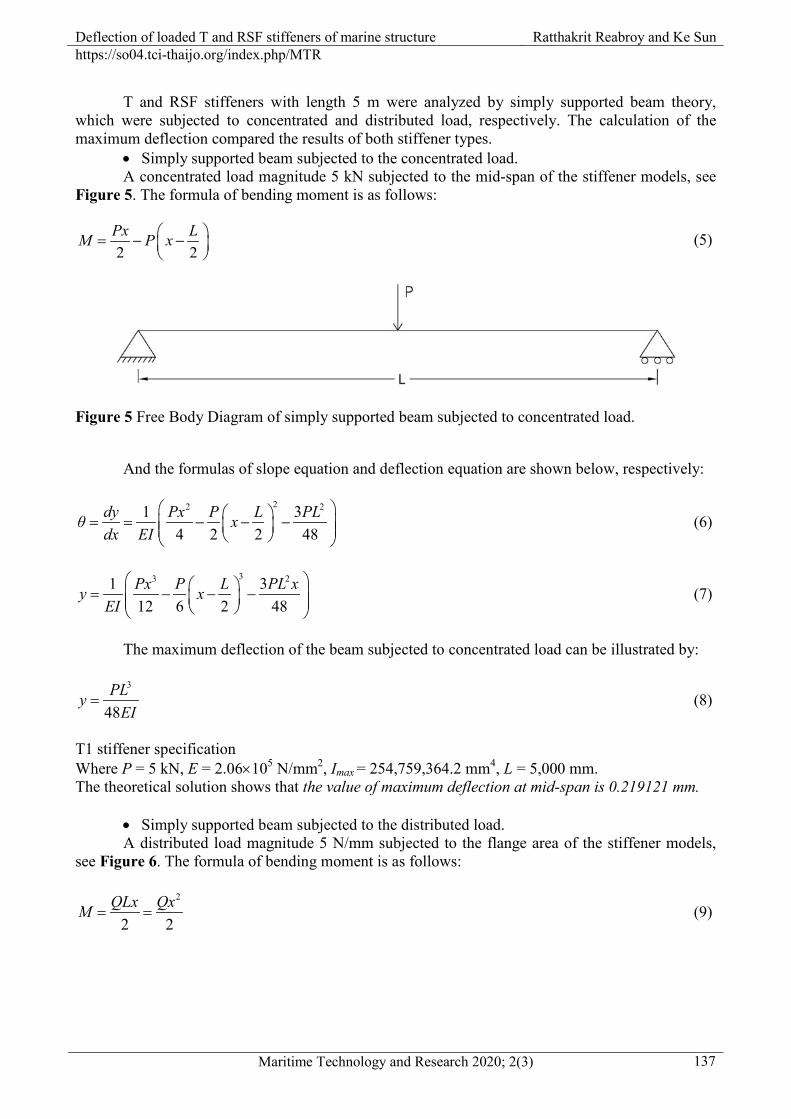
• Simply supported beam subjected to the concentrated load. A concentrated load magnitude 5 kN subjected to the mid-span of the stiffener models, see
Figure 5. The formula of bending moment is as follows:
2 2Px LM P x = − −
(5)
Figure 5 Free Body Diagram of simply supported beam subjected to concentrated load.
And the formulas of slope equation and deflection equation are shown below, respectively:
22 21 34 2 2 48
dy Px P L PLθ xdx EI
= = − − − (6)
33 21 3
12 6 2 48Px P L PL xy x
EI = − − −
(7)
The maximum deflection of the beam subjected to concentrated load can be illustrated by: 3
48PLy
EI= (8)
T1 stiffener specification Where P = 5 kN, E = 2.06×10⁵ N/mm2, Imax = 254,759,364.2 mm4, L = 5,000 mm. The theoretical solution shows that the value of maximum deflection at mid-span is 0.219121 mm.
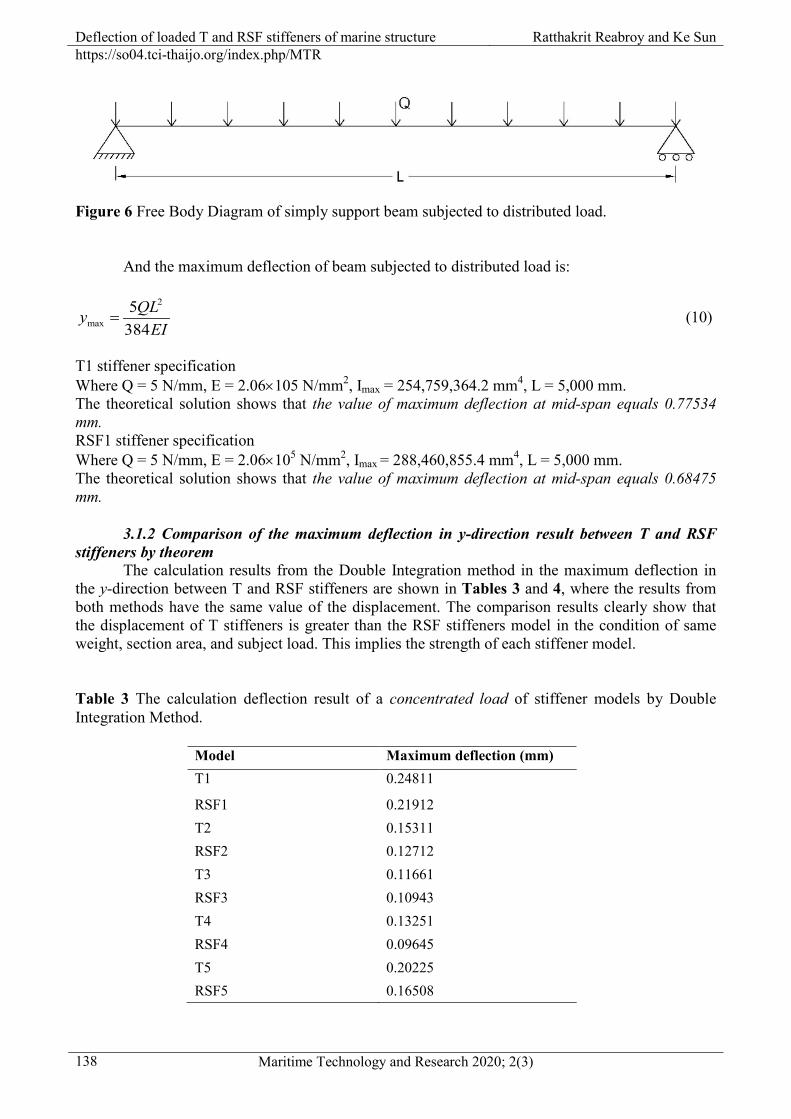
• Simply supported beam subjected to the distributed load. A distributed load magnitude 5 N/mm subjected to the flange area of the stiffener models,
see Figure 6. The formula of bending moment is as follows:
2
2 2QLx QxM = = (9)
Deflection of loaded T and RSF stiffeners of marine structure Ratthakrit Reabroy and Ke Sun https://so04.tci-thaijo.org/index.php/MTR
Maritime Technology and Research 2020; 2(3) 138
Figure 6 Free Body Diagram of simply support beam subjected to distributed load.
And the maximum deflection of beam subjected to distributed load is:
2
max5
384QLy
EI= (10)
T1 stiffener specification Where Q = 5 N/mm, E = 2.06×10⁵ N/mm2, Imax = 254,759,364.2 mm4, L = 5,000 mm. The theoretical solution shows that the value of maximum deflection at mid-span equals 0.77534 mm. RSF1 stiffener specification Where Q = 5 N/mm, E = 2.06×10⁵ N/mm2, Imax = 288,460,855.4 mm4, L = 5,000 mm. The theoretical solution shows that the value of maximum deflection at mid-span equals 0.68475 mm.
3.1.2 Comparison of the maximum deflection in y-direction result between T and RSF stiffeners by theorem
The calculation results from the Double Integration method in the maximum deflection in the y-direction between T and RSF stiffeners are shown in Tables 3 and 4, where the results from both methods have the same value of the displacement. The comparison results clearly show that the displacement of T stiffeners is greater than the RSF stiffeners model in the condition of same weight, section area, and subject load. This implies the strength of each stiffener model. Table 3 The calculation deflection result of a concentrated load of stiffener models by Double Integration Method.
Model Maximum deflection (mm) T1 0.24811
RSF1 0.21912 T2 0.15311 RSF2 0.12712 T3 0.11661 RSF3 0.10943 T4 0.13251 RSF4 0.09645 T5 0.20225 RSF5 0.16508
Deflection of loaded T and RSF stiffeners of marine structure Ratthakrit Reabroy and Ke Sun https://so04.tci-thaijo.org/index.php/MTR
Maritime Technology and Research 2020; 2(3)
139
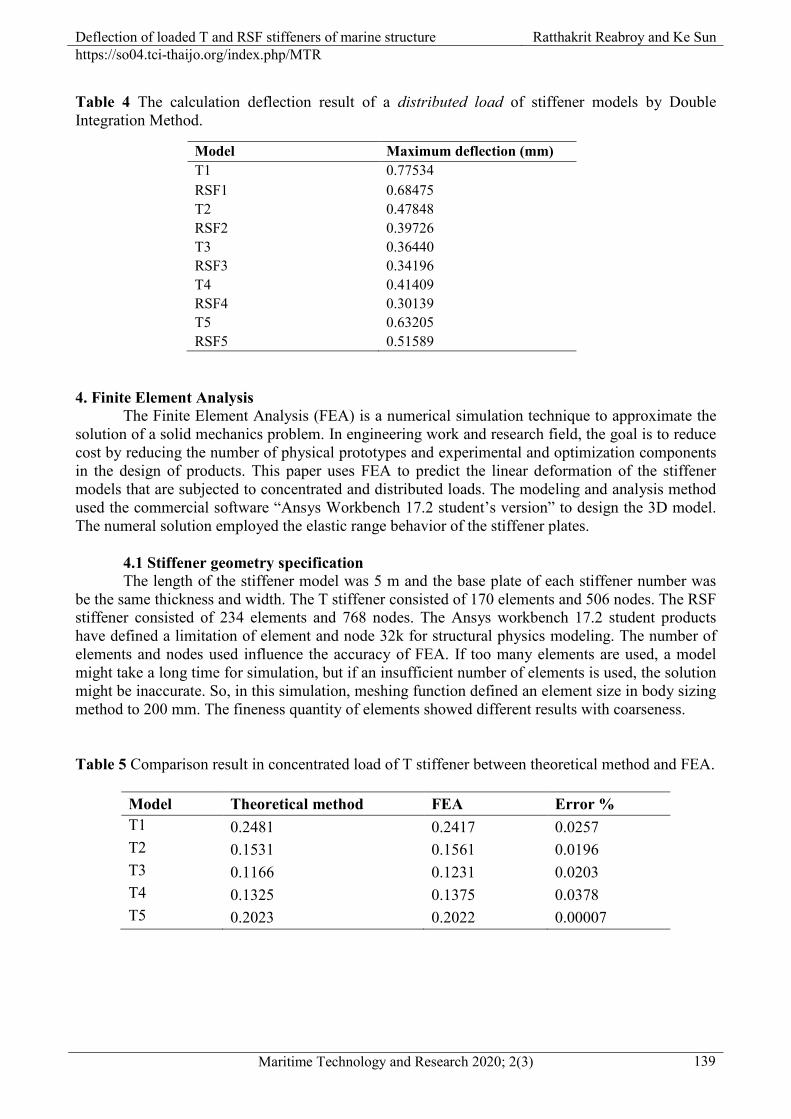
Table 4 The calculation deflection result of a distributed load of stiffener models by Double Integration Method.
Model Maximum deflection (mm) T1 0.77534 RSF1 0.68475 T2 0.47848 RSF2 0.39726 T3 0.36440 RSF3 0.34196 T4 0.41409 RSF4 0.30139 T5 0.63205 RSF5 0.51589
4. Finite Element Analysis
The Finite Element Analysis (FEA) is a numerical simulation technique to approximate the solution of a solid mechanics problem. In engineering work and research field, the goal is to reduce cost by reducing the number of physical prototypes and experimental and optimization components in the design of products. This paper uses FEA to predict the linear deformation of the stiffener models that are subjected to concentrated and distributed loads. The modeling and analysis method used the commercial software “Ansys Workbench 17.2 student’s version” to design the 3D model. The numeral solution employed the elastic range behavior of the stiffener plates.
4.1 Stiffener geometry specification The length of the stiffener model was 5 m and the base plate of each stiffener number was
be the same thickness and width. The T stiffener consisted of 170 elements and 506 nodes. The RSF stiffener consisted of 234 elements and 768 nodes. The Ansys workbench 17.2 student products have defined a limitation of element and node 32k for structural physics modeling. The number of elements and nodes used influence the accuracy of FEA. If too many elements are used, a model might take a long time for simulation, but if an insufficient number of elements is used, the solution might be inaccurate. So, in this simulation, meshing function defined an element size in body sizing method to 200 mm. The fineness quantity of elements showed different results with coarseness. Table 5 Comparison result in concentrated load of T stiffener between theoretical method and FEA.
Model Theoretical method FEA Error % T1 0.2481 0.2417 0.0257 T2 0.1531 0.1561 0.0196 T3 0.1166 0.1231 0.0203 T4 0.1325 0.1375 0.0378 T5 0.2023 0.2022 0.00007
Deflection of loaded T and RSF stiffeners of marine structure Ratthakrit Reabroy and Ke Sun https://so04.tci-thaijo.org/index.php/MTR
Maritime Technology and Research 2020; 2(3) 140
Table 6 Comparison result in distributed load of T stiffener between theoretical method and FEA.
Model Theoretical method FEA Error % T1 0.7753 0.7757 0.00044 T2 0.4784 0.4787 0.00042 T3 0.3644 0.3835 0.0526 T4 0.4140 0.4259 0.0284 T5 0.6320 0.6431 0.017
Tables 5 and 6 show the comparison results of the maximum deflection of the stiffener models with the theoretical and FEA calculation results of the stiffener models. The maximum deflection results between the 2 methods show the percentage error is in agreement, which can indicate the mesh is fine enough and the setting condition in the FEA calculation is correct.
4.2 Specifying material properties and boundary condition The physical properties of the stiffener models are defined; the density is 7.85×10⁻⁶ kg/mm3,
Young’s modulus is 206,000 N/mm2, and Poisson’s ratio is 0.3 (Badran et al., 2013). As mentioned in section 4, an analytical solution focused on a linear elastic range of material, so this section neglected the value of the yield stress.
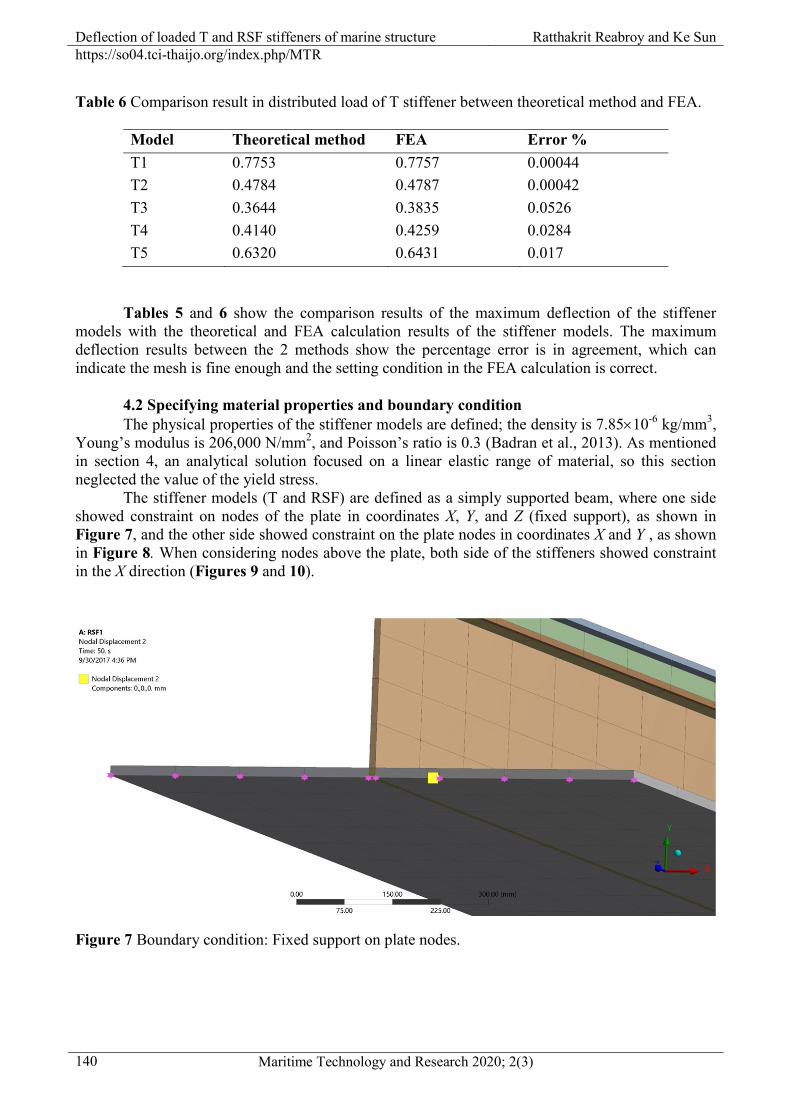
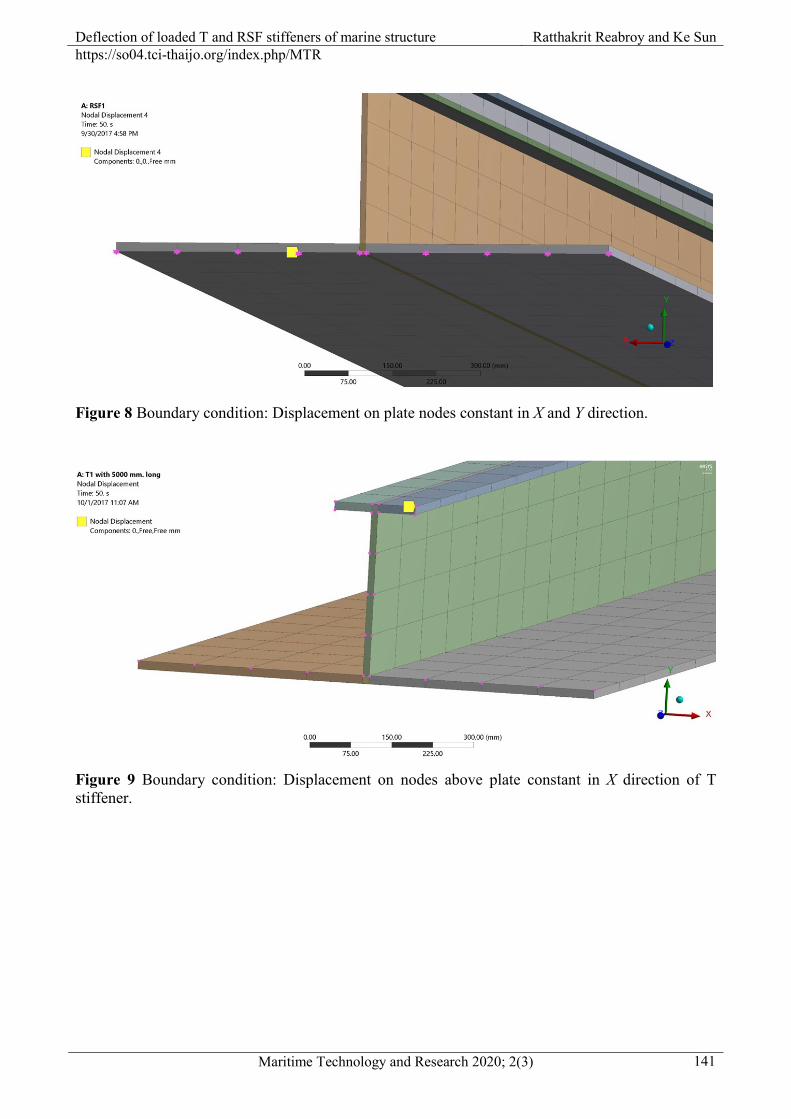
The stiffener models (T and RSF) are defined as a simply supported beam, where one side showed constraint on nodes of the plate in coordinates X, Y, and Z (fixed support), as shown in Figure 7, and the other side showed constraint on the plate nodes in coordinates X and Y , as shown in Figure 8. When considering nodes above the plate, both side of the stiffeners showed constraint in the X direction (Figures 9 and 10).
Figure 7 Boundary condition: Fixed support on plate nodes.
Deflection of loaded T and RSF stiffeners of marine structure Ratthakrit Reabroy and Ke Sun https://so04.tci-thaijo.org/index.php/MTR
Maritime Technology and Research 2020; 2(3)
141
Figure 8 Boundary condition: Displacement on plate nodes constant in X and Y direction.
Figure 9 Boundary condition: Displacement on nodes above plate constant in X direction of T stiffener.

Deflection of loaded T and RSF stiffeners of marine structure Ratthakrit Reabroy and Ke Sun https://so04.tci-thaijo.org/index.php/MTR
Maritime Technology and Research 2020; 2(3) 142
Figure 10 Boundary condition: Displacement on nodes above plate constant in X direction of RSF stiffener.
T and RSF stiffeners were subjected to uniform load on all nodes of the bottom plate of the stiffener model in a positive y-direction, with 210 nodes in total. The maximum force was 5×10⁵ N and the maximum pressure was 0.5 MPa, as shown in Figures 11 and 12, respectively. The number of load steps are defined as 50 steps by 1 s of a step of time.
Figure 11 Load on all nodes of the stiffener plate in positive y-direction.

Deflection of loaded T and RSF stiffeners of marine structure Ratthakrit Reabroy and Ke Sun https://so04.tci-thaijo.org/index.php/MTR
Maritime Technology and Research 2020; 2(3)
143
Figure 12 Pressure on all nodes of the stiffener plate in positive y-direction. 5. Load - Deflection curve
The result of mid-span deflection was obtained from Ansys Workbench 17.2 student’s version, and the load-deflection curves plotted for the various stiffeners using OriginPro 8. The results are shown in Figures 13 and 14.
Figure 13 is the comparison result of the mid-span deflection between T and RSF stiffeners subjected to concentrated load. For model 1, the highest deflection was 0.25 mm for the T1 model. In contrast, the RSF1 model illustrated a deflection of 0.22 mm, which demonstrates a difference of 13.63 %. When considering other models, there is also the same tendency. Moreover, in Figure 14, the T stiffeners have illustrated a deflection from the distributed load higher than the RSF stiffeners.
Figure 13 Mid-span deflections of T and RSF subjected to concentrated load.

Deflection of loaded T and RSF stiffeners of marine structure Ratthakrit Reabroy and Ke Sun https://so04.tci-thaijo.org/index.php/MTR
Maritime Technology and Research 2020; 2(3) 144
Figure 14 Mid-span deflections of T and RSF stiffeners subjected to distributed load.
In addition, this research provided the condition of the load step applied to all nodes under the bottom plate of the stiffener. The forces were 10,000 to 500,000 N, and the pressures were 0.01 to 0.5 MPa. The results of the linear analysis of deflection are shown in Figures 15 and 16. (a) shows all stiffener models combined in the same chart, and (b) to (f) show the comparison of the mid-span deflection between the T and RSF stiffeners in each model. From Figure 15(b), for the linear elastic curve and deflection at the maximum force 500,000 N, the deflection of T1 was 23.619 mm, and RSF1 was 21.986 mm, which demonstrates a difference of approximately 8.9 % between the 2 models. In Figure 16, the linear elastic curve of pressure and deflection of the T and RSF stiffeners illustrated the same tendency as in Figures 15(a) - 15(f).

Deflection of loaded T and RSF stiffeners of marine structure Ratthakrit Reabroy and Ke Sun https://so04.tci-thaijo.org/index.php/MTR
Maritime Technology and Research 2020; 2(3)
145
(a) (b)
(c) (d)
(e) (f)
Figure 15 Linear elastic curve of force and deflection of T and RSF stiffeners.

Deflection of loaded T and RSF stiffeners of marine structure Ratthakrit Reabroy and Ke Sun https://so04.tci-thaijo.org/index.php/MTR
Maritime Technology and Research 2020; 2(3) 146
(a) (b)
(c) (d)
(e) (f)
Figure 16 Linear elastic curve of pressure and deflection of T and RSF.
Deflection of loaded T and RSF stiffeners of marine structure Ratthakrit Reabroy and Ke Sun https://so04.tci-thaijo.org/index.php/MTR
Maritime Technology and Research 2020; 2(3)
147
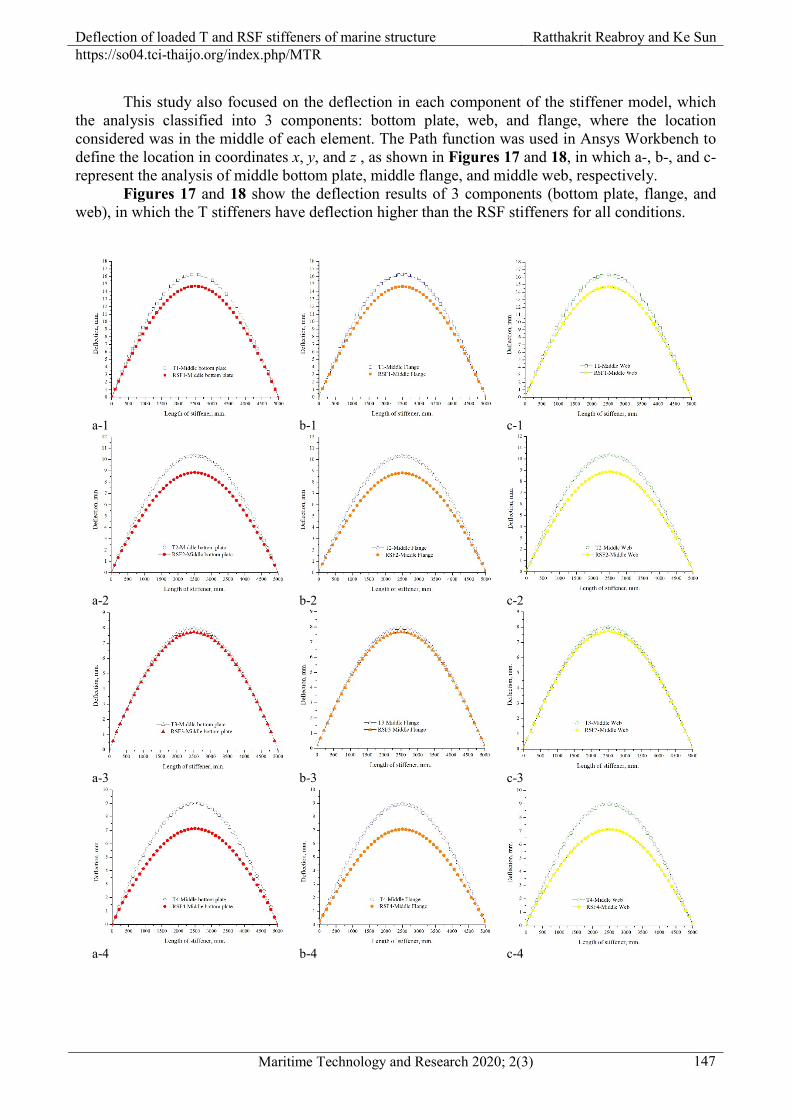
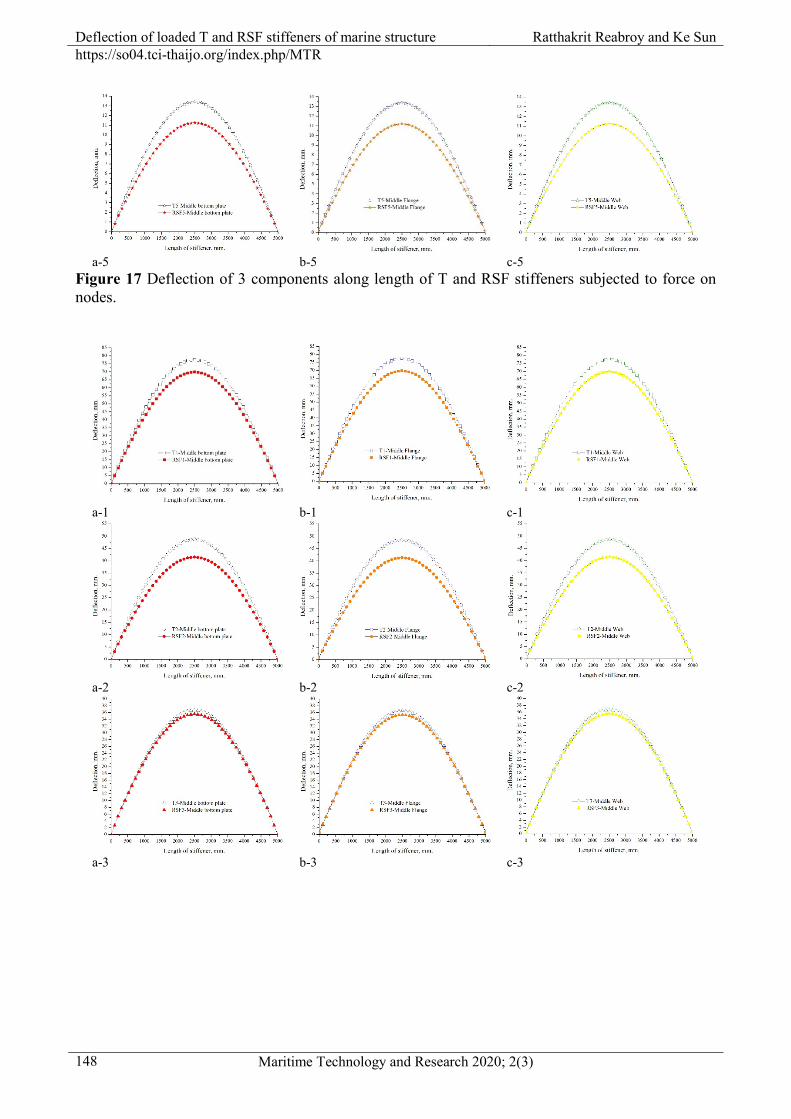
This study also focused on the deflection in each component of the stiffener model, which the analysis classified into 3 components: bottom plate, web, and flange, where the location considered was in the middle of each element. The Path function was used in Ansys Workbench to define the location in coordinates x, y, and z , as shown in Figures 17 and 18, in which a-, b-, and c- represent the analysis of middle bottom plate, middle flange, and middle web, respectively.
Figures 17 and 18 show the deflection results of 3 components (bottom plate, flange, and web), in which the T stiffeners have deflection higher than the RSF stiffeners for all conditions.
a-1 b-1 c-1
a-2 b-2 c-2
a-3 b-3 c-3
a-4 b-4 c-4
Deflection of loaded T and RSF stiffeners of marine structure Ratthakrit Reabroy and Ke Sun https://so04.tci-thaijo.org/index.php/MTR
Maritime Technology and Research 2020; 2(3) 148
a-5 b-5 c-5
Figure 17 Deflection of 3 components along length of T and RSF stiffeners subjected to force on nodes.
a-1 b-1 c-1
a-2 b-2 c-2
a-3 b-3 c-3

Deflection of loaded T and RSF stiffeners of marine structure Ratthakrit Reabroy and Ke Sun https://so04.tci-thaijo.org/index.php/MTR
Maritime Technology and Research 2020; 2(3)
149
a-4 b-4 c-4
a-5 b-5 c-5
Figure 18 Deflection of 3 components along length of T and RSF stiffeners subjected to pressure on nodes.
One of the methods to determine the strength of a structure is to evaluate the equivalent stress. Von-Mises is widely used to check whether an engineering design will withstand defined load conditions. This paper also aimed to determine the equivalent stress at the middle and end part of the flange. The results of the equivalent stress of T and RSF stiffeners for the 2 load conditions of force and pressure are compared, as shown in Figures 19 - 22. The equivalent stress of the T stiffeners is higher than that of the RSF stiffeners.
Figure 19 Equivalent stress at middle flange of stiffener models from force subjected on bottom plate nodes.

Deflection of loaded T and RSF stiffeners of marine structure Ratthakrit Reabroy and Ke Sun https://so04.tci-thaijo.org/index.php/MTR
Maritime Technology and Research 2020; 2(3) 150
Figure 20 Equivalent stress at middle flange of stiffener models from pressure subjected on bottom plate nodes.
Figure 21 Equivalent stress at the end flange of stiffener models from force subjected on bottom plate nodes.

Deflection of loaded T and RSF stiffeners of marine structure Ratthakrit Reabroy and Ke Sun https://so04.tci-thaijo.org/index.php/MTR
Maritime Technology and Research 2020; 2(3)
151
Figure 22 Equivalent stress at end flange of stiffener models from pressure subjected on bottom plate nodes. 6. Result of analysis
The relationships of load and deflection were obtained for both T and RSF stiffeners. From section 5, the results from Figures 13 - 18 presented that RSF stiffeners had higher strength than T stiffeners when subjected to force and pressure in conditions of the same section area, weight, and plate dimension. Considering the results of simply supported beams shown in Figures 17 and 18, the location of maximum deflection in the y-direction occurred in the middle of the component, in which the curves are illustrated as a parabola. All of the curve types showed deflection in the y-direction of T stiffeners was higher than that of RSF stiffeners subjected to the same load condition.
Figure 23 Deflection of T1 stiffener subjected to force 5,000 N. on bottom plate nodes.
Deflection of loaded T and RSF stiffeners of marine structure Ratthakrit Reabroy and Ke Sun https://so04.tci-thaijo.org/index.php/MTR
Maritime Technology and Research 2020; 2(3) 152
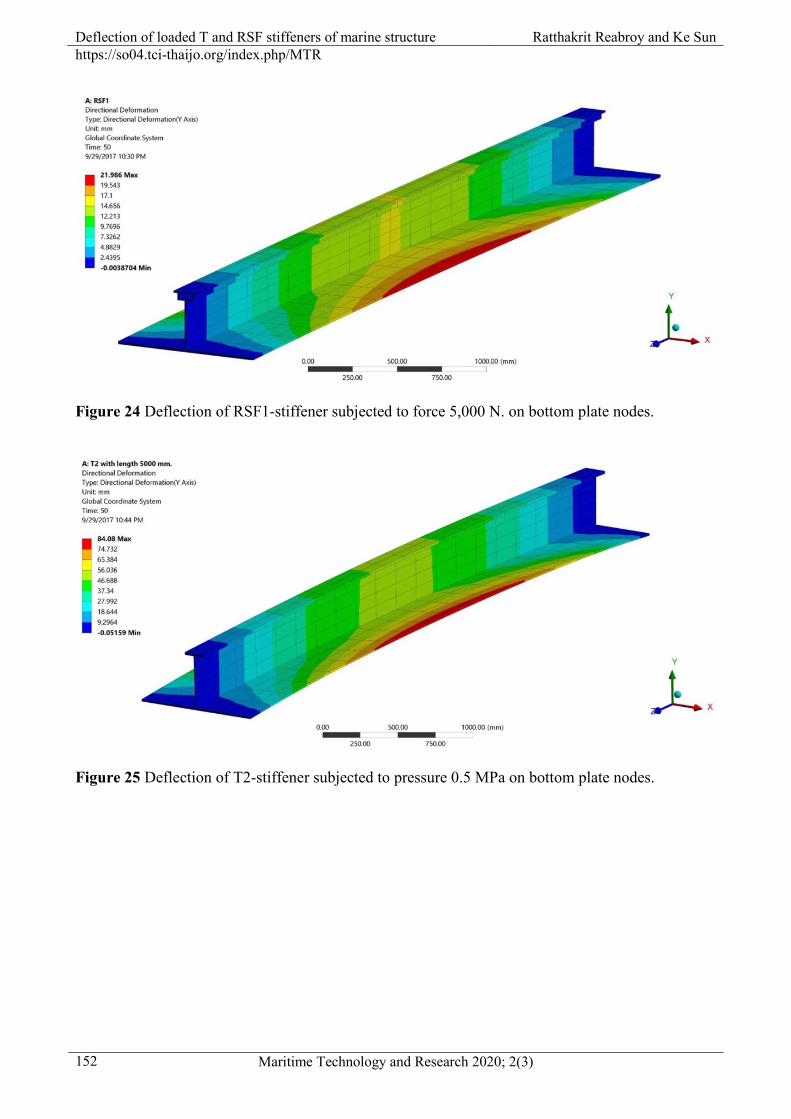
Figure 24 Deflection of RSF1-stiffener subjected to force 5,000 N. on bottom plate nodes.
Figure 25 Deflection of T2-stiffener subjected to pressure 0.5 MPa on bottom plate nodes.

Deflection of loaded T and RSF stiffeners of marine structure Ratthakrit Reabroy and Ke Sun https://so04.tci-thaijo.org/index.php/MTR
Maritime Technology and Research 2020; 2(3)
153
Figure 26 Deflection of RSF2-stiffener subjected to pressure 0.5 MPa on bottom plate nodes.
Figures 23 - 36 show the finite element simulation of deflection in the y-direction of T1&2
and RSF1&2 stiffener models subjected to a force of 5,000 N and a pressure of 0.5 MPa. The maximum deflection occurred on the bottom plate. This situation indicated that, at the same load condition, T stiffeners have more deflection in the y-direction than RSF stiffeners. Figures 27 and 28 are based on finite element simulation in the location of middle horizontal from start to end in which (a), (b), and (c) represent the middle bottom plate, middle web, and middle flange, respectively.
(a)

Deflection of loaded T and RSF stiffeners of marine structure Ratthakrit Reabroy and Ke Sun https://so04.tci-thaijo.org/index.php/MTR
Maritime Technology and Research 2020; 2(3) 154
(b)
(c)
Figure 27 Deflection of T3 stiffener by finite element simulation with path function.
(a)

Deflection of loaded T and RSF stiffeners of marine structure Ratthakrit Reabroy and Ke Sun https://so04.tci-thaijo.org/index.php/MTR
Maritime Technology and Research 2020; 2(3)
155
(b)
(c)
Figure 28 Deflection of RSF3 stiffener by finite element simulation with path function.
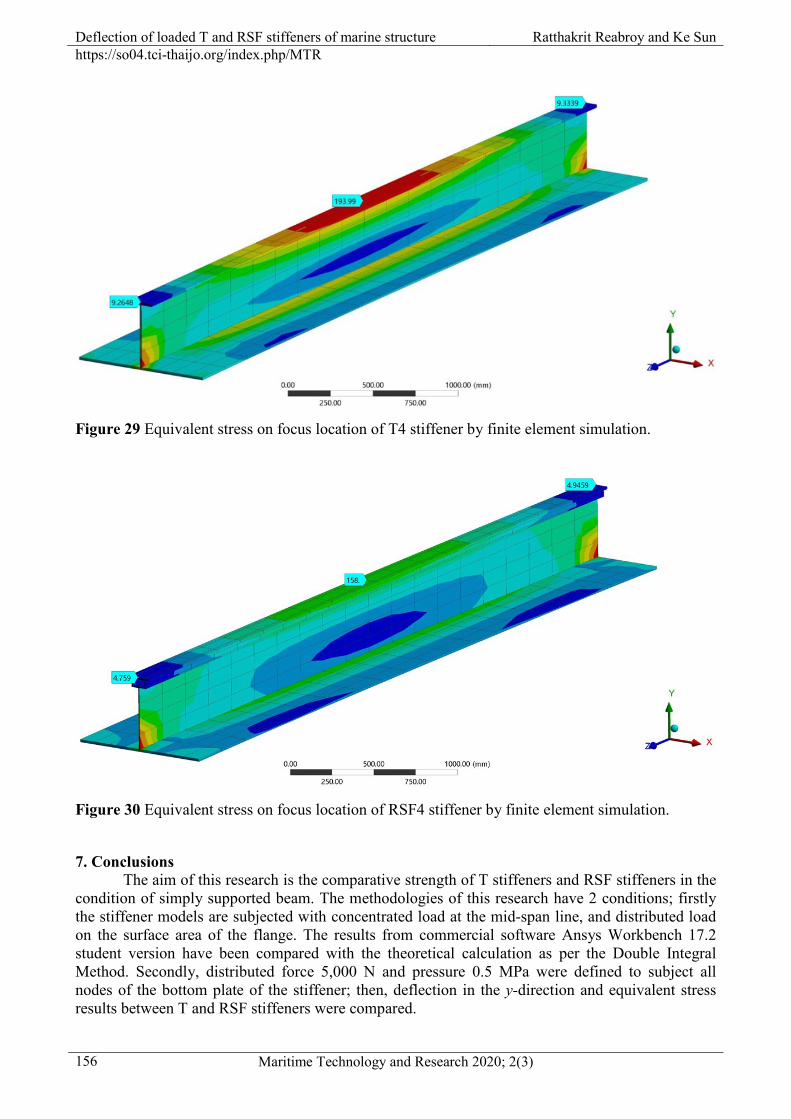
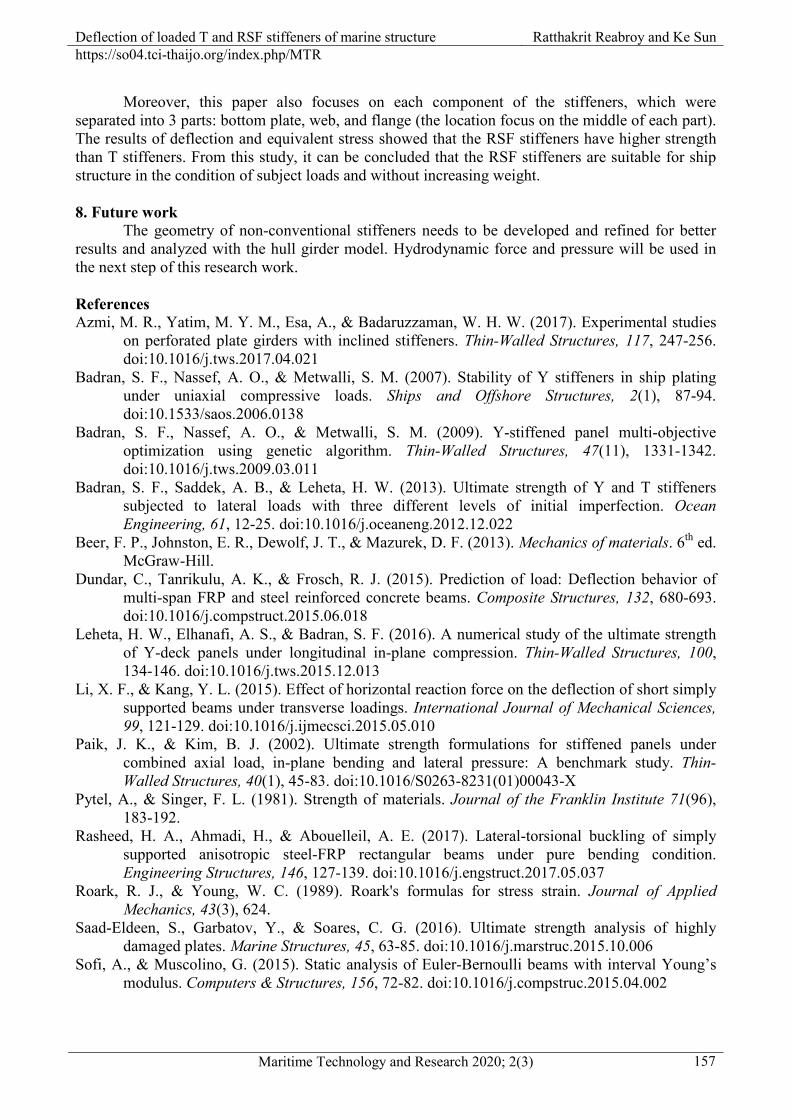
Furthermore, this paper provided the comparison results of equivalent stress on the middle and end of the flange. The simulation results indicated the equivalent stress at the focus point of the RSF stiffener was lower than that in the standard T stiffener. When considering the middle flange of the T4 stiffener, the value of equivalent stress is 193.99 MPa, and for RSF4-stiffener, it is 159 MPa. The finite element simulations of equivalent stress are shown in Figures 29 and 30. Therefore, the RSF stiffeners have a failure load higher than the T stiffeners in conditions of the same weight, section area, and plate dimension.
Deflection of loaded T and RSF stiffeners of marine structure Ratthakrit Reabroy and Ke Sun https://so04.tci-thaijo.org/index.php/MTR
Maritime Technology and Research 2020; 2(3) 156
Figure 29 Equivalent stress on focus location of T4 stiffener by finite element simulation.
Figure 30 Equivalent stress on focus location of RSF4 stiffener by finite element simulation. 7. Conclusions
The aim of this research is the comparative strength of T stiffeners and RSF stiffeners in the condition of simply supported beam. The methodologies of this research have 2 conditions; firstly the stiffener models are subjected with concentrated load at the mid-span line, and distributed load on the surface area of the flange. The results from commercial software Ansys Workbench 17.2 student version have been compared with the theoretical calculation as per the Double Integral Method. Secondly, distributed force 5,000 N and pressure 0.5 MPa were defined to subject all nodes of the bottom plate of the stiffener; then, deflection in the y-direction and equivalent stress results between T and RSF stiffeners were compared.
Deflection of loaded T and RSF stiffeners of marine structure Ratthakrit Reabroy and Ke Sun https://so04.tci-thaijo.org/index.php/MTR
Maritime Technology and Research 2020; 2(3)
157
Moreover, this paper also focuses on each component of the stiffeners, which were separated into 3 parts: bottom plate, web, and flange (the location focus on the middle of each part). The results of deflection and equivalent stress showed that the RSF stiffeners have higher strength than T stiffeners. From this study, it can be concluded that the RSF stiffeners are suitable for ship structure in the condition of subject loads and without increasing weight.
8. Future work The geometry of non-conventional stiffeners needs to be developed and refined for better results and analyzed with the hull girder model. Hydrodynamic force and pressure will be used in the next step of this research work. References Azmi, M. R., Yatim, M. Y. M., Esa, A., & Badaruzzaman, W. H. W. (2017). Experimental studies
on perforated plate girders with inclined stiffeners. Thin-Walled Structures, 117, 247-256. doi:10.1016/j.tws.2017.04.021
Badran, S. F., Nassef, A. O., & Metwalli, S. M. (2007). Stability of Y stiffeners in ship plating under uniaxial compressive loads. Ships and Offshore Structures, 2(1), 87-94. doi:10.1533/saos.2006.0138
Badran, S. F., Nassef, A. O., & Metwalli, S. M. (2009). Y-stiffened panel multi-objective optimization using genetic algorithm. Thin-Walled Structures, 47(11), 1331-1342. doi:10.1016/j.tws.2009.03.011
Badran, S. F., Saddek, A. B., & Leheta, H. W. (2013). Ultimate strength of Y and T stiffeners subjected to lateral loads with three different levels of initial imperfection. Ocean Engineering, 61, 12-25. doi:10.1016/j.oceaneng.2012.12.022
Beer, F. P., Johnston, E. R., Dewolf, J. T., & Mazurek, D. F. (2013). Mechanics of materials. 6th ed. McGraw-Hill.
Dundar, C., Tanrikulu, A. K., & Frosch, R. J. (2015). Prediction of load: Deflection behavior of multi-span FRP and steel reinforced concrete beams. Composite Structures, 132, 680-693. doi:10.1016/j.compstruct.2015.06.018
Leheta, H. W., Elhanafi, A. S., & Badran, S. F. (2016). A numerical study of the ultimate strength of Y-deck panels under longitudinal in-plane compression. Thin-Walled Structures, 100, 134-146. doi:10.1016/j.tws.2015.12.013
Li, X. F., & Kang, Y. L. (2015). Effect of horizontal reaction force on the deflection of short simply supported beams under transverse loadings. International Journal of Mechanical Sciences, 99, 121-129. doi:10.1016/j.ijmecsci.2015.05.010
Paik, J. K., & Kim, B. J. (2002). Ultimate strength formulations for stiffened panels under combined axial load, in-plane bending and lateral pressure: A benchmark study. Thin-Walled Structures, 40(1), 45-83. doi:10.1016/S0263-8231(01)00043-X
Pytel, A., & Singer, F. L. (1981). Strength of materials. Journal of the Franklin Institute 71(96), 183-192.
Rasheed, H. A., Ahmadi, H., & Abouelleil, A. E. (2017). Lateral-torsional buckling of simply supported anisotropic steel-FRP rectangular beams under pure bending condition. Engineering Structures, 146, 127-139. doi:10.1016/j.engstruct.2017.05.037
Roark, R. J., & Young, W. C. (1989). Roark's formulas for stress strain. Journal of Applied Mechanics, 43(3), 624.
Saad-Eldeen, S., Garbatov, Y., & Soares, C. G. (2016). Ultimate strength analysis of highly damaged plates. Marine Structures, 45, 63-85. doi:10.1016/j.marstruc.2015.10.006
Sofi, A., & Muscolino, G. (2015). Static analysis of Euler-Bernoulli beams with interval Young’s modulus. Computers & Structures, 156, 72-82. doi:10.1016/j.compstruc.2015.04.002

Deflection of loaded T and RSF stiffeners of marine structure Ratthakrit Reabroy and Ke Sun https://so04.tci-thaijo.org/index.php/MTR
Maritime Technology and Research 2020; 2(3) 158
Tanaka, S., Yanagihara, D., Yasuoka, A., Harada, M., Okazawa, S., Fujikubo, M., & Yao, T. (2014). Evaluation of ultimate strength of stiffened panels under longitudinal thrust. Marine Structures, 36(36), 21-50. doi:10.1016/j.marstruc.2013.11.002
Timmers, R., & Lener, G. (2016). Collapse mechanisms and load: Deflection curves of unstiffened and stiffened plated structures from bridge design. Thin-Walled Structures, 106, 448-458. doi:10.1016/j.tws.2016.05.020
Witkowska, M., & Soares, C. G. (2009). Ultimate strength of stiffened plates with local damage on the stiffener. UK: Taylor & Francis Group. doi:10.1201/9780203874981.ch16
Xu, M. C., Song, Z. J., Pan, J., & Soares, C. G. (2017). Ultimate strength assessment of continuous stiffened panels under combined longitudinal compressive load and lateral pressure. Ocean Engineering, 139, 39-53. doi:10.1016/j.oceaneng.2017.04.042