journal of maritime transport and engineering · estonian maritime academy of tallinn university of...
TRANSCRIPT

ESTONIAN MARITIME ACADEMY OF
TALLINN UNIVERSITY OF TECHNOLOGY
LATVIAN MARITIME ACADEMY
RESEARCH INSTITUTE
LITHUANIAN MARITIME ACADEMY
JOURNAL OF
MARITIME TRANSPORT
AND ENGINEERING
Volume 6, No 1
ISSN 2255-758X
2017

2
EDITORIAL BOARD: Editor-in-Chief
Members Assoc. prof. Ph. D. Taner Albayrak, Piri Reis University (Turkey)
Prof. Ph. D. Anatoli Alop, Estonian Maritime Academy of TUT (Estonia)
Prof. Dr. sc. ing. Rüdiger Böhlhoff, Hochschule Emden/Leer (Germany)
Prof. Dr. sc. ing. Aleksandrs Gasparjans, Latvian Maritime Academy (Latvia)
MBA Maurice Jansen, STC-Group, Shipping and Transport College (Netherlands)
Ph. D. Heiki Lindpere, Tallinn University (Estonia)
Prof. Dr. sc. ing. Viktoras Senčila, Lithuanian Maritime Academy (Lithuania)
Prof. Dr. habil. sc. ing. Zahid Ziyadkhan Sharifov, Azerbaijan State Marine Academy (Azerbaijan)
Prof. Dr. hist. Helēna Šimkuva, Latvian Maritime Academy (Latvia)
Prof. Dr. habil. sc. ing. Wiesław Tarełko, Gdynia Maritime University (Poland)
Prof. Dr. habil. sc. Alexander Yalovenko, Admiral Makarov State University of Maritime and Inland
Shipping (Russia)
Host organizations:
Estonian Maritime Academy of TUT
Latvian Maritime Academy
Lithuanian Maritime Academy
EDITORIAL CORRESPONDENCE Latvian Maritime Academy
Research Institute
www.latja.lv
12 k-1 Flotes Street, Riga, LV-1016, Latvia
Phone: (+371) 67161111; fax (+371) 67830138
E-mail: [email protected]
Each article submitted to the journal is subject to double blind-peer review.
Copyright © Latvian Maritime Academy, 2017

3
CONTENTS
Arnis Bankovičs, Inese Barbare
A COMPARISON OF NON-TECHNICAL SKILL LEVELS FOR CURRENT SHIP CAPTAINS AND UPCOMING OFFICERS IN CHARGE OF NAVIGATIONAL WATCH ................................ 5
Teona Dzneladze, Mamuka Baramidze
ROLE OF GEORGIAN PORTS AS LOGISTIC HUB IN TRANSNATIONAL PROJECTS ........... 12
Marino Fonseca, Alfredo Trueba, Luis M. Vega, Sergio García
CHARACTERIZATION OF LEAKAGE VERIFICATION PROCEDURES IN REFRIGERATION CIRCUITS APPLIED TO MARITIME CONTAINERS ................................. 17
Jānis Kasalis, Ivars Kassalis
INFLUENCE OF NEW PANAMA CANAL ON CARGO VOLUMES, CAPITAL INVESTMENTS AND SHIP SIZES IN THE AMERICAS REGION .............................................. 26
Tariel Kokoladze, Luiza Sikharulidze, Medea Abashidze, Zurab Bezhanovi
OPPORTUNITIES FOR INCREASING TRANSIT POTENTIAL OF GEORGIAN SEA PORTS ...................................................................................................................................... 34
Nino Kurshubadze
ROLE of ISO 14001:2015 IN SUSTAINABLE ASSURANCE OF MARPOL CONVENTION REQUIREMENTS ....................................................................................................................... 40
Tsiuri Kurshubadze, Makvala Bekirishvili, Luiza Sikharulidze, Kristine Zarbazoia,
Zurab Bezhanovi
ANALYTICAL REVIEW OF GEORGIAN MARITIME PORTS DEVELOPMENT AND ORGANIZATION ......................................................................................................................... 47
Saulius Lileikis
PSYCHOANALYTIC SYMBOLISM REGARDING SKILLED SEAPORT WORKERS’ RESISTANCE TO PSYCHOLOGICAL DEFENSE MECHANISMS ............................................ 53
Kristaps Lūkins
OPPORTUNITIES OF IMPROVEMENT IN LEARNING COLREGS AT LATVIAN MARITIME ACADEMY ................................................................................................................ 60
Z. Z. Sharifov, F. N. Gurbanov
THE EFFECT OF THE PHASE COMPOSITION OF THE ANODE MATERIAL ON THE PROCESS PARAMETERS AND THE FORMATION OF THE RESULTING COATINGS IN ELECTROSPARK ALLOYİNG (ESA) ..................................................................................... 66
Fabian Struwe, Laurentiu Chiotoroiu
THE APPLICATION OF THE POLAR CODE ON THE NORTHERN SEA ROUTE .................... 71

4
Rusudan Vadatchkoria
SOME THEORETICAL AND PRACTICAL APPROACHES TO HUMAN ANATOMY TEACHING FOR THE IMO MODEL COURSE 1.13 “ELEMENTARY FIRST AID FOR SEAFARERS” ND 2-TP07-07 ..................................................................................................... 78
REQUIREMENTS FOR MANUSCRIPTS.................................................................................... 83
5
A COMPARISON OF NON-TECHNICAL SKILL LEVELS FOR
CURRENT SHIP CAPTAINS AND UPCOMING OFFICERS IN
CHARGE OF NAVIGATIONAL WATCH
Arnis Bankovičs Latvian Maritime Academy, 12 k-1 Flotes Street, Riga, LV-1016, Latvia,
E-mail: [email protected], phone: +37167161126
Inese Barbare Latvian Maritime Academy, 12 k-1 Flotes Street, Riga, LV-1016, Latvia,
E-mail: [email protected], phone: +37167161126
Abstract
Non-technical skills are a set of human cognitive and social skills which are integrated and used
along side with technical skills. Non-technical skills manifest themselves during routine procedures and
non-standard situations [4]. The analysis of accidents and routine work helps to assess how non-
technical skills affect working environment and people [3].
The term „non-technical skills” was first discussed in the aviation industry in the 60s and 70s as
part of investigating plane crashes and other accidents [13]. During the 70s non-technical skills were
looked upon even in the field of aeronautics when NASA (National Aeronautics and Space
Administration) analyzed its pilots with interviews and specific tasks on the flight simulator. As a result it
was decided that non-technical skills along with technical skills is an important part of decision-making,
communication and teamwork [9]. Other fields of work that are associated with an increased risk and
safety aspects, such as the nuclear industry, aviation and military industries also continue to further
explore the value of non-technical skills. In each of these fields of work it is important to define the most
valuable non-technical skills for a specific profession and how to further develop this set of skills during
early studies and the learning process as a whole [13].
The aim of the article is to compare the non-technical skill level of current ship captains and
upcoming officers in charge of navigational watch (students) in order to determine the themes in need of
improvement for the overall study process. Improving different themes in both early and late years of
studies will further help current students develop the necessary non-technical skills for their future
profession in the maritime industry.
The article analyzes theories on non-technical skills and identification methods for such skills as
well as set out five already existing non-technical skills in the maritime industry and provides a clear
definition for the term „non-technical skills”. As a direct result of theory analysis the acquired data is
used in an empirical study. The identification and comparison of non-technical skills in further research
is planned to ensure steady improvements on the upcoming officers in charge of navigational watch study
process and integration of technical and non-technical skills.
In result of conducted research by comparing both good and poor performance displays of non-
technical skills for a group of experts along with a special control group, it can be concluded that the all
the skills, both good and poor performances are in need of better development, with the sole exception of
team work skills by the expert group. The good results in this specific skill demonstration exceed the
performance of the control group. This is can be explained as part of the opportunities offered by the
current era of communication and technology. The poor performance results of the assessed skills are to
be improved.
Keywords: non-technical skills, officer in charge of navigational watch, behavioral markers.
Introduction
The explanation of non-technical skills in modern pedagogy requires a new approach. It is important
to understand not only the nature of these skills, but also to see the way of obtaining them. These
problems are associated with the integration of new knowledge and skills, innovations in the field of
human cooperation pedagogy and the actualization of competence training during studies.
It is ever so important to establish a balance between acquiring knowledge to perform certain
practical activities and learning to actually think and assess the situation. The modern professional quality
of education is more focused on the acquisition of specific information and the ability to put it into

6
practice, which is how it is being done so far, as well as personality self-development and the use of self-
experience, which has not been given much attention.
During the preparation of engineering specialists on the level of modern day higher education, more
and more attention is paid to such a study process in which future specialist acquire specific skills in
accordance to the selected sectors of the economy along with communication skills, creative and critical
thinking, decision-making and problem-solving skills, organizational skills and willingness to take
responsibility as well as ability to work with information.
The assurance of quality for the acquisition of upcoming officers in charge of navigational watch
competencies during the study process can be viewed as a targeted system, in which it is essential to plan
the study process and manage it accordingly along with monitoring the quality of it all.
Consequently, it is likely that upcoming officers in charge of navigational watch do not understand
the following two concepts: learning as a purposeful process of cognition and learning as a process of
developing specific knowledge and skills [14]. If a student acquires the appropriate techniques of
learning, the study process affects not only his intellectual and emotional development, but also helps to
learn better social skills and increase self-esteem.
It is true that in certain situations it is important for the student to learn the particulars of the facts,
formulas, or other information. But this cannot become the dominant path, since it discourages any
analytical evaluation of the given information and search for causes and consequences. It does not allow
for analysis, synthesis, comparison or evaluation process to link past experiences with any new
information and thus to create new knowledge.
The correlation of non-technical skills and technical know-how is highly positive - as for an
individual person's social skills as well as a whole team’s set of skills in comparison with their level of
technical knowledge and individual skill [2].
So it is essential to compare the ship captain and upcoming officers in charge of navigational watch
non-technical skill levels in order to determine the themes in need of improvement.
The aim of the article is to compare the non-technical skill level of current ship captains and
upcoming officers in charge of navigational watch (students) in order to determine the themes in need of
improvement to up the level of non-technical skill acquisition.
Methods and materials
The article analyzes the theories in relation to non-technical skills and the identification of such
skills to be used on a ship's bridge simulator as well as empirical research results to identify and compare
the captains and upcoming officers in charge of navigational watch non-technical skill levels. Empirical
research is carried out during the observation and analysis of audio/video recordings. The gathered data
was processed using SPSS software, the methods used: statistical data processing (arithmetic average and
standard deviation), graphic data processing. The study included three experienced ship captains as the
group of experts and four Latvian Maritime Academy 4th year students - upcoming officers in charge of
navigational watch as the control group.
Results
As for previous research experience in the necessity for non-technical skill acquisition for various
branches of engineering specialists, analysis of specialized training courses and the assessment of the
results achieved, it should be noted that each of the engineering industries pay attention to similar non-
technical skills, but mostly focus on those part of a risk probability area:
• the aviation industry trains skills such as situation analysis, decision-making, teamwork,
leadership, stress management, fatigue control;
• oil exploration and nuclear power industries assess the importance of situation analysis, decision
making, communication, teamwork, ability to evaluate the work process and the results as a whole,
general management skills, stress management, fatigue control;
• rail transport industry - situation analysis, decision making, communication, teamwork,
leadership, stress management, fatigue control, conscientiousness;
• the maritime industry - situation analysis, decision making, communication, teamwork, ability to
evaluate the work process and the results as a whole, general management skills, stress management,
fatigue control. [1; 3; 6; 9; 11].

7
It can be surely noted that the representatives of different engineering specialties employed on oil
platforms at sea or the operation of nuclear power plants, according to the specifics of their work are
needed to be on a directly equivalent level of non-technical skills and the management of these necessary
skills to avoid any factors of possible human error and the threats of potential consequences caused by
such error.
By collecting and analyzing theories on non-technical skills in different professions and sectors of
work, it is found that, overall, there is talk of the eight prime non-technical skills. Further analysis of both
the theory and practice along with critically analyzing the nature of each skill, it is found that in the
maritime sector one can speak of five non-technical skills:
• decision-making skills;
• teamwork skills;
• ability to evaluate the work process and the results as a whole;
• leadership skills;
• self-control skills.
Theory analysis suggests that non-technical skills are abilities in the process of different engineering
activities, by using personal resources independently or cooperatively in a team, to get information and be
able to evaluate it critically, make decisions in order to provide targeted and reliable operation and
assessment of the many technical processes. Non-technical skills complement the technical knowledge
and skills in everyday and emergency situations.
As one of the most appropriate means to achieve a set goal, there are certain signs and expressions
of the actions, which can be used to accurately assess both individual work, as well as teamwork. Signs
are required to identify positive or negative task execution and afterwards suitable for detailed analysis of
the causal link. This practice in the analysis process of plane crashes is described by B. Klampfer’s team
of researchers from the Swissair airline training center [7], but it can be successfully adapted to the
maritime industry, identifying the incidents caused by human error.
Defining the behavioral markers is directly dependent on research objective and tasks, that is, a
behavioral marker describes the causal link, allowing to unmistakably notice and record specific skills
and assess whether the performed action is best for the current situation. There should not be any personal
touch or treatment features. Phraseology should be as simple and clear as possible, the marker should
describe a direct concept [12]. The more the detailed features will be divided into sub-categories, the
easier it will make the observation of processes, coding and analysis of recordings. As an example B.
Klampfer notes the non-technical skills of team work. This skill consists of team-building and active
maintenance, but the behavioral marker which shows a positive action is helping teammates [7]. In turn,
P. O'Connor and M. Long notes that the behavioral marker system has some important limitations, which
do not always let to achieve the results needed, because not all the features may be noticed and recorded
during the process of analysis, and different interpretation of the various situations is likely to mislead the
person under surveillance and thus the predictable behavioral marker, which can be classified as human
error, will simply not appear [12].
This study identifies behavioral markers of upcoming officers in charge of navigational watch non-
technical skill identification, according to the non-technical skills and adapting research experience from
fields such as medicine, aviation and the maritime sector, in which a variety of non-technical skills
components have been studied. Some bright examples are R. Flin’s non-technical skill assessment system
NOTECHS for aviation pilots' command interoperability analysis [4], Danish Institute for Medical
Simulation (DIMS) research group led by H. T. Lyk-Jensen and their developed methodology for non-
technical skills training for anesthesia nurse in a simulation environment N-ANTS [8] and A. Mundt’s
method to work with the simulator SPLINTSdk (Scrub Practitioners' List of Intraoperative Non-Technical
Skills) [10]. One of the few published studies with behavioral markers of use in the maritime sector is the
work of British researchers D. Gregory and P. Shanahan, which deals with the importance of the human
factor in the maritime sector, as measured by the behavioral markers [5]. The markers for detecting and
indicating the non-technical skill that are compiled and adapted in the maritime sector for are summarized
in Table 1. Each non-technical skill has been defined by good and poor performance criteria.

8
Table 1. Non-technical skills evaluation criteria and indicators
Skill Criteria Good performance indicators (L) Poor performance indicators (V)
Dec
isio
n-m
akin
g s
kills
(LP
P)
Identification of the problem
Collect information and identify problems
Unable to identify the problems
The choice of options and its coordination with the team
Recognize and identify types of solutions, identify with views of the rest of the team members and coordinate those with your choices for a solution
Unable to recognize and identify types of solutions, not asking team members to express their views
Risk assessment Consider and discuss with the rest of the team the risk associated with a particular choice
Unable to share the risks of a particular choice (adapted by Flin, 2003)
Tea
mw
ork
ski
lls (
PS
K) Transfer of information
and communication
The use of standard terminology, use of non-verbal signals where appropriate, report to the crew about major events, providing a calm voice tone and volume according to the situation
Inappropriate language used for communication, use of non-verbal language in situations where the verbal is more suitable, conceal of important facts, inappropriate tone of voice and volume (adapted by Mundt 2014 and Lyk-Jensen 2014)
Team management and creation of positive relationships
Creates an atmosphere of open communication (dialogue)
Unable to create open communication (dialogue)
Reaction in situations of conflict
Keeping peace in times of conflict, proposing solutions to conflicts, respecting the universally accepted norms of behavior
Not being able to be flexible, failing to consider any compromise, offending other members of the crew (adapted by Flin, 2003)
Ab
ility
to
eva
luat
e th
e
wo
rk p
roce
ss a
nd
th
e
resu
lts
as a
wh
ole
(PV
D)
Awareness of ship systems
Observes and reports on changes in any of the ship systems
Does not ask for updates on the ship systems
Awareness of the surrounding environment
Collecting information on the surrounding conditions (location, weather, traffic)
Does not give a message to any partners about the current circumstances or is surprised by the situation
Analysis of different events and causality
Discusses emergency scenarios (the correlation between recent events and possible outcomes)
Does not discuss the relationship between any recent developments and possible future incidents (adapted by Flin, 2003)
Lea
der
ship
ski
lls (
KV
P)
Authority in the team/group
Taking the initiative to involve the crew in the ongoing processes on board
Deters any crew members from engaging in ongoing processes on board
Following the set standards
Controlling management of tasks according to the set standards, if necessary, consulting with the crew if necessary to derogate from any standards
Not controlling the execution of certain tasks in accordance with the set standards on board. Departing from the standards without consulting with the crew
Planning and coordination
Encourages the crew to participate in planning and to get things done, handing out the tasks among the crew members according to their abilities
Planning alone, trying to accomplish all the work by himself, ignores signs of stress from the crew members (adapted by Flin, 2003)
Sel
f-co
ntr
ol s
kills
(P
P) Reaction in situations of
high stress
Keeps a neutral position no matter the reactions of the crew, keeps transparency on all the technical means of the ship regardless of how stressful the situation.
Poor response in relation to the ongoing (voice change intonation, vocabulary usage, non-verbal language), there is no good organization with regard to the technical means used (adapted by Mundt 2014)
Concentration and appropriate behavior
Staying focused and being able to track the information and figures, follow standard behavioral norms on board.
Problems in staying focused, inability to keep track of complicated information and figures, ignoring the norms of behavior (adapted by Gregory, 2010)

9
The developed criteria and indicators will be used in the empirical study to determine the non-
technical skill level of the ship captains and upcoming officers in charge of navigational watch.
All study participants were informed about the objective of the study, the following procedures and
their content. All voluntarily agreed to participate in the study. In total, there were 7 participants (3 expert
groups and 4 control groups) which took 10 minutes of practical navigation tasks on the ship's bridge
simulator Transas NTPRO 5000. Task description:
o 12:00 – ship is on the ship traffic distribution system in good visibility with a compass course of
052,0º, there are vessels heading towards the ship and others passing it by, the shipping area - Bosphorus
Strait;
o 12:03 – visibility deteriorates to 1.0 nautical miles, there are vessels heading towards the ship
and others passing it by;
o 12:05 – ship enters a zone of fog, visibility is 0.3 nautical miles, there are vessels heading
towards the ship and others to pass it by;
o 12:07 – steering device stops working, there are vessels heading towards the ship and others to
pass it by;
o 12:10 – turn to a new compass course 013,5º, vessels heading towards the ship and others
looking to pass it by.
Ship module used in the practical simulation task:
• chemical tanker
• displacement – 8682 t
• deadweight – 6503 t
• length – 110 m
• width – 16,1 m
• draft – 7,1 m
• one engine – 2405 kw
• fixed pitch propellers,
• maximum speed – 13 knots.
Practical exercises on the ship's bridge simulator were recorded with audio/video surveillance
equipment (a video camera and a microphone). 3 experts/psychologists were invited for non-technical
skills identification in the recordings by the criteria and indicators developed (see. Table 1). The
identification of non-technical skills in all the audio/video recordings was carried out during 2016/2017.
Each recording was reviewed 6 times, each time adding to the previously noted non-technical skills
indicators. For each criteria the expression of good or poor performance indicators experts awarded one
point. During the task the team on ship’s bridge consisted of 3 members (captain, watch officer and a
helmsman). Each participant of the experiment was in the role of the captain, during what the necessary
measurements were recorded.
The study findings from both the expert group and the control group and their average use of non-
technical skills will be compared to determine non-technical skills that need to be improved (both good
and poor performance) for the upcoming officers in charge of navigational watch preparation process.
The assessments made by the 3 experts/psychologists during the study were calculated into an
average (VID) for each of the five non-technical skills. In accordance with the criteria developed, each
skill has a good performance indicator and a poor performance indicator, which forms a total of 5 good
and 5 poor performances.
The estimated average rating by the 3 experts/psychologists for the expert group are summarized in
Table 2.
Table 2. Averages of non-technical skills for the expert group
Statistical
indicator
LPP_L
_VID
LPP_V
_VID
PSK_L
_VID
PSK_V
_VID
PVD_L
_VID
PVD_
V_VID
KVP_L
_VID
KVP_V_
VID
PP_L_
VID
PP_V_
VID
N Plausible 3 3 3 3 3 3 3 3 3 3
Arithmetic
average 7,33 0,33 26,11 6,33 13,89 1,78 7,67 4,78 4,22 2,78
Standard
deviation 2,90 0,34 3,91 4,16 1,50 1,07 4,10 2,46 1,02 3,98

10
It is concluded that the experts/psychologists more often evaluated the expert group with lower
values than the arithmetic average of all skills for the poor performances and self-control skills
considering the good performance. Each good and poor performance of the expert group is comparable
only with the appropriate criteria of good and poor performances of the control group. In no way are the
skill performance results comparable within the same group.
Similarly, the average set of five non-technical skills for the control group were analyzed by the 3
experts/psychologists, both good and poor performances for each skill. The obtained data is summarized
in Table 3.
Table 3. Averages of non-technical skills for the control group
Statistical
indicator LPP_L
_VID
LPP_V
_VID
PSK_L
_VID
PSK_V
_VID
PVD_L
_VID
PVD_
V_VID
KVP_L
_VID
KVP_
V_VID
PP_L_
VID
PP_V_
VID
N Plausible 4 4 4 4 4 4 4 4 4 4
Arithmetic
average 2,75 0,58 31,75 8,25 6,42 3,75 3,25 5,50 2,09 1,25
Standard
deviation 2,06 0,69 18,14 3,44 3,42 1,64 1,23 3,43 2,83 1,17
As the readings for every good and poor performance indicator are assessed separately when
analyzing the arithmetic average and the standard deviation, it is concluded that for some readings the
expert/psychologist assessments have not been consistent. This can be explained by the small number of
participants in the group (N=4). For the same reason normality and kurtosis was not determined. It is
concluded that the experts/psychologists often assessed the control group at lower values than the
arithmetic average for decision-making skills to both the good and poor performance indicators, the poor
performance indicator to teamwork skills, good performance indicator for the ability to evaluate the work
process and again both the good and poor performance of self-control skills. In order to determine the
topics in need of development for the study process, performances of both the expert group and the
control group are summarized in Figure 1. The good performance results are more positive as the score
goes higher. The poor performance results need the lower score for a more positive result.
Figure 1. Average performance results of the expert group and the control group
The overall conclusion is that both the good and the poor performance of the expert group is more
positive than the performance of the control group, with the sole exception of thee non-technical skill of
working in a team. Here the good performance indicator for the control group is significantly more
positive. This can be due to the modern day communication and technology era and the possibilities for
the development of these skills at a young age in school, thus the current students are prone to know how
to work properly in a team manner. Comparing the good and the poor performance of both groups it can
be concluded that there is room for improvement to all non-technical skill performances, both good and
7,3
0,3
26,1
6,3
13,9
1,8
7,74,8 4,2 2,82,8
0,6
31,8
8,36,4
3,8 3,35,5
2,1 1,3
0
5
10
15
20
25
30
35
Rai
tin
g in
po
ints
Achievements of good and weak skills
Expert Group performance Control Group performance

11
poor. The only exception is the good performance indicator of the teamwork skill, which are much more
positive than the performance by the expert group consisting of actual ship captains. There is still room
for development to the poor performance results for this particular skill.
Conclusions
Non-technical skills are abilities in the process of different engineering activities, by using personal
resources independently or cooperatively in a team, to get information and be able to evaluate it critically,
make decisions in order to provide targeted and reliable operation and assessment of the many technical
processes. Non-technical skills complement the technical knowledge and skills in everyday and
emergency situations.
Behavioral marker identification system is suitable for indentifying non-technical skills, a behavioral
marker describes the causal link, allowing to unmistakably notice and record specific skills and assess
whether the performed action is best for the current situation.
In the process of preparing the upcoming officers in charge of navigational watch additional
attention should be paid to their decision-making skills, skills to evaluate the work process and the results
as a whole, leadership skills and self-control skills. There is no need to currently put more emphasis on.
References
1. Bonsall-Clarke, K. (2012). Operations and Management Non-technical skills required in train
driver role: Developing an integrated approach to NTS training and investment.
2. Brunckhorst, O., Shahid, S., Aydin, A., Khan, S., Mcllhenny, C., Brewin, J., Sahai, A., Bello, F.,
Kneebone, R., Khan, M. S., Dasgupta, P., Ahmed, K. (2015). The Relationship Between Technical And
Nontechnical Skills Within A Simulation-Based Ureteroscopy Training Environment. Journal of Surgical
Education. DOI: 10.1016/j.jsurg.2015.04.002.
3. Flin R., Maran N.(2015). Basic concepts for crew resource management and non-technical skills.
Industrial Psychology Research Centre, University of Aberdeen, King's College, Old Aberdeen;
Department of Anaesthetics, Royal Infirmary of Edinburgh.
4. Flin, R, Martin, L., Goeters, K.M, Hörmann H.J, Amalberti, R., Valot, C. and Nijhuis, H. (2003).
Development of the NOTECHS (non-technical skills) system for assessing pilots’ CRM skills. Human
Factors and Aerospace Safety 3(2), 95-1.
5. Gregory, D., Shanahan, P. (2010). The human element: Guide to human behaviour in the
shipping industry. The Stationery Office (TSO), Norfolk, UK. 120.lpp.
6. Hetherington, C., Flin, R., Mearns, K. (2006). Safety in shipping: The human element. Journal of
Safety Research 37, 401–411.
7. Klampfer B., Flin, R., Helmreich, R. L., Häusler, R., Sexton, B., Fletcher, G., Field, P., Staender,
S., Lauche, K., Dieckmann, P., Amacher, A. (2001). Enhancing performance in high risk environments:
Recommendations for the use of Behavioural Markers, Swissair Training Centre, Cīriche, 30.lpp.
8. Lyk-Jensen, H.T., Spanager, L., Malene, R., Ǿstergaard, D., Dieckmann, P. (2014). N-ANTS
Handbook. The Danish Institute for Medical Simulation. 16.lpp.
9. Moffat S.,Crichton M. (2015). Investigating Non-Technical Skills through team behavioral
markers in oil and gas simulation-based exercises. Procedia Manufacturing 3 ( 2015 ), pp. 1241– 1247
10. Mundt, A., Spanager, L., Malene, R., Ǿstergaard, D., Dieckmann, P. (2014). SPLINTSdk User
Guide. The Danish Institute for Medical Simulation. 11.lpp.
11. O’Connor, P., Flin, R. (2003). Crew Resource Management Training for offshore oil production
team. Department of Psychology, Safety Science, 591-609.
12. O’Connor, P., Long, M. W. (2011). The development of a prototype behavioral marker system
for US Navy officers of the deck. U., S. Navy Research, University of Nebraska – Lincoln. 11.lpp.
13. Saeed F., Wall A, Roberts C., Riahi R., Bury A. (2016). A proposed quantitative methodology
for the evaluation of the effectiveness of Human Element, Leadership and Management (HELM) training
in the UK. Springer, IAMU section article.
14. Žogla, I. (2001).Didaktikas teorētiskie pamati. Rīga: RaKa.

12
ROLE OF GEORGIAN PORTS AS LOGISTIC HUB
IN TRANSNATIONAL PROJECTS
Teona Dzneladze, Mamuka Baramidze Batumi State Maritime Academy, Batumi, Georgia
E-mail: [email protected]
Abstract
Georgia’s location at the Black Sea in the South Caucasus, connecting Western Europe and Central Asia,
as well as Russia and Turkey on a north-south axis makes up its geopolitical advantage and great
potential for economic development, which needs appropriate evaluation and using. Correct approach
can make Georgia as a Transportation Center of the Caucasus, partially it operates so by now, but if we
look at the increased interest in the region, also Georgia’s attraction by EU Integration, main condition
of which is the healthy economic environment, then it is clear that soon Georgia will be integrated in EU
and its economic potential will enact with its full economical capacity. Georgia will have to change its
way from letting economic development to follow the flow, to the well effective and well planned
economic policy, which requires a fully functioning infrastructure, including development of the
transporting and private maritime infrastructure. Becoming a major regional transit and logistic hub is
thus a priority for the Georgian Government, as stated in its National Transport Policy. From the
corridor perspective Georgia is situated along the shortest link between Western Europe and Central
Asia, through Azerbaijan and the Caspian Sea, for transportation of oil and gas, as well as dry cargo.
The role of Georgia Sea Ports is vital in this chain. The combination of Transport Strategy of
Government of Georgia, TRACECA and new Silk Road make its positive contribution in formation of
Georgia as logistics hub of regional importance.
Keywords: ports, Georgia, logistic hub, TRACECA, Silk Road
Introduction
In the wake of establishing Georgia as a regional center of Caucasus, it is very important of
Government to use all of its economic potential. Not a secret that Georgia is attractive for western
developed and Asian rapidly developing countries as a transit region. The main issue of interest for
investors in Georgia right now is its rich hydro resources and transportation arteries. For government of
Georgia development of Transport Infrastructure and formation of Georgia as main transit country is one
of the priorities. They are doing their best to present the transporting infrastructure as much more
attractive, and do their best to make foreign investors to invest more in this sphere. For better
performance some researches should be conducted, what is maximum output in case of its full load;
create an attractive legal framework for the transporting, review the tariff policy in every type of
transporting, especially making possible combination of maritime, land and railway transportation. When
discussing these topics, western experience should be taken into account.
Georgia’s location at the Black Sea in the South Caucasus, connecting Western Europe and Central
Asia, as well as Russia and Turkey on a north-south axis makes up its geopolitical advantage and great
potential for economic development, which needs appropriate evaluation and using. Correct approach can
make Georgia as a Transportation Center of the Caucasus, partially it operates so by now, but if we look
at the increased interest in the region, also Georgia’s attraction by EU Integration, main condition of
which is the healthy economic environment, then it is clear that soon Georgia will be integrated in EU and
its economic potential will enact with its full economical capacity. Georgia will have to change its way
from letting economic development to follow the flow, to the well effective and well planned economic
policy, which requires a fully functioning infrastructure, including development of the transporting and
private maritime infrastructure. Becoming a major regional transit and logistic hub is thus a priority for
the Georgian Government, as stated in its National Transport Policy.

13
Figure 1. “National Transport Policy” Ministry of Economy and Sustainable Development of Georgia
Economic context
Georgia’s economic growth steadily increased in past decade, resulting in a significant increase in
imports and exports. Exports (main exported products are: metal products, minerals, wine products and
other food supplies) grew from around 865 million USD in 2005 to 2,820 million USD in 2016, import
grew from around 2,500 million USD to 8,500 million USD (mainly petroleum, automobiles, natural
gases).
The relative high growth in 2014 (+4,8%) was driven by an increase in private investment and
public consumption, supported by greater policy certainty, the opening of Russian market and the signing
of the Association Agreement with the European Union. In 2015, however, the growth rate moderated
from 4,8% to 2,5% as a result of a weaker external environment. Nonetheless, demand of goods, services
and related freight transportation activity is expected to continue to increase in the long-term. In that
framework, achieving more efficient and sustainable transportation system is a key factor ensuring
competitiveness and economic growth.
From the corridor perspective Georgia is situated along the shortest link between Western Europe
and Central Asia, through Azerbaijan and the Caspian Sea, for transportation of oil and gas, as well as dry
cargo. Main trade flows along East West corridor are facilitated by the expansion of the transportation
infrastructure, including the East West highway, the railway network, oil and gas pipelines, seaports, and
three international airports.
Georgian maritime transport system - port infrastructure
The Georgian port system comprises two medium-size bulk, general cargo and container port, Poti
and Batumi, plus dedicated oil terminals at Supsa and Kulevi. The two largest ports of Poti and Batumi
are managed by two globally reputed operators.
Port of Poti is the main maritime gateway in Georgia, and a spearhead of the corridors that transit
the Caucasus region leading to the Black Sea, with direct access and connections to the East-West
Highway. The port spands 30 hectars and consists of 14 berths extending over 2,9 km.Poti port operators

14
is undertaking investments to expand its off-dock container storage capacity with a new Inland Container
Depot (ICD) and started works to reconvert a berth to allow vessels with a draft of 12 meters. These
investments would increase the capacity from 600,000 TEU to 1 million TEU by 2017.
Batumi is predominantly a liquid bulk terminal. Depending on year crude oil and oil products can
represent up to 80-90% of the total turnover. Batumi port operator, Batumi International Container
Terminal, handled around 62,000 TEU in 2016. Both Poti and Batumi port are directly linked to the
Georgian railway network and to the East West highway network.
Port of Batumi is a major cargo terminal in the Caucasus and is often used by neighboring
Azerbaijan as transit point for making energy deliveries to Europe. Sheduled and chartered passenger
ferry service link Georgia with Ukraine and Turkey. The port has five separate berths for oil, containers,
rail ferry, dry cargo, and passangers, and a conventional buoy mooring for larger vessels with depth of
13,6 meters. The capacities of the oil and dry cargo berths are 15,0 million tons and 2,1 million tons,
respectively. The two container berths have a combined capacity of 300,000 TEU year, but their drafts are
only 11,7 meters. The ferry berth can accept 108 eight-wheel rail wagons, is completely automated, and
can handle about 0,7 million tons cargo per year. The total area of the port is 13,6 hectares, of which only
3,6 hectares have been developed. Therefore, the port have space for further expension, although the
immediate need is for improving handling equipment and berth.
To further increase transshipment of cargo, the Government of Georgia is developing a new deep
sea project – Anaklia Port. The Anaklia Port would be located in Samegrelo-Zemo Svaneti Region, where
the Enguri River flows into the Black Sea. It is roughly estimated that within 3 years of operation, the
annual turnover would reach 7 million tons, while within 12 years it could reach 40 million tons. Anaklia
port will be located at the coast which has the deepest canyon in the Black Sea canyon, allowing 16
meters of draft. Current ports of Georgia in Poti and Batumi can handle only vessels around 1,500 TEU.
New port will allow accommodating Post-Panamax size ships.
From commercial side Georgia plans to reemerge its position as main transit corridor between China
and Europe as the shortest distance to transport goods overland between them goes through South
Caucasus.
Anaklia Deep Sea port project will allow Georgian Government to establish its position as a major
station on a revived Silk Road. Government of Georgia signed agreement with Anaklia Development
Consortium (ADC) on construction of port. Port construction will be divided in seven phases, with 586
million USD already allocated by the ADC for the first phase.
Table 1. Phases of Anaklia Port construction
Phase Construction Capacity Mln. tone
1 3 years 7
2 7 years 20
3 12 years 40
4 90% Using 55
5 90% Using 70
6 90% Using 85
7 90% Using 100
According to National Transport Strategy of Government of Georgia the port of Anaklia will give the
following advantages:
- Strategic location
- Capacity to receive Panamax type of vessels
- One stop shop solutions
- Simple and fast procedures
- All year round safe navigation.
As a result Georgia will develop its transit potencial, promote logistics and industrial potential and the
most important creat new jobs.
International maritime transport volumes
Key trends in maritime transport in Georgia include relatively high share of transit cargo, incresing
share of Poti port vis-à-vis other ports, and a sharp increase in containerized cargo handling. Overall
maritime volume has been relatively steady or marginally decreasing since recovery from economic

15
downturn in 2009. (GEOSTAT) Poti port’s container cargo constitutes 27% of the volume handled, while
bulk cargo (36%), liquid cargo (16%), break bulk (10%), and roll-on and roll-off traffic (11%) make up
the rest. About 46% of the cargo is transit traffic, while imports make up 37% and exports 17%. While
total cargo handled grew at 10% per annum from 2009 to 2011, the number of containers handled
increased sharply at a rate of 17,5% per annum during 2009-2014.
The number of toms handled at Batumi port has decreased after a peak in 2010, at 22,7 million tons,
to 20,3 million tons in 2016. Batumi port handled 5,3 million tons of oil, 1,5 million of bulk dry cargo,
and 45,442 TEU in 2011, and the cargo composition has remained largely stable thereafter, with an
exception of moderate increase in containerized cargo. Transit cargo turnover increased by 6% and made
43% of the total turnover, of which 80% is destined to Azerbaijan, while import and export cargos
decreased by 2% and 4% to make up 35% and 22%, respectively. The majorities of imports come from
Ukraine, and are mainly ore bulk. The main recipient country of Georgia export via Batumi Sea Port is
USA where 53% of total export turnover of the port was transshipped.
Volume of containerized cargo handled in Georgia ports have increased dramatically, particularly
thanks to remarkable growth of Poti port. Containerized cargo handled at Poti port increased from
172,000 TEU in 2009, 284,559 TEU in 2012, 331,324 TEU in 2013, and 384,992 TEU in 2014, 398,998
TEU in 2015. At Batumi, volume increased at similarly rapid rate during 2009-2012, albeit from a much
lower baseline, to 73,095 TEU in 2012, but since has stabilized ar decreased marginally, to 72,123 TEU
in 2013 and 61,980 TEU in 2015.
With 85% of the total Poti is by far the most important seaport for containerized cargo. Especially
after 2011, the steep increase in total number of containers ws entirely due to the increase at Poti. This
increase at Poti also caused a dropping share of Batumi in the total volume. Poti port customes handles
about 10,000 loaded TEU per month, 70% of which is inbound transit, 20% imports, 6% outbound
transits, and 4% export. Clearance and transit iniciation takes place in inland terminals located in Poti.
Container terminals capacity remains inadeqate to meet the growing containerization trends. Since
2004, dry and liquid cargo volumes handled in Georgian seaports have increased only marginally, at 4,3
and 0,8 per annum respectively, while conteinerized cargo volumes have increased at an average rate of
18,9% annually. Ongoing and planned investments in Poti port would increase the handling capacity from
600,000 TEU to 1 million TEU by end of 2017, which will translate to capacity increase at 18,5% per
annum; this would allow it to respond to the increasing demand.
Georgias maritime transport sector creates attractive logistics solution only together with Georgias
Air, Railways and Road transport. As aTRACECA corridor country Georgia is aimed to extend its
regional cooperation and is gradually implementing IGC TRACECA Strategy for developing of
international transport Europe-Caucasus-Asia corridor and creates sustainable infrastructure chain with
multi-modal transport which will allow integration into Trans-Europe Transport Network (TENs).
In its national strategy Georgian government has set three objectives related to transport: (i) make
Georgia a regional and logistics hub, and business platform; (ii) upgrade multimodal infrustructure; and
(iii) develop professional and higher education centers.
The capacity of major seaports on the west coast will remain constrained until the rail and road
capacities in the east-west corridor are increased.
The main logistics project of Georgia at the moment are:
1. Construction of Baku-Tbilisi-Kars New Railway Line
2. Railway Modernization Project
3. East-West Highway
4. Anaklia New Deep Water Black Sea Port
Georgias strategy in development its transport infrastructure and involvement in international
logistic projects made it interesting and one of key partners in Silk Road project which is main link
between Europe and Asia.
“The ‘One Belt, One Road’ initiative is a very important initiative for us. It offers a lot of new
opportunities to countries along the Silk Road,” said Prime Minister Kvirikashvili.
Silk Road Economic Belt and Amritime Silk Road projects, also called One Belt, One Road
(OBOR) project was first announced by President of China in 2013. At that time Georgia was not
considered in the project, but thing changed and already in 2016 Georgia was hosting Silk Road Forum in
Tbilisi. Gergia is admitted as a hub between Aisa and Europe.
For Georgia it means creating more jobs, building infrastructure, getting more FDI, and providing a
much-needed economic boost. Georgias struggle towards EU and NATO membership has become one of
the key points in the issue. It will also give the country China as a guarantor of stability in complicated

16
relations with Russia. Role of the main hub and strategic partner in Silk Road project will make Georgia’s
position on political map much stronger.
Maritime Transport Sectors role is vital in this project. The main project is considered above
mentioned Anaklia Deep Water Port. It is strategically located on the shortest route from China to
Europe.
Mamuka Khazaradze, founder and president of TBC Holding: “The Anaklia project represents a
one-of-a-kind investment in the restoration of the Silk Road that will pay dividends for generations of
workers in Asia and Europe.” The Anaklia Development Consortium was also awarded the right to
develop a free industrial zone on about 600 hectares of land adjacent to the port.
At the same time first transit train from China arrived to Georgia – marking opening of Silk Road. It
took 15 days for cargo to reach Georgia and it passed Kazakhstan and Azerbaijan and it will then pass by
sea from Georgia to Turkey. The cargo sent from Lianyungang in China (eastern port city) will reach
Istanbul 25 days short that if it was shipped by the sea rout.
Conclusions
Georgia with its strategic location as a link between Asia and Europe, with its willingness to be a
part of EU has big potential to benefit from key international logistics projects. Hosting Silk Road Forum
in Tbilisi placed Georgia at the forefront of region and it will establish itself as the hub of connectivity
network. This will allow not only encouraging investment into the country, but also profiting from the
Silk Road investment corridor through the region and positioning itself at the heart of Eurasian economic
connectivity. The key role in this issue will be given to construction of new port in Anaklia, which will
allow raising Georgia port capacities dramatically. With current maritime sector Georgia will not be able
to use entire potential provided by international projects.
References
1. Ministry of Economy and Sustainable Development of Georgia, National Transport Strategy,
2016, September.
2. Georgian National Investment Agency, Investment Climate and Opportunities in Georgia, 2016.
3. Maritime Transport Agency of Georgia, TRACECA Maritime Safety and Security, 2015.
4. GEOSTAT, External Trade Indicators, 2017, Available: (accessed on 22.03.2017):
http://www.geostat.ge/index.php?action=page&p_id=134&lang=eng.
5. Batumi Sea Port, Available (accessed on 02.02.2017): http://batumiport.com/news/eng.

17
CHARACTERIZATION OF LEAKAGE VERIFICATION
PROCEDURES IN REFRIGERATION CIRCUITS
APPLIED TO MARITIME CONTAINERS
Marino Fonseca, Alfredo Trueba, Luis M. Vega, Sergio García School of Maritime Engineering, University of Cantabria,
Department of Sciences & Techniques of Navigation and Ship Construction,
Gamazo 1, 39004, Santander, Spain
E-mail: [email protected], phones: +34 945 175 715, +34 637 708 433
Abstract
The evolution of portable refrigeration units and the refrigerants used with them has facilitated enormous
advances in autonomous refrigerated maritime shipping containers and temperature control. This has
permitted the shipping of products with very strict temperature requirements. It is very important to have
a correctly designed system in which the amount of fluid is calculated for a specific construction. A mass
above design requirements increases the cost of the finished product. If the mass of refrigerant is below
design requirements, more energy is required to maintain the target temperature and, therefore,
maintenance costs increase. This paper describes a process to test for leaks in refrigeration equipment.
This process can assure the tightness of refrigeration circuits against small leaks over their working lives.
Keywords: reefer container, production process, limits, permeability, leak.
Introduction
When a small leak of this fluid occurs in a refrigeration system, and this leak continues over time,
the performance of equipment, most importantly its capacity to control the temperature, progressively
diminishes [3]. On the other hand, if the mass of refrigerant gas is increased, performance does not
increase beyond design specifications [10]. Corberán [4] demonstrated experimentally and empirically the
existence of an optimal mass of refrigerant. Due to the reduced volume of mobile systems, which require
a minimal mass of refrigerant, it is especially important to maintain a sufficient quantity of refrigerant
fluid inside the refrigerant circuits over their working lifetimes. As such, for a refrigeration system
working with its optimal refrigerant mass, it is vital to avoid performance loss caused by refrigerant fluid
leaks
All refrigeration systems have a natural tendency to lose refrigerants, as their working pressure is
higher than atmospheric pressure. The most common leaks are found between the compressor and the
expansion value [12], which coincides with the greatest differences in pressure between the interior and
exterior of the circuits [6]. Leaks contribute to a reduction in performance, increased consumption by the
ship´s auxiliary systems and an increase in maintenance costs, including accelerated depreciation of
equipment. Further, depending on the refrigerant used, a leak can have an important economic impact
[12].
At present, the environmental impact of refrigerants is rapidly diminishing [14, 17, 19]. With respect
to the refrigerants most commonly used with mobile systems, the GWP (Global Warming Potential) of
HFC134a is 1430, for HFO134a: 1430, for HFO1244yf: 4 and for R744: 1.
The limit established in the Kyoto Protocol was 150 [9]. HFO1234yf performs slightly below
HFC134a, but its environmental impact rating is much lower and it has the great advantage of requiring
no modifications to existing circuits when used as a substitute [12, 20]. However, the use of more
environmentally sustainable refrigerants has its economic dimension. Although moderated through the
application of taxes on refrigerant gases with a high greenhouse effect, substitutes end up costing 13 times
more than conventional gases.
Due to both the obligation to comply with current legislation and the environmental and economic
impacts, it has become necessary to guarantee the complete tightness of refrigeration systems, assuring
the absence of leaks and porosities from the moment of fabrication and throughout their working lives.
An occasional leak might be relatively easy to detect, but a small structural leak can be very difficult to
find. Because of this, it has become necessary to develop a useful method of leak detection.
Leaks in refrigeration circuits can be located directly through halogen detectors [15], acoustic wave
sensors [1] immersion or UV (ultraviolet) amongst other techniques. Nevertheless, these methods are not
viable for or capable of locating the very small leaks that can affect the operation of refrigeration systems

18
over their lifespans. Leaks can be located through indirect methods in which other variables in the system,
such as, for example, pressure and temperature are observed. The results of these observations are
analysed from a statistical point of view [1, 21, 25, 26], or in comparison with other reference models [7,
19, 26].
The most classic leak test is detection through immersion, through which leaks down to a size of
7g/y can be detected, which can be considered a significant leak. This is an economical test, but one
difficult to apply and relatively ineffective [13]. Other methods based on leak detectors are limited by
their incapacity to detect small leaks, and these must be very close to the sensor used. The limitations of
the existing leak detection systems described above has created the need to develop new leak detection
methods.
Although some studies have been made about leaks detection in pipes using mathematical models, is
difficult to yield accurate mathematical results, especially in the detection of so small leaks in
refrigeration circuits that ensure the equipment tightness over their whole lifetime. Elaoud et al [5]
presented a technique for detection and location of leaks in a single pipe, by means of transient analysis of
pressure waves governed by two coupled non-linear, hyperbolic partial differential equations with
pressure dependent coefficients. It was tested with hydrogen-natural gas mixtures, and may be useful for
pipelines with flow but not when flow rate is null. Tian et al [18] proposed a locating algorithm based on
pressure difference profiles; the minimum detectable leak ratio was 1% for R22 and 4% for ammonia.
Some small leakages were undetectable and neglected by this method, and then it does not allow ensuring
the tightness over its useful life.
The best results in looking for leaks in mobile refrigeration equipment are obtained by combining
direct and indirect methods. The change in pressure inside circuits over a period of time is measured,
while variables such as the pressure applied, the temperature of the test, environmental humidity and the
fluid used are controlled. Statistical analysis is applied to test results.
To analyse the tightness at manufacture of circuit components, control methods such as pressure or
vacuum chambers are used, through the analysis of a tracer gas in a controlled atmosphere. In the
laboratory, there are many different means to search for leaks and the quality of the tests is superior,
primarily because there are no severe time limitations.
The most effective quality control technique that can be used once different components are already
assembled is the test of fall in pressure over time in a pressurized circuit. In this test, the circuit is filled
with inert gas, which helps eliminate humidity. It also facilitates the following test, that of measuring the
increase in pressure over time in a circuit containing a vacuum.
When a low density inert gas is used, such as helium, as well as locating leaks of a small diameter
equivalent due to the very small diameter of the helium molecule, comparison methods such as a gas
tracer can be employed. However, it must be taken into account that helium is capable of permeating
though flexible tubes and rubber joins (permeability). Helium molecules can become stored in porous
materials (memory effect), as well as having a “corrosive effect” on components containing aluminium.
In Table 1, you can see the methods employed as well as important variables.
Table 1. Method to look for leakage [8, 21]
Method Standard gas
Detectable Leakage
Pressure Measurable mbar·l·s-1 g·y-1
HFO1234yf
Pressure Air, Ni, He 10-4 7 · 10-1 Positive Yes
Vacuum Air 10-4 7 · 10-1 Vacuum Yes
Water pressure Water 10-2 70 Positive No
Immersion Air 10-3 7 Positive No
Helium sniffer Helium 10-12 7 · 10-9 Positive Yes
Refrigerant Sniffer Refrigerants 10-5 7 · 10-3 Positive Yes
Halogen Halogens 10-6 7 · 10-3 Positive With limits
Thermic conductivity Specifics gases 10-3 10-1 Positive No
Ultrasonic microphone Air and additives 10-2 70 Positive No
Foaming additives Air and additives 10-4 7 · 10-1 Positive No
The objective of this investigation has been to design a control procedure based on non-invasive
methods that would grantee the tightness of refrigeration circuits used in maritime transport containers

19
during their working lifetimes. Different trials have taken into account the refrigerant gas used and a
testing process has been implemented that prioritizes a minimum use of time: the test process must be
completed quickly. Because of this, the test parameters have been set according to prevailing pressure and
the time taken to conduct the test.
Materials and methods
No circuit is completely sealed, and this is not really necessary. The goal is that any leak must be
sufficiently small so as not to influence operating conditions such as pressure or temperature. As such, the
requirements for the test have been greater where the interior pressure of the circuit has been higher and
the density of the fluid has been lower.
To quantitatively register leaks, it is necessary to define a leak (QL) as the loss of pressure over time,
and according to the volume of the circuit. In this way, a leak with a value of 1(QL=1), corresponds to a
pressure loss of 1 mbar in 1s in a circuit with a volume of one litre. The unit of measurement for leaks is
therefore mbar·l·s-1
𝑄𝐿 =𝑑(𝑝𝑉)
𝑑𝑡 (1)
Taking into account that p·V = m·R·T/M, then:
𝑄𝐿 =𝑅 𝑇
𝑀 𝑑𝑚
𝑑𝑡 (2)
R: constant (R= 83.14 mbar·l·mol-1·ºK-1)
T: temperature in ºK
M: molecular mass of the standard gas g·mol -1
dm: decrease of mass during the test (g)
dt: test time (s)
Based on equations (1) and (2) and for a gas of known molecular mass, the leak can be determined.
It is possible to determine the existence of a gas leak, measuring times and pressures in the circuit during
the test, but it is necessary to weigh the circuit before and after the test, which can be difficult during the
production process. A simpler method is necessary; however, this formula is useful to establish the
groundwork. Like example of a detectable leak, it can be supposed that we have a circuit with an optimal
mass of 1000g, with a tolerance of +/- 10g, which has a lifespan of 10 years. The maximum allowable
leak is approximately 77·10-7 mb·l·s-1. If we assume that the time interval available to carry out the test is
four minutes, the detectable leak would be approximately 18·10-4 mbar·l·s-1. To summarize, to locate a
leak in a refrigeration circuit in a controlled environment (laboratory) without time restrictions, is
possible. As part of the production process, it is more difficult.
The objective of this research has been to establish a test model for tightness testing that will assure
the seal of refrigeration circuits over their working lifetimes. To do this, the system must have calibrated
leaks at different points in the circuit to establish the control parameters (pressure and time) required to
achieve a quality test with a high degree of reliability.
Some of the advantages of using an indirect method based on equations (1) and (2) are that the test
pressure is close to the operational pressure of the circuit in which a leak could occur, and that the
refrigerant gas itself can be used as a tracer gas.
To achieve this objective, it is necessary to construct physical models of both the standard circuits
and the test bench. However, beforehand, the processes for different stages of testing must be established.
Design of a leak test model
There is an obvious necessity to test for leaks inside circuits in both directions, that is to say, from
the inside out (a pressurized circuit) and from the outside in (circuit containing a vacuum). Figure 1
illustrates the test model established to test the tightness or seal of low volume circuits, which contain a
resultantly low mass of refrigerants. The following stages have been designed:
P1: To avoid damaging the measuring equipment, the prevailing pressure in the circuit is measured
so that, if the circuit was previously filled, the system will not allow the test to continue.
P1 - P2: A constant pressure is applied to the interior of the circuit with an inert gas (N), and the
change in pressure is observed. The objective is that the interior of the circuit reaches the pressure applied
in a time to be determined. This stage is called the Pressure Test.

20
Figure 1. The Pressure-Time curve: Model leak test design process.
P2 - P3: Once the target pressure (P2), is achieved, the circuit is isolated and there is a waiting period for the pressure to equalize at all points in the circuit. No measurements or decisions are taken. This stage is called stabilization.
P3 - P4: Once the inert gas is inside the isolated, pressurized and stable circuit, we observe the fall in pressure over time and make a decision according to the results. This stage is called the Pressure Drop Test. Once this test is complete, possible positive leaks have been tested for, that is to say, leaks that occur with the circuit under pressure. It should not be forgotten that positive pressure is normally the case with refrigeration circuits. However, it is considered it essential to look for negative leaks (with the circuit containing a vacuum). In this way, leaks of a structural character that cannot be found under pressure (the position of the 0-rings, joins with insufficient torque) can be detected. For this reason, pressure is released inside the circuit and the creation of a vacuum is begun.
P5 - P6: To achieve a vacuum rapidly, an unstable first stage vacuum is created, which is called the pre-vacuum, through a Venturi tube. With this device, two objectives are achieved: An acceptable vacuum in as little time as possible, and the protection of the vacuum pump.
P6 - P7: When the system is under 150mb, the vacuum pump it turned on. This stage is called the Vacuum Test and it has the objective of reaching a target pressure in a determined time.
P7 - P8: Once this objective of establishing a vacuum inside the circuit is achieved, the circuit is isolated and the changes in pressure over time are observed. This stage is called the Test of Decreasing Vacuum.
If the circuit passes the test stages described above, it will be filled first with polyalkylene glycol (PAG) and then with refrigerant. To achieve the fastest possible time in each one of the test stages, the key moment is the one in which the pressure stabilizes. The Figure 2 shows that applying constant pressure through two points, one in the high pressure circuit (HP) and the other in the low pressure circuit (LP), a stable pressure was only achieved above 10 bar, from the 8th second. Following this principle of stabilization, the time required for each stage can be determined. The times can be seen in the table of Figure 2.
A value of 10.5 bar was established as the test pressure value, and the objective in the vacuum stage was the highest grade of vacuum that could be achieved. Limits were established experimentally through statistical analysis.
Once the different phases of the test were defined, a physical model of the refrigeration circuits and the test bench was constructed. To be able to simulate the different architectures of different shipping containers used in maritime transport, which have different circuits with different capacities and components, two circuits were constructed. One simulates a system with a single evaporator and the other a system with a double evaporator. Both models are illustrated in Figure 3.
To be able to carry out the necessary measurements as has been described; a test bench was constructed, as illustrated in Figure 4. This consists of a pressure module, one supply module and one vacuum module. To carry out this study and to be able to statistically analyse the results obtained, the complete test has been carried out on each one of the model circuits. After each cycle, the circuit has been completely dismounted and remounted, renewing each of sealed units and couplings, so that the setup is the only factor affecting the test. The process of tightness testing is shown in figure 1, with times shown in Figure 2. The experiment has been repeated 1000 times, 500 with each variant of the circuit. The results obtained were recorded (Table 2).

21
Figure 2. Test time setup
Figure 3. Refrigeration system diagrams.
Figure 4. Laboratory layout and diagrams

22
Results and discussion
This research discussion can be divided in two main stages, a pressure drop test and a vacuum test.
Pressure drop test
The pressurisation stage consists of increasing the pressure inside the circuit with an inert gas
(Nitrogen), and then we test to see if we achieve the target pressure within a certain time limit.
If we look at the curve of the Figure 5 "Events - Pressure" it can be seen that with a constant
pressure input of 10.5 bar during 10s, in a majority of tests, in the short circuit a higher pressure was
reached at the end of the stage as compared with the tests performed in the larger circuit.
Thus, in the short circuit, the highest number of repetitions (101 of 500) occurred at 10.25 bar of
pressure and, in 98% of the tests performed, at a pressure higher than 10.17 bar. If we establish the same
criteria for the higher capacity circuit, we see that the greatest number of repetitions (106 of 500)
occurred at a slightly lower pressure than in the short circuit: 10.16 bar and the clustering of 98 % of tests
was above 10.13 bar.
If the right hand side of the curve (high pressure), it can be seen that while in the short circuit more
than 20% of the tests performed had a result higher than 10.25 bar, in the larger circuit, the value was
only reached in 0.2% of the tests (1 event).
Table 2. Monitored results (example)
Type Pres.
(bar)
Stab.
(bar)
∆. Pres.
(bar)
Vac.1
(mbar)
∆ Vac.
(mbar)
Vac.2
(mbar)
∆ Vac.
(mbar)
Time
(s)
Sh
ort
10.2 10.09 0.01 2 9.8 0.2 0.3 162
10.28 10.22 0.01 2.1 9.1 0.1 0.1 163
10.28 10.2 0.01 1.8 7.5 0.3 0.4 162
Lo
ng 10.27 10.25 0.02 5 20 0.2 0.3 198
10.17 10.15 0.02 2.8 14.6 0.1 0.1 197
10.27 10.24 0.03 3.2 14.8 0.3 0.5 198
Last of all, leakage was simulated in both the short circuit and the long circuit, resulting in all the
simulated leakage in the short circuit being detected by this pressure test, but not in the long circuit. If the
O-ring is removed from the junction between the expansion valve and the second evaporator (the furthest
point from the measuring points), this leakage is not detected by this test. However, the leak is detected
by a tracer gas test. This test was performed with Helium sniffer and with a refrigerant sniffer. The leak
was detected in both cases.
With the circuit under pressure, stabilized and isolated from the outside after the stages of
pressurizing and stabilization, the drop-in pressure was observed over time. For a fixed time (5s.), the
limit values beyond which a circuit is considered to be non-leak-proof are assessed.
In Figure 6 (diagram events / pressure: Pressure drop test results), two completely different curves
can be seen, with well differentiated groupings. In the short circuit, 90% of the tests are grouped below 20
mbar, and the remaining 10% tests are dispersed between 20 and 150 mbar. The highest number of events
occurs at 10 mbar (370 of 500). In the long circuit, the largest number of events (229 of 500) occurs at 30
mbar. However, 90% of results can only be encompassed from a value below 80 mbar. The remaining
10% of results are dispersed between 80 and 140 mbar.
Figure 5. Pressure test results Figure 6. Pressure drop test results
23
At this stage, leakage was simulated, loosening different junctions and observing the evolution of
the pressure drop. Leaks caused in the short circuit were detected quickly, however in the long circuit,
leakages were not detected until the pipe was almost completely loose. These leaks were detected quickly
with helium and refrigerant sniffers.
The stages of the pressurization, stabilization and pressure drop tests are the only steps proposed with
positive pressure
Vacuum tests
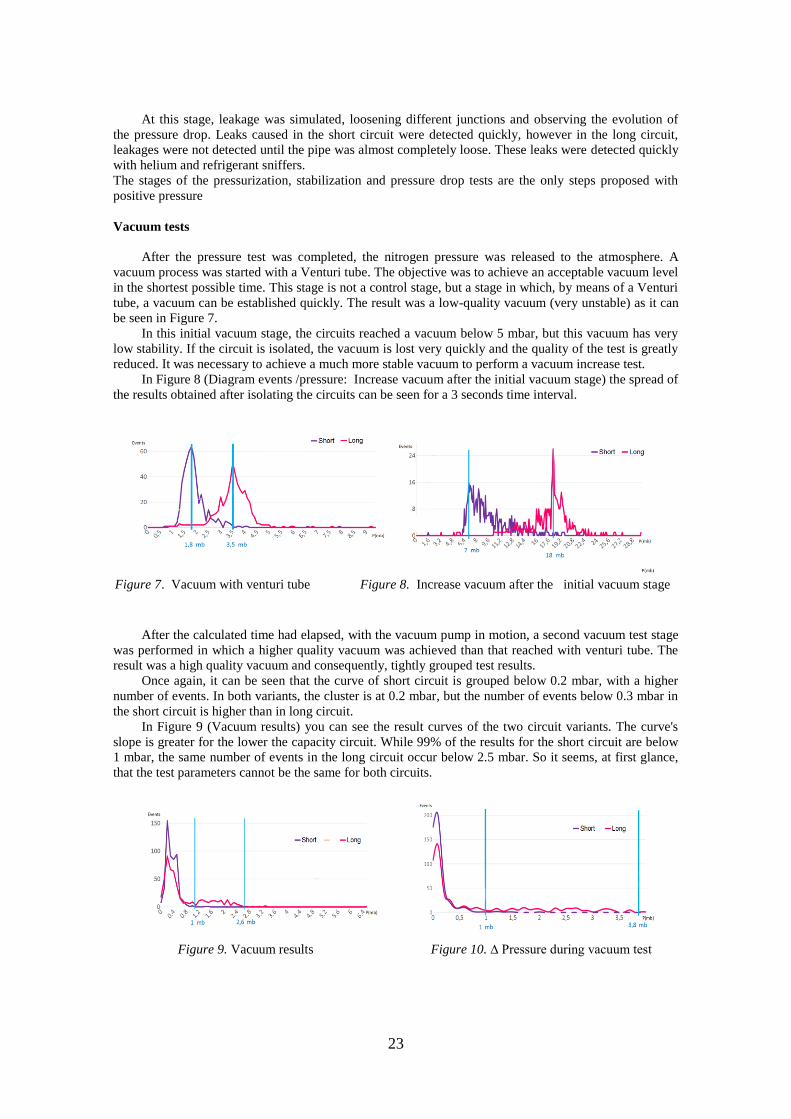
After the pressure test was completed, the nitrogen pressure was released to the atmosphere. A
vacuum process was started with a Venturi tube. The objective was to achieve an acceptable vacuum level
in the shortest possible time. This stage is not a control stage, but a stage in which, by means of a Venturi
tube, a vacuum can be established quickly. The result was a low-quality vacuum (very unstable) as it can
be seen in Figure 7.
In this initial vacuum stage, the circuits reached a vacuum below 5 mbar, but this vacuum has very
low stability. If the circuit is isolated, the vacuum is lost very quickly and the quality of the test is greatly
reduced. It was necessary to achieve a much more stable vacuum to perform a vacuum increase test.
In Figure 8 (Diagram events /pressure: Increase vacuum after the initial vacuum stage) the spread of
the results obtained after isolating the circuits can be seen for a 3 seconds time interval.
After the calculated time had elapsed, with the vacuum pump in motion, a second vacuum test stage
was performed in which a higher quality vacuum was achieved than that reached with venturi tube. The
result was a high quality vacuum and consequently, tightly grouped test results.
Once again, it can be seen that the curve of short circuit is grouped below 0.2 mbar, with a higher
number of events. In both variants, the cluster is at 0.2 mbar, but the number of events below 0.3 mbar in
the short circuit is higher than in long circuit.
In Figure 9 (Vacuum results) you can see the result curves of the two circuit variants. The curve's
slope is greater for the lower the capacity circuit. While 99% of the results for the short circuit are below
1 mbar, the same number of events in the long circuit occur below 2.5 mbar. So it seems, at first glance,
that the test parameters cannot be the same for both circuits.
Figure 7. Vacuum with venturi tube Figure 8. Increase vacuum after the initial vacuum stage
Figure 9. Vacuum results Figure 10. ∆ Pressure during vacuum test

24
All detected leaks were confirmed as real leaks, but not all simulated leaks were detected at this
stage. Micro-leaks caused by lack of tightness in the joints were not detected. However, they were
detected with the refrigerant and / or helium sniffer.
The last stage of the vacuum test was carried out by creating a vacuum inside the circuit, isolating
the circuit containing the vacuum created in the previous stage and observing the vacuum decline over
time.
Once again, in the curve it can be observed that results for the short circuit are much more stable
than the results obtained from tests carried out on the circuit of greater volume. While in the short circuit
only two events were obtained above 1 mbar (all with confirmed leakage), in the long circuit 131 events
were measured above 1 mbar. Most importantly, only a small proportion of these events were confirmed
as real leaks.
To summarise, for the short circuit all detected leaks were confirmed as real leaks, and for the long
circuit not all detected leaks were confirmed as real leaks, but these were so small leaks that can be
extremely difficult to be confirmed by conventional methods as helium sniffers. Some of the simulated
real leaks were not detected in the vacuum test, but these leaks could be confirmed by conventional
methods.
Conclusions
The evolution of refrigerants used in refrigerated shipping containers has made it necessary to use
more demanding quality control techniques during the manufacturing process. This need is due to
environmental motives in the case of HFC refrigerants and for economic reasons in the case of HFO
refrigerants. Physicochemical motives are important in the case of refrigerants synthesized from CO2, as
these require an increase in operating pressure or the critical point temperature.
It is not enough to ensure statistically the tightness of circuits in the quiet of the laboratory. To
guarantee quality, leak tests must be carried out on 100% of the fabricated circuits off the production line.
It is necessary to take into account the demands of the manufacturing process, especially production time,
so that the finished product does not become more expensive. Therefore, there is a clear need for a
leakage control process that does not leave residues in circuits, ensures their tightness during their useful
working lives and which can be executed within an economically viable timeframe.
In this work, a leakage verification process in refrigeration equipment has been presented, this
process ensures the circuit tightness against small magnitude leakages of refrigerant fluid over its entire
lifetime. In the experimental process a very low proportion of leaks were not confirmed as real leaks, but
these were so small leaks that was very difficult to be confirmed by conventional methods as helium
sniffers. Some simulated real leaks were not detected in the vacuum test, but these leaks was confirmed
by conventional methods. This process has proved being an effective tool to be applied to the
refrigeration circuits sealing verification, due to their capacity to detect leakages of small magnitude.
References
1. Bender, F., et al. Selective detection of HFC and HCFC refrigerants using a surface acoustic wave
sensor system. Analytical Chemistry. 75, 2003, pp. 5262-5266. DOI: 10.1021/ac034542l
2. Cai, B., et al. Multi-source information fusion based fault diagnosis of ground-source heat pump
using Bayesian network, Applied Energy, Vol. 114, 2014, pp. 1–9.
3. Corberán, J.M., Martínez, I.O., Gonzálvez, J. Charge optimization study of a reversible water-to-
water propane heat pump. International Journal of Refrigeration, Vol. 31, Issue 4, 2008, pp. 716-726.
4. Corberán, J. M., et al. Influence of the source and sink temperatures on the optimal refrigerant
charge of a water-to-water heat pump. International Journal of Refrigeration, Vol. 34, Issue 4, 2011, pp.
881-892.
5. Elaoud, S., Hadj-Taïeb, L., & Hadj-Taïeb, E. (2010). Leak detection of hydrogen–natural gas
mixtures in pipes using the characteristics method of specified time intervals. Journal of Loss Prevention
in the Process Industries, Vol.23, Issue 5, 2010, pp. 637-645.
6. Francis, C., Maidment, G., Davies, G. An investigation of refrigerant leakage in commercial
refrigeration. International Journal of Refrigeration, Vol. 74, 2017, pp. 10-19.
7. Grace, I.N., Datta, D., Tassou, S.A. Sensitivity of refrigeration system performance to charge levels
and parameters for on-line leak detection, Applied Thermal Engineering, Vol. 25, 2005, pp. 557–566
8. Herrmann, Klauss: Seminar System Leak Detection – Fundamentals of Leak Testing - Inficon -
Cologne 2017.

25
9. IPCC. Intergovernmental Panel on Climate Change Fourth Assessment Report - Climate Change
2007: Synthesis Report. 2007.
10. Kim, D.H., Park, H.S., Kim, M.S., The effect of the refrigerant charge amount on single and
cascade cycle heat pump systems. International Journal of Refrigeration. Vol. 40, 2014, pp. 254-268.
11. Kim, J. H., et al. Circulation concentration of CO 2/propane mixtures and the effect of their charge
on the cooling performance in an air-conditioning system. International journal of refrigeration, vol. 30,
Issue 1, 2007, pp. 43-49.
12. Koban, M. E. Experiences Transitioning Automotive OEM Plants to Low GWP Refrigerant HFO-
1234yf. International Journal of Automotive Engineering, Vol. 7, Issue 1, 2016, pp. 23-28.
13. Koronaki, I.P., et al. Refrigerant emissions and leakage prevention across Europe – results from
the Real Skills Europe project. Energy, Vol. 45, Issue 1, 2012, pp. 71–80.
14. Mount, D. J. Trends in leak testing: advancing the state-of-the-art. Quality, Vol. 54, Issue 2, 2015,
pp. S8-S8.
15. Nations, U. Kyoto Protocol to the United Nations Framework Convention on Climate Change.
New York, NY, USA. 1998.
16. Rasmussen, H., Thorud, S. Using a refrigerant leak detector to monitor waste gases from
halogenated anesthetics. Journal of the American Association for Laboratory Animal Science, Vol. 46,
Issue 5, 2007, pp. 64-68.
17. Tassou, S.A., Grace, I.N., Fault diagnosis and refrigerant leak detection in vapour compression
refrigeration systems. International Journal of Refrigeration, Vol. 28, issue 5, 2005, pp. 680-688.
18. Tian, S., et al. (2016). A study on a real-time leak detection method for pressurized liquid
refrigerant pipeline based on pressure and flow rate. Applied Thermal Engineering, Vol. 95, 2016, pp.
462-470.
19. Union, E. Directive 2006/40/EC of the European Parliament and of the Council of 17 May 2006
relating to emissions from air-conditioning systems in motor vehicles and Amending Council Directive
70/156/EEC. Official Journal of the European Union L 161/12-18. 2006.
20. Union, E. Regulation (EU) No 517/2014 of the European Parliament and the Council of 16 April
2014 on fluorinated greenhouse gases and repealing Regulation (EC) No 842/2006. Official Journal of the
European Union. 2014.
21. Umrath, Walter: Leak detection with halogen leak detector – Fundamentals of the Vacuum
Technology – Cologne 2007; pp.110-124.
22. Vaghela, J. K. Comparative Evaluation of an Automobile Air-Conditioning System Using R134a
and Its Alternative Refrigerants. Energy Procedia, Vol 109, 2017, pp. 153-160.
23. Wang, M., et al. Research on the leak-rate characteristics of leak-before-break (LBB) in
pressurized water reactor (PWR), Applied Thermal Engineering, Vol. 62, Issue 1, 2014, pp.133–140.07
24. Yoo, J. W., Hong, S. B., Kim, M. S. Refrigerant leakage detection in an EEV installed residential
air conditioner with limited sensor installations. International Journal of Refrigeration, vol. 78, 2017, pp.
157-165.
25. Zhao, Y., Wang, S.W., Xiao, F. A statistical fault detection and diagnosis method for centrifugal
chillers based on exponentially-weighted moving average control charts and support vector regression,
Applied Thermal Engineering, Vol. 51, 2013, pp.560–572.
26. Zhao, Y., Wen, J., Wang, S.W. Diagnostic Bayesian networks for diagnosing air handling units
faults – Part II: Faults in coils and sensors, Applied Thermal Engineering, Vol. 90, 2015, pp. 145–147.

26
INFLUENCE OF NEW PANAMA CANAL ON CARGO VOLUMES,
CAPITAL INVESTMENTS AND SHIP SIZES
IN THE AMERICAS REGION
Jānis Kasalis Portek International, Puerto Rico; Latvian Maritime Academy, Riga, Latvia,
E-mail: [email protected], phone: +37129425545
Ivars Kassalis Competition Board of the Republic of Latvia, Riga, Latvia,
E-mail: [email protected], phone: +37129430295
Abstract
In today’s global seaborne trade Panama Canal plays important role as infrastructure contributor to the
shipping lines. With one of the largest single maritime investment in last decade having built new locks
and allowing much larger ships to transit from Atlantic to Pacific and vice versa Panama Canal
Authority has made remarkable asset which has snowball effect on the further large scale investments in
the port infrastructures and other related assets from the both sides of canal. There are winners and
losers due to opportunities crated. Countries having direct influence due to the Panama Canal new locks
are USA, Trinidad and Tobago, Bahamas, Dominican Republic, Mexico, Columbia and others from the
Americas region.
Keywords: canal transit, port investments, market segment, long tons, seaborne trade.
Introduction
The new locks of Panama Canal were inaugurated in the summer of last year having delays from the
original time frame. The moves of the first vessels after new locks also have some issues with tug boats
and delays in terms of transit time. However, with the huge efforts from the canal operators side this giant
and very important World’s infrastructure project is in operations for more than half a year bringing new
possibilities to the global shipping industry and allowing new Neo Panama size ships to cross the canal.
This has changed the map of port terminal infrastructure around canal and had large influence to both
Atlantic and Pacific side.
Research methods
To accomplish the Publication authors have use the mix of Qualitative and Quantitative research
methods to achieve the most successful result. From the qualitative methods authors used Interview
method where 5 different industry experts (shipping advisors, container terminal managers and terminal
operators) from Panama, Singapore, Mexico, USA and Puerto Rico have been interviewed. There was
also case study method used where Panama Canal Authority from both perspectives - canal transit
activities and terminal concession activities was analyzed. From the Quantitative methods the analysis of
the statistics data was used where 8 detailed tables where presented and analyzed in various aspects and
angles. Based on the research methods used the conclusions were made.
In terms of forecast the qualitative technique has been used because represents the best suitable
outcome. Namely qualitative data have been used like expert opinion but only for one of 9 conclusions
where the statistical data isn’t available due to the confidentiality reasons. In other conclusions where
author provided quantitative data the forecast was made based on analysis and calculations what can be
seen from the eight tables presented in the Publication.
Description
Operations in Panama Canal started in 1914, more than 100 years ago and through the sanctuary has
long and also complicated history and development. Panama Government has started the work on
expansion of Panama Canal in 2007 and accomplished 3rd traffic line with new locks in the summer of
2016. The total costs of the new line are estimated in amount of 5,2 billion USD. Once the work was
finished the total capacity of Panama Canal has increased two times.

27
Today Panama Canal is servicing 144 maritime routes and connects 160 countries. Of course those
numbers are constantly changing together with the global trade. Even though the transit capacity has
doubled as per valuations of the economists from Maersk Line the total transit volume growth through the
Canal will be more moderate due to the global situation in the World’s economy. [2.3.]
Full benefits from the transit through Panama Canal the country will gain only once the global trade
will grow and the situation in Latin American countries and China will improve as well as other markets
will show positive growth. After the increase of the capacity of the Canal it is planned that the biggest
contributor will be container segment ensuring 50% of total revenues until 2020. This is based on the fact
that before new Panama Canal the maximum capacity of container vessel was 4400 TEU but after the
new locks – 14000 TEU. It means that container vessel maximum capacity increased more than 3 times.
Of course it does not mean that all shipping lines will automatically start to use the maximum
vessel’s size because we have to consider also terminal capacities in the region as well as need for the
bigger capacity. However, the total trend is that the vessel sizes will continue to grow almost in all trade
routes and it has and will have to put pressure on terminal investments in infrastructure, equipment and as
technologies.
Regions around Panama Canal like Latin America, Central America, Caribbean and USA are
directly impacted by the new Panama Canal and already 8 months after opening of new locks we can see
winners and losers among port terminals. Terminals having the biggest challenge are those just partly
involved in transshipment and located in Caribbean area. The capital investments have been made already
before Panama Canal new locks were planned and as explained the bigger vessel’s doesn’t mean more
gateway cargo because it depends on the state of the art of economy (import/export volumes) and not on
the size of the ships. We can see the trend that with larger mother vessel’s also the feeder vessel’s average
size is increasing and those terminals who are not ready for bigger ships are canceled from the map of
transshipment hubs. It means that those port terminals will remain only as local gateway terminals. Also
existing Caribbean transshipment hubs are facing challenging investment decisions because they have to
invest just to maintain existing flow and accommodate larger vessel’s but not in the way to increase the
cargo flow. As per statistic data Caribbean region together with Latin-American region is stagnating for
the last decade and there are no positive forecasts for the remarkable market growth in foreseeable future.
It is important to understand the World’s Seaborne Trade [3.3.] and the share of major cargo segments
and its impact on Panama Canal transit.
Table 1. World’s Seaborne Trade and split by cargo types 2015 (estimated) in Million tons [1.1.]
Cargo Type Volume CAGR1 (2011-2015) Impact on Panama Canal transit
Seaborne trade 10.959 + 3,8% USWC strike gave positive impact
Container trade 1.744 +5,6% Important part in total volume
Dry Bulk 4.668 +5,0 % Grain export from Brazil to Asia
Oil Trade 2.843 +0,7% Trade from Ecuador to Mexico
LNG 259 +1,2% Trade from Gulf of Mexico to Asia
As it’s represented in the table above the main cargo contributor to the World’s seaborne trade is dry
bulk followed by oil and containers. In terms of CAGR the most sustainable growth from 2011-2015 have
containers and dry bulk where the smallest growth has oil trade what is related to low oil prices in last 5
years. From the Panama Canal authority point of view, the biggest focus after new locks is stressed on
container transit. Panama Canal Authority is forecasting that container cargo share in total Panama Canal
transit will grow from current 34% to 50% until 2020.
1 CAGR - The compound annual growth rate (CAGR) is a useful measure of growth over multiple time periods.
It can be thought of as the growth rate that gets you from the initial investment value to the ending investment value
if you assume that the investment has been compounding over the time period.
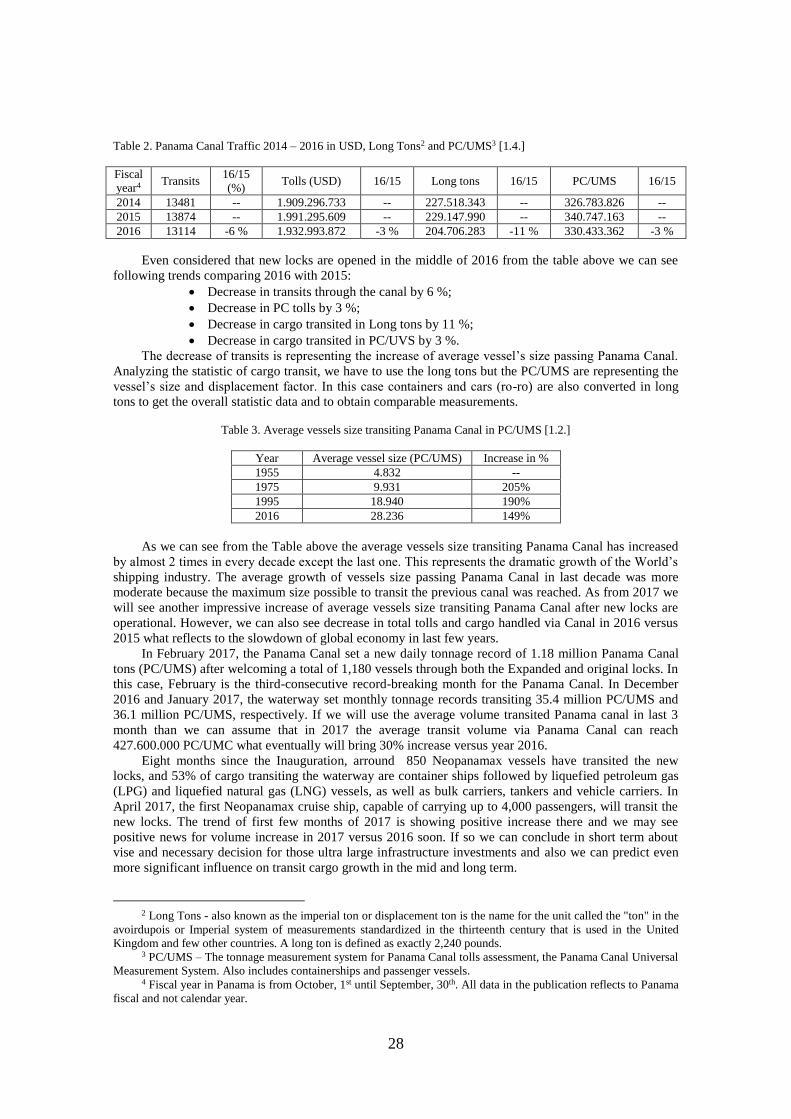
28
Table 2. Panama Canal Traffic 2014 – 2016 in USD, Long Tons2 and PC/UMS3 [1.4.]
Fiscal
year4 Transits
16/15
(%) Tolls (USD) 16/15 Long tons 16/15 PC/UMS 16/15
2014 13481 -- 1.909.296.733 -- 227.518.343 -- 326.783.826 --
2015 13874 -- 1.991.295.609 -- 229.147.990 -- 340.747.163 --
2016 13114 -6 % 1.932.993.872 -3 % 204.706.283 -11 % 330.433.362 -3 %
Even considered that new locks are opened in the middle of 2016 from the table above we can see
following trends comparing 2016 with 2015:
Decrease in transits through the canal by 6 %;
Decrease in PC tolls by 3 %;
Decrease in cargo transited in Long tons by 11 %;
Decrease in cargo transited in PC/UVS by 3 %.
The decrease of transits is representing the increase of average vessel’s size passing Panama Canal.
Analyzing the statistic of cargo transit, we have to use the long tons but the PC/UMS are representing the
vessel’s size and displacement factor. In this case containers and cars (ro-ro) are also converted in long
tons to get the overall statistic data and to obtain comparable measurements.
Table 3. Average vessels size transiting Panama Canal in PC/UMS [1.2.]
Year Average vessel size (PC/UMS) Increase in %
1955 4.832 --
1975 9.931 205%
1995 18.940 190%
2016 28.236 149%
As we can see from the Table above the average vessels size transiting Panama Canal has increased
by almost 2 times in every decade except the last one. This represents the dramatic growth of the World’s
shipping industry. The average growth of vessels size passing Panama Canal in last decade was more
moderate because the maximum size possible to transit the previous canal was reached. As from 2017 we
will see another impressive increase of average vessels size transiting Panama Canal after new locks are
operational. However, we can also see decrease in total tolls and cargo handled via Canal in 2016 versus
2015 what reflects to the slowdown of global economy in last few years.
In February 2017, the Panama Canal set a new daily tonnage record of 1.18 million Panama Canal
tons (PC/UMS) after welcoming a total of 1,180 vessels through both the Expanded and original locks. In
this case, February is the third-consecutive record-breaking month for the Panama Canal. In December
2016 and January 2017, the waterway set monthly tonnage records transiting 35.4 million PC/UMS and
36.1 million PC/UMS, respectively. If we will use the average volume transited Panama canal in last 3
month than we can assume that in 2017 the average transit volume via Panama Canal can reach
427.600.000 PC/UMC what eventually will bring 30% increase versus year 2016.
Eight months since the Inauguration, arround 850 Neopanamax vessels have transited the new
locks, and 53% of cargo transiting the waterway are container ships followed by liquefied petroleum gas
(LPG) and liquefied natural gas (LNG) vessels, as well as bulk carriers, tankers and vehicle carriers. In
April 2017, the first Neopanamax cruise ship, capable of carrying up to 4,000 passengers, will transit the
new locks. The trend of first few months of 2017 is showing positive increase there and we may see
positive news for volume increase in 2017 versus 2016 soon. If so we can conclude in short term about
vise and necessary decision for those ultra large infrastructure investments and also we can predict even
more significant influence on transit cargo growth in the mid and long term.
2 Long Tons - also known as the imperial ton or displacement ton is the name for the unit called the "ton" in the
avoirdupois or Imperial system of measurements standardized in the thirteenth century that is used in the United
Kingdom and few other countries. A long ton is defined as exactly 2,240 pounds. 3 PC/UMS – The tonnage measurement system for Panama Canal tolls assessment, the Panama Canal Universal
Measurement System. Also includes containerships and passenger vessels. 4 Fiscal year in Panama is from October, 1st until September, 30th. All data in the publication reflects to Panama
fiscal and not calendar year.

29
Table 4. Panama Canal Traffic by market segment (cargo type) in 2016 [1.4.]
Market segment Number of
Transits
Share in
total
(%)
PC/UMS Net
tonnage (000)
Share in
total (%)
Long tons of
cargo (000)
Share in
total (%)
Container 2.977 25 119.800 36 39.651 19
Dry Bulk 2.634 23 65.800 20 89.525 44
Vehicle Carriers/ ro-ro 809 7 46.759 14 4.824 2
Chemical tankers 1.899 16 39.619 12 38.319 19
Crude product tankers 581 5 15.575 5 15.066 7
Liquefied Petroleum Gas 449 4 11.542 3 6.234 3
Refrigerated 948 8 9.040 3 3.340 2
General cargo 710 6 8.419 2 4.846 2
Other cargo 677 6 12.891 5 2.349 2
Total 11.684 100 329.445 100 204.154 100
Table above represents Panama Canal transit by market segments in other words by type of the
cargo. As we can observe containers are representing more than 25% from all transits, more than 35%
from PC/UMS net tonnage and around 20% from total cargo transited via Panama Canal in 2016. This is
the cargo segment with highest growth potential after new locks are operational and the first 8 months
after inauguration are confirming those assumptions. In terms of total transits, the next important cargo
segment is dry bulk followed by chemical tankers representing 23% and 16 % accordingly. In terms of
PC/UMS net tonnage containerships are followed by dry bulk and vehicle carrier’s/ro-ro vessels
representing accordingly 20% and 14% of total annual volume in 2016. Once observing transited long
tons, we can conclude that leading segment is dry bulk with 44% followed by container carriers and
chemical tankers both having 19% of market share from the total volume in 2016. After new locks are in
operations we can see that there are new market segments opening in Panama Canal transit like Liquefied
Natural Gas due to the increase of vessel’s size.
Table 5. Cargo movement through Panama Canal (origin-destination) Pacific-Atlantic (long tons) 2016 [1.4.]
From ECUS5 Europe Others Total
Asia 22.728.098 258.954 7.196.645 30.183.697
WCUS6 2.235.647 3.330.987 2.373.606 7.940.240
Others 14.472.594 13.667.555 13.829.876 41.970.025
Total 39.436.339 17.257.496 23.400.127 80.093.962
As we can see from the table above the largest contributor to the Panama Canal transit from Pacific
to Atlantic is Asia region followed by West Coast of South America, then West Coast of Central America
and then by WC United States. In this statistic USA is the largest contributor as a country having 10%
from total Pacific – Atlantic transit.
If we review the same statistic from the final destination’s perspective than without doubt ECUS is
far the largest receiver of the cargo. So in the year 2016 EC of the USA received almost 40 million of
tons of cargo via Panama Canal counting 50% from the total volume as destination. As explained in the
publication there is high chance that the volume in the ECUS ports will grow with the new locks in
Panama Canal being opened. This mainly reflects to containerized cargo.
Table 6. Cargo movement through Panama Canal (origin-destination) Atlantic-Pacific (long tons) 2016 [1.4.]
From Asia WCUS Others Total
ECUS 41.465.015 2.517.941 41.724.731 85.707.687
Europe 292.963 4.055.205 7.313.663 11.661.831
Others 5.293.623 3.147.815 18.800.277 27.241.715
Total 47.051.601 9.720.961 67.838.671 124.611.233
5 East Coast of the United States 6 West Coast of the United States

30
As we can see from the table above the largest origin is ECUS when analyzing Panama Canal transit
volumes from the Atlantic to Pacific. The ECUS share in the total Atlantic – Pacific cargo flow as origin
is 68% or it contributes to more than 85 million tons of cargo per year. The main ECUS destination is
Asia with almost 50% share. The WCUS is second most important destination in Atlantic – Pacific trade
in transit via Panama Canal and it presents the large importance of the new locks to the USA seaborne
trade and also represents USA as largest country and contributor to Panama Canal transit. The total share
of the USA in Panama Canal transit from Pacific to Atlantic and vice versa is 67% and there is great
chance that this share will still increase.
When comparing both transit directions via Panama Canal we can conclude that Atlantic – Pacific
trade is 55% larger as Pacific – Atlantic trade and it can be explained with the fact that countries and
regions from the Atlantic side are more developed with larger scale of economy as well as their export
potential is also dominating in the Panama Canal transit.
Another interesting factor is that there are more than 2 million of tons annually being shipped from
the WCUS and vice versa via Panama Canal and it shows the importance of the seaborne trade versus
inland transportation. The only factor which can seriously influence the volumes between Asia and USA
especially EC of the USA is the current trade policy and trade deals. The new USA focus on “America
first” may have influence on so important exports to Asia and also on trade balance with other
Transatlantic and Transpacific partners and alliances. The scope of new trade deals and arrangements can
have influence on Panama Canal transit volume especially the USA trade deals due to the large
importance in total annual volume.
Analyzing Panama Canal’s total cargo transit from the perspective of top countries by origin and
destination in 2016 as explained before the leading country by far is the USA with 67% of share followed
by China with 19% share and Chile with 12% of share. The next important countries are Peru, Japan,
South Korea, Mexico and few Central American countries. The largest contributors from EU are Spain
and Belgium with less than 2% of the share each.
Table 7. North America’s main East Coast and West Coast port investments (in the infrastructure and access roads)
and handled volume [2.2.]
East Coast /
West Coast Port of call
TEU (000’s)
2015
Investments
2016 (billion
USD)
Investments 2017-
2020 (billion
USD)
EC NY & NJ 6.372 0,5 3,0
EC Savannah 3.737 0,2 0,6
EC Huston 2.131 0,1 0,7
EC Charleston 1.973 1,0 1,0
EC Virginia (Norf.) 2.549 1,3 4,0
EC Baltimore 840 0,1 0,25
EC Montreal (Canada) 1.446 0,14 1,5
EC Everglades 1.061 0,1 1,6
EC Miami 1.008 1,0 1,0
EC Jacksonville 915 0,2 0,8
EC Total 22.032 4,64 14,45
WC Long Beach 7.192 0,6 1,3
WC Los Angeles 8.160 0,5 4,5
WC NSA (Seattle/Tacoma) 3.529 1,0 16,0
WC Vancouver (Canada) 3.071 0,1 0,3
WC Oakland 2.277 0,2 1,8
WC Total 24.229 2,4 23,9
As per statistic data in 2010 WCUS stake in total USA container volume was 57% but in 2016 it
was already down to 52%. Within last 7 years we can review constant shift of the cargo from the WCUS
to the ECUS and Panama Canal new locks opening and related investments in ECUS major ports may
even speed up this shift to ECUS providing more options for container shipping lines and consignees
(beneficial cargo owners) once deciding for the use of ports within USA.
We can estimate that total USA ports container volume handled in 2016 was over 48 million TEU.
As we can see from the table above the largest WC and EC ports in the USA have handled almost 42
million TEU (this number we can get when from total amount of North American ports, we deduct 2
Canadian ports). It means that 13 largest USA ports have handled almost 88% of total USA container

31
volume. It is expected that after new Panama Canal locks ECUS will benefit from the increase in
Asia/USA trade which now can be redirected to the East Coast.
Once looking on investment numbers and comparing East Coast and West Coast we can see that
with 4,6 billion of USD the East Coast port related investments almost two times are increasing
investments made in West Coast ports and related infrastructure. But if we will review the planned
investments in the port and related infrastructure until 2020 than remarkable data appears. The planned
investments in ECUS ports are around 13 billion USD where in the WCUS ports – 24 million USD
(deducting 2 Canadian ports). After more careful considerations we have to deduct NSA port planned
investments in the amount of 16 billion USD because it’s more related with new roads in the area. In this
case the planned WCUS investments will reach 8 million USD what is significantly less as for the ECUS.
To be exact the planned investments until 2020 in the WCUS ports are 55% from the ECUS investments.
This represents the high price what ECUS taxpayers and also USA tax payers (once financed from federal
budget) have to bear to shift more cargo to ECUS in future and to accommodate larger container ships
transiting new Panama Canal locks.
The question remains without answer as of now about are those investments worth to the potential
volume to be gained? We need to get the new container volume data for full 2017 or even better for 2018
to start to consider and valuate the potential return on investment in port and related infrastructure. Due to
the fact that port related investments are being depreciated in 20-50 years depending on the type [3.1.] of
asset there is long way to go while making motivated answers on the real ROI and other financial
indicators. We have also to consider the different legislation in the USA and Europa about the
government investments in the port infrastructure operated by public but also private companies and the
reasons behind. Author suggest to compare the increase of the container volume in TEU versus
investments made in USD and to conclude about results to settle benchmark (new cargo in
TEU/investments in USD). There are winners and losers after this project was accomplished but in some
aspects we still need time to evaluate the impact of the new Panama Canal on port terminal infrastructure,
related capital expenditures and the vessel sizes crossing the Panama Canal after the new locks are
operational. Bigger ships do not mean shippers and consignees choose a given routing and those larger
ships have been going through the Suez Canal to US East Coast anyway even after new Panama Canal
opening.
On cargo flow side over the past few years, we have seen ECUS (Miami port etc.) and Gulf
receiving essentially all USA container volume growth whereas WCUS (Los Angeles ports, San
Francisco ports) has been stagnant. Some industry specialists are attributing this to the Panama Canal
expansion but author believes spreading risk, a lesser focus on transit time and more on dependability in
arrival times and inland cost where rail lines build up the Mini Land Bridge choice with relatively low 1-
way cost but later reversed this to 2-way charges. This has negative influence on US West Coast volumes.
Mentioning all above author is ‘not buying the argument that the Panama Canal has anything to do
with the increased volumes of export/import cargo in the Americas region. Transshipment of containers is
of course another important issue to measure the impacts of new Panama Canal. Once new Panama Canal
allows bigger ships to pass it that means less direct port pairs what naturally has to bring to more
transshipment volume. But since this is coinciding with new Alliance Formations and important mergers
of the international ocean container lines there are more direct port pairs/calls for individual lines and net
transshipment growth has so far been modest [3.2.] . The table below represents the new international
container line Alliances.
Table 8. International container line Alliances as from April, 1st 2017 [1.3.]
Alliance Partners Validity
(year)
Capacity
(TEU)
% from
global trade
2M ML; MSC +HMM 2025 6.000.000 30
Ocean
Alliance
CMA/CGM; Evergreen;
OOCL; COSCO Shipping 2022 5.500.000 26
The Alliance MOL; NYK Line; Yang Ming;
K-Line; HL +UASC 2022 3.500.000 16
As you can see from the table above the most effective Alliance in terms of ratio between total
capacity in TEU and % from global trade is 2M, followed by Ocean Alliance and in last place is left The
Alliance. This ration means that 2M need 200.000 TEU of capacity to control 1% of global trade when in
the same time The Alliance need’s 218.750 TEU or 9% more. Once the new Alliances where established
as per above they are controlling about 72% of all World’s international container trade. When ML will

32
finish the deal with HS and will get all the necessary approvals from the various competition board this
number will increase to 76% in 2017. This factor will have large influence on the US EC and WC
competition as well as on the hubs and other container ports in Caribbean. The first real impact we will be
able to see once analyzing the data for 2017 and 2018. In this case we can partly understand ultra large
investments in the USA ports as reason pointing new Panama Canal because with the new Alliance set up
as from April, 1st 2017 the shippers decisions will be not based only on the gateway volumes and other
classical parameters but also based on port terminal capacities and efficiency to accommodate larger
vessel’s after new Panama Canal is inaugurated and operational. [2.1.]
In regards to port capital investments, we have seen significant investment and especially US ports
have pointed at the Panama Canal expansion as an excuse to get old infrastructure updated to
accommodate larger vessels. Having say this we have to remember that state-owned public ports have to
justify investments because it’s federal and state money. It has to prove that there are economic benefits
in terms of additional profits (or/and ROI) and it’s hard to explain to the public that there is a need to
invest significant amount of money in the port related assets just to maintain existing cargo flow or to get
only incremental cargo volume growth.
Anyway, in last few years all over the USA port authorities have spent large amount of capital
investments for updating port related infrastructure (needed with or without Panama Canal), increasing
terminal capacities (to accommodate increasing volumes that were coming with or without Panama
Canal) and to accommodate new container line alliances (needing more capacity on fewer terminals).
As example in past few years Miami port spend USD 2 billion on dredging, obtaining new port
related equipment, investing in tunnel and rail connections. Savannah/Charleston port is doing dredging
for now costing some USD 750 million. New York is raising the Bayonne bridge at a cost of USD 1.5
Billion (this is current estimate; original budget was USD 1.3 billion). These few major port related
capital investments within the USA in past few years are the big scale items however there has of course
also been many other investments in cranes, other handling equipment, rail capability, dredging, open
areas etc. We could estimate that the overall investment in the USA ports on water front and immediate
hinterland related with new Panama Canal opening will be around USD 40 billion.
From the Caribbean point of view, author believes that to the Panama Canal expansion can attribute
expansion investments in major container transshipment hubs like Cartagena port and Kingston port.
Immediately within Americas region we have to mention also PSA Panama port terminal investments
related to new Panama Canal opening. It is proved that new Panama Canal opportunities are challenging
the global port terminal competition in the region Americas and there is long way to go to equalize the
terminal capacities with newly built vessels. We will continue to observe cargo shift from place to place
due to the global trends described in this article bringing change in Caribbean, USA and other Americas
port terminals.
Conclusions
We can conclude that new Panama Canal has caused significant investments in the port related
infrastructure first of all within USA and in Americas region. USA ports will invest around 40 billion of
USD in the time frame from 2015-2020.
The new Panama Canal opening wasn’t followed by same level of volume increase in container
related trade and in Returns on Investment. However, we have to review this aspect from the longer term
perspective and 8 months after opening of new Panama Canal is not enough time frame to make long
lasting conclusions.
There is strong trend about increase of average vessel’s size transiting Panama Canal. After new
locks are open the biggest increase is expected in container segment and there are forecasts that until 2020
this segment can reach 50% of Panama Canal transit.
After new Panama Canal locks are in operations the maximum containers vessels size has increase
from 4.400 TEU capacity to 14.000 TEU capacity. This will allow container shipping lines to have
savings on transportation costs because larger vessel’s normally means less transportation costs per
container.
New international container line Alliances will play dominating role in World trade and also in
Panama Canal transit. With significant line’s consolidations and vessel’s sharing agreements the
consignees and port operators will have less choice and container lines will have much stronger bargain
power what may lead to decrease of terminal costs and increase of freight rates.
Investments in large port infrastructure not always correlates with return on investments. It’s often
common that local governments are also playing important role on securing port infrastructure with

33
related investments and often the driving force is the increase of economic activity and not ROI or other
economic indicators.
The real impact of Panama Canal’s new locks on the cargo volume transited we will be able to
review once the World’s economy will recover and the global trade will grow. This will lead to the
increase of seaborne trade and to increase of Panama Canal transit volumes due to the importance in
multiple World’s principal trade routes.
The total share of the USA in Panama Canal transit from Pacific to Atlantic and vice versa is 67%
and there is great chance that this share will increase in future. This makes Panama Canal heavy
depending on one single country’s economy and political decisions.
Potential new trade deals as TTIP7 and TTP 8 as well as existing NAFTA9 deal with proposed
changes initiated by USA will have significant influence on Panama Canal transit volumes especially
considering the role of the USA due to the large importance in total annual volume.
References
1.1. www.alphaliner.com;
1.2. www.economict.com;
1.3. www.lloydslist.com;
1.4. www.pancanal.com/eng/op/transit-stats/ ;
1.5. www.wikipedia.com
2.1. ACP and Clarkson Research Service, World seaborne trade 2015;
2.2. CBRE research, Seaports & Logistics, 2016 North America, Annual Report;
2.3. Maersk Line Trade Report, 2016 Latin America.
3.1. Handbook of terminal planning, Jurgen W Bose, Springer New York Dordrecht Heidelberg
London, 2011.
3.2. Introduction to Marine Cargo Management, Mark Rowbotham. Lloyd’s Practical Shipping
Guides. Informa Law from Routledge, 2014.
3.3. Port Management and Operations, Lloyd’s Practical Shipping Guides. Patrick Alderton, Informa
London, 2008.
7 The Transatlantic Trade and Investment Partnership (TTIP) is a proposed trade agreement between the
European Union and the United States, with the aim of promoting trade and multilateral economic growth. TTIP is
considered a companion agreement to the Trans-Pacific Partnership (TPP). [1.5.] 8 The Trans-Pacific Partnership (TPP), or the Trans Pacific Partnership Agreement (TPPA), is a trade
agreement between Australia, Brunei, Canada, Chile, Japan, Malaysia, Mexico, New Zealand, Peru, Singapore, the
United States and Vietnam. [1.5.] 9 The North American Free Trade Agreement (NAFTA) is an agreement signed by Canada, Mexico, and the
United States, creating a trilateral trade bloc in North America. The agreement came into force on January 1, 1994. It
superseded the Canada–United States Free Trade Agreement between the U.S. and Canada. [1.5.]

34
OPPORTUNITIES FOR INCREASING TRANSIT POTENTIAL
OF GEORGIAN SEA PORTS
Tariel Kokoladze, Luiza Sikharulidze, Medea Abashidze, Zurab Bezhanovi Batumi State Maritime Academy Maritime academy, Batumi, Georgia,
E-mail: [email protected] Abstract
Opportunities for increasing transit potential of Georgian sea ports are presented in this paper. The
paper identifies directions of opportunities for increasing transit potential of Georgian sea ports. For this
purpose the following tasks have been solved from theoretical perspective: economic analysis of
Georgian sea ports taking into account transformation of the global economy areas is made; the causes
of the loss of transit cargo turnover are identified; Georgian port development directions to attract
transit cargo are reviewed. The paper also provides analysis of transit cargo services rendered in recent
years that suggests that the volume of cargo passing through Georgia is reducing and it requires renewal
and update. The reasons, which prevent the attraction of transit cargo to Georgia are divided into
internal and external factors. Due to the complexity of the country's transport system, directions of port
development have been determined to ensure general improvement of the transit situation in Georgian
ports.
Keywords: transit, potential port, transport system.
Introduction
In this research work, we will identify opportunities for increasing transit potential of Georgian sea ports
and for this purpose solve the following tasks from theoretical perspective:
carry out the economic analysis of Georgian sea ports taking into account transformation of the
global economy areas;
examine the causes of the loss of transit cargo turnover;
determine Georgian port development directions to attract transit cargo.
Berths and terminals
In order to analyze the issues related with the research, presented below, let us present the description of
the Port of Batumi current condition:
Oil Terminal
Berth No. 1 No. 2 No. 3 CBM
Length(m) 200 140 165
Depth(m) 12 10.2 10.2 15.5-20.0
Area(м2) 9 546 5 662 12 481
Ships' DWT 45 000 16 000 25 000 140 000
Throughput efficiency of the oil terminal is – up to 15 million tons annually. The terminal specializes in
refining raw oil and almost all types of oil products: diesel fuel, petrol, reduced cruel and so on. The
given berths are leased to Ltd "Batumi Oil Terminal” until 2019.

35
Container and the railway ferry terminal
Berth No. 4,5 Railway Ferry Terminal
Length(m) 284.0 43.9
Depth(m) 12.0 8.24
Area(м2) 40 000
Ships' DWT 35 000 12 600
Throughput efficiency of the container terminal is 100 000 TEU annually. The container terminal has
open storing areas and possesses transshipment equipment, which specializes in operating with containers
in direct and storage ways. The ferry runs between Varna, Iliychevsk, Poti and Batumi. The operation of
the ferry is totally automated. The nominal throughput efficiency of the terminal is approximately 700
000 tones. From November 2007, berths 4, 5, 6 and railway ferry terminal were leased to Batumi
International Container Terminal LLC, which is the member of group of companies International
Container Terminal Services INC (ICTSI).
Dry Cargo Terminal
Berth No. 6 No. 7 No. 8 No. 9
Length(m) 183.0 263.3 180.0 204.0
Depth(m) 8.2 11.5 10.7 10.2
Area(м2)
6 655 5 630 3 371
Ships' DWT
60 000 20 000 25 000
The Berth No.6 owns open storing area and specializes in handling the scrap metal in direct and storage
ways.
The Berth No.7 serves the large-capacity vessels and specializes in bulk cargo, fluid cargo, general and
packing and piece load with the weight of one piece no more than 20 tones.
The Berth No.8 serves the small-capacity vessels and specializes in bulk cargo, fluid cargo, general and
packing- piece load with the weight of one piece no more than 10 tones.
The Berth No.9 serves the small-capacity vessels and specializes in fluid cargo, general and packing and
piece load with the weight of one piece no more than 6 tones.
Maximum throughput of the dry cargo terminal – 2,0 million tones annually.
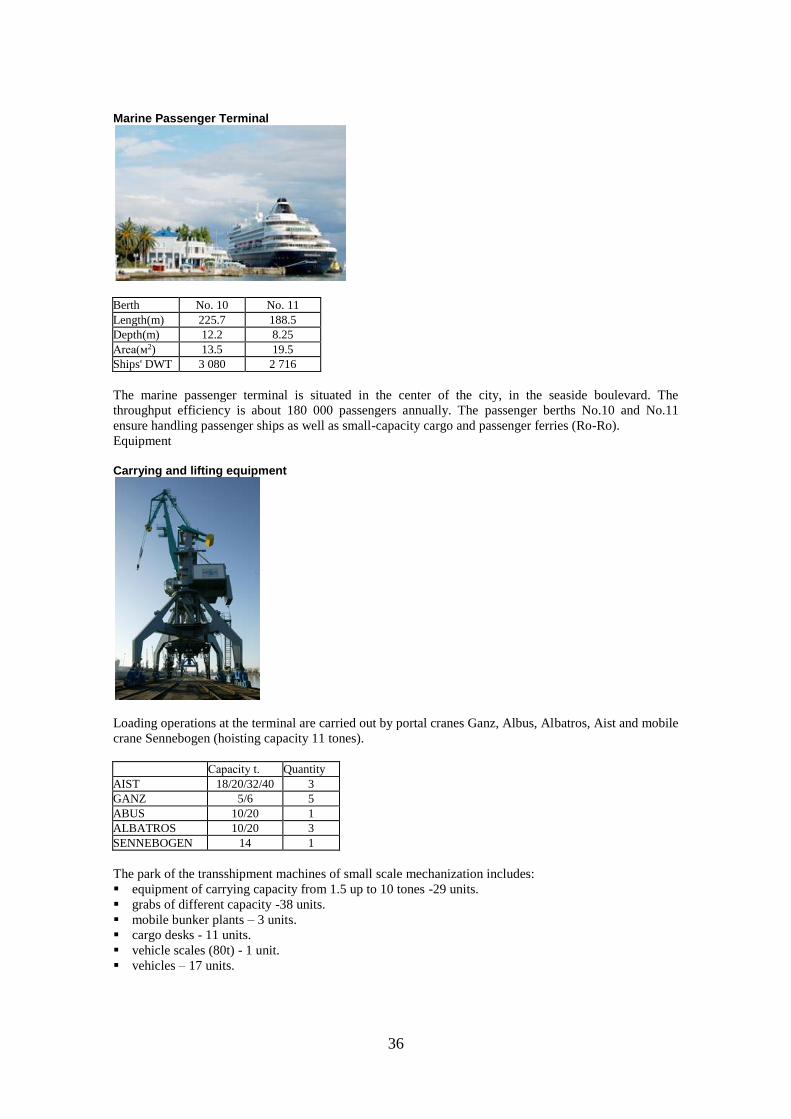
36
Marine Passenger Terminal
Berth No. 10 No. 11
Length(m) 225.7 188.5
Depth(m) 12.2 8.25
Area(м2) 13.5 19.5
Ships' DWT 3 080 2 716
The marine passenger terminal is situated in the center of the city, in the seaside boulevard. The
throughput efficiency is about 180 000 passengers annually. The passenger berths No.10 and No.11
ensure handling passenger ships as well as small-capacity cargo and passenger ferries (Ro-Ro).
Equipment
Carrying and lifting equipment
Loading operations at the terminal are carried out by portal cranes Ganz, Albus, Albatros, Aist and mobile
crane Sennebogen (hoisting capacity 11 tones).
Сapacity t. Quantity
AIST 18/20/32/40 3
GANZ 5/6 5
ABUS 10/20 1
ALBATROS 10/20 3
SENNEBOGEN 14 1
The park of the transshipment machines of small scale mechanization includes:
equipment of carrying capacity from 1.5 up to 10 tones -29 units.
grabs of different capacity -38 units.
mobile bunker plants – 3 units.
cargo desks - 11 units.
vehicle scales (80t) - 1 unit.
vehicles – 17 units.

37
Port fleet
Type Type Power and volume
Tug boat TAMARA I
3000 h.p.
Tug boat TAMARA II
3000 h.p.
Tug boat USHBA
2310 h.p.
Tug boat K.KVACHANTIRADZE
1200 h.p.
Tug boat GONIO
600 h.p.
Berthing tug CAPTAIN PAGHAVA
680 h.p.
Inshore boat SKHALTA
300 h.p.
Collector of bilge water AISI
360 m3
Oil skimmer FLORA
19 м3
Water barge CHOROKHI
800 м3
Barge derrick CHERNOMORETS-9
100 t.
Diving boat MEDEA
Four divers are in staff of the station.
Interstate transit is an important national resource, which is today rarely used. Deterioration of
transit area in Georgia can lead to irreparable consequences, if this issue is not taken into account when
looking at interstate relations and effective and attractive common transport policy is not developed.
The analysis of transit cargo services provided in recent years suggests that the volume of cargo
passing through Georgia grows only in respect of Armenia. Cargo going to other countries, including
Azerbaijan, via Georgian sea ports reduces or does not comply with pace of economic growth of our
partner countries. The nomenclature for cargo transit through Georgia is as follows: petroleum and

38
petroleum products - 50-60%, bulk cargo - 10-15%, chemical and mineral fertilizers - 10-15%, metals
(including scrap) - 10%, other cargo - 5-10 %.
The reasons, which prevent the attraction of transit cargo to Georgia can be divided into internal and
external factors. External factors include:
a) increasing international competition at the interstate level, which has impact on redirection of
transit traffic towards competitive (mostly Russian) routes;
b) compliance of the national transport system and transport services with international standards
and more rapid development of transport infrastructure on competitive routes;
Internal factors include:
a) relatively slow pace of the transport system development;
b) low quality of transport boundaries in the country; slow pace of transit traffic, technically
obsolete rolling stock;
c) technical depreciation of fixed capital, physical obsolescence of market facilities of the
transportation infrastructure;
d) dimension of border and customs service value and length, delays at the border;
e) complexity of transit cargo clearance, reliability level of transit cargo losses;
f) lack of activity of the country in terms of international conventions on transit cargo;
g) tariff policy, which is not flexible enough and taking into account changes to competitive routes.
Most of the aforementioned internal factors have systematic nature.
The problem lies in the fact that the sea ports are only one integral link of transit cargo services and
besides it, there are other integral links of transit turnover links, such as Georgian Railway and motor
transport, border customs checkpoints and border cross posts at the border of Georgia, roads and their
throughput.
Effective sea ports performance in this cycle cannot fully ensure the achievement of the final result;
therefore, the issue resolution requires an integrated approach and activation of the national transport
policy, which will ensure coherence and coordination of all transport chain components. There is the need
to implement common tariff policy in this regard and regulate them due to common interests. The same
approach should be taken to the specific transit route.
Georgia needs to develop a new transport system management strategy based on a complex
approach. The United Transport Administration under the Ministry of Economy and Sustainable
Development of Georgia, which has been abolished, might have played a positive role in this regard and it
was necessary to improve coordination mechanisms, although reverse processes develop. The United
Transport Administration was split into the transport agencies having equal rights according to varieties
of transport means. Therefore, the Maritime Transport Agency does not hold any leverage to affect
railway transportation tariffs and speed and ensure the synchronization of transit cargo import and export
with the railway transport. Likewise, the railway does not have any impact on cargo entering the port and
in most cases it even obtains information in a delayed mode. Due to this fact there is the need to make
stocks of transit cargos at the terminals, which increases the transit cost and speed.
Conclusion
Due to the complexity of the country's transport system, directions of port development focused on
the general improvement of the situation can be divided in the following areas:
Activities aimed at simplifying the tariff and customs policy. Tariffs should be determined taking
into consideration interests of transport and other means and terminals service fees.
In post-Soviet countries the second direction of port development is privatization of sea ports.
Georgian sea ports are privatized by international companies who have been granted the right to long-
term management; however, it did not have tangible effects on the increase of the transit cargo turnover
volume. No large-scale investments have been made to update fixed capital and renew and modernize
berths.
Enhance investment capacity in sea ports, which can be achieved through general macro-economic
measures, first of all, tax system liberalization, improvement of the banking and credit system and market
infrastructure.
Coordination of Georgian transport with transport of Azerbaijan, neighboring country has crucial
importance to ensure better use of transit potential. Transit cargo services of Azerbaijan as well as
Central Asian countries are determined to a large extent by the Caspian Sea ferry and rail services in the
territory of Azerbaijan. Therefore, it is recommended to implement an agreed tariff and technical policy.

39
References
1. G. Tkeshelashvili, T. Kokoladze. Economic Analysis, Tbilisi, 2012, p. 185.
2. A project of a new Port of Poti, ENVIRON London, UK, 2010, p. 34.
3. “The Major data and directions of the country development for 2012-2015”, Tbilisi, 2011, p. 23.

40
ROLE of ISO 14001:2015 IN SUSTAINABLE ASSURANCE OF
MARPOL CONVENTION REQUIREMENTS
Nino Kurshubadze Batumi State Maritime Academy, Batumi, Georgia,
E-mail: [email protected]
Abstract
Numerous ISO (International Organization for standardization) standards support the goals of the
International Maritime Organization (IMO) as important technical competent in different IMO works.
Close cooperation of the ISO and the IMO develops the standards which support IMO requirements and
regulations, provides strong contribution to ensuring cleaner and sustainable marine environment. ISO
14001:2015 standard helps the company to optimize operations, identify, priorities and to manage its
environmental risks as a part of normal business practice. This paper aims to demonstrate importance of
using ISO 14001:2015 - the international specification - for an environmental quality management
system (EMS) in shipping companies and on board its ships and to identify synergies with existing
management system.
Keywords: ISO, EMS, requirements, implementation, sustainable development, integrated system
Introduction
One of ISO most well-known contributions is the generic ISO 14000 series on environmental
management standards, implemented in all areas of activity, including the maritime sector. Due to its far
reaching scope, ISO impacts on the environmental performance of the maritime industry from a variety of
angles, both directly and indirectly. Some examples belonging to several technical committees include
freight containers, oil and oil platforms, paints and varnish for ships, refueling, ships and marine
technology, transport of dangerous goods, water quality testing for pollution, etc. Currently, in close
coordination with the IMO, ISO is also developing a number of standards to provide solutions for specific
marine environmental problems.
Overview of ISO 14001 Environmental management practice
Today there are two major areas in the evaluation of environmental practice. One area focuses on
organisational issues, and the other on products, services and processes. The ISO 14000 series covers the
following topics:
Organisation Evaluation:
o Environmental Management Systems [ISO 14001, 14004];
o Environmental Performance Evaluation (ISO 14014,14015, 14031);
o Environmental Auditing (ISO 14010, 14011, 14012, 14013, 14014).
Products, Services and Processes:
o Life Cycle Assessment (ISO 14040, 14041, 14042, 14043);
o Environmental Labelling (ISO 14020, 14021, 14024, 14025);
o Environmental Aspects in Product Standards (ISO 14060).
An overview of environmental management tools is given in Table 1.
Table 1. Overview of environmental management tools
Environmental Management
Environmental Management System Life Cycle Assessment
Environmental Performance
Evaluation
Environmental
Auditing
Environmental
Labelling
Environmental Aspects
in Product Standards
For a better understanding of EMS we should consider the following point: EMS standards are
process – NOT performance – standards. In other words these standards do NOT tell organisations what
environmental performance they must achieve (besides compliance with environmental regulations).

41
Instead, the standards describe a system that will help an organisation to achieve its own objectives and
targets. The assumption is that better environmental management will lead indirectly to a better
environmental performance.
An effective EMS is built on Total Quality Management (TQM) concepts. Most EMS models
(including the ISO 14001 standard) are built on the "Plan, Do, Check, Act" model introduced by Shewart
and Deming for TQM. This model endorses the concept of continual improvement. Over time, the
systematic identification and correction of system deficiencies leads to better environmental (and overall
organisational) performance. Quality Management System is based on the same model, which is subject to
ISO 9001. ISO 14001 standard is largely based on the ISO 9001 quality standard but also takes into
consideration the environmental impact.
Figure 1. Structure of standards
ISO 14001:2015 specifies the requirements for an environmental management system (EMS) that an
organization can use to enhance its environmental performance, to manage its environmental
responsibilities in a systematic manner that contributes to the environmental pillar of sustainability.
Consistent with the organization's environmental policy, the intended outcomes of an environmental
management system include: enhancement of environmental performance, fulfillment of compliance
obligations, achievement of environmental objectives.
ISO 14001, nonspecific to the maritime industry, which address management practices from the
perspective of controlling environmental impact. The standard not specific to the marine industry, provide
useful guidance that can be employed in marine management and the operation of ships to further
enhance management systems focused on the safe operating practices and prevention of pollution. It’s a
tool for enhancing marine management practices and further supporting safe management in the operation
of ships and prevention of pollution.
Evolution of the ISO 14001 standard
Approximately 20 years after it was first published, ISO14001 became the world’s most widely
recognized environmental standard. A new version of the standard has been published in September 2015.
The Final Draft International Standard (FDIS) ISO 14001:2015 was published on July 2, and no further
technical changes will be made to this version.
ISO 14001:2015 is designed to help organizations develop sustainable business practices that will
revitalize, restructure and will improve their environmental management practices while pushing
corporate environmental performance to a higher level. As markets and mentalities have evolved in the
last decade, the standard needed updating to stay in line with today’s thinking about environmental issues
and to better integrate sustainable development concepts. With the new version, any type of organization
wishing to prepare for the environmental challenges and business opportunities of the future will have a
stable framework of requirements for the next 10 year s or more. The changes in ISO 14001 standard are
presented in the Table 2.

42
Table 2. Evaluation of ISO 14001 standard
1996 2004 2015
Publication of the ISO 14001
norm which set up criteria that an
organization should follow in
order to certify its Environmental
Management System (EMS)
Modification added:
- Clarify and reinforce the
requirements for
documentation, compliance
evaluation
- In-depth examination of non-
conformances
Changes to come:
- Context of the organization
- Actions to address risks and
opportunities
- Compliance obligations
- Leadership
- Lifecycle thinking
- Environmental Policy
- Continual improvement
- Documented information
The 2015 version features a new numbering structure. The ISO technical committee based the
revision on Annex SL, which sets out a standard High-Level Structure as well as core text, common terms
and definitions for the next-generation management system. A common platform ensures uniformity
among management system standards, enabling them to be integrated more easily and efficiently within
an organization. Due to this new platform, ISO 14001:2015 has more requirements than ISO 14001:2004.
Readers will remember that the previous standard contained all of the management system requirements
in one main clause (Clause 4) that had six sub-clauses. By contrast, the new standard contains seven main
clauses (Clauses 4 to 10) and 21 sub-clauses.
In terms of requirements, the 2015 version bears some resemblance to 2004 version, but there has
been a shift in emphasis to certain key considerations, detailed below.
Clause 4 – context of the organization. This is a new clause requiring organizations to demonstrate
understanding of the context in which they operate. For example, they must show an understanding of the
conditions and factors that affect their environmental management, such as climate change, natural
resource availability and constraints, the quality of water and air, the social context and the regulatory
framework.
Sub-clause 6.1 – Actions to address risks and opportunities. The new standard calls for an
integrated approach to risk management. In addition to the aspects and impacts of its activities, products
and services, the organization must assess the threats and opportunities that it faces. These stem from the
organization’s context.
Sub-clause 6.1.3 – Compliance obligations. Formerly under the heading “Legal and other
requirements” in 2004 version, compliance obligations will be considered as possible sources of risks and
opportunities to organizations. Organizations will be required to maintain documentation of their
obligations and action plan to address them. Obligations can include applicable laws and regulations,
industry standards and codes of practice, as well as requirements arising from agreements with interested
parties.
Clause 5 – Leadership. Specific responsibilities are assigned to top management in this version of
the standard. The organization’s decision makers will be required to ensure alignment of the
environmental policy and objectives with the strategic direction of the organization, and integration of
EMS requirements into key business processes. Top management is also required to ensure that the EMS
achieves its intended outcomes, which include enhanced environmental performance.
Sub-Clauses 6.1.2 and 8.1 – Lifecycle thinking. Organizations will have to go further than
previous required when identifying environmental management system requirements by including
impacts arising from the use of products and their treatment or disposal at the end of their useful lives.
While this does not mean conducting a lifecycles analysis (LCA) of their products, it does entail the
establishment of controls in the design and development process of products or service, considering each
stage of the life cycle. Sub-clause 8.1 also explicitly requires that environmental requirements be
established for procurement of products and services and that outsourced processes be controlled or
influenced.
Sub-Clauses 5.2 – Environmental Policy. Beyond limiting, preventing or mitigating environmental
damage, the new ISO 14001 requires organizations should be proactive in protecting the environment in
their own context. This may include pollution prevention, sustainable resources use, climate change
mitigation and adaptation, and protection of biodiversity and ecosystems.
Sub-Clauses 10.3 – Continual improvement. The notion of continual improvement of the EMS
has now been directed toward enhancement of environmental performance. Objectives must be linked to
measurable results in order to show tangible enhancement of performance. Under the new standard, the

43
organization will have to be more critical about the level of results and benefits achieved through its
efforts. In some cases, interested party needs and expectations could have a significant impact on
performance targets.
Sub-Clauses 7.5 – Documented Information. The standard now refers to documented information
(instead of documentation, procedures, records, etc.) and takes a less procedure-centered approach to
document management. Information on the EMS may be integrated with other management system in the
organization. Storage can be paper or electronic media.
Sustainable ship management Overview of ship management
ISO 14001 standard is widely used for improving the effectiveness and efficiency of MARPOL
convention requirement implementation in Maritime industry. Modern shipboard environmental
management systems incorporate ISO 14001 standard in their management system. Shipping companies’
manuals are developed on the basis of the complex standard and regulation requirements and identified as
integrated management system. There are many common or interfacing requirements among the ISM
code and ISO 9001, 14001, 18001 and 50001, therefore any combination of these systems leads to a more
efficient way of managing safety, quality, environmental issues, occupational health and safety and
Energy Management.
Effective sustainable ship management means that resources give the best return according to the
long-term operational needs. It includes the creation of a safe, healthy and injury-free workplace.
Accident can be prevented by raising the awareness among employees, especially necessity for taking
responsibility for the environment. International and national legislation, international standards and
guidelines that should form the basis of the company work.
ISO 14001 standard certification is a voluntary international standard for environmental
management systems which goes further than applicable rules regulations and the ISM code. It gives
guidance and systemizes the environmental work.
The first step is to identify all environmental impacts of the company. It should be regularly
performed to find any new of forgotten environmental impacts.
The next step is to find the significant aspects and decide objectives and targets. Aspects can be
weighted based on various criteria: possible damage, use of renewable resources, effects on the public
image, breach of rules and regulation, technical feasibility. It’s vital that objects are both economically
and technically feasible in order to realize and perform the necessary action. It’s important to decide
targets in order to reduce impact on the environmental impacts by reducing consumption, use less
polluting substances, etc. In order to have evidence for both impact and improvements it is necessary to
find measurable points for all objectives and regularly monitor them to ensure compliance with the
environmental program.
Environmental Objectives, Targets and Actions
Here are some examples of environmental objectives, targets and actions:
1) Ballast Water. Avoid spreading of non-native species via ballast water – use of ballast
management plan and installation of Ballast Water Treatment System – implementation of ballast
treatment system according to the vessel installation plan.
2) Consumption of bunker and emission of exhaust gases. Reduce consumption of nonrenewable
resources and emission of exhaust gases to the atmosphere – reduce CO2, SOx, NOx and particular
matter emissions – implementation of various measures according to Environmental Plan (EP).
3) Use of lubricating oil. Reduce emissions related to the cylinder oil consumption and reduce the
impact of pollution in the case of oil spill from hydraulic system and oil to sea interface systems –
implementation of various measure according to Environmental Plan (EP).
4) Discharge of Bilge water. Reduce impact of oil and chemical residues from bilge water in the
oceans – implementation of various measures according to Environmental Plan (EP): reduce generated
bilge, monitoring generated bilge water, evaluation of bilge treatment systems in use and looking for
improved technologies.
5) Use of chemicals. Reduce impact to the ecosystem from cleaning chemicals - reduce use on
cleaning chemicals used onboard – implementation of various measures according to Environmental Plan
(EP).

44
6) Refrigerant. Reduce impact on the ozone layer and to the global warming effect from emission of
released refrigerant gases – reduce consumption / emission of refrigerant used onboard – implementation
of various measures according to Environmental Plan (EP).
7) Consumption of fluorescent tubes. Reduce impact from released mercury to the ecosystem –
reduce consumption of the mercury from fluorescent tubes – implementation of various measures
according to Environmental Plan (EP)
8) Raise environmental awareness. Improve environmental awareness: all onboard personnel to
undergo environmental training and annual Environmental Day onboard – implementation of various
measures according to Environmental Plan (EP).
Figure 2. Voluntary and mandatory regulations scheme
Environmental Plan Hotspots
The most important sources of pollution from the ships are given in this section. The International
Convention for Prevention of Pollution from Ship (MARPOL) is the main international convention
covering prevention of pollution of the marine environment by ships from operational or accidental
causes. The MARPOL Convention was adopted on 2 November 1973 at IMO. The Protocol of 1978 was
adopted in response to a spate of tanker accidents in 1976-1977. As the 1973 MARPOL Convention had
not yet entered into force, the 1978 MARPOL Protocol absorbed the parent Convention. The combined
instrument entered into force on 2 October 1983. In 1997, a Protocol was adopted to amend the
Convention and a new Annex VI was added which entered into force on 19 May 2005. MARPOL has
been updated by amendments through the years. The Convention includes regulations aimed at preventing
and minimizing pollution from ships – both accidental pollution and that from routine operations – and
currently includes six technical Annexes. Special Areas with strict controls on operational discharges are
includes in most Annexes. 136 countries of 98% of world shipping tonnage are parties to the Convention.
A. Oils The most common systems onboard that have a potential for spilling oils are bunker operation, bilge
water, oil to sea interfaces, oil from cargo holds coming from leakages on hydraulic cylinders and
winches, life boat diesel and oil. Bilge water contains a mixture of: heavy fuel oil, diesel oil, fresh water,
tube oil, hydraulic oil, light detergents, heavy duty detergents, liquid, cooling water foam liquid, some
heavy emulsifier, boiler water (high pH value), salt water, outer special, soot water (low pH value), parts
of metals, black water chemicals, fibers, colony of bacteria and grey waters with different types of
chemicals.
Annex I of the MARPOL Convention describes details of the discharge criteria and requirements for
the prevention of pollution by oil and oily substances. It contains seven chapters and 39 regulations that
serve as guidelines, information and references for creating instructions, contingency plans and
procedures for shipboard application. Annex I regulation 15 of the MARPOL Convention gives the
requirements for bilge water discharging. Marine companies can perform some modifications and
routines to improve the handling of bilge water from the vessels in order to: increase knowledge for the
operations, minimize generation of water and oil, pre-treat and separate oil and water, reduce mix of
water and oil, control that non violation discharging occurs, minimize sludge generation, separate water

45
from sludge prior to incineration, extract usable bunker from the sludge that can be reused, and to provide
intensive environmental inspections.
B. Ballast water The International Convention for the Control and Management of Ships Ballast Water and
Sediments was completed and adopted in 2004. It is divided into articles and regulations including an
annex which describes the technical standards and requirements:
Regulation D-1 Ballast water exchange standard
Regulation D-2 Ballast water performance standard
Regulation B-3 Ballast water management for ships.
The shipping companies should implement the use of a ballast water management plan onboard their
vessels. It should be specific to each ship and should at least:
1). Provide a detailed description of the actions to be taken to implement ballast water management
requirements and supplemental ballast water management practices;
2). Detail the procedures for the disposal of sediments at the sea and to shore;
3) Include the procedures for coordinating shipboard ballast water management plan that involves
discharges to the sea with the coastal state authorities;
4) designate the officer on board in charge of ensuring that the plan is properly implemented;
5) contain the reporting requirements for ships.
The plan should be written in the language of the ship. A translation into English, French or Spanish
shall be included.
C. Sewage According to MARPOL Annex IV Regulation 1, sewage, or black water, is defined as: drainage and
other wastes from any form of toilets, urinals and WC scuppers; drainage from medical premises via wash
basin, wash tubs and scuppers located in such premises; drainage from spaces containing living animals;
other waste waters when mixed with the drainages defined before. Grey water in meant to include
drainage from dishwasher, shower, laundry, bath, washbasin drains, swimming pools and spas. Grey
water is not considered to be sewage and it is not covered by the Regulations nor MARPOL as long as it
does not contain a pollutant prescribed in the regulations or MARPOL Annex II. MARPOL Annex IV
contains a set of regulations regarding the discharge of sewage into the sea, ships equipment and systems
for the control of sewage discharge.
D. Garbage According to Annex V of the MARPOL, garbage includes all kinds of operational and food waste
generated during the normal operation of the ship. Typical garbage generated onboard includes: packing
materials, paper, plastic, food waste, soft drink cans, food tins and cans, bottles, paint cans, and oil drums,
batteries, steel and steel products old spare parts. All vessels should have specific garbage management
plan in which responsibility, equipment, position of containers, etc., should be described. The garbage
management plan should provide written procedures for collecting, storing, processing and disposing of
ship-generated garbage, including the use of the equipment onboard. It should also designate the person in
charge of carrying out the plan. The best garbage handling policy is: no garbage into the sea – no garbage
other than food waste is to be discharged into the sea. All the garbage has to be properly disposed off by
either incinerator on board or be delivered to shore reception facilities, segregated and marked according
to the plan. The vessel board has to be segregated according to categories: domestic waste (food waste,
plastics, glass, aluminium cans, paper, wood, metal and ash from incinerator) and hazardous waste (used
fluorescent tubes, used batteries, paint residues, chemical residues. Food wastes and associated garbage
which are returned to port may carry disease or pests and have to be kept separate from other types of
garbage. All types of garbage should be in separate, clearly marked containers to avoid incorrect disposal
and treatment on land. Garbage containers must be lashed and be of fire proof type and have proper
marked covers. All crew are responsible to follow the no discharge policy and routines for garbage
handling onboard. All crew should participate in the collection and segregation of garbage according the
plan.
E. Air Pollutants The emission of oxides of nitrogen, oxides of sulfur, particular matter, ozone depleting substances
and volatile compounds are set in Annex VI of the MARPOL. Emission of carbon dioxide is not covered
by Annex VI of the MARPOL. Air emission generators on board can be divided into:

46
1) Group related to combustion, combustion products, fuel oil quality, maintenance and spare parts
supply main engine, auxiliary engine, auxiliary boiler and incinerator that depend on proper garbage
segregation;
2) Group related to equipment maintenance and leaks – refrigerant plant and tanker ships.
Annex VI of the MARPOL requires that every ship of 400 gross tons and above should have an
International Air Pollution Prevention Certificate (IAPPC) that requires a periodic survey per five years.
It will have an effect on oxides of nitrogen, oxides of sulfur, particular matter, and ozone depleting
substances. MARPOL Annex VI regulation 14 regulates sulfur oxides and particulate matter. The sulfur
content of any fuel oil used onboard ships should not exceed the following concentrations: 4.5% m/m
prior 1 January 2012, 3.5% m/m after 1 January 2012; 0.5% m/m after 1 January 2020. The worldwide
average sulfur content of residual fuel oil supplied for use onboard ships shall be monitored according the
IMO guidelines. While ships are operating within Emission Control Areas, the sulfur content of fuel used
on board ships should not exceed the following limitations: 1.5% m/m prior to 1 July 2010; 1.0% m/m
after July 2010; 0.1% m/m after 1 January 2015.
Shipping industry recognizes environmental protection as one of its highest priorities and that
every effort should be made to conserve and protect the environment from marine, atmospheric and other
forms of pollution.
Environmental policy aims to eliminate the possibility of pollution at source by ensuring that high
standards of safety and awareness are maintained, and that all relevant legislation and conventions are
followed.
An Environmental Management System (EMS) is a structure designed to implement and establish a
working environmental policy. Shipboard EMS Team is to be made responsible for identifying and
monitoring any specific legal, regulatory and other relevant requirements and guidelines pertaining to the
environmental programme. This is done to ensure that the programme and its objectives are kept up-to-
date and in line with legislation.
Conclusions
Public awareness, pressure groups and legal directives forced shipping companies to have a second
look at their Environment Management practices and adopt ways to minimize pollution. Leading shipping
companies are now beginning to seek ISO 14001 certification for their offices and for their ships. These
companies are also rewarded with better business prospects and surprisingly even cost benefits.
Because ISO 14001:2015 is in line with the concepts of sustainable development, it is helpful to
shipping companies to manage to implement MARPOL requirements, environment and sustainable
development more closely. The EMS is the logical place for documenting and managing the many risks,
opportunities and compliance obligations in terms of sustainable development, such as corporate
leadership, governance, social responsibility, consumption issues, climate change, natural resource
management and etc.
References
1. ISO 14000 as a Strategic Tool for Shipping and Shipbuilding.
2. ISO 14001:2015, White Paper on the changes to the ISO Standard on Environmental Management
System, July 2015
3. International Convention for the Prevention of Pollution from ship (Marpol 73/78), Practical
Guide, 2015
4. Correspondence between ISO 9001 and 14001, OHSAS 18001, ISM and Seabird Management
System, 2012.
5. A quantitative study of the review and verification process of the Safety Management system
within companies servicing the Norwegian Continental Shelf, Mats Christensen, Master Thesis,
November 2013.
6. Integrated Management Systems onboard ships. Safety, Quality, Environment and Occupational
health and Safety. DNV Maritime.

47
ANALYTICAL REVIEW OF GEORGIAN MARITIME PORTS
DEVELOPMENT AND ORGANIZATION
Tsiuri Kurshubadze, Makvala Bekirishvili, Luiza Sikharulidze,
Kristine Zarbazoia, Zurab Bezhanovi Batumi State Maritime Academy, Batumi, Georgia,
E-mail: [email protected]
Abstract
Georgia, especially its western part, historically, has always been associated with the sea and marine
navigation. In the Middle Ages maritime transport connected Georgia to Byzantine Empire, Iraq, and
civilized world. Caucasus region with its geopolitical position and rich natural resources is the unique
region of the world. That is why this region plays the great in development of economic relationship
between Central and Eastern Europe. Georgian transport infrastructure is inconceivable without marine
ports development, especially Batumi Sea port, plays one of the most important roles in the maritime
cargo services. It is important to develop and improve socio-economic and tourist recreational
complexes in Georgia along the Black Sea. Most notable is that all above mentioned problems, tasks or
goals affect the country, its regional and develop its social infrastructure systems. Thus, the future of a
stable economic growth of Georgia is related to the sustained development of its transport-transit
function.
Keywords: ports, Eurasia Corridor, TRACECA, Silk Road
As a result of capitalism and economic growth of the country the Black sea ports of Georgia were
developed in the nineteenth and twentieth centuries. Despite being the smallest littoral sates in the Black
Sea, Georgia does have important security and economic interest in the maritime environment. Today,
Black sea ports of Georgia are important ports not only for the country itself but also for Trans-Caucasian
and Central Asian states, because of being the most convenient and short way in Eurasian corridor.
In recent years, the strong cargo demand in the region (through the ports in Black Sea) has
increased significantly with growth rate of 12% between 2012 and 2013. Shipping companies have started
direct service to ports of the Black Sea from Far East by employing large container vessels with 6,700
TEU (draft 14.5 m, Length300m) to minimize the Logistic cost. The existing ports in Georgia did not
have sufficient depth and berthing area, also there were no enough storage area inside the ports and there
were Lack of adequate infrastructure and inefficient container handling systems. Under such situation, if
the ports in Georgia strives to become one of the major ports in the Black Sea, new deep sea port should
be developed to accommodate such Large container vessels and upgrade efficient cargo handling services
of the international standards. The new deep sea port will function as regional hub port and transit
terminal of Logistic center between Asia and Europe.
Geographically, Georgia is in a very strategic position to be a regional hub between Asia and the EU
(the gateway to Europe). It has a very small but very open economy toward the outside world.
Geographically, this country is in very good position to facilitate trade. Georgia offers the most liberal
customs regime in the Caucasian region. It allows traders to store their goods and cargos at Georgian
customs warehouses and sell the product without customs clearance in the neighboring countries. It spares
traders extra cost. So investors from both Asia and Europe may be interested in developing logistic and
warehouse infrastructure here and shipping cargo in all directions. The recently created Eurasian Union,

48
which unites Russia, Belarus, Kazakhstan, and Armenia as a unified custom space creates huge
competition for Georgia. This huge space offers unified customs and tariffs for the transportation corridor
on the Asia-Europe route that looks attractive from a logistics point of view. The geopolitical location of
Caucasus may become the center of transport-logistics. It is very difficult to compete with the
neighboring countries, especially with Russia’s sea ports, its roads and transit points. Also other big
competitors of Georgia are Ukraine and Turkey.
Georgia is in a highly strategic location in that it serves as an entry gate to the Caucasus and Central
Asia. Georgia is a reliable corridor for addressable flows between Caucasus and Europe and between
Central Asia and Europe. This concept is being based on historical Silk Road for centuries that gives
Georgia a significant geopolitical role.
Georgian transport economy is transit oriented. From 65% to 95% of cargo flow in Georgia is
transit. Transport corridors are breathing new life into the ancient trade route between east and west and
could reinvigorate Georgian transportation. Georgia is developing a new deep sea port, which is intended
to have 100 mln tons capacity; Also, Baku-Tbilisi-Kars railway project with the 5-15 mln t/year capacity
is completed, integration is planned no later than 2017. This railway has a significant importance for the
region, because it is intended to connect Georgian and Azerbaijan railways to the Turkish one.
These projects are aimed to increase the main geopolitical asset of Georgia – transit potential.
Georgia serves as an entry gate for the Central Asian landlocked countries, so the oil, gas, coal, zinc,
copper and other resources can be transferred to the Europe though Georgia. Out of the three main roads
from Europe to Asia, the road through Georgia is the most stable and secure. Due to the stable political
and economic climate, Caucasian corridor is becoming more and more attractive for businesses.
The importance of The Georgian ports constantly is increasing not only for the Caucasus region, but
also for the Central Asian states. The latter mentioned countries are characterized by large supplies of oil,
for which the best and the shortest way for goods traffic goes through Georgia. The process is carried out
for the formation of the country as a key transit region.
Geopolitics and the length of roads of Georgia is important for the Central Asian transport corridor,
that is why it is important and compulsory to develop all sea ports of Georgia.
The West and the world economy, is interested in the existence of several alternative transit routes
for constant free competition. Caucasus region with its geopolitical position and rich natural resources is
the unique region of the world. That is why this region plays the great role in development of economic
relationship between Central and Eastern Europe with the South Caucasus countries.
Georgia continues to its geographically strategic location to develop transportation routes in and out
of the Caucasus and Central Asia, including oil and gas pipelines. Georgian infrastructure, developed

49
during the Soviet era, was not designed to handle large volumes of east vest transport. Years of
inadequate maintenance have resulted in serious deterioration of these assets. Nevertheless, the Georgian
Government has identified Georgia’s geographic location as a competitive advantage to exploit. The
government has proposed a “Eurasia Corridor” that will require substantial investment in refurbishment
and expansion of transportation infrastructure including roads, rail, seaport, and civil aviation services.
USAID, World Bank, EBRD, the EU and other donors are examining ways to improve transport, water
supply, and wastewater treatment infrastructure.
The EU helped start the Transport Corridor for Europe, Caucasus, and Asia (TRACECA).
TRACECA is an internationally recognized program aimed at strengthening of economic relations, trade
and transport communication in the regions of the Black Sea basin, South Caucasus and Central Asia
owing to active work based on political will and common aspirations of all member-states. Today the
TRACECA route comprises the transport system of the 13 member-states of the “Basic Multilateral
Agreement on International Transport for development of the Europe-the Caucasus-Asia Corridor” (MLA
TRACECA): Azerbaijan, Armenia, Georgia, Iran, Kazakhstan, Kyrgyzstan, Moldova, Romania,
Tajikistan, Turkey, Ukraine and Uzbekistan.
In recent period the Caucasus factor significantly all over the world. It became the spotlight for the
world’s largest states, international organizations and transnational companies. Georgia, which is leading
to the formation of the common Eurasian space is connector between Europe and Asia. TRACECA
(Transport Corridor Europe-Caucasus-Asia) is an international transport program involving the European
Union 14 member States of the Eastern European, Caucasian and Central Asian region. The program aim
is to strengthen economic relations, trade and transport in regions of the Black Sea basin, South Caucasus
and Central Asia.
About million tons of cargo, are handled by the four ports of Georgia: Batumi, Poti, Kulevi and
Supsa.
Batumi Sea Port historically represents logistics center of the Caucasus region. Particularly this was
the very first port, owing to which Georgia has always had the function of the transit country. Today
Batumi Sea Port plays an important role in the life and development of the region. Having the status of
the deepest-sea port in Georgia, it offers different types of services to its clients and partners.
Incorporation of several facilities, including oil-loading terminals, container berths, ferry docks, dry cargo
berths as well as the berths for passenger liners makes Batumi Sea Port multifunctional and an important
facility for the region and for the country in whole.

50
The Poti Sea Port is a major seaport and harbor off the eastern Black Sea coast at the mouth of the
Rioni River in Poti, Georgia. The Poti seaport is a cross point of the Trans-Caucasian
Corridor/TRACECA, a multinational project which connects the Romanian port of Constanta and
Bulgarian port Varna with the land-locked countries of the Caspian region and Central Asia.
Kulevi Oil Terminal constantly undergoes improvement measures in an effort to solve problematic
issues concerning the transshipment of various oil products available on the market. Nowadays, oil
refinery factories are proceeding crude oil at deeper levels, which leads to obtainment of oil products that
have increased viscosity. The terminal’s priority is to keep pace with the modern requirements for
offloading, storing and transshipping oil products.
The Supsa Sea port is one of the most important transit routes for Georgia. The Baku-Supsa pipeline
runs from Azerbaijan to the Georgian port of Supsa on the Black Sea.
Georgia will spend around four billion dollars on infrastructure projects in the period of 2017-2020.
The major part of this sum will be spent on roads (including highways); approximately 800 km of roads
projects are in the pipeline now. This will further strengthen the role of the country in the new Silk Road.
In addition, other major infrastructure projects that boost country’s economic development will be carried
out throughout Georgia. The port infrastructure must develop together with other transportation
infrastructure like roads and railways. The ports development and their organizational issues will increase

51
competitiveness of our ports. For further enhancing country’s transit potential Government of Georgia is
carrying out major infrastructural projects, such as: Anaklia New Deep Water Black Sea Port, Railway
Modernization Project, East-West Highway Construction, Baku-Tbilisi-Kars new railway connection line
project, development of logistical centers.
Georgia is the only Black Sea country that does not have a deep sea port. Building a major port at
Anaklia had been a long time coming. This location on the coast at Anaklia has the deepest canyon in the
Black Sea basin, allowing for 16 meters of draft, and designs for a deep sea port here date back to Soviet
times. Today, building a fully modern port at Anaklia is part of Georgia’s broader ambition to revive its
historic position as a transit corridor, connecting east and west as well as serving as a regional hub. Our
current ports are very old, they were built and designed to meet modern maritime needs. As a region, over
time our competitive advantages as a transit corridor have diminished significantly because of extra costs
in the exchange of goods and the logistics cost. All of this is due to outdated infrastructure. So the
government is really looking into enhancing the corridor and getting back the leading role as a transit
country. The shortest distance to transport goods overland between China and Europe goes through the
Southern Caucasus – right across Georgia – but the cost of doing so is significantly higher than other
emerging corridors, such as those which run through Russia and Kazakhstan.
The Anaklia deep sea port is a key piece of Georgia’s plan to establish its position as a major station
on revived Silk Road. In addition to building essential transportation infrastructure, the government has
also been signing free trade agreements with an array of major economic players in all directions. Since
2014, Georgia has had a Deep and Comprehensive Free Trade Agreement with the EU, which allows
Georgian products to enter Europe duty free, free trade regimes with most Central Asian countries,
Russia, and Turkey, as well as preferential trade agreements with the USA, Norway, Switzerland,
Canada, and Japan. Georgia is also in the process of working on a monumental free trade agreement with
China. In essence, Georgia is trying to set itself up as a base camp for countries from every corner of
Eurasia to set up shop and manufacture goods that can be efficiently and cheaply exported elsewhere. The
Government is pursuing the development of a new deep-sea port in Anaklia on the Black Sea coast,
which will be constructed in 9 phases and be able to handle 100 million tons of cargo per year. The
Anaklia port shall have the following competitive advantages: strategic location, capacity to receive
Panamax type of vessels, one stop shop solutions, simple and fast procedures and all year round safe
navigation.
Today Georgia as an independent and sovereign state, with its historical and geopolitical location,
still has a chance to be involved in the world economic space. With its relationship, potential and national
identity Georgia can contribute the economic rise and it will improve living standards of the country. The
port infrastructure is the most important component for the country’s development. By the scientific and
technical influence all countries of the world are involved in the world economic globalization and
Georgia promotes its involvement in globalization, as far as a country is located between Europe and Asia
and is a transit route for the Caucasus and Central Asian states. The geopolitical advantage of the country
“its location over the Black Sea is the Gateway for the South Caucasus, and we should use our resources
properly. The ports’ infrastructure development is closely related to socio-economic developments of the
country. Their geographic location, their effective use have an influence on the Eurasian Transport
Corridor. Thus, the future of a stable economic progress is linked to the transport-transit sustained
development. The Eurasian transport corridor development, the restoration of historical Silk Rod, the
political and geopolitical importance is well established.
Taking into consideration the world globalization processes and geostrategic location of Georgia,
the country’s economy development is directly linked with uninterruptible and effective work of transport
sector. George is located in the crossroad of Europe and Asia, the place of the traffic of strategic-purpose

52
cargo. Accordingly, coordinated uninterrupted working regime and modernization-development of the
transport infrastructure components and harmonization of the local legislation with the international
standards present the major priority for Georgia. The port development concept and the general policy
form the basis of many factors, from which priority is given to general political, geopolitical and
geostrategic factors. The most important issues are also: socio-economic development and environmental
protection, proper transport-technological and economic objectives and goals.
For the country’s transport system inner balance, we must analyze the neighboring states’
(especially Azerbaijan, Turkey, Russia, Armenia) transport systems. Their development levels, general
strategic direction and general transport policy. Georgia is an attractive country for international
investments with open market and liberal economy, strategically located between Europe, Asia and
Middle East. It is considered to be a key platform for revitalizing the Silk Road and a bridge between East
and West. In order to utilize natural potential and facilitate the economic growth Government of Georgia
is carrying out large-scale infrastructural projects. Construction of the new port and the port infrastructure
development, also gives opportunity for development of value added services and shall result in
significant increase not only cargo turnover through Georgia but also increase the number of implies.
The socio-economic development, improvement of tourist and recreational facilities, ecological
improvement, all problems, tasks and goals affect the country’s separate regions, their accommodations
and social infrastructural systems development. One of the key factors for the country development is
foreign investments. We need investing for positive change in Georgia. The regional transportation
capacity forms the main component of the concept. Such predictions will determine the future values of
cargo and passenger transportation, cargo structure, its trends and changes, growth dynamics, the
projected flow of goods and the dynamic structure of the industrial-technological specifics. Maritime
shipping increases every year, because it is more profitable, safe and we can transfer large amount of
cargo by seas. The Black Sea unique natural complexes, specific natural and geographical conditions, the
coastal area is the main determining factor for new port constructions.
References
1. http://www.batumiport.com
2. http://www.potiseaport.com
3. http://thediplomat.com/tag/silk-road-economic-belt
4. http://thediplomat.com/2016/04/georgia-the-key-to-chinas-belt-and-road
5. http://www.forbes.com/sites/wadeshepard/2016/09/29/silk-road-anaklia-deep-sea-port-set-to-
transform-georgia/#27b3e6f129df

53
PSYCHOANALYTIC SYMBOLISM REGARDING SKILLED
SEAPORT WORKERS’ RESISTANCE TO PSYCHOLOGICAL
DEFENSE MECHANISMS
Saulius Lileikis Lithuanian Maritime Academy, 7 I. Kanto Street, Klaipėda, LT-92123, Lithuania,
E-mail: [email protected], phone: +370 46 397 255
Abstract
Psychological self-management of the personality is especially important when defense mechanisms
manifest. Defense mechanisms operate semi-consciously. They are natural and important because they
help survive. At the same time they disturb the smooth collaboration in a work-team. It is necessary, as
much as it is possible, to apply psychological self-management in stressful situations that are prevailing
in a seaport activity. A skilled seaport worker is operating in a port, which is characterized by the
seashore that connects the sea and the land. In this connection, the seashore symbolizes a resistance to
sea waves that psychoanalytically symbolize often destructive psychological defense mechanisms. The
goal of the paper is a discussion of skilled port workers’ resistance to their psychological defense
mechanisms regarding seaport psychoanalytic symbolism. The main methods such as scientific literature
analysis, interpretation, heuristic method and systemization were used in the research based on
existentialism, humanism, symbolic interactionism, psychoanalysis and analytical psychology.
Keywords: seaport, psychoanalysis, defense mechanisms, resistance.
Introduction
Higher school remains as long as it is characterized by a comprehensive education. Only
comprehensive education helps develop creativity based on anthropology because it directly corresponds
to the creative human nature and helps ensure the flexible psychological self-management in different
situations. Comprehensive education of the maritime academy helps develop creativity and psychological
self-management of a future skilled seaport worker according to the human nature.
Psychological self-management of the personality is especially important when defense mechanisms
(e.g. projection, regression, repression, rationalization, sublimation etc.), given by psychoanalysis,
manifest. Psychological defense mechanisms operate semi-consciously. They are natural and important
because they help survive. However, at the same time they disturb the smooth collaboration in a work-
team, e.g. the chief, succumbing to the regression mechanism, shouts on a subordinate. It is necessary, as
much as it is possible, to apply psychological self-management in stressful situations that are prevailing in
a seaport activity.
One of relevant ways of the skilled seaport worker’s psychological self-management, regarding
defense mechanisms, is based on the analytical psychology as a direction of psychoanalysis. This
psychological direction, created by C. G. Jung, bases the development of the symbolistic approach, which
relates the human nature to one’s own life events, dreams, nature phenomena and myths that grant
significance and help cognize oneself from a broader and deeper point of view [18].
A skilled seaport worker is operating in a port, which is characterized by the seashore (in a broader
sense of reality) that connects the sea and the land. In this connection, the seashore symbolizes a
resistance to sea waves that psychoanalytically symbolize often destructive psychological defense
mechanisms.
A future skilled seaport worker, as a part of nature, has to know and to feel oneself as an integral
part of all that, and to use it in one’s own professional self-expression and self-management. The higher
school has to help develop the psychological approach, based anthropologically, to one’s own vocation,
daily events, professional identification and self-management.
On the one hand, rules, e.g. methods and techniques of the stress management, are important.
However, it is not enough for psychological self-management because the people are different. Moreover,
self-management, based on rules, does not promote the wish to learn and practically apply them.
On the other hand, the symbol is similar to the human nature, and everyone will inevitably
participate in it. It helps ensure creativity, which is most important by implementation of the self-
management based on flexibility. It requires the comprehensive education, which is the only way to

54
develop creativity that helps not only control but also flexibly manage oneself in difficult situations when
psychological defense mechanisms manifest.
So, it is appropriate to consider possible psychological defense mechanisms of a skilled seaport
worker, and psychoanalytic self-management regarding them, by symbolistically relating all that to the
seaport as a resistance of techno-culturally developed seashore (developed personality’s self-
management) against the destructive sea (psychological defense mechanisms).
The grade of the exploration: the number of scientific studies of this type is low. Investigations
are only approaching to this scientific issue [1; 2; 3; 4; 5; 6; 9; 10; 11; 12; 13; 14; 15; 16; 17; 19].
The object of the research is psychological defense mechanisms regarding seaport symbolism.
The goal of the paper is a discussion of skilled port workers’ resistance to their psychological
defense mechanisms regarding seaport psychoanalytic symbolism.
The tasks are as follows:
1. Revelation of the psychological self-management regarding avoidance, transference,
compensation;
2. Consideration of the psychological self-management regarding sublimation, denial, repression;
3. Characterization of the psychological self-management regarding opposite reaction, projection,
conversion;
4. Development of the psychological self-management regarding restitution, rationalization,
regression.
The type of the research and methodological principle
The type of the research is theoretically descriptive.
The methodological principles are as follows:
– Existentialism emphasizes that seashore is not only a work place of skilled seaport workers but
also their existential state, in which their semi-unconscious experiences of the natural and techno-cultural
environment relate between themselves from the anthropological point of view;
– Humanism bases the commitment of a skilled seaport worker to act authentically, by implementing
one’s humanistic nature, where biological and spiritual origins relate between themselves; the seashore
symbolizes them as a relationship between the sea and techno-culturally developed land, and all their
dynamic and creative tensions;
– Symbolic interactionism analyses human behavior that (at the level of the seashore) depends on the
meaning of the seashore; perception of this meaning is the result of the social interaction (e.g. in higher
education) but meanings are applied and changed (depending on situations) in processes of interpretation;
– Psychoanalysis as a psychological direction emphasizes the role of subconsciousness, internal
conflicts and defense mechanisms, which can be partially solved regarding existential interpretation of
semi-unconscious relationships between the seashore and the personality of a skilled seaport worker;
– Analytical psychology, as a direction of psychoanalysis, gives the basis for the development of
symbolistic approach, by relating human nature to life events, dreams, nature phenomena and myths,
which grant significance and help cognize oneself from the broader and deeper point of view.
Methods and methodological limits of the research
The main methods such as scientific literature analysis, interpretation, heuristic method and
systemization were used in the research.
Limits and application - the results of the research are limited by theoretical prerequisites and can be
applied by methodologically basing empirical investigations and psychologically preparing future skilled
seaport workers at the level of higher education.
The conception of the research
It was mentioned that a skilled seaport worker is operating in a port, which is characterized by the
embankment, techno-cultural infrastructure of which is devoted to resist to sea waves that symbolize
often destructive psychological defense mechanisms (Figure 1).

55
Figure 1. Psychoanalytic resistance symbolism
The simplified model of the seaport as a resistance of techno-culturally developed seashore (as a
developed personality’s self-management) against the destructive sea (as psychological defense
mechanisms) is shown. The anthropomorphic approach to this connection is based ontologically.
Relevant psychological defense mechanisms such as avoidance, transference, compensation,
sublimation, denial, repression, opposite reaction, projection, conversion, restitution, rationalization,
regression [7; 8] were chosen. Psychological defense mechanisms are discussed by analyzing their
general conception, possible situation of a skilled seaport worker, advantage and disadvantage, possibility
of general solution and of solution regarding seaport symbolism.
Avoidance, transference, compensation
Avoidance mechanism. Avoidance expresses itself as an abandonment to operate or collaborate etc.
E.g. a skilled seaport worker feels bad, is afraid for criticism and is not doing, what he/she should do.
Cargo handling in seaports is a fast and permanent process. A skilled seaport worker takes part at work,
which is characterized by nonstandard situations. Young workers can avoid their operations because they
do not know how to do the work.
Advantage of the avoidance mechanism - the person is protecting oneself against a possible mistake.
Disadvantage of the mechanism - the unsolved problem is more deepening, collaboration is getting worse
in the intense activity of cargo handling, warehousing, management of documents etc. General possibility
of solution of the problem is development of professional vocation, professional interest and
communication with mature colleagues.
Regarding seaport psychoanalysis, possibility of the solution is anthropological studies of the
embankment, techno-cultural infrastructure of which is devoted to resist to sea waves. This is a
symbolistic example of self-development, which is devoted to help the personality of a skilled seaport
worker not escape from problems but solve them as a natural professional challenge.
Transference mechanism. Transference reveals itself in conflicts. A skilled seaport worker, which
feels as a victim of the chief in managerial relationships, can behave defensively and return to another
person (colleague or family member).
Advantage of the transference mechanism - the person as if proves his/her own self-esteem and
power. However, he/she behaves inappropriately and disturbs relationships, e.g. to his/her subordinates or
family members. General possibility of solution of the problem is development of consciousness of
professionalism and reality of life by perceiving that others are not guilty regarding inappropriate
behavior of the chief. It is important to learn flexible collaboration with the chief.
Regarding seaport psychoanalysis, possibility of the solution is anthropological studies of the
embankment, techno-cultural infrastructure of which is regularly observed and improved according to
problems of the water element. This is a symbolistic example of improvement of the skilled seaport
worker’s personality, by observing himself/herself in reference to commitment to work in the port
company, which is characterized by the natural tension of collaboration.
Compensation mechanism. Compensation expresses itself because of the chief’s limited
personality. If a skilled seaport worker is a chief but is not able to communicate, does not have authority
and is not able to be a leader, so, he/she can naturally portray a boss.
EM
BA
NK
ME
NT
Psychological
defense
mechanisms
Developed
personality
R
E
S I
S
T A
N
C E T
ec
hn
o-c
ult
ur
all
y
de
ve
lop
ed
se
as
ho
re
SE
A W
AV
ES

56
Advantage of the compensation mechanism - the person as if retains his/her authority. However, he/she loses it indeed much more. General possibility of solution of the problem relates to the self-development and psychological self-management.
Regarding seaport psychoanalysis, possibility of the solution is anthropological studies of the embankment, techno-cultural infrastructure of which composes the basis of the seaport superstructure and its activity. This is a symbolistic example, how it is important to learn of combining strictness with friendship because it is the basis of successful managerial relationships.
Sublimation, denial, repression
Sublimation mechanism. Sublimation reveals itself because of aspiration to be appreciated by
others, especially when self-esteem is low. A skilled seaport worker, usually young one, can feel undervalued and try to work and/or communicate too much. Competition among the seaports is strong. Dynamic market of transportation is characterized by big tension. So, the wish of a skilled seaport worker to be noticed and appreciated can be hardly achieved.
Advantage of the sublimation mechanism - the person can prove his/her personal worth for oneself, cognize oneself and show his/her achieved work results to others. However, the reality of managerial relationships is more related to lost health than acquirement of recognition from the side of the government. General possibility of solution of the problem is learning to combine one’s own aspirations with current possibilities, and development of self-esteem by choosing an appropriate worldview.
Regarding seaport psychoanalysis, possibility of the solution is anthropological studies of the embankment, strong techno-cultural infrastructure of which resists to sea waves. A young skilled seaport worker can make efforts. However, the enriched and self-enough personality is as if strong embankment, which is able to resist to sea waves that symbolize the rising aspirations to show oneself to others, depending on them.
Denial mechanism. Denial expresses itself when the person is unable to take responsibility. The chain of collaboration in the seaport requires responsibility of each of its members, so that the activity system of cargo handling or ship agency services would operate well. Mistakes are sometimes occurring at work. A skilled seaport worker, who violated the order and is unable to take responsibility, can pursue to protect himself/herself from negative consequences.
Advantage of the denial mechanism - the person as if defends oneself. However, it does not allow him/her to solve the problem. The person feels bad and cannot freely implement oneself at work. General possibility of solution of the problem is liberation from lie, by applying social and humanitarian studies, learning to perceive that lying does not solve the problem at work and creates disturbed psychological state of the personality.
Regarding seaport psychoanalysis, possibility of the solution is anthropological studies of the embankment, techno-cultural infrastructure of which symbolizes the enriched personality. Sea waves, which deny the power of the embankment to resist them, are symbolizing the mechanism of the wish to deny one’s own mistake. The enriched personality does not allow oneself to behave primitively, and he/she resists to the wish to deny one’s own mistake at work, taking responsibility for quality of one’s own activity.
Repression mechanism. Repression reveals itself by fear to come back in thoughts to an unpleasant experience. Conflicts are rising in seaport companies because of the fast cargo handling, forwarding etc., and of various problems, psycho-emotional stress and different personalities. The experienced conflicts can promote skilled seaport workers to forget them by operating some constructive or destructive activity, instead of giving meaning to the situation at the time or later in long-term prospect of their worth life and mental health.
Advantage of the repression mechanism - the person forgets about his/her unpleasant experience. However, it remains at the level of subconsciousness and later unavoidably manifests by anxiety or terrible dreams. General possibility of solution of the problem is an attempt to grant significance to the negative experience, accept the situation, e.g. perceive that we cannot easily change other’s approach, and calm down.
Regarding seaport psychoanalysis, possibility of the solution is anthropological studies of the embankment, techno-cultural infrastructure of which symbolizes the enriched personality, who is able to give meaning to all his/her own life experiences, and not only to the positive ones because all his/her experiences belong to him/her. Sea waves, which symbolize the repression mechanism, are temporarily calm and are not delivering an attack to the seashore. However, as the embankment must be strong regarding future large waves, so the personality does not have to ignore problems, which will always be, but has to learn the real approach to all one’s own life experiences and to find modus vivendi in accordance to his/her personal values.

57
Opposite reaction, projection, conversion
Opposite reaction mechanism. Opposite reaction expresses itself when one person hates another
and panders to him/her because of defensive motives. Seaport is characterized by fast activity and strong
psycho-emotional tension regarding social managerial relationships. So, not only denial or compensation
mechanism of a skilled seaport worker can manifest during the conflicts but also the opposite reaction.
Advantage of the opposite reaction mechanism - the person, applying false flexibility, avoids the
strong negative reaction of others. However, it is not real relationships. Eventually, real motives
unavoidably appear. General possibility of solution of the problem is learning to authentically
communicate with oneself and others, by perceiving that pandering and lying express the schizophrenic
state, divides the personality and causes diseases. Regarding seaport psychoanalysis, possibility of the
solution is anthropological studies of the embankment, techno-cultural infrastructure of which symbolizes
the strong personality. The sea, which is characterized by underwater currents, is symbolizing the
mentioned defense mechanism. The personality has to learn to comprehensively perceive his/her nature
and dignity, and to apply the authentic collaboration, resisting to debased motives of pandering.
Projection mechanism. Projection reveals itself when the person does not want to notice his/her
own mistakes and tends to blame others. Projection can express itself in the maritime sector and in any
other situation of social life. Usually, a weak and inadequately responsible chief can tend to apply over
control to his/her subordinates, especially at extreme conditions of a seaport activity.
Advantage of the projection mechanism - the chief tries to protect his/her own reputation. However,
he/she loses his/her authority because subordinates naturally perceive the real situation and real causes of
problems. General possibility of solution of the problem is permanent self-development of the chief,
regular development of his/her authority and application of supportive leadership.
Regarding seaport psychoanalysis, possibility of the solution is anthropological studies of the
embankment, techno-cultural infrastructure of which symbolizes the strong personality. Destructive sea
power is not a cause when the embankment cannot sustain. This is problem of the embankment
construction and its maintenance. The chief, who enriches his/her personality, does not allow oneself to
blame others, even if others are really guilty. He/she applies leadership, creates adequate relationships to
his/her subordinates and solves problems with them together ensuring positive psychological climate.
Conversion mechanism. Conversion expresses itself when the person at work is afraid to ask on
something. He/she feels bad because his/her super-ego (conscience) requires an implementation of the
obligation, and the person eventually becomes sick. Activity in a seaport is characterized by many
nonstandard situations, in which a skilled seaport worker (especially a young one) confuses but is afraid
to ask for help in the beginning of his/her professional career. Melancholic introverts and isolated people,
e.g. with Nordic mentality, can be more characterized by the conversion mechanism. Frequent illnesses of
young specialists can be namely related to the conversion mechanism based on psychosomatic processes.
Although conversion is a big problem but its advantage is a temporary isolation of oneself from the
problematic situation. A young specialist can know better about himself/herself and the real causes of
his/her illness. General possibility of solution of the problem is learning of communication and
collaboration when the person perceives oneself as a timid one, especially when transparency is the policy
of the seaport company and the chief applies the supportive leadership.
Regarding seaport psychoanalysis, possibility of the solution is anthropological studies of the
embankment, techno-cultural infrastructure of which is namely devoted to resist to the sea waves. This is
a symbolistic example of self-development, which is devoted to help the personality of a young skilled
seaport worker perceive that any work relates to problems. They are natural challenges at work in the
seaport, which is characterized by fast activity and problems that require urgent solution.
Restitution, rationalization, regression
Restitution mechanism. Restitution reveals itself when the person feels guilty and manipulates
others by applying apologies. This phenomenon can be related to the chief of a seaport company but more
to a young subordinate, especially female one, after conflicts at extreme conditions.
Advantage of the restitution mechanism - the person is searching ways to create good work
relationships. However, when the situation does not require apology or it is not true, so, it is only
manipulative one. Manipulations do not allow a creation of certain relationships. General possibility of
solution of the problem is a development of adequate self-esteem and partnership at work.

58
Regarding seaport psychoanalysis, possibility of the solution is anthropological studies of the embankment, techno-cultural infrastructure of which symbolizes self-esteem of the personality, who is able to resist to manipulative motives.
Rationalization mechanism. Rationalization expresses itself when the person, who has behaved inappropriately, is seeking to justify oneself. The person, who experiences failure at work, tends to justify oneself using, e.g. ineffective marketing of the port company, instead to make strategies further, applying self-criticism, too.
Rationalization mechanism advantage - the chief or a skilled seaport worker feels better when justifies oneself. However, the person deceives oneself and stops a creation of new strategies of the company’s activity for solution of problems. General possibility of solution of the problem is not to waste time for justification but to learn the solution of problems, perceiving them as natural challenges.
Regarding seaport psychoanalysis, possibility of the solution is anthropological studies of the embankment, techno-cultural infrastructure of which symbolizes self-esteem of the personality, who is able to resist to the debased justification. Adequate self-esteem does not allow oneself to justify and calm down but it promotes to solve problems, unless the solution of problems is impossible at all honestly saying to oneself - “feci quod potui”.
Regression mechanism. Regression reveals itself when immature people, entered the unsuccessful situation, are degraded to primitive forms of communication. E.g. immature skilled seaport workers or chiefs of port companies, who are not characterized by the leadership competence, shout on each other in conflict situations.
Advantage of the regression mechanism is a false show of one’s own power. However, the problem is more deepened. A chief loses his/her own authority in terms of his/her subordinates. A worker loses his/her reputation in terms of his/her colleagues. A shout reduces capacity of work. General possibility of solution of the problem is learning of self-management. The person is more than a machine. The communication with him/her must be adequate, applying the supportive leadership.
Regarding seaport psychoanalysis, possibility of the solution is anthropologically based studies of the embankment, techno-cultural infrastructure of which symbolizes dignity and self-management of the personality under any condition.
Conclusions
A skilled seaport worker has to recognize the defense mechanisms in oneself and does not have to allow that they completely overpowered him/her. Psychological self-management, regarding avoidance, transference and compensation, is characterized by the self-development, which is devoted to help the personality not escape from problems but solve them as a natural professional challenge. It is important to learn of combining strictness with friendship because it is the base of successful managerial relationships.
Consideration regarding sublimation, denial and repression is related to the enriched and self-enough personality who does not allow oneself to behave primitively, and he/she resists to the wish to deny one’s own mistake at work, taking responsibility for quality of the activity. The enriched and self-enough personality is as if strong embankment, which is able to resist to sea waves that symbolize the rising aspirations to show oneself to others, depending on them. The personality does not have to ignore problems, which will always be, but has to learn the real approach to all one’s own life experiences and to find modus vivendi in accordance to his/her personal values.
Opposite reaction, projection and conversion are characterized by the personality who has to learn to comprehensively perceive his/her nature and dignity, and to apply the authentic collaboration, resisting to debased motives of pandering. The chief, who enriches his/her personality, does not allow oneself to blame others, even if others are really guilty. He/she applies leadership, creates adequate relationships to his/her subordinates and solves problems with them together, ensuring positive psychological climate. Self-development is devoted to help the personality of a young skilled seaport worker perceive that any work relates to problems. They are natural challenges at work in the seaport, which is characterized by fast activity and problems that require urgent solution.
Restitution, rationalization and regression are related to self-esteem of the personality who is able to resist to manipulative motives. The personality is able to resist to the debased justification. Adequate self-esteem does not allow oneself to justify and calm down but it promotes to solve problems, unless the solution of problems is impossible at all. Anthropologically based psychoanalytic studies of the embankment are important, techno-cultural infrastructure of which symbolizes dignity and psychological self-management of the personality under any condition.
The results of the research are limited by theoretical prerequisites and can be applied by methodologically basing empirical investigations and psychologically preparing future skilled seaport workers at the level of higher education.

59
References
1. Beckenhagen, E. Schiffahrt in der Weltliteratur. Ein Panorama aus fünf Jahrtausenden.
Bremerhaven: Kabel, 1995.
2. Beresnevičius, G. Ant laiko ašmenų. Vilnius: Aidai, 2002.
3. Chiesa, C. On the Seashore of an Endless World. Children Play: Using Transactional Analysis in
Play Therapy with Children. Transactional Analysis Journal, Vol. 44, 2014, pp. 128-141.
4. Corbin, A. Meereslust. Das Abendland und die Entdeckung der Küste. Frankfurt am Main:
Fischer Taschenbuch, 1994.
5. Durkheim, E. Die elementaren Formen des religiösen Lebens. Frankfurt am Main: Verlag der
Weltreligionen, 2007.
6. Freud, S. Das Unbehagen in der Kultur. Wien: Internationaler Psychoanalytischer Verlag, 1930.
7. Freud, A. The Ego and the Mechanisms of Defence. London: Karnac Books, 1993.
8. Fürst, M. Psichologija. Vilnius: Lumen, 1998.
9. Goldschmidt, G. A. Als Freud das Meer sah. Zürich: Ammann, 2003.
10. Jovaiša, L. Ugdymo mokslas ir praktika. Vilnius: Agora, 2001.
11. Kaufmann, J. C. Frauenkörper – Männerblicke. Soziologie des Oben-ohne. Konstanz: UVK
Verlagsgesellschaft, 2006.
12. Lileikis, S. Kultūrinės ir psichosocialinės jūrinės edukacijos metodologiniai metmenys.
Klaipėda: Klaipėdos universiteto leidykla, 2011.
13. Lileikis, S. Jūrinės savivokos formavimosi kontūrai: asmenybės vertingumo linkmė. Klaipėda:
Lietuvos aukštoji jūreivystės mokykla, 2015.
14. Mega, V. P. Cities by the Sea: Ideas and Innovation, Science and the Arts. Heidelberg, New
York: Springer, 2016.
15. O’Connor, K. Imagining and Consuming the Coast: Anthropology, Archeology, ‘Heritage’ and
‘Conservation’ on the Gower in South Wales. Imagining Landscapes - Past, Present and Future. London,
New York: Routledge, 2016, pp. 121-142.
16. Schmid-Höhne, F. Die Meere in uns. Eine psychologische Untersuchung über das Meer als
Bedeutungsraum. Herbolzheim: Centaurus Verlag, 2006.
17. Tenzer, E. Einfach schweben. Wie das Meer den Menschen glücklich macht. Hamburg:
Marebuchverlag, 2007.
18. The Earth Has a Soul: C. G. Jung on Nature, Technology & Modern Life. California: North
Atlantic Books, 2016.
19. Wirth, H. J. 9/11 as a Collective Trauma and other Essays on Psychoanalysis and Society.
Gießen: Psychosozial-Verlag, 2004.

60
OPPORTUNITIES OF IMPROVEMENT IN LEARNING COLREGS
AT LATVIAN MARITIME ACADEMY
Kristaps Lūkins Latvian Maritime Academy, 12-k Flotes Street, Riga, LV-1016, Latvia,
E-mails: [email protected]
Abstract
International Maritime Organization (IMO), European Maritime Safety Agency (EMSA) and other
organizations note that ship collisions are one of the most common types of accidents at sea. Lack of
understanding and inappropriate use of the International Regulations for Preventing Collisions at Sea
(COLREG) is meant to be the most frequent reason of such cases. European Union project “Avoiding
Collisions at Sea” that began on 1st November 2013 lasted two years and showed the level of
understanding and the degree of correct application of COLREGs. Latvia did not take participation in the
project, nevertheless it is interesting and useful to compare project results with the level showed by
students of Latvian Maritime Academy (LMA). The paper not only describes the need of questionnaire
that includes real-life situations between vessels and identifies rules of the Collision Regulations which
are hardest to understand by LMA students. The results of testing show opportunities of learning
improvement, since lecturer is the one who can encourage study process by collaboration with students to
reduce skill gaps in knowledge and teaching of COLREGs.
Keywords: COLREGs, interpretation, teaching, understanding.
Introduction
It is proposed by International Maritime Organization (IMO) that safety and security of life at sea,
marine environment protection and over 90% of the world’s trade depends on the competence and
professionalism of seafarers [5]. European Maritime Safety Agency at its annual overview of maritime
casualties and incidents note that during period from 2011 till 2014 there were 67% of accidents related to
human erroneous actions. Most of them by nature of occurrence are loss of control (24%), contact (18%),
collision (17%), grounding and stranding (17%). Half of accidents involved cargo ships [3]. IMO reports
that 80% of accidents at sea are due to human factors. [8]
During investigation on human factor in seafaring it is concluded that 10% of all collisions occurred
due to not complying with International Regulations Preventing Collisions at Sea 1972, as amended
(COLREGs). [7] COLREGs and duties concerning watchkeeping in Latvian Maritime Academy (LMA)
are studied in course Watchkeeping. It is studied during all grades from second till fifth and before
passing government exam of competence, students must show they knowledge, skills and competence in
pre-exam that includes questions about COLREGs and watchkeeping only.
The aim of this paper is to check the level of students self-assessment about learning COLREGs,
search misunderstandings of COLREGs rules and look for most appropriate study method. As study
process involves both sides – students and lecturers, it is important to analyze students’ opinion about
themes and topics being taught. Pedagogically psychological conditions of collaboration between students
and lecturers form the importance of improving nautical study programs. Optimal approach of the way
how to achieve the maritime field requirements for competence of navigational officers is searched by
involving students into study process, self-evaluation and self-assessment of their study work. European
Union project Avoiding Collisions and Sea (ACTs) was realized in LMA to compare the level and
opinion of LMA students with results of original ACTs. Beside that students received self-assessment
charts to evaluate their level of understanding COLREGs.
Human element in Watchkeeping and COLREGs
IMO describes human element as a complex multi-dimensional issue that affects maritime safety,
security and marine environmental protection involving the entire spectrum of human activities
performed by ships’ crews, shore based management, regulatory bodies and others. IMO has adopted
resolutions and guidelines concerning human element in maritime transport industry and safe operation of
ships. For example, International Safety Management (ISM) Code establishes an international standard
for the safe management and operation of ships. It is stated that: “Effective implementation of the ISM

61
Code should lead to a move away from a culture of "unthinking" compliance with external rules towards
a culture of "thinking" self-regulation of safety - the development of a 'safety culture'. The safety culture
involves moving to a culture of self-regulation, with every individual - from the top to the bottom -
feeling responsible for actions taken to improve safety and performance. Application of the ISM Code
should support and encourage the development of a safety culture in shipping.”
Requirements of safe navigational watch are stated in International convention on standards of
training, certification and watchkeeping for seafarers, 1978 (STCW convention). Extract from Regulation
II/1 about basic principles to be observed in keeping a navigational watch:
“1. Parties shall direct the attention of shipowners, ship operators, masters and watchkeeping
personnel to the following principles which shall be observed to ensure that a safe navigational watch is
maintained at all times.
2. The master of every ship is bound to ensure that watchkeeping arrangements are adequate for
maintaining a safe navigational watch. Under the master’s general direction, the officers of the watch are
responsible for navigating the ship safely during their periods of duty when they will be particularly
concerned with avoiding collision and stranding.”
Also, STCW Code Part A “Mandatory standards regarding provisions of the annex to the
convention” Chapter VIII Standards regarding watchkeeping notes principles to be observed in keeping a
navigational watch: “The officer in charge of the navigational watch is the master’s representative and is
primarily responsible at all times for the safe navigation of the ship and for complying with the
International Regulations for Preventing Collisions at Sea, 1972.” [1]
Authors of “A Guide to the Collision Avoidance Rules” reminds that complete knowledge of
COLREGs has always been considered to be essential for navigating officers. They state a problem about
committing the Rules to memory. This does not always result in a clear understanding of the contents. A
guide to the Collision Avoidance Rules promotes a better understanding of the Rules by discussing the
implications of the various phrases and gives Court interpretations. It has been noticed that nautical
students learn the COLREGs Rules by heart, but when they are asked to apply the Rules on the
navigational simulator or during practical training on board, it has been observed that they often fail to
understand the concept and practical application of some of the Rules.
However, during the study process students have wide look on the situations concerning collision
avoidance, but in real life situations during sea going practice the implications of COLREGs depend on
surrounding conditions.
Klaas van Dokkum in his “The Colregs Guide – A Fully Illustrated Textbook” gives the same
opinion that learning COLREGs will not in general present the nautical student with any insuperable
problems. It is a wrong impression that after passing several tests and exams the COLREGs and the
manoeuvres for giving way hold no secrets for the future officer. Busy channels demand a quite different
approach to applying the COREGs Rules. Most situations there are slightly different from those learned
and are not always so clearly related to a certain Rule. A lot of experience is needed to be able to interpret
all these situations, for example during night time, when matching radar images with real world calls for
quite some effort and expertise. Author emphasizes that self-reliance is a part of the job for a
watchkeeping officer and there is a real danger that one will not notice that the COLREGs have been
learned wrongly and are consequently falsely applied or interpreted. Sometimes an officer will not be
receptive to corrections. [2]
Nevertheless, as it is stated that learning COLREGs by heart or bare following to Rules is not
sufficient for safe navigation, it must be understood that without full knowledge of all included points,
details and responsibilities officer of watch cannot be able to analyze the situation between two or even
more vessels and solve the risk of collision.
Knowledge and understanding of collision avoidance rules
The International Regulations for Preventing Collisions at Sea are a convention by themselves
issued by IMO and are divided into 5 parts and 4 Annexes. Part A includes general rules about
application, responsibility and definitions. 19 rules Part B are divided into three sections depending on
terms of visibility. Section I Conduct of vessels in any conditions of visibility includes rules about look-
out, safe speed, risk of collision, action to avoid collision, narrow channels and traffic separation
schemes. Section II Conduct of vessels in sight of one another covers rules for sailing vessels, overtaking,
head-on and crossing situations, states responsibilities of give-way vessels and stand-on vessels and
responsibilities between different types of vessels due to their manoeuvrability. Section III is for conduct
of vessels in restricted visibility stating a way different principles of avoiding risk of collision or close-

62
quarters situation. Following Part C Lights and Shapes, Part D Sound and Light Signals are for
recognition of vessels during night by lights and during day time by shapes, signals for their actions and
plying in restricted visibility. Part E is for Exemptions. Annexes include characteristics and position of
lights, sound signaling apparatus and additional signals for fishing vessels and Annex IV Distress signals.
[1]
As proper look-out is the main condition for correct use of all other rules, there must be considered
navigation principles stated in STCW convention. Due to proper look-out and correct identification of the
situation in prevailing conditions of visibility the appropriate action to avoid collision must be done.
Failing in this action can mislead others in the vicinity and make approaching situation harder to solve.
European Union project – Avoiding Collisions at Sea (ACTs) began at 1st November 2013 and
lasted 24 months. The questionnaire was prepared by lecturers and assistants at the Faculty of Maritime
Studies Rijeka with the aim to identify knowledge gaps and deficiencies in the application of the
COLREGs Rules (Mohovic, 2016). The survey was designed to determine which rules are difficult to
understand and which rules are most frequently broken it practice. For studying situation at LMA in this
paper group of questions concerning opinion was used. Student self-assessment about learning rules was
supplemented and compared with results showing correct applications of binding rules in ACTs.
Comparison of students’ answers on question “Which rules are hardest to understand?” shows
similar situation in LMA Watchkeeping subject as it was in EU project ACTs. Rule 8 – action to avoid
collision, rule 9 – narrow channels, rule 10 – traffic separation schemes, rule 19 - conduct of vessels in
restricted visibility are hardest to understand. Difference in percentage of few rules can be explained by
number of students covered by each research. It is obvious that no problems with application of rules that
covers situations without any special circumstances. Problems occur when it is restricted waters (rule 9),
limited lanes (rule 10), restricted visibility (rule 19) or navigator need to choose the best action from all
available (rule 8) (see Figure 1).
Figure 1. Percentage of answers by each Rule for question: “Which Rules are hardest to understand?” ([6],
LMA, 2017)
Similar opinion is visible from Figure 2 showing percentage of answers by each Rule for question
“Rules which are the most difficult for students to understand”. This question was offered only for
lecturers. Rules 19, 10, 8, 9 are mentioned here more frequently. Additional Rule 18 about responsibilities
between vessels appeared, but it has the same characteristic – special circumstances as different types of
vessels with varied ability to manoeuvre are involved in risk of collision (see Figure 2).
By using self-assessment charts with 52 competence based skills research on students’ opinion about
their learning process and outcomes was carried out. Self-assessment charts included IMO Model course
7.01 and 7.03 included competences for navigator officers. Each of selected competence was related to
one particular Rule from COLREGs. Students had to point whether they have learned the Rule totally,
partly or rule is not learned at all. Answers concerning opinion about totally learned Rules are showed in
Figure 4. The result can be compared with the one from ACTs just to discuss a gap between knowledge
and viewpoint on hardest Rules to be learned.
0%
10%
20%
30%
40%
50%
60%
1 2 3 4 5 6 7 8 9 10 11 12 13 14 15 16 17 18 19
Which Rules are hardest to understand?
Students of LMA 4th grade (n=77) ACTs (n=466)

63
Figure 2. Percentage of answers by each Rule for question: “Rules which are the most difficult for students to
understand”. [6]
Figure 3. Percentage of answers by each Rule for question: “Which Rules are hardest to understand?” ([4],
LMA, 2017)
Figure 4. Percentage of totally learned rules based on student self-assessment. (LMA, 2016)
19%
13%12%
10% 10% 10%
5% 5%4%
3% 3% 3%1% 1%
0% 0% 0% 0% 0%0%
5%
10%
15%
20%
25%
8 10 1 2 9 19 7 17 13 6 12 18 3 16 4 5 11 14 15
Which Rules are hardest to understand?Students of LMA 4th grade…
77%
59%
94%
81% 83%
61%71%
63% 66%
83% 82% 82% 86% 84%90%
79%86%
67%
0%10%20%30%40%50%60%70%80%90%
100%
Totally learned rules

64
As there are different methods how Rules can be taught, students of LMA were given to rank
effectiveness of seven methods (1 is the least, 7 is the most effective). Percentage of answers shows that
students think practical training in board, classroom teaching with teacher explanation of each rule and
learning COLREGs using real-life or prepared scenarios, also using navigation simulator as most
effective methods. Online and distance learning or self-study is mentioned as least effective methods of
learning COLREGs (see Figure 5).
Figure 5. Percentage of answers for question: Which teaching methods do You think is the most effective?”
([4], LMA, 2017)
Conclusions
IMO and EMSA point out that human factor is one of the most relevant with collisions at sea.
Human factor leads to different application of COLREGs and various explanations of terms. Research on
avoiding collisions at sea and COREGs Rules learning in EU project ACTs and the same questionnaire
realized in LMA shows similar trends – problems occur when simple rules must be used in conditions
concerning narrow places to navigate, involving different types of vessels and restricted visibility as well.
Student self-assessment of study process and outcomes of learning COLREGs are related. The same
view on hardest Rules to learn is from lecturer side. Collaboration between lecturer and students can lead
to more effective outcomes of study process if supplemented with practical tasks involving real-life
situations between vessels and scenarios concerning conduct of vessels in different conditions. It is
advisable to learn Rules during practical training on board.
It is recommended to include ACTs or similar questionnaires in Watchkeeping course in future to
research different explanations of terms and conditions depending on the level of studies and continue to
analyze results of the EU project ACTs relatively to results showed by students of LMA Rule by Rule.
References
1. Cockcroft, A.N., Lameijer J.N.F., A Guide to the Collision Avoidance Rules International
Regulations for Preventing Collisions at Sea, 7th edition, 2012, 175p.
2. Dokkum, K.van, The Colregs Guide, a Fully Illustrated Textbook, 3rd edition, DOKMAR, 2012,
196p
3. EMSA, European maritime Safety Agency, Annual overview of marine casualties and incidents
2015, EU; http://www.emsa.europa.eu/emsa-documents/latest/item/2551-annual-overview-of-marine-
casualties-and-incidents-2015.html
4. EU Project – Avoiding Collisions at Sea, retrieved from web site at February 27, 2017:
http://www.adam-europe.eu/prj/10860/prj/ACTs%20Questionnaire.pdf
5. IMO, International Maritime Organization, Human element, retrieved on web site at 1st March,
2017: http://www.imo.org/en/OurWork/HumanElement/Pages/Default.aspx
17%
11%
16% 17%
10% 9%
20%
0%
5%
10%
15%
20%
25%
Cla
ssro
om
tea
chin
gw
ith
te
ach
erex
pla
nat
ion
of
eac
hru
le
Usi
ng
self
e-l
earn
ing
(sel
f-st
ud
y, s
elf-
imp
rove
me
nt
typ
ew
ith
bo
oks
or
CD
s)
Lear
nin
g C
OLR
EGu
sin
g n
avig
atio
nsi
mu
lato
r
Lear
nin
g C
OLR
EGu
sin
g re
al-l
ife
or
pre
par
ed
sce
nar
ios
e.g.
An
imat
ion
s
On
line
lear
nin
g in
agr
ou
p (
Inco
rpo
rate
sco
mp
ute
r, w
ebb
ased
an
d e
-…
Dis
tan
ce le
arn
ing
-in
agr
ou
p(I
nte
ract
ion
wit
hin
stru
cto
r an
d…
Pra
ctic
al t
rain
ing
on
bo
ard
Which teaching methods do You think are the most effective?
Students of LMA…

65
6. Mohovic, D., Mohovic, R., Baric, M., Deficiencies in Learning COLREGs and New Teaching
Methodology for Nautical Engineering Students and Seafarers in Lifelong Learning Programs, The
Journal of Navigation, 2016, 69, 765-776.
7. Švetak, J., Model of Optimal Collision Avoidance Manoeuvre on the High Seas to Improve
Safety at Sea. Slovenia, Naše more 60(1-2), 2013, (pp. 1–7).
8. Ziarati, R., What Is Wrong? A Review of National, European and International Efforts in
Improving the Standard and Quality of Maritime Education and Training. St. John's, Newfoundland and
Labrador, Canada: IMLA21 Conference, October 9th -12th 2013.

66
THE EFFECT OF THE PHASE COMPOSITION OF THE ANODE
MATERIAL ON THE PROCESS PARAMETERS AND THE
FORMATION OF THE RESULTING COATINGS IN
ELECTROSPARK ALLOYİNG (ESA)
Z. Z. Sharifov, F. N. Gurbanov Azerbaijan State Marine Academy
Abstract
The interaction of the electrode material’s phase composition with the parameters of the process during
electro-spark alloying (ESA) and their effect on the resulting coatings’ formation have been investigated
in this article. Concentration dependence of total cathode weight gain to the brittle fracture boundary
during ESA of the steel 35 by BN-Mn anode material, the effectiveness of the coating formation process,
transition coefficient and total erosion of anode have been identified. The granulometric composition of
the products of erosion of the alloying anode was determined.
Keywords: electro-spark alloying, electrode, anode, cathode, transition coefficient, brittle fracture, total
weight gain
Introduction During ESA process the different thickness, wholeness and roughness alloying layer (a.l) is formed
on the surface of the part. The control of these parameters is performed by technological modes of
processing, as well as alignment of the phase constituent of alloying electrode’s material. Depending on
the special time of the alloying, and electric parameters of the titanium smelting with aluminum and
nickel in Alloying layer the learning by the electronic microscope had been done in 1-3. As a
continuation of this work, the electrode material’s phase composition morphology and effect to conditions
of the formation of surface layer in cathode is studied.
Discussion
BN-Mn alloys and different volume share of the unit like the electrode material have been used.
These alloys were obtained by the Pressing of the BN (purity 99.5%) and Mn (purity 99.5%) crumbs and
cooking in “СШВЛ” vacuum oven with argon environment.ESA of the steel “35” was carried out in EFI-
46A (ЭФИ-46A) equipment with the air environment.
In accordance with the classification of work 4 the processing mode has been tailored to
"thermomechanical" alloying (R=J2q/E=15A/C), where the influence of temperature to erosion of the
electrode materials together with the cyclic mechanical loads resulting from spark charges has helped in
many cases.
Total erosion of Anode t
a and increase of cathode t
k in the process of ESA were
measured with accuracy which is not exceed 4%. According to these information the kinetic dependences
of the ESA’s characteristics were made up and brittle disintegration border of the alloying layer (a.l) tx
(special time of the alloying, when the negative increase happens twice) and transition coefficient
K=k/a % was defined. The wholeness of the alloying layer (a.l) were determined by the micrometer,
but the roughness by MИСII microscopy tool set.
X-ray phase analysis of the alloys under copper and chromium radiation was done in DPOН -2
equipment. The phase composition of the erosion products is identified with cu- radiation by metal
powder. The working surface of cathode’s form was learned with the help of РЭМ -200 microscope.
According to X-ray phase analysis’ data the main components after the cooking of BN-Mn system’s
materials are the BN(Mn) and Mn (BN) solid solutions, BMn2 is the eutectic and intermetallid, the
composition of which is difficult to determine. According to the formula xt
k K proposed in the
work [4, where the K is the averaged transition coefficient during tx time, the effectiveness of the
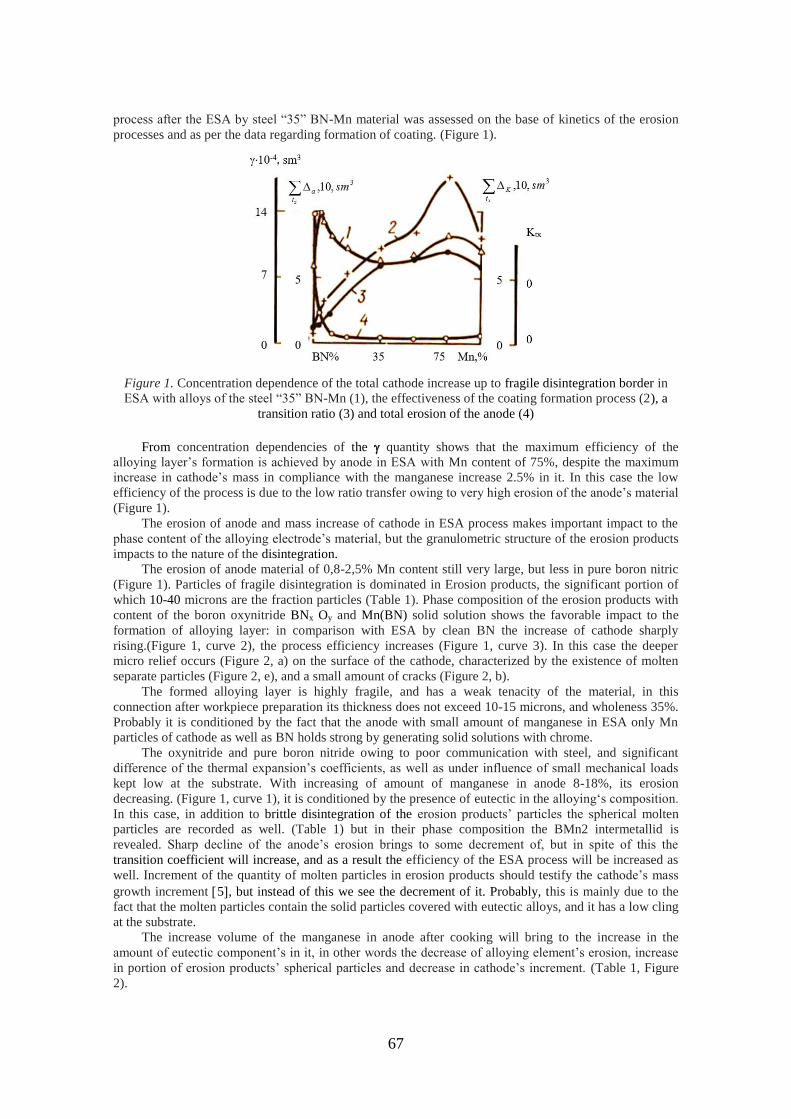
67
process after the ESA by steel “35” BN-Mn material was assessed on the base of kinetics of the erosion
processes and as per the data regarding formation of coating. (Figure 1).
Figure 1. Concentration dependence of the total cathode increase up to fragile disintegration border in
ESA with alloys of the steel “35” BN-Mn (1), the effectiveness of the coating formation process (2), a
transition ratio (3) and total erosion of the anode (4)
From concentration dependencies of the quantity shows that the maximum efficiency of the
alloying layer’s formation is achieved by anode in ESA with Mn content of 75%, despite the maximum
increase in cathode’s mass in compliance with the manganese increase 2.5% in it. In this case the low
efficiency of the process is due to the low ratio transfer owing to very high erosion of the anode’s material
(Figure 1).
The erosion of anode and mass increase of cathode in ESA process makes important impact to the
phase content of the alloying electrode’s material, but the granulometric structure of the erosion products
impacts to the nature of the disintegration.
The erosion of anode material of 0,8-2,5% Mn content still very large, but less in pure boron nitric
(Figure 1). Particles of fragile disintegration is dominated in Erosion products, the significant portion of
which 10-40 microns are the fraction particles (Table 1). Phase composition of the erosion products with
content of the boron oxynitride BNx Oy and Mn(BN) solid solution shows the favorable impact to the
formation of alloying layer: in comparison with ESA by clean BN the increase of cathode sharply
rising.(Figure 1, curve 2), the process efficiency increases (Figure 1, curve 3). In this case the deeper
micro relief occurs (Figure 2, a) on the surface of the cathode, characterized by the existence of molten
separate particles (Figure 2, e), and a small amount of cracks (Figure 2, b).
The formed alloying layer is highly fragile, and has a weak tenacity of the material, in this
connection after workpiece preparation its thickness does not exceed 10-15 microns, and wholeness 35%.
Probably it is conditioned by the fact that the anode with small amount of manganese in ESA only Mn
particles of cathode as well as BN holds strong by generating solid solutions with chrome.
The oxynitride and pure boron nitride owing to poor communication with steel, and significant
difference of the thermal expansion’s coefficients, as well as under influence of small mechanical loads
kept low at the substrate. With increasing of amount of manganese in anode 8-18%, its erosion
decreasing. (Figure 1, curve 1), it is conditioned by the presence of eutectic in the alloying‘s composition.
In this case, in addition to brittle disintegration of the erosion products’ particles the spherical molten
particles are recorded as well. (Table 1) but in their phase composition the BMn2 intermetallid is
revealed. Sharp decline of the anode’s erosion brings to some decrement of, but in spite of this the
transition coefficient will increase, and as a result the efficiency of the ESA process will be increased as
well. Increment of the quantity of molten particles in erosion products should testify the cathode’s mass
growth increment 5, but instead of this we see the decrement of it. Probably, this is mainly due to the
fact that the molten particles contain the solid particles covered with eutectic alloys, and it has a low cling
at the substrate.
The increase volume of the manganese in anode after cooking will bring to the increase in the
amount of eutectic component’s in it, in other words the decrease of alloying element’s erosion, increase
in portion of erosion products’ spherical particles and decrease in cathode’s increment. (Table 1, Figure
2).

68
a b c
Figure 2. After ESA with BN-0,8% Mn material, the working surface microstructure of stell “35”.
Augmentation: A-200; b-800; c-2000
Table 1. Granulometric composition of the alloying electrode’s erosion products
Anode’s Compositon, %
Brittle particles Molten particles
measure, mkm Volume part, % measure, mkm Volume part, %
BN
BN-0,8Mn
BN-2,5Mn
BN -8Mn
BN-18Mn
BN-55Mn
BN-75Mn
Mn
28
8-75
35-75
15-75
35-95
35-75
55-75
55-75
85
98
85
85
75
65
45
45
18
18
35-55
35
35
35-75
15-55
15-55
15
2
15
15
25
35
55
5
All of the patterns are evident in the form of cathode’s working surface. For example, when there is
35% of Mn in anode’s material the involvement of liquid phase increases in formation of relief. (Figure 3,
a). At the same time, a large amount of incorrectly shaped pores are exposed, it can be interpreted as the
breaking of individual particles under the influence of the spark discharge, as a result of brittle
disintegration of alloying surface (Figure 3, b, c). In phase composition of alloying electrode and the
presence of large amount of intermetaldin in erosion products stipulates by discovery of cracks on
alloying surface (Figure 3, b).
These intermetaldins with substrate and with materials transitioned to it have different thermal
expansion coefficient. The anode’s erosion and cathode’s increment in ESA increase with 75% Mn
content electrodes (Figure 1, curves 1,2), in this case the intensity of the process, the alloying layer’s
thickness and its wholeness has a maximum rate. Probably, with achievement of full eutectic in this type
of anode, and mainly by the solid solution of BN (Mn) with large share of molten spherical particles in
anode’s erosion products can be done by affordable size of erosion products, it helps them to stand firm
on substrate. The shallow relief is formed on the surface of processed parts (Figure 4, a), The small
splashes of molten anode’s material is accompanied, less important amount of fairly small pores, small
amount of individual particles prints and small cracks on the strengthened surface is recorded. (Figure 4,
b, c).
After consolidating of the steel directly by manganese the total quantity of anode’s erosion t
a
is stabilizing, the total increment of cathode up to - tx , the effectiveness of ESA process , K decreases
slightly (Figure 1).
It is known 76 that, the transition of manganese to the brittle condition has temperature high
enough (4004500C). In the strengthening by manganese in the air and because of the solution of the
oxygen in it, the cooling border is increasing. In erosion products of it, the incorrectly shaped coarse
particles are dominated. There is a difficulty in tenacity of them on the surface of cathode.
We can see from Table 1 that after the ESA with pure manganese there are molten spherical
particles in the erosion products, not less than brittle particles. But catching of such particles with the
cathode probably is difficult, because their surface in the conditions of high temperatures spark discharge
in the air are oxidized, and the oxides are bad holding on the steel substrate. In this case, the micro-relief

69
formed on surface characterized by the presence of a small amount of melted tightened areas and small
spherical pores on it (Figure 5, b), probably they arise as a result of gas emission during alloy. The relief
is forming mostly in the presence of the liquid phase, its quick crystallization brings to creation of a large
number of thermal cracks on strengthened layer distributed to the entire depth up to substrate. (Figure 5,
c). That is confirmed by the results of metallographic analysis (Figure 6). So, the granulometric and phase compositions of the erosion products, the effectiveness of the
Electro-spark alloying process, the thickness and wholeness of the alloying layer and the shape of the
surface coating are determining by the phase composition of the anode’s material.
a b c
Figure 3. Microstructure of the surface layer of steel “35” after ESA with BN-35Mn alloy. x200
a b c
Figure 4. Microstructure of the surface layer of steel “35” after ESA with BN-75% Mn material. x200
a b c Figure 5. Microstructure of the surface layer of steel “35” after ESA with pure manganese. x200

70
Figure 6. Microstructure of the strengthened layer of steel “35” after ESA with pure manganese. x600
The obtained result shows competitiveness of the alloying layer’s saturation processes by mutual
impact of cathode material transitioned to materials under the multiple influence of the spark discharges,
the mechanical loads and heat influence.
Optimal structure and the phase composition at which the highest effectiveness of ESA is achieved,
was formed by alloying with anode of 75% Mn content.
Conclusions
The effect of the electrode material’s phase composition to the process of ESA and to the formation
of the layers was investigated. Certain that, phase composition of the anode’s material, granulometric and
phase compositions of the erosion products determine the effectiveness of ESA process, the thickness and
wholeness of the alloying layer and the form of the surface’s cover.
In determining of the amount of plastic binding in alloyed alloys, not only consideration of the
maximum effectiveness of the process, but the purpose of the coating to be taken into account as well.
References
1. Pilyankevich, A. N., Martynenko, A. I., Verhoturov, A. D., Derno, V. I. Electr.obra. Electron
microscope investigation of hardened layers under EIL of a Titanium alloy VT-18 with aluminum.
Materials, 1999, No.4 / 5, p. 40-42.
2. Pilyankovich, A. N., Paderno, V. N., Verhoturov, A. D. Structural features of surface layers after
electro-spark alloying of the titanium alloy VT-18 with aluminum in a hard mode / et al., 2000, No. 1/2,
p. 30-32.
3. Pilyanovich, A. N., Paderno, V. N., Verkhoturov, A. D., Martynenko, A. N. Investigation of the
surface structure of electrodes during electro-spark alloying of a titanium alloy VT-18 with nickel. 2002,
No. 4/5, p. 30-33.
4. Verhoturov, A. D., Podchernyaeva, I. A. Classification of types of electro-spark alloying. -
Electrophiz. And electrochemical methods of treatment., 2003, № 3, p.5-7.
5. Verkhoturov, A. D., Murzin, L. M. On the Mechanism of Electrical Erosion of Composite
Materials in Electro-spark Doping // Powder Metallurgy, 2003, № 7/8, p. 94-99.
6. Samsonov, G. V., Verkhoturov, A. D., Bovkun, G. A., Sychev, V. Electro-spark alloying of
metal surfaces. Kiev: Nauk.dumka, 1996.

71
THE APPLICATION OF THE POLAR CODE
ON THE NORTHERN SEA ROUTE
Fabian Struwe German Naval Yards Kiel GmbH, 24143 Kiel, Germany
E-mail: [email protected]
Laurentiu Chiotoroiu
Jade University of Applied Sciences, 26931 Elsfleth, Germany
E-mail: [email protected]
Abstract The paper describes the Polar Code and its application on the Northern Sea Route. A general overview is
provided to allow for a general understanding of the situation which led to the development of the Polar
Code, the environmental conditions, as well as the legal basis necessary for the implementation of the
Polar Code and the regime of the Northern Sea Route (NSR). The general provisions of a NSR passage
are also explained. The Polar Code and its underlying regulations pose a significant threat to the
commercial viability of trade of non-Russian actors within the NSR as well as to non-Russian commodity
export originating from this area. These threats stem from one of several shortfalls of the Polar Code,
namely its limited scope. Generally speaking, when engaged in national trade only, a vessel is not subject
to the Polar Code. This is most likely to result in a competitive advantage of national actors on the NSR.
This issue is even more significant when seasonal changes of the environmental conditions are
considered.
Keywords: Polar Code, Arctic Trade Routes, Polar waters, Northern Sea Route
Introduction
The foundation of this work was the author´s master thesis about ‘The International Code for Ships
Operating in Polar Waters (Polar Code) and its practical application on the Northern Sea Route [8]. The
topic of the thesis was chosen because it is of relevance to today’s shipping industry, especially when ship
owners are engaged in or planning to engage in arctic trade. In an ex-ante evaluation of the thesis, several
aspects were identified which might be of further interest for the shipping community. This article is
intended to show the impact of the Polar Code on current and future trade within the difficult commercial
environment to be found on or near the NSR. Both the use of the NSR for exporting of goods originating
from the area of the NSR and the use of the NSR as a shortcut between Europe and Asia will be
discussed. Especially the feasibility of the NSR in comparison to the Royal Route via the Suez channel
will be highlighted later in this work.
When only looking at the Arctic it is assumed that investments within the next ten years can be as
high as $100bn, maybe even more [1]. The related growth of trade by merchant vessels in the Arctic
depends on several factors. The major economic drivers will be the exploitation of carbohydrate resources
like gas and oil, as well as mineral exploitation in the area. These drivers are influenced by several
determinants, beyond the control of shipping and prospecting stakeholders and include among other
things, but not limited to: accessibility in different seasonal conditions, investment climate regarding the
increased risk of Arctic shipping, global economic development, regulatory framework and political
tensions just to name a few. For example, it may be inefficient to transport the goods by ship in case
insurance premiums are unbeneficial, cargo handling facilities are insufficient or inappropriate or
inaccessible depending on the season of operation. Determinants negatively influencing the Royal Route,
like the piracy off Somalia or in the Malacca Strait, are not of such significance that they influence
decision making processes in benefit of Arctic Routes. But global changes in trade patterns are
influencing the decisions whether or not Arctic Routes are to be used. The higher the efficiency of the
traditional routes for example the recent increased capacity of the Panama Canal in June 2016, the lesser
the benefits of a shorter Arctic route. All these determinants are hard to quantify, because they are subject
to a multitude of influences and are hard to predict, especially for a prolonged period of time, like the
operational lifetime of a vessel [2].
One fundamental question has to be answered when polar trade, on the NSR or on any other possible
future route is considered: Is the possible increase in the return on investment for ship-owners and
operators sufficient when they use the NSR or another route and take an increased risk? It is a legitimate

72
question for these stakeholders because it might result in an increased risk of damage to their vessels
while simultaneously these vessels might suffer from a lower all year round utilization, when subject to
seasonal restrictions. Another possible adverse effect could be found in the lower fuel efficiency of a
vessel with a Polar Class. In comparison to a common vessel, these vessels usually lack a bulbous bow
which generally affects the wave resistance and the power required negatively, ultimately leading to an
increase in fuel consumption.
In order to give the reader a general understanding of the underlying framework of this article, the
Polar Code will be highlighted in the next chapter.
Polar Code
The Polar Code claims to take an integrated and holistic approach, considering ship operation and
personnel on board in a hostile and remote environment with only limited Search and Rescue (SAR)
infrastructure into account. The Polar Code aims at increasing safety of shipping, reducing the influence
of shipping on the indigenous people and the environment. But this holistic approach, though welcome
and urgently needed, suffers from several shortfalls. For example, the environmental protection is not
fully factored into the Polar Code, beside its holistic aim. For example Annex VI of MARPOL is not
made mandatory by the Polar Code [4], [7]. This is hard to understand, especially when looking at the fact
that the polar areas are suffering heavily from the influence of global warming which stems from air
pollution [5]. The geographical area of the Polar Code is including the Arctic areas of the USA, Canada
and part of the Arctic areas of the Russian Federation. Further, it includes the whole territory of
Greenland but excludes Iceland as well as Norway. On the southern Hemisphere it covers the whole area
south of 60° south, without any exemption.
The Polar Code was created by the Maritime Safety Committee and the Maritime Environmental
Protection Committee in cooperation. Although this allows for the inclusion of the knowledge of both
committees, it might complicate future adaption processes as both committees are equals and have to
accept any changes to the Polar Code. This might ultimately result in an increased timeframe for
adaptions and corrections.
As said earlier, the pivotal issue in this article is the area of coverage of the Polar Code, legally as
well as geographically. When looking at the legal area of coverage, the Polar Code covers only
international trade. The geographical coverage, in relation to the Arctic, is indicated in Figure 1 and it is
obvious that the Russian Federations Ports of Archangelsk and Murmansk are not included. The result is
that merchant vessels calling these ports are not subject to the Polar Code unless they intent to follow the
NSR or, for example, a transpolar route.
Figure 1. Arctic area of coverage of the Polar Code10 [4]
10 Figure 1 is for illustrative purposes only. Additional information on ports was added by the authors.

73
The regulations, implemented by the Polar Code, increase the costs associated with a vessel in
relation to building and operation in comparison to a common merchant vessel. Increased costs of
shipbuilding stem from the increased amount and quality of steel to be used in order to reach a sufficient
safety level as well as an increased planning complexity. The increase in operational costs is easily seen
when looking at the necessary life-saving and survival appliances mandatory under the Polar Code as well
as in the sophisticated equipment which has to be used, like gyros, hatches, heating arrangements, etc. [4].
We can therefore conclude that two vessels, one subject to the Polar Code and another equal-size vessel,
which is not subject to the Polar Code, incur different costs throughout their commercial lifetime.
When a new shipbuilding is planned, the Polar Code requires ship-owners to determine the
necessary Polar Class of the vessel based on the expected ice conditions and expected season of trade.
This determination will significantly limit the operation of the vessel and is most likely to become an
effective hindrance when the vessels operation alters towards more dangerous ice conditions or from the
summer/autumn to winter conditions. This is the case because the Polar Class of the vessel will be
considered inappropriate for the new conditions, and alterations of the Polar Class incur high costs, for
example for additional steel strengthening or additional equipment.
Even though the Polar Code claims to have an integrated and holistic approach, another issue that
arises refers to the low level of the training requirements for the personnel on board. For example, a
vessel sailing within the area of coverage of the Polar Code may do so without any navigational officer or
master having experience in the area. Another fundamental concern is that such inexperienced officers
and masters might sail near ice-covered waters on a vessel with only little or even no ice class at all.
Adverse weather conditions, like the prevailing fog, a low proficiency level of personnel in conjunction
with ice predictions can pose a significant threat to personnel and environment. This un-holistic issue is
further deepened when we keep in mind that leisure vessels and even fishing vessels are not subject to the
Polar Code. Today, this is of higher relevance to the Antarctic, where fishing vessels are the main source
for distress calls. But still, when more and more waterways in the Arctic area become accessible this
problem might extend towards the Arctic.
Some of the issues of the Polar Code have been outlined above and the challenges for stakeholders
are manifold, but they reflect the current issues to be found in this field of trade today. When the Polar
Code is subject to a revision in the future hopefully several of these matters will be resolved or at least
reduced.
The Northern Sea Route
In the Figure 2 below the areas of the Northern Sea Route are displayed. At this point, it has to be
mentioned that the NSR is not to be understood as one single route, it is generally speaking an area which
can be used to navigate. There is a multitude of shoals in the area which create several chokepoints for
vessels of a certain draught. These chokepoints are also subject to the prevailing ice conditions which
might deny access to them.
Figure 2. Areas of the Northern Sea Route [10]

74
Competition on the Northern Sea Route is subject to a multitude of challenges, but only few of them
will be discussed in this paper. One fundamental topic is the insurance issue. When sailing on the NSR, as
well as in the remainder of Arctic or Antarctic waters, the coverage of H&M as well as P&I is excluded.
This requires owners and commercial operators to negotiate terms and premiums of the insurance
coverage. On the NSR, a proof of coverage has to be included in the application to the Russian
Government, prior to a passage. When the insurance coverage for a voyage is not sufficient in order to
provide full coverage of clean-up operations in the aftermath of a pollution event [6], a company engaged
in this trade is risking its “raison d'être”. The determination of insurance premiums, both for P&I and
H&M, is made by consideration of various elements. Both a company’s experience in polar waters as
well as crew experience in the Arctic waters might be taken into account. On the one hand these
premiums might also be used to gain a sustainable competitive advantage when a good and longstanding
record of proficiency can be established and maintained. On the other hand, this could result in
unexperienced competitors being forced to pay unbeneficial premiums in general, but this might also
deter possible new entries from participating in the market [6].
Special consideration has to be given to Russian vessels on the NSR, because Russian vessels might
be capable of putting economic pressure on vessels which are subject to the Polar Code. When vessels are
only used in Russian cabotage11 trade, they are subject to Russian regulations only and they might operate
as shuttle tankers on the NSR, as it is already the case today [9], [11]. This might benefit the owners of
these vessels as their ice-strengthened vessels can be engaged in year-round operations, ensuring high
utilization of these vessels serving between ice-free transhipment ports and production facilities subject to
ice, without incurring high costs to adhere to Polar Code regulations. But also the owners of cheaper and
non-ice-strengthened vessels can still benefit and participate in polar trade when servicing these
transhipment ports. Owners of a Polar Class vessel therefore have a competitive disadvantage when year-
round utilization is low, because of being limited to the summer/autumn period in relation to the shuttle
model described above, or the overall efficiency of the vessel is low, because of the missing bulbous bow.
The main concern in this context is if the costs required for unloading of the ice-strengthened vessel at an
ice-free transhipment port and the loading of the non-ice strengthened vessel are higher or lower in
relation to the costs for building and operating of a Polar Class vessel, with a possible lower year-round
utilization12 or lower efficiency.
When a company intends to engage itself in the use of the NSR as a shortcut between Europe and
Asia, the overall feasibility of a passage via the NSR is mostly dependent on the overall reduction in costs
as in daily costs of operation and this is mostly based on fuel costs. The ports and their geographical
location also determine the distance benefits and the associated maximum fuel savings which could be
achieved when a vessel uses the NSR instead of the Royal Route. Summarizing this, it can be said that the
lower the fuel costs are, the lower the attractiveness of the NSR. But these fuel costs are highly influenced
by the prevailing conditions on the NSR and on the ports which will be served on the intended voyage.
The conditions, especially the ice conditions, can force a vessel to increase its fuel consumption, due to
higher loads on the main engine, even though the speed of advance is reduced at the same time. It may
also very well be the case that a vessel will be forced to reduce its service speed significantly, even to nil,
when fog is encountered on the NSR. In average the fog-days on the NSR range from ‘80 to 158 days per
year‘ [3] and this can very well result in a vessel being forced to anchor for several days.
But the competitive situation when trading on the NSR is not the only concern for the stakeholders.
A fundamental question is whether trade on the NSR is fruitful at all, especially in comparison to trade on
the traditional route, the so called Royal Route between Europe and Asia. Table 1 below has been created
in order to allow for a visualisation of the different areas where costs are incurred. As Table 1 shows, the
only cost savings which can be achieved when trading on the NSR can be found in lower fuel costs as
well as in lower wages. But these two fields are highly dependent on the duration of the voyage and will
only result in a commercial viable voyage when these cost savings outweigh the higher costs generated in
the other fields of the Table 1. Unfortunately, the duration of the voyage is highly uncertain when the
NSR is utilized. This is because of the lower quality of the meteorological and oceanographic data, as this
poses an effective hindrance for long-term lookouts, as well as the high seasonal variability of the extent
of the ice coverage, which further increases the uncertainty factor in every voyage planning. If this wasn’t
11 Cabotage is a special trade which is only governed by national regulations because no international borders
are crossed. 12 Regardless of whether the Russian or Polar Codes regulations for the ice covered leg of the voyage are
applied, the model is based on the comparison of a Polar Class vessel conducting the whole voyage in comparison to
two vessels, one ice strengthened and one non-ice strengthened, sharing the voyage.

75
enough, the Polar Code requires the later ship owner to conduct not only a voyage planning, but an entire
lifetime planning for his later vessel starting with the early stages in the design process.
Table 1. Costs associated with Royal Route and Northern Sea Route [8]
Cost Royal Route Northern Sea Route
Capital costs for vessel Lower Increased (shorter earning period, vessel are more expensive)
Equipment Lower Increased (better equipment required)
Insurance Lower13 Increased (higher risk of groundings, higher impact of
pollution)
Fuel consumption (overall
and as per day)
Dependent on
serviced ports Dependent on serviced ports and ice conditions
Fees Lower Increased (may include icebreaker services, icepilots, port
services in general are more costly in the polar area)
Wages (overall) Dependent on
serviced ports Dependent on serviced ports and ice conditions
Operating costs, including
maintenance and repair
(as per day)
Lower
Increased (transportation costs in polar areas for example for
spare parts is significantly higher, as well as time required for
necessary repairs due to environmental conditions and more
precautions while operating in the area increase costs
associated with operations)
Crew Training Nil Increased (as training requirements for operations in polar
waters have been implemented)
When considering the possible change of global trade routes stemming from the use of the Arctic
routes several facts have to be mentioned. First, within the conceivable future, the traditional shipping
routes, like the Royal route will not be substituted by the NSR, mostly because of capacity and reliability
problems and still too high costs for a transit. In the near future commercial shipping in the Arctic will
mostly consist of servicing Arctic ports, but the number of trans-Arctic voyages is most likely to raise
continually. The emphasis will be on the Northern Sea Route (NSR) as it had more ice-free days,
allowing for a cost efficient passage without icebreaker assistance, in the past. The current predictions
show that this trend will continue in the future. Another argument stated in the literature is that the NSR
will be the centre of gravity for the Arctic trade because of the envisaged exploitation of oil and gas fields
in its proximity, intensifying the traffic in the area and integrating it into global trade.
Seasonal changes = year round disadvantages?
The climate change is capable of having a significant influence on the viability of the Northern Sea
Route (NSR), as accessibility of ports and routes is highly affected by ice conditions. Generally speaking,
the global warming led to the opening of the NSR on the first hand. But the ice conditions are not only
subject to the overall warming of the climate, but also to annual and seasonal variations. Especially the
high annual variability of ice conditions make it nearly impossible to predict the voyage duration of a
vessel and vessels of low or even no ice class are affected significantly as they would be the first to be
hindered, stopped, forced to alter their course or wait for icebreaker assistance. But when such an ice
class vessel is sailing in open waters, it is also negatively affected. The disadvantage it has to suffer from,
in comparison to a non-ice classed vessel, can be found in the overall inefficiency due to the design
requirements of an ice classed vessel, namely the lack of its bulbous bow, more steel required for
strengthening etc. As discussed earlier, this issue might effectively prohibit the utilization of the NSR as
the potential cost savings might turn into extra costs when unbeneficial conditions are encountered.
Conclusions
1. The lower the fuel costs are, the lower the attractiveness of the NSR More research has to be done in order to allow for continuous improvements of the Polar Code and
its feasibility in reality - especially when it comes to the prognosis of ice development in the future, which
is of utmost importance when the required ice class of a ship in development is to be determined.
13 The risk premium for example for piracy is not significant (Blunden 2012).

76
2. The Polar Code requires a review in order to reduce its deficiencies, with regard to its area of
coverage
When the review of the Polar Code will be conducted in the year 2020 (Allen 2016) its area of
coverage should be extended to include all commercial shipping operations in the area. The suggestion is
to include the fishing vessels sailing in the area and force them to increase their level of safety at least to
the level required by the Polar Code. Another problem that should be changed in our opinion is related to
the fact that no ice-strengthening as well as no polar experience is mandatory when sailing in polar
waters.
3. The scope of the Polar Code should reflect the protection of the environment, especially the
protection from air pollution
The inclusion of the Annex VI of MARPOL, preventing air pollution from ships, as well as the
banishment of heavy fuel oil by amending the MARPOL Annex I would provide valuable support in
preserving the climate and the environment in the polar areas.
But the layout of the Polar Code as a combination of MARPOL annexes and SOLAS chapters might
lead to a prolonged time when regulations are to be updated because these underlying documents have to
be changed. This will require a higher level of cooperation and liaison between the relevant committees of
the IMO, namely the Maritime Safety Committee (MSC) and the Marine Environment Protection
Committee (MEPC). Besides its many deficiencies, the Polar Code has to be seen as another very
valuable step in increasing safety and protecting the fragile environment of the Arctic and Antarctic.
When the coverage is extended towards all relevant types of vessel and includes the whole of MARPOL
as well as the regulations of the Ballast Water Management, another very valuable step ahead has been
achieved. The Polar Code will enable and support commercial shipping in both the Arctic and Antarctic
because it implemented regulations increasing the safety of shipping, which will motivate insurers to
provide coverage and allow for an increase in trade. If the regulations of the Polar Code will be
continuously improved over time and if the regulations are adhered to, the Polar Code might become
invaluable for future generations.
4. Non-Russian actors are subject to a commercial disadvantage when exporting goods from the
area of NSR
Along the various threats for the economic viability of trade on the NSR, two significant threats
emerge when looking at seasonal variability and the applicability of the Polar Code. The feasibility of
trade depends on timely arrival and efficient conduct of voyages throughout the year, especially for
container trade. But due to the costs associated with icebreaker services plus the possible increased fuel
costs and possible increased voyage duration due to slower steaming in or near ice, most trade still
remains seasonal because of economic forces. This will prohibit the conduct of container trade on the
NSR as well as on other Arctic routes. It has been stated above that the Polar Code applies to the
international trade only. This results in the fact that the Russian Federations’ trade on the NSR, especially
the shuttle transportation of bulk, puts economic pressure on international trade trying to enter the market.
This issue is of such importance because the Russian cabotage vessels don’t have to abide to the
regulations of the Polar Code which allows for the creation of distortions of normal trading conditions.
Alternatively the loading of raw goods in the transhipment ports of Archangelsk or Murmansk offers
several possibilities to engage in this trade, while evading either a low year-round utilization or decreased
efficiency of operations, ice risks and high operating costs.
Whether or not shipping in the Arctic and therefore on the NSR will be conducted, it is highly
dependent on the ship owners and operators. When they decide that taking an increased risk is acceptable
in relation to an increased return, the enterprise will be undertaken. But this might only be possible when
ship-owners and operators can benefit from the cost reduction on the NSR, which might allow for
commercial success not only for the charterers side.
References
1. Chatham House. Arctic Opening: Opportunity and Risk in the High North. The Royal Institute of
International Affairs, Chatham House, 10 St James's Square, London, United Kingdom, 2012. Available
(accessed on 12.02.2017): https://www.chathamhouse.org/publications/papers/view/182839.
2. CMTS. A 10-Year Projection Of Maritime Activity In The U.S. Arctic Region. report, Committee
on the Marine Transportation System, Office of the Executive Secretariat, U.S. Department of
Transportation, 1200 New Jersey Ave, Washington DC, United States of America, 26 January 2015,
(accessed on 12.02.2017): http://www.cmts.gov/downloads/CMTS_10-
Year_Arctic_Vessel_Projection_Report_1.1.15.pdf.

77
3. House, D., et al. The Ice Navigation Manual. 1st edition, Witherby Seamanship International Ltd.,
Edinburgh, United Kingdom, 2010, pp. 64.
4. IMO. The International Code for Ships Operating in Polar Waters (Polar Code). International
Maritime Organization, 4 Albert Embankment, London, United Kingdom, 2016. Available (accessed on
12.02.2017):
http://www.imo.org/en/MediaCentre/HotTopics/polar/Documents/POLAR%20CODE%20TEXT%20AS
%20ADOPTED.pdf.
5. Mein, A. Die Regulierung der Schifffahrt in den Polarregionen und der neue Polar Code der IMO.
Recht der Transportwirtschaft, vol. 1, 2016, pp. 6-14.
6. Sarrabezoles, A., Lasserre, F. & Hagouagn’rin, Z. Arctic shipping insurance: towards a
harmonisation of practices and costs? Polar Record Journal, vol. 52, no. 265, 2014, pp. 393-398.
Available (accessed on 13.07.2016):
http://rk9dr6cc2p.search.serialssolutions.com.ezproxy.utas.edu.au/?genre=article&issn=00322474&title=
Polar%20Record&volume=52&issue=4&date=20160701&atitle=Arctic%20shipping%20insurance%3A
%20towards%20a%20harmonisation%20of%20practices%20and%20costs%3F&spage=393&pages=393-
398&sid=EBSCO:Publisher%20Provided%20Full%20Text%20Searching%20File&au=Sarrabezoles,%2
0Aur%c3%a9lie.
7. Schuler, M. ‘Imo adopts Landmark ‘Polar Code’ Marpol rules. GCaptain, 15 May 2015.
Available (accessed on 12.02.2017): http://gcaptain.com/imo-adopts-landmark-polar-code-into-marpol/.
8. Struwe, F. The International Code for Ships Operating in Polar Waters (Polar Code) and its
practical application on the Northern Sea Route, MSc. Thesis, Elsfleth: Jade University of Applied
Sciences, September 2016.
9. Tanker Operator. First Arc7-class tanker launched. April 2016, pp. 22-23. Available (accessed on
12.02.2017): http://ea45bb970b5c70169c61-0cd083ee92972834b7bec0d968bf8995.r81.cf1.rackcdn.com/TOApr2016v2.pdf.
10. The Northern Sea Route Information Office website, Shkolnaya Street 35, Moscow, Russian
Federation. Image source is available (accessed on 12.02.2017): http://www.arctic-
lio.com/images/nsr_zones.jpg.
11. Tschudi, F.H. Nordområdene – grenseoverskridende muligheter. Kyst og havnekonferansen
2014, Honningsvåg, conference paper, 22 October 2014. Available (accessed on 12.02.2017):
http://www.kystverket.no/contentassets/3f7e156a2e484386a96a9b56e6ff286c/nordomradene-
grenseoverskridende-muligheter---felix-tschudi.pdf.

78
SOME THEORETICAL AND PRACTICAL APPROACHES TO
HUMAN ANATOMY TEACHING FOR THE IMO MODEL
COURSE 1.13 “ELEMENTARY FIRST AID FOR SEAFARERS”
ND 2-TP07-07
Rusudan Vadatchkoria Batumi State Maritime Academy, Batumi, Georgia
E-mail: [email protected], phone: (+995) 551 2615 42
Abstract
The IMO Model Course 1.13 “Elementary First Aid for Seafarers” aims to provide the training for
listeners/seafarers with basic knowledge and practical skills of elementary first aid on board, in
accordance with Section A-VI/1 of the STCW Code. Knowledge of some anatomical and physiological
aspects (namely - the structure and function of the human body) is very important for proper, well-timed
and efficient first aid arrangement in practice. The current article considers the most important
approaches to human anatomy and physiology teaching for the some topics in according with Model
Course 1.13 “Elementary First Aid for Seafarers”, that should be explained theoretically and
demonstrated practically, using anatomical models and specific simulators for training and developing
the practical skills. The methods of these topics teaching are taking into account the age status and the
previous basic knowledge of listeners, that makes the learning course much more accessible, interesting
and easy to mastering.
Keywords: anatomy, physiology, topography, morphology, organ, system of organs.
The IMO Model Course 1.13 “Elementary First Aid for Seafarers” aims to provide the training for
listeners/seafarers with basic knowledge and practical skills of elementary first aid on board, in
accordance with Section A-VI/1 of the STCW Code [3, 4]. Introduction subjects of this course (namely
the “Human Body General Observation”, “Human Body Structure and Functions”, “Organ System and
Some Vitally Important Organs of Human Body Topography, Morphology, Structure and Functions”)
include as theoretical as well practical classes concerning the structure and function of the human body.
Considering the fact that the listeners of the above-mentioned course usually have a vocational/
professional or higher technical education and they have only elementary knowledge about the anatomical
structure of the human body, the structure and functions of its components (organs and systems of
organs), it is necessary to emphasize the importance and peculiarities of these components teaching from
the practical point of view. It should be noted that it is almost impossible to provide listeners with even
more or less full knowledge of the human body structure in a short period of time in according the
schedule of the model course and the syllabus. The only way is to rely on the listeners’ knowledge in the
field of human anatomy and physiology, which they have acquired from the secondary school times.
However, it is rather difficult because the different age qualification of the listeners and as the result the
different level of basic knowledge.
In connection with the foregoing, a special approach to the study of anatomy and human physiology
should be applied within the learning course, so that the listeners will get a common apprehension about
the structure of the human body and the topography of internal organs, which are especially important to
carry out the cardiopulmonary resuscitation correctly (based on ABC system). First of all, the general
anatomical observation of the human body includes the learning (rather looking though) of all the organs’
systems of the body: musculoskeletal, respiratory, cardiovascular, digestive, excretory, endocrine,
nervous, sensory and integumentary systems) with mandatory demonstration of anatomical models
(skeleton and internal organs) and training simulators to supply listeners with general but clear
understanding of the structure of the body
In the course of training, it is necessary to emphasize the structural and functional interconnection of
all organ systems, especially respiratory and cardiovascular systems, as the basic knowledge for CPR
carrying out. This component of training course is especially important for explanation the meaning and
importance of all the steps of cardiopulmonary resuscitation, namely the proper alternation of respiratory
manipulations (two forced inspiration) with the heart external massage (thirty compressions of chest
area).
The following components (see Table 1) should be taken into the first helper consideration in the
process of carrying out cardiopulmonary resuscitation [1, 2].

79
List of used abbreviation:
ABC – Airway – Breathing – Circulation
BSMA – Public Entity Teaching University –Batumi State Maritime Academy MTA – Maritime
Transport Agency
CPR – Cardio-Pulmonary Resuscitation
CTSW Code - Seafarers Training Certification and Watch-keeping Code
FBAO- Foreign Body Airway Obstruction
IMGS – International Medical Guide for Ships
IMO – International Maritime Organization
ND – Normative Document
STCC at BSMA – “Seafarers Training and Certification Center at Batumi State Maritime Academy
Table 1. The most important points of human anatomy teaching for the some topics of IMO Model
Course 1.13 “Elementary First Aid for Seafarers”
№ Subject Significance What should be
explained? Picture
1 Topographic
location of the
left and right
common carotid
arteries in the
anterial zone of
the neck
The zone for
determining
the presence
of the victim’s
pulse
How to determine
correctly the pulse
in the region of
the carotid artery?
Picture 1. Carotid
arteries location
Picture 2. Puls
control in the area
of carotid artery
Picture 1. Carotid arteries
location
Picture 2. Puls control in the area
of carotid artery
2 Participation
and interrelation
of the nasal and
oral cavities of
the affected
person in
respiratory
movements
Zone of
determining
the presence
of respiration
(ability of
independent
breathing) in
the suffered
person
How to determine
correctly the
presence or
absence of
breathing activity
in the victim?
How to perform
properly two full
inhalation into the
respiratory system
(lungs) of the
affected person?
Why it is
necessary to close
the nasal airway
during artificial
inhalation?
Picture 3. Upper
Airway (nasal and
oral cavities)
Picture 4
Artificial
breathing (mouth
–to- mouth)
Picture 3. Upper Airway (nasal
and oral cavities)
Picture 4. Artificial breathing
(mouth –to- mouth)

80
3 The structure,
position,
physiological
meaning and
role of the
diaphragm in
respiratory
movements
The
diaphragm is
a powerful
horizontally
located
muscle, that
extends across
the bottom of
the thoracic
cavity. The
diaphragm
separates the
thoracic
cavity,
containing the
heart and lung
s, from
the abdominal
cavity and
performs an
important
function
in respiration:
as the
diaphragm
contracts, the
volume of the
thoracic
cavity
increases and
air is drawn
into the lungs
How to determine
the exact position
of the diaphragm
in the trunk:
dorsally - relating
to the vertebrae
and ventrally -
relating to the
sternum and
costal arch?
At the front
(ventrally) fibers
insert into
the xiphoid
process of
sternum and along
the costal margin.
Laterally, muscle
fibers insert into
ribs 6-12. In the
back (dorsally),
muscle fibers
insert into the
vertebra at T12
and two
appendages- the
right and left crus,
descend and insert
into the lumbar
vertebrae at L1
and L2
Picture 5. Lungs
and Diaphragm
Picture 6. Lungs
and Diaphragm
interrelation
during the
respiration
Picture 5. Lungs and Diaphragm
Picture 6. Lungs and Diaphragm
interrelation during the respiration
4 Topographic
position of the
heart and lungs
in the thoracic
space.
Working area
for
cardiopulmon
ary
resuscitation
(CPR)
The exact position
of the first aider
hands in the chest
area of the
affected person.
Picture 7. Heart
and lungs location
in the thoracic
cavity
Picture 8. CPR
Picture 7. Heart and lungs
location in the thoracic cavity
5 Structural and
functional
interaction of
the heart and
lungs in the
thoracic cavity
In the process
of cardio-
pulmonary
resuscitation
(CPR)
The technique of
CPR in the ratio
(2:30). It would
be appropriate to
compare the new
standard of
inhalation and
compression rate
(2:30) with the
old standard
(2:15) and explain
the new one
advantages.
Picture 7. Heart
and lungs location
in the thoracic
cavity
Picture 8. CPR
Picture 8. CPR

81
6 The structure of
the sternum, the
position of the
xiphoid process
Working area
for
cardiopulmon
ary
resuscitation
(CPR)
Explain the
vulnerability of
the xiphoid
process of the
sternum during
the CPR.
How to avoid
damage of the
sternal xiphoid
process and
nearby organs
during CPR -
retreat 3-4 cm
from the xiphoid
process (cranially)
towards the body
of the sternum?
Picture 9.
Sternum
Picture 9. Sternum
7 The structure
and
topographical
position of the
ribs, mechanical
features of the
bony and
cartilaginous
parts of the ribs
and costal arch
Working area
for CPR and
manipulation
for removal of
foreign body
from the
respiratory
tract in case of
their
obstruction
How to avoid the
fracture of the ribs
and damage of
nearby organs of
thoracic cavity
during CPR and
FBAO?
Picture 10. Rib
cage structure
Picture 11. Hands
position during
CPR
Picture 10. Rib cage structure
Picture 11. Hands position during
CPR
8 The structure,
topographical
position and
relative position
of the
esophagus,
trachea and the
epiglottis.
Working area
for
manipulating
the removal of
a foreign body
from the
respiratory
tract resulting
their
obstruction
How to determine
the area of
mechanical
influence on the
diaphragm
(dorsally and
ventrally) at
different stages of
the manipulation
for the urgent
removal of the
foreign body from
the airway?
Picture 12.
Epiglotis and
Trachea
Picture 13.
Esophagus,
trachea and
diaphragm
relationship
Picture 12. Epiglotis and Trachea
Picture 13. Esophagus, trachea
and diaphragm relationship
It is recommended to choose some volunteers from the group of listeners and play out the situation
of providing the urgent first aid to demonstrate the procedure for the foreign body removing from the
respiratory tract during mechanical obstruction of the victim’s trachea, putting the suffered person in the
recovery position, as well as carrying out CPR with a contactless method in order to clarify the contact
area on the victim's body from the anatomical point of view based on the data indicated in the above done
table.

82
Conclusions
In spite of the IMO Model Course 1.13 "Elementary First Aid for Seafarers" is the short-termed training
course, knowledge of some anatomical and physiological aspects (namely - the structure and function of
the human body) is very important for proper, well-timed and efficient first aid arrangement in practice.
The most important points of human anatomy teaching for the some topics of IMO Model Course 1.13
“Elementary First Aid for Seafarers” should be explained theoretically and demonstrated practically,
using anatomical models and specific simulators.
References
1. Moore, K. L., Dalley, A. F., Agur, A. M. R. Clinically Oriented Anatomy. Wolters Cluwer
Health Lippincott Williams&Wilkins, 2008.
2. Cray’s Anatomy. The anatomical Basis of Clinical Practice. Ed. by Standring, S. Churchill
Livingstone Elsevier, 2014.
3. IMO Model Course – 1.13 „Elementary First Aid”, 2001.
4. Quality Manual ND 2–Q03.

83
REQUIREMENTS FOR THE MANUSCRIPTS
SUBMITTED FOR PUBLICATION
IN JOURNAL OF MARITIME TRANSPORT AND ENGINEERING
1. Page Layout (paper size A4 - 21 cm x 29,7 cm) should be as follows: Top – 3 cm, Bottom – 3 cm,
Left – 3 cm, Right – 3 cm.
2. Manuscripts should be prepared using Microsoft Word programme (not older than Microsoft Word
2000).
3. Minimum length for the article is 6 pages, maximum length - 10 pages.
4. No page numbering.
5. Text should be typed using font Times New Roman and be single-spaced. New paragraph should be
started with indentation 0,75 cm from the left margin.
6. The article should include these sections:
– title;
– author’s name(s) and information (organisation, city, country, address, phones, and e-mail
addresses);
– abstract (100–150 words);
– keywords (max. 5);
– introduction – explaining the nature of the problem, goal and tasks of the research, research
object, previous work, contribution of the research, research methods;
– description of research;
– conclusion section (mandatory!) which should clearly indicate advantages, limitations and
possible applications;
– references.
7. The text of the article should be prepared in English (spelling – British English).
8. The title of the article – 14 point, UPPERCASE, style Bold and centered.
9. Author’s names – centered, type size 12 point, Upper and lower case, style Bold Italic.
10. Author’s information – 10 point, Upper and lower case, style Italic, centered.
11. Abstract and keywords – 10 point size, style Normal, alignment Justify.
12. The first level Headings – 11 point, Upper and lower case, style Bold, alignment Left. Use one line
space before the first level Heading and one line space after the first level Heading.
13. The second and third level Headings – 10 point, Upper and lower case, style Bold, alignment Left.
Use one line space before the second level Heading and one line space after the second level
Heading.
14. Text of the article – 10 point, single-spaced, alignment Justify.
15. The set of formulas on application of fonts, signs and a way of design should be uniform throughout
the text. The set of formulas is carried out with use of editors of formulas MS Equation 3.0 or
MathType.
16. The formula with a number – the formula itself should be located on the left edge of the text, but a
number – on the right.
17. Font sizes for equations are: 11pt – full, 7pt – subscripts/superscripts, 5pt – sub-
subscripts/superscripts, 16pt – symbols, 11pt – subsymbols.
18. All Figures – must be centered. Figure number and caption appear below the Figure, type size 9
point.
Figure 1. This is an example
19. Diagrams, Figures and Photographs – must be of high quality, в in format *.TIFF, *.JPG, *.BMP
with resolution not less than 300 dpi. Also formats *.CDR, *.PSD are possible. Combination of
Figures in format, for instance, *.TIFF with elements of the in-built Figure Editor in MS Word is
prohibited.
20. Table Number and Title are above the Table. Alignment Left. Type size 9 point. Use one line space
before the Table Title, one line space after the Table Title and one line space after the Table.
21. References in the text should be indicated by a number in square brackets, e.g. [1]. Numbered list of
references and quoted literature is presented at the end of the article in the alphabetic order. The
correct format for references is the following:

84
21.1. Articles:
Panagoulia, D., Dimou, G. Sensitivity of flood events to global climate change. Journal of
Hydrology, Vol. 191, Issue 1, 1997, pp. 208-222.
21.2. Books:
Stoford, M. Maritime economics. New York: Routledge, 1997.
21.3. Conference proceedings:
Andrejeva, D. The air pollution prevention from ships. In: Maritime Transport and Infrastructure.
Proceedings of the 12th International Conference (Riga, Latvia, April 29-30, 2010, Latvian Maritime
Academy), 2010, pp. 84-86.
22. If the number of authors of an article, a book or a paper published in the conference proceedings
exceeds three, the first author is indicated and followed by «et. al.» For example, the format for
article is the following:
Wang, J., et. al. Safety based design and maintenance optimisation of large marine engineering
systems. Applied Ocean Research, Vol. 18, Issue 1, 1996, pp. 13-27.
23. All papers will be reviewed by two reviewers. All authors have to provide one review from their own
country (signed, scanned and sent by e-mail in pdf format) along with the paper. The other reviewer
will be provided by the Journal Editorial Board. Once referee evaluation forms have been returned
we will contact you with regards to the position of your paper. In some cases the referees will suggest
amendments which the author will be asked to attend to before the paper is suitable for publication.
24. Articles poorly prepared or incorrectly formatted may not be published in the Journal.