march 2016 u.s. employment update and outlook
TRANSCRIPT
U.S. employment situation: September 2013
Release date: October 22, 2013
Healthier growth returned in February,
but variance remains
U.S. employment situation: February 2016 March 4, 2016
February 2016 employment summary
• After a slow January, February returned back to normal levels of grow with 242,000 net new jobs. Although year-to-date figures are down
compared to 2015, January saw significant upward revisions to 172,000 jobs, improving the year’s initial performance. Despite global tensions
and economic shifts, the U.S. economy seems to be holding its own, although certain sectors such as energy and trade could be impacted by
fluctuations in domestic and international demand.
• Hourly wage growth fell slightly to 2.2 percent, but is still outperforming inflation at 0.0 percent. Over the past two years, wages have
increased 3.8 times faster than inflation; while this should be increasing consumer spending, the personal consumption expenditures
component of GDP has fallen in seasonally adjusted annual terms to 1.5 percent, compared to the 2015 average of 1.8 percent.
• Unemployment remained steady at 4.9 percent in February, keeping it below 5.0 percent for the second month since before the recession. On
the other hand, total unemployment dipped by 20 basis points to 9.7 percent as the number of marginally detached workers continues to
decline.
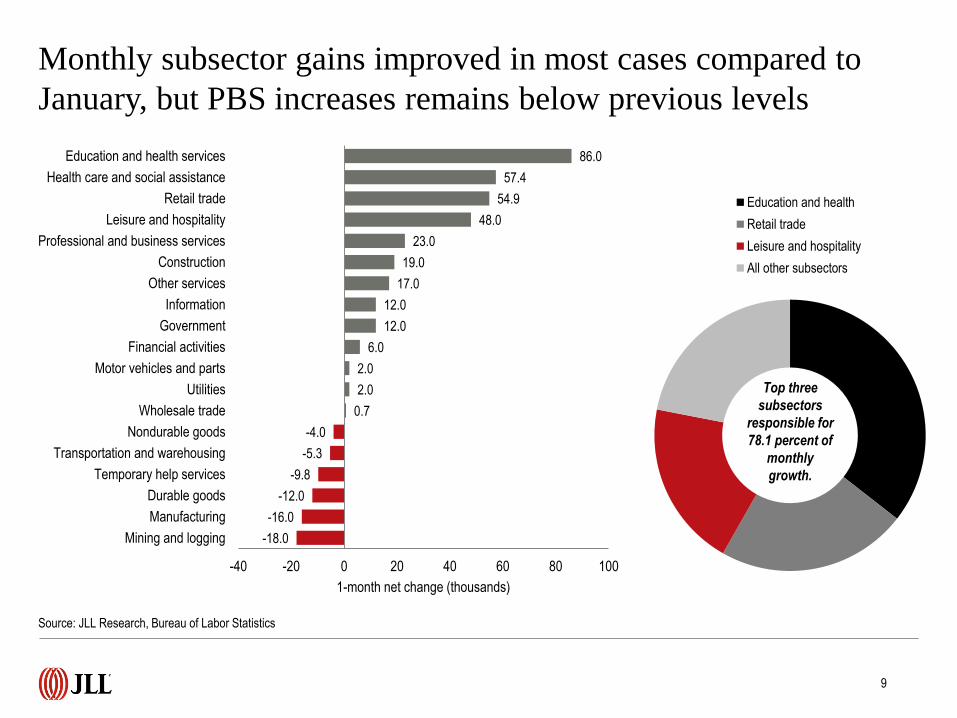
• At the industry level, most subsectors witnessed some level of improvement, while mining and logging contracted yet again by 18,000. More
volatile was manufacturing, which dropped into negative territory in February as well, along with transportation and warehousing. Professional
and business services (PBS), previously the consistent leader in the recovery, is still growing, albeit at a slower rate than education and
health, retail trade and leisure and hospitality, in turn bringing down office-using industries’ contributions to monthly gains.
• High-performing local markets continue to add jobs at a blistering pace, although their rates of growth have begun to soften as talent
shortages and a lack of slack in the labor market make current absolute levels of growth more difficult. Silicon Valley once again led the pack
with 4.4-percent growth, while tech hubs such as San Francisco and Portland aren’t far behind at 3.7 and 3.8 percent, respective ly. At 3.0 and
2.9 percent, Atlanta and Dallas continue to witness the positive effects of diverse corporate expansion and migration, as rapid employment
growth is translating into demand for space, aided by structurally high vacancy providing increased and more affordable options for tenants.
Source: JLL Research, Bureau of Labor Statistics

February 2016 labor market at a glance
+242,000(65 consecutive months
of growth)1-month net change
+2,672,000(+1.9% y-o-y)
12-month change
+779,00010-year average annual growth
Source: JLL Research, Bureau of Labor Statistics
4.9%Unemployment rate
-60bp12-month change in unemployment
7.0%10-year average unemployment
5,607,000(+3.8% y-o-y)
Job openings
5,361,000(+2.3% y-o-y)
Hires
3,055,000(+2.1% y-o-y)
Quits
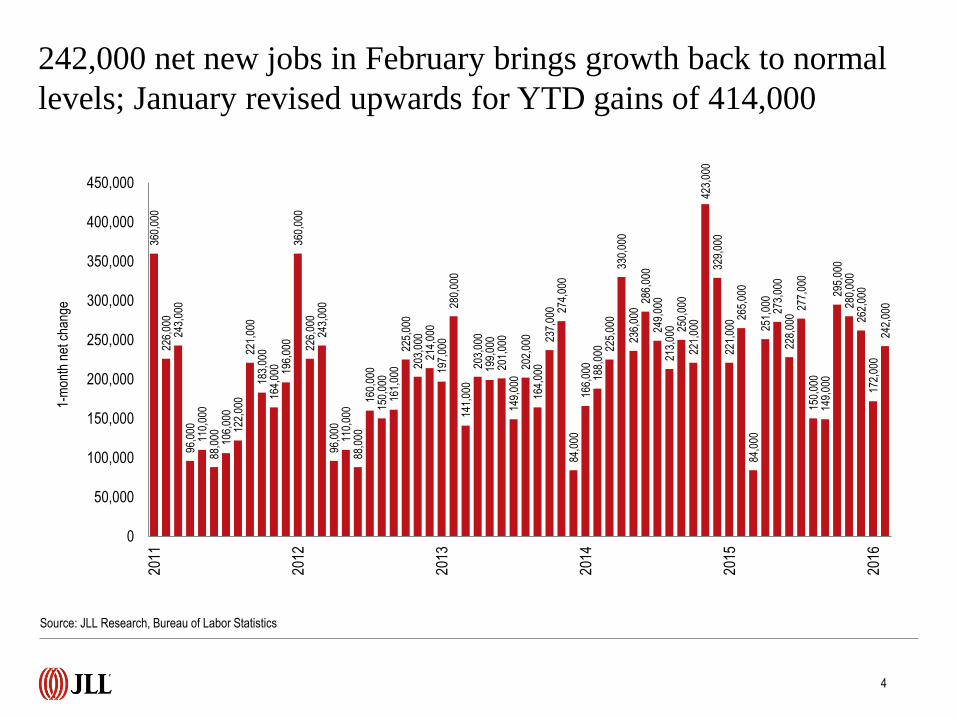
242,000 net new jobs in February brings growth back to normal
levels; January revised upwards for YTD gains of 414,000
360,
000
226,
000
243,
000
96,0
0011
0,00
088
,000 10
6,00
012
2,00
022
1,00
018
3,00
016
4,00
0 196,
000
360,
000
226,
000
243,
000
96,0
0011
0,00
088
,000
160,
000
150,
000
161,
000
225,
000
203,
000
214,
000
197,
000
280,
000
141,
000
203,
000
199,
000
201,
000
149,
000
202,
000
164,
000
237,
000 27
4,00
084
,000
166,
000
188,
000 22
5,00
033
0,00
023
6,00
028
6,00
024
9,00
021
3,00
0 250,
000
221,
000
423,
000
329,
000
221,
000 26
5,00
084
,000
251,
000
273,
000
228,
000
277,
000
150,
000
149,
000
295,
000
280,
000
262,
000
172,
000
242,
000
0
50,000
100,000
150,000
200,000
250,000
300,000
350,000
400,000
450,000
2011
2012
2013
2014
2015
2016
1-m
onth
net
cha
nge
4
Source: JLL Research, Bureau of Labor Statistics
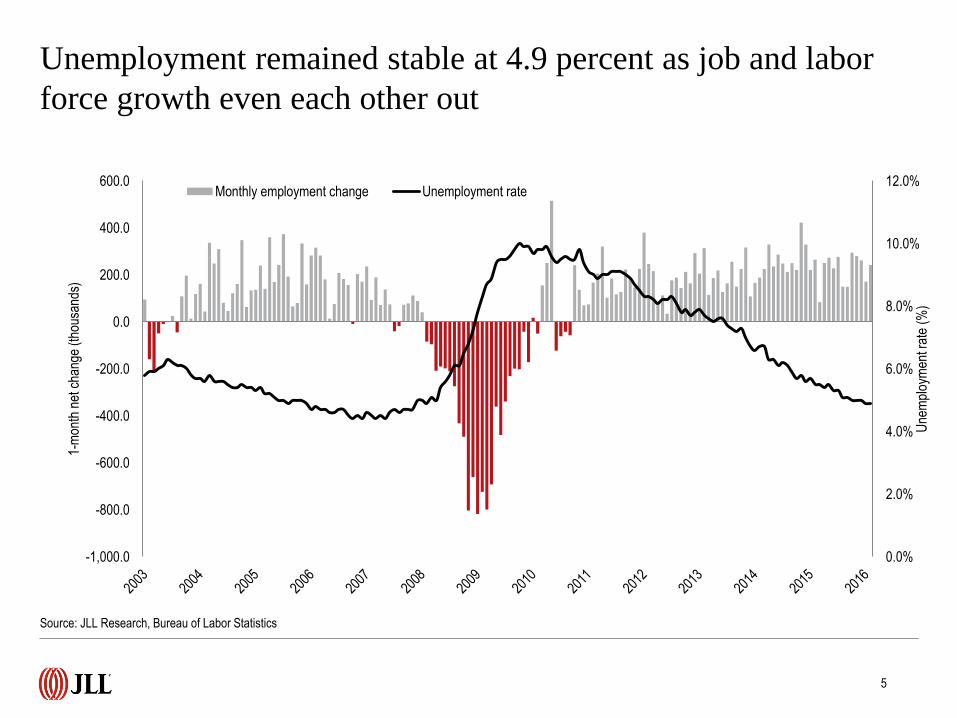
Unemployment remained stable at 4.9 percent as job and labor
force growth even each other out
0.0%
2.0%
4.0%
6.0%
8.0%
10.0%
12.0%
-1,000.0
-800.0
-600.0
-400.0
-200.0
0.0
200.0
400.0
600.0
Une
mpl
oym
ent r
ate
(%)
1-m
onth
net
cha
nge
(tho
usan
ds)
Monthly employment change Unemployment rate
Source: JLL Research, Bureau of Labor Statistics
5
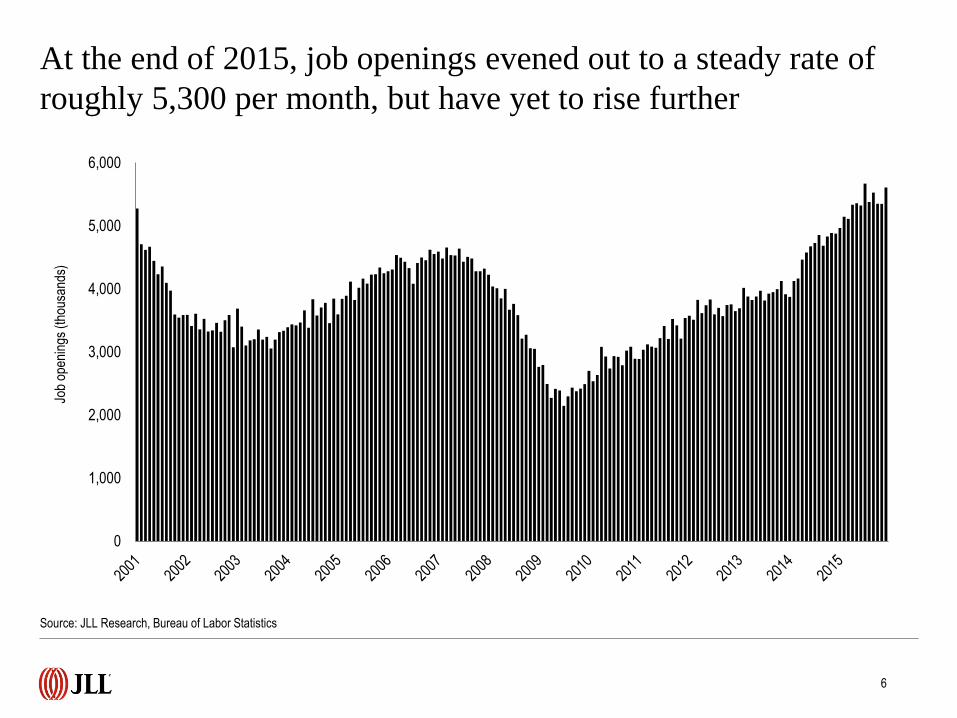
At the end of 2015, job openings evened out to a steady rate of
roughly 5,300 per month, but have yet to rise further
Source: JLL Research, Bureau of Labor Statistics
6
0
1,000
2,000
3,000
4,000
5,000
6,000
Job
open
ings
(th
ousa
nds)

0.0
20.0
40.0
60.0
80.0
100.0
120.0
140.0
Con
sum
er c
onfid
ence
inde
xAlthough consumer confidence dropped to 92.2 in February, it
has stayed within a similar range for past six months
Source: JLL Research, Bureau of Labor Statistics
7
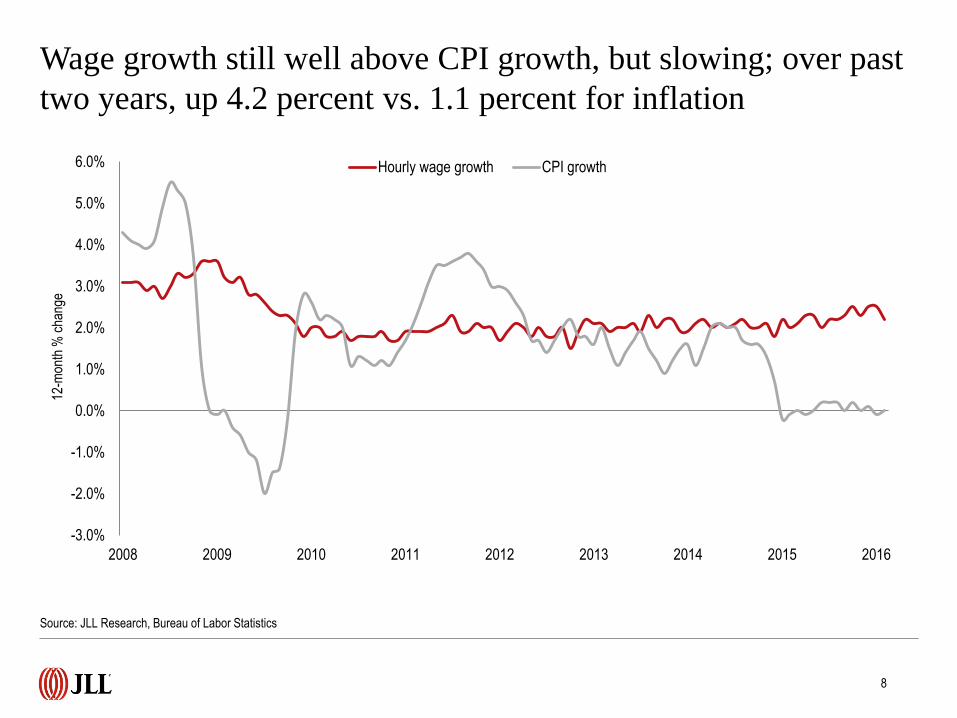
Wage growth still well above CPI growth, but slowing; over past
two years, up 4.2 percent vs. 1.1 percent for inflation
Source: JLL Research, Bureau of Labor Statistics
8
-3.0%
-2.0%
-1.0%
0.0%
1.0%
2.0%
3.0%
4.0%
5.0%
6.0%
2008 2009 2010 2011 2012 2013 2014 2015 2016
12-m
onth
% c
hang
e
Hourly wage growth CPI growth
-18.0
-16.0
-12.0
-9.8
-5.3
-4.0
0.7
2.0
2.0
6.0
12.0
12.0
17.0
19.0
23.0
48.0
54.9
57.4
86.0
-40 -20 0 20 40 60 80 100
Mining and logging
Manufacturing
Durable goods
Temporary help services
Transportation and warehousing
Nondurable goods
Wholesale trade
Utilities
Motor vehicles and parts
Financial activities
Government
Information
Other services
Construction
Professional and business services
Leisure and hospitality
Retail trade
Health care and social assistance
Education and health services
1-month net change (thousands)
Monthly subsector gains improved in most cases compared to
January, but PBS increases remains below previous levels
Source: JLL Research, Bureau of Labor Statistics
9
Education and health
Retail trade
Leisure and hospitality
All other subsectors
Top three
subsectors
responsible for
78.1 percent of
monthly
growth.
-141.0
-34.0
11.2
12.0
27.3
41.0
46.0
51.7
66.0
68.0
75.0
86.0
142.0
253.0
338.6
446.0
610.0
634.5
698.0
-200 0 200 400 600 800
Mining and logging
Durable goods
Utilities
Manufacturing
Motor vehicles and parts
Information
Nondurable goods
Wholesale trade
Other services
Transportation and warehousing
Government
Temporary help services
Financial activities
Construction
Retail trade
Leisure and hospitality
Professional and business services
Health care and social assistance
Education and health services
12-month net change (thousands)
Education and health
PBS
Leisure and hospitality
Retail trade
Financial activities
Manufacturing
All other jobs
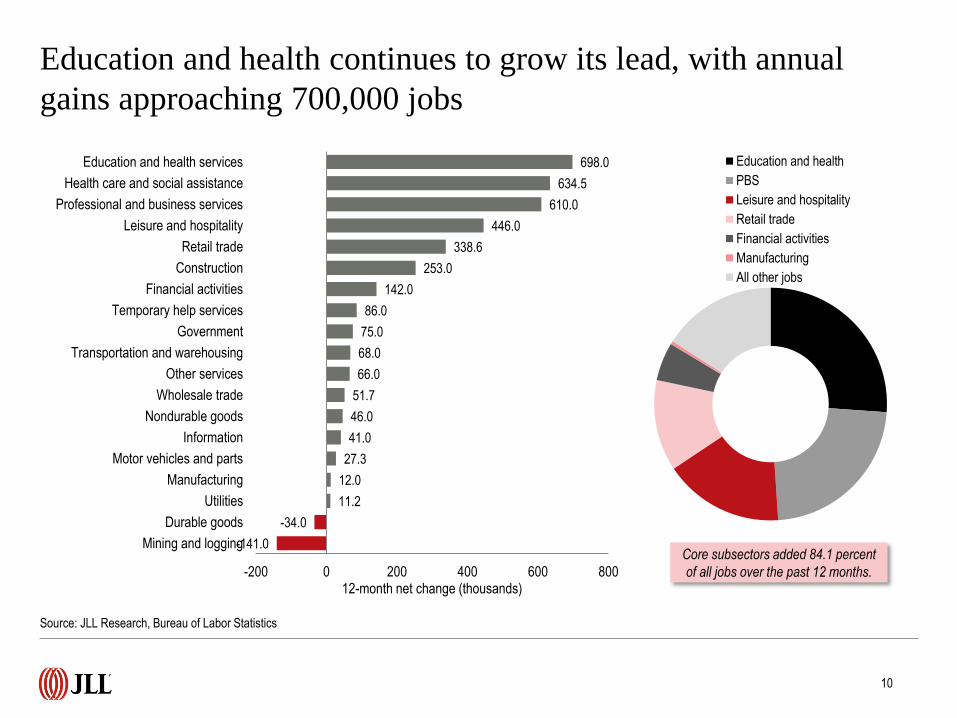
Education and health continues to grow its lead, with annual
gains approaching 700,000 jobs
Source: JLL Research, Bureau of Labor Statistics
10
Core subsectors added 84.1 percent
of all jobs over the past 12 months.
0.0%
1.0%
2.0%
3.0%
4.0%
5.0%
6.0%
Une
mpl
oym
ent r
ate
(%)
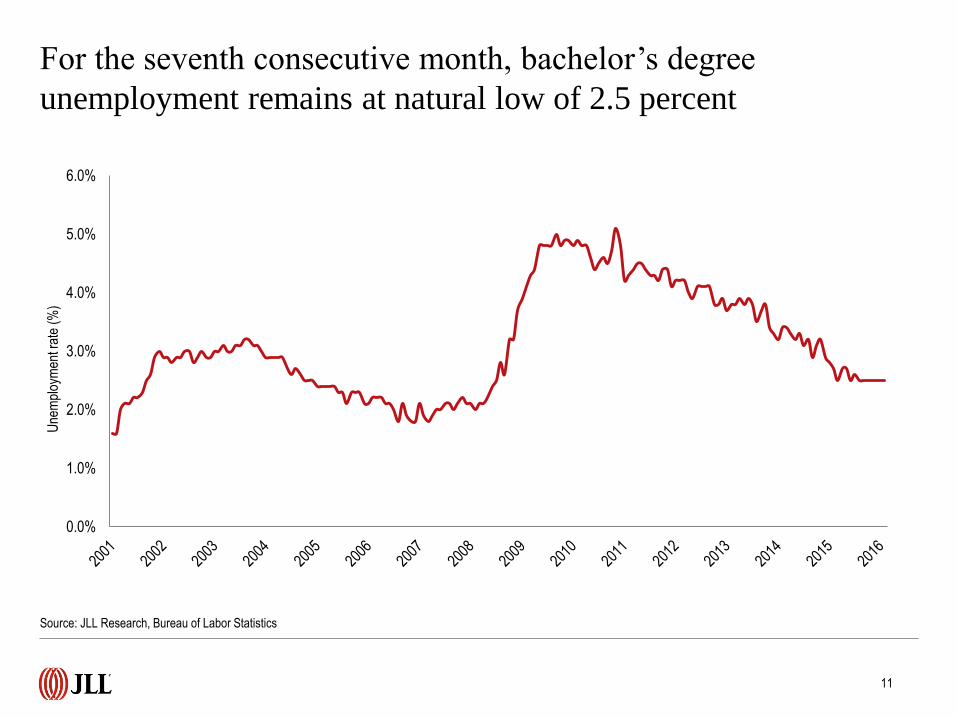
For the seventh consecutive month, bachelor’s degree
unemployment remains at natural low of 2.5 percent
Source: JLL Research, Bureau of Labor Statistics
11
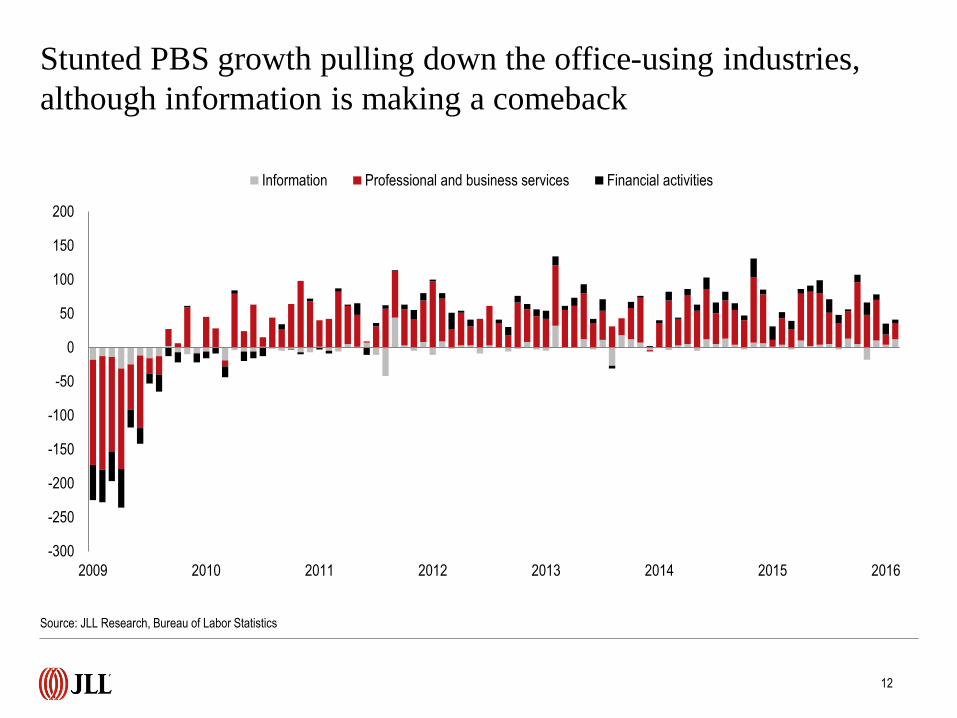
Stunted PBS growth pulling down the office-using industries,
although information is making a comeback
-300
-250
-200
-150
-100
-50
0
50
100
150
200
2009 2010 2011 2012 2013 2014 2015 2016
Information Professional and business services Financial activities
Source: JLL Research, Bureau of Labor Statistics
12
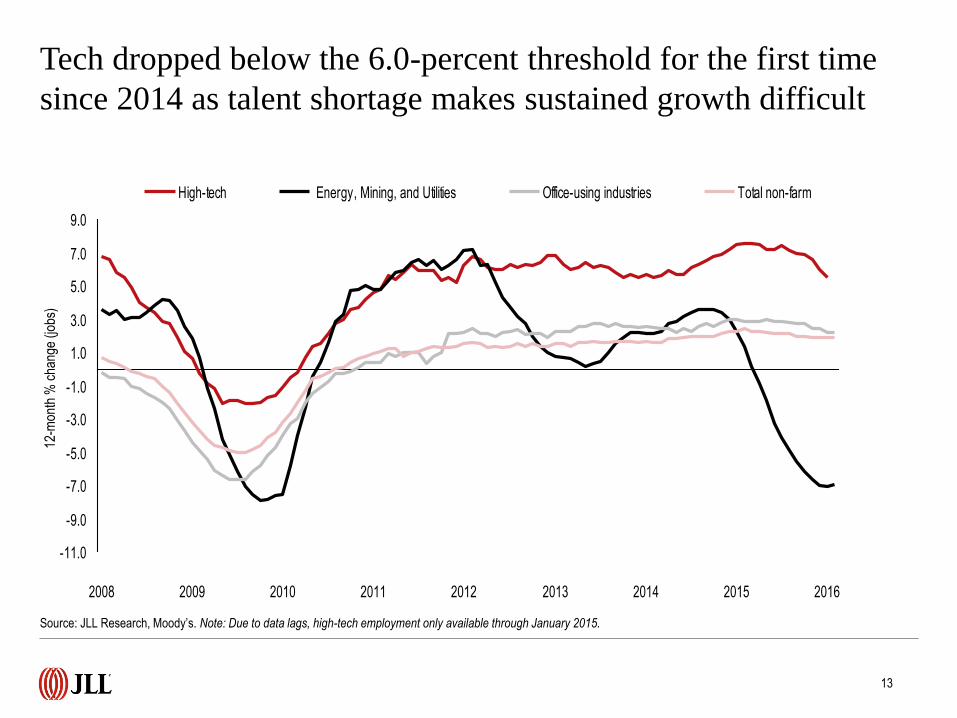
Tech dropped below the 6.0-percent threshold for the first time
since 2014 as talent shortage makes sustained growth difficult
-11.0
-9.0
-7.0
-5.0
-3.0
-1.0
1.0
3.0
5.0
7.0
9.0
2008 2009 2010 2011 2012 2013 2014 2015 2016
High-tech Energy, Mining, and Utilities Office-using industries Total non-farm
Source: JLL Research, Moody’s. Note: Due to data lags, high-tech employment only available through January 2015.
13
12-m
onth
% c
hang
e (jo
bs)
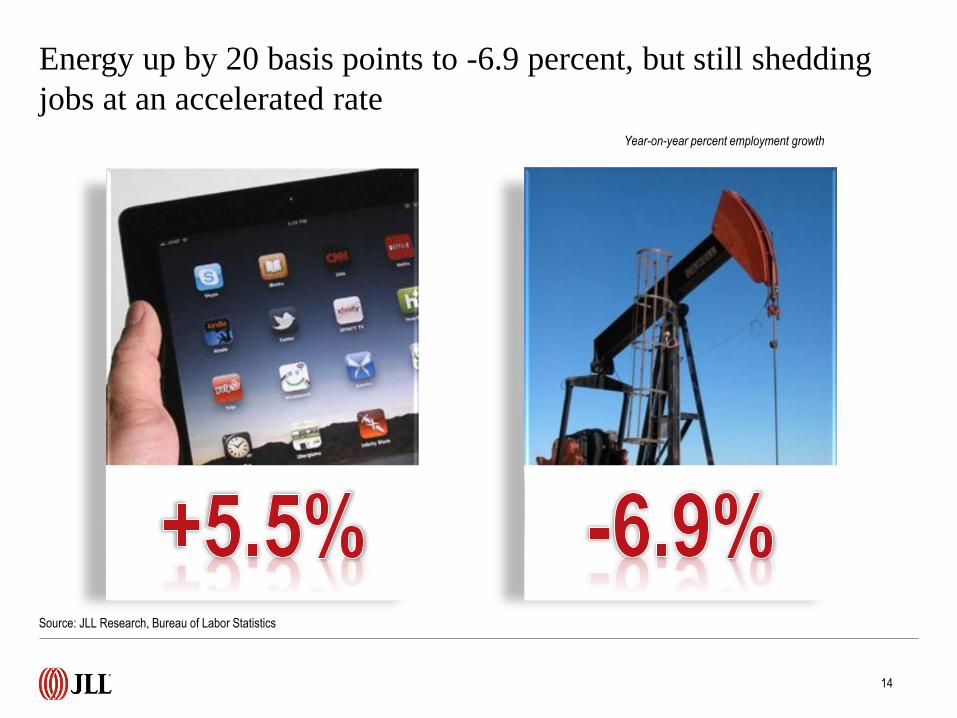
Energy up by 20 basis points to -6.9 percent, but still shedding
jobs at an accelerated rate Year-on-year percent employment growth
Source: JLL Research, Bureau of Labor Statistics
14
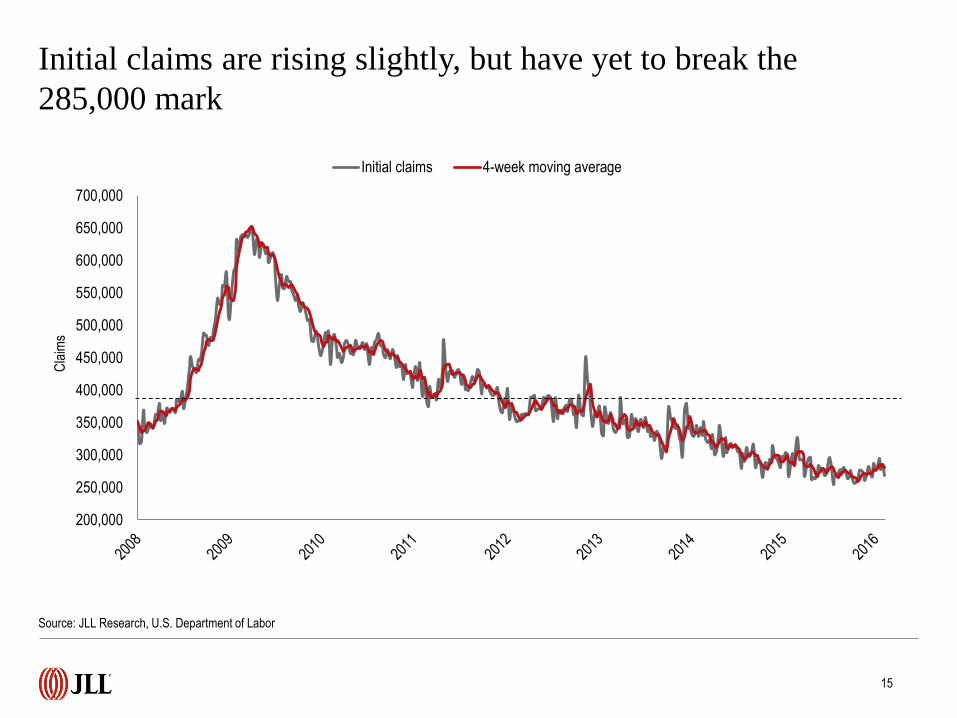
Initial claims are rising slightly, but have yet to break the
285,000 mark
Source: JLL Research, U.S. Department of Labor
15
200,000
250,000
300,000
350,000
400,000
450,000
500,000
550,000
600,000
650,000
700,000
Cla
ims
Initial claims 4-week moving average
0
1,000
2,000
3,000
4,000
5,000
6,000
2007 2008 2009 2010 2011 2012 2013 2014 2015
Hire
s an
d qu
its (
thou
sand
s)
Hires Quits
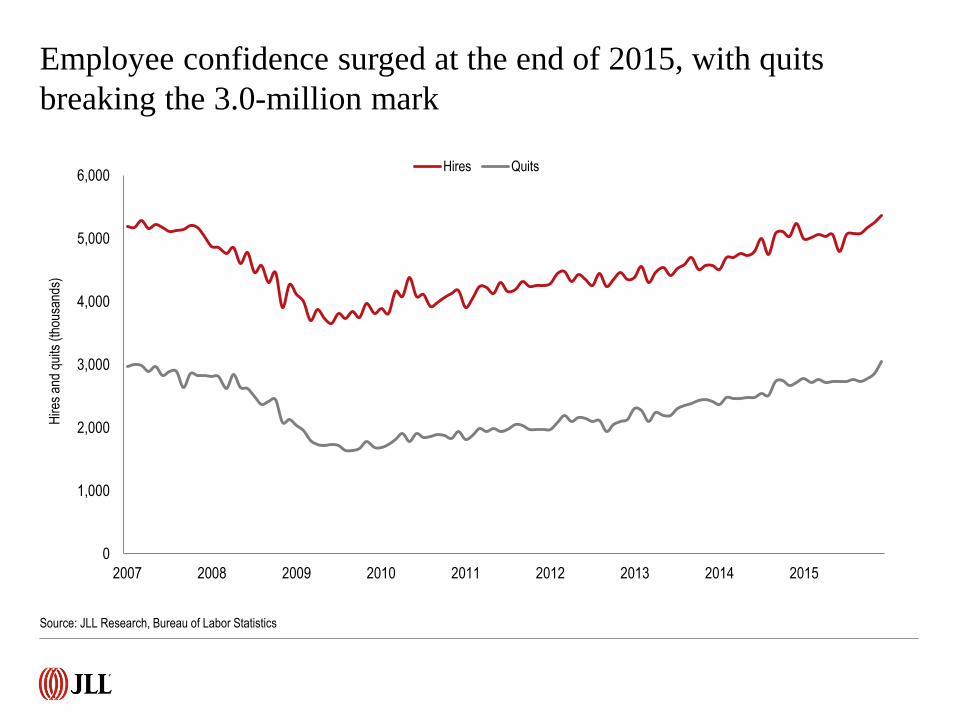
Employee confidence surged at the end of 2015, with quits
breaking the 3.0-million mark
Source: JLL Research, Bureau of Labor Statistics
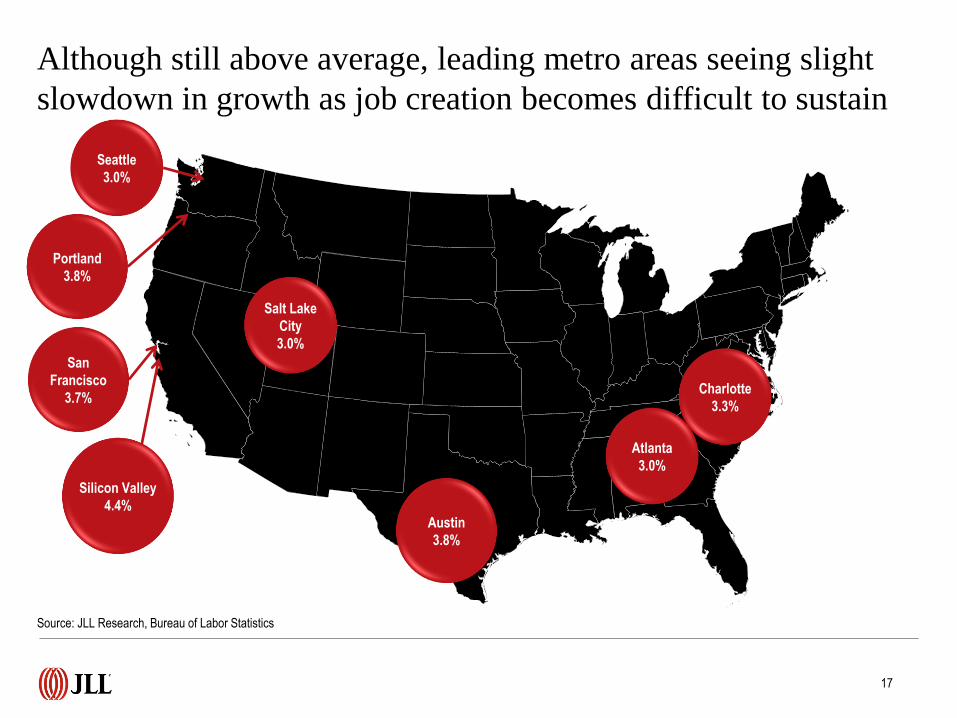
Although still above average, leading metro areas seeing slight
slowdown in growth as job creation becomes difficult to sustain
Source: JLL Research, Bureau of Labor Statistics
17
Silicon Valley
4.4%
San
Francisco
3.7%
Atlanta
3.0%
Austin
3.8%
Salt Lake
City
3.0%
Portland
3.8%
Seattle
3.0%
Charlotte
3.3%
0.6%
0.8%
1.3%
1.7%
1.7%
2.2%
2.2%
2.2%
2.9%
3.0%
3.0%
4.4%
0.0% 0.5% 1.0% 1.5% 2.0% 2.5% 3.0% 3.5% 4.0% 4.5% 5.0%
Chicago
Houston
Philadelphia
Boston
New York
Los Angeles
Washington, DC
South Florida
Dallas
Seattle
Atlanta
San Francisco
12-month % change
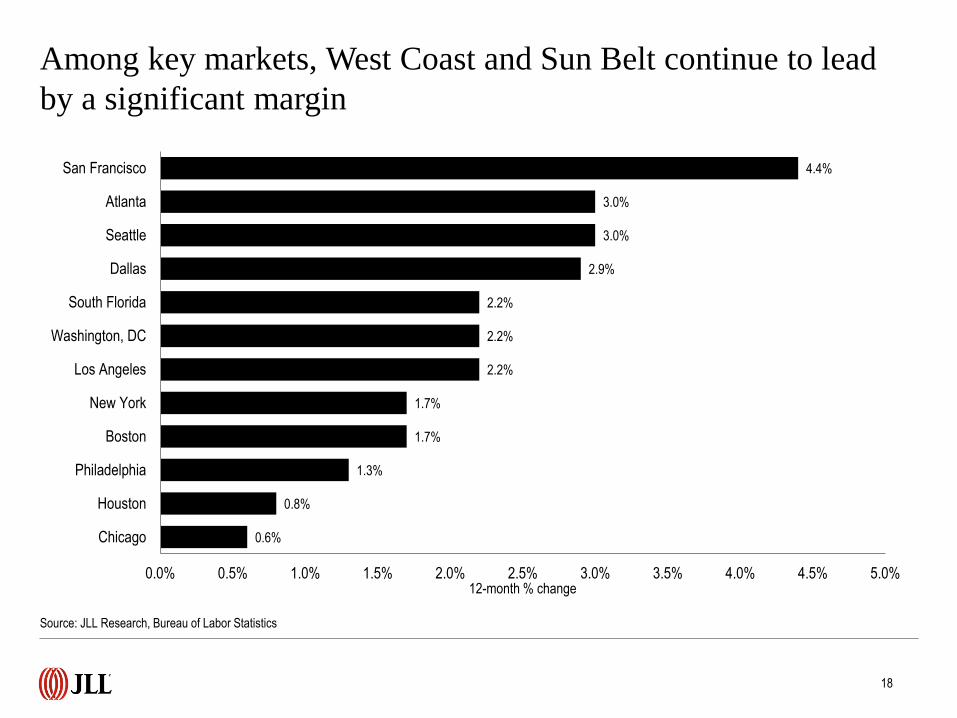
Among key markets, West Coast and Sun Belt continue to lead
by a significant margin
Source: JLL Research, Bureau of Labor Statistics
18
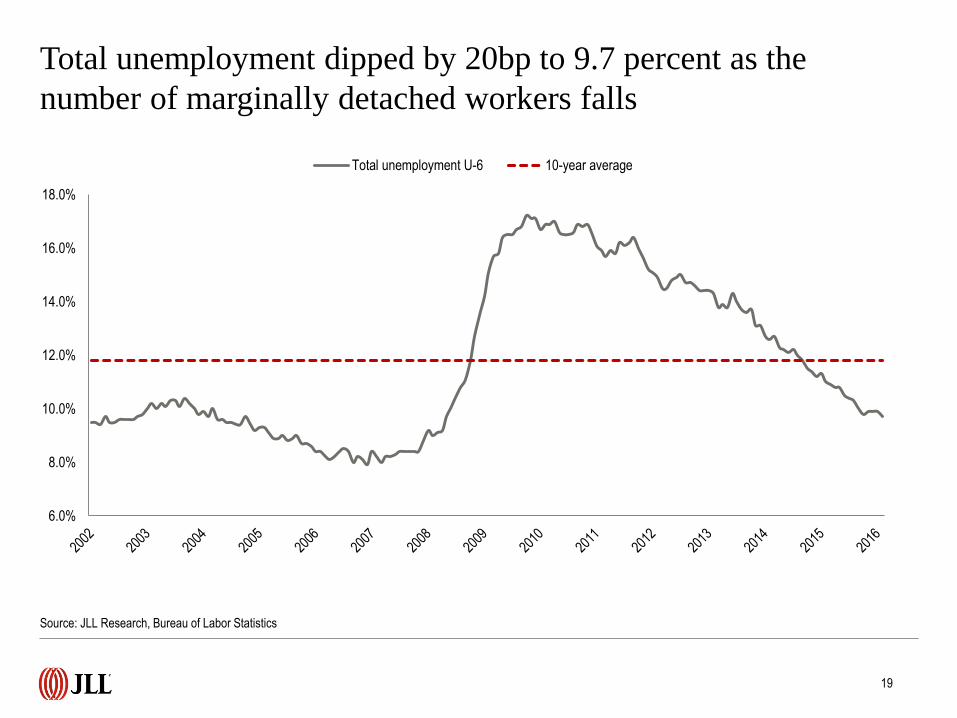
Total unemployment dipped by 20bp to 9.7 percent as the
number of marginally detached workers falls
6.0%
8.0%
10.0%
12.0%
14.0%
16.0%
18.0%
Total unemployment U-6 10-year average
Source: JLL Research, Bureau of Labor Statistics
19
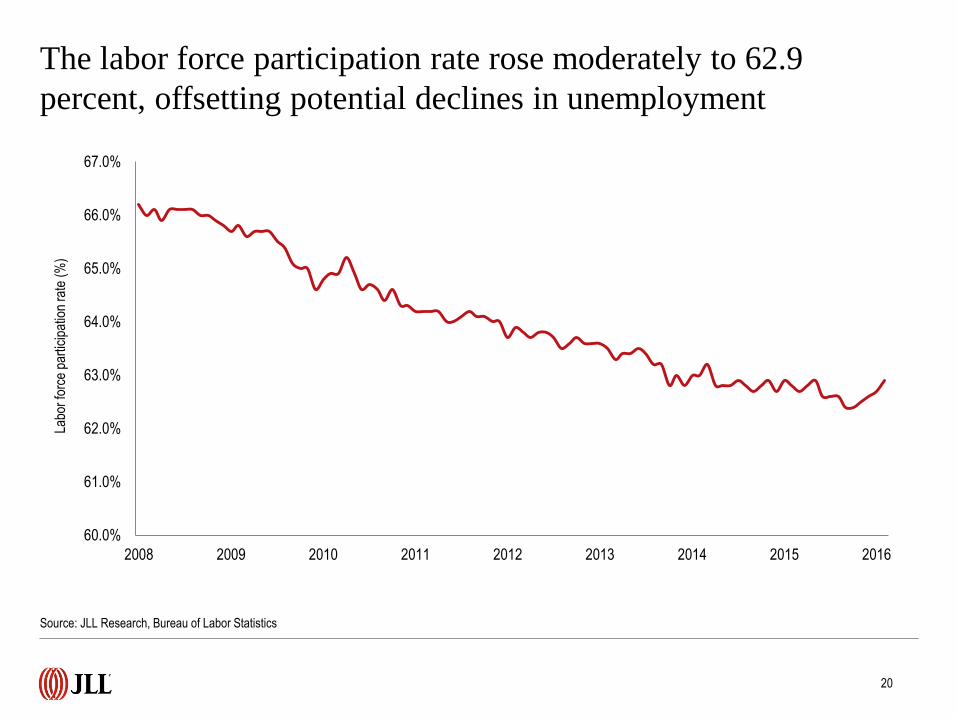
The labor force participation rate rose moderately to 62.9
percent, offsetting potential declines in unemployment
Source: JLL Research, Bureau of Labor Statistics
20
60.0%
61.0%
62.0%
63.0%
64.0%
65.0%
66.0%
67.0%
2008 2009 2010 2011 2012 2013 2014 2015 2016
Labo
r fo
rce
part
icip
atio
n ra
te (
%)
©2015 Jones Lang LaSalle Research IP, Inc. All rights reserved. All information contained herein is from sources deemed reliable; however, no representation or warranty is made to the accuracy thereof.
For more information, please contact:
Ben Breslau
Managing Director - Americas Research
Phil Ryan
Research Analyst – Office and Economy Research
Or, find more employment, business and real estate research at jll.com.
>>> Click here to check it out.