malaysian society of nephrology ministry of health … · i 4th report of the malaysian registry of...
TRANSCRIPT
Malaysian Society of Nephrology Ministry of Health Malaysia

i
4th REPORT OF
THE MALAYSIAN REGISTRY
of
RENAL BIOPSY
2010
Sponsors:
Malaysian Society of Nephrology
The National Renal Registry is funded with grants from:
Roche
Ain Medicare
Baxter Healthcare
Fresenius Medical Care
The Ministry of Health Malaysia
ii
March 2013
© National Renal Registry, Malaysia
ISSN 1985-6989
Published by:
The National Renal Registry
Malaysian Society of Nephrology
Suite 1604, Plaza Permata
No. 6, Jalan Kampar
50400 Kuala Lumpur
Malaysia
Telephone. : (603) 4045 8636
Direct Fax : (603) 4042 7694
e-mail : [email protected]
Web site : http://www.msn.org.my
Cover illustration by Dr. Nik Hasimah Nik Yahya HKL
Important information:
This report is copyrighted. However it may be freely reproduced without the permission of the
National Renal Registry. Acknowledgment would be appreciated. Suggested citation is:
Rosnawati Yahya, Wan Jazilah W I (Eds) 4th Report of the Malaysian Registry of Renal Biopsy
2010. Kuala Lumpur 2013.
This report is also published electronically on these websites http://www.msn.org.my or https://
www.macr.org.my/emrrb .
iii
The National Renal Registry would like to thank the following:
All the nephrologists and staff of the participating hospitals
For their hard work and contribution,
The Ministry of Health, Malaysia
for support seen and unseen,
For their generous support: -
Roche
Ain Medicare
Baxter Healthcare
Fresenius Medical Care
The staff of the Clinical Research Centre
&
All who have in one way or another supported the National Renal
Registry.
ACKNOWLEDGEMENTS
iv
Clinical Registry Manager Lee Day Guat
Clinical Research Assistant Suhazelini Ali
Choo Cheh Loo
Statistician Adam bin Bujang
Premaa A/P Supramaniam
Tassha Hilda binti Adnan
Members: MSN appointment: Facilities
Datuk Dr. Ghazali Ahmad Chairman Hospital Kuala Lumpur
Dr. Abdul Halim Abd Gafor University representative University Kebangsaan
Malaysia Medical Centre
Dr. S. Prasad Menon Private sector representative Sime Darby Medical
Centre Subang Jaya
Dr. Ong Loke Meng CRC representative Hospital Penang
Mr. Tam Chong Chiang ADMAN representative Hospital Tg. Ampuan
Afzan
Dr. Lim Yam Ngo
MDTR sub-committee Chairperson Hospital Kuala Lumpur
Dr. Wong Hin Seng
eMOSS sub-committee Chairperson Hospital Selayang
Dato' Dr. Wan Shaariah Md Yusuf
MRRB sub-committee Chairperson Tuanku Ja'afar Hospital
Dr. Goh Bak Leong MDTR Editor Hospital Serdang
Dr. Rafidah Abdullah Honorary MSN Treasurer Hospital Selayang
NRR ADVISORY COMMITTEE MEMBERS
2010 TO 2012
MRRB WORKING COMMITTEE MEMBERS
Chairperson Dato’ Dr. Wan Sha’ariah Md Yusuf
Co-Chairperson Dr. Rosnawati Yahya
Members Dr. Lim Soo Kun
Dr. Sunita Bavanandan
Dr. Wan Jazilah Wan Ismail
Dr. Wong Hin Seng
Dr. Yap Yoke Chin
v
ABOUT MALAYSIAN REGISTRY OF RENAL BIOPSY
Renal biopsy remains the main investigation in the diagnosis of renal diseases. In addition, it plays a
major role in determining the management and prognosis of parenchymal renal disease. The
collection of demographic, clinical and laboratory data at the time of biopsy and the set up of a
database are useful tools for studying renal parenchymal diseases.
The development of a renal biopsy registry in each country promotes many advantages and these
include comparison in incidence of renal diseases, identification of different policies and practices in
renal biopsy in different areas, linkage with other registries such as dialysis or transplant registry and
identification of rare renal diseases. Thus, the registry is a source of epidemiological data and would
provide useful information in the planning of health care and in organizing prospective clinical studies.
The incidence of glomerular disease varies according to population, demographic characteristics,
environmental factors, socio-economic status and the prevalence of infectious diseases. At present,
there is limited information on the prevalence and incidence of glomerular disease, its potential
disease burden and the temporal trend in Malaysia. Hence, the Malaysian Registry of Renal Biopsy
(MRRB) was set up in 2005 to address this deficiency.
The MRRB collects information about patients who undergo renal biopsy in Malaysia. The MRRB is a
new component of National Renal Registry (NRR), which has been operating the Malaysian Dialysis
and Transplant Registry (MDTR) since 1993.
Objectives
The objectives of the MRRB registry are to:
1. Determine the disease burden attributable to glomerular disease (GD) by quantifying its incidence
and prevalence, and its geographic and temporal trends in Malaysia.
2. Identify subgroups in the population at high risk of GD to whom preventive efforts should be
targeted.
3. Identify potential causal and risk factors involved in GD.
4. Describe the clinical presentation and spectrum of GD.
5. Stimulate and facilitate basic, clinical and epidemiological research on GD.
6. Identify causes of allograft failure in our renal transplant population.
7. To audit the renal biopsy procedure, monitor both complications and quality of specimens in
addition to identifying risk factors associated with complications.
vi
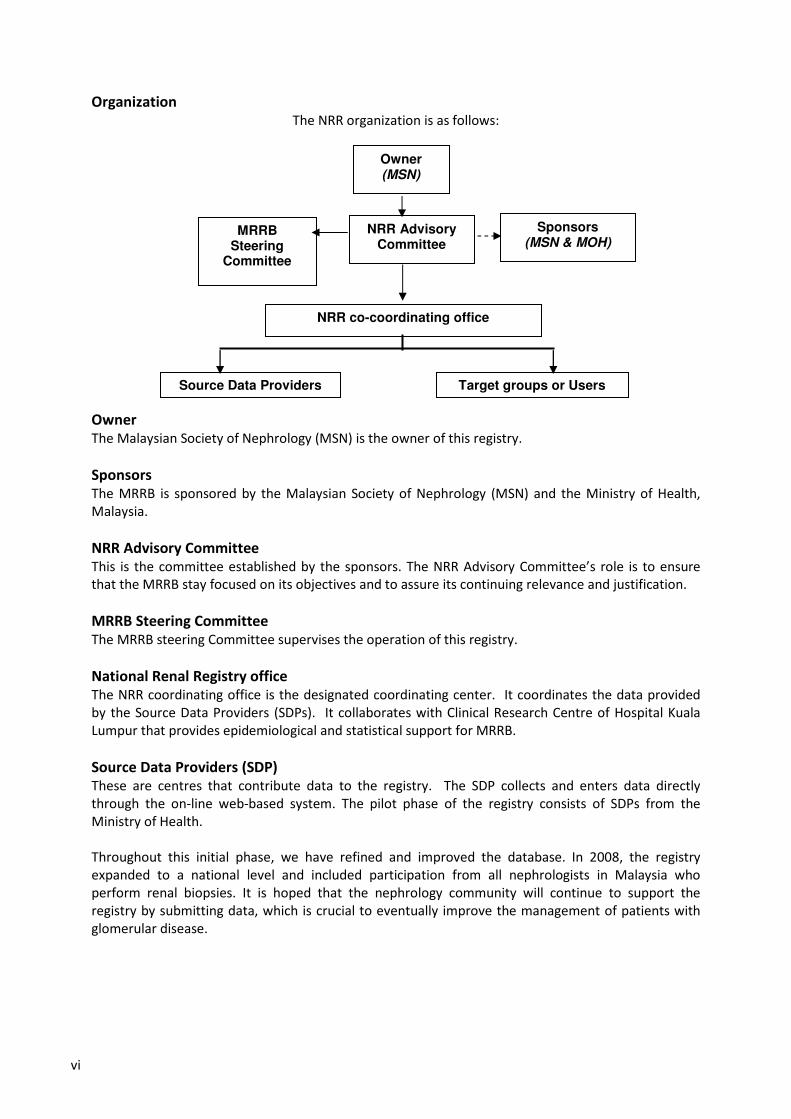
Organization
The NRR organization is as follows:
Owner (MSN)
NRR Advisory Committee
NRR co-coordinating office
MRRB Steering
Committee
Sponsors (MSN & MOH)
Source Data Providers Target groups or Users
Owner
The Malaysian Society of Nephrology (MSN) is the owner of this registry.
Sponsors
The MRRB is sponsored by the Malaysian Society of Nephrology (MSN) and the Ministry of Health,
Malaysia.
NRR Advisory Committee
This is the committee established by the sponsors. The NRR Advisory Committee’s role is to ensure
that the MRRB stay focused on its objectives and to assure its continuing relevance and justification.
MRRB Steering Committee
The MRRB steering Committee supervises the operation of this registry.
National Renal Registry office
The NRR coordinating office is the designated coordinating center. It coordinates the data provided
by the Source Data Providers (SDPs). It collaborates with Clinical Research Centre of Hospital Kuala
Lumpur that provides epidemiological and statistical support for MRRB.
Source Data Providers (SDP)
These are centres that contribute data to the registry. The SDP collects and enters data directly
through the on-line web-based system. The pilot phase of the registry consists of SDPs from the
Ministry of Health.
Throughout this initial phase, we have refined and improved the database. In 2008, the registry
expanded to a national level and included participation from all nephrologists in Malaysia who
perform renal biopsies. It is hoped that the nephrology community will continue to support the
registry by submitting data, which is crucial to eventually improve the management of patients with
glomerular disease.
vii
To participate in MRRB
Centres interested to participate in this registry please write in to NRR officially via post or email
The following documents need to be completed and returned to facilitate participation.
• Centre Participation Self Reply Form
• Authorization Form
• Information Security Policy/User Agreement . One form per nominee as listed in the Authorization
form. Users must have a personal mobile phone to received SMS authentication.
Upon receiving these documents, the centre shall be registered and each of the users of the MRRB
shall be notified via their e-mail address.
Methodology
All patients from participating centres who undergo any kidney biopsy (native or graft) are to be
enrolled into the registry.
On-line data submission is through MRRB web application and paper CRF still practice. The data
variables collected include demography, clinical presentation, indications of biopsy, renal function and
laboratory data at presentation and at the time of biopsy, serological markers, virology status and
histopathological result. In addition, an update on outcomes in terms of significant end-points such as
end stage renal disease or death will be recorded annually.

viii
List of Source Data Providers Adult Centre Name Sector 1st
Report
2nd
Report
3rd
Report
4th
Report
96 Hospital Angkatan Tentera Lumut Armed forces √ √ √
Hospital Pakar Sultanah Fatimah Muar MOH √
Kuala Lumpur Hospital MOH √ √ √ √
Melaka Hospital MOH √ √ √ √
Pulau Pinang Hospital MOH √ √ √ √
Queen Elizabeth Hospital MOH √ √ √ √
Raja Perempuan Zainab II Hospital MOH √ √ √ √
Raja Permaisuri Bainun Hospital MOH √ √ √
Sarawak General Hospital MOH √ √ √ √
Selayang Hospital MOH √ √ √ √
Serdang Hospital MOH √ √ √
Sultanah Aminah Hospital MOH √ √ √ √
Sultanah Bahiyah Hospital MOH √ √ √ √
Sultanah Nur Zahirah Hospital MOH √ √ √ √
Tengku Ampuan Afzan Hospital MOH √ √ √ √
Tengku Ampuan Rahimah Hospital MOH √ √ √ √
Tuanku Ja'afar Hospital MOH √ √ √ √
Fan Medical Renal Clinic Private √ √ √
Ipoh Specialist Hospital Private √ √ √
KPJ Ampang Puteri Specialist Hospital Private √ √ √
KPJ Selangor Specialist Hospital Private √
Lam Wah Ee Hospital Private √ √ √
Metro Specialist Hospital Private √ √ √
Normah Medical Specialist Centre Private √ √ √
Prince Court Medical Centre Private √ √
Sunway Medical Centre Private √ √ √
Teo Kidney Specialist Clinic Private √ √
Timberland Medical Centre Private √ √
Tung Shin Hospital Private √ √ √
University Malaya Medical Centre University √ √ √
Universiti Sains Malaysia Hospital University √ √
All 13 26 28 30
Paediatric Centre Name Sector 1st
Report 2nd
Report 3rd
Report 4th
Report
Kuala Lumpur Hospital MOH √ √ √ √
Likas Hospital MOH √ √ √ √
Pulau Pinang Hospital MOH √ √ √ √
Selayang Hospital MOH √ √ √ √
Sultan Ismail Hospital MOH √ √ √ √
Tengku Ampuan Afzan Hospital MOH √ √
All 7 7 6 6
ix
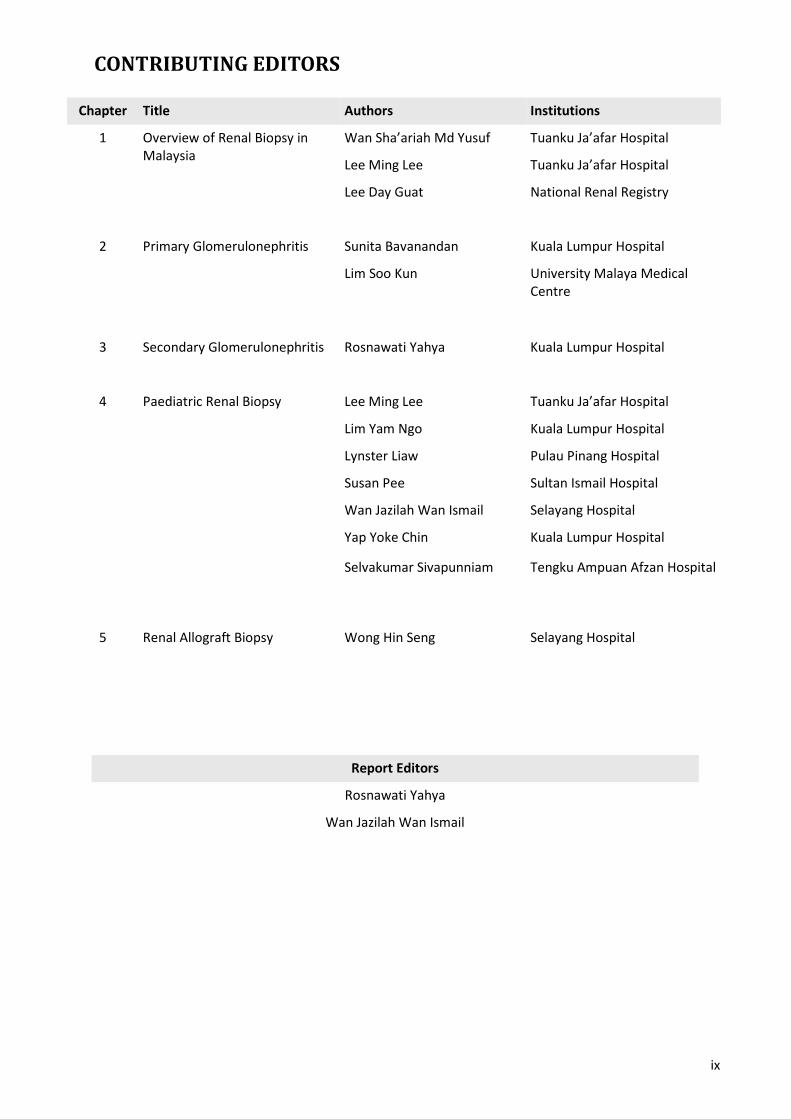
CONTRIBUTING EDITORS
Chapter Title Authors Institutions
1 Overview of Renal Biopsy in
Malaysia
Wan Sha’ariah Md Yusuf Tuanku Ja’afar Hospital
Lee Ming Lee Tuanku Ja’afar Hospital
Lee Day Guat National Renal Registry
2 Primary Glomerulonephritis Sunita Bavanandan Kuala Lumpur Hospital
Lim Soo Kun University Malaya Medical
Centre
3 Secondary Glomerulonephritis Rosnawati Yahya Kuala Lumpur Hospital
4 Paediatric Renal Biopsy Lee Ming Lee Tuanku Ja’afar Hospital
Lim Yam Ngo Kuala Lumpur Hospital
Lynster Liaw Pulau Pinang Hospital
Susan Pee Sultan Ismail Hospital
Wan Jazilah Wan Ismail Selayang Hospital
Yap Yoke Chin Kuala Lumpur Hospital
Selvakumar Sivapunniam Tengku Ampuan Afzan Hospital
5 Renal Allograft Biopsy Wong Hin Seng Selayang Hospital
Report Editors
Rosnawati Yahya
Wan Jazilah Wan Ismail
x
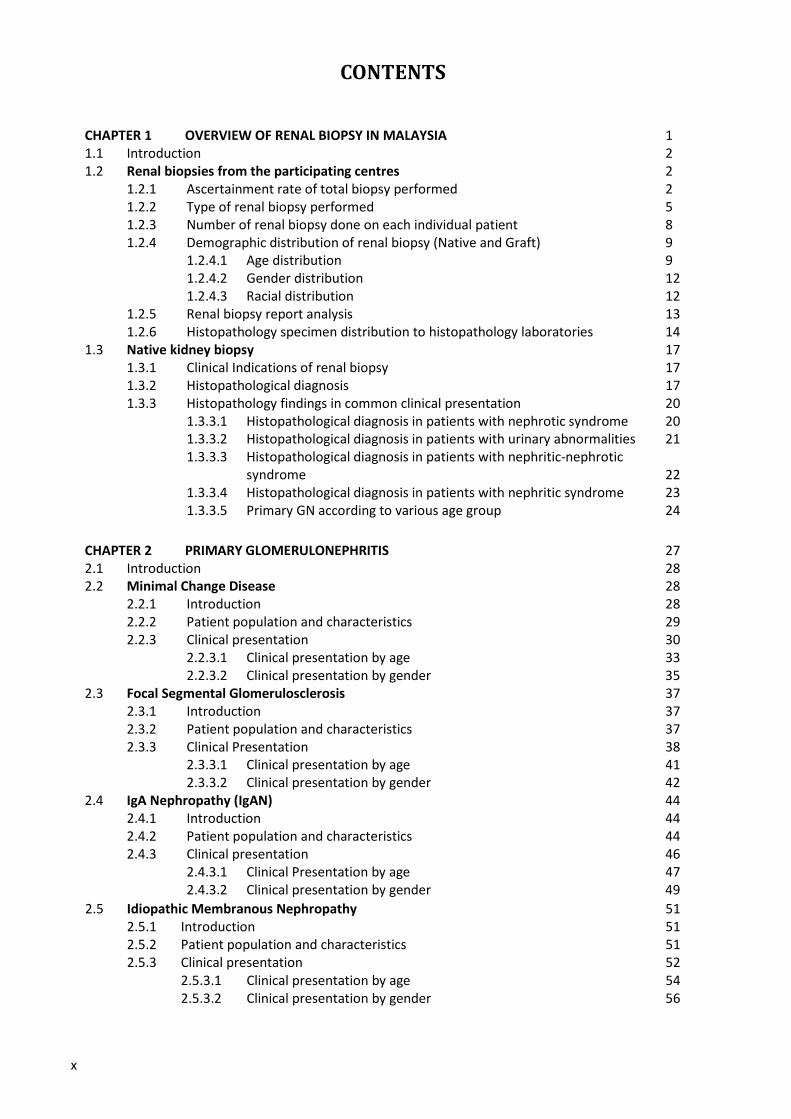
CONTENTS
1
1.1 Introduction 2
1.2 Renal biopsies from the participating centres 2
1.2.1 Ascertainment rate of total biopsy performed 2
1.2.2 Type of renal biopsy performed 5
1.2.3 Number of renal biopsy done on each individual patient 8
1.2.4 Demographic distribution of renal biopsy (Native and Graft) 9
1.2.4.1 Age distribution 9
1.2.4.2 Gender distribution 12
1.2.4.3 Racial distribution 12
1.2.5 Renal biopsy report analysis 13
1.2.6 Histopathology specimen distribution to histopathology laboratories 14
1.3 Native kidney biopsy 17
1.3.1 Clinical Indications of renal biopsy 17
1.3.2 Histopathological diagnosis 17
1.3.3 Histopathology findings in common clinical presentation 20
1.3.3.1 Histopathological diagnosis in patients with nephrotic syndrome 20
1.3.3.2 Histopathological diagnosis in patients with urinary abnormalities 21
1.3.3.3 Histopathological diagnosis in patients with nephritic-nephrotic
syndrome 22
1.3.3.4 Histopathological diagnosis in patients with nephritic syndrome 23
1.3.3.5 Primary GN according to various age group 24
CHAPTER 1 OVERVIEW OF RENAL BIOPSY IN MALAYSIA
CHAPTER 2 PRIMARY GLOMERULONEPHRITIS 27
2.1 Introduction 28
2.2 Minimal Change Disease 28
2.2.1 Introduction 28
2.2.2 Patient population and characteristics 29
2.2.3 Clinical presentation 30
2.2.3.1 Clinical presentation by age 33
2.2.3.2 Clinical presentation by gender 35
2.3 Focal Segmental Glomerulosclerosis 37
2.3.1 Introduction 37
2.3.2 Patient population and characteristics 37
2.3.3 Clinical Presentation 38
2.3.3.1 Clinical presentation by age 41
2.3.3.2 Clinical presentation by gender 42
2.4 IgA Nephropathy (IgAN) 44
2.4.1 Introduction 44
2.4.2 Patient population and characteristics 44
2.4.3 Clinical presentation 46
2.4.3.1 Clinical Presentation by age 47
2.4.3.2 Clinical presentation by gender 49
2.5 Idiopathic Membranous Nephropathy 51
2.5.1 Introduction 51
2.5.2 Patient population and characteristics 51
2.5.3 Clinical presentation 52
2.5.3.1 Clinical presentation by age 54
2.5.3.2 Clinical presentation by gender 56
xi
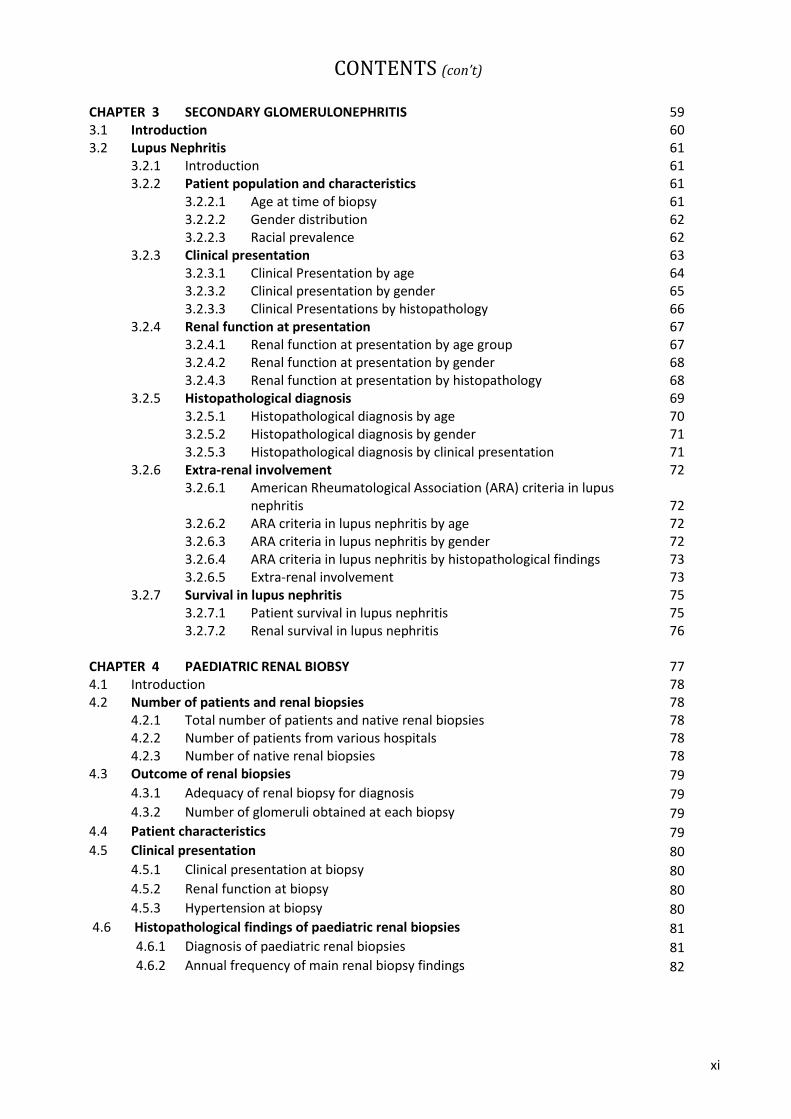
CHAPTER 3 SECONDARY GLOMERULONEPHRITIS 59
3.1 Introduction 60
3.2 Lupus Nephritis 61
3.2.1 Introduction 61
3.2.2 Patient population and characteristics 61
3.2.2.1 Age at time of biopsy 61
3.2.2.2 Gender distribution 62
3.2.2.3 Racial prevalence 62
3.2.3 Clinical presentation 63
3.2.3.1 Clinical Presentation by age 64
3.2.3.2 Clinical presentation by gender 65
3.2.3.3 Clinical Presentations by histopathology 66 3.2.4 Renal function at presentation 67
3.2.4.1 Renal function at presentation by age group 67
3.2.4.2 Renal function at presentation by gender 68
3.2.4.3 Renal function at presentation by histopathology 68
3.2.5 Histopathological diagnosis 69
3.2.5.1 Histopathological diagnosis by age 70
3.2.5.2 Histopathological diagnosis by gender 71
3.2.5.3 Histopathological diagnosis by clinical presentation 71
3.2.6 Extra-renal involvement 72
3.2.6.1 American Rheumatological Association (ARA) criteria in lupus
nephritis 72
3.2.6.2 ARA criteria in lupus nephritis by age 72
3.2.6.3 ARA criteria in lupus nephritis by gender 72
3.2.6.4 ARA criteria in lupus nephritis by histopathological findings 73
3.2.6.5 Extra-renal involvement 73
3.2.7 Survival in lupus nephritis 75
3.2.7.1 Patient survival in lupus nephritis 75
3.2.7.2 Renal survival in lupus nephritis 76
CHAPTER 4 PAEDIATRIC RENAL BIOBSY 77
4.1 Introduction 78
4.2 Number of patients and renal biopsies 78
4.2.1 Total number of patients and native renal biopsies 78
4.2.2 Number of patients from various hospitals 78
4.2.3 Number of native renal biopsies 78
CONTENTS (con’t)
4.3 Outcome of renal biopsies 79
4.3.1 Adequacy of renal biopsy for diagnosis 79
4.3.2 Number of glomeruli obtained at each biopsy 79
4.4 Patient characteristics 79
4.5 Clinical presentation 80
4.5.1 Clinical presentation at biopsy 80
4.5.2 Renal function at biopsy 80
4.5.3 Hypertension at biopsy 80
4.6 Histopathological findings of paediatric renal biopsies 81
4.6.1 Diagnosis of paediatric renal biopsies 81
4.6.2 Annual frequency of main renal biopsy findings 82
xii
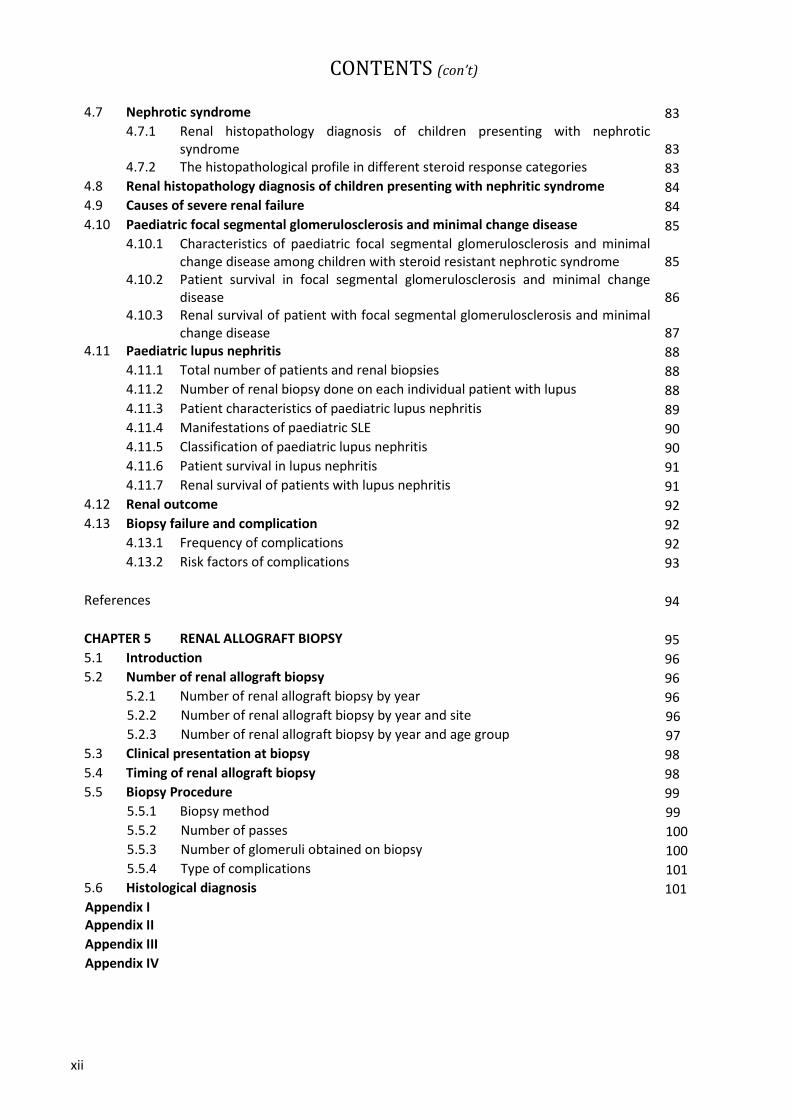
CONTENTS (con’t)
4.7 Nephrotic syndrome 83
4.7.1 Renal histopathology diagnosis of children presenting with nephrotic
syndrome 83
4.7.2 The histopathological profile in different steroid response categories 83
4.8 Renal histopathology diagnosis of children presenting with nephritic syndrome 84
4.9 Causes of severe renal failure 84
4.10 Paediatric focal segmental glomerulosclerosis and minimal change disease 85
4.10.1 Characteristics of paediatric focal segmental glomerulosclerosis and minimal
change disease among children with steroid resistant nephrotic syndrome 85
4.10.2 Patient survival in focal segmental glomerulosclerosis and minimal change
disease 86
4.10.3 Renal survival of patient with focal segmental glomerulosclerosis and minimal
change disease 87
4.11 Paediatric lupus nephritis 88
4.11.1 Total number of patients and renal biopsies 88
4.11.2 Number of renal biopsy done on each individual patient with lupus 88
4.11.3 Patient characteristics of paediatric lupus nephritis 89
4.11.4 Manifestations of paediatric SLE 90
4.11.5 Classification of paediatric lupus nephritis 90
4.11.6 Patient survival in lupus nephritis 91
4.11.7 Renal survival of patients with lupus nephritis 91
4.12 Renal outcome 92
4.13 Biopsy failure and complication 92
4.13.1 Frequency of complications 92
4.13.2 Risk factors of complications 93
References 94
CHAPTER 5 RENAL ALLOGRAFT BIOPSY 95
5.1 Introduction 96
5.2 Number of renal allograft biopsy 96
5.2.1 Number of renal allograft biopsy by year 96
5.2.2 Number of renal allograft biopsy by year and site 96
5.2.3 Number of renal allograft biopsy by year and age group 97
5.3 Clinical presentation at biopsy 98
5.4 Timing of renal allograft biopsy 98
5.5 Biopsy Procedure 99
5.5.1 Biopsy method 99
5.5.2 Number of passes 100
5.5.3 Number of glomeruli obtained on biopsy 100
5.5.4 Type of complications 101
5.6 Histological diagnosis 101
Appendix I
Appendix II
Appendix III
Appendix IV
xiii
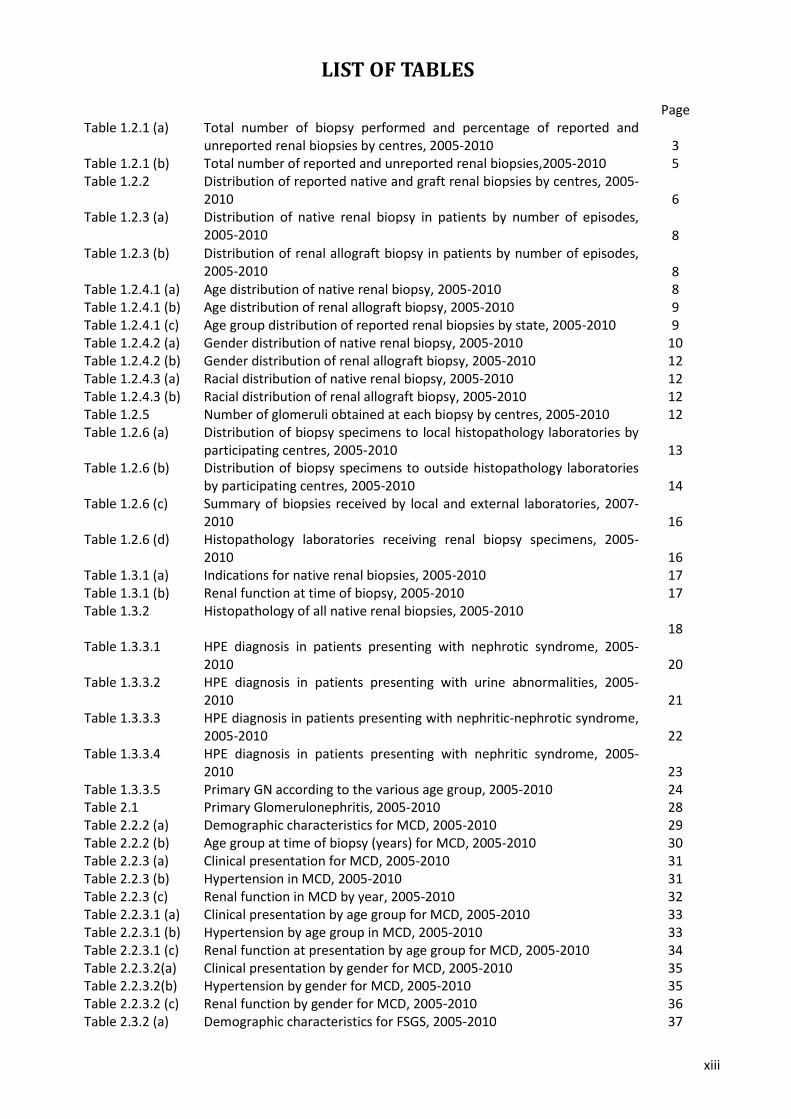
LIST OF TABLES
Page
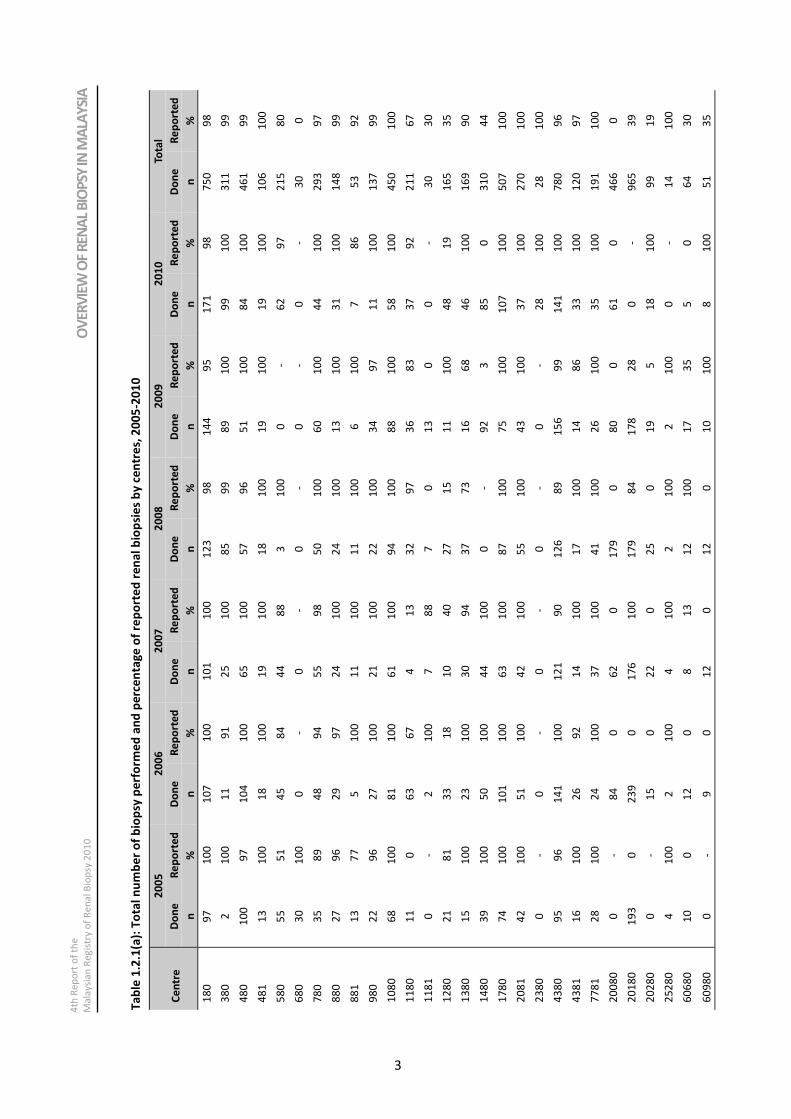
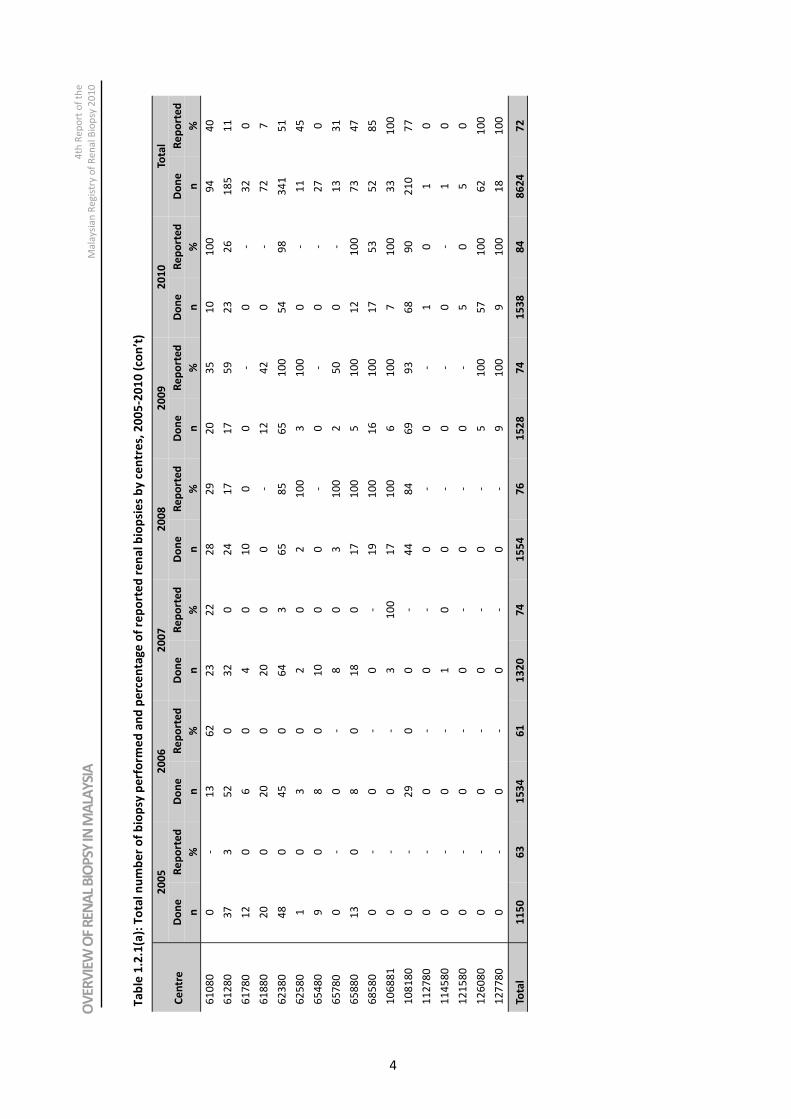
Table 1.2.1 (a) Total number of biopsy performed and percentage of reported and
unreported renal biopsies by centres, 2005-2010 3
Table 1.2.1 (b) Total number of reported and unreported renal biopsies,2005-2010 5
Table 1.2.2 Distribution of reported native and graft renal biopsies by centres, 2005-
2010 6
Table 1.2.3 (a) Distribution of native renal biopsy in patients by number of episodes,
2005-2010 8
Table 1.2.3 (b) Distribution of renal allograft biopsy in patients by number of episodes,
2005-2010 8
Table 1.2.4.1 (a) Age distribution of native renal biopsy, 2005-2010 8
Table 1.2.4.1 (b) Age distribution of renal allograft biopsy, 2005-2010 9
Table 1.2.4.1 (c) Age group distribution of reported renal biopsies by state, 2005-2010 9
Table 1.2.4.2 (a) Gender distribution of native renal biopsy, 2005-2010 10
Table 1.2.4.2 (b) Gender distribution of renal allograft biopsy, 2005-2010 12
Table 1.2.4.3 (a) Racial distribution of native renal biopsy, 2005-2010 12
Table 1.2.4.3 (b) Racial distribution of renal allograft biopsy, 2005-2010 12
Table 1.2.5 Number of glomeruli obtained at each biopsy by centres, 2005-2010 12
Table 1.2.6 (a) Distribution of biopsy specimens to local histopathology laboratories by
participating centres, 2005-2010 13
Table 1.2.6 (b) Distribution of biopsy specimens to outside histopathology laboratories
by participating centres, 2005-2010 14
Table 1.2.6 (c) Summary of biopsies received by local and external laboratories, 2007-
2010 16
Table 1.2.6 (d) Histopathology laboratories receiving renal biopsy specimens, 2005-
2010 16
Table 1.3.1 (a) Indications for native renal biopsies, 2005-2010 17
Table 1.3.1 (b) Renal function at time of biopsy, 2005-2010 17
Table 1.3.2 Histopathology of all native renal biopsies, 2005-2010
18
Table 1.3.3.1 HPE diagnosis in patients presenting with nephrotic syndrome, 2005-
2010 20
Table 1.3.3.2 HPE diagnosis in patients presenting with urine abnormalities, 2005-
2010 21
Table 1.3.3.3 HPE diagnosis in patients presenting with nephritic-nephrotic syndrome,
2005-2010 22
Table 1.3.3.4 HPE diagnosis in patients presenting with nephritic syndrome, 2005-
2010 23
Table 1.3.3.5 Primary GN according to the various age group, 2005-2010 24
Table 2.1 Primary Glomerulonephritis, 2005-2010 28
Table 2.2.2 (a) Demographic characteristics for MCD, 2005-2010 29
Table 2.2.2 (b) Age group at time of biopsy (years) for MCD, 2005-2010 30
Table 2.2.3 (a) Clinical presentation for MCD, 2005-2010 31
Table 2.2.3 (b) Hypertension in MCD, 2005-2010 31
Table 2.2.3 (c) Renal function in MCD by year, 2005-2010 32
Table 2.2.3.1 (a) Clinical presentation by age group for MCD, 2005-2010 33
Table 2.2.3.1 (b) Hypertension by age group in MCD, 2005-2010 33
Table 2.2.3.1 (c) Renal function at presentation by age group for MCD, 2005-2010 34
Table 2.2.3.2(a) Clinical presentation by gender for MCD, 2005-2010 35
Table 2.2.3.2(b) Hypertension by gender for MCD, 2005-2010 35
Table 2.2.3.2 (c) Renal function by gender for MCD, 2005-2010 36
Table 2.3.2 (a) Demographic characteristics for FSGS, 2005-2010 37
xiv
LIST OF TABLES (con’t)
Page
Table 2.3.2 (b) Age group at time of biopsy (years) for FSGS, 2005-2010 38
Table 2.3.3 (a) Clinical presentation for FSGS, 2005-2010 39
Table 2.3.3 (b) Presence of hypertension in FSGS, 2005-2010 39
Table 2.3.3 (c) Renal function in FSGS by year, 2005-2010 40
Table 2.3.3.1 (a) Clinical presentation by age group for FSGS, 2005-2010 41
Table 2.3.3.1 (b) Hypertension by age group for FSGS, 2005-2010 41
Table 2.3.3.1 (c) Renal function at presentation by age group for FSGS, 2005-2010 42
Table 2.3.3.2 (a) Clinical presentation by gender for FSGS, 2005-2010 42
Table 2.3.3.2 (b) Hypertension by gender in FSGS, 2005-2010 43
Table 2.3.3.2 (c) Renal function by gender for FSGS, 2005-2010 43
Table 2.4.2 (a) Demographic characteristics of patients with IgA nephropathy, 2005-
2010 44
Table 2.4.2 (b) Age group at time of biopsy (years) for IgA nephropathy, 2005-2010 45
Table 2.4.3 (a) Clinical presentation for IgA nephropathy, 2005-2010 46
Table 2.4.3 (b) Hypertension in IgA nephropathy, 2005-2010 46
Table 2.4.3 (c) Renal function in IgA Nephropathy, 2005-2010 47
Table 2.4.3.1 (a) Clinical presentation by age group for IgA nephropathy, 2005-2010 47
Table 2.4.3.1 (b) Hypertension by age group for IgA nephropathy, 2005-2010 47
Table 2.4.3.1 (c) Renal function at presentation by age group for IgA nephropathy, 2005-
2010 48
Table 2.4.3.2 (a) Clinical presentation by gender for IgA nephropathy, 2005-2010 49
Table 2.4.3.2 (b) Hypertension by gender for IgA nephropathy, 2005-2010 49
Table 2.4.3.1 (c) Renal function by gender for IgA nephropathy, 2005-2010 50
Table 2.5.2 (a) Demographic characteristics for IMN, 2005-2010 51
Table 2.5.2 (b) Age group at time of biopsy (years) for IMN, 2005-2010 52
Table 2.5.3 (a) Clinical presentation for IMN, 2005-2010 52
Table 2.5.3 (b) Hypertension in IMN, 2005-2010 53
Table 2.5.3 (c) Renal function in IMN, 2005-2010 53
Table 2.5.3.1 (a) Clinical presentation by age group for IMN, 2005-2010 54
Table 2.5.3.1 (b) Hypertension by age group for IMN, 2005-2010 54
Table 2.5.3.1 (c) Renal function at presentation by age group for IMN, 2005-2010 55
Table 2.5.3.2 (a) Clinical presentation by gender for IMN, 2005-2010 56
Table 2.5.3.2 (b) Hypertension by gender for IMN, 2005-2010 56
Table 2.5.3.1 (c) Renal function by gender for IMN, 2005-2010 57
Table 3.1 Causes of secondary glomerulonephritis in adult, 2005-2010 60
Table 3.2.2.1 Age group at time of biopsy (years), 2005-2010 61
Table 3.2.3.1 (a) Clinical presentation by age group, 2005-2010 64
Table 3.2.3.3 (a) Clinical presentations by histopathology in lupus nephritis, 2005-2010 66
Table 3.2.4.1 Renal function by age group in lupus nephritis, 2005-2010 67
Table 3.2.4.3 Renal function at presentation by histopathology, 2005-2010 68
Table 3.2.5 Histopathological diagnosis in lupus nephritis by year, 2005-2010 69
Table 3.2.5.1 Histopathological diagnosis by age group in lupus nephritis, 2005-2010 70
Table 3.2.5.2 Histopathological diagnosis by gender in lupus nephritis, 2005-2010 71
Table 3.2.5.3 Histopathological diagnosis by clinical presentation in lupus nephritis,
2005-2010 71
Table 3.2.6.1 ARA criteria in lupus nephritis, 2005-2010 72
Table 3.2.6.5 (a) Extra-renal involvement by gender, 2005-2010 73
Table 3.2.6.5 (b) Mucocutaneous involvement by gender in lupus nephritis, 2005-2010 74
Table 3.2.7.1 Patients survival estimates for death in lupus nephritis 75
Table 3.2.7.2 Renal survival estimates for death in lupus nephritis 76
Table 4.2.2 Number of patients from various hospitals 78
xv
LIST OF TABLES (con’t)
Page Table 4.2.3 Number of renal biopsis 78 Table 4.2.4 Number of renal biopsies done on each individual patient 78 Table 4.3.1 Conclusive report 79 Table 4.3.2 Number of glomeruli obtained at each biopsy 79 Table 4.4.1 Gender and racial distribution 79 Table 4.4.2 Age distribution 79 Table 4.5.1 Clinical presentation at biopsy 80 Table 4.5.2 Renal function at biopsy 80 Table 4.5.3 Hypertension at biopsy 80 Table 4.6.1 Diagnosis of paediatric renal biopsies 81 Table 4.6.2 Annual frequency of the main renal biopsy findings 1999-2010 82 Table 4.7.1 Renal histopathology diagnosis of children presenting with nephrotic
syndrome 83
Table 4.7.2 The histopathological profile in different steroid response categories 83 Table 4.8 Renal histopathology diagnosis of children presenting with nephritic
syndrome 84
Table 4.9 Histology finding of children who had severe renal failure (needed dialysis therapy) who underwent renal biopsy
84 Table 4.10.1 Clinical characteristics of children with steroid resistant nephrotic
syndrome 85
Table 4.10.2 Patient survival for focal segmental glomerulosclerosis and minimal change disease
86 Table 4.10.3 Renal survival of patient with focal segmental glomerulosclerosis and
minimal change disease 87
Table 4.11.1 Total number of patient and biopsies (SLE) 88 Table 4.11.2 Distribution of renal biopsy in patients with lupus by numbers of biopsy 88 Table 411.3.1 Gender distribution for paediatric lupus nephritis 89 Table 411.3.2 Racial distribution for paediatric lupus nephritis 89 Table 411.3.3 Age for paediatric lupus nephritis 89 Table 411.3.4 Dialysis therapy for paediatric lupus nephritis at the time of biopsy 89 Table 411.3.5 Patient with hypertension (SLE) 89 Table 411.3.6 Clinical presentation at biopsy (SLE) 89 Table 4.11.4(a) Clinical presentation of paediatric lupus 90 Table 4.11.4(b) ARA criteria at presentation 90 Table 4.11.5 Classification of paediatric lupus nephritis 90 Table 4.11.6 Patients survival in lupus nephritis 91 Table 4.11.7 Renal survival of patients with lupus nephritis (ESRF & ESRF+died) 91 Table 4.12 Causes of end stage renal disease in children who underwent renal
biopsy 92 Table 4.13.1 Frequency of complications 92 Table 4.13.2 Risk factors for complication 93 Table 5.2.1 Number of renal allograft biopsy, 2004-2010 96 Table 5.2.2 Number of renal allograft biopsy by centre, 2004-2010 96 Table 5.2.3 Renal allograft biopsy by year and age group, rate (per million
population), 2004-2010 97 Table 5.3 Indications for renal allograft biopsy, 2004-2010 98 Table 5.4 Timing of renal allograft biopsy, 2004-2010 99 Table 5.5.1 Biopsy method, 2004-2010 99 Table 5.5.2 Number of passes, 2004-2010 100 Table 5.5.3 Number of glomeruli obtained on biopsy, 2004-2010 100 Table 5.5.4 Type of complications, 2004-2010 101 Table 5.6 Histological diagnosis, 2004-2010 101
xvi
LIST OF FIGURES
Page
Figure 1.3.3.5 Primary GN according to the various age group, 2005-2010 25
Figure 2.2.2 (a) Demographic characteristics for MCD, 2005-2010 29
Figure 2.2.2 (b) Age at time of biopsy (years) for MCD, 2005-2010 30
Figure 2.2.3 (a) Overall clinical presentation for MCD, 2005-2010 31
Figure 2.2.3 (b) Presence of hypertension in MCD, 2005-2010 32
Figure 2.2.3 (c) Impaired renal function in MCD by year, 2005-2010 32
Figure 2.2.3.1 (b) Presence of hypertension by age group for MCD, 2005-2010 34
Figure 2.2.3.1 (c) Impaired renal function at presentation by age group for MCD, 2005-
2010 34
Figure 2.2.3.2 (b) Presence of Hypertension by gender for MCD, 2005-2010 35
Figure 2.2.3.2 (b) Impaired renal function by gender for MCD, 2005-2010 36
Figure 2.3.2(a) Demographic characteristics for FSGS, 2005-2010 37
Figure 2.3.2 (b) Age at time of biopsy (years) for FSGS, 2005-2010 38
Figure 2.3.3 (a) Overall clinical presentation for FSGS, 2005-2010 39
Figure 2.3.3 (b) Hypertension in FSGS, 2005-2010 40
Figure 2.3.3 (c) Impaired renal function in FSGS by year, 2005-2010 40
Figure 2.3.3.1 (b) Hypertension by age group for FSGS, 2005-2010 41
Figure 2.3.3.1 (c) Renal function at presentation by age group for FSGS, 2005-2010 42
Figure 2.3.3.2 (b) Hypertension by gender for FSGS, 2005-2010 43
Figure 2.3.3.2 (c) Impaired renal function at presentation by gender in FSGS, 2005-2010 44
Figure 2.4.2 (a) Demographic characteristics of patients with IgA nephropathy, 2005-
2010 45
Figure 2.4.2 (b) Age at time of biopsy (years) for IgA nephropathy, 2005-2010 45
Figure 2.4.3 (a) Overall clinical presentation for IgA nephropathy, 2005-2010 46
Figure 2.4.3 (b) Hypertension in IgA nephropathy, 2005-2010 48
Figure 2.4.3 (c) Impaired renal function in IgA nephropathy by year, 2005-2010 48
Figure 2.4.3.2 (b) Hypertension by gender for IgA nephropathy, 2005-2010 49
Figure 2.4.3.2 (c) Impaired renal function by gender in, 2005-2010 50
Figure 2.5.2 (a) Demographic characteristics for IMN, 2005-2010 51
Figure 2.5.2 (b) Age at time of biopsy (years) IMN, 2005-2010 52
Figure 2.5.3 (a) Overall clinical presentation for IMN, 2005-2010 53
Figure 2.5.3 (c) Renal function in IMN, 2005-2010 54
Figure 2.5.3.1 (b) Hypertension by age group for IMN, 2005-2010 55
Figure 2.5.3.1 (c) Renal function at presentation by age group for IMN, 2005-2010 55
Figure 2.5.3.2 (b) Hypertension by gender for IMN, 2005-2010 56
Figure 2.5.3.2 (c) Impaired renal function by gender, 2005-2010 57
Figure 3.2.2.1 Age group at time of biopsy (years), 2005-2010 61
Figure 3.2.2.2 Gender distribution in lupus nephritis, 2005-2010 62
Figure 3.2.2.3 Racial distribution in lupus nephritis, 2005-2010 62
Figure 3.2.3 Clinical presentation by year, 2005-2010 63
Figure 3.2.3 (a) Hypertension by year in lupus nephritis, 2005-2010 63
Figure 3.2.3 (b) Impaired renal function by year in lupus nephritis, 2005-2010 63
Figure 3.2.3.1 (a) Clinical presentation by age group in lupus nephritis, 2005-2010 64
Figure 3.2.3.1 (b) Hypertension by age group in lupus nephritis, 2005-2010 65
Figure 3.2.3.1 (c) Impaired renal function by age group in lupus nephritis, 2005-2010 65
xvii
Page
Figure 3.2.3.2 (a) Clinical presentation by gender in lupus nephritis, 2005-2010 65
Figure 3.2.3.2 (b) Hypertension by gender in lupus nephritis, 2005-2010 65
Figure 3.2.3.2 (c) Impaired renal function by gender in lupus nephritis, 2005-2010 65
Figure 3.2.3.3 (a) Clinical presentations by histopathology in lupus nephritis, 2005-2010 66
Figure 3.2.3.3 (b) Hypertension by histopathology in lupus nephritis, 2005-2010 67
Figure 3.2.3.3 (c) Impaired renal function by histopathology in lupus nephritis, 2005-2010 67
Figure 3.2.4.1 Renal function by age group in lupus nephritis, 2005-2010 67
Figure 3.2.4.2 Renal function at presentation by gender in lupus nephritis, 2005-2010 68
Figure 3.2.6.2 ARA criteria in lupus nephritis by age group, 2005-2010 72
Figure 3.2.6.3 ARA criteria in lupus nephritis by gender, 2005-2010 72
Figure 3.2.6.4 ARA criteria in lupus nephritis by histopathology, 2005-2010 73
Figure 3.2.6.5 (a) Extra-renal involvement by gender in lupus nephritis, 2005-2010 74
Figure 3.2.6.5 (b) Mucocutaneous involvement by gender in lupus nephritis, 2005-2010 74
Figure 3.2.7.1 Patients survival estimates for death in lupus nephritis 75
Figure 3.2.7.2 Renal survival estimates for lupus nephritis 76
Figure 4.10.2 Patient survival by focal segmental glomerulosclerosis and minimal
change disease 86
Figure 4.10.3 Renal survival by focal segmental glomerulosclerosis and minimal change 88
Figure 4.11.6 Patients survival estimates for lupus nephritis 91
Figure 4.11.7 Renal survival of patients with lupus nephritis 91
Figure 5.2.1 Number of renal allograft biopsy, 2004-2010 96
Figure 5.2.3 Renal allograft biopsy by year and age group, rate per million population
2004-2010 97
Figure 5.4 Timing of renal allograft biopsy, 2004-2010 98
Figure 5.5.1 Biopsy method (censored for missing data), 2004-2010 99
Figure 5.5.2 Number of passes, 2004-2010 100
Figure 5.5.3 Number of glomeruli obtained on biopsy, 2004-2010 100
Figure 5.5.6 Histological diagnosis, 2004-2010 101
LIST OF FIGURES (con’t)
4th Report of the
Malaysian Registry of Renal Biopsy 2010 OVERVIEW OF RENAL BIOPSY IN MALAYSIA
1
CHAPTER 1
Overview Of Renal Biopsy In Malaysia
Wan Sha’ariah Md Yusuf
Lee Ming Lee
Lee Day Guat
OVERVIEW OF RENAL BIOPSY IN MALAYSIA 4th Report of the
Malaysian Registry of Renal Biopsy 2010
2
1.1: Introduction
The main aim of The Malaysian Registry of Renal Biopsy (MRRB) was to collect and published data from all hospitals
performing renal biopsies. The data collected will be able to provide the pattern of glomerular disease in the
country. Unlike the first MRRB Report 2007 which only included data from the Ministry of Health (MOH), the
second MRRB Report 2008 and subsequent reports had included data from most hospitals in Malaysia performing
renal biopsies.
This fourth MRRB Report 2010 will include data of renal biopsy performed in all participating centres in MOH
centres, universities and private hospitals from 2005 to 2010. Renal biopsies performed and previously reported or
unreported from all participating centres from 2005 onwards will also be updated and reported in this fourth
MRRB report.
In 2011, the MRRB had attempted to come up with their annual publications in the next immediate year like the
Malaysian Dialysis and Transplant Registry (MDTR) but failed to do so for various reasons. One of the major reasons
was a number of participating centres had not sent in their data or if they had sent the data were incomplete. In
future, MRRB hopes to provide data, which is truly a national registry, and also to provide the clinical course of the
biopsied patients.
1.2: Renal biopsies from the participating centres
1.2.1 Ascertainment rate of total biopsy performed
From 2005 to 2010, there were a total of 45 participating centres: 23 centres (15 adult and 8 paediatric) were from
Ministry of Health (MOH), 3 were from universities, 1 from the army and 18 centres were from private hospitals.
All participating centres will be identified by their individual source document provider (SDP) number.
A total of 8624 biopsies were done since 2005 and of these 6249(72.1%) were reported. The ascertainment rate
was 62.6% for 2005, 61.1% for 2006, 74% for 2007, 76.1% for 2008, 74.2% in 2009 and 84.5% for 2010. There
appears to be a progressive improvement in the ascertainment rate. The average ascertainment rate for 2005-
2010 was 72.1%.
4th Report of the
Malaysian Registry of Renal Biopsy 2010 OVERVIEW OF RENAL BIOPSY IN MALAYSIA
3
Ce
ntr
e
20
05
2
00
6
20
07
2
00
8
20
09
2
01
0
Tota
l
Do
ne
R
ep
ort
ed
D
on
e
Re
po
rte
d
Do
ne
R
ep
ort
ed
D
on
e
Re
po
rte
d
Do
ne
R
ep
ort
ed
D
on
e
Re
po
rte
d
Do
ne
R
ep
ort
ed
n
%
n
%
n
%
n
%
n
%
n
%
n
%
18
0
97
1
00
1
07
1
00
1
01
1
00
1
23
9
8
14
4
95
1
71
9
8
75
0
98
38
0
2
10
0
11
9
1
25
1
00
8
5
99
8
9
10
0
99
1
00
3
11
9
9
48
0
10
0
97
1
04
1
00
6
5
10
0
57
9
6
51
1
00
8
4
10
0
46
1
99
48
1
13
1
00
1
8
10
0
19
1
00
1
8
10
0
19
1
00
1
9
10
0
10
6
10
0
58
0
55
5
1
45
8
4
44
8
8
3
10
0
0
- 6
2
97
2
15
8
0
68
0
30
1
00
0
-
0
- 0
-
0
- 0
-
30
0
78
0
35
8
9
48
9
4
55
9
8
50
1
00
6
0
10
0
44
1
00
2
93
9
7
88
0
27
9
6
29
9
7
24
1
00
2
4
10
0
13
1
00
3
1
10
0
14
8
99
88
1
13
7
7
5
10
0
11
1
00
1
1
10
0
6
10
0
7
86
5
3
92
98
0
22
9
6
27
1
00
2
1
10
0
22
1
00
3
4
97
1
1
10
0
13
7
99
10
80
6
8
10
0
81
1
00
6
1
10
0
94
1
00
8
8
10
0
58
1
00
4
50
1
00
11
80
1
1
0
63
6
7
4
13
3
2
97
3
6
83
3
7
92
2
11
6
7
11
81
0
-
2
10
0
7
88
7
0
1
3
0
0
- 3
0
30
12
80
2
1
81
3
3
18
1
0
40
2
7
15
1
1
10
0
48
1
9
16
5
35
13
80
1
5
10
0
23
1
00
3
0
94
3
7
73
1
6
68
4
6
10
0
16
9
90
14
80
3
9
10
0
50
1
00
4
4
10
0
0
- 9
2
3
85
0
3
10
4
4
17
80
7
4
10
0
10
1
10
0
63
1
00
8
7
10
0
75
1
00
1
07
1
00
5
07
1
00
20
81
4
2
10
0
51
1
00
4
2
10
0
55
1
00
4
3
10
0
37
1
00
2
70
1
00
23
80
0
-
0
- 0
-
0
- 0
-
28
1
00
2
8
10
0
43
80
9
5
96
1
41
1
00
1
21
9
0
12
6
89
1
56
9
9
14
1
10
0
78
0
96
43
81
1
6
10
0
26
9
2
14
1
00
1
7
10
0
14
8
6
33
1
00
1
20
9
7
77
81
2
8
10
0
24
1
00
3
7
10
0
41
1
00
2
6
10
0
35
1
00
1
91
1
00
20
08
0
0
- 8
4
0
62
0
1
79
0
8
0
0
61
0
4
66
0
20
18
0
19
3
0
23
9
0
17
6
10
0
17
9
84
1
78
2
8
0
- 9
65
3
9
20
28
0
0
- 1
5
0
22
0
2
5
0
19
5
1
8
10
0
99
1
9
25
28
0
4
10
0
2
10
0
4
10
0
2
10
0
2
10
0
0
- 1
4
10
0
60
68
0
10
0
1
2
0
8
13
1
2
10
0
17
3
5
5
0
64
3
0
60
98
0
0
- 9
0
1
2
0
12
0
1
0
10
0
8
10
0
51
3
5
Ta
ble
1.2
.1(a
): T
ota
l n
um
be
r o
f b
iop
sy p
erf
orm
ed
an
d p
erc
en
tag
e o
f re
po
rte
d r
en
al
bio
psi
es
by
ce
ntr
es,
20
05
-20
10
OV
ERV
IEW
OF
REN
AL
BIO
PSY
IN M
ALA
YSI
A
4th
Re
po
rt o
f th
e
Ma
laysi
an
Re
gis
try o
f R
en
al B
iop
sy 2
01
0
OVERVIEW OF RENAL BIOPSY IN MALAYSIA 4th Report of the
Malaysian Registry of Renal Biopsy 2010
4
Ce
ntr
e
20
05
2
00
6
20
07
2
00
8
20
09
2
01
0
Tota
l
Do
ne
R
ep
ort
ed
D
on
e
Re
po
rte
d
Do
ne
R
ep
ort
ed
D
on
e
Re
po
rte
d
Do
ne
R
ep
ort
ed
D
on
e
Re
po
rte
d
Do
ne
R
ep
ort
ed
n
%
n
%
n
%
n
%
n
%
n
%
n
%
61
08
0
0
- 1
3
62
2
3
22
2
8
29
2
0
35
1
0
10
0
94
4
0
61
28
0
37
3
5
2
0
32
0
2
4
17
1
7
59
2
3
26
1
85
1
1
61
78
0
12
0
6
0
4
0
1
0
0
0
- 0
-
32
0
61
88
0
20
0
2
0
0
20
0
0
-
12
4
2
0
- 7
2
7
62
38
0
48
0
4
5
0
64
3
6
5
85
6
5
10
0
54
9
8
34
1
51
62
58
0
1
0
3
0
2
0
2
10
0
3
10
0
0
- 1
1
45
65
48
0
9
0
8
0
10
0
0
-
0
- 0
-
27
0
65
78
0
0
- 0
-
8
0
3
10
0
2
50
0
-
13
3
1
65
88
0
13
0
8
0
1
8
0
17
1
00
5
1
00
1
2
10
0
73
4
7
68
58
0
0
- 0
-
0
- 1
9
10
0
16
1
00
1
7
53
5
2
85
10
68
81
0
-
0
- 3
1
00
1
7
10
0
6
10
0
7
10
0
33
1
00
10
81
80
0
-
29
0
0
-
44
8
4
69
9
3
68
9
0
21
0
77
11
27
80
0
-
0
- 0
-
0
- 0
-
1
0
1
0
11
45
80
0
-
0
- 1
0
0
-
0
- 0
-
1
0
12
15
80
0
-
0
- 0
-
0
- 0
-
5
0
5
0
12
60
80
0
-
0
- 0
-
0
- 5
1
00
5
7
10
0
62
1
00
12
77
80
0
-
0
- 0
-
0
- 9
1
00
9
1
00
1
8
10
0
Tota
l 1
15
0
63
1
53
4
61
1
32
0
74
1
55
4
76
1
52
8
74
1
53
8
84
8
62
4
72
OV
ERV
IEW
OF
REN
AL
BIO
PSY
IN M
ALA
YSI
A
4th
Re
po
rt o
f th
e
Ma
laysi
an
Re
gis
try o
f R
en
al B
iop
sy 2
01
0
Ta
ble
1.2
.1(a
): T
ota
l n
um
be
r o
f b
iop
sy p
erf
orm
ed
an
d p
erc
en
tag
e o
f re
po
rte
d r
en
al
bio
psi
es
by
ce
ntr
es,
20
05
-20
10
(co
n’t
)
4th Report of the
Malaysian Registry of Renal Biopsy 2010 OVERVIEW OF RENAL BIOPSY IN MALAYSIA
5
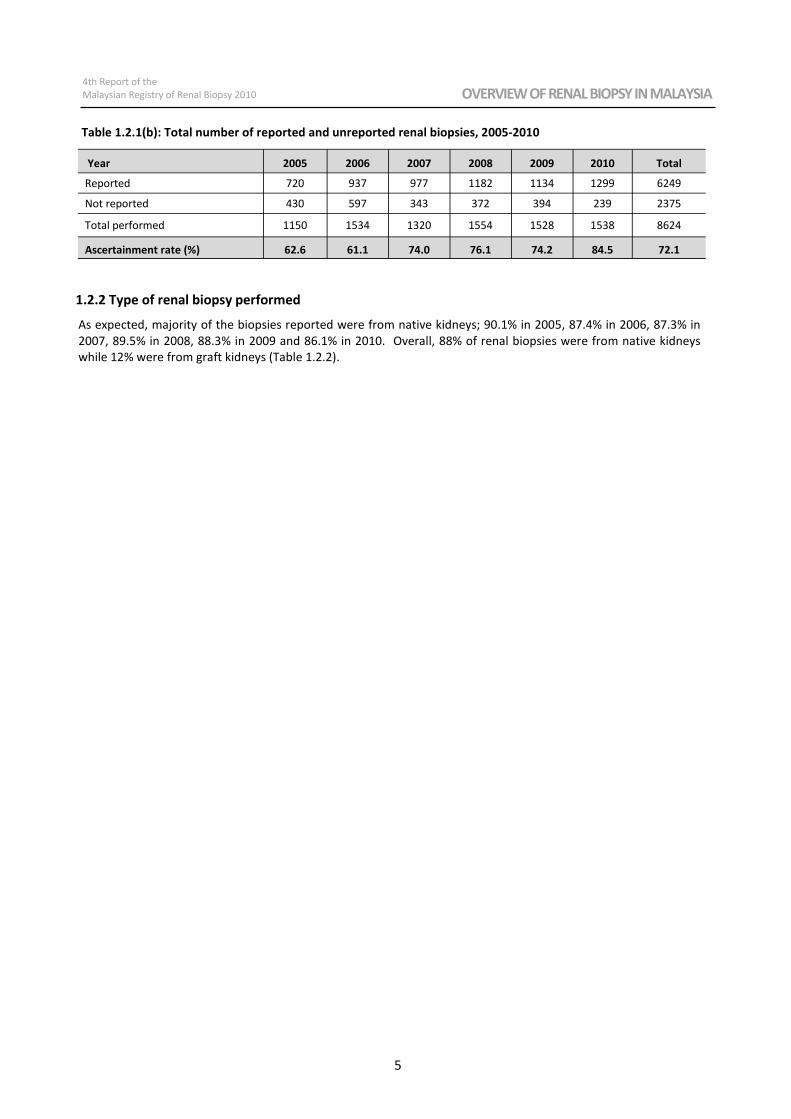
Table 1.2.1(b): Total number of reported and unreported renal biopsies, 2005-2010
Year 2005 2006 2007 2008 2009 2010 Total
Reported 720 937 977 1182 1134 1299 6249
Not reported 430 597 343 372 394 239 2375
Total performed 1150 1534 1320 1554 1528 1538 8624
Ascertainment rate (%) 62.6 61.1 74.0 76.1 74.2 84.5 72.1
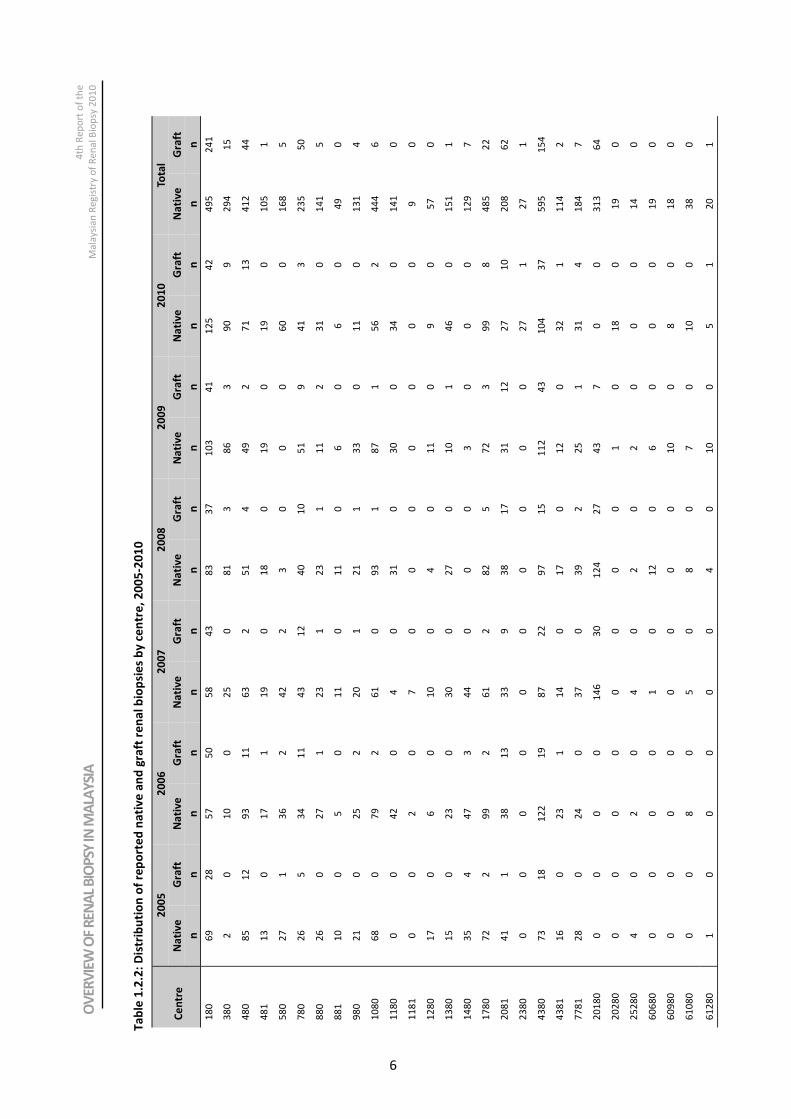
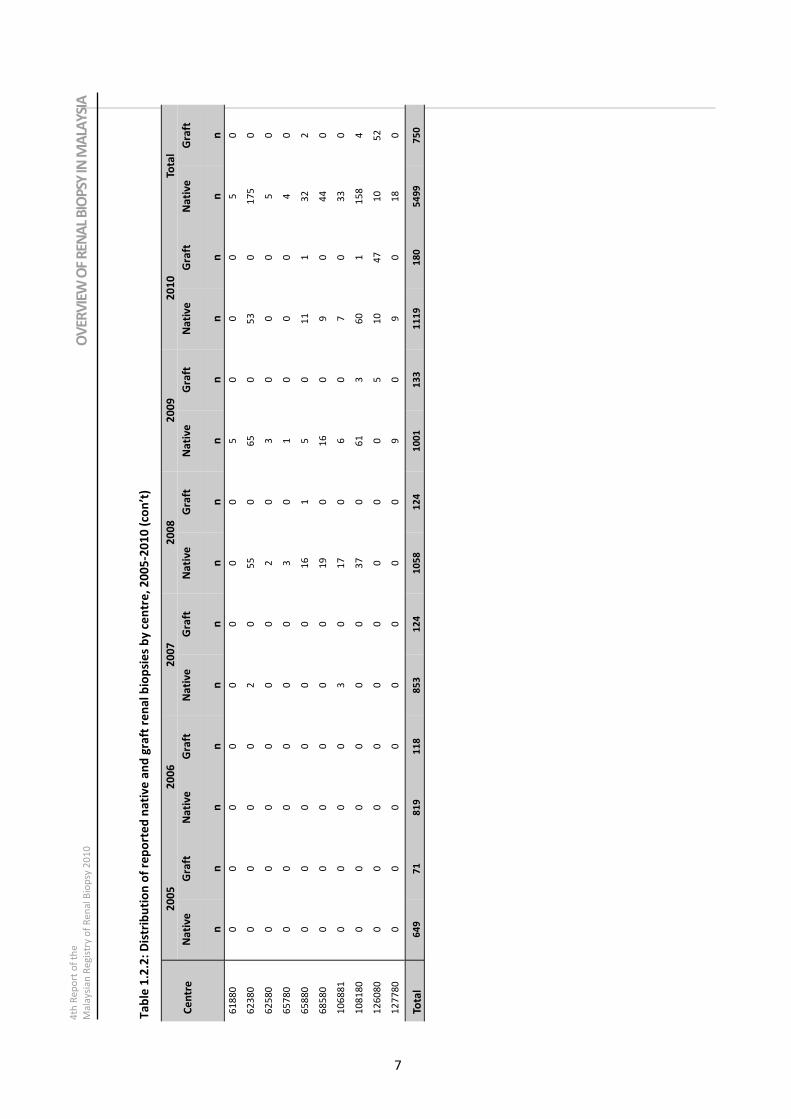
1.2.2 Type of renal biopsy performed
As expected, majority of the biopsies reported were from native kidneys; 90.1% in 2005, 87.4% in 2006, 87.3% in
2007, 89.5% in 2008, 88.3% in 2009 and 86.1% in 2010. Overall, 88% of renal biopsies were from native kidneys
while 12% were from graft kidneys (Table 1.2.2).
OVERVIEW OF RENAL BIOPSY IN MALAYSIA 4th Report of the
Malaysian Registry of Renal Biopsy 2010
6
Ce
ntr
e
20
05
2
00
6
20
07
2
00
8
20
09
2
01
0
Tota
l
Na
tiv
e
Gra
ft
Na
tiv
e
Gra
ft
Na
tiv
e
Gra
ft
Na
tiv
e
Gra
ft
Na
tiv
e
Gra
ft
Na
tiv
e
Gra
ft
Na
tiv
e
Gra
ft
n
n
n
n
n
n
n
n
n
n
n
n
n
n
18
0
69
2
8
57
5
0
58
4
3
83
3
7
10
3
41
1
25
4
2
49
5
24
1
38
0
2
0
10
0
2
5
0
81
3
8
6
3
90
9
2
94
1
5
48
0
85
1
2
93
1
1
63
2
5
1
4
49
2
7
1
13
4
12
4
4
48
1
13
0
1
7
1
19
0
1
8
0
19
0
1
9
0
10
5
1
58
0
27
1
3
6
2
42
2
3
0
0
0
6
0
0
16
8
5
78
0
26
5
3
4
11
4
3
12
4
0
10
5
1
9
41
3
2
35
5
0
88
0
26
0
2
7
1
23
1
2
3
1
11
2
3
1
0
14
1
5
88
1
10
0
5
0
1
1
0
11
0
6
0
6
0
4
9
0
98
0
21
0
2
5
2
20
1
2
1
1
33
0
1
1
0
13
1
4
10
80
6
8
0
79
2
6
1
0
93
1
8
7
1
56
2
4
44
6
11
80
0
0
4
2
0
4
0
31
0
3
0
0
34
0
1
41
0
11
81
0
0
2
0
7
0
0
0
0
0
0
0
9
0
12
80
1
7
0
6
0
10
0
4
0
1
1
0
9
0
57
0
13
80
1
5
0
23
0
3
0
0
27
0
1
0
1
46
0
1
51
1
14
80
3
5
4
47
3
4
4
0
0
0
3
0
0
0
12
9
7
17
80
7
2
2
99
2
6
1
2
82
5
7
2
3
99
8
4
85
2
2
20
81
4
1
1
38
1
3
33
9
3
8
17
3
1
12
2
7
10
2
08
6
2
23
80
0
0
0
0
0
0
0
0
0
0
2
7
1
27
1
43
80
7
3
18
1
22
1
9
87
2
2
97
1
5
11
2
43
1
04
3
7
59
5
15
4
43
81
1
6
0
23
1
1
4
0
17
0
1
2
0
32
1
1
14
2
77
81
2
8
0
24
0
3
7
0
39
2
2
5
1
31
4
1
84
7
20
18
0
0
0
0
0
14
6
30
1
24
2
7
43
7
0
0
3
13
6
4
20
28
0
0
0
0
0
0
0
0
0
1
0
18
0
1
9
0
25
28
0
4
0
2
0
4
0
2
0
2
0
0
0
14
0
60
68
0
0
0
0
0
1
0
12
0
6
0
0
0
1
9
0
60
98
0
0
0
0
0
0
0
0
0
10
0
8
0
1
8
0
61
08
0
0
0
8
0
5
0
8
0
7
0
10
0
3
8
0
61
28
0
1
0
0
0
0
0
4
0
10
0
5
1
2
0
1
Ta
ble
1.2
.2:
Dis
trib
uti
on
of
rep
ort
ed
na
tiv
e a
nd
gra
ft r
en
al
bio
psi
es
by
ce
ntr
e,
20
05
-20
10
OV
ERV
IEW
OF
REN
AL
BIO
PSY
IN M
ALA
YSI
A
4th
Re
po
rt o
f th
e
Ma
laysi
an
Re
gis
try o
f R
en
al B
iop
sy 2
01
0
4th Report of the
Malaysian Registry of Renal Biopsy 2010 OVERVIEW OF RENAL BIOPSY IN MALAYSIA
7
Ce
ntr
e
20
05
2
00
6
20
07
2
00
8
20
09
2
01
0
Tota
l
Na
tiv
e
Gra
ft
Na
tiv
e
Gra
ft
Na
tiv
e
Gra
ft
Na
tiv
e
Gra
ft
Na
tiv
e
Gra
ft
Na
tiv
e
Gra
ft
Na
tiv
e
Gra
ft
n
n
n
n
n
n
n
n
n
n
n
n
n
n
61
88
0
0
0
0
0
0
0
0
0
5
0
0
0
5
0
62
38
0
0
0
0
0
2
0
55
0
6
5
0
53
0
1
75
0
62
58
0
0
0
0
0
0
0
2
0
3
0
0
0
5
0
65
78
0
0
0
0
0
0
0
3
0
1
0
0
0
4
0
65
88
0
0
0
0
0
0
0
16
1
5
0
1
1
1
32
2
68
58
0
0
0
0
0
0
0
19
0
1
6
0
9
0
44
0
10
68
81
0
0
0
0
3
0
1
7
0
6
0
7
0
33
0
10
81
80
0
0
0
0
0
0
3
7
0
61
3
6
0
1
15
8
4
12
60
80
0
0
0
0
0
0
0
0
0
5
1
0
47
1
0
52
12
77
80
0
0
0
0
0
0
0
0
9
0
9
0
1
8
0
Tota
l 6
49
7
1
81
9
11
8
85
3
12
4
10
58
1
24
1
00
1
13
3
11
19
1
80
5
49
9
75
0
OV
ERV
IEW
OF
REN
AL
BIO
PSY
IN M
ALA
YSI
A
4th
Re
po
rt o
f th
e
Ma
laysi
an
Re
gis
try o
f R
en
al B
iop
sy 2
01
0
Ta
ble
1.2
.2:
Dis
trib
uti
on
of
rep
ort
ed
na
tiv
e a
nd
gra
ft r
en
al
bio
psi
es
by
ce
ntr
e,
20
05
-20
10
(co
n’t
)
OVERVIEW OF RENAL BIOPSY IN MALAYSIA 4th Report of the
Malaysian Registry of Renal Biopsy 2010
8
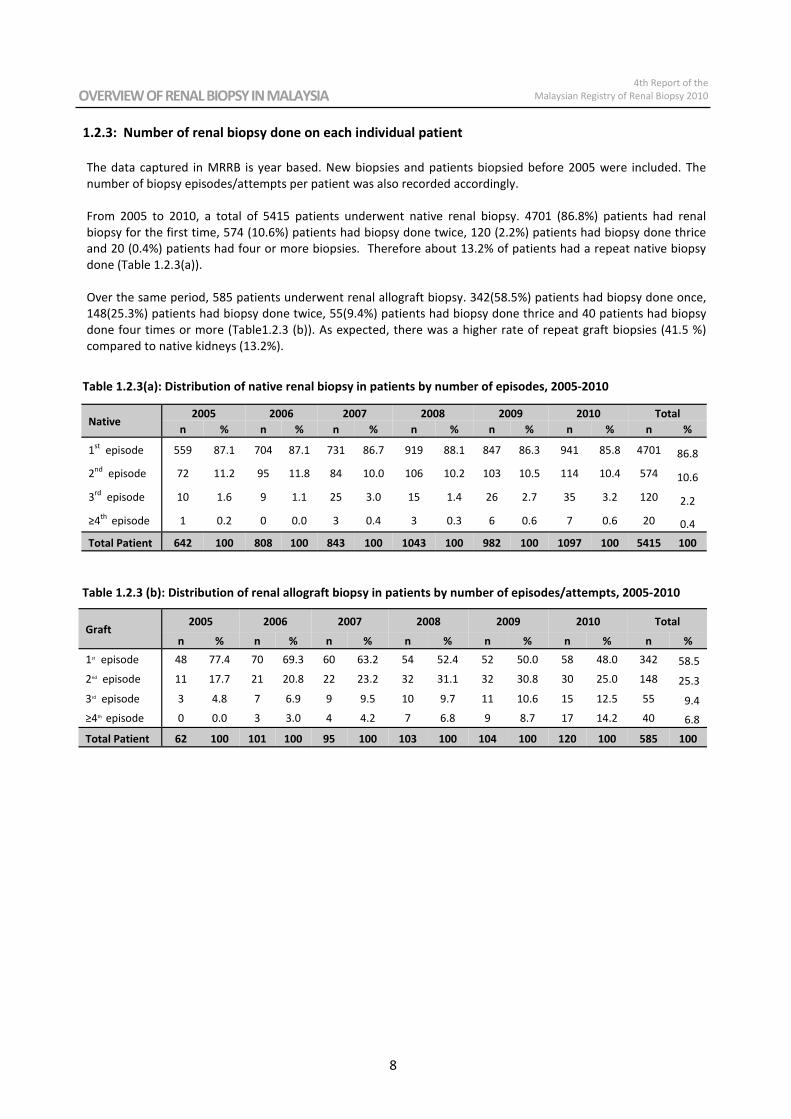
1.2.3: Number of renal biopsy done on each individual patient
The data captured in MRRB is year based. New biopsies and patients biopsied before 2005 were included. The
number of biopsy episodes/attempts per patient was also recorded accordingly.
From 2005 to 2010, a total of 5415 patients underwent native renal biopsy. 4701 (86.8%) patients had renal
biopsy for the first time, 574 (10.6%) patients had biopsy done twice, 120 (2.2%) patients had biopsy done thrice
and 20 (0.4%) patients had four or more biopsies. Therefore about 13.2% of patients had a repeat native biopsy
done (Table 1.2.3(a)).
Over the same period, 585 patients underwent renal allograft biopsy. 342(58.5%) patients had biopsy done once,
148(25.3%) patients had biopsy done twice, 55(9.4%) patients had biopsy done thrice and 40 patients had biopsy
done four times or more (Table1.2.3 (b)). As expected, there was a higher rate of repeat graft biopsies (41.5 %)
compared to native kidneys (13.2%).
Table 1.2.3(a): Distribution of native renal biopsy in patients by number of episodes, 2005-2010
Native 2005 2006 2007 2008 2009 2010 Total
n % n % n % n % n % n % n %
1st
episode 559 87.1 704 87.1 731 86.7 919 88.1 847 86.3 941 85.8 4701 86.8
2nd
episode 72 11.2 95 11.8 84 10.0 106 10.2 103 10.5 114 10.4 574 10.6
3rd
episode 10 1.6 9 1.1 25 3.0 15 1.4 26 2.7 35 3.2 120 2.2
≥4th
episode 1 0.2 0 0.0 3 0.4 3 0.3 6 0.6 7 0.6 20 0.4
Total Patient 642 100 808 100 843 100 1043 100 982 100 1097 100 5415 100
Table 1.2.3 (b): Distribution of renal allograft biopsy in patients by number of episodes/attempts, 2005-2010
Graft 2005 2006 2007 2008 2009 2010 Total
n % n % n % n % n % n % n %
1st episode 48 77.4 70 69.3 60 63.2 54 52.4 52 50.0 58 48.0 342 58.5
2nd episode 11 17.7 21 20.8 22 23.2 32 31.1 32 30.8 30 25.0 148 25.3
3rd episode 3 4.8 7 6.9 9 9.5 10 9.7 11 10.6 15 12.5 55 9.4
≥4th episode 0 0.0 3 3.0 4 4.2 7 6.8 9 8.7 17 14.2 40 6.8
Total Patient 62 100 101 100 95 100 103 100 104 100 120 100 585 100
4th Report of the
Malaysian Registry of Renal Biopsy 2010 OVERVIEW OF RENAL BIOPSY IN MALAYSIA
9
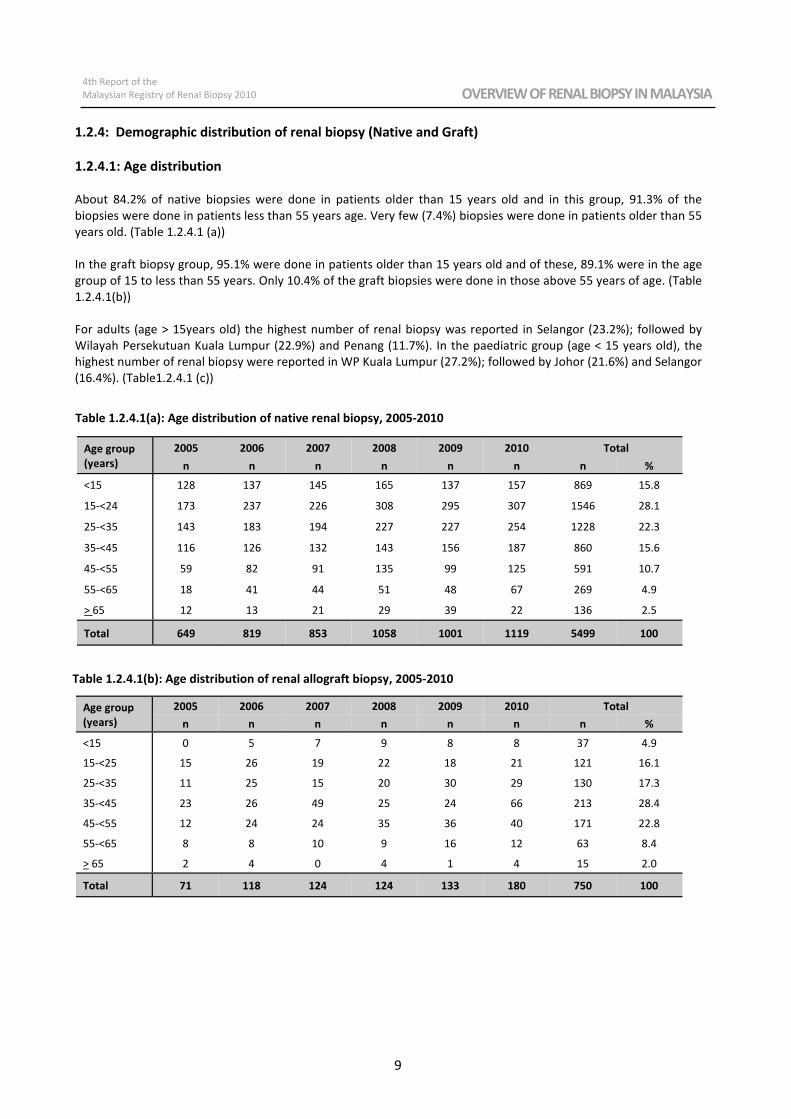
1.2.4: Demographic distribution of renal biopsy (Native and Graft)
1.2.4.1: Age distribution
About 84.2% of native biopsies were done in patients older than 15 years old and in this group, 91.3% of the
biopsies were done in patients less than 55 years age. Very few (7.4%) biopsies were done in patients older than 55
years old. (Table 1.2.4.1 (a))
In the graft biopsy group, 95.1% were done in patients older than 15 years old and of these, 89.1% were in the age
group of 15 to less than 55 years. Only 10.4% of the graft biopsies were done in those above 55 years of age. (Table
1.2.4.1(b))
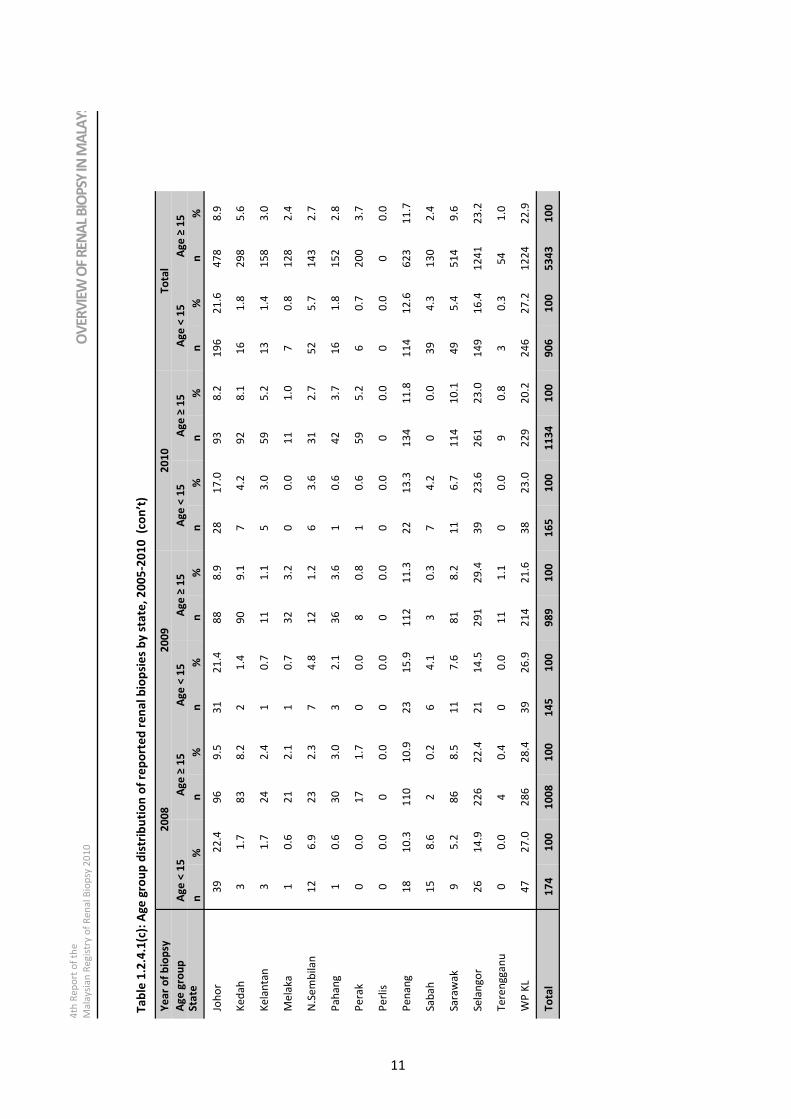
For adults (age > 15years old) the highest number of renal biopsy was reported in Selangor (23.2%); followed by
Wilayah Persekutuan Kuala Lumpur (22.9%) and Penang (11.7%). In the paediatric group (age < 15 years old), the
highest number of renal biopsy were reported in WP Kuala Lumpur (27.2%); followed by Johor (21.6%) and Selangor
(16.4%). (Table1.2.4.1 (c))
Table 1.2.4.1(a): Age distribution of native renal biopsy, 2005-2010
Age group
(years) 2005 2006 2007 2008 2009 2010 Total
n n n n n n n %
<15 128 137 145 165 137 157 869 15.8
15-<24 173 237 226 308 295 307 1546 28.1
25-<35 143 183 194 227 227 254 1228 22.3
35-<45 116 126 132 143 156 187 860 15.6
45-<55 59 82 91 135 99 125 591 10.7
55-<65 18 41 44 51 48 67 269 4.9
> 65 12 13 21 29 39 22 136 2.5
Total 649 819 853 1058 1001 1119 5499 100
Table 1.2.4.1(b): Age distribution of renal allograft biopsy, 2005-2010
Age group
(years) 2005 2006 2007 2008 2009 2010 Total
n n n n n n n %
<15 0 5 7 9 8 8 37 4.9
15-<25 15 26 19 22 18 21 121 16.1
25-<35 11 25 15 20 30 29 130 17.3
35-<45 23 26 49 25 24 66 213 28.4
45-<55 12 24 24 35 36 40 171 22.8
55-<65 8 8 10 9 16 12 63 8.4
> 65 2 4 0 4 1 4 15 2.0
Total 71 118 124 124 133 180 750 100

OVERVIEW OF RENAL BIOPSY IN MALAYSIA 4th Report of the
Malaysian Registry of Renal Biopsy 2010
10
Ta
ble
1.2
.4.1
(c):
Ag
e g
rou
p d
istr
ibu
tio
n o
f re
po
rte
d r
en
al
bio
psi
es
by
sta
te,
20
05
-20
10
Ye
ar
of
bio
psy
2
00
5
20
06
20
07
Ag
e g
p (
ye
ars
) A
ge
< 1
5
Ag
e ≥
15
Ag
e <
15
Ag
e ≥
15
Ag
e <
15
Ag
e ≥
15
Sta
te
n
%
n
%
n
%
n
%
n
%
n
%
Joh
or
29
2
2.7
6
7
11
.3
24
1
6.9
8
1
10
.2
45
2
9.6
5
3
6.4
Ke
da
h
0
0.0
2
0
.3
0
0.0
1
0
1.3
4
2
.6
21
2
.5
Ke
lan
tan
2
1.6
1
3
2.2
0
0
.0
23
2
.9
2
1.3
2
8
3.4
Me
lak
a
2
1.6
1
9
3.2
2
1
.4
25
3
.1
1
0.7
2
0
2.4
N.S
em
bil
an
11
8
.6
25
4
.2
6
4.2
2
7
3.4
1
0
6.6
2
5
3.0
Pa
ha
ng
0
0.0
0
0
.0
6
4.2
3
8
4.8
5
3
.3
6
0.7
Pe
rak
3
2.3
2
9
4.9
2
1
.4
38
4
.8
0
0.0
4
9
5.9
Pe
rlis
0
0
.0
0
0.0
0
0
.0
0
0.0
0
0
.0
0
0.0
Pe
na
ng
14
1
0.9
9
6
16
.2
18
1
2.7
1
04
1
3.1
1
9
12
.5
67
8
.1
Sa
ba
h
1
0.8
3
8
6.4
5
3
.5
45
5
.7
5
3.3
4
2
5.1
Sa
raw
ak
6
4.7
6
8
11
.5
8
5.6
1
01
1
2.7
4
2
.6
64
7
.8
Se
lan
go
r 1
7
13
.3
12
1
20
.4
29
2
0.4
1
81
2
2.8
1
7
11
.2
16
1
19
.5
Te
ren
gg
an
u
2
1.6
1
5
2.5
1
0
.7
5
0.6
0
0
.0
10
1
.2
WP
KL
41
3
2.0
9
9
16
.7
41
2
8.9
1
17
1
4.7
4
0
26
.3
27
9
33
.8
To
tal
12
8
10
0
59
2
10
0
14
2
10
0
79
5
10
0
15
2
10
0
82
5
10
0
OV
ERV
IEW
OF
REN
AL
BIO
PSY
IN M
ALA
YSI
A
4th
Re
po
rt o
f th
e
Ma
laysi
an
Re
gis
try o
f R
en
al B
iop
sy 2
01
0
4th Report of the
Malaysian Registry of Renal Biopsy 2010 OVERVIEW OF RENAL BIOPSY IN MALAYSIA
11
OV
ERV
IEW
OF
REN
AL
BIO
PSY
IN M
ALA
YSI
A
4th
Re
po
rt o
f th
e
Ma
laysi
an
Re
gis
try o
f R
en
al B
iop
sy 2
01
0
Ye
ar
of
bio
psy
2
00
8
20
09
2
01
0
To
tal
Ag
e g
rou
p
Ag
e <
15
A
ge
≥ 1
5
Ag
e <
15
A
ge
≥ 1
5
Ag
e <
15
A
ge
≥ 1
5
Ag
e <
15
A
ge
≥ 1
5
Sta
te
n
%
n
%
n
%
n
%
n
%
n
%
n
%
n
%
Joh
or
39
2
2.4
9
6
9.5
3
1
21
.4
88
8
.9
28
1
7.0
9
3
8.2
1
96
2
1.6
4
78
8
.9
Ke
da
h
3
1.7
8
3
8.2
2
1
.4
90
9
.1
7
4.2
9
2
8.1
1
6
1.8
2
98
5
.6
Ke
lan
tan
3
1.7
2
4
2.4
1
0
.7
11
1
.1
5
3.0
5
9
5.2
1
3
1.4
1
58
3
.0
Me
lak
a
1
0.6
2
1
2.1
1
0
.7
32
3
.2
0
0.0
1
1
1.0
7
0
.8
12
8
2.4
N.S
em
bil
an
12
6
.9
23
2
.3
7
4.8
1
2
1.2
6
3
.6
31
2
.7
52
5
.7
14
3
2.7
Pa
ha
ng
1
0.6
3
0
3.0
3
2
.1
36
3
.6
1
0.6
4
2
3.7
1
6
1.8
1
52
2
.8
Pe
rak
0
0.0
1
7
1.7
0
0
.0
8
0.8
1
0
.6
59
5
.2
6
0.7
2
00
3
.7
Pe
rlis
0
0
.0
0
0.0
0
0
.0
0
0.0
0
0
.0
0
0.0
0
0
.0
0
0.0
Pe
na
ng
18
1
0.3
1
10
1
0.9
2
3
15
.9
11
2
11
.3
22
1
3.3
1
34
1
1.8
1
14
1
2.6
6
23
1
1.7
Sa
ba
h
15
8
.6
2
0.2
6
4
.1
3
0.3
7
4
.2
0
0.0
3
9
4.3
1
30
2
.4
Sa
raw
ak
9
5.2
8
6
8.5
1
1
7.6
8
1
8.2
1
1
6.7
1
14
1
0.1
4
9
5.4
5
14
9
.6
Se
lan
go
r 2
6
14
.9
22
6
22
.4
21
1
4.5
2
91
2
9.4
3
9
23
.6
26
1
23
.0
14
9
16
.4
12
41
2
3.2
Te
ren
gg
an
u
0
0.0
4
0
.4
0
0.0
1
1
1.1
0
0
.0
9
0.8
3
0
.3
54
1
.0
WP
KL
47
2
7.0
2
86
2
8.4
3
9
26
.9
21
4
21
.6
38
2
3.0
2
29
2
0.2
2
46
2
7.2
1
22
4
22
.9
To
tal
17
4
10
0
10
08
1
00
1
45
1
00
9
89
1
00
1
65
1
00
1
13
4
10
0
90
6
10
0
53
43
1
00
Ta
ble
1.2
.4.1
(c):
Ag
e g
rou
p d
istr
ibu
tio
n o
f re
po
rte
d r
en
al
bio
psi
es
by
sta
te,
20
05
-20
10
(c
on
’t)
OVERVIEW OF RENAL BIOPSY IN MALAYSIA 4th Report of the
Malaysian Registry of Renal Biopsy 2010
12
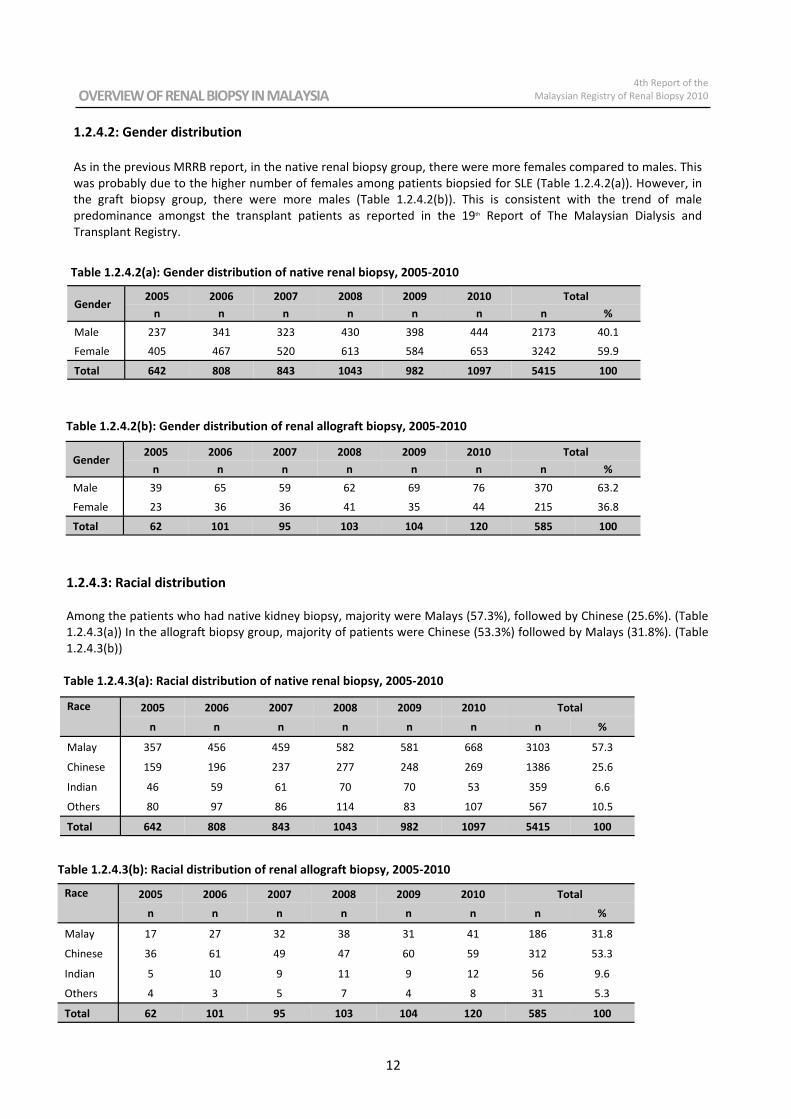
1.2.4.2: Gender distribution
As in the previous MRRB report, in the native renal biopsy group, there were more females compared to males. This
was probably due to the higher number of females among patients biopsied for SLE (Table 1.2.4.2(a)). However, in
the graft biopsy group, there were more males (Table 1.2.4.2(b)). This is consistent with the trend of male
predominance amongst the transplant patients as reported in the 19th Report of The Malaysian Dialysis and
Transplant Registry.
Table 1.2.4.2(a): Gender distribution of native renal biopsy, 2005-2010
Gender 2005 2006 2007 2008 2009 2010 Total
n n n n n n n %
Male 237 341 323 430 398 444 2173 40.1
Female 405 467 520 613 584 653 3242 59.9
Total 642 808 843 1043 982 1097 5415 100
Table 1.2.4.2(b): Gender distribution of renal allograft biopsy, 2005-2010
Gender 2005 2006 2007 2008 2009 2010 Total
n n n n n n n %
Male 39 65 59 62 69 76 370 63.2
Female 23 36 36 41 35 44 215 36.8
Total 62 101 95 103 104 120 585 100
1.2.4.3: Racial distribution
Among the patients who had native kidney biopsy, majority were Malays (57.3%), followed by Chinese (25.6%). (Table
1.2.4.3(a)) In the allograft biopsy group, majority of patients were Chinese (53.3%) followed by Malays (31.8%). (Table
1.2.4.3(b))
Table 1.2.4.3(a): Racial distribution of native renal biopsy, 2005-2010
Race 2005 2006 2007 2008 2009 2010 Total
n n n n n n n %
Malay 357 456 459 582 581 668 3103 57.3
Chinese 159 196 237 277 248 269 1386 25.6
Indian 46 59 61 70 70 53 359 6.6
Others 80 97 86 114 83 107 567 10.5
Total 642 808 843 1043 982 1097 5415 100
Table 1.2.4.3(b): Racial distribution of renal allograft biopsy, 2005-2010
Race 2005 2006 2007 2008 2009 2010 Total
n n n n n n n %
Malay 17 27 32 38 31 41 186 31.8
Chinese 36 61 49 47 60 59 312 53.3
Indian 5 10 9 11 9 12 56 9.6
Others 4 3 5 7 4 8 31 5.3
Total 62 101 95 103 104 120 585 100
4th Report of the
Malaysian Registry of Renal Biopsy 2010 OVERVIEW OF RENAL BIOPSY IN MALAYSIA
13
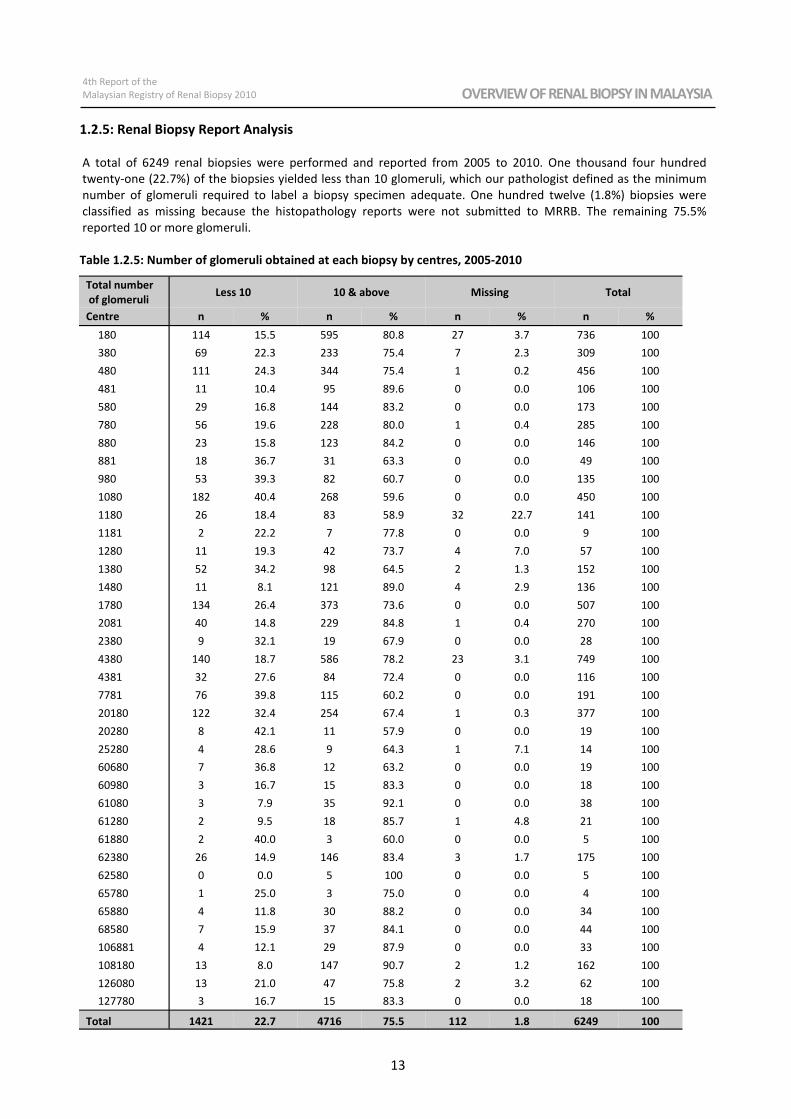
1.2.5: Renal Biopsy Report Analysis
A total of 6249 renal biopsies were performed and reported from 2005 to 2010. One thousand four hundred
twenty-one (22.7%) of the biopsies yielded less than 10 glomeruli, which our pathologist defined as the minimum
number of glomeruli required to label a biopsy specimen adequate. One hundred twelve (1.8%) biopsies were
classified as missing because the histopathology reports were not submitted to MRRB. The remaining 75.5%
reported 10 or more glomeruli.
Table 1.2.5: Number of glomeruli obtained at each biopsy by centres, 2005-2010
Total number
of glomeruli Less 10 10 & above Missing Total
Centre n % n % n % n %
180 114 15.5 595 80.8 27 3.7 736 100
380 69 22.3 233 75.4 7 2.3 309 100
480 111 24.3 344 75.4 1 0.2 456 100
481 11 10.4 95 89.6 0 0.0 106 100
580 29 16.8 144 83.2 0 0.0 173 100
780 56 19.6 228 80.0 1 0.4 285 100
880 23 15.8 123 84.2 0 0.0 146 100
881 18 36.7 31 63.3 0 0.0 49 100
980 53 39.3 82 60.7 0 0.0 135 100
1080 182 40.4 268 59.6 0 0.0 450 100
1180 26 18.4 83 58.9 32 22.7 141 100
1181 2 22.2 7 77.8 0 0.0 9 100
1280 11 19.3 42 73.7 4 7.0 57 100
1380 52 34.2 98 64.5 2 1.3 152 100
1480 11 8.1 121 89.0 4 2.9 136 100
1780 134 26.4 373 73.6 0 0.0 507 100
2081 40 14.8 229 84.8 1 0.4 270 100
2380 9 32.1 19 67.9 0 0.0 28 100
4380 140 18.7 586 78.2 23 3.1 749 100
4381 32 27.6 84 72.4 0 0.0 116 100
7781 76 39.8 115 60.2 0 0.0 191 100
20180 122 32.4 254 67.4 1 0.3 377 100
20280 8 42.1 11 57.9 0 0.0 19 100
25280 4 28.6 9 64.3 1 7.1 14 100
60680 7 36.8 12 63.2 0 0.0 19 100
60980 3 16.7 15 83.3 0 0.0 18 100
61080 3 7.9 35 92.1 0 0.0 38 100
61280 2 9.5 18 85.7 1 4.8 21 100
61880 2 40.0 3 60.0 0 0.0 5 100
62380 26 14.9 146 83.4 3 1.7 175 100
62580 0 0.0 5 100 0 0.0 5 100
65780 1 25.0 3 75.0 0 0.0 4 100
65880 4 11.8 30 88.2 0 0.0 34 100
68580 7 15.9 37 84.1 0 0.0 44 100
106881 4 12.1 29 87.9 0 0.0 33 100
108180 13 8.0 147 90.7 2 1.2 162 100
126080 13 21.0 47 75.8 2 3.2 62 100
127780 3 16.7 15 83.3 0 0.0 18 100
Total 1421 22.7 4716 75.5 112 1.8 6249 100

OVERVIEW OF RENAL BIOPSY IN MALAYSIA 4th Report of the
Malaysian Registry of Renal Biopsy 2010
14
1.2.6: Histopathology specimen distribution to histopathology laboratories
As shown in Table 1.2.6 (a) and (b), not all biopsies performed at the centres were read by the local
histo-pathologists. A number of the renal biopsy specimens were sent to other centres for processing and
reporting. A total of 47.8% of HPE slides were read locally and 52.2% were sent to another laboratory (Table 1.2.6
(c)). The histopathology laboratories were coded alphabetically (Table 1.2.6 (d)).
Table 1.2.6 (a): Distribution of biopsy specimens to local histopathology laboratories by participating centres,
2005-2010
Centre
Local histopathology laboratories
2005 2006 2007 2008 2009 2010 Total
n % n % n % n % n % n % n %
180 58 7.9 58 7.9 98 13.3 116 15.8 141 19.2 166 22.6 637 86.5
380 - - - - - - - - - - - - - -
480 90 19.7 98 21.5 31 6.8 15 3.3 41 9.0 82 18.0 357 78.3
481 13 12.3 17 16.0 11 10.4 1 0.9 11 10.4 19 17.9 72 67.9
580 26 15.0 37 21.4 44 25.4 3 1.7 0 0.0 54 31.2 164 94.8
780 - - - - - - - - - - - - - -
880 8 5.5 7 4.8 8 5.5 6 4.1 8 5.5 15 10.3 52 35.6
881 8 16.3 5 10.2 8 16.3 11 22.4 6 12.2 6 12.2 44 89.8
980 21 15.6 26 19.3 21 15.6 22 16.3 33 24.4 11 8.1 134 99.3
1080 68 15.1 81 18.0 60 13.3 94 20.9 88 19.6 58 12.9 449 99.8
1180 0 0.0 11 7.8 0 0.0 0 0.0 0 0.0 0 0.0 11 7.8
1181 - - - - - - - - - - - - - -
1280 17 29.8 6 10.5 10 17.5 3 5.3 11 19.3 9 15.8 56 98.2
1380 0 0.0 0 0.0 10 6.6 24 15.8 3 2.0 41 27.0 78 51.3
1480 - - - - - - - - - - - - - -
1780 - - - - - - - - - - - - - -
2081 36 13.3 37 13.7 41 15.2 52 19.3 43 15.9 36 13.3 245 90.7
2380 - - - - - - - - - - - - - -
4380 8 1.1 16 2.1 1 0.1 2 0.3 31 4.1 28 3.7 86 11.5
4381 2 1.7 0 0.0 0 0.0 1 0.9 0 0.0 19 16.4 22 19.0
7781 - - - - - - - - - - - - - -
20180 0 0.0 0 0.0 175 46.4 150 39.8 49 13.0 0 0.0 374 99.2
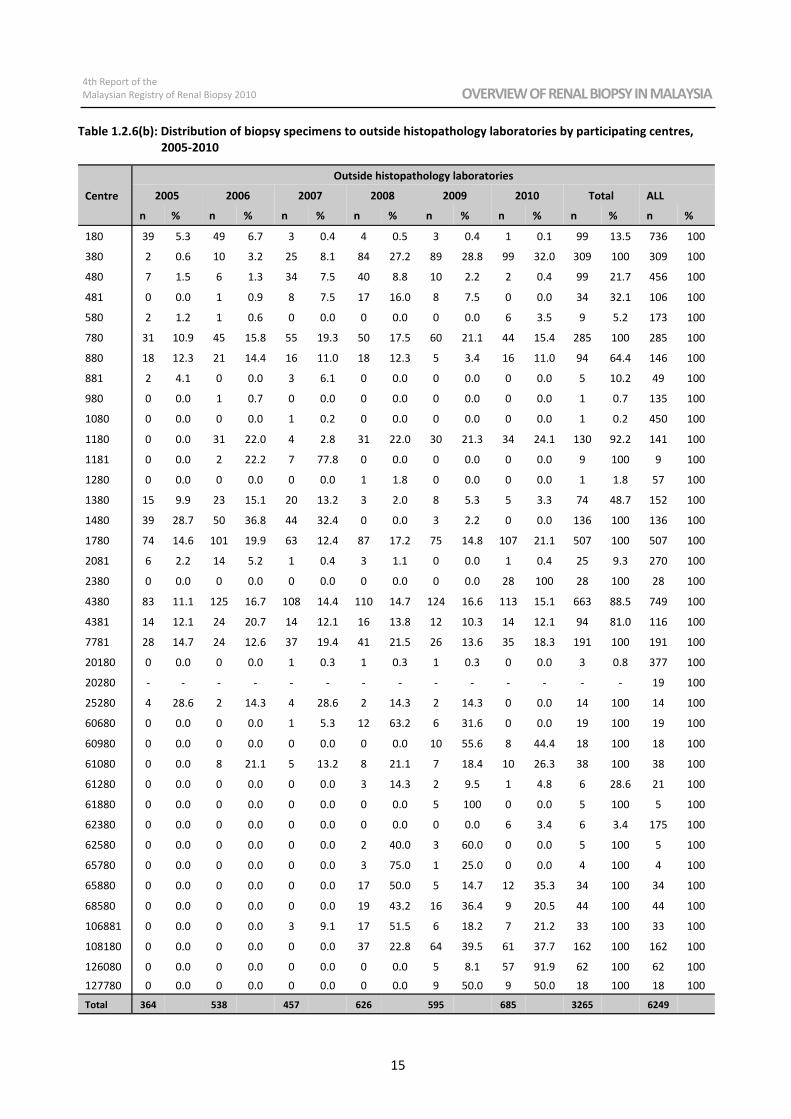
4th Report of the
Malaysian Registry of Renal Biopsy 2010 OVERVIEW OF RENAL BIOPSY IN MALAYSIA
15
Table 1.2.6(b): Distribution of biopsy specimens to outside histopathology laboratories by participating centres,
2005-2010
Centre
Outside histopathology laboratories
2005 2006 2007 2008 2009 2010 Total ALL
n % n % n % n % n % n % n % n %
180 39 5.3 49 6.7 3 0.4 4 0.5 3 0.4 1 0.1 99 13.5 736 100
380 2 0.6 10 3.2 25 8.1 84 27.2 89 28.8 99 32.0 309 100 309 100
480 7 1.5 6 1.3 34 7.5 40 8.8 10 2.2 2 0.4 99 21.7 456 100
481 0 0.0 1 0.9 8 7.5 17 16.0 8 7.5 0 0.0 34 32.1 106 100
580 2 1.2 1 0.6 0 0.0 0 0.0 0 0.0 6 3.5 9 5.2 173 100
780 31 10.9 45 15.8 55 19.3 50 17.5 60 21.1 44 15.4 285 100 285 100
880 18 12.3 21 14.4 16 11.0 18 12.3 5 3.4 16 11.0 94 64.4 146 100
881 2 4.1 0 0.0 3 6.1 0 0.0 0 0.0 0 0.0 5 10.2 49 100
980 0 0.0 1 0.7 0 0.0 0 0.0 0 0.0 0 0.0 1 0.7 135 100
1080 0 0.0 0 0.0 1 0.2 0 0.0 0 0.0 0 0.0 1 0.2 450 100
1180 0 0.0 31 22.0 4 2.8 31 22.0 30 21.3 34 24.1 130 92.2 141 100
1181 0 0.0 2 22.2 7 77.8 0 0.0 0 0.0 0 0.0 9 100 9 100
1280 0 0.0 0 0.0 0 0.0 1 1.8 0 0.0 0 0.0 1 1.8 57 100
1380 15 9.9 23 15.1 20 13.2 3 2.0 8 5.3 5 3.3 74 48.7 152 100
1480 39 28.7 50 36.8 44 32.4 0 0.0 3 2.2 0 0.0 136 100 136 100
1780 74 14.6 101 19.9 63 12.4 87 17.2 75 14.8 107 21.1 507 100 507 100
2081 6 2.2 14 5.2 1 0.4 3 1.1 0 0.0 1 0.4 25 9.3 270 100
2380 0 0.0 0 0.0 0 0.0 0 0.0 0 0.0 28 100 28 100 28 100
4380 83 11.1 125 16.7 108 14.4 110 14.7 124 16.6 113 15.1 663 88.5 749 100
4381 14 12.1 24 20.7 14 12.1 16 13.8 12 10.3 14 12.1 94 81.0 116 100
7781 28 14.7 24 12.6 37 19.4 41 21.5 26 13.6 35 18.3 191 100 191 100
20180 0 0.0 0 0.0 1 0.3 1 0.3 1 0.3 0 0.0 3 0.8 377 100
20280 - - - - - - - - - - - - - - 19 100
25280 4 28.6 2 14.3 4 28.6 2 14.3 2 14.3 0 0.0 14 100 14 100
60680 0 0.0 0 0.0 1 5.3 12 63.2 6 31.6 0 0.0 19 100 19 100
60980 0 0.0 0 0.0 0 0.0 0 0.0 10 55.6 8 44.4 18 100 18 100
61080 0 0.0 8 21.1 5 13.2 8 21.1 7 18.4 10 26.3 38 100 38 100
61280 0 0.0 0 0.0 0 0.0 3 14.3 2 9.5 1 4.8 6 28.6 21 100
61880 0 0.0 0 0.0 0 0.0 0 0.0 5 100 0 0.0 5 100 5 100
62380 0 0.0 0 0.0 0 0.0 0 0.0 0 0.0 6 3.4 6 3.4 175 100
62580 0 0.0 0 0.0 0 0.0 2 40.0 3 60.0 0 0.0 5 100 5 100
65780 0 0.0 0 0.0 0 0.0 3 75.0 1 25.0 0 0.0 4 100 4 100
65880 0 0.0 0 0.0 0 0.0 17 50.0 5 14.7 12 35.3 34 100 34 100
68580 0 0.0 0 0.0 0 0.0 19 43.2 16 36.4 9 20.5 44 100 44 100
106881 0 0.0 0 0.0 3 9.1 17 51.5 6 18.2 7 21.2 33 100 33 100
108180 0 0.0 0 0.0 0 0.0 37 22.8 64 39.5 61 37.7 162 100 162 100
126080 0 0.0 0 0.0 0 0.0 0 0.0 5 8.1 57 91.9 62 100 62 100
127780 0 0.0 0 0.0 0 0.0 0 0.0 9 50.0 9 50.0 18 100 18 100
Total 364 538 457 626 595 685 3265 6249
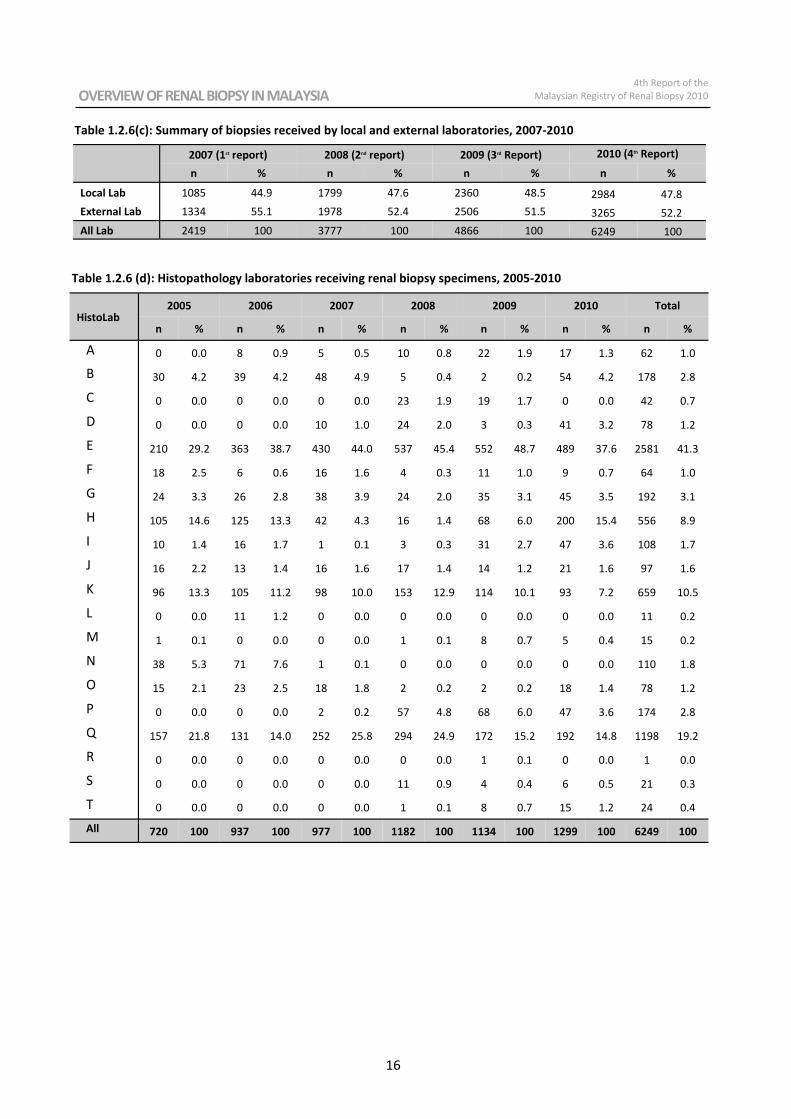
OVERVIEW OF RENAL BIOPSY IN MALAYSIA 4th Report of the
Malaysian Registry of Renal Biopsy 2010
16
Table 1.2.6(c): Summary of biopsies received by local and external laboratories, 2007-2010
2007 (1st report) 2008 (2nd report) 2009 (3rd Report) 2010 (4th Report)
n % n % n % n %
Local Lab 1085 44.9 1799 47.6 2360 48.5 2984 47.8
External Lab 1334 55.1 1978 52.4 2506 51.5 3265 52.2
All Lab 2419 100 3777 100 4866 100 6249 100
Table 1.2.6 (d): Histopathology laboratories receiving renal biopsy specimens, 2005-2010
HistoLab 2005 2006 2007 2008 2009 2010 Total
n % n % n % n % n % n % n %
A 0 0.0 8 0.9 5 0.5 10 0.8 22 1.9 17 1.3 62 1.0
B 30 4.2 39 4.2 48 4.9 5 0.4 2 0.2 54 4.2 178 2.8
C 0 0.0 0 0.0 0 0.0 23 1.9 19 1.7 0 0.0 42 0.7
D 0 0.0 0 0.0 10 1.0 24 2.0 3 0.3 41 3.2 78 1.2
E 210 29.2 363 38.7 430 44.0 537 45.4 552 48.7 489 37.6 2581 41.3
F 18 2.5 6 0.6 16 1.6 4 0.3 11 1.0 9 0.7 64 1.0
G 24 3.3 26 2.8 38 3.9 24 2.0 35 3.1 45 3.5 192 3.1
H 105 14.6 125 13.3 42 4.3 16 1.4 68 6.0 200 15.4 556 8.9
I 10 1.4 16 1.7 1 0.1 3 0.3 31 2.7 47 3.6 108 1.7
J 16 2.2 13 1.4 16 1.6 17 1.4 14 1.2 21 1.6 97 1.6
K 96 13.3 105 11.2 98 10.0 153 12.9 114 10.1 93 7.2 659 10.5
L 0 0.0 11 1.2 0 0.0 0 0.0 0 0.0 0 0.0 11 0.2
M 1 0.1 0 0.0 0 0.0 1 0.1 8 0.7 5 0.4 15 0.2
N 38 5.3 71 7.6 1 0.1 0 0.0 0 0.0 0 0.0 110 1.8
O 15 2.1 23 2.5 18 1.8 2 0.2 2 0.2 18 1.4 78 1.2
P 0 0.0 0 0.0 2 0.2 57 4.8 68 6.0 47 3.6 174 2.8
Q 157 21.8 131 14.0 252 25.8 294 24.9 172 15.2 192 14.8 1198 19.2
R 0 0.0 0 0.0 0 0.0 0 0.0 1 0.1 0 0.0 1 0.0
S 0 0.0 0 0.0 0 0.0 11 0.9 4 0.4 6 0.5 21 0.3
T 0 0.0 0 0.0 0 0.0 1 0.1 8 0.7 15 1.2 24 0.4
All 720 100 937 100 977 100 1182 100 1134 100 1299 100 6249 100
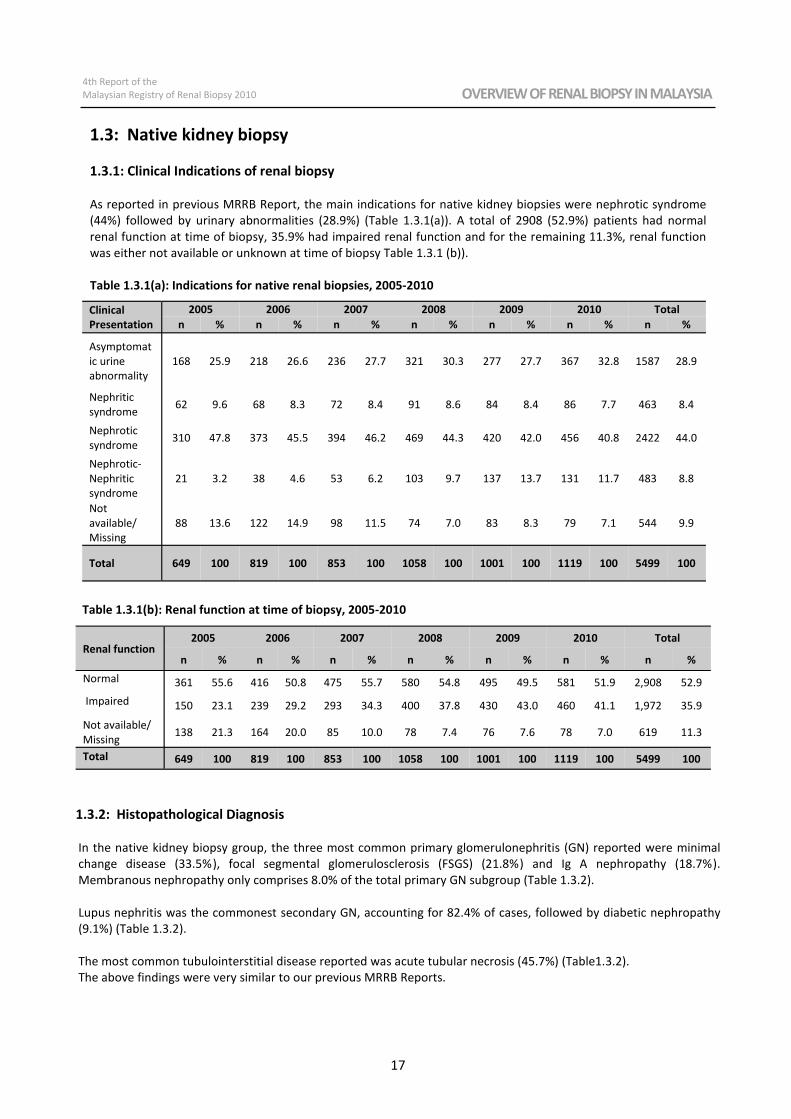
4th Report of the
Malaysian Registry of Renal Biopsy 2010 OVERVIEW OF RENAL BIOPSY IN MALAYSIA
17
1.3: Native kidney biopsy
1.3.1: Clinical Indications of renal biopsy
As reported in previous MRRB Report, the main indications for native kidney biopsies were nephrotic syndrome
(44%) followed by urinary abnormalities (28.9%) (Table 1.3.1(a)). A total of 2908 (52.9%) patients had normal
renal function at time of biopsy, 35.9% had impaired renal function and for the remaining 11.3%, renal function
was either not available or unknown at time of biopsy Table 1.3.1 (b)).
Table 1.3.1(a): Indications for native renal biopsies, 2005-2010
Clinical
Presentation 2005 2006 2007 2008 2009 2010 Total
n % n % n % n % n % n % n %
Asymptomat
ic urine
abnormality 168 25.9 218 26.6 236 27.7 321 30.3 277 27.7 367 32.8 1587 28.9
Nephritic
syndrome 62 9.6 68 8.3 72 8.4 91 8.6 84 8.4 86 7.7 463 8.4
Nephrotic
syndrome 310 47.8 373 45.5 394 46.2 469 44.3 420 42.0 456 40.8 2422 44.0
Nephrotic-
Nephritic
syndrome 21 3.2 38 4.6 53 6.2 103 9.7 137 13.7 131 11.7 483 8.8
Not
available/
Missing 88 13.6 122 14.9 98 11.5 74 7.0 83 8.3 79 7.1 544 9.9
Total 649 100 819 100 853 100 1058 100 1001 100 1119 100 5499 100
Table 1.3.1(b): Renal function at time of biopsy, 2005-2010
Renal function 2005 2006 2007 2008 2009 2010 Total
n % n % n % n % n % n % n %
Normal 361 55.6 416 50.8 475 55.7 580 54.8 495 49.5 581 51.9 2,908 52.9
Impaired 150 23.1 239 29.2 293 34.3 400 37.8 430 43.0 460 41.1 1,972 35.9
Not available/
Missing 138 21.3 164 20.0 85 10.0 78 7.4 76 7.6 78 7.0 619 11.3
Total 649 100 819 100 853 100 1058 100 1001 100 1119 100 5499 100
1.3.2: Histopathological Diagnosis
In the native kidney biopsy group, the three most common primary glomerulonephritis (GN) reported were minimal
change disease (33.5%), focal segmental glomerulosclerosis (FSGS) (21.8%) and Ig A nephropathy (18.7%).
Membranous nephropathy only comprises 8.0% of the total primary GN subgroup (Table 1.3.2).
Lupus nephritis was the commonest secondary GN, accounting for 82.4% of cases, followed by diabetic nephropathy
(9.1%) (Table 1.3.2).
The most common tubulointerstitial disease reported was acute tubular necrosis (45.7%) (Table1.3.2).
The above findings were very similar to our previous MRRB Reports.
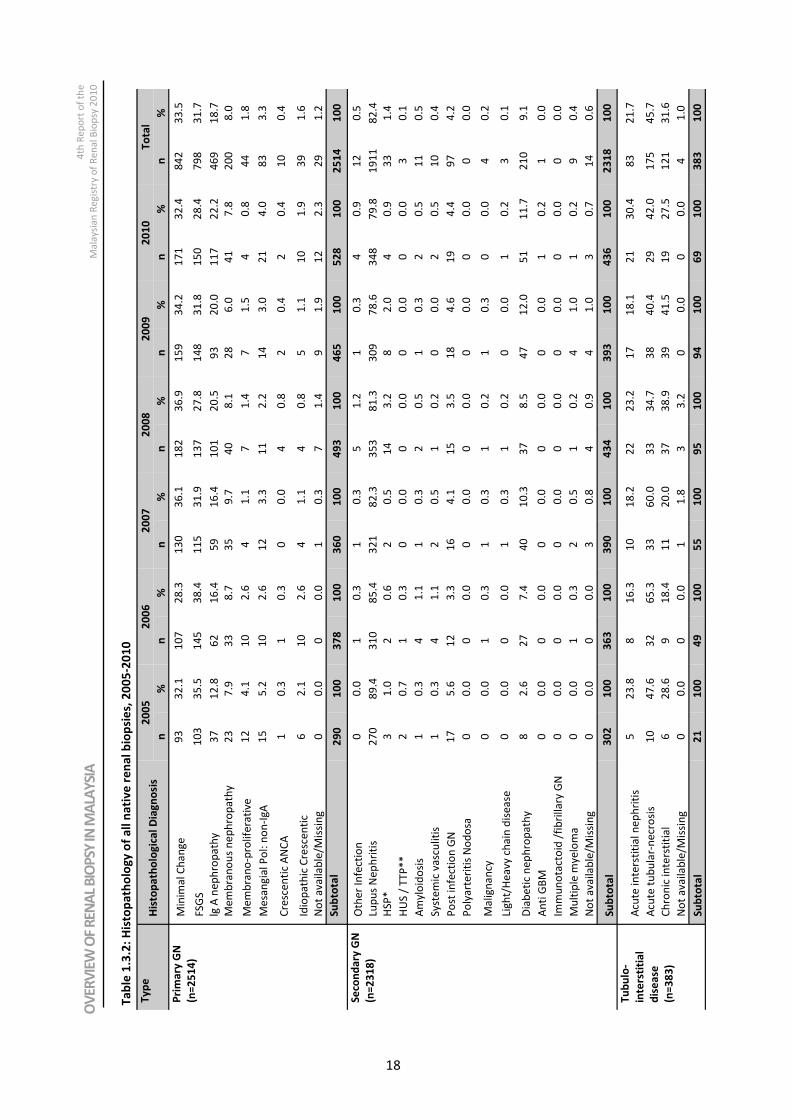
OVERVIEW OF RENAL BIOPSY IN MALAYSIA 4th Report of the
Malaysian Registry of Renal Biopsy 2010
18
OV
ERV
IEW
OF
REN
AL
BIO
PSY
IN M
ALA
YSI
A
4th
Re
po
rt o
f th
e
Ma
laysi
an
Re
gis
try o
f R
en
al B
iop
sy 2
01
0
Ty
pe
His
top
ath
olo
gic
al
Dia
gn
osi
s 2
00
5
20
06
20
07
20
08
20
09
20
10
To
tal
n
%
n
%
n
%
n
%
n
%
n
%
n
%
Pri
ma
ry G
N
(n=
25
14
) M
inim
al
Ch
an
ge
93
32
.1
10
7
28
.3
13
0
36
.1
18
2
36
.9
15
9
34
.2
17
1
32
.4
84
2
33
.5
FS
GS
10
3
35
.5
14
5
38
.4
11
5
31
.9
13
7
27
.8
14
8
31
.8
15
0
28
.4
79
8
31
.7
lg A
ne
ph
rop
ath
y
37
12
.8
62
16
.4
59
16
.4
10
1
20
.5
93
20
.0
11
7
22
.2
46
9
18
.7
Me
mb
ran
ou
s n
ep
hro
pa
thy
23
7.9
3
3
8.7
3
5
9.7
4
0
8.1
2
8
6.0
4
1
7.8
2
00
8.0
Me
mb
ran
o-p
roli
fera
tiv
e
12
4.1
1
0
2.6
4
1.1
7
1.4
7
1.5
4
0.8
4
4
1.8
Me
san
gia
l P
ol:
no
n-I
gA
1
5
5.2
1
0
2.6
1
2
3.3
1
1
2.2
1
4
3.0
2
1
4.0
8
3
3.3
Cre
sce
nti
c A
NC
A
1
0.3
1
0.3
0
0.0
4
0.8
2
0.4
2
0.4
1
0
0.4
Idio
pa
thic
Cre
sce
nti
c 6
2.1
1
0
2.6
4
1.1
4
0.8
5
1.1
1
0
1.9
3
9
1.6
No
t a
va
ila
ble
/Mis
sin
g
0
0.0
0
0.0
1
0.3
7
1.4
9
1.9
1
2
2.3
2
9
1.2
S
ub
tota
l 2
90
10
0
37
8
10
0
36
0
10
0
49
3
10
0
46
5
10
0
52
8
10
0
25
14
10
0
Se
con
da
ry G
N
(n=
23
18
) O
the
r In
fect
ion
0
0.0
1
0.3
1
0.3
5
1.2
1
0.3
4
0.9
1
2
0.5
Lu
pu
s N
ep
hri
tis
27
0
89
.4
31
0
85
.4
32
1
82
.3
35
3
81
.3
30
9
78
.6
34
8
79
.8
19
11
82
.4
HS
P*
3
1.0
2
0.6
2
0.5
1
4
3.2
8
2.0
4
0.9
3
3
1.4
H
US
/ T
TP
**
2
0.7
1
0.3
0
0.0
0
0.0
0
0.0
0
0.0
3
0.1
Am
ylo
ido
sis
1
0.3
4
1.1
1
0.3
2
0.5
1
0.3
2
0.5
1
1
0.5
Sy
ste
mic
va
scu
liti
s 1
0.3
4
1.1
2
0.5
1
0.2
0
0.0
2
0.5
1
0
0.4
Po
st i
nfe
ctio
n G
N
17
5.6
1
2
3.3
1
6
4.1
1
5
3.5
1
8
4.6
1
9
4.4
9
7
4.2
Po
lya
rte
riti
s N
od
osa
0
0.0
0
0.0
0
0.0
0
0.0
0
0.0
0
0.0
0
0.0
Ma
lig
na
ncy
0
0.0
1
0.3
1
0.3
1
0.2
1
0.3
0
0.0
4
0.2
Lig
ht/
He
av
y c
ha
in d
ise
ase
0
0.0
0
0.0
1
0.3
1
0.2
0
0.0
1
0.2
3
0.1
Dia
be
tic
ne
ph
rop
ath
y
8
2.6
2
7
7.4
4
0
10
.3
37
8.5
4
7
12
.0
51
11
.7
21
0
9.1
An
ti G
BM
0
0.0
0
0.0
0
0.0
0
0.0
0
0.0
1
0.2
1
0.0
Imm
un
ota
cto
id /
fib
rill
ary
GN
0
0.0
0
0.0
0
0.0
0
0.0
0
0.0
0
0.0
0
0.0
Mu
ltip
le m
ye
lom
a
0
0.0
1
0.3
2
0.5
1
0.2
4
1.0
1
0.2
9
0.4
N
ot
av
ail
ab
le/M
issi
ng
0
0.0
0
0.0
3
0.8
4
0.9
4
1.0
3
0.7
1
4
0.6
Su
bto
tal
30
2
10
0
36
3
10
0
39
0
10
0
43
4
10
0
39
3
10
0
43
6
10
0
23
18
10
0
Tu
bu
lo-
inte
rsti
tia
l
dis
ea
se
(n=
38
3)
Acu
te i
nte
rsti
tia
l n
ep
hri
tis
5
23
.8
8
16
.3
10
18
.2
22
23
.2
17
18
.1
21
30
.4
83
21
.7
Acu
te t
ub
ula
r-n
ecr
osi
s 1
0
47
.6
32
65
.3
33
60
.0
33
34
.7
38
40
.4
29
42
.0
17
5
45
.7
Ch
ron
ic i
nte
rsti
tia
l 6
28
.6
9
18
.4
11
20
.0
37
38
.9
39
41
.5
19
27
.5
12
1
31
.6
No
t a
va
ila
ble
/Mis
sin
g
0
0.0
0
0.0
1
1.8
3
3.2
0
0.0
0
0.0
4
1.0
Su
bto
tal
21
10
0
49
10
0
55
10
0
95
10
0
94
10
0
69
10
0
38
3
10
0
Ta
ble
1.3
.2:
His
top
ath
olo
gy
of
all
na
tiv
e r
en
al
bio
psi
es,
20
05
-20
10
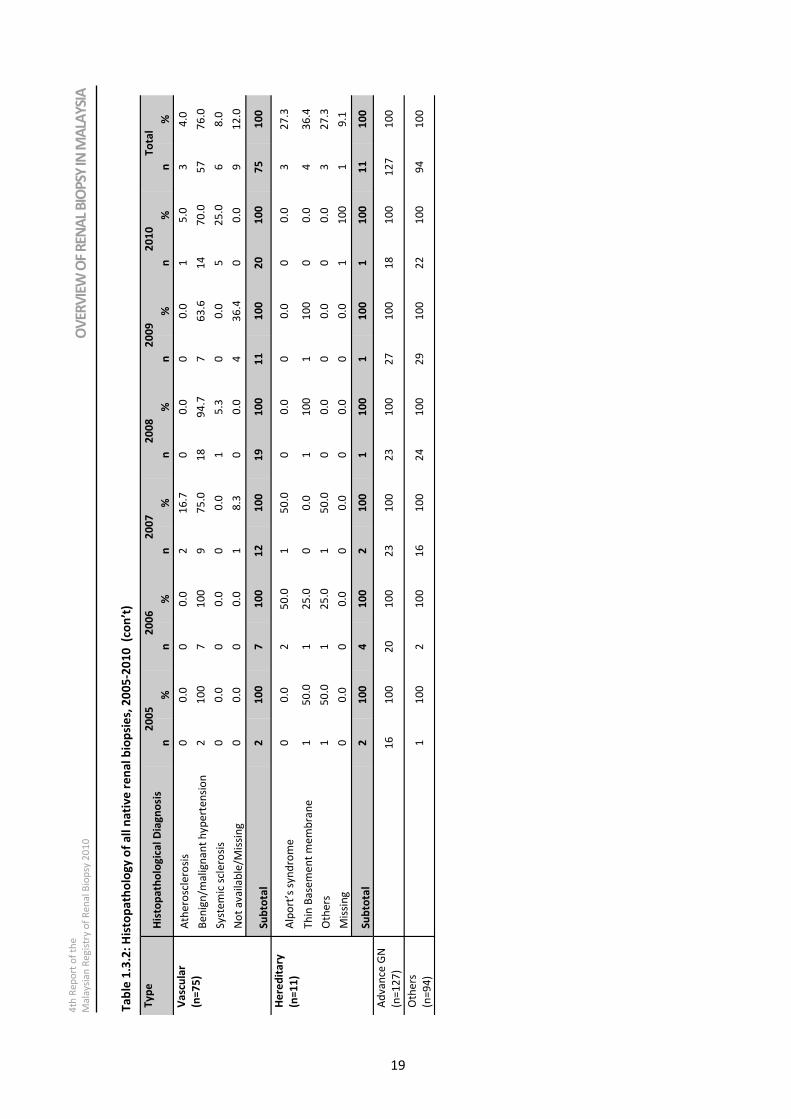
4th Report of the
Malaysian Registry of Renal Biopsy 2010 OVERVIEW OF RENAL BIOPSY IN MALAYSIA
19
OV
ERV
IEW
OF
REN
AL
BIO
PSY
IN M
ALA
YSI
A
4th
Re
po
rt o
f th
e
Ma
laysi
an
Re
gis
try o
f R
en
al B
iop
sy 2
01
0
Ty
pe
His
top
ath
olo
gic
al
Dia
gn
osi
s 2
00
5
20
06
20
07
20
08
20
09
20
10
To
tal
n
%
n
%
n
%
n
%
n
%
n
%
n
%
Va
scu
lar
(n=
75
) A
the
rosc
lero
sis
0
0.0
0
0
.0
2
16
.7
0
0.0
0
0
.0
1
5.0
3
4
.0
Be
nig
n/m
ali
gn
an
t h
yp
ert
en
sio
n
2
10
0
7
10
0
9
75
.0
18
9
4.7
7
6
3.6
1
4
70
.0
57
7
6.0
Sy
ste
mic
scl
ero
sis
0
0.0
0
0
.0
0
0.0
1
5
.3
0
0.0
5
2
5.0
6
8
.0
No
t a
va
ila
ble
/Mis
sin
g
0
0.0
0
0
.0
1
8.3
0
0
.0
4
36
.4
0
0.0
9
1
2.0
Su
bto
tal
2
10
0
7
10
0
12
1
00
1
9
10
0
11
1
00
2
0
10
0
75
1
00
He
red
ita
ry
(n=
11
) A
lpo
rt’s
sy
nd
rom
e
0
0.0
2
5
0.0
1
5
0.0
0
0
.0
0
0.0
0
0
.0
3
27
.3
Th
in B
ase
me
nt
me
mb
ran
e
1
50
.0
1
25
.0
0
0.0
1
1
00
1
1
00
0
0
.0
4
36
.4
Oth
ers
1
5
0.0
1
2
5.0
1
5
0.0
0
0
.0
0
0.0
0
0
.0
3
27
.3
Mis
sin
g
0
0.0
0
0
.0
0
0.0
0
0
.0
0
0.0
1
1
00
1
9
.1
Su
bto
tal
2
10
0
4
10
0
2
10
0
1
10
0
1
10
0
1
10
0
11
1
00
Ad
va
nce
GN
(n=
12
7)
1
6
10
0
20
1
00
2
3
10
0
23
1
00
2
7
10
0
18
1
00
1
27
1
00
Oth
ers
(n=
94
)
1
10
0
2
10
0
16
1
00
2
4
10
0
29
1
00
2
2
10
0
94
1
00
Ta
ble
1.3
.2:
His
top
ath
olo
gy
of
all
na
tiv
e r
en
al
bio
psi
es,
20
05
-20
10
(c
on
’t)
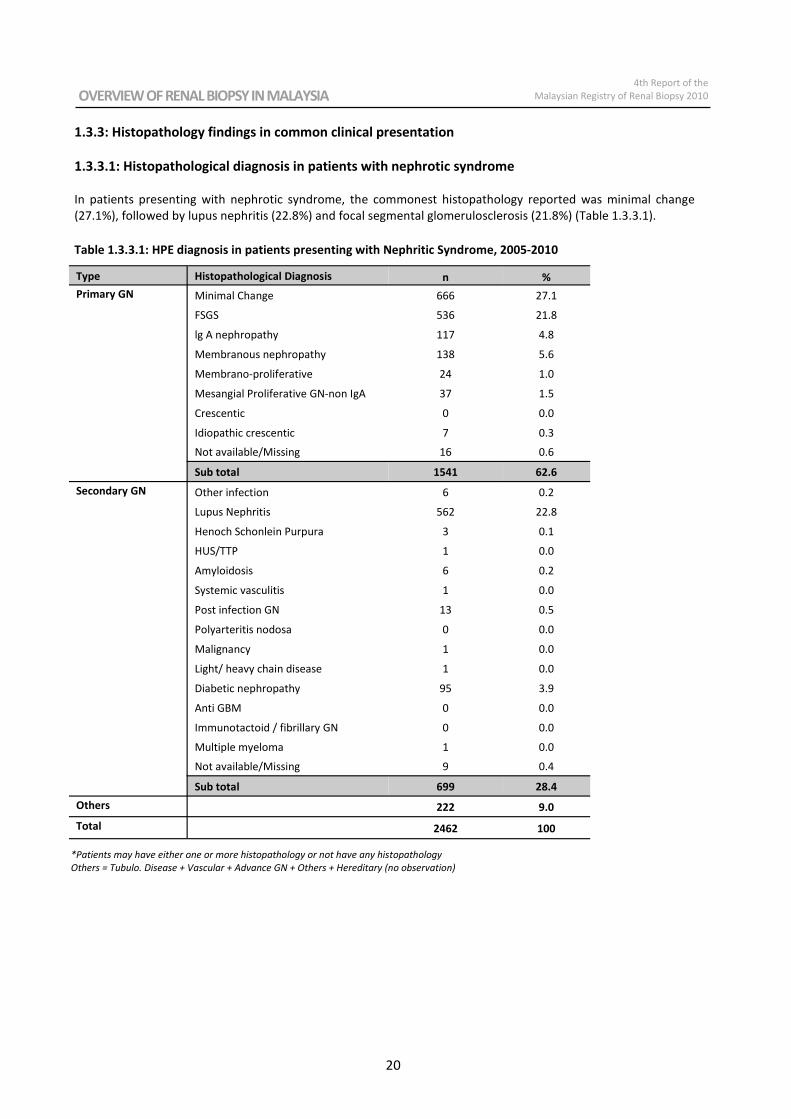
OVERVIEW OF RENAL BIOPSY IN MALAYSIA 4th Report of the
Malaysian Registry of Renal Biopsy 2010
20
1.3.3: Histopathology findings in common clinical presentation
1.3.3.1: Histopathological diagnosis in patients with nephrotic syndrome
In patients presenting with nephrotic syndrome, the commonest histopathology reported was minimal change
(27.1%), followed by lupus nephritis (22.8%) and focal segmental glomerulosclerosis (21.8%) (Table 1.3.3.1).
Table 1.3.3.1: HPE diagnosis in patients presenting with Nephritic Syndrome, 2005-2010
Type Histopathological Diagnosis n %
Primary GN Minimal Change 666 27.1
FSGS 536 21.8
lg A nephropathy 117 4.8
Membranous nephropathy 138 5.6
Membrano-proliferative 24 1.0
Mesangial Proliferative GN-non IgA 37 1.5
Crescentic 0 0.0
Idiopathic crescentic 7 0.3
Not available/Missing 16 0.6
Sub total 1541 62.6
Secondary GN Other infection 6 0.2
Lupus Nephritis 562 22.8
Henoch Schonlein Purpura 3 0.1
HUS/TTP 1 0.0
Amyloidosis 6 0.2
Systemic vasculitis 1 0.0
Post infection GN 13 0.5
Polyarteritis nodosa 0 0.0
Malignancy 1 0.0
Light/ heavy chain disease 1 0.0
Diabetic nephropathy 95 3.9
Anti GBM 0 0.0
Immunotactoid / fibrillary GN 0 0.0
Multiple myeloma 1 0.0
Not available/Missing 9 0.4
Sub total 699 28.4
Others 222 9.0
Total 2462 100
*Patients may have either one or more histopathology or not have any histopathology
Others = Tubulo. Disease + Vascular + Advance GN + Others + Hereditary (no observation)
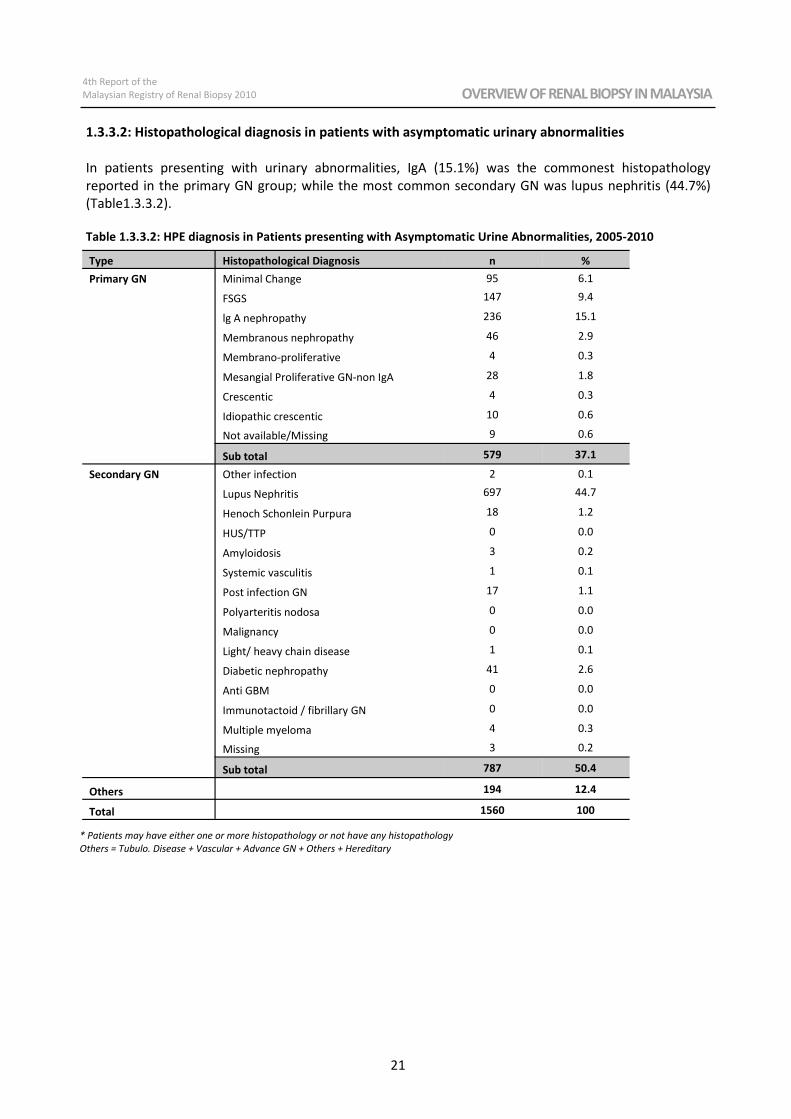
4th Report of the
Malaysian Registry of Renal Biopsy 2010 OVERVIEW OF RENAL BIOPSY IN MALAYSIA
21
1.3.3.2: Histopathological diagnosis in patients with asymptomatic urinary abnormalities
In patients presenting with urinary abnormalities, IgA (15.1%) was the commonest histopathology
reported in the primary GN group; while the most common secondary GN was lupus nephritis (44.7%)
(Table1.3.3.2).
Table 1.3.3.2: HPE diagnosis in Patients presenting with Asymptomatic Urine Abnormalities, 2005-2010
Type Histopathological Diagnosis n %
Primary GN Minimal Change 95 6.1
FSGS 147 9.4
lg A nephropathy 236 15.1
Membranous nephropathy 46 2.9
Membrano-proliferative 4 0.3
Mesangial Proliferative GN-non IgA 28 1.8
Crescentic 4 0.3
Idiopathic crescentic 10 0.6
Not available/Missing 9 0.6
Sub total 579 37.1
Secondary GN Other infection 2 0.1
Lupus Nephritis 697 44.7
Henoch Schonlein Purpura 18 1.2
HUS/TTP 0 0.0
Amyloidosis 3 0.2
Systemic vasculitis 1 0.1
Post infection GN 17 1.1
Polyarteritis nodosa 0 0.0
Malignancy 0 0.0
Light/ heavy chain disease 1 0.1
Diabetic nephropathy 41 2.6
Anti GBM 0 0.0
Immunotactoid / fibrillary GN 0 0.0
Multiple myeloma 4 0.3
Missing 3 0.2
Sub total 787 50.4
Others 194 12.4
Total 1560 100
* Patients may have either one or more histopathology or not have any histopathology
Others = Tubulo. Disease + Vascular + Advance GN + Others + Hereditary
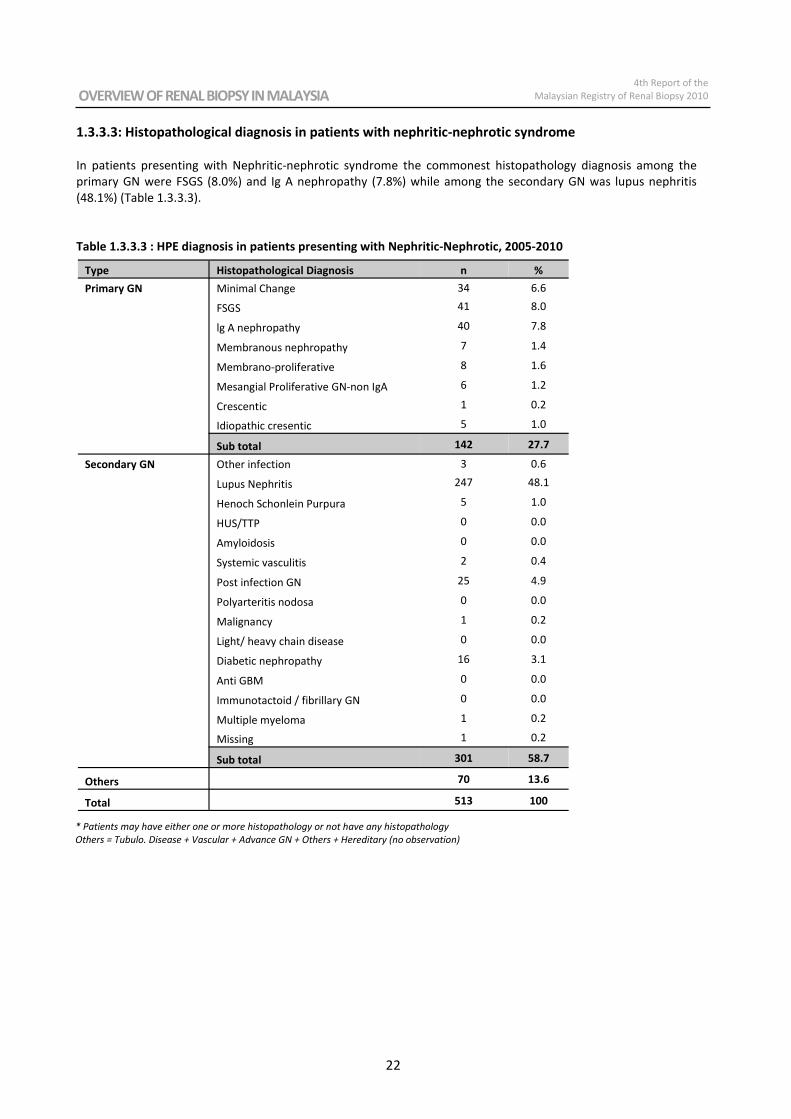
OVERVIEW OF RENAL BIOPSY IN MALAYSIA 4th Report of the
Malaysian Registry of Renal Biopsy 2010
22
1.3.3.3: Histopathological diagnosis in patients with nephritic-nephrotic syndrome
In patients presenting with Nephritic-nephrotic syndrome the commonest histopathology diagnosis among the
primary GN were FSGS (8.0%) and Ig A nephropathy (7.8%) while among the secondary GN was lupus nephritis
(48.1%) (Table 1.3.3.3).
Table 1.3.3.3 : HPE diagnosis in patients presenting with Nephritic-Nephrotic, 2005-2010
Type Histopathological Diagnosis n %
Primary GN Minimal Change 34 6.6
FSGS 41 8.0
lg A nephropathy 40 7.8
Membranous nephropathy 7 1.4
Membrano-proliferative 8 1.6
Mesangial Proliferative GN-non IgA 6 1.2
Crescentic 1 0.2
Idiopathic cresentic 5 1.0
Sub total 142 27.7
Secondary GN Other infection 3 0.6
Lupus Nephritis 247 48.1
Henoch Schonlein Purpura 5 1.0
HUS/TTP 0 0.0
Amyloidosis 0 0.0
Systemic vasculitis 2 0.4
Post infection GN 25 4.9
Polyarteritis nodosa 0 0.0
Malignancy 1 0.2
Light/ heavy chain disease 0 0.0
Diabetic nephropathy 16 3.1
Anti GBM 0 0.0
Immunotactoid / fibrillary GN 0 0.0
Multiple myeloma 1 0.2
Missing 1 0.2
Sub total 301 58.7
Others 70 13.6
Total 513 100
* Patients may have either one or more histopathology or not have any histopathology
Others = Tubulo. Disease + Vascular + Advance GN + Others + Hereditary (no observation)
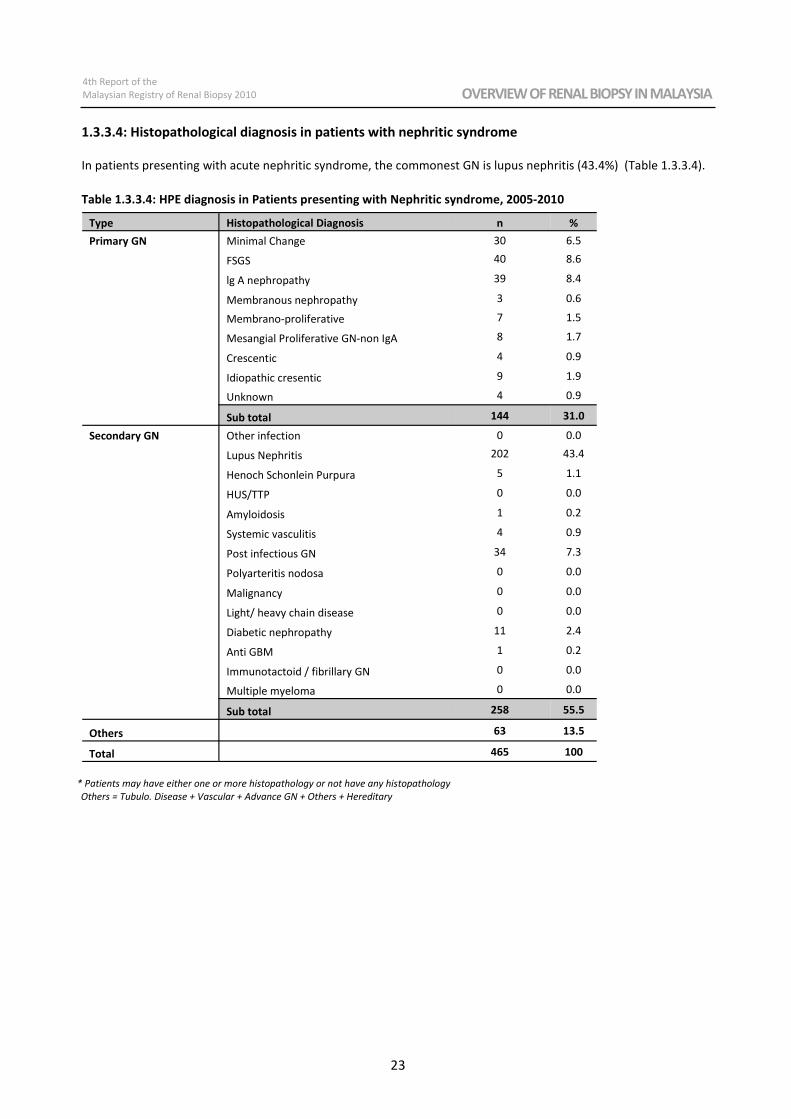
4th Report of the
Malaysian Registry of Renal Biopsy 2010 OVERVIEW OF RENAL BIOPSY IN MALAYSIA
23
1.3.3.4: Histopathological diagnosis in patients with nephritic syndrome
In patients presenting with acute nephritic syndrome, the commonest GN is lupus nephritis (43.4%) (Table 1.3.3.4).
Table 1.3.3.4: HPE diagnosis in Patients presenting with Nephritic syndrome, 2005-2010
Type Histopathological Diagnosis n %
Primary GN Minimal Change 30 6.5
FSGS 40 8.6
lg A nephropathy 39 8.4
Membranous nephropathy 3 0.6
Membrano-proliferative 7 1.5
Mesangial Proliferative GN-non IgA 8 1.7
Crescentic 4 0.9
Idiopathic cresentic 9 1.9
Unknown 4 0.9
Sub total 144 31.0
Secondary GN Other infection 0 0.0
Lupus Nephritis 202 43.4
Henoch Schonlein Purpura 5 1.1
HUS/TTP 0 0.0
Amyloidosis 1 0.2
Systemic vasculitis 4 0.9
Post infectious GN 34 7.3
Polyarteritis nodosa 0 0.0
Malignancy 0 0.0
Light/ heavy chain disease 0 0.0
Diabetic nephropathy 11 2.4
Anti GBM 1 0.2
Immunotactoid / fibrillary GN 0 0.0
Multiple myeloma 0 0.0
Sub total 258 55.5
Others 63 13.5
Total 465 100
* Patients may have either one or more histopathology or not have any histopathology
Others = Tubulo. Disease + Vascular + Advance GN + Others + Hereditary
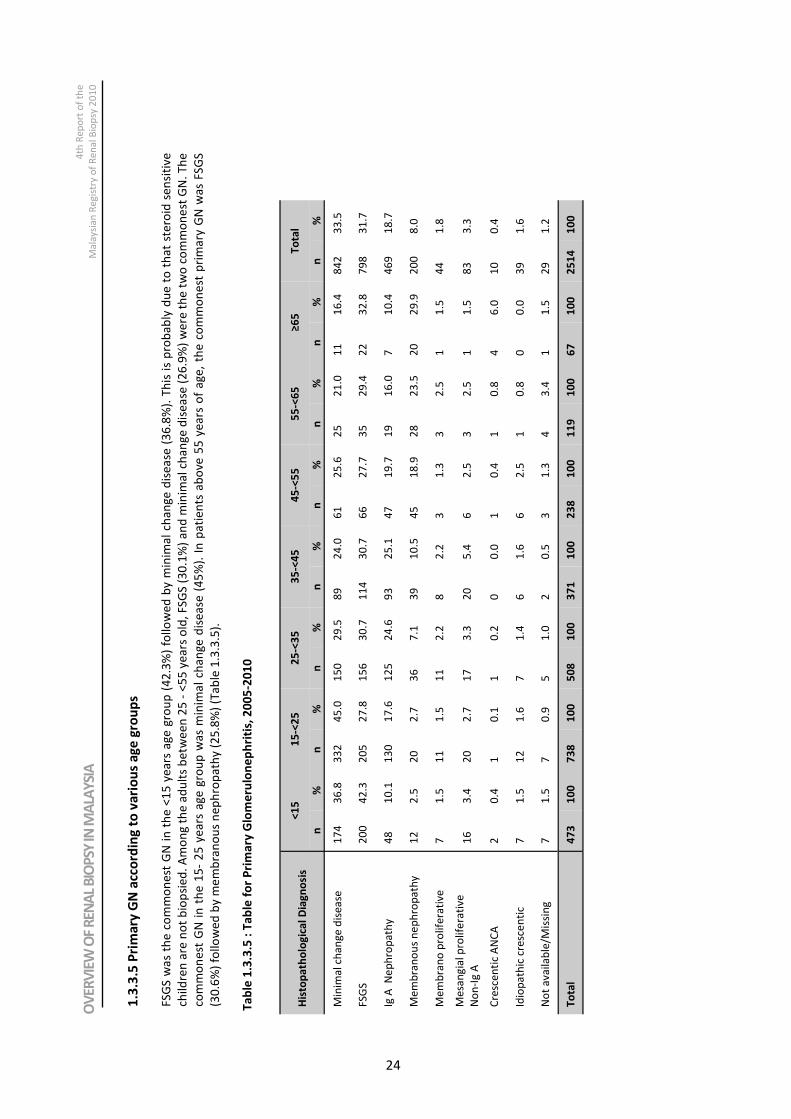
OVERVIEW OF RENAL BIOPSY IN MALAYSIA 4th Report of the
Malaysian Registry of Renal Biopsy 2010
24
1.3
.3.5
Pri
ma
ry G
N a
cco
rdin
g t
o v
ari
ou
s a
ge
gro
up
s
FS
GS
wa
s th
e c
om
mo
ne
st G
N i
n t
he
<1
5 y
ea
rs a
ge
gro
up
(4
2.3
%)
foll
ow
ed
by
min
ima
l ch
an
ge
dis
ea
se (
36
.8%
). T
his
is
pro
ba
bly
du
e t
o t
ha
t st
ero
id s
en
siti
ve
chil
dre
n a
re n
ot
bio
psi
ed
. A
mo
ng
th
e a
du
lts
be
twe
en
25
- <
55
ye
ars
old
, F
SG
S (
30
.1%
) a
nd
min
ima
l ch
an
ge
dis
ea
se (
26
.9%
) w
ere
th
e t
wo
co
mm
on
est
GN
. T
he
com
mo
ne
st G
N i
n t
he
15
- 2
5 y
ea
rs a
ge
gro
up
wa
s m
inim
al
cha
ng
e d
ise
ase
(4
5%
). I
n p
ati
en
ts a
bo
ve 5
5 y
ea
rs o
f a
ge
, th
e c
om
mo
ne
st p
rim
ary
GN
wa
s F
SG
S
(30
.6%
) fo
llo
we
d b
y m
em
bra
no
us
ne
ph
rop
ath
y (
25
.8%
) (T
ab
le 1
.3.3
.5).
Ta
ble
1.3
.3.5
: T
ab
le f
or
Pri
ma
ry G
lom
eru
lon
ep
hri
tis,
20
05
-20
10
His
top
ath
olo
gic
al
Dia
gn
osi
s <
15
15
-<2
5
25
-<3
5
35
-<4
5
45
-<5
5
55
-<6
5
≥6
5
To
tal
n
%
n
%
n
%
n
%
n
%
n
%
n
%
n
%
Min
ima
l ch
an
ge
dis
ea
se
17
4
36
.8
33
2
45
.0
15
0
29
.5
89
24
.0
61
25
.6
25
21
.0
11
16
.4
84
2
33
.5
FS
GS
20
0
42
.3
20
5
27
.8
15
6
30
.7
11
4
30
.7
66
27
.7
35
29
.4
22
32
.8
79
8
31
.7
Ig A
N
ep
hro
pa
thy
48
10
.1
13
0
17
.6
12
5
24
.6
93
25
.1
47
19
.7
19
16
.0
7
10
.4
46
9
18
.7
Me
mb
ran
ou
s n
ep
hro
pa
thy
12
2.5
2
0
2.7
3
6
7.1
3
9
10
.5
45
18
.9
28
23
.5
20
29
.9
20
0
8.0
Me
mb
ran
o p
roli
fera
tiv
e
7
1.5
1
1
1.5
1
1
2.2
8
2.2
3
1.3
3
2.5
1
1.5
4
4
1.8
Me
san
gia
l p
roli
fera
tiv
e
No
n-I
g A
1
6
3.4
2
0
2.7
1
7
3.3
2
0
5.4
6
2.5
3
2.5
1
1.5
8
3
3.3
Cre
sce
nti
c A
NC
A
2
0.4
1
0.1
1
0.2
0
0.0
1
0.4
1
0.8
4
6.0
1
0
0.4
Idio
pa
thic
cre
sce
nti
c 7
1.5
1
2
1.6
7
1.4
6
1.6
6
2.5
1
0.8
0
0.0
3
9
1.6
No
t a
va
ila
ble
/Mis
sin
g
7
1.5
7
0.9
5
1.0
2
0.5
3
1.3
4
3.4
1
1.5
2
9
1.2
To
tal
47
3
10
0
73
8
10
0
50
8
10
0
37
1
10
0
23
8
10
0
11
9
10
0
67
10
0
25
14
10
0
OV
ERV
IEW
OF
REN
AL
BIO
PSY
IN M
ALA
YSI
A
4th
Re
po
rt o
f th
e
Ma
laysi
an
Re
gis
try o
f R
en
al B
iop
sy 2
01
0
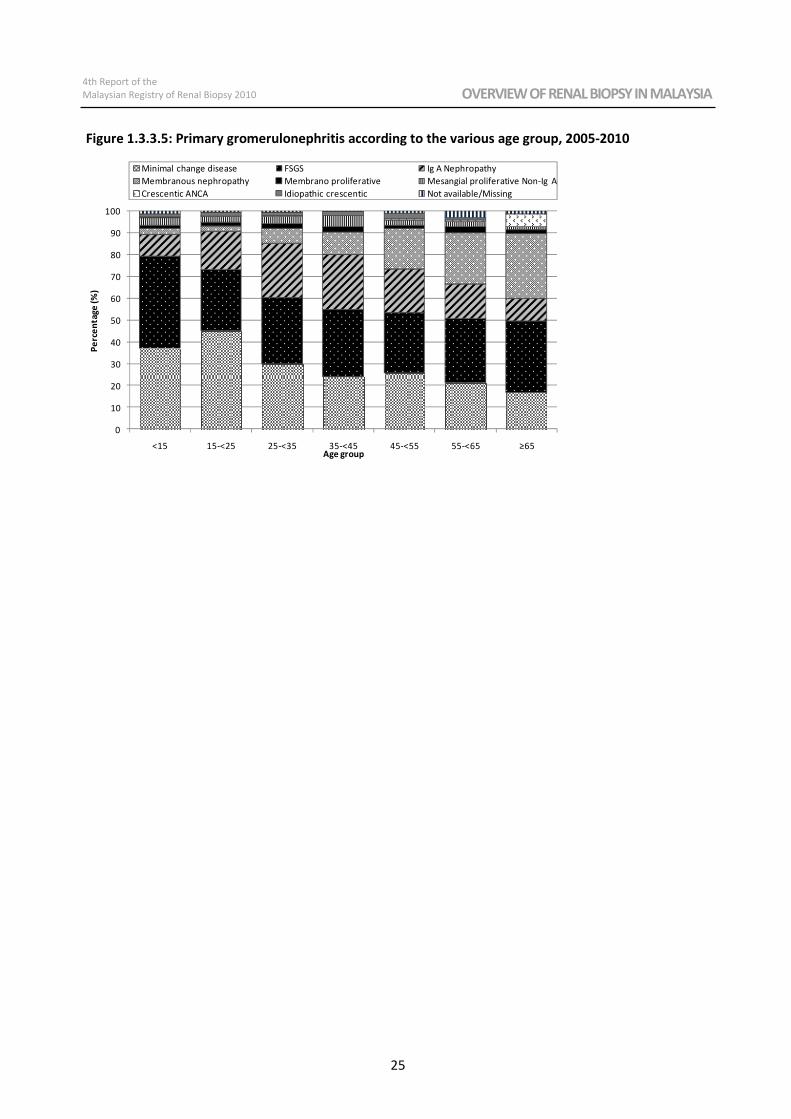
4th Report of the
Malaysian Registry of Renal Biopsy 2010 OVERVIEW OF RENAL BIOPSY IN MALAYSIA
25
Figure 1.3.3.5: Primary gromerulonephritis according to the various age group, 2005-2010
0
10
20
30
40
50
60
70
80
90
100
<15 15-<25 25-<35 35-<45 45-<55 55-<65 ≥65
Pe
rce
nta
ge
(%
)
Age group
Minimal change disease FSGS Ig A Nephropathy
Membranous nephropathy Membrano proliferative Mesangial proliferative Non-Ig A
Crescentic ANCA Idiopathic crescentic Not available/Missing
OVERVIEW OF RENAL BIOPSY IN MALAYSIA 4th Report of the
Malaysian Registry of Renal Biopsy 2010
26
4th Report of the
Malaysian Registry of Renal Biopsy 2010 PRIMARY GLOMERULONEPHRITIS
27
CHAPTER 2
PRIMARY GLOMERULONEPHRITIS
Sunita Bavanandan
Lim Soo Kun
Lee Han Wei
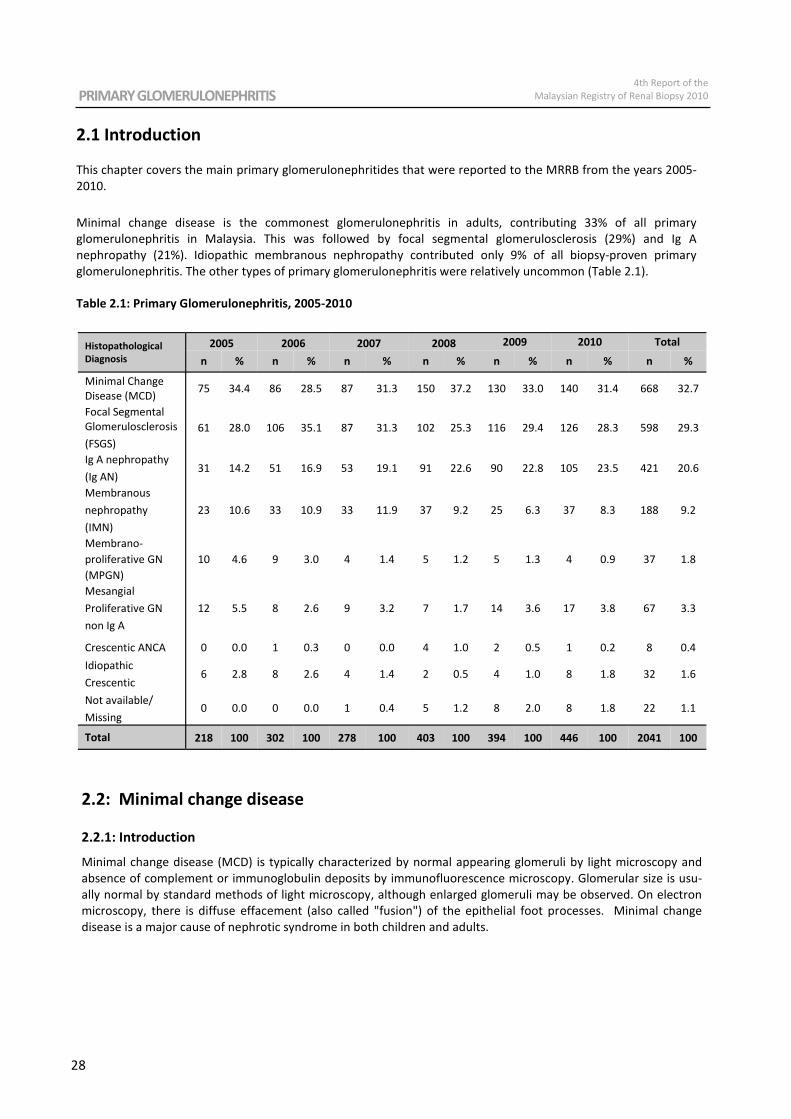
PRIMARY GLOMERULONEPHRITIS 4th Report of the
Malaysian Registry of Renal Biopsy 2010
28
2.1 Introduction
This chapter covers the main primary glomerulonephritides that were reported to the MRRB from the years 2005-
2010.
Minimal change disease is the commonest glomerulonephritis in adults, contributing 33% of all primary
glomerulonephritis in Malaysia. This was followed by focal segmental glomerulosclerosis (29%) and Ig A
nephropathy (21%). Idiopathic membranous nephropathy contributed only 9% of all biopsy-proven primary
glomerulonephritis. The other types of primary glomerulonephritis were relatively uncommon (Table 2.1).
Table 2.1: Primary Glomerulonephritis, 2005-2010
Histopathological
Diagnosis
2005 2006 2007 2008 2009 2010 Total
n % n % n % n % n % n % n %
Minimal Change
Disease (MCD) 75 34.4 86 28.5 87 31.3 150 37.2 130 33.0 140 31.4 668 32.7
Focal Segmental
Glomerulosclerosis
(FSGS)
61 28.0 106 35.1 87 31.3 102 25.3 116 29.4 126 28.3 598 29.3
Ig A nephropathy
(Ig AN) 31 14.2 51 16.9 53 19.1 91 22.6 90 22.8 105 23.5 421 20.6
Membranous
nephropathy
(IMN)
23 10.6 33 10.9 33 11.9 37 9.2 25 6.3 37 8.3 188 9.2
Membrano-
proliferative GN
(MPGN)
10 4.6 9 3.0 4 1.4 5 1.2 5 1.3 4 0.9 37 1.8
Mesangial
Proliferative GN
non Ig A
12 5.5 8 2.6 9 3.2 7 1.7 14 3.6 17 3.8 67 3.3
Crescentic ANCA 0 0.0 1 0.3 0 0.0 4 1.0 2 0.5 1 0.2 8 0.4
Idiopathic
Crescentic 6 2.8 8 2.6 4 1.4 2 0.5 4 1.0 8 1.8 32 1.6
Not available/
Missing 0 0.0 0 0.0 1 0.4 5 1.2 8 2.0 8 1.8 22 1.1
Total 218 100 302 100 278 100 403 100 394 100 446 100 2041 100
2.2: Minimal change disease
2.2.1: Introduction
Minimal change disease (MCD) is typically characterized by normal appearing glomeruli by light microscopy and
absence of complement or immunoglobulin deposits by immunofluorescence microscopy. Glomerular size is usu-
ally normal by standard methods of light microscopy, although enlarged glomeruli may be observed. On electron
microscopy, there is diffuse effacement (also called "fusion") of the epithelial foot processes. Minimal change
disease is a major cause of nephrotic syndrome in both children and adults.
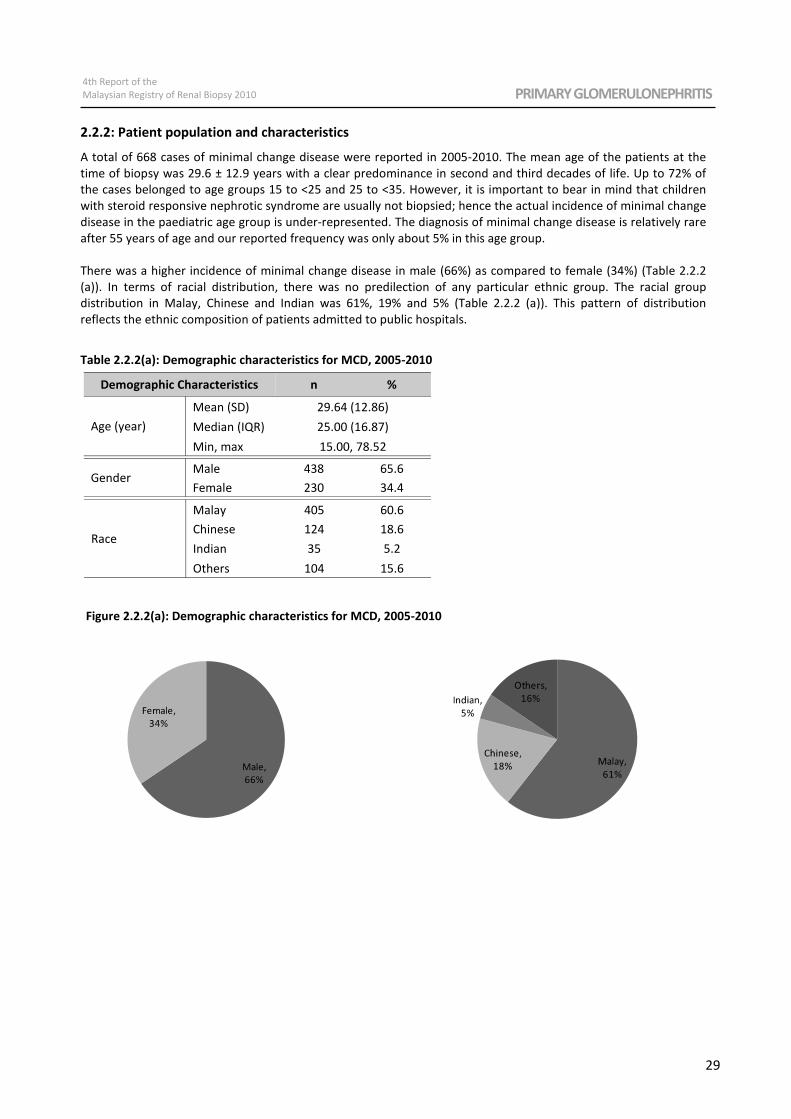
4th Report of the
Malaysian Registry of Renal Biopsy 2010 PRIMARY GLOMERULONEPHRITIS
29
2.2.2: Patient population and characteristics
A total of 668 cases of minimal change disease were reported in 2005-2010. The mean age of the patients at the
time of biopsy was 29.6 ± 12.9 years with a clear predominance in second and third decades of life. Up to 72% of
the cases belonged to age groups 15 to <25 and 25 to <35. However, it is important to bear in mind that children
with steroid responsive nephrotic syndrome are usually not biopsied; hence the actual incidence of minimal change
disease in the paediatric age group is under-represented. The diagnosis of minimal change disease is relatively rare
after 55 years of age and our reported frequency was only about 5% in this age group.
There was a higher incidence of minimal change disease in male (66%) as compared to female (34%) (Table 2.2.2
(a)). In terms of racial distribution, there was no predilection of any particular ethnic group. The racial group
distribution in Malay, Chinese and Indian was 61%, 19% and 5% (Table 2.2.2 (a)). This pattern of distribution
reflects the ethnic composition of patients admitted to public hospitals.
Table 2.2.2(a): Demographic characteristics for MCD, 2005-2010
Demographic Characteristics n %
Age (year)
Mean (SD) 29.64 (12.86)
Median (IQR) 25.00 (16.87)
Min, max 15.00, 78.52
Gender Male 438 65.6
Female 230 34.4
Race
Malay 405
Others 104
Indian 35
Chinese 124
60.6
18.6
5.2
15.6
Figure 2.2.2(a): Demographic characteristics for MCD, 2005-2010
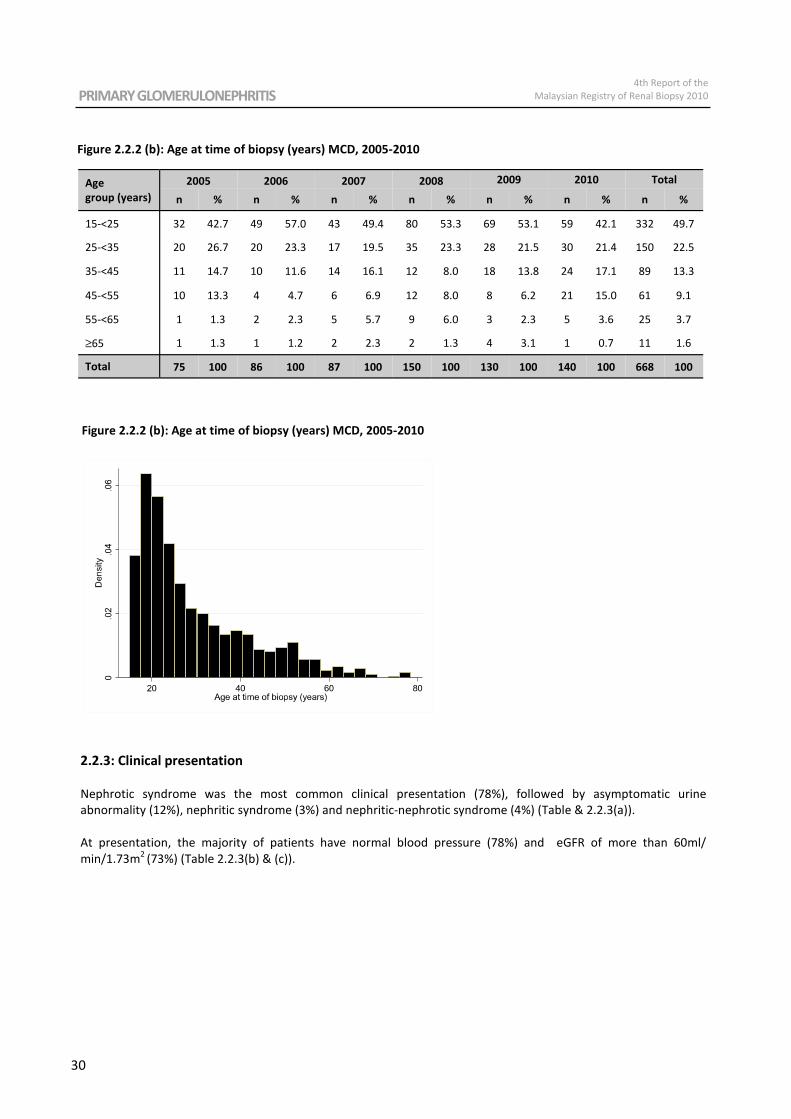
PRIMARY GLOMERULONEPHRITIS 4th Report of the
Malaysian Registry of Renal Biopsy 2010
30
Figure 2.2.2 (b): Age at time of biopsy (years) MCD, 2005-2010
Figure 2.2.2 (b): Age at time of biopsy (years) MCD, 2005-2010
Age
group (years)
2005 2006 2007 2008 2009 2010 Total
n % n % n % n % n % n % n %
15-<25 32 42.7 49 57.0 43 49.4 80 53.3 69 53.1 59 42.1 332 49.7
25-<35 20 26.7 20 23.3 17 19.5 35 23.3 28 21.5 30 21.4 150 22.5
35-<45 11 14.7 10 11.6 14 16.1 12 8.0 18 13.8 24 17.1 89 13.3
45-<55 10 13.3 4 4.7 6 6.9 12 8.0 8 6.2 21 15.0 61 9.1
55-<65 1 1.3 2 2.3 5 5.7 9 6.0 3 2.3 5 3.6 25 3.7
≥65 1 1.3 1 1.2 2 2.3 2 1.3 4 3.1 1 0.7 11 1.6
Total 75 100 86 100 87 100 150 100 130 100 140 100 668 100
2.2.3: Clinical presentation
Nephrotic syndrome was the most common clinical presentation (78%), followed by asymptomatic urine
abnormality (12%), nephritic syndrome (3%) and nephritic-nephrotic syndrome (4%) (Table & 2.2.3(a)).
At presentation, the majority of patients have normal blood pressure (78%) and eGFR of more than 60ml/
min/1.73m2
(73%) (Table 2.2.3(b) & (c)).
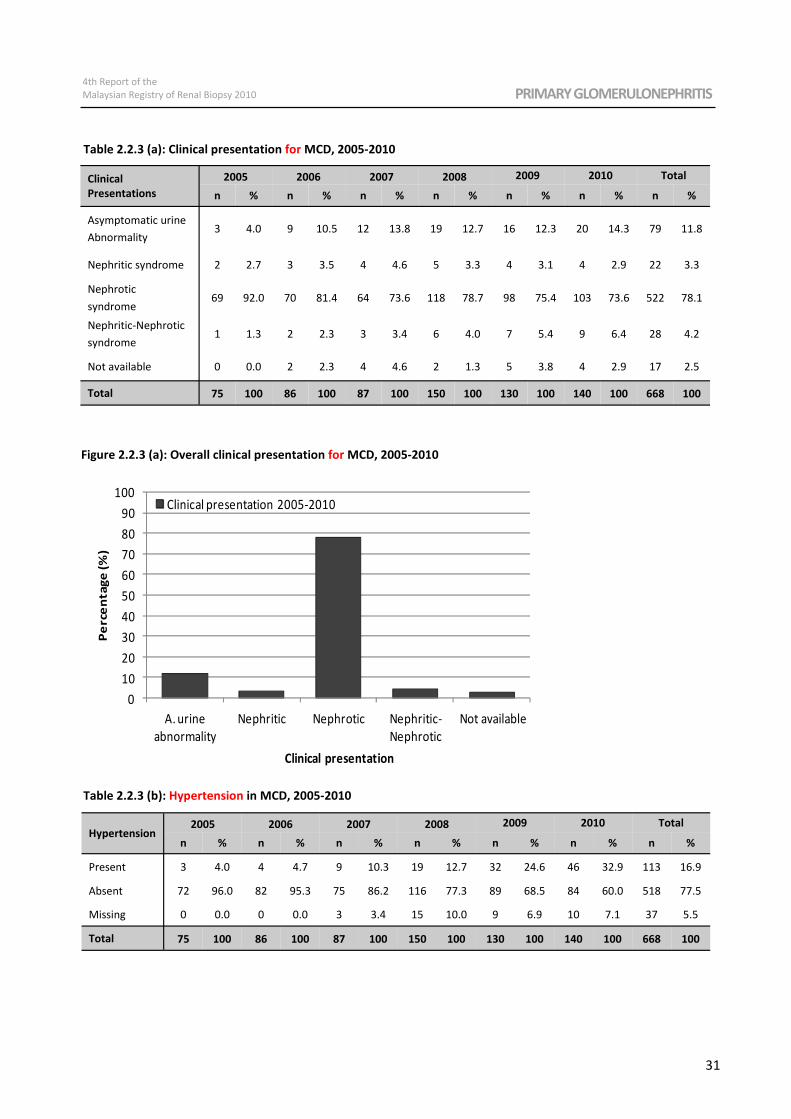
4th Report of the
Malaysian Registry of Renal Biopsy 2010 PRIMARY GLOMERULONEPHRITIS
31
Figure 2.2.3 (a): Overall clinical presentation for MCD, 2005-2010
Table 2.2.3 (b): Hypertension in MCD, 2005-2010
Table 2.2.3 (a): Clinical presentation for MCD, 2005-2010
Clinical
Presentations
2005 2006 2007 2008 2009 2010 Total
n % n % n % n % n % n % n %
Asymptomatic urine
Abnormality 3 4.0 9 10.5 12 13.8 19 12.7 16 12.3 20 14.3 79 11.8
Nephritic syndrome 2 2.7 3 3.5 4 4.6 5 3.3 4 3.1 4 2.9 22 3.3
Nephrotic
syndrome 69 92.0 70 81.4 64 73.6 118 78.7 98 75.4 103 73.6 522 78.1
Nephritic-Nephrotic
syndrome 1 1.3 2 2.3 3 3.4 6 4.0 7 5.4 9 6.4 28 4.2
Not available 0 0.0 2 2.3 4 4.6 2 1.3 5 3.8 4 2.9 17 2.5
Total 75 100 86 100 87 100 150 100 130 100 140 100 668 100
Hypertension 2005 2006 2007 2008 2009 2010 Total
n % n % n % n % n % n % n %
Present 3 4.0 4 4.7 9 10.3 19 12.7 32 24.6 46 32.9 113 16.9
Absent 72 96.0 82 95.3 75 86.2 116 77.3 89 68.5 84 60.0 518 77.5
Missing 0 0.0 0 0.0 3 3.4 15 10.0 9 6.9 10 7.1 37 5.5
Total 75 100 86 100 87 100 150 100 130 100 140 100 668 100
0
10
20
30
40
50
60
70
80
90
100
A. urine
abnormality
Nephritic Nephrotic Nephritic-
Nephrotic
Not available
Pe
rce
nta
ge
(%
)
Clinical presentation
Clinical presentation 2005-2010
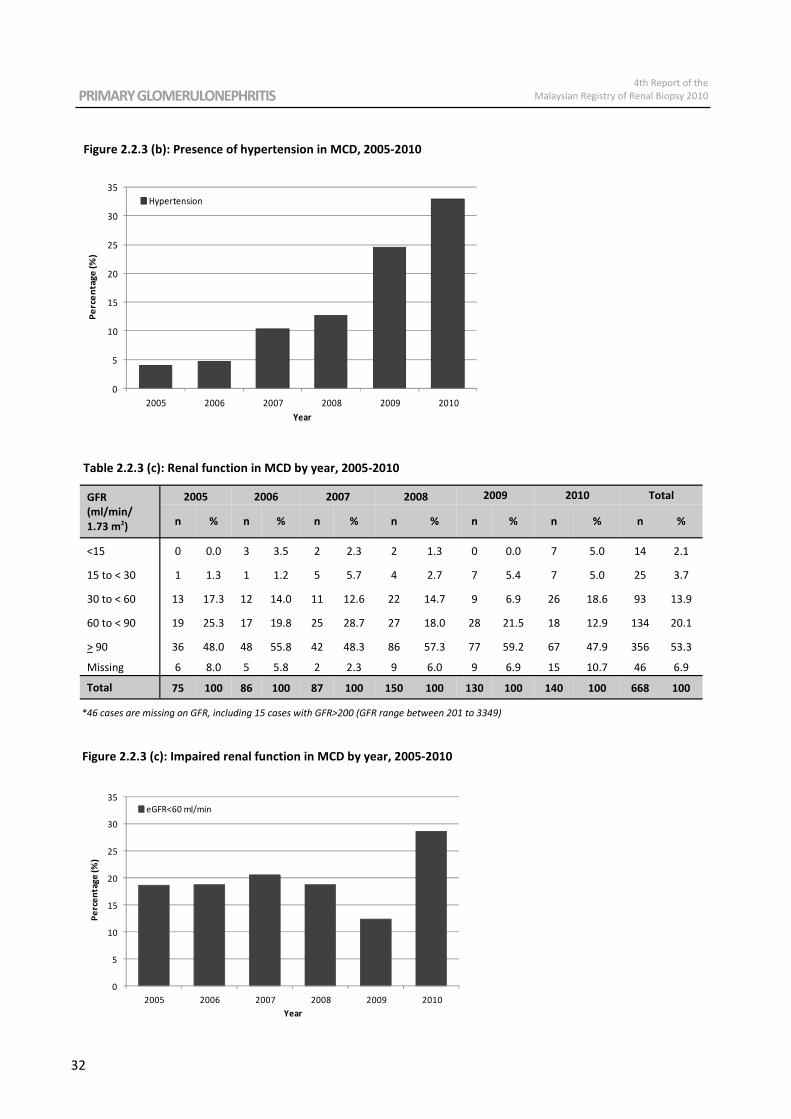
PRIMARY GLOMERULONEPHRITIS 4th Report of the
Malaysian Registry of Renal Biopsy 2010
32
Table 2.2.3 (c): Renal function in MCD by year, 2005-2010
Figure 2.2.3 (b): Presence of hypertension in MCD, 2005-2010
GFR
(ml/min/
1.73 m2)
2005 2006 2007 2008 2009 2010 Total
n % n % n % n % n % n % n %
<15 0 0.0 3 3.5 2 2.3 2 1.3 0 0.0 7 5.0 14 2.1
60 to < 90 19 25.3 17 19.8 25 28.7 27 18.0 28 21.5 18 12.9 134 20.1
Missing 6 8.0 5 5.8 2 2.3 9 6.0 9 6.9 15 10.7 46 6.9
Total 75 100 86 100 87 100 150 100 130 100 140 100 668 100
> 90 36 48.0 48 55.8 42 48.3 86 57.3 77 59.2 67 47.9 356 53.3
15 to < 30 1 1.3 1 1.2 5 5.7 4 2.7 7 5.4 7 5.0 25 3.7
30 to < 60 13 17.3 12 14.0 11 12.6 22 14.7 9 6.9 26 18.6 93 13.9
*46 cases are missing on GFR, including 15 cases with GFR>200 (GFR range between 201 to 3349)
Figure 2.2.3 (c): Impaired renal function in MCD by year, 2005-2010
0
5
10
15
20
25
30
35
2005 2006 2007 2008 2009 2010
Pe
rce
nta
ge
(%
)
Year
eGFR<60 ml/min
0
5
10
15
20
25
30
35
2005 2006 2007 2008 2009 2010
Pe
rce
nta
ge
(%
)
Year
Hypertension
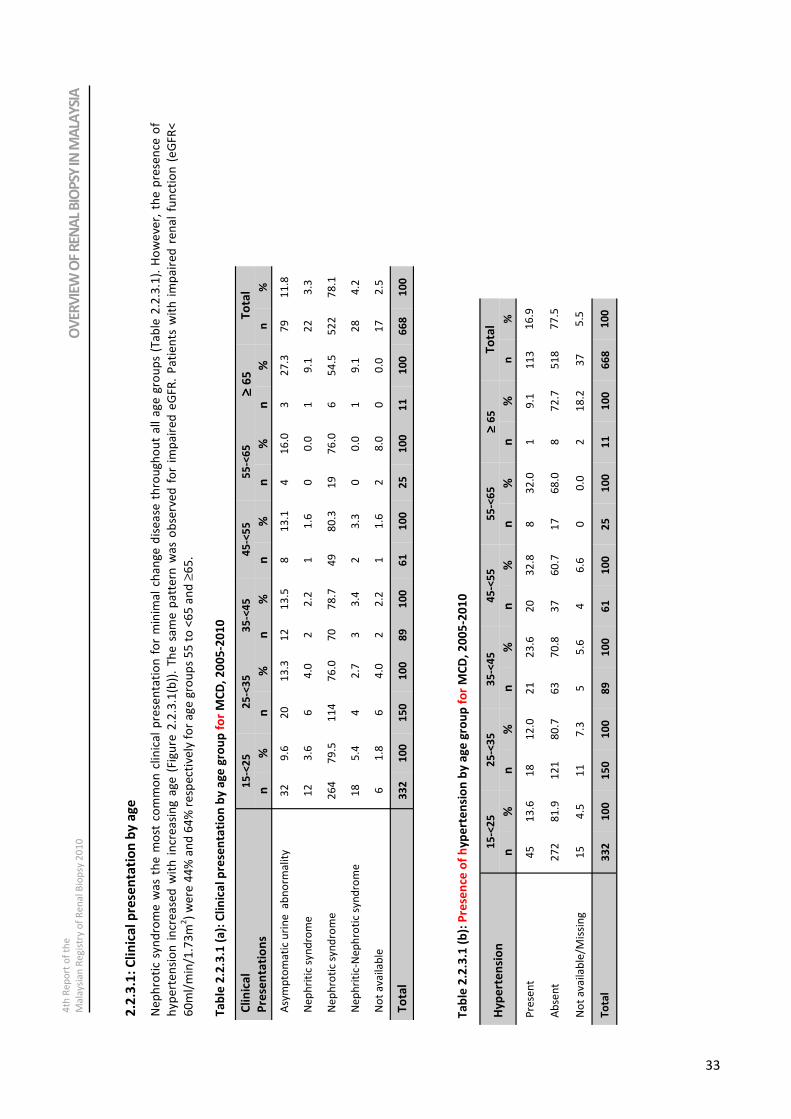
4th Report of the
Malaysian Registry of Renal Biopsy 2010 PRIMARY GLOMERULONEPHRITIS
33
2.2
.3.1
: C
lin
ica
l p
rese
nta
tio
n b
y a
ge
Ne
ph
roti
c sy
nd
rom
e w
as
the
mo
st c
om
mo
n c
lin
ica
l p
rese
nta
tio
n f
or
min
ima
l ch
an
ge
dis
ea
se t
hro
ug
ho
ut
all
ag
e g
rou
ps
(Ta
ble
2.2
.3.1
). H
ow
eve
r, t
he
pre
sen
ce o
f
hy
pe
rte
nsi
on
in
cre
ase
d w
ith
in
cre
asi
ng
ag
e (
Fig
ure
2.2
.3.1
(b))
. T
he
sa
me
pa
tte
rn w
as
ob
serv
ed
fo
r im
pa
ire
d e
GF
R.
Pa
tie
nts
wit
h i
mp
air
ed
re
na
l fu
nct
ion
(e
GF
R<
60
ml/
min
/1.7
3m
2)
we
re 4
4%
an
d 6
4%
re
spe
ctiv
ely
fo
r a
ge
gro
up
s 5
5 t
o <
65
an
d ≥
65
. T
ab
le 2
.2.3
.1 (
a):
Cli
nic
al
pre
sen
tati
on
by
ag
e g
rou
p f
or
MC
D,
20
05
-20
10
Ta
ble
2.2
.3.1
(b
): P
rese
nce
of
hy
pe
rte
nsi
on
by
ag
e g
rou
p f
or
MC
D,
20
05
-20
10
Cli
nic
al
Pre
sen
tati
on
s
15
-<2
5
25
-<3
5
35
-<4
5
45
-<5
5
55
-<6
5
≥
≥
≥
≥ 6
5
To
tal
n
%
n
%
n
%
n
%
n
%
n
%
n
%
Asy
mp
tom
ati
c u
rin
e
ab
no
rma
lity
3
2
9.6
2
0
13
.3
12
1
3.5
8
1
3.1
4
1
6.0
3
2
7.3
7
9
11
.8
Ne
ph
riti
c sy
nd
rom
e
12
3
.6
6
4.0
2
2
.2
1
1.6
0
0
.0
1
9.1
2
2
3.3
Ne
ph
roti
c sy
nd
rom
e
26
4
79
.5
11
4
76
.0
70
7
8.7
4
9
80
.3
19
7
6.0
6
5
4.5
5
22
7
8.1
Ne
ph
riti
c-N
ep
hro
tic
syn
dro
me
1
8
5.4
4
2
.7
3
3.4
2
3
.3
0
0.0
1
9
.1
28
4
.2
No
t a
va
ila
ble
6
1
.8
6
4.0
2
2
.2
1
1.6
2
8
.0
0
0.0
1
7
2.5
To
tal
33
2
10
0
15
0
10
0
89
1
00
6
1
10
0
25
1
00
1
1
10
0
66
8
10
0
Hy
pe
rte
nsi
on
1
5-<
25
2
5-<
35
3
5-<
45
4
5-<
55
5
5-<
65
≥
≥
≥
≥
6
5
To
tal
n
%
n
%
n
%
n
%
n
%
n
%
n
%
Pre
sen
t 4
5
13
.6
18
1
2.0
2
1
23
.6
20
3
2.8
8
3
2.0
1
9
.1
11
3
16
.9
Ab
sen
t 2
72
8
1.9
1
21
8
0.7
6
3
70
.8
37
6
0.7
1
7
68
.0
8
72
.7
51
8
77
.5
No
t a
va
ila
ble
/Mis
sin
g
15
4
.5
11
7
.3
5
5.6
4
6
.6
0
0.0
2
1
8.2
3
7
5.5
To
tal
33
2
10
0
15
0
10
0
89
1
00
6
1
10
0
25
1
00
1
1
10
0
66
8
10
0
OV
ERV
IEW
OF
REN
AL
BIO
PSY
IN M
ALA
YSI
A
4th
Re
po
rt o
f th
e
Ma
laysi
an
Re
gis
try o
f R
en
al B
iop
sy 2
01
0
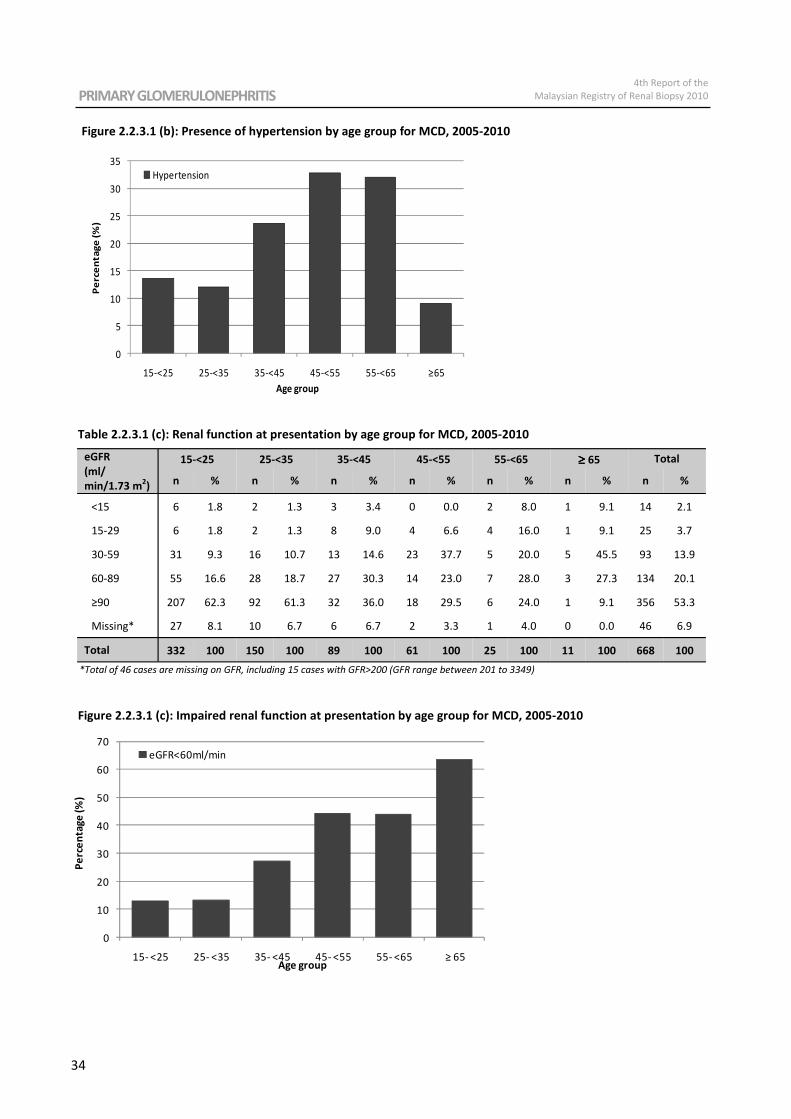
PRIMARY GLOMERULONEPHRITIS 4th Report of the
Malaysian Registry of Renal Biopsy 2010
34
Figure 2.2.3.1 (b): Presence of hypertension by age group for MCD, 2005-2010
0
5
10
15
20
25
30
35
15-<25 25-<35 35-<45 45-<55 55-<65 ≥65
Pe
rce
nta
ge
(%
)
Age group
Hypertension
Table 2.2.3.1 (c): Renal function at presentation by age group for MCD, 2005-2010
0
10
20
30
40
50
60
70
15- <25 25- <35 35- <45 45- <55 55- <65 ≥ 65
Pe
rce
nta
ge
(%
)
Age group
eGFR<60ml/min
eGFR
(ml/
min/1.73 m2)
15-<25 25-<35 35-<45 45-<55 55-<65 ≥ ≥ ≥ ≥ 65 Total
n % n % n % n % n % n % n %
<15 6 1.8 2 1.3 3 3.4 0 0.0 2 8.0 1 9.1 14 2.1
60-89 55 16.6 28 18.7 27 30.3 14 23.0 7 28.0 3 27.3 134 20.1
Missing* 27 8.1 10 6.7 6 6.7 2 3.3 1 4.0 0 0.0 46 6.9
Total 332 100 150 100 89 100 61 100 25 100 11 100 668 100
≥90 207 62.3 92 61.3 32 36.0 18 29.5 6 24.0 1 9.1 356 53.3
15-29 6 1.8 2 1.3 8 9.0 4 6.6 4 16.0 1 9.1 25 3.7
30-59 31 9.3 16 10.7 13 14.6 23 37.7 5 20.0 5 45.5 93 13.9
*Total of 46 cases are missing on GFR, including 15 cases with GFR>200 (GFR range between 201 to 3349)
Figure 2.2.3.1 (c): Impaired renal function at presentation by age group for MCD, 2005-2010
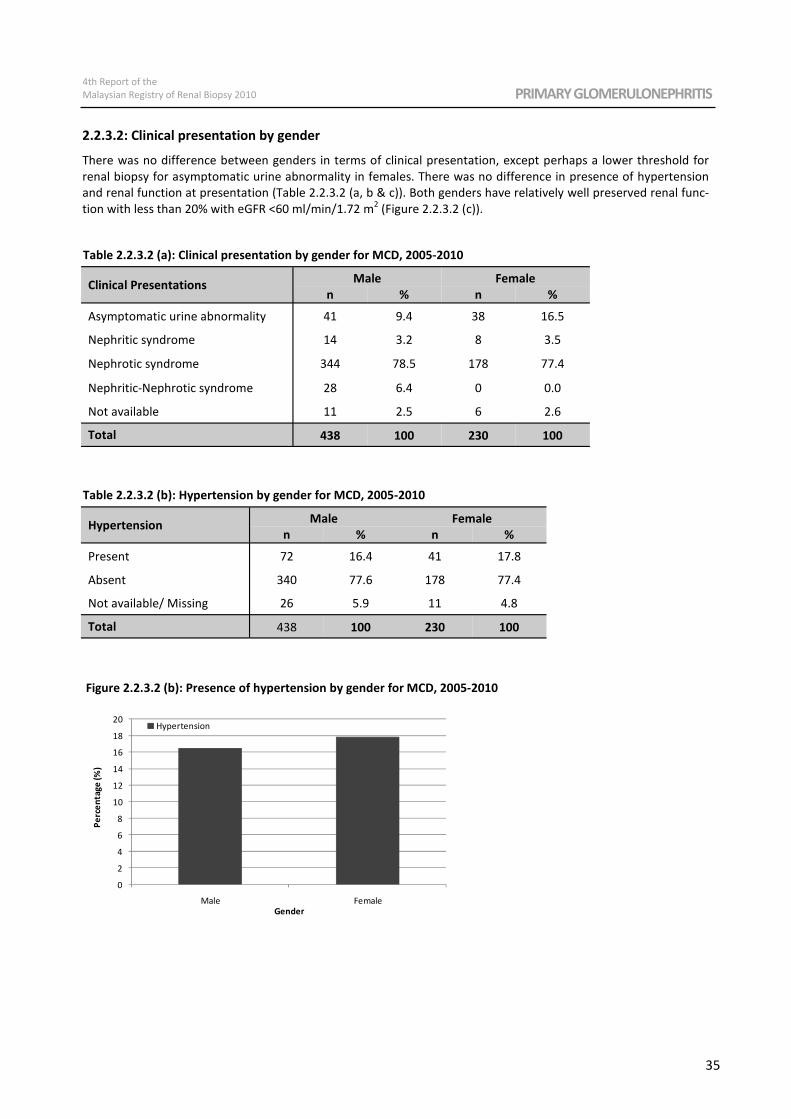
4th Report of the
Malaysian Registry of Renal Biopsy 2010 PRIMARY GLOMERULONEPHRITIS
35
2.2.3.2: Clinical presentation by gender
There was no difference between genders in terms of clinical presentation, except perhaps a lower threshold for
renal biopsy for asymptomatic urine abnormality in females. There was no difference in presence of hypertension
and renal function at presentation (Table 2.2.3.2 (a, b & c)). Both genders have relatively well preserved renal func-
tion with less than 20% with eGFR <60 ml/min/1.72 m2 (Figure 2.2.3.2 (c)).
Clinical Presentations Male Female
n % n %
Asymptomatic urine abnormality 41 9.4 38 16.5
Nephritic syndrome 14 3.2 8 3.5
Nephrotic syndrome 344 78.5 178 77.4
Nephritic-Nephrotic syndrome 28 6.4 0 0.0
Not available 11 2.5 6 2.6
Total 438 100 230 100
Table 2.2.3.2 (a): Clinical presentation by gender for MCD, 2005-2010
0
2
4
6
8
10
12
14
16
18
20
Male Female
Pe
rce
nta
ge
(%
)
Gender
Hypertension
Hypertension Male Female
n % n %
Present 72 16.4 41 17.8
Absent 340 77.6 178 77.4
Not available/ Missing 26 5.9 11 4.8
Total 438 100 230 100
Table 2.2.3.2 (b): Hypertension by gender for MCD, 2005-2010
Figure 2.2.3.2 (b): Presence of hypertension by gender for MCD, 2005-2010
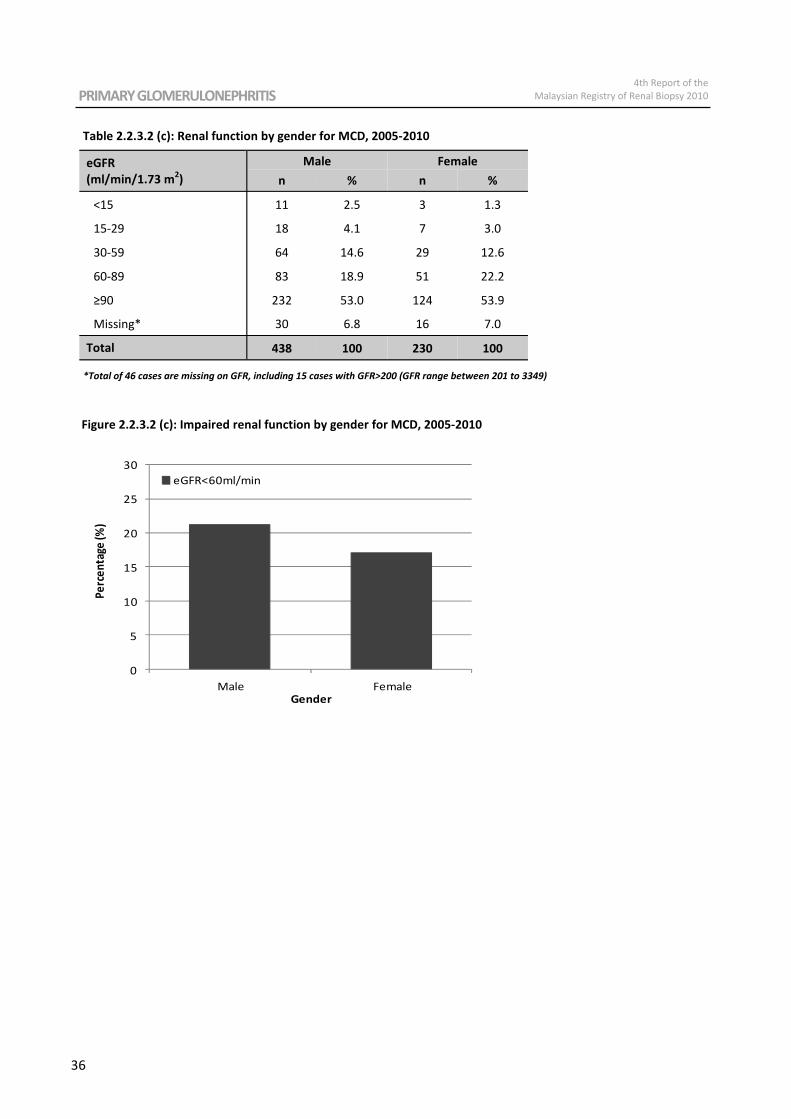
PRIMARY GLOMERULONEPHRITIS 4th Report of the
Malaysian Registry of Renal Biopsy 2010
36
Table 2.2.3.2 (c): Renal function by gender for MCD, 2005-2010
eGFR
(ml/min/1.73 m2)
Male Female
n % n %
<15 11 2.5 3 1.3
15-29 18 4.1 7 3.0
30-59 64 14.6 29 12.6
60-89 83 18.9 51 22.2
≥90 232 53.0 124 53.9
Missing* 30 6.8 16 7.0
Total 438 100 230 100
*Total of 46 cases are missing on GFR, including 15 cases with GFR>200 (GFR range between 201 to 3349)
Figure 2.2.3.2 (c): Impaired renal function by gender for MCD, 2005-2010
0
5
10
15
20
25
30
Male Female
Pe
rce
nta
ge (%
)
Gender
eGFR<60ml/min
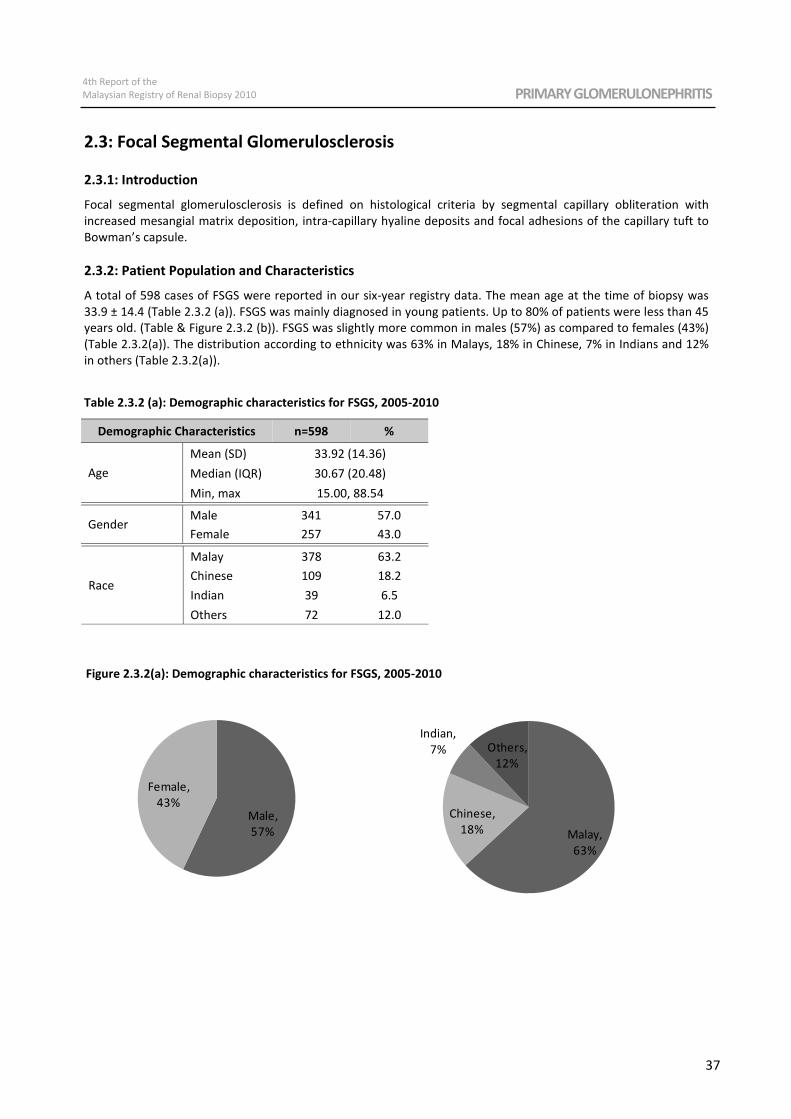
4th Report of the
Malaysian Registry of Renal Biopsy 2010 PRIMARY GLOMERULONEPHRITIS
37
2.3: Focal Segmental Glomerulosclerosis
2.3.1: Introduction
Focal segmental glomerulosclerosis is defined on histological criteria by segmental capillary obliteration with
increased mesangial matrix deposition, intra-capillary hyaline deposits and focal adhesions of the capillary tuft to
Bowman’s capsule.
2.3.2: Patient Population and Characteristics
A total of 598 cases of FSGS were reported in our six-year registry data. The mean age at the time of biopsy was
33.9 ± 14.4 (Table 2.3.2 (a)). FSGS was mainly diagnosed in young patients. Up to 80% of patients were less than 45
years old. (Table & Figure 2.3.2 (b)). FSGS was slightly more common in males (57%) as compared to females (43%)
(Table 2.3.2(a)). The distribution according to ethnicity was 63% in Malays, 18% in Chinese, 7% in Indians and 12%
in others (Table 2.3.2(a)).
Table 2.3.2 (a): Demographic characteristics for FSGS, 2005-2010
Demographic Characteristics n=598 %
Age
Mean (SD) 33.92 (14.36)
Median (IQR) 30.67 (20.48)
Min, max 15.00, 88.54
Gender Male 341 57.0
Female 257 43.0
Race
Malay 378
Others 72
Indian 39
Chinese 109
63.2
18.2
6.5
12.0
Figure 2.3.2(a): Demographic characteristics for FSGS, 2005-2010
Male,
57%
Female,
43%
Malay,
63%
Chinese,
18%
Indian,
7% Others,
12%
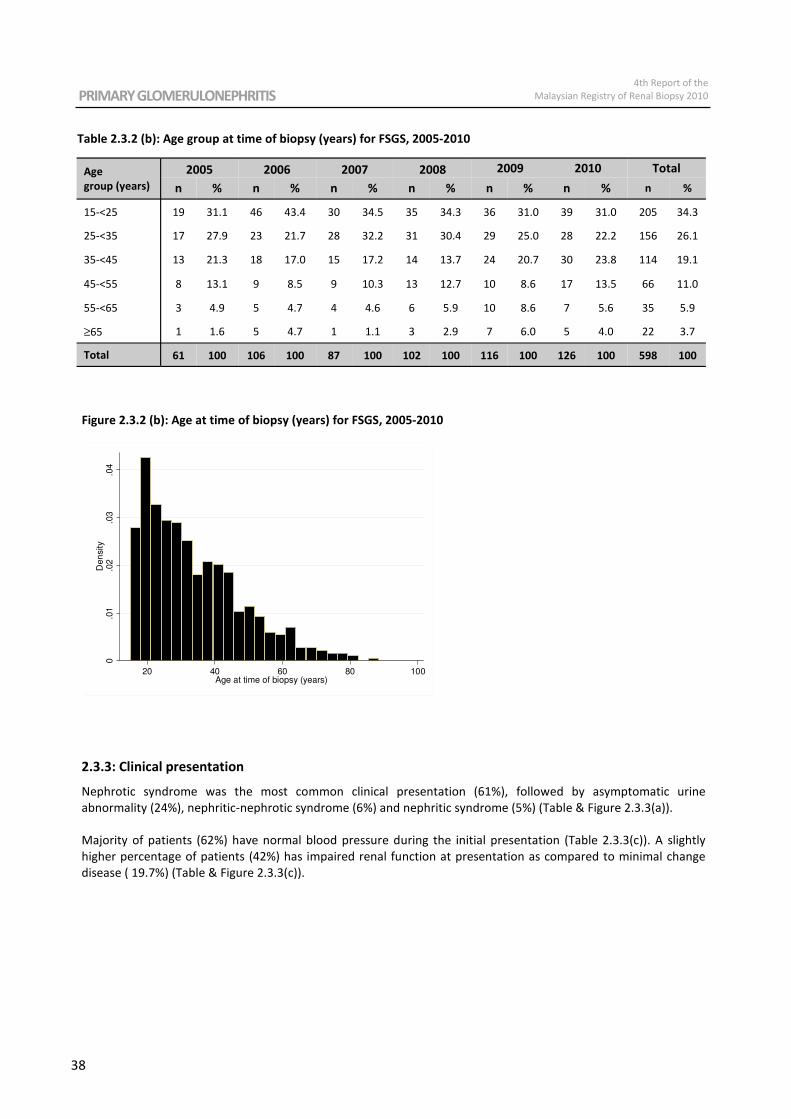
PRIMARY GLOMERULONEPHRITIS 4th Report of the
Malaysian Registry of Renal Biopsy 2010
38
Table 2.3.2 (b): Age group at time of biopsy (years) for FSGS, 2005-2010
Figure 2.3.2 (b): Age at time of biopsy (years) for FSGS, 2005-2010
Age
group (years)
2005 2006 2007 2008 2009 2010 Total
n % n % n % n % n % n % n %
15-<25 19 31.1 46 43.4 30 34.5 35 34.3 36 31.0 39 31.0 205 34.3
25-<35 17 27.9 23 21.7 28 32.2 31 30.4 29 25.0 28 22.2 156 26.1
35-<45 13 21.3 18 17.0 15 17.2 14 13.7 24 20.7 30 23.8 114 19.1
45-<55 8 13.1 9 8.5 9 10.3 13 12.7 10 8.6 17 13.5 66 11.0
55-<65 3 4.9 5 4.7 4 4.6 6 5.9 10 8.6 7 5.6 35 5.9
≥65 1 1.6 5 4.7 1 1.1 3 2.9 7 6.0 5 4.0 22 3.7
Total 61 100 106 100 87 100 102 100 116 100 126 100 598 100
0.0
1.0
2.0
3.0
4D
en
sity
20 40 60 80 100Age at time of biopsy (years)
2.3.3: Clinical presentation
Nephrotic syndrome was the most common clinical presentation (61%), followed by asymptomatic urine
abnormality (24%), nephritic-nephrotic syndrome (6%) and nephritic syndrome (5%) (Table & Figure 2.3.3(a)).
Majority of patients (62%) have normal blood pressure during the initial presentation (Table 2.3.3(c)). A slightly
higher percentage of patients (42%) has impaired renal function at presentation as compared to minimal change
disease ( 19.7%) (Table & Figure 2.3.3(c)).
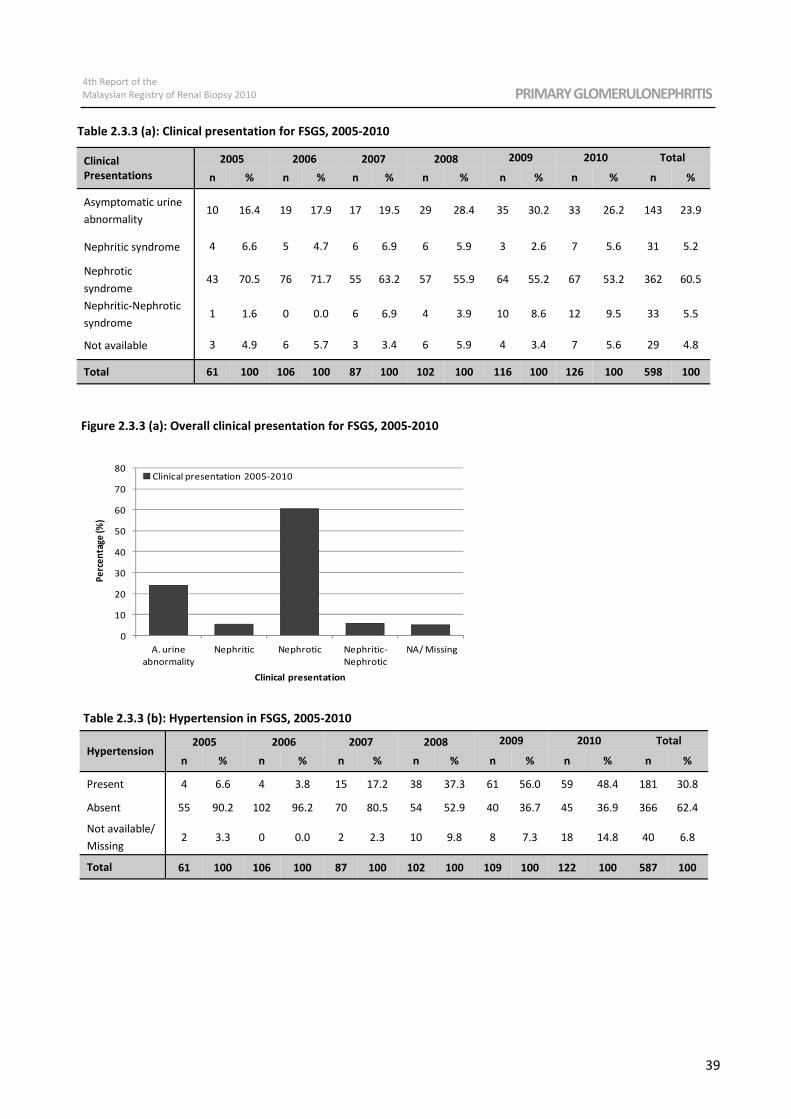
4th Report of the
Malaysian Registry of Renal Biopsy 2010 PRIMARY GLOMERULONEPHRITIS
39
Figure 2.3.3 (a): Overall clinical presentation for FSGS, 2005-2010
Table 2.3.3 (b): Hypertension in FSGS, 2005-2010
Table 2.3.3 (a): Clinical presentation for FSGS, 2005-2010
Clinical
Presentations
2005 2006 2007 2008 2009 2010 Total
n % n % n % n % n % n % n %
Asymptomatic urine
abnormality 10 16.4 19 17.9 17 19.5 29 28.4 35 30.2 33 26.2 143 23.9
Nephritic syndrome 4 6.6 5 4.7 6 6.9 6 5.9 3 2.6 7 5.6 31 5.2
Nephrotic
syndrome 43 70.5 76 71.7 55 63.2 57 55.9 64 55.2 67 53.2 362 60.5
Nephritic-Nephrotic
syndrome 1 1.6 0 0.0 6 6.9 4 3.9 10 8.6 12 9.5 33 5.5
Not available 3 4.9 6 5.7 3 3.4 6 5.9 4 3.4 7 5.6 29 4.8
Total 61 100 106 100 87 100 102 100 116 100 126 100 598 100
Hypertension 2005 2006 2007 2008 2009 2010 Total
n % n % n % n % n % n % n %
Present 4 6.6 4 3.8 15 17.2 38 37.3 61 56.0 59 48.4 181 30.8
Absent 55 90.2 102 96.2 70 80.5 54 52.9 40 36.7 45 36.9 366 62.4
Not available/
Missing 2 3.3 0 0.0 2 2.3 10 9.8 8 7.3 18 14.8 40 6.8
Total 61 100 106 100 87 100 102 100 109 100 122 100 587 100
0
10
20
30
40
50
60
70
80
A. urine
abnormality
Nephritic Nephrotic Nephritic-
Nephrotic
NA/ Missing
Pe
rce
nta
ge (%
)
Clinical presentation
Clinical presentation 2005-2010
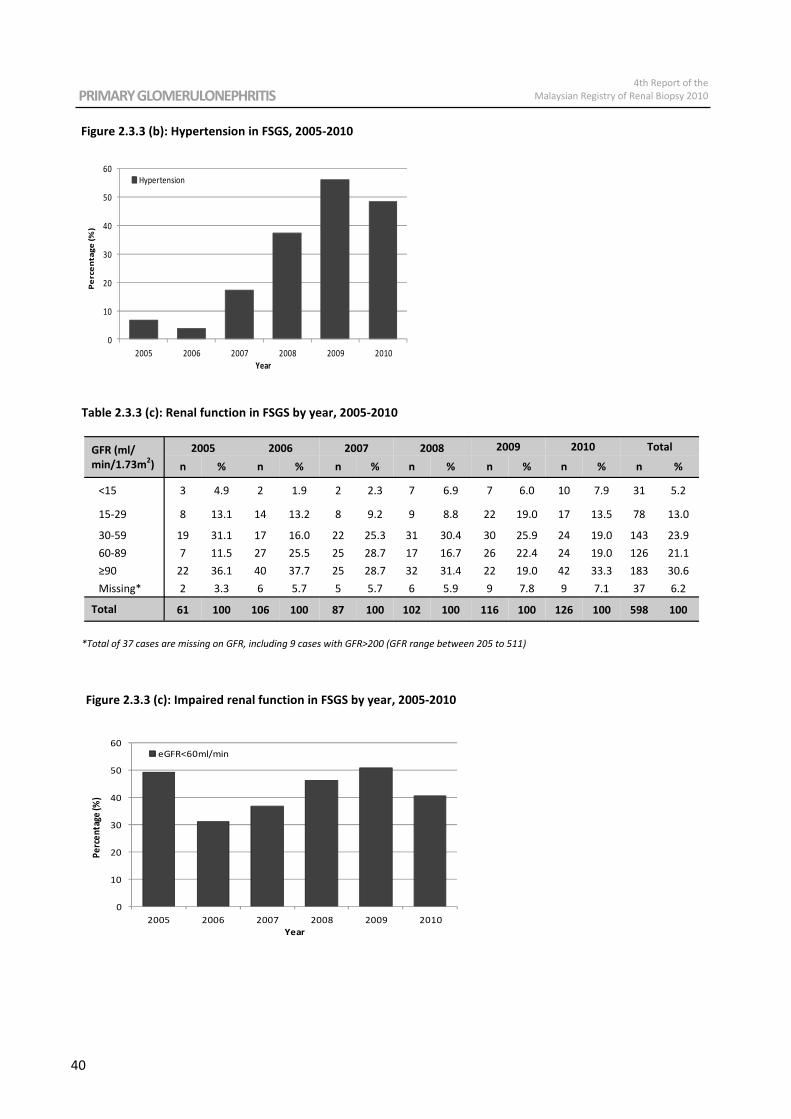
PRIMARY GLOMERULONEPHRITIS 4th Report of the
Malaysian Registry of Renal Biopsy 2010
40
Figure 2.3.3 (b): Hypertension in FSGS, 2005-2010
Table 2.3.3 (c): Renal function in FSGS by year, 2005-2010
GFR (ml/
min/1.73m2)
2005 2006 2007 2008 2009 2010 Total
n % n % n % n % n % n % n %
<15 3 4.9 2 1.9 2 2.3 7 6.9 7 6.0 10 7.9 31 5.2
15-29 8 13.1 14 13.2 8 9.2 9 8.8 22 19.0 17 13.5 78 13.0
Missing* 2 3.3 6 5.7 5 5.7 6 5.9 9 7.8 9 7.1 37 6.2
Total 61 100 106 100 87 100 102 100 116 100 126 100 598 100
30-59 19 31.1 17 16.0 22 25.3 31 30.4 30 25.9 24 19.0 143 23.9
60-89 7 11.5 27 25.5 25 28.7 17 16.7 26 22.4 24 19.0 126 21.1
≥90 22 36.1 40 37.7 25 28.7 32 31.4 22 19.0 42 33.3 183 30.6
*Total of 37 cases are missing on GFR, including 9 cases with GFR>200 (GFR range between 205 to 511)
Figure 2.3.3 (c): Impaired renal function in FSGS by year, 2005-2010
0
10
20
30
40
50
60
2005 2006 2007 2008 2009 2010
Pe
rce
nta
ge
(%
)
Year
Hypertension
0
10
20
30
40
50
60
2005 2006 2007 2008 2009 2010
Pe
rce
nta
ge (%
)
Year
eGFR<60ml/min
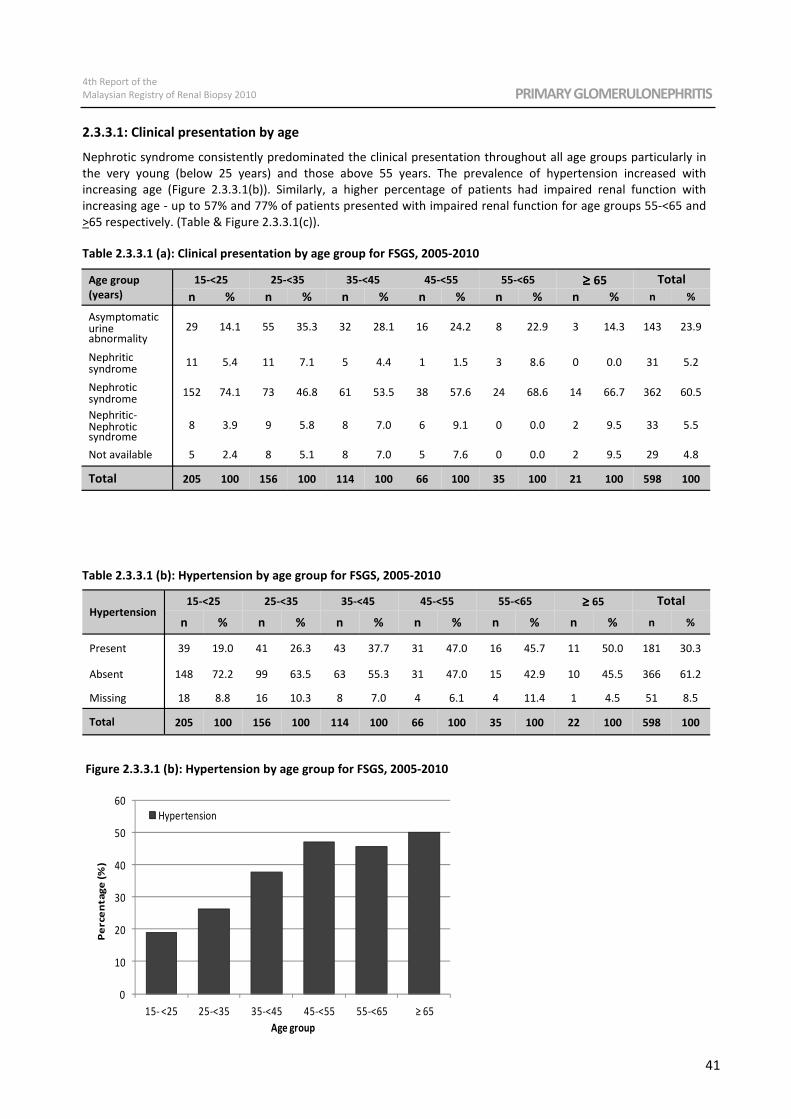
4th Report of the
Malaysian Registry of Renal Biopsy 2010 PRIMARY GLOMERULONEPHRITIS
41
2.3.3.1: Clinical presentation by age
Nephrotic syndrome consistently predominated the clinical presentation throughout all age groups particularly in
the very young (below 25 years) and those above 55 years. The prevalence of hypertension increased with
increasing age (Figure 2.3.3.1(b)). Similarly, a higher percentage of patients had impaired renal function with
increasing age - up to 57% and 77% of patients presented with impaired renal function for age groups 55-<65 and
>65 respectively. (Table & Figure 2.3.3.1(c)).
Table 2.3.3.1 (a): Clinical presentation by age group for FSGS, 2005-2010
Table 2.3.3.1 (b): Hypertension by age group for FSGS, 2005-2010
Age group
(years)
15-<25 25-<35 35-<45 45-<55 55-<65 ≥ ≥ ≥ ≥ 65 Total
n % n % n % n % n % n % n %
Asymptomatic urine abnormality
29 14.1 55 35.3 32 28.1 16 24.2 8 22.9 3 14.3 143 23.9
Nephritic syndrome
11 5.4 11 7.1 5 4.4 1 1.5 3 8.6 0 0.0 31 5.2
Nephrotic syndrome
152 74.1 73 46.8 61 53.5 38 57.6 24 68.6 14 66.7 362 60.5
Nephritic- Nephrotic syndrome
8 3.9 9 5.8 8 7.0 6 9.1 0 0.0 2 9.5 33 5.5
Not available 5 2.4 8 5.1 8 7.0 5 7.6 0 0.0 2 9.5 29 4.8
Total 205 100 156 100 114 100 66 100 35 100 21 100 598 100
Hypertension 15-<25 25-<35 35-<45 45-<55 55-<65 ≥ ≥ ≥ ≥ 65 Total
n % n % n % n % n % n % n %
Present 39 19.0 41 26.3 43 37.7 31 47.0 16 45.7 11 50.0 181 30.3
Absent 148 72.2 99 63.5 63 55.3 31 47.0 15 42.9 10 45.5 366 61.2
Missing 18 8.8 16 10.3 8 7.0 4 6.1 4 11.4 1 4.5 51 8.5
Total 205 100 156 100 114 100 66 100 35 100 22 100 598 100
Figure 2.3.3.1 (b): Hypertension by age group for FSGS, 2005-2010
0
10
20
30
40
50
60
15- <25 25-<35 35-<45 45-<55 55-<65 ≥ 65
Pe
rce
nta
ge
(%
)
Age group
Hypertension
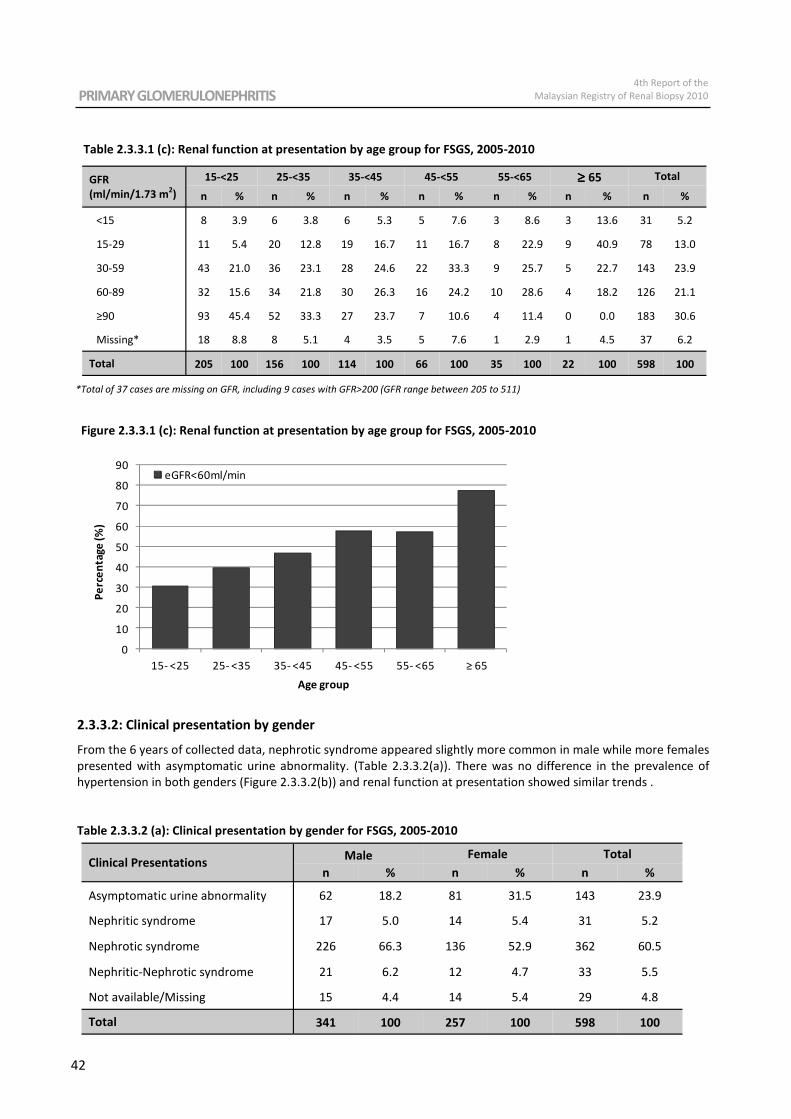
PRIMARY GLOMERULONEPHRITIS 4th Report of the
Malaysian Registry of Renal Biopsy 2010
42
Figure 2.3.3.1 (c): Renal function at presentation by age group for FSGS, 2005-2010
2.3.3.2: Clinical presentation by gender
From the 6 years of collected data, nephrotic syndrome appeared slightly more common in male while more females
presented with asymptomatic urine abnormality. (Table 2.3.3.2(a)). There was no difference in the prevalence of
hypertension in both genders (Figure 2.3.3.2(b)) and renal function at presentation showed similar trends .
Table 2.3.3.2 (a): Clinical presentation by gender for FSGS, 2005-2010
Table 2.3.3.1 (c): Renal function at presentation by age group for FSGS, 2005-2010
GFR
(ml/min/1.73 m2)
15-<25 25-<35 35-<45 45-<55 55-<65 ≥ ≥ ≥ ≥ 65 Total
n % n % n % n % n % n % n %
<15 8 3.9 6 3.8 6 5.3 5 7.6 3 8.6 3 13.6 31 5.2
60-89 32 15.6 34 21.8 30 26.3 16 24.2 10 28.6 4 18.2 126 21.1
Missing* 18 8.8 8 5.1 4 3.5 5 7.6 1 2.9 1 4.5 37 6.2
Total 205 100 156 100 114 100 66 100 35 100 22 100 598 100
≥90 93 45.4 52 33.3 27 23.7 7 10.6 4 11.4 0 0.0 183 30.6
15-29 11 5.4 20 12.8 19 16.7 11 16.7 8 22.9 9 40.9 78 13.0
30-59 43 21.0 36 23.1 28 24.6 22 33.3 9 25.7 5 22.7 143 23.9
*Total of 37 cases are missing on GFR, including 9 cases with GFR>200 (GFR range between 205 to 511)
Clinical Presentations Male Female
n % n % n %
Asymptomatic urine abnormality 62 18.2 81 31.5 143 23.9
Nephritic syndrome 17 5.0 14 5.4 31 5.2
Nephrotic syndrome 226 66.3 136 52.9 362 60.5
Nephritic-Nephrotic syndrome 21 6.2 12 4.7 33 5.5
Not available/Missing 15 4.4 14 5.4 29 4.8
Total 341 100 257 100 598 100
Total
0
10
20
30
40
50
60
70
80
90
15- <25 25- <35 35- <45 45- <55 55- <65 ≥ 65
Pe
rce
nta
ge (
%)
Age group
eGFR<60ml/min
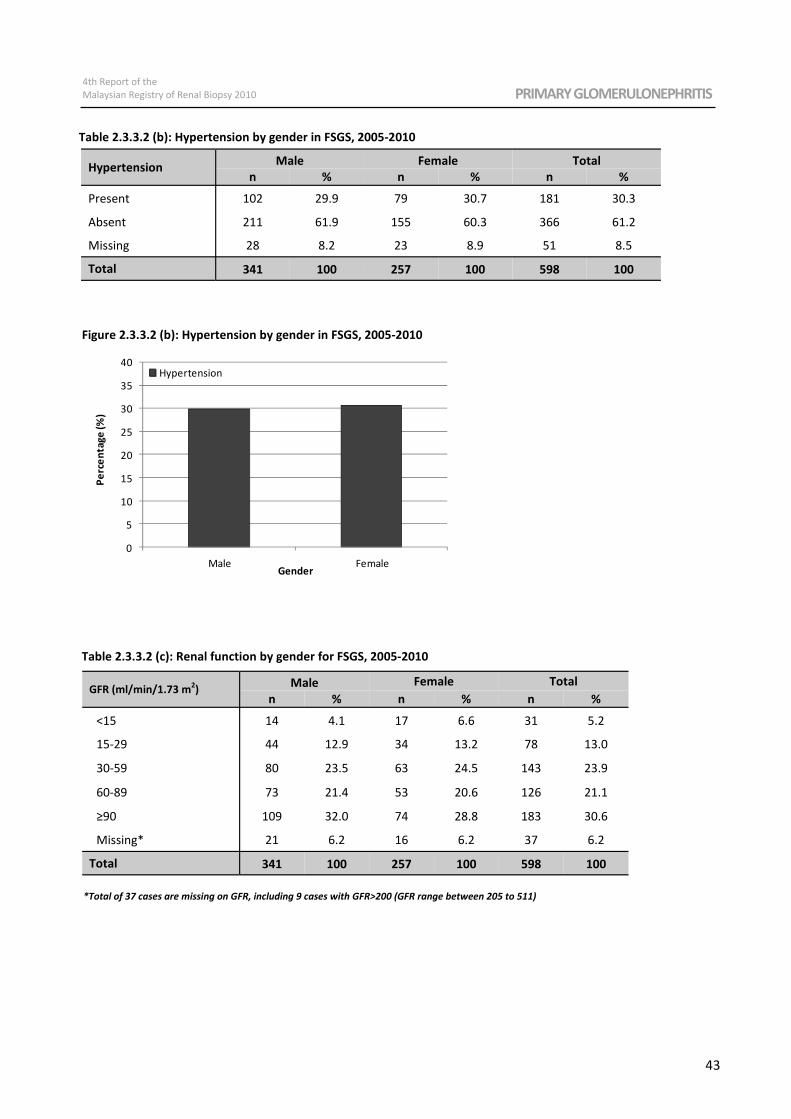
4th Report of the
Malaysian Registry of Renal Biopsy 2010 PRIMARY GLOMERULONEPHRITIS
43
Hypertension Male Female
n % n % n %
Present 102 29.9 79 30.7 181 30.3
Absent 211 61.9 155 60.3 366 61.2
Missing 28 8.2 23 8.9 51 8.5
Total 341 100 257 100 598 100
Total
Table 2.3.3.2 (b): Hypertension by gender in FSGS, 2005-2010
Figure 2.3.3.2 (b): Hypertension by gender in FSGS, 2005-2010
Table 2.3.3.2 (c): Renal function by gender for FSGS, 2005-2010
*Total of 37 cases are missing on GFR, including 9 cases with GFR>200 (GFR range between 205 to 511)
GFR (ml/min/1.73 m2)
Male Female
n % n % n %
<15 14 4.1 17 6.6 31 5.2
15-29 44 12.9 34 13.2 78 13.0
30-59 80 23.5 63 24.5 143 23.9
≥90 109 32.0 74 28.8 183 30.6
Missing* 21 6.2 16 6.2 37 6.2
Total 341 100 257 100 598 100
Total
60-89 73 21.4 53 20.6 126 21.1
0
5
10
15
20
25
30
35
40
Male Female
Pe
rce
nta
ge
(%
)
Gender
Hypertension
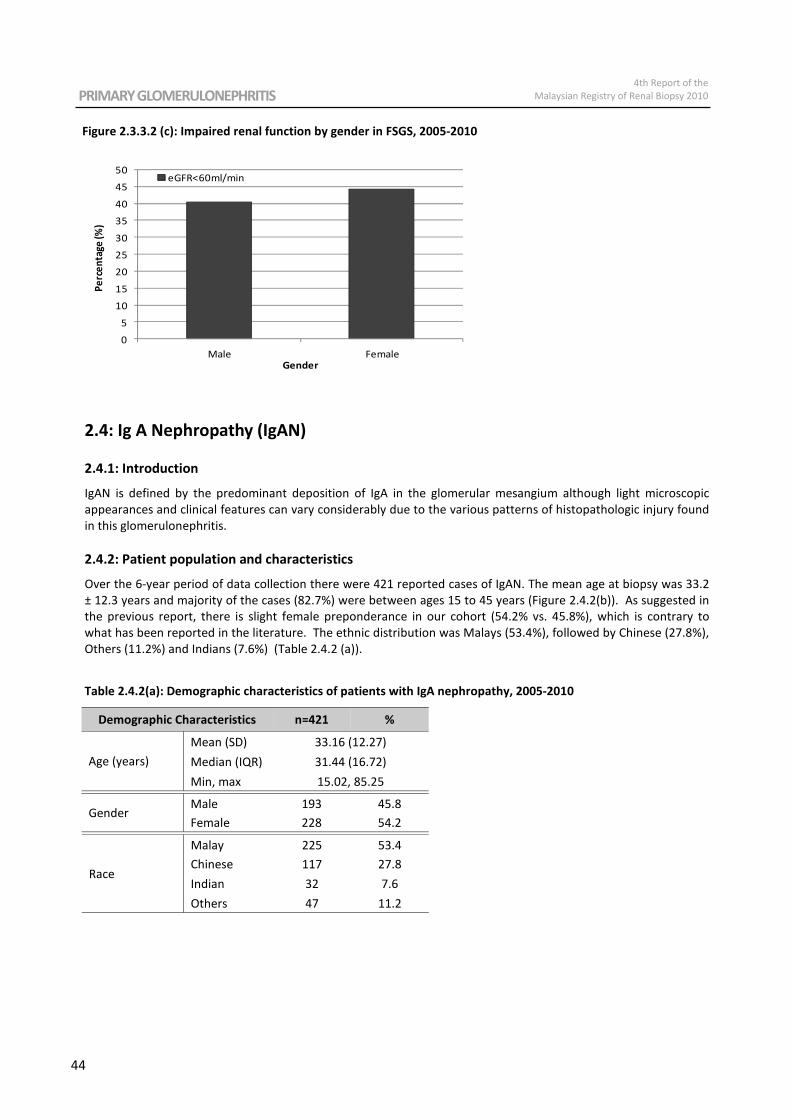
PRIMARY GLOMERULONEPHRITIS 4th Report of the
Malaysian Registry of Renal Biopsy 2010
44
Figure 2.3.3.2 (c): Impaired renal function by gender in FSGS, 2005-2010
2.4: Ig A Nephropathy (IgAN)
2.4.1: Introduction
IgAN is defined by the predominant deposition of IgA in the glomerular mesangium although light microscopic
appearances and clinical features can vary considerably due to the various patterns of histopathologic injury found
in this glomerulonephritis.
2.4.2: Patient population and characteristics
Over the 6-year period of data collection there were 421 reported cases of IgAN. The mean age at biopsy was 33.2
± 12.3 years and majority of the cases (82.7%) were between ages 15 to 45 years (Figure 2.4.2(b)). As suggested in
the previous report, there is slight female preponderance in our cohort (54.2% vs. 45.8%), which is contrary to
what has been reported in the literature. The ethnic distribution was Malays (53.4%), followed by Chinese (27.8%),
Others (11.2%) and Indians (7.6%) (Table 2.4.2 (a)).
Table 2.4.2(a): Demographic characteristics of patients with IgA nephropathy, 2005-2010
Demographic Characteristics n=421 %
Age (years)
Mean (SD) 33.16 (12.27)
Median (IQR) 31.44 (16.72)
Min, max 15.02, 85.25
Gender Male 193 45.8
Female 228 54.2
Race
Malay 225
Others 47
Indian 32
Chinese 117
53.4
27.8
7.6
11.2
0
5
10
15
20
25
30
35
40
45
50
Male Female
Pe
rce
nta
ge (%
)
Gender
eGFR<60ml/min
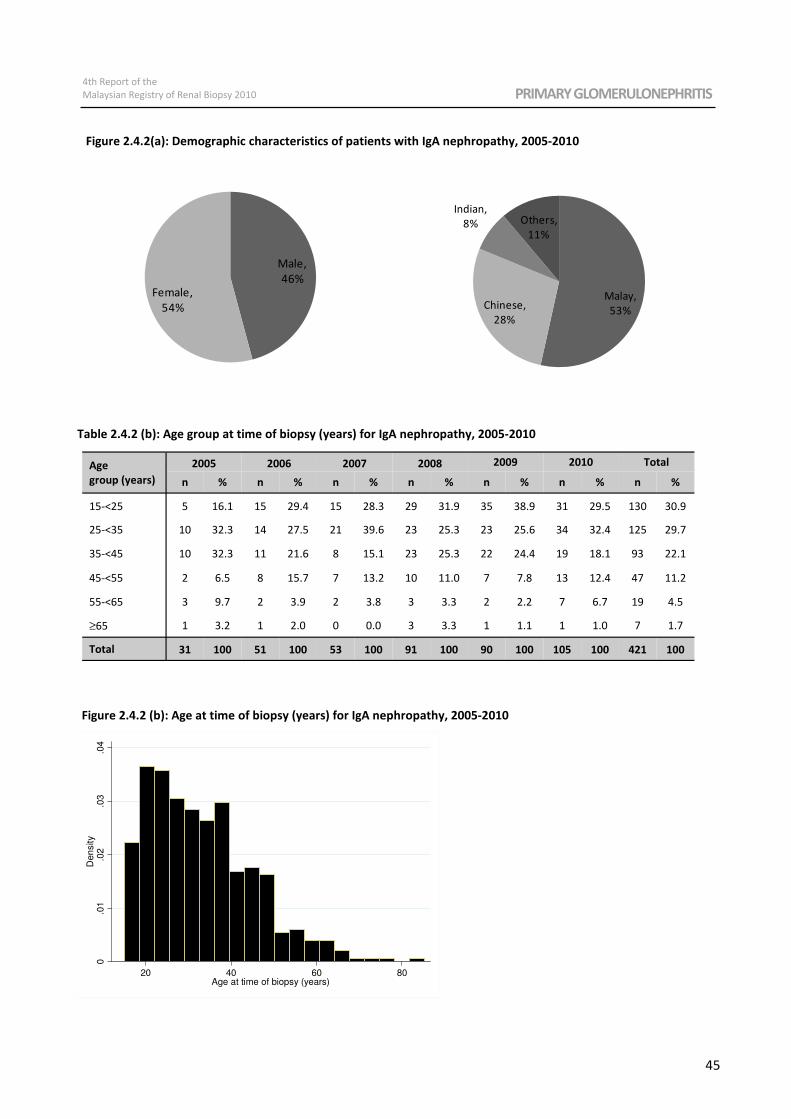
4th Report of the
Malaysian Registry of Renal Biopsy 2010 PRIMARY GLOMERULONEPHRITIS
45
Figure 2.4.2(a): Demographic characteristics of patients with IgA nephropathy, 2005-2010
Table 2.4.2 (b): Age group at time of biopsy (years) for IgA nephropathy, 2005-2010
Figure 2.4.2 (b): Age at time of biopsy (years) for IgA nephropathy, 2005-2010
Age
group (years)
2005 2006 2007 2008 2009 2010 Total
n % n % n % n % n % n % n %
15-<25 5 16.1 15 29.4 15 28.3 29 31.9 35 38.9 31 29.5 130 30.9
25-<35 10 32.3 14 27.5 21 39.6 23 25.3 23 25.6 34 32.4 125 29.7
35-<45 10 32.3 11 21.6 8 15.1 23 25.3 22 24.4 19 18.1 93 22.1
45-<55 2 6.5 8 15.7 7 13.2 10 11.0 7 7.8 13 12.4 47 11.2
55-<65 3 9.7 2 3.9 2 3.8 3 3.3 2 2.2 7 6.7 19 4.5
≥65 1 3.2 1 2.0 0 0.0 3 3.3 1 1.1 1 1.0 7 1.7
Total 31 100 51 100 53 100 91 100 90 100 105 100 421 100
Male,
46%Female,
54%Malay,
53%Chinese,
28%
Indian,
8% Others,
11%
0.0
1.0
2.0
3.0
4D
en
sity
20 40 60 80Age at time of biopsy (years)
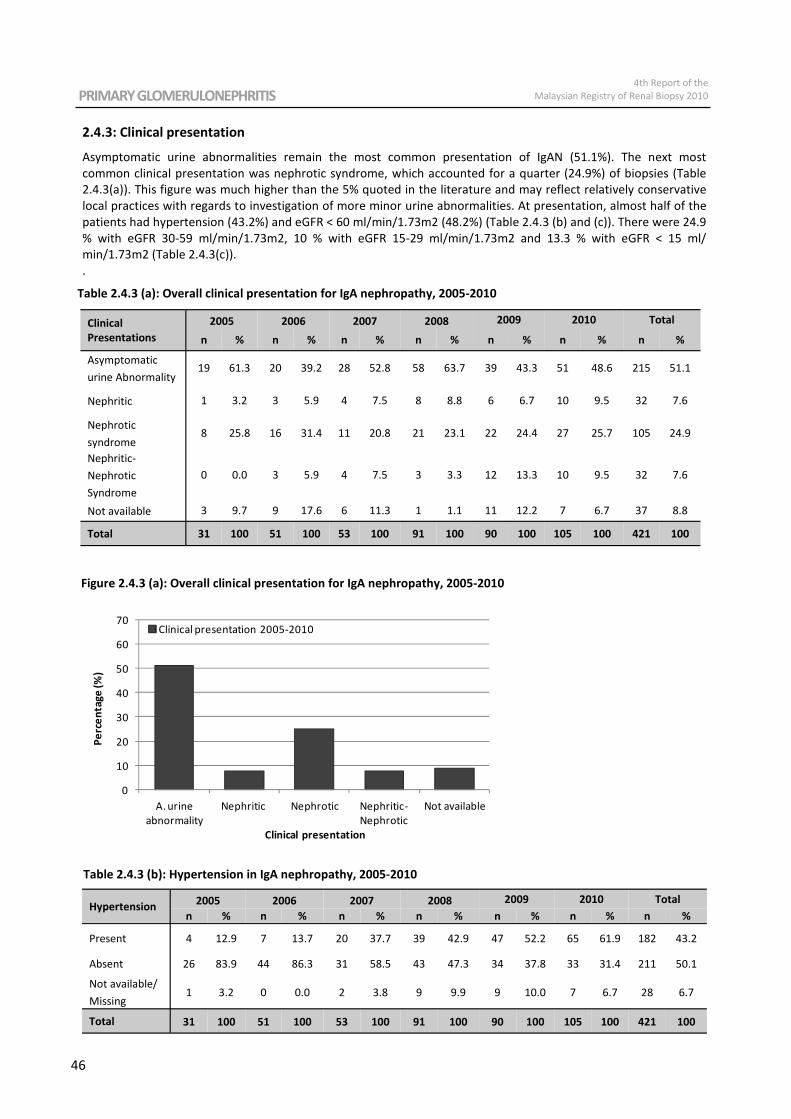
PRIMARY GLOMERULONEPHRITIS 4th Report of the
Malaysian Registry of Renal Biopsy 2010
46
Figure 2.4.3 (a): Overall clinical presentation for IgA nephropathy, 2005-2010
Table 2.4.3 (b): Hypertension in IgA nephropathy, 2005-2010
Table 2.4.3 (a): Overall clinical presentation for IgA nephropathy, 2005-2010
Clinical
Presentations
2005 2006 2007 2008 2009 2010 Total
n % n % n % n % n % n % n %
Asymptomatic
urine Abnormality 19 61.3 20 39.2 28 52.8 58 63.7 39 43.3 51 48.6 215 51.1
Nephritic 1 3.2 3 5.9 4 7.5 8 8.8 6 6.7 10 9.5 32 7.6
Nephrotic
syndrome 8 25.8 16 31.4 11 20.8 21 23.1 22 24.4 27 25.7 105 24.9
Nephritic-
Nephrotic
Syndrome
0 0.0 3 5.9 4 7.5 3 3.3 12 13.3 10 9.5 32 7.6
Not available 3 9.7 9 17.6 6 11.3 1 1.1 11 12.2 7 6.7 37 8.8
Total 31 100 51 100 53 100 91 100 90 100 105 100 421 100
Hypertension 2005 2006 2007 2008 2009 2010 Total
n % n % n % n % n % n % n %
Present 4 12.9 7 13.7 20 37.7 39 42.9 47 52.2 65 61.9 182 43.2
Absent 26 83.9 44 86.3 31 58.5 43 47.3 34 37.8 33 31.4 211 50.1
Not available/
Missing 1 3.2 0 0.0 2 3.8 9 9.9 9 10.0 7 6.7 28 6.7
Total 31 100 51 100 53 100 91 100 90 100 105 100 421 100
2.4.3: Clinical presentation
Asymptomatic urine abnormalities remain the most common presentation of IgAN (51.1%). The next most
common clinical presentation was nephrotic syndrome, which accounted for a quarter (24.9%) of biopsies (Table
2.4.3(a)). This figure was much higher than the 5% quoted in the literature and may reflect relatively conservative
local practices with regards to investigation of more minor urine abnormalities. At presentation, almost half of the
patients had hypertension (43.2%) and eGFR < 60 ml/min/1.73m2 (48.2%) (Table 2.4.3 (b) and (c)). There were 24.9
% with eGFR 30-59 ml/min/1.73m2, 10 % with eGFR 15-29 ml/min/1.73m2 and 13.3 % with eGFR < 15 ml/
min/1.73m2 (Table 2.4.3(c)).
.
0
10
20
30
40
50
60
70
A. urine
abnormality
Nephritic Nephrotic Nephritic-
Nephrotic
Not available
Pe
rce
nta
ge
(%
)
Clinical presentation
Clinical presentation 2005-2010
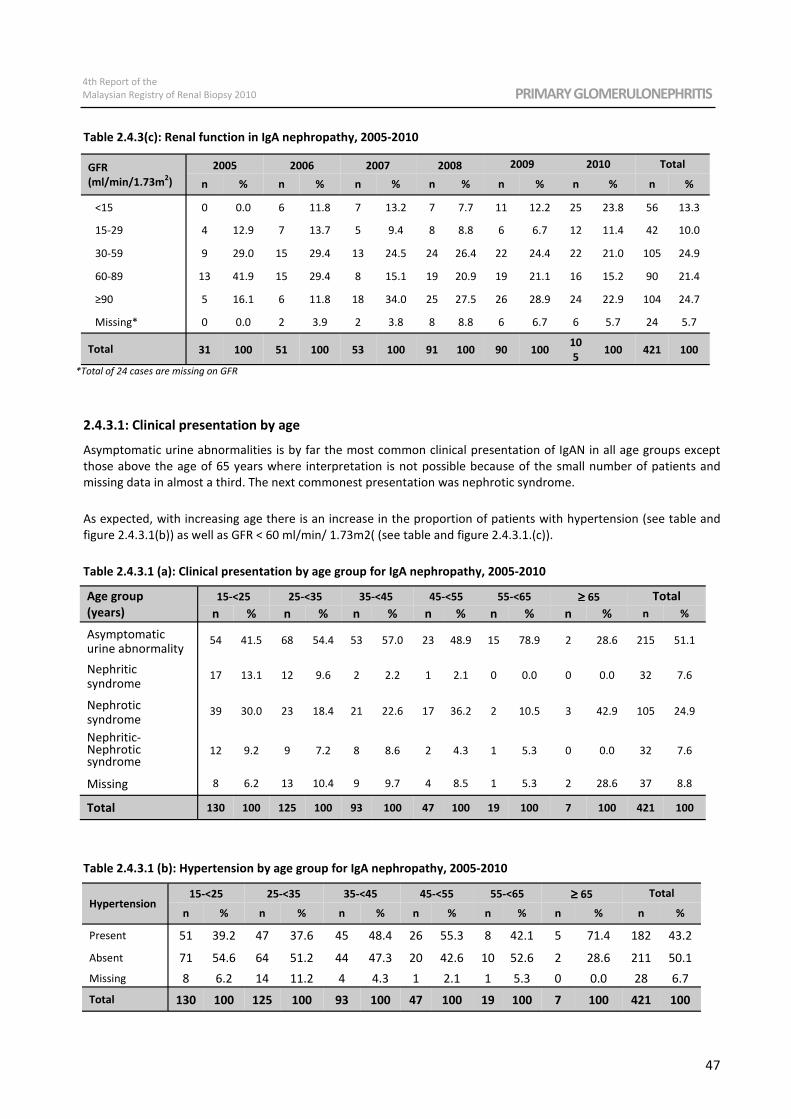
4th Report of the
Malaysian Registry of Renal Biopsy 2010 PRIMARY GLOMERULONEPHRITIS
47
2.4.3.1: Clinical presentation by age
Asymptomatic urine abnormalities is by far the most common clinical presentation of IgAN in all age groups except
those above the age of 65 years where interpretation is not possible because of the small number of patients and
missing data in almost a third. The next commonest presentation was nephrotic syndrome.
As expected, with increasing age there is an increase in the proportion of patients with hypertension (see table and
figure 2.4.3.1(b)) as well as GFR < 60 ml/min/ 1.73m2( (see table and figure 2.4.3.1.(c)).
Table 2.4.3.1 (a): Clinical presentation by age group for IgA nephropathy, 2005-2010
Table 2.4.3(c): Renal function in IgA nephropathy, 2005-2010
*Total of 24 cases are missing on GFR
GFR
(ml/min/1.73m2)
2005 2006 2007 2008 2009 2010 Total
n % n % n % n % n % n % n %
<15 0 0.0 6 11.8 7 13.2 7 7.7 11 12.2 25 23.8 56 13.3
15-29 4 12.9 7 13.7 5 9.4 8 8.8 6 6.7 12 11.4 42 10.0
Missing* 0 0.0 2 3.9 2 3.8 8 8.8 6 6.7 6 5.7 24 5.7
Total 31 100 51 100 53 100 91 100 90 100 10
5 100 421 100
30-59 9 29.0 15 29.4 13 24.5 24 26.4 22 24.4 22 21.0 105 24.9
60-89 13 41.9 15 29.4 8 15.1 19 20.9 19 21.1 16 15.2 90 21.4
≥90 5 16.1 6 11.8 18 34.0 25 27.5 26 28.9 24 22.9 104 24.7
Age group
(years)
15-<25 25-<35 35-<45 45-<55 55-<65 ≥ ≥ ≥ ≥ 65 Total
n % n % n % n % n % n % n %
Asymptomatic urine abnormality
54 41.5 68 54.4 53 57.0 23 48.9 15 78.9 2 28.6 215 51.1
Nephritic syndrome
17 13.1 12 9.6 2 2.2 1 2.1 0 0.0 0 0.0 32 7.6
Nephrotic syndrome
39 30.0 23 18.4 21 22.6 17 36.2 2 10.5 3 42.9 105 24.9
Nephritic- Nephrotic syndrome
12 9.2 9 7.2 8 8.6 2 4.3 1 5.3 0 0.0 32 7.6
Missing 8 6.2 13 10.4 9 9.7 4 8.5 1 5.3 2 28.6 37 8.8
Total 130 100 125 100 93 100 47 100 19 100 7 100 421 100
Table 2.4.3.1 (b): Hypertension by age group for IgA nephropathy, 2005-2010
Hypertension 15-<25 25-<35 35-<45 45-<55 55-<65 ≥ ≥ ≥ ≥ 65 Total
n % n % n % n % n % n % n %
Present 51 39.2 47 37.6 45 48.4 26 55.3 8 42.1 5 71.4 182 43.2
Absent 71 54.6 64 51.2 44 47.3 20 42.6 10 52.6 2 28.6 211 50.1
Missing 8 6.2 14 11.2 4 4.3 1 2.1 1 5.3 0 0.0 28 6.7
Total 130 100 125 100 93 100 47 100 19 100 7 100 421 100
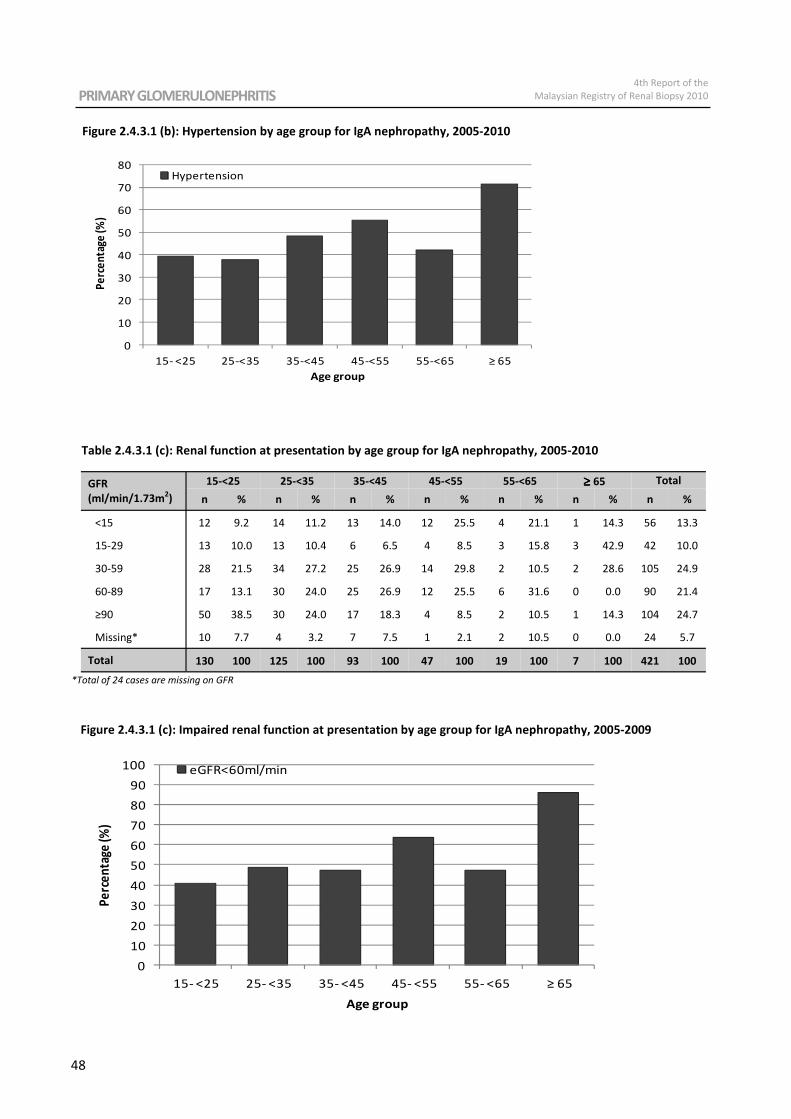
PRIMARY GLOMERULONEPHRITIS 4th Report of the
Malaysian Registry of Renal Biopsy 2010
48
Figure 2.4.3.1 (b): Hypertension by age group for IgA nephropathy, 2005-2010
Table 2.4.3.1 (c): Renal function at presentation by age group for IgA nephropathy, 2005-2010
GFR
(ml/min/1.73m2)
15-<25 25-<35 35-<45 45-<55 55-<65 ≥ ≥ ≥ ≥ 65 Total
n % n % n % n % n % n % n %
<15 12 9.2 14 11.2 13 14.0 12 25.5 4 21.1 1 14.3 56 13.3
15-29 13 10.0 13 10.4 6 6.5 4 8.5 3 15.8 3 42.9 42 10.0
Missing* 10 7.7 4 3.2 7 7.5 1 2.1 2 10.5 0 0.0 24 5.7
Total 130 100 125 100 93 100 47 100 19 100 7 100 421 100
30-59 28 21.5 34 27.2 25 26.9 14 29.8 2 10.5 2 28.6 105 24.9
60-89 17 13.1 30 24.0 25 26.9 12 25.5 6 31.6 0 0.0 90 21.4
≥90 50 38.5 30 24.0 17 18.3 4 8.5 2 10.5 1 14.3 104 24.7
*Total of 24 cases are missing on GFR
Figure 2.4.3.1 (c): Impaired renal function at presentation by age group for IgA nephropathy, 2005-2009
0
10
20
30
40
50
60
70
80
15- <25 25-<35 35-<45 45-<55 55-<65 ≥ 65
Pe
rce
nta
ge (%
)
Age group
Hypertension
0
10
20
30
40
50
60
70
80
90
100
15- <25 25- <35 35- <45 45- <55 55- <65 ≥ 65
Pe
rce
nta
ge (%
)
Age group
eGFR<60ml/min
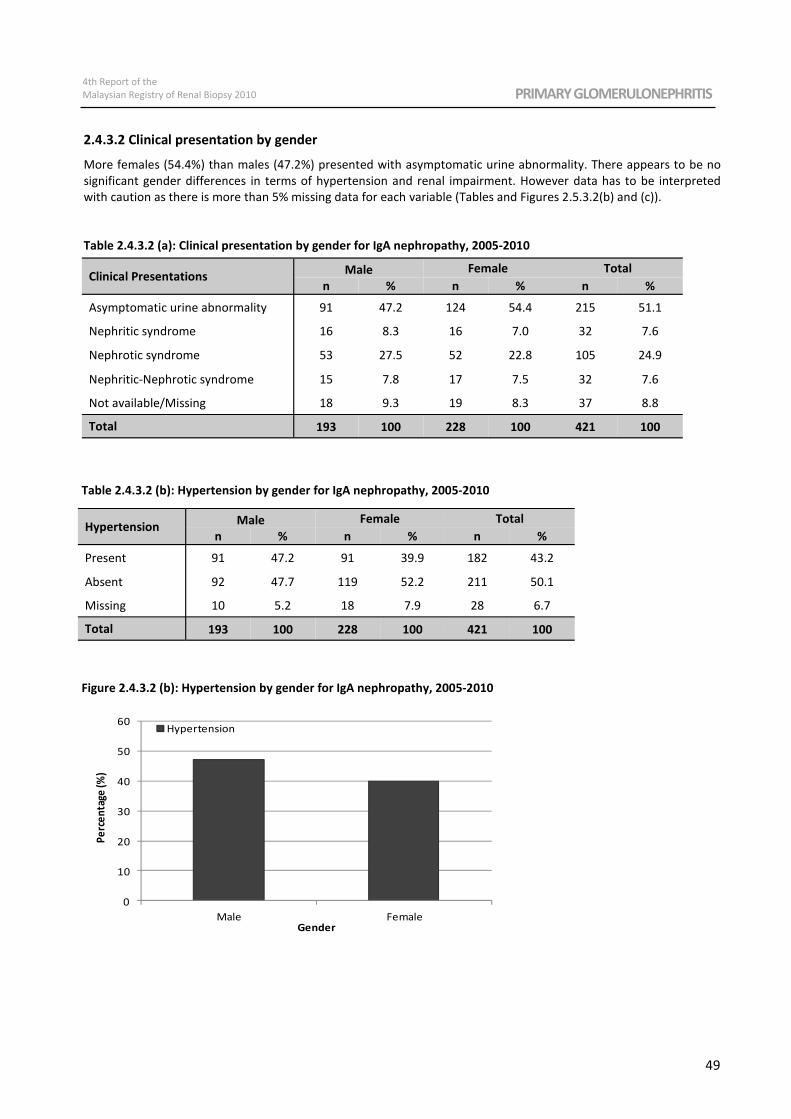
4th Report of the
Malaysian Registry of Renal Biopsy 2010 PRIMARY GLOMERULONEPHRITIS
49
2.4.3.2 Clinical presentation by gender
More females (54.4%) than males (47.2%) presented with asymptomatic urine abnormality. There appears to be no
significant gender differences in terms of hypertension and renal impairment. However data has to be interpreted
with caution as there is more than 5% missing data for each variable (Tables and Figures 2.5.3.2(b) and (c)).
Table 2.4.3.2 (a): Clinical presentation by gender for IgA nephropathy, 2005-2010
Clinical Presentations Male Female
n % n % n %
Asymptomatic urine abnormality 91 47.2 124 54.4 215 51.1
Nephritic syndrome 16 8.3 16 7.0 32 7.6
Nephrotic syndrome 53 27.5 52 22.8 105 24.9
Nephritic-Nephrotic syndrome 15 7.8 17 7.5 32 7.6
Not available/Missing 18 9.3 19 8.3 37 8.8
Total 193 100 228 100 421 100
Total
Table 2.4.3.2 (b): Hypertension by gender for IgA nephropathy, 2005-2010
Hypertension Male Female Total
n % n % n %
Present 91 47.2 91 39.9 182 43.2
Absent 92 47.7 119 52.2 211 50.1
Missing 10 5.2 18 7.9 28 6.7
Total 193 100 228 100 421 100
Figure 2.4.3.2 (b): Hypertension by gender for IgA nephropathy, 2005-2010
0
10
20
30
40
50
60
Male Female
Pe
rce
nta
ge (%
)
Gender
Hypertension
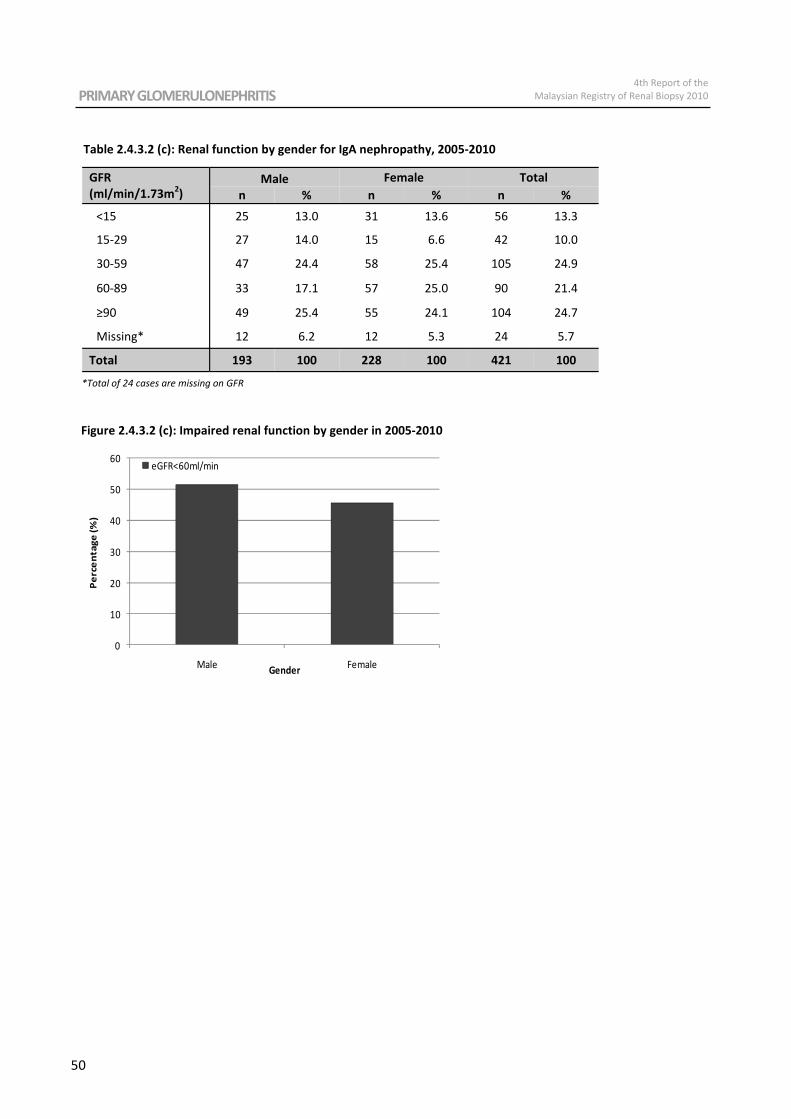
PRIMARY GLOMERULONEPHRITIS 4th Report of the
Malaysian Registry of Renal Biopsy 2010
50
Figure 2.4.3.2 (c): Impaired renal function by gender in 2005-2010
Table 2.4.3.2 (c): Renal function by gender for IgA nephropathy, 2005-2010
*Total of 24 cases are missing on GFR
GFR
(ml/min/1.73m2)
Male Female
n % n % n %
<15 25 13.0 31 13.6 56 13.3
15-29 27 14.0 15 6.6 42 10.0
60-89 33 17.1 57 25.0 90 21.4
≥90 49 25.4 55 24.1 104 24.7
Missing* 12 6.2 12 5.3 24 5.7
Total 193 100 228 100 421 100
Total
30-59 47 24.4 58 25.4 105 24.9
0
10
20
30
40
50
60
Male Female
Pe
rce
nta
ge
(%
)
Gender
eGFR<60ml/min
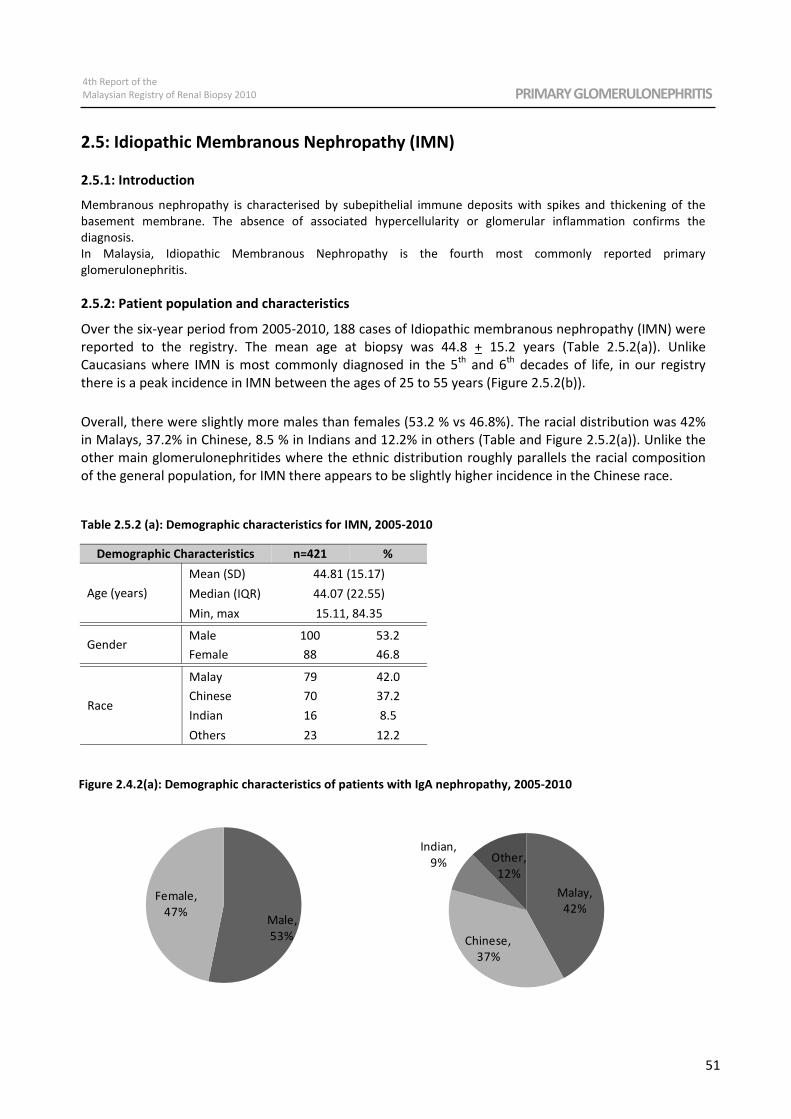
4th Report of the
Malaysian Registry of Renal Biopsy 2010 PRIMARY GLOMERULONEPHRITIS
51
2.5: Idiopathic Membranous Nephropathy (IMN)
2.5.1: Introduction
Membranous nephropathy is characterised by subepithelial immune deposits with spikes and thickening of the
basement membrane. The absence of associated hypercellularity or glomerular inflammation confirms the
diagnosis.
In Malaysia, Idiopathic Membranous Nephropathy is the fourth most commonly reported primary
glomerulonephritis.
2.5.2: Patient population and characteristics
Over the six-year period from 2005-2010, 188 cases of Idiopathic membranous nephropathy (IMN) were
reported to the registry. The mean age at biopsy was 44.8 + 15.2 years (Table 2.5.2(a)). Unlike
Caucasians where IMN is most commonly diagnosed in the 5th
and 6th
decades of life, in our registry
there is a peak incidence in IMN between the ages of 25 to 55 years (Figure 2.5.2(b)).
Overall, there were slightly more males than females (53.2 % vs 46.8%). The racial distribution was 42%
in Malays, 37.2% in Chinese, 8.5 % in Indians and 12.2% in others (Table and Figure 2.5.2(a)). Unlike the
other main glomerulonephritides where the ethnic distribution roughly parallels the racial composition
of the general population, for IMN there appears to be slightly higher incidence in the Chinese race.
Table 2.5.2 (a): Demographic characteristics for IMN, 2005-2010
Demographic Characteristics n=421 %
Age (years)
Mean (SD) 44.81 (15.17)
Median (IQR) 44.07 (22.55)
Min, max 15.11, 84.35
Gender Male 100 53.2
Female 88 46.8
Race
Malay 79
Others 23
Indian 16
Chinese 70
42.0
37.2
8.5
12.2
Figure 2.4.2(a): Demographic characteristics of patients with IgA nephropathy, 2005-2010
Male,
53%
Female,
47%
Malay,
42%
Chinese,
37%
Indian,
9% Other,
12%
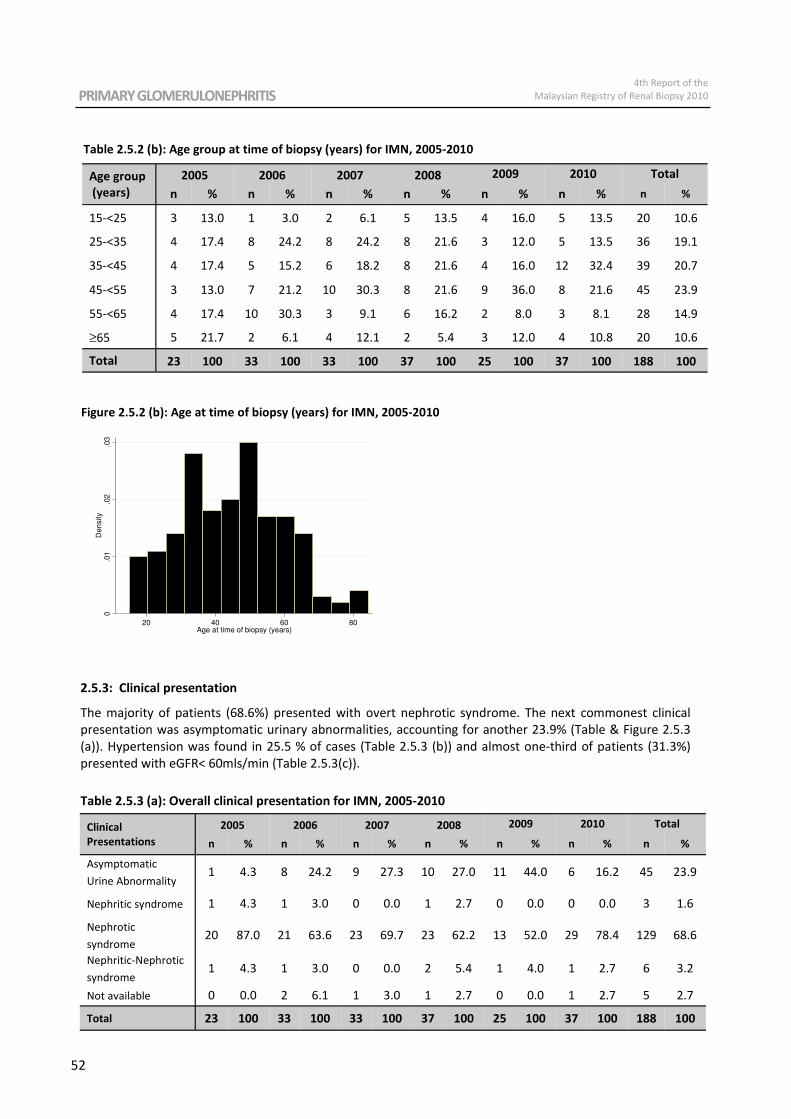
PRIMARY GLOMERULONEPHRITIS 4th Report of the
Malaysian Registry of Renal Biopsy 2010
52
Figure 2.5.2 (b): Age at time of biopsy (years) for IMN, 2005-2010
2.5.3: Clinical presentation
The majority of patients (68.6%) presented with overt nephrotic syndrome. The next commonest clinical
presentation was asymptomatic urinary abnormalities, accounting for another 23.9% (Table & Figure 2.5.3
(a)). Hypertension was found in 25.5 % of cases (Table 2.5.3 (b)) and almost one-third of patients (31.3%)
presented with eGFR< 60mls/min (Table 2.5.3(c)).
Table 2.5.3 (a): Overall clinical presentation for IMN, 2005-2010
Table 2.5.2 (b): Age group at time of biopsy (years) for IMN, 2005-2010
Age group
(years)
2005 2006 2007 2008 2009 2010 Total
n % n % n % n % n % n % n %
15-<25 3 13.0 1 3.0 2 6.1 5 13.5 4 16.0 5 13.5 20 10.6
25-<35 4 17.4 8 24.2 8 24.2 8 21.6 3 12.0 5 13.5 36 19.1
35-<45 4 17.4 5 15.2 6 18.2 8 21.6 4 16.0 12 32.4 39 20.7
45-<55 3 13.0 7 21.2 10 30.3 8 21.6 9 36.0 8 21.6 45 23.9
55-<65 4 17.4 10 30.3 3 9.1 6 16.2 2 8.0 3 8.1 28 14.9
≥65 5 21.7 2 6.1 4 12.1 2 5.4 3 12.0 4 10.8 20 10.6
Total 23 100 33 100 33 100 37 100 25 100 37 100 188 100
0.0
1.0
2.0
3D
en
sity
20 40 60 80Age at time of biopsy (years)
Clinical
Presentations
2005 2006 2007 2008 2009 2010 Total
n % n % n % n % n % n % n %
Asymptomatic
Urine Abnormality 1 4.3 8 24.2 9 27.3 10 27.0 11 44.0 6 16.2 45 23.9
Nephritic syndrome 1 4.3 1 3.0 0 0.0 1 2.7 0 0.0 0 0.0 3 1.6
Nephrotic
syndrome 20 87.0 21 63.6 23 69.7 23 62.2 13 52.0 29 78.4 129 68.6
Nephritic-Nephrotic
syndrome 1 4.3 1 3.0 0 0.0 2 5.4 1 4.0 1 2.7 6 3.2
Not available 0 0.0 2 6.1 1 3.0 1 2.7 0 0.0 1 2.7 5 2.7
Total 23 100 33 100 33 100 37 100 25 100 37 100 188 100
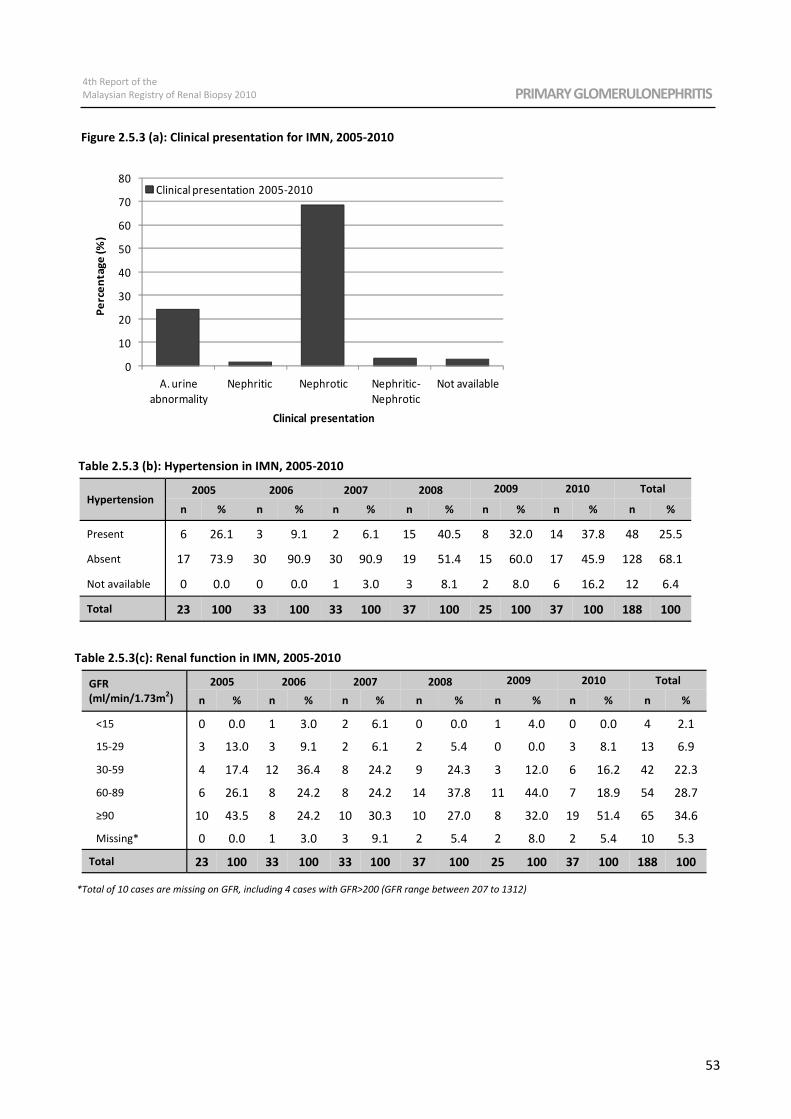
4th Report of the
Malaysian Registry of Renal Biopsy 2010 PRIMARY GLOMERULONEPHRITIS
53
Figure 2.5.3 (a): Clinical presentation for IMN, 2005-2010
Table 2.5.3 (b): Hypertension in IMN, 2005-2010
Hypertension 2005 2006 2007 2008 2009 2010 Total
n % n % n % n % n % n % n %
Present 6 26.1 3 9.1 2 6.1 15 40.5 8 32.0 14 37.8 48 25.5
Absent 17 73.9 30 90.9 30 90.9 19 51.4 15 60.0 17 45.9 128 68.1
Not available 0 0.0 0 0.0 1 3.0 3 8.1 2 8.0 6 16.2 12 6.4
Total 23 100 33 100 33 100 37 100 25 100 37 100 188 100
GFR
(ml/min/1.73m2)
2005 2006 2007 2008 2009 2010 Total
n % n % n % n % n % n % n %
<15 0 0.0 1 3.0 2 6.1 0 0.0 1 4.0 0 0.0 4 2.1
15-29 3 13.0 3 9.1 2 6.1 2 5.4 0 0.0 3 8.1 13 6.9
Missing* 0 0.0 1 3.0 3 9.1 2 5.4 2 8.0 2 5.4 10 5.3
Total 23 100 33 100 33 100 37 100 25 100 37 100 188 100
30-59 4 17.4 12 36.4 8 24.2 9 24.3 3 12.0 6 16.2 42 22.3
60-89 6 26.1 8 24.2 8 24.2 14 37.8 11 44.0 7 18.9 54 28.7
≥90 10 43.5 8 24.2 10 30.3 10 27.0 8 32.0 19 51.4 65 34.6
*Total of 10 cases are missing on GFR, including 4 cases with GFR>200 (GFR range between 207 to 1312)
Table 2.5.3(c): Renal function in IMN, 2005-2010
0
10
20
30
40
50
60
70
80
A. urine
abnormality
Nephritic Nephrotic Nephritic-
Nephrotic
Not available
Pe
rce
nta
ge
(%
)
Clinical presentation
Clinical presentation 2005-2010
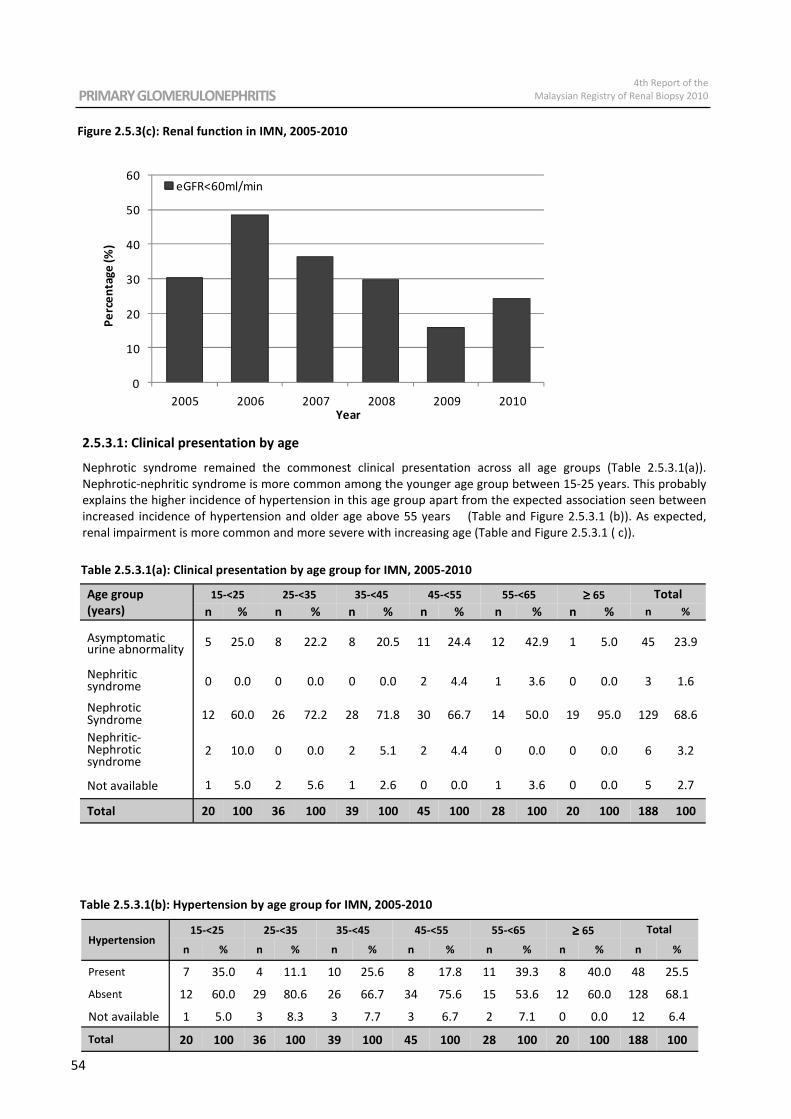
PRIMARY GLOMERULONEPHRITIS 4th Report of the
Malaysian Registry of Renal Biopsy 2010
54
Table 2.5.3.1(a): Clinical presentation by age group for IMN, 2005-2010
Table 2.5.3.1(b): Hypertension by age group for IMN, 2005-2010
Figure 2.5.3(c): Renal function in IMN, 2005-2010
2.5.3.1: Clinical presentation by age
Nephrotic syndrome remained the commonest clinical presentation across all age groups (Table 2.5.3.1(a)).
Nephrotic-nephritic syndrome is more common among the younger age group between 15-25 years. This probably
explains the higher incidence of hypertension in this age group apart from the expected association seen between
increased incidence of hypertension and older age above 55 years (Table and Figure 2.5.3.1 (b)). As expected,
renal impairment is more common and more severe with increasing age (Table and Figure 2.5.3.1 ( c)).
Age group
(years)
15-<25 25-<35 35-<45 45-<55 55-<65 ≥ ≥ ≥ ≥ 65 Total
n % n % n % n % n % n % n %
Asymptomatic urine abnormality
5 25.0 8 22.2 8 20.5 11 24.4 12 42.9 1 5.0 45 23.9
Nephritic syndrome 0 0.0 0 0.0 0 0.0 2 4.4 1 3.6 0 0.0 3 1.6
Nephrotic Syndrome 12 60.0 26 72.2 28 71.8 30 66.7 14 50.0 19 95.0 129 68.6
Nephritic- Nephrotic syndrome
2 10.0 0 0.0 2 5.1 2 4.4 0 0.0 0 0.0 6 3.2
Not available 1 5.0 2 5.6 1 2.6 0 0.0 1 3.6 0 0.0 5 2.7
Total 20 100 36 100 39 100 45 100 28 100 20 100 188 100
Hypertension 15-<25 25-<35 35-<45 45-<55 55-<65 ≥ ≥ ≥ ≥ 65 Total
n % n % n % n % n % n % n %
Present 7 35.0 4 11.1 10 25.6 8 17.8 11 39.3 8 40.0 48 25.5
Absent 12 60.0 29 80.6 26 66.7 34 75.6 15 53.6 12 60.0 128 68.1
Not available 1 5.0 3 8.3 3 7.7 3 6.7 2 7.1 0 0.0 12 6.4
Total 20 100 36 100 39 100 45 100 28 100 20 100 188 100
0
10
20
30
40
50
60
2005 2006 2007 2008 2009 2010
Pe
rce
nta
ge
(%
)
Year
eGFR<60ml/min
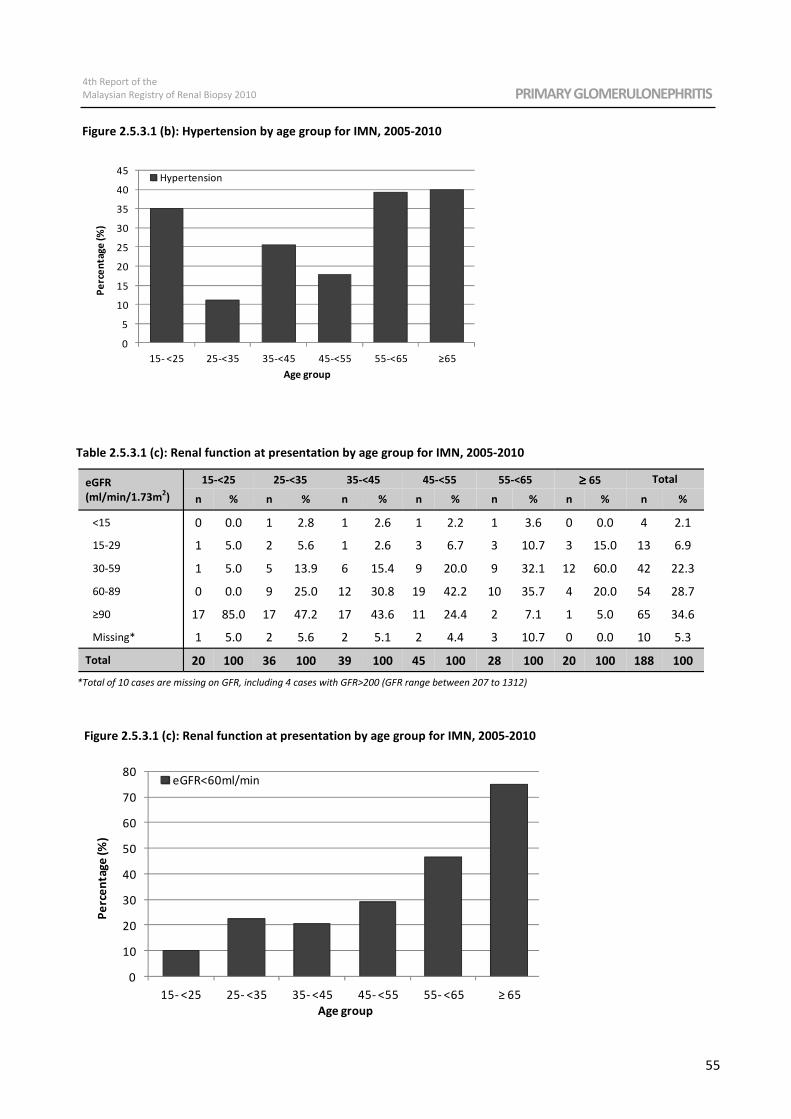
4th Report of the
Malaysian Registry of Renal Biopsy 2010 PRIMARY GLOMERULONEPHRITIS
55
Figure 2.5.3.1 (b): Hypertension by age group for IMN, 2005-2010
Table 2.5.3.1 (c): Renal function at presentation by age group for IMN, 2005-2010
eGFR
(ml/min/1.73m2)
15-<25 25-<35 35-<45 45-<55 55-<65 ≥ ≥ ≥ ≥ 65 Total
n % n % n % n % n % n % n %
<15 0 0.0 1 2.8 1 2.6 1 2.2 1 3.6 0 0.0 4 2.1
15-29 1 5.0 2 5.6 1 2.6 3 6.7 3 10.7 3 15.0 13 6.9
Missing* 1 5.0 2 5.6 2 5.1 2 4.4 3 10.7 0 0.0 10 5.3
Total 20 100 36 100 39 100 45 100 28 100 20 100 188 100
30-59 1 5.0 5 13.9 6 15.4 9 20.0 9 32.1 12 60.0 42 22.3
60-89 0 0.0 9 25.0 12 30.8 19 42.2 10 35.7 4 20.0 54 28.7
≥90 17 85.0 17 47.2 17 43.6 11 24.4 2 7.1 1 5.0 65 34.6
*Total of 10 cases are missing on GFR, including 4 cases with GFR>200 (GFR range between 207 to 1312)
Figure 2.5.3.1 (c): Renal function at presentation by age group for IMN, 2005-2010
0
5
10
15
20
25
30
35
40
45
15- <25 25-<35 35-<45 45-<55 55-<65 ≥65
Pe
rce
nta
ge
(%
)
Age group
Hypertension
0
10
20
30
40
50
60
70
80
15- <25 25- <35 35- <45 45- <55 55- <65 ≥ 65
Pe
rce
nta
ge
(%
)
Age group
eGFR<60ml/min

PRIMARY GLOMERULONEPHRITIS 4th Report of the
Malaysian Registry of Renal Biopsy 2010
56
2.5.3.2: Clinical presentation by gender
There were no significant differences in gender with respect to clinical presentation or presence of hypertension.
However renal impairment defined as GFR < 60 mls/min/1.73m2 was more likely in males (37.0 %) versus females
(25%) - see Table and Figure 2.5.3.2(c).
Table 2.5.3.2 (a): Clinical presentation by gender for IMN, 2005-2010
Table 2.5.3.2 (b): Hypertension by gender for IMN, 2005-2010
Clinical Presentations Male Female
n % n % n %
Asymptomatic urine abnormality 24 24.0 21 23.9 45 23.9
Nephritic syndrome 2 2.0 1 1.1 3 1.6
Nephrotic syndrome 68 68.0 61 69.3 129 68.6
Nephritic-Nephrotic syndrome 3 3.0 3 3.4 6 3.2
Not available 3 3.0 2 2.3 5 2.7
Total 100 100 88 100 188 100
Total
Hypertension Male Female
n % n % n %
Present 27 27.0 21 23.9 48 25.5
Absent 68 68.0 60 68.2 128 68.1
Missing 5 5.0 7 8.0 12 6.4
Total 100 100 88 100 188 100
Total
Figure 2.5.3.2 (b): Hypertension by gender for IMN, 2005-2010
0
5
10
15
20
25
30
35
Male Female
Pe
rce
nta
ge (%
)
Gender
Hypertension
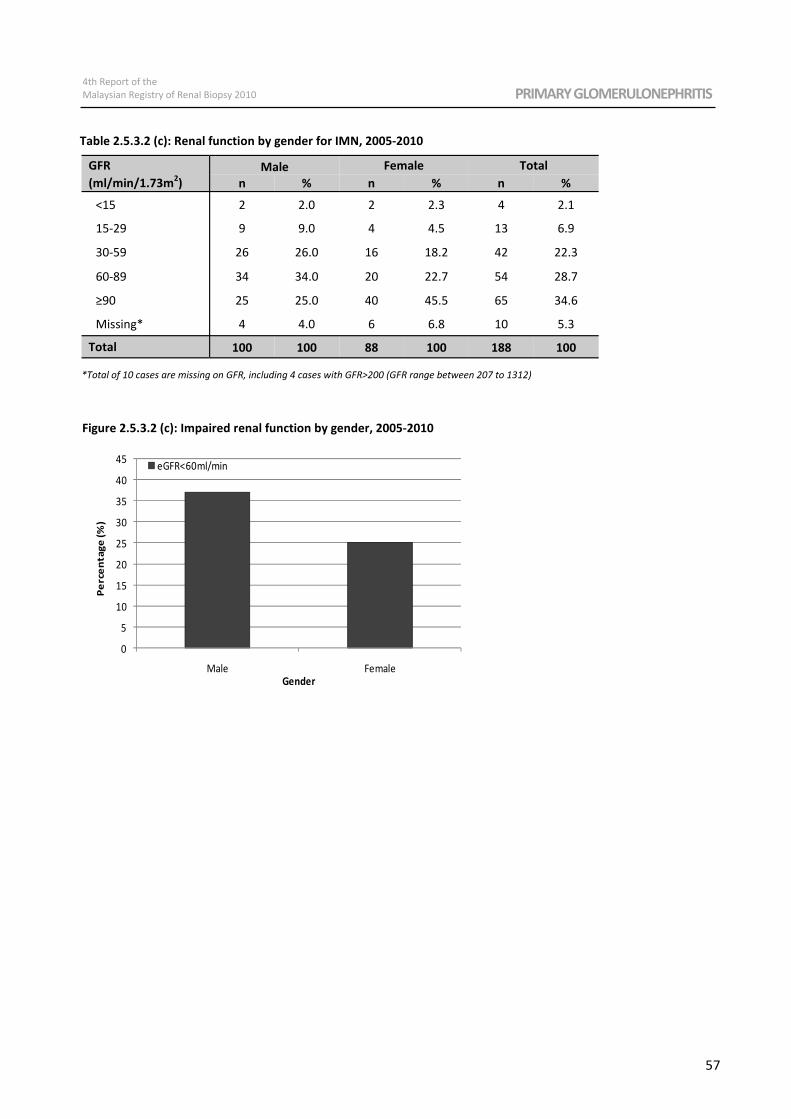
4th Report of the
Malaysian Registry of Renal Biopsy 2010 PRIMARY GLOMERULONEPHRITIS
57
Table 2.5.3.2 (c): Renal function by gender for IMN, 2005-2010
GFR
(ml/min/1.73m2)
Male Female
n % n % n %
<15 2 2.0 2 2.3 4 2.1
15-29 9 9.0 4 4.5 13 6.9
30-59 26 26.0 16 18.2 42 22.3
≥90 25 25.0 40 45.5 65 34.6
Missing* 4 4.0 6 6.8 10 5.3
Total 100 100 88 100 188 100
Total
60-89 34 34.0 20 22.7 54 28.7
*Total of 10 cases are missing on GFR, including 4 cases with GFR>200 (GFR range between 207 to 1312)
Figure 2.5.3.2 (c): Impaired renal function by gender, 2005-2010
0
5
10
15
20
25
30
35
40
45
Male Female
Pe
rce
nta
ge
(%
)
Gender
eGFR<60ml/min

PRIMARY GLOMERULONEPHRITIS 4th Report of the
Malaysian Registry of Renal Biopsy 2010
58
4th Report of the
Malaysian Registry of Renal Biopsy 2010 SECONDARY GLOMERULONEPHRITIS
59
CHAPTER 3
Secondary Glomerulonephritis
Rosnawati Yahya
Liew Yew Foong
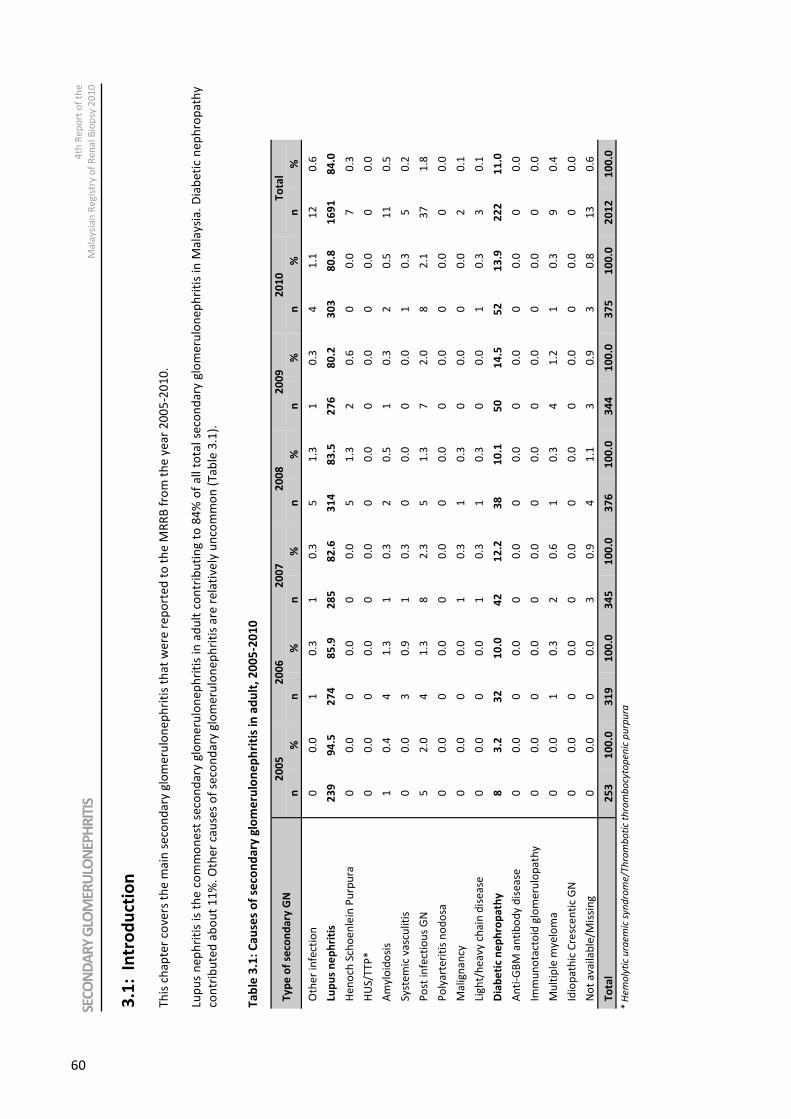
SECONDARY GLOMERULONEPHRITIS 4th Report of the
Malaysian Registry of Renal Biopsy 2010
60
Ty
pe
of
seco
nd
ary
GN
2
00
5
20
06
2
00
7
20
08
2
00
9
20
10
T
ota
l
n
%
n
%
n
%
n
%
n
%
n
%
n
%
Oth
er
infe
ctio
n
0
0.0
1
0
.3
1
0.3
5
1
.3
1
0.3
4
1
.1
12
0
.6
Lup
us
ne
ph
riti
s 2
39
9
4.5
2
74
8
5.9
2
85
8
2.6
3
14
8
3.5
2
76
8
0.2
3
03
8
0.8
1
69
1
84
.0
He
no
ch S
cho
en
lein
Pu
rpu
ra
0
0.0
0
0
.0
0
0.0
5
1
.3
2
0.6
0
0
.0
7
0.3
HU
S/T
TP
*
0
0.0
0
0
.0
0
0.0
0
0
.0
0
0.0
0
0
.0
0
0.0
Am
ylo
ido
sis
1
0.4
4
1
.3
1
0.3
2
0
.5
1
0.3
2
0
.5
11
0
.5
Sy
ste
mic
va
scu
liti
s 0
0
.0
3
0.9
1
0
.3
0
0.0
0
0
.0
1
0.3
5
0
.2
Po
st i
nfe
ctio
us
GN
5
2
.0
4
1.3
8
2
.3
5
1.3
7
2
.0
8
2.1
3
7
1.8
Po
lya
rte
riti
s n
od
osa
0
0
.0
0
0.0
0
0
.0
0
0.0
0
0
.0
0
0.0
0
0
.0
Ma
lig
na
ncy
0
0
.0
0
0.0
1
0
.3
1
0.3
0
0
.0
0
0.0
2
0
.1
Lig
ht/
he
av
y c
ha
in d
ise
ase
0
0
.0
0
0.0
1
0
.3
1
0.3
0
0
.0
1
0.3
3
0
.1
Dia
be
tic
ne
ph
rop
ath
y
8
3.2
3
2
10
.0
42
1
2.2
3
8
10
.1
50
1
4.5
5
2
13
.9
22
2
11
.0
An
ti-G
BM
an
tib
od
y d
ise
ase
0
0
.0
0
0.0
0
0
.0
0
0.0
0
0
.0
0
0.0
0
0
.0
Imm
un
ota
cto
id g
lom
eru
lop
ath
y
0
0.0
0
0
.0
0
0.0
0
0
.0
0
0.0
0
0
.0
0
0.0
Mu
ltip
le m
ye
lom
a
0
0.0
1
0
.3
2
0.6
1
0
.3
4
1.2
1
0
.3
9
0.4
Idio
pa
thic
Cre
sce
nti
c G
N
0
0.0
0
0
.0
0
0.0
0
0
.0
0
0.0
0
0
.0
0
0.0
No
t a
va
ila
ble
/Mis
sin
g
0
0.0
0
0
.0
3
0.9
4
1
.1
3
0.9
3
0
.8
13
0
.6
To
tal
25
3
10
0.0
3
19
1
00
.0
34
5
10
0.0
3
76
1
00
.0
34
4
10
0.0
3
75
1
00
.0
20
12
1
00
.0
* H
em
oly
tic
ura
em
ic s
ynd
rom
e/T
hro
mb
oti
c th
rom
bo
cyto
pe
nic
pu
rpu
ra
SEC
ON
DA
RY
GLO
MER
ULO
NEP
HR
ITIS
4
th R
ep
ort
of
the
Ma
laysi
an
Re
gis
try o
f R
en
al B
iop
sy 2
01
0
3.1
: I
ntr
od
uct
ion
T
his
ch
ap
ter
cove
rs t
he
ma
in s
eco
nd
ary
glo
me
rulo
ne
ph
riti
s th
at
we
re r
ep
ort
ed
to
th
e M
RR
B f
rom
th
e y
ea
r 2
00
5-2
01
0.
Lup
us
ne
ph
riti
s is
th
e c
om
mo
ne
st s
eco
nd
ary
glo
me
rulo
ne
ph
riti
s in
ad
ult
co
ntr
ibu
tin
g t
o 8
4%
of
all
to
tal
seco
nd
ary
glo
me
rulo
ne
ph
riti
s in
Ma
lay
sia
. D
iab
eti
c n
ep
hro
pa
thy
con
trib
ute
d a
bo
ut
11
%.
Oth
er
cau
ses
of
seco
nd
ary
glo
me
rulo
ne
ph
riti
s a
re r
ela
tive
ly u
nco
mm
on
(T
ab
le 3
.1).
Ta
ble
3.1
: C
au
ses
of
seco
nd
ary
glo
me
rulo
ne
ph
riti
s in
ad
ult
, 2
00
5-2
01
0
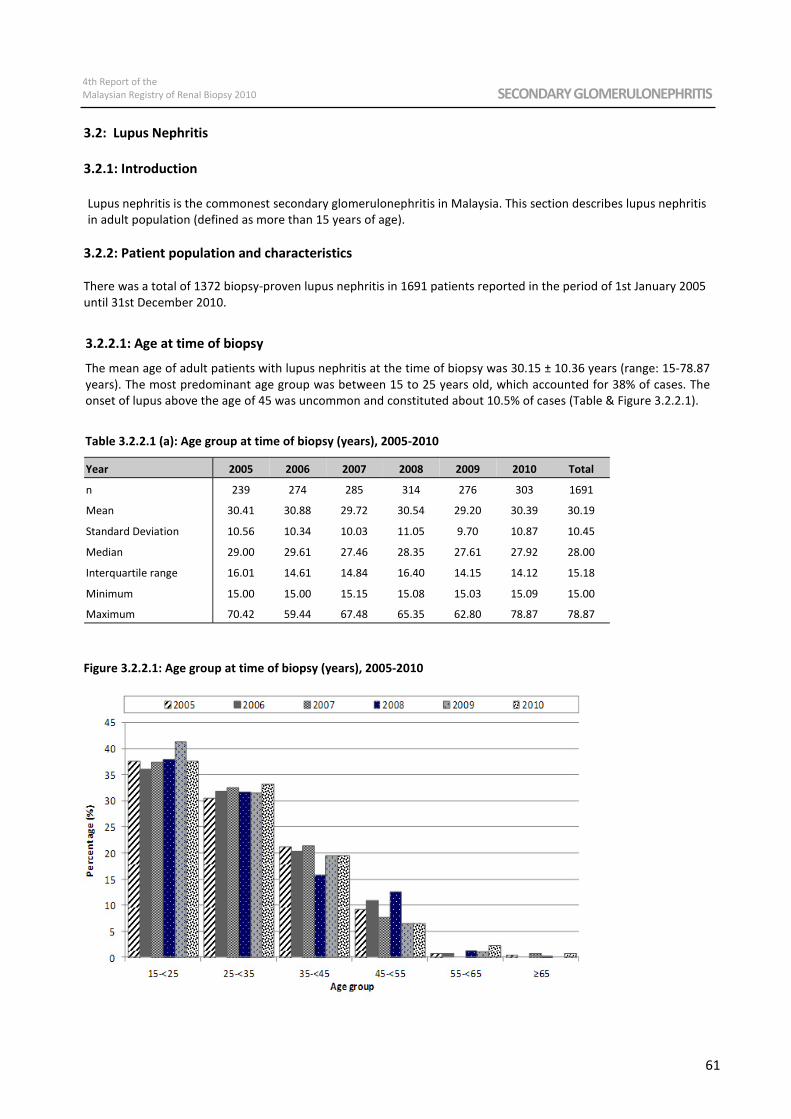
4th Report of the
Malaysian Registry of Renal Biopsy 2010 SECONDARY GLOMERULONEPHRITIS
61
3.2.2.1: Age at time of biopsy
The mean age of adult patients with lupus nephritis at the time of biopsy was 30.15 ± 10.36 years (range: 15-78.87
years). The most predominant age group was between 15 to 25 years old, which accounted for 38% of cases. The
onset of lupus above the age of 45 was uncommon and constituted about 10.5% of cases (Table & Figure 3.2.2.1).
Table 3.2.2.1 (a): Age group at time of biopsy (years), 2005-2010
Year 2005 2006 2007 2008 2009 2010 Total
n 239 274 285 314 276 303 1691
Mean 30.41 30.88 29.72 30.54 29.20 30.39 30.19
Standard Deviation 10.56 10.34 10.03 11.05 9.70 10.87 10.45
Median 29.00 29.61 27.46 28.35 27.61 27.92 28.00
Interquartile range 16.01 14.61 14.84 16.40 14.15 14.12 15.18
Minimum 15.00 15.00 15.15 15.08 15.03 15.09 15.00
Maximum 70.42 59.44 67.48 65.35 62.80 78.87 78.87
Figure 3.2.2.1: Age group at time of biopsy (years), 2005-2010
3.2: Lupus Nephritis
3.2.1: Introduction
Lupus nephritis is the commonest secondary glomerulonephritis in Malaysia. This section describes lupus nephritis
in adult population (defined as more than 15 years of age).
3.2.2: Patient population and characteristics
There was a total of 1372 biopsy-proven lupus nephritis in 1691 patients reported in the period of 1st January 2005
until 31st December 2010.
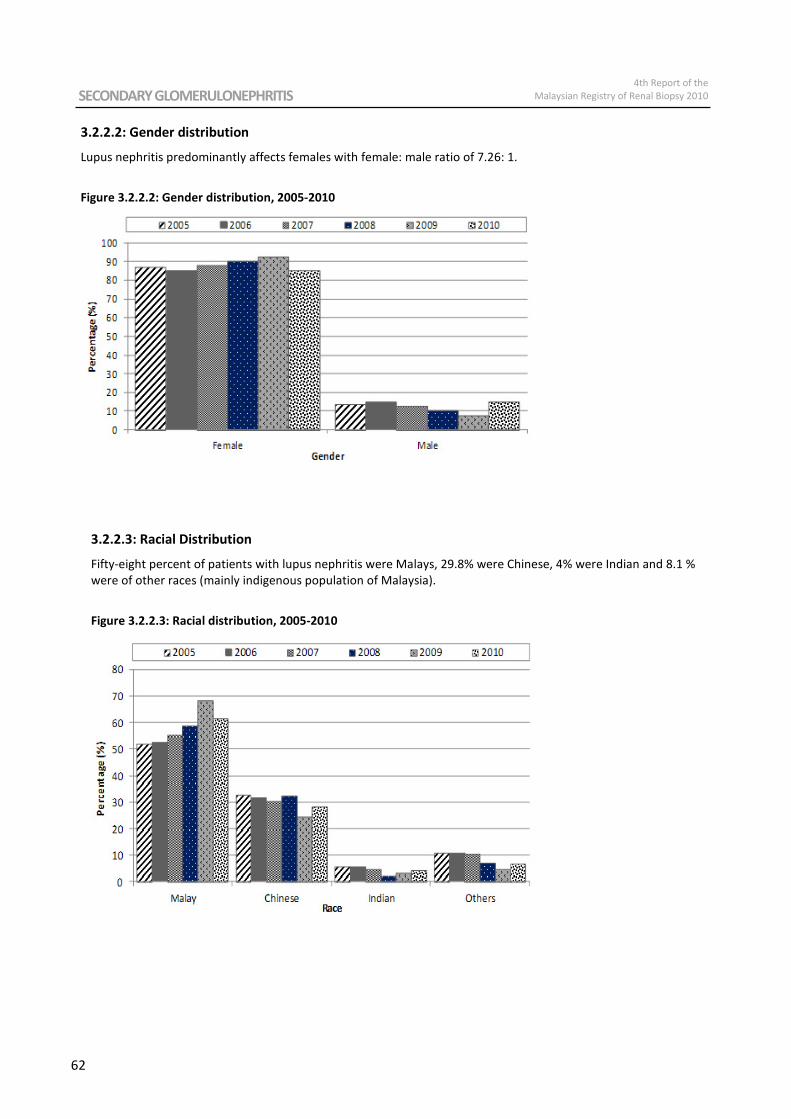
SECONDARY GLOMERULONEPHRITIS 4th Report of the
Malaysian Registry of Renal Biopsy 2010
62
3.2.2.2: Gender distribution
Lupus nephritis predominantly affects females with female: male ratio of 7.26: 1.
Figure 3.2.2.2: Gender distribution, 2005-2010
3.2.2.3: Racial Distribution
Fifty-eight percent of patients with lupus nephritis were Malays, 29.8% were Chinese, 4% were Indian and 8.1 %
were of other races (mainly indigenous population of Malaysia).
Figure 3.2.2.3: Racial distribution, 2005-2010
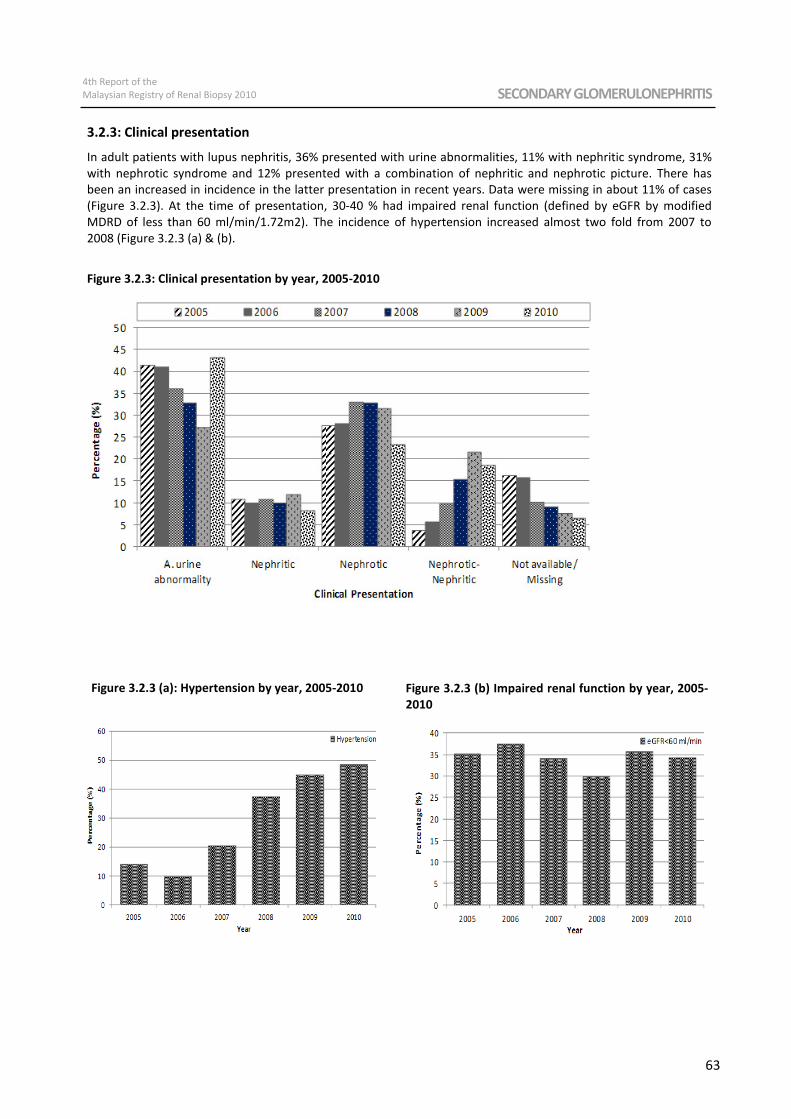
4th Report of the
Malaysian Registry of Renal Biopsy 2010 SECONDARY GLOMERULONEPHRITIS
63
3.2.3: Clinical presentation
In adult patients with lupus nephritis, 36% presented with urine abnormalities, 11% with nephritic syndrome, 31%
with nephrotic syndrome and 12% presented with a combination of nephritic and nephrotic picture. There has
been an increased in incidence in the latter presentation in recent years. Data were missing in about 11% of cases
(Figure 3.2.3). At the time of presentation, 30-40 % had impaired renal function (defined by eGFR by modified
MDRD of less than 60 ml/min/1.72m2). The incidence of hypertension increased almost two fold from 2007 to
2008 (Figure 3.2.3 (a) & (b).
Figure 3.2.3: Clinical presentation by year, 2005-2010
Figure 3.2.3 (a): Hypertension by year, 2005-2010 Figure 3.2.3 (b) Impaired renal function by year, 2005-
2010
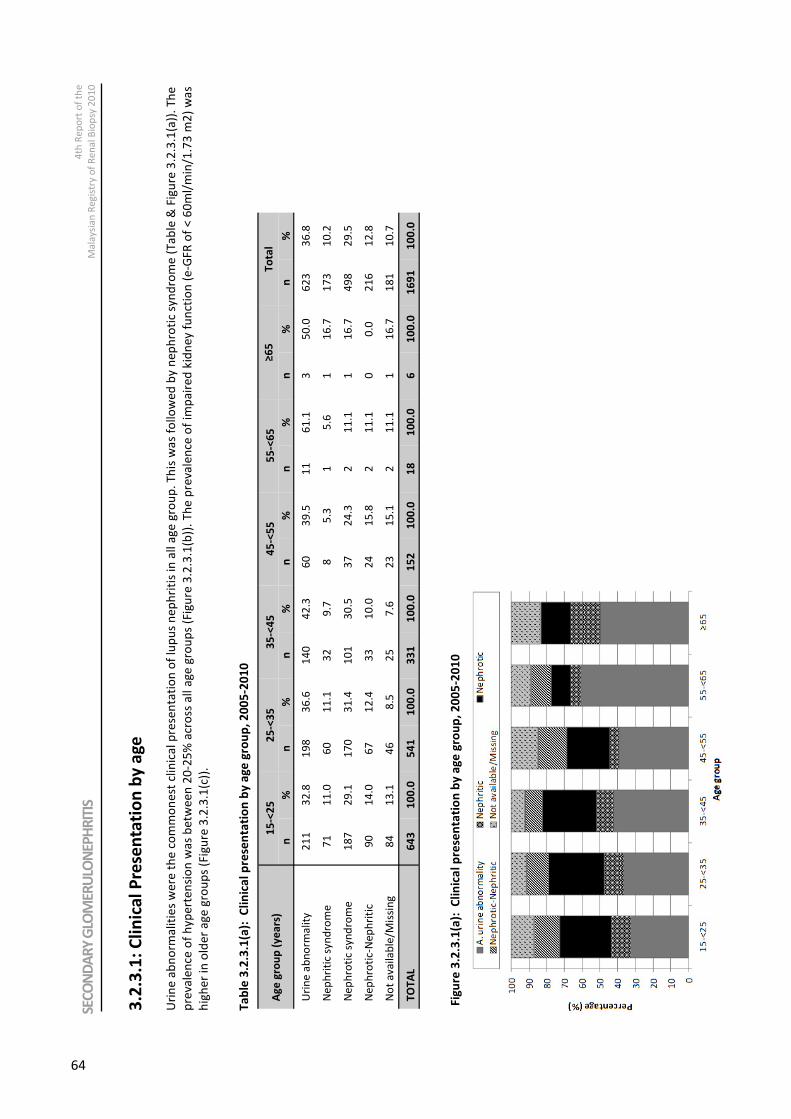
SECONDARY GLOMERULONEPHRITIS 4th Report of the
Malaysian Registry of Renal Biopsy 2010
64
Ag
e g
rou
p (
ye
ars
) 1
5-<
25
2
5-<
35
3
5-<
45
4
5-<
55
5
5-<
65
≥
65
T
ota
l
n
%
n
%
n
%
n
%
n
%
n
%
n
%
Uri
ne
ab
no
rma
lity
2
11
3
2.8
1
98
3
6.6
1
40
4
2.3
6
0
39
.5
11
6
1.1
3
5
0.0
6
23
3
6.8
Ne
ph
riti
c sy
nd
rom
e
71
1
1.0
6
0
11
.1
32
9
.7
8
5.3
1
5
.6
1
16
.7
17
3
10
.2
Ne
ph
roti
c sy
nd
rom
e
18
7
29
.1
17
0
31
.4
10
1
30
.5
37
2
4.3
2
1
1.1
1
1
6.7
4
98
2
9.5
Ne
ph
roti
c-N
ep
hri
tic
90
1
4.0
6
7
12
.4
33
1
0.0
2
4
15
.8
2
11
.1
0
0.0
2
16
1
2.8
No
t a
va
ila
ble
/Mis
sin
g
84
1
3.1
4
6
8.5
2
5
7.6
2
3
15
.1
2
11
.1
1
16
.7
18
1
10
.7
TO
TA
L 6
43
1
00
.0
54
1
10
0.0
3
31
1
00
.0
15
2
10
0.0
1
8
10
0.0
6
1
00
.0
16
91
1
00
.0
Fig
ure
3.2
.3.1
(a):
C
lin
ica
l p
rese
nta
tio
n b
y a
ge
gro
up
, 2
00
5-2
01
0
SEC
ON
DA
RY
GLO
MER
ULO
NEP
HR
ITIS
4
th R
ep
ort
of
the
Ma
laysi
an
Re
gis
try o
f R
en
al B
iop
sy 2
01
0
3.2
.3.1
: C
lin
ica
l P
rese
nta
tio
n b
y a
ge
U
rin
e a
bn
orm
ali
tie
s w
ere
th
e c
om
mo
ne
st c
lin
ica
l p
rese
nta
tio
n o
f lu
pu
s n
ep
hri
tis
in a
ll a
ge
gro
up
. T
his
wa
s fo
llo
we
d b
y n
ep
hro
tic
syn
dro
me
(T
ab
le &
Fig
ure
3.2
.3.1
(a))
. T
he
pre
vale
nce
of
hy
pe
rte
nsi
on
wa
s b
etw
ee
n 2
0-2
5%
acr
oss
all
ag
e g
rou
ps
(Fig
ure
3.2
.3.1
(b))
. T
he
pre
vale
nce
of
imp
air
ed
kid
ne
y f
un
ctio
n (
e-G
FR
of
< 6
0m
l/m
in/1
.73
m2
) w
as
hig
he
r in
old
er
ag
e g
rou
ps
(Fig
ure
3.2
.3.1
(c))
.
Ta
ble
3.2
.3.1
(a):
C
lin
ica
l p
rese
nta
tio
n b
y a
ge
gro
up
, 2
00
5-2
01
0
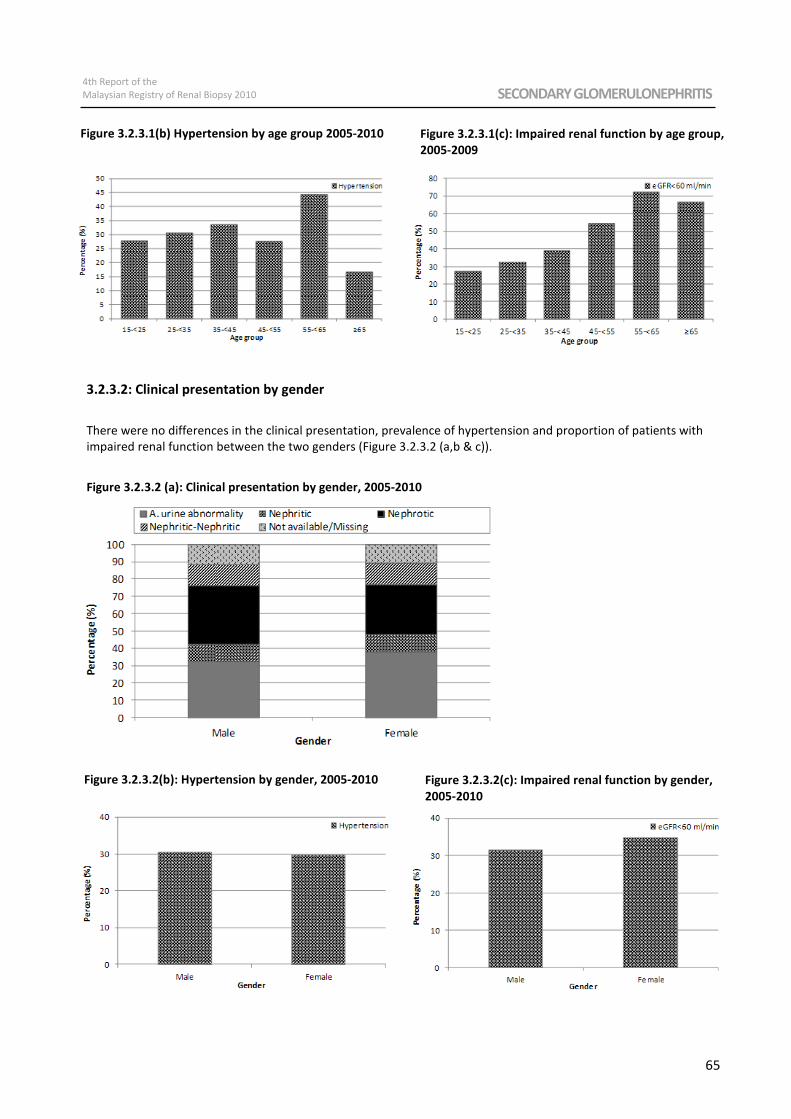
4th Report of the
Malaysian Registry of Renal Biopsy 2010 SECONDARY GLOMERULONEPHRITIS
65
Figure 3.2.3.1(b) Hypertension by age group 2005-2010 Figure 3.2.3.1(c): Impaired renal function by age group,
2005-2009
3.2.3.2: Clinical presentation by gender
There were no differences in the clinical presentation, prevalence of hypertension and proportion of patients with
impaired renal function between the two genders (Figure 3.2.3.2 (a,b & c)).
Figure 3.2.3.2 (a): Clinical presentation by gender, 2005-2010
Figure 3.2.3.2(b): Hypertension by gender, 2005-2010 Figure 3.2.3.2(c): Impaired renal function by gender,
2005-2010
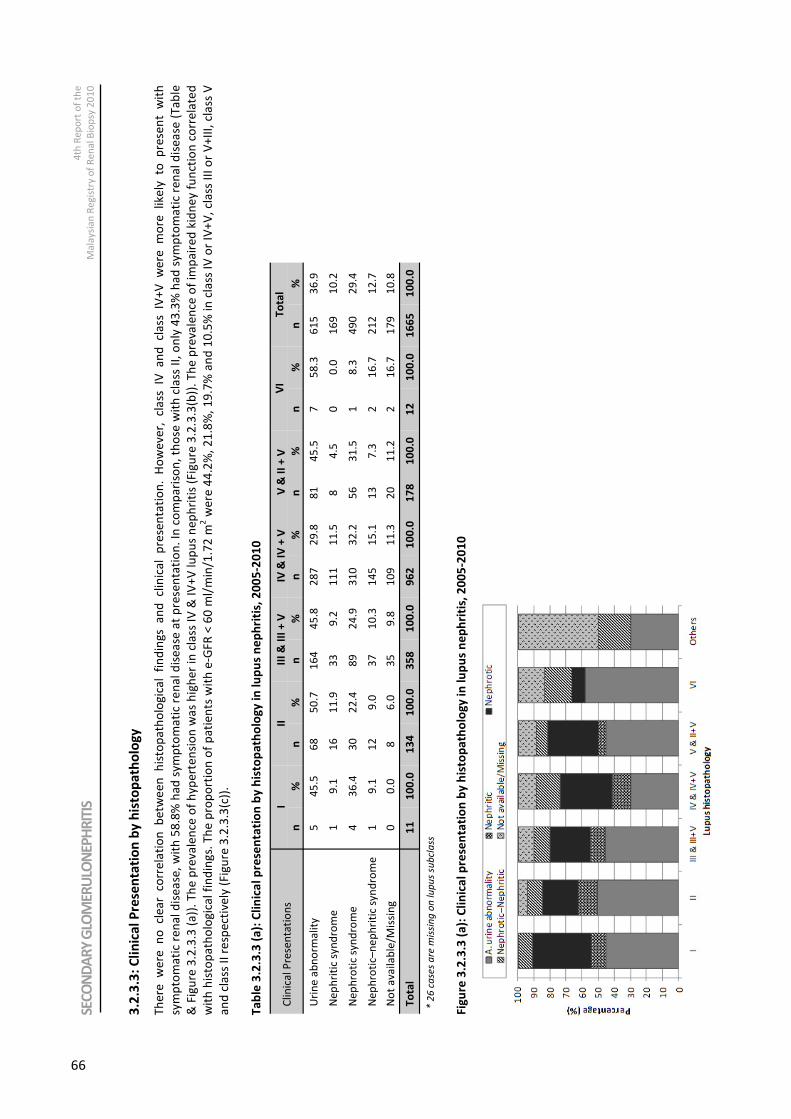
SECONDARY GLOMERULONEPHRITIS 4th Report of the
Malaysian Registry of Renal Biopsy 2010
66
Fig
ure
3.2
.3.3
(a
): C
lin
ica
l p
rese
nta
tio
n b
y h
isto
pa
tho
log
y i
n l
up
us
ne
ph
riti
s, 2
00
5-2
01
0
Cli
nic
al
Pre
sen
tati
on
s
I II
II
I &
III
+ V
IV
& I
V +
V
V &
II
+ V
V
I T
ota
l
n
%
n
%
n
%
n
%
n
%
n
%
n
%
Uri
ne
ab
no
rma
lity
5
4
5.5
6
8
50
.7
16
4
45
.8
28
7
29
.8
81
4
5.5
7
5
8.3
6
15
3
6.9
Ne
ph
riti
c sy
nd
rom
e
1
9.1
1
6
11
.9
33
9
.2
11
1
11
.5
8
4.5
0
0
.0
16
9
10
.2
Ne
ph
roti
c sy
nd
rom
e
4
36
.4
30
2
2.4
8
9
24
.9
31
0
32
.2
56
3
1.5
1
8
.3
49
0
29
.4
Ne
ph
roti
c–n
ep
hri
tic
syn
dro
me
1
9
.1
12
9
.0
37
1
0.3
1
45
1
5.1
1
3
7.3
2
1
6.7
2
12
1
2.7
No
t a
va
ila
ble
/Mis
sin
g
0
0.0
8
6
.0
35
9
.8
10
9
11
.3
20
1
1.2
2
1
6.7
1
79
1
0.8
To
tal
11
1
00
.0
13
4
10
0.0
3
58
1
00
.0
96
2
10
0.0
1
78
1
00
.0
12
1
00
.0
16
65
1
00
.0
* 2
6 c
ase
s a
re m
issi
ng
on
lu
pu
s su
bcl
ass
SEC
ON
DA
RY
GLO
MER
ULO
NEP
HR
ITIS
4
th R
ep
ort
of
the
Ma
laysi
an
Re
gis
try o
f R
en
al B
iop
sy 2
01
0
3.2
.3.3
: C
lin
ica
l P
rese
nta
tio
n b
y h
isto
pa
tho
log
y
Th
ere
w
ere
n
o
cle
ar
corr
ela
tio
n
be
twe
en
h
isto
pa
tho
log
ica
l fi
nd
ing
s a
nd
cl
inic
al
pre
sen
tati
on
. H
ow
ev
er,
cl
ass
IV
a
nd
cl
ass
IV
+V
w
ere
m
ore
li
ke
ly
to
pre
sen
t w
ith
sym
pto
ma
tic
ren
al
dis
ea
se,
wit
h 5
8.8
% h
ad
sy
mp
tom
ati
c re
na
l d
ise
ase
at
pre
sen
tati
on
. In
co
mp
ari
son
, th
ose
wit
h c
lass
II,
on
ly 4
3.3
% h
ad
sy
mp
tom
ati
c re
na
l d
ise
ase
(T
ab
le
& F
igu
re 3
.2.3
.3 (
a))
. T
he
pre
va
len
ce o
f h
yp
ert
en
sio
n w
as
hig
he
r in
cla
ss I
V &
IV
+V
lu
pu
s n
ep
hri
tis
(Fig
ure
3.2
.3.3
(b))
. T
he
pre
vale
nce
of
imp
air
ed
kid
ne
y f
un
ctio
n c
orr
ela
ted
wit
h h
isto
pa
tho
log
ica
l fi
nd
ing
s. T
he
pro
po
rtio
n o
f p
ati
en
ts w
ith
e-G
FR
< 6
0 m
l/m
in/1
.72
m2 w
ere
44
.2%
, 2
1.8
%,
19
.7%
an
d 1
0.5
% i
n c
lass
IV
or
IV+
V,
cla
ss I
II o
r V
+II
I, c
lass
V
an
d c
lass
II
resp
ect
ive
ly (
Fig
ure
3.2
.3.3
(c))
.
Ta
ble
3.2
.3.3
(a
): C
lin
ica
l p
rese
nta
tio
n b
y h
isto
pa
tho
log
y i
n l
up
us
ne
ph
riti
s, 2
00
5-2
01
0
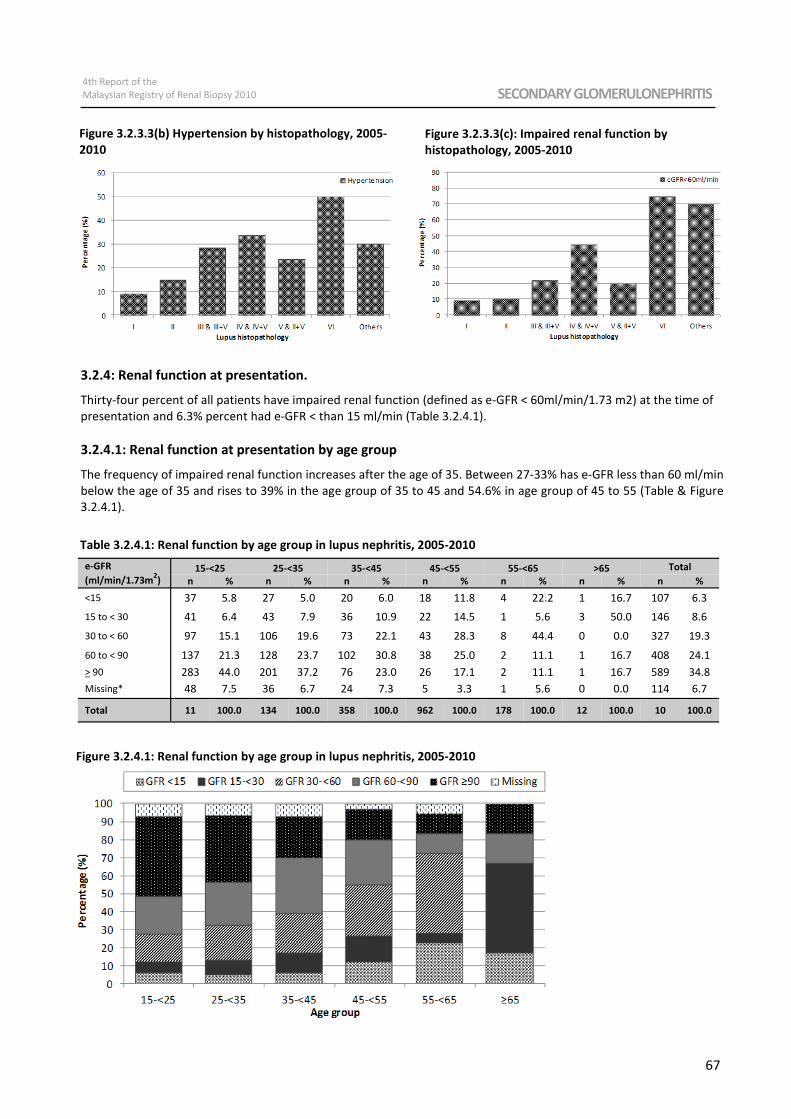
4th Report of the
Malaysian Registry of Renal Biopsy 2010 SECONDARY GLOMERULONEPHRITIS
67
Figure 3.2.3.3(b) Hypertension by histopathology, 2005-
2010
Figure 3.2.3.3(c): Impaired renal function by
histopathology, 2005-2010
3.2.4: Renal function at presentation.
Thirty-four percent of all patients have impaired renal function (defined as e-GFR < 60ml/min/1.73 m2) at the time of
presentation and 6.3% percent had e-GFR < than 15 ml/min (Table 3.2.4.1).
3.2.4.1: Renal function at presentation by age group
The frequency of impaired renal function increases after the age of 35. Between 27-33% has e-GFR less than 60 ml/min
below the age of 35 and rises to 39% in the age group of 35 to 45 and 54.6% in age group of 45 to 55 (Table & Figure
3.2.4.1).
Figure 3.2.4.1: Renal function by age group in lupus nephritis, 2005-2010
e-GFR
(ml/min/1.73m2)
15-<25 25-<35 35-<45 45-<55 55-<65 >65 Total
n % n % n % n % n % n % n %
<15 37 5.8 27 5.0 20 6.0 18 11.8 4 22.2 1 16.7 107 6.3
15 to < 30 41 6.4 43 7.9 36 10.9 22 14.5 1 5.6 3 50.0 146 8.6
60 to < 90 137 21.3 128 23.7 102 30.8 38 25.0 2 11.1 1 16.7 408 24.1
> 90 283 44.0 201 37.2 76 23.0 26 17.1 2 11.1 1 16.7 589 34.8
Missing* 48 7.5 36 6.7 24 7.3 5 3.3 1 5.6 0 0.0 114 6.7
Total 11 100.0 134 100.0 358 100.0 962 100.0 178 100.0 12 100.0 10 100.0
30 to < 60 97 15.1 106 19.6 73 22.1 43 28.3 8 44.4 0 0.0 327 19.3
Table 3.2.4.1: Renal function by age group in lupus nephritis, 2005-2010
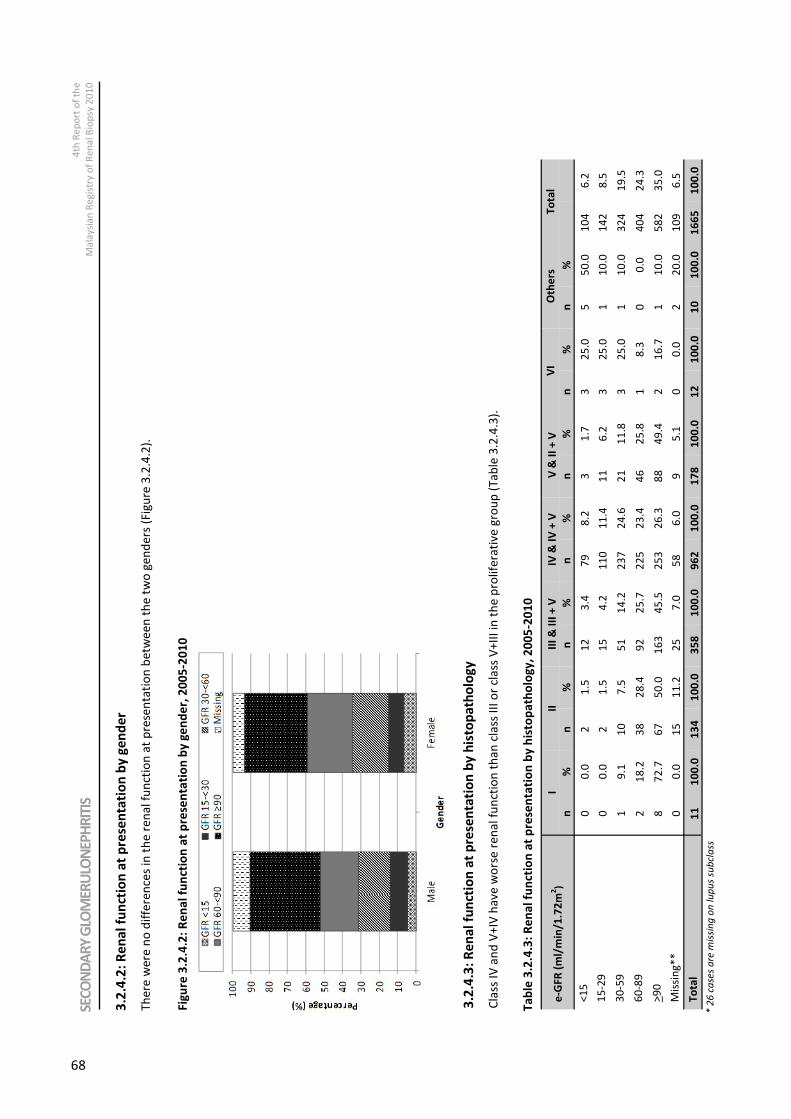
SECONDARY GLOMERULONEPHRITIS 4th Report of the
Malaysian Registry of Renal Biopsy 2010
68
SEC
ON
DA
RY
GLO
MER
ULO
NEP
HR
ITIS
4
th R
ep
ort
of
the
Ma
laysi
an
Re
gis
try o
f R
en
al B
iop
sy 2
01
0
3.2
.4.2
: R
en
al
fun
ctio
n a
t p
rese
nta
tio
n b
y g
en
de
r
Th
ere
we
re n
o d
iffe
ren
ces
in t
he
re
na
l fu
nct
ion
at
pre
sen
tati
on
be
twe
en
th
e t
wo
ge
nd
ers
(F
igu
re 3
.2.4
.2).
e-G
FR
(m
l/m
in/1
.72
m2)
I
II
III
& I
II +
V
IV &
IV
+ V
V
& I
I +
V
VI
Oth
ers
n
%
n
%
n
%
n
%
n
%
n
%
n
%
<1
5
0
0.0
2
1
.5
12
3
.4
79
8
.2
3
1.7
3
2
5.0
5
5
0.0
1
04
6
.2
15
-29
0
0
.0
2
1.5
1
5
4.2
1
10
1
1.4
1
1
6.2
3
2
5.0
1
1
0.0
1
42
8
.5
30
-59
1
9
.1
10
7
.5
51
1
4.2
2
37
2
4.6
2
1
11
.8
3
25
.0
1
10
.0
32
4
19
.5
60
-89
2
1
8.2
3
8
28
.4
92
2
5.7
2
25
2
3.4
4
6
25
.8
1
8.3
0
0
.0
40
4
24
.3
>9
0
8
72
.7
67
5
0.0
1
63
4
5.5
2
53
2
6.3
8
8
49
.4
2
16
.7
1
10
.0
58
2
35
.0
Mis
sin
g*
*
0
0.0
1
5
11
.2
25
7
.0
58
6
.0
9
5.1
0
0
.0
2
20
.0
10
9
6.5
To
tal
11
1
00
.0
13
4
10
0.0
3
58
1
00
.0
96
2
10
0.0
1
78
1
00
.0
12
1
00
.0
10
1
00
.0
16
65
1
00
.0
To
tal
* 2
6 c
ase
s a
re m
issi
ng
on
lu
pu
s su
bcl
ass
Ta
ble
3.2
.4.3
: R
en
al
fun
ctio
n a
t p
rese
nta
tio
n b
y h
isto
pa
tho
log
y,
20
05
-20
10
Fig
ure
3.2
.4.2
: R
en
al
fun
ctio
n a
t p
rese
nta
tio
n b
y g
en
de
r, 2
00
5-2
01
0
3.2
.4.3
: R
en
al
fun
ctio
n a
t p
rese
nta
tio
n b
y h
isto
pa
tho
log
y
Cla
ss I
V a
nd
V+
IV h
av
e w
ors
e r
en
al
fun
ctio
n t
ha
n c
lass
III
or
cla
ss V
+II
I in
th
e p
roli
fera
tiv
e g
rou
p (
Ta
ble
3.2
.4.3
).
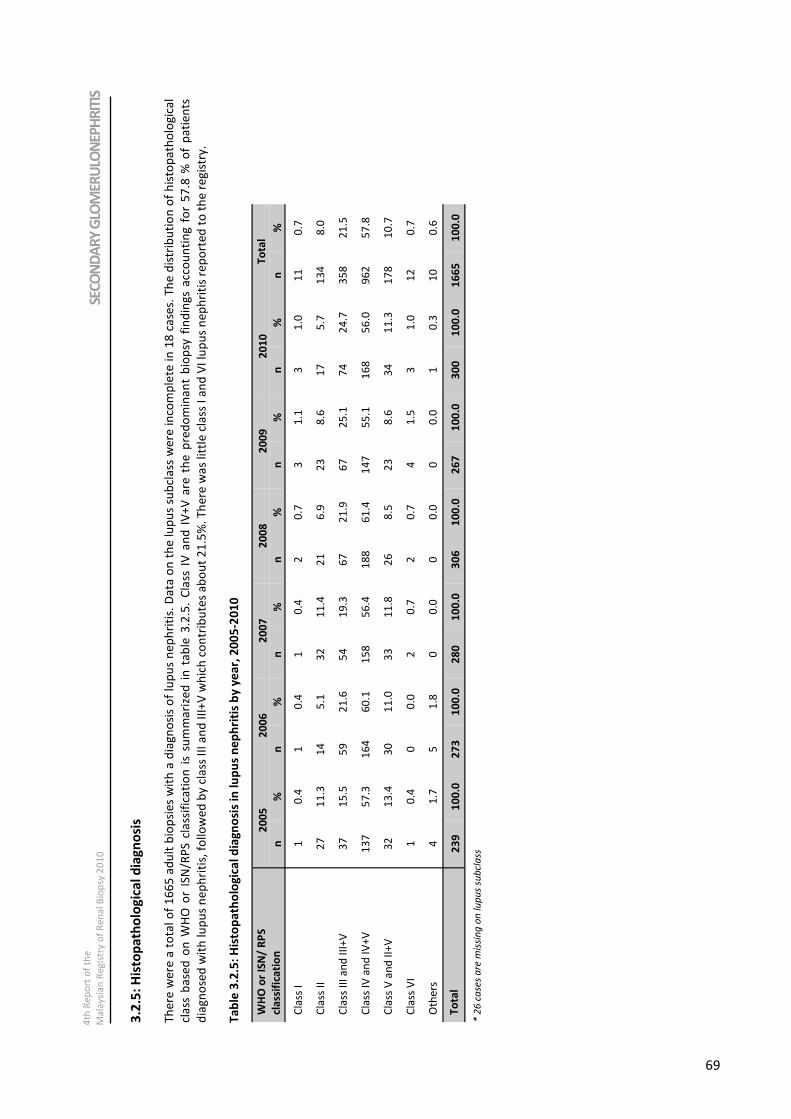
4th Report of the
Malaysian Registry of Renal Biopsy 2010 SECONDARY GLOMERULONEPHRITIS
69
3.2
.5:
His
top
ath
olo
gic
al
dia
gn
osi
s
Th
ere
we
re a
to
tal
of
16
65
ad
ult
bio
psi
es
wit
h a
dia
gn
osi
s o
f lu
pu
s n
ep
hri
tis.
Da
ta o
n t
he
lu
pu
s su
bcl
ass
we
re i
nco
mp
lete
in
18
ca
ses.
Th
e d
istr
ibu
tio
n o
f h
isto
pa
tho
log
ica
l
cla
ss b
ase
d o
n W
HO
or
ISN
/RP
S c
lass
ific
ati
on
is
sum
ma
rize
d i
n t
ab
le 3
.2.5
. C
lass
IV
an
d I
V+
V a
re t
he
pre
do
min
an
t b
iop
sy f
ind
ing
s a
cco
un
tin
g f
or
57
.8 %
of
pa
tie
nts
dia
gn
ose
d w
ith
lu
pu
s n
ep
hri
tis,
fo
llo
we
d b
y c
lass
III
an
d I
II+
V w
hic
h c
on
trib
ute
s a
bo
ut
21
.5%
. T
he
re w
as
litt
le c
lass
I a
nd
VI
lup
us
ne
ph
riti
s re
po
rte
d t
o t
he
re
gis
try
.
Ta
ble
3.2
.5:
His
top
ath
olo
gic
al
dia
gn
osi
s in
lu
pu
s n
ep
hri
tis
by
ye
ar,
20
05
-20
10
WH
O o
r IS
N/
RP
S
cla
ssif
ica
tio
n
20
05
2
00
6
20
07
2
00
8
20
09
2
01
0
To
tal
n
%
n
%
n
%
n
%
n
%
n
%
n
%
Cla
ss I
1
0
.4
1
0.4
1
0
.4
2
0.7
3
1
.1
3
1.0
1
1
0.7
Cla
ss I
I 2
7
11
.3
14
5
.1
32
1
1.4
2
1
6.9
2
3
8.6
1
7
5.7
1
34
8
.0
Cla
ss V
an
d I
I+V
3
2
13
.4
30
1
1.0
3
3
11
.8
26
8
.5
23
8
.6
34
1
1.3
1
78
1
0.7
Cla
ss V
I 1
0
.4
0
0.0
2
0
.7
2
0.7
4
1
.5
3
1.0
1
2
0.7
Oth
ers
4
1
.7
5
1.8
0
0
.0
0
0.0
0
0
.0
1
0.3
1
0
0.6
To
tal
23
9
10
0.0
2
73
1
00
.0
28
0
10
0.0
3
06
1
00
.0
26
7
10
0.0
3
00
1
00
.0
16
65
1
00
.0
Cla
ss I
V a
nd
IV
+V
1
37
5
7.3
1
64
6
0.1
1
58
5
6.4
1
88
6
1.4
1
47
5
5.1
1
68
5
6.0
9
62
5
7.8
Cla
ss I
II a
nd
III
+V
3
7
15
.5
59
2
1.6
5
4
19
.3
67
2
1.9
6
7
25
.1
74
2
4.7
3
58
2
1.5
* 2
6 c
ase
s a
re m
issi
ng
on
lu
pu
s su
bcl
ass
SEC
ON
DA
RY
GLO
MER
ULO
NEP
HR
ITIS
4
th R
ep
ort
of
the
Ma
laysi
an
Re
gis
try o
f R
en
al B
iop
sy 2
01
0
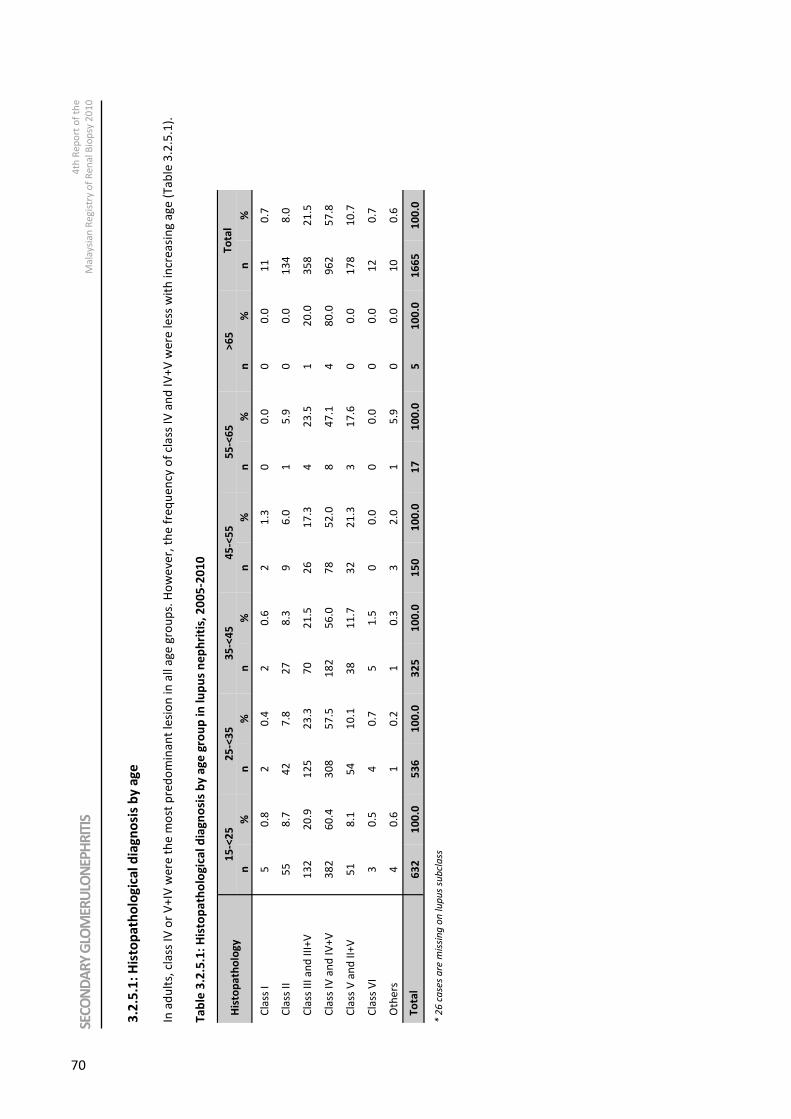
SECONDARY GLOMERULONEPHRITIS 4th Report of the
Malaysian Registry of Renal Biopsy 2010
70
3.2
.5.1
: H
isto
pa
tho
log
ica
l d
iag
no
sis
by
ag
e
In a
du
lts,
cla
ss I
V o
r V
+IV
we
re t
he
mo
st p
red
om
ina
nt
lesi
on
in
all
ag
e g
rou
ps.
Ho
we
ver,
th
e f
req
ue
ncy
of
cla
ss I
V a
nd
IV
+V
we
re l
ess
wit
h i
ncr
ea
sin
g a
ge
(T
ab
le 3
.2.5
.1).
Ta
ble
3.2
.5.1
: H
isto
pa
tho
log
ica
l d
iag
no
sis
by
ag
e g
rou
p i
n l
up
us
ne
ph
riti
s, 2
00
5-2
01
0
His
top
ath
olo
gy
15
-<2
5
25
-<3
5
35
-<4
5
45
-<5
5
55
-<6
5
>6
5
To
tal
n
%
n
%
n
%
n
%
n
%
n
%
n
%
Cla
ss I
5
0
.8
2
0.4
2
0
.6
2
1.3
0
0
.0
0
0.0
1
1
0.7
Cla
ss I
I 5
5
8.7
4
2
7.8
2
7
8.3
9
6
.0
1
5.9
0
0
.0
13
4
8.0
Cla
ss V
an
d I
I+V
5
1
8.1
5
4
10
.1
38
1
1.7
3
2
21
.3
3
17
.6
0
0.0
1
78
1
0.7
Cla
ss V
I 3
0
.5
4
0.7
5
1
.5
0
0.0
0
0
.0
0
0.0
1
2
0.7
Oth
ers
4
0
.6
1
0.2
1
0
.3
3
2.0
1
5
.9
0
0.0
1
0
0.6
To
tal
63
2
10
0.0
5
36
1
00
.0
32
5
10
0.0
1
50
1
00
.0
17
1
00
.0
5
10
0.0
1
66
5
10
0.0
Cla
ss I
V a
nd
IV
+V
3
82
6
0.4
3
08
5
7.5
1
82
5
6.0
7
8
52
.0
8
47
.1
4
80
.0
96
2
57
.8
Cla
ss I
II a
nd
III
+V
1
32
2
0.9
1
25
2
3.3
7
0
21
.5
26
1
7.3
4
2
3.5
1
2
0.0
3
58
2
1.5
* 2
6 c
ase
s a
re m
issi
ng
on
lu
pu
s su
bcl
ass
SEC
ON
DA
RY
GLO
MER
ULO
NEP
HR
ITIS
4
th R
ep
ort
of
the
Ma
laysi
an
Re
gis
try o
f R
en
al B
iop
sy 2
01
0

4th Report of the
Malaysian Registry of Renal Biopsy 2010 SECONDARY GLOMERULONEPHRITIS
71
Table 3.2.5.2: Histopathological diagnosis by gender in lupus nephritis, 2005-2010
3.2.5.3: Histopathological diagnosis by clinical presentation
Urine abnormalities were the most common clinical presentation, followed by nephrotic syndrome. Sixty-eight
percent with nephritic-nephrotic, 63.3% with nephrotic syndrome and 65.7% with nephritic syndrome had class IV
or class V+IV lupus nephritis. (Table 3.2.5.3).
Table 3.2.5.3: Histopathological diagnosis by clinical presentation, 2005-2010
Histopathology Male Female Total
n % n % n %
Class I 1 0.5 10 0.7 11 0.7
Class II 13 6.4 121 8.3 134 8.0
Class III and III+V 47 23.2 311 21.3 358 21.5
Class IV and IV+V 106 52.2 856 58.5 962 57.8
Others 2 1.0 8 0.5 10 0.6
Total 203 100.0 1462 100.0 1665 100.0
Class V and II+V 32 15.8 146 10.0 178 10.7
Class VI 2 1.0 10 0.7 12 0.7
Histopathology
Urine
abnormality Nephritic Nephrotic
Nephritic-
Nephrotic
Not available/
Missing Total
n % n % n % n % n % n %
Class I 5 0.8 1 0.6 4 0.8 1 0.5 0 0.0 11 0.7
Class II 68 11.1 16 9.5 30 6.1 12 5.7 8 4.5 134 8.0
Class III and III+V 164 26.7 33 19.5 89 18.2 37 17.5 35 19.6 358 21.5
Class IV and IV+V 287 46.7 111 65.7 310 63.3 145 68.4 109 60.9 962 57.8
Class V and II+V 81 13.2 8 4.7 56 11.4 13 6.1 20 11.2 178 10.7
Class VI 7 1.1 0 0.0 1 0.2 2 0.9 2 1.1 12 0.7
Others 3 0.5 0 0.0 0 0.0 2 0.9 5 2.8 10 0.6
Total 615 100.0 169 100.0 490 100.0 212 100.0 179 100.0 1665 100.0
* 26 cases are missing on lupus subclass
* 26 cases are missing on lupus subclass
3.2.5.2: Histopathological diagnosis by gender
Class IV and IV+V was the commonest histopathological finding in both genders. Class IV or IV+V occurred in higher
frequency in females, whereas class V occurred in higher frequency in males (Table 3.2.5.2).
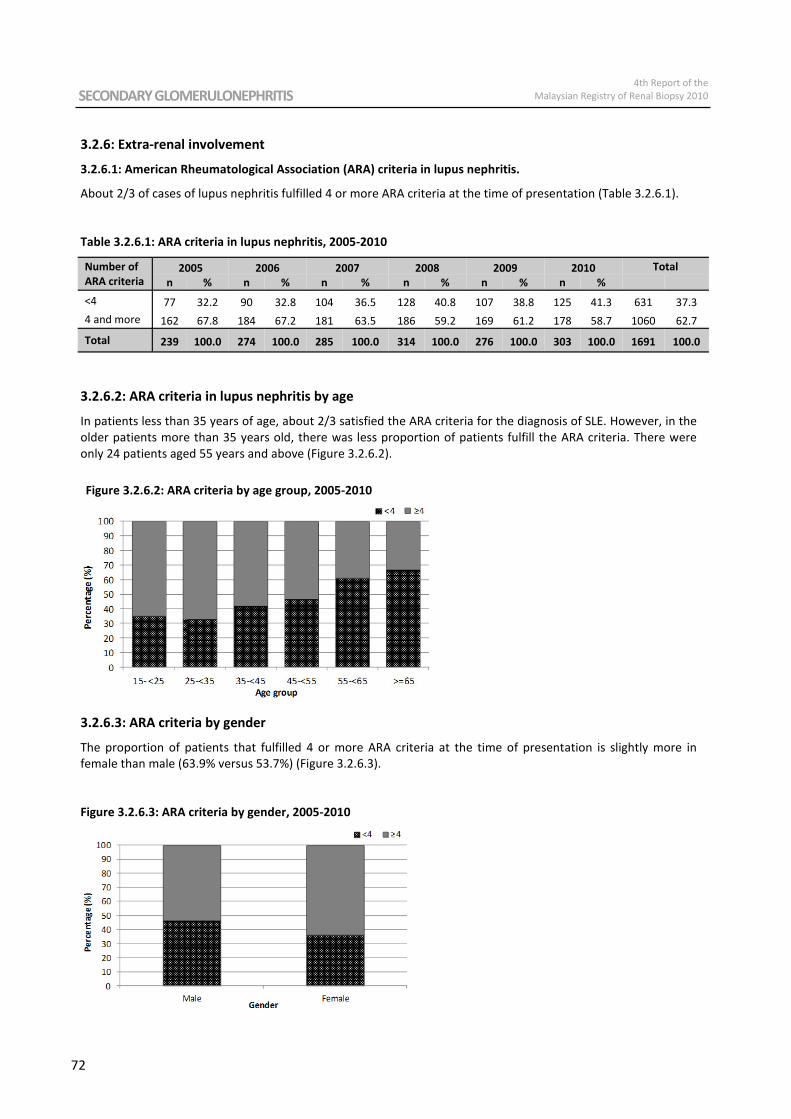
SECONDARY GLOMERULONEPHRITIS 4th Report of the
Malaysian Registry of Renal Biopsy 2010
72
3.2.6: Extra-renal involvement
3.2.6.1: American Rheumatological Association (ARA) criteria in lupus nephritis.
About 2/3 of cases of lupus nephritis fulfilled 4 or more ARA criteria at the time of presentation (Table 3.2.6.1).
Table 3.2.6.1: ARA criteria in lupus nephritis, 2005-2010
3.2.6.2: ARA criteria in lupus nephritis by age
In patients less than 35 years of age, about 2/3 satisfied the ARA criteria for the diagnosis of SLE. However, in the
older patients more than 35 years old, there was less proportion of patients fulfill the ARA criteria. There were
only 24 patients aged 55 years and above (Figure 3.2.6.2).
3.2.6.3: ARA criteria by gender
The proportion of patients that fulfilled 4 or more ARA criteria at the time of presentation is slightly more in
female than male (63.9% versus 53.7%) (Figure 3.2.6.3).
Figure 3.2.6.3: ARA criteria by gender, 2005-2010
Number of
ARA criteria 2005 2006 2007 2008 2009 2010 Total
n % n % n % n % n % n %
<4 77 32.2 90 32.8 104 36.5 128 40.8 107 38.8 125 41.3 631 37.3
4 and more 162 67.8 184 67.2 181 63.5 186 59.2 169 61.2 178 58.7 1060 62.7
Total 239 100.0 274 100.0 285 100.0 314 100.0 276 100.0 303 100.0 1691 100.0
Figure 3.2.6.2: ARA criteria by age group, 2005-2010
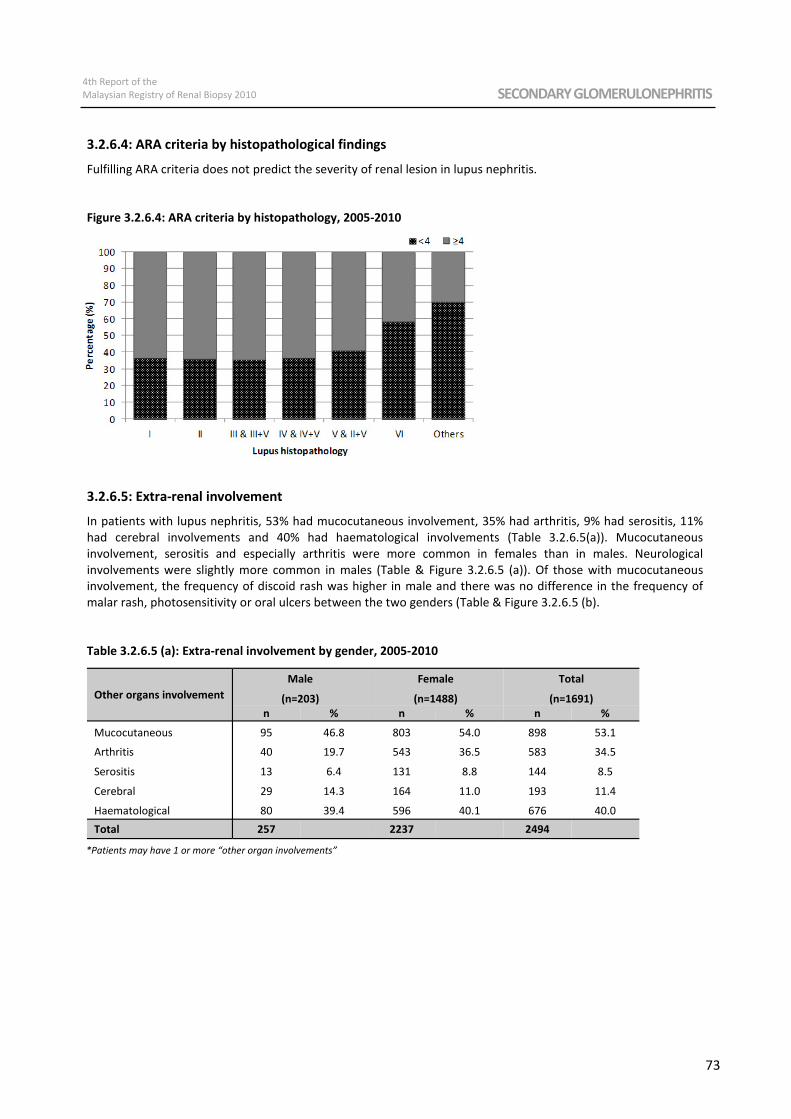
4th Report of the
Malaysian Registry of Renal Biopsy 2010 SECONDARY GLOMERULONEPHRITIS
73
3.2.6.4: ARA criteria by histopathological findings
Fulfilling ARA criteria does not predict the severity of renal lesion in lupus nephritis.
Figure 3.2.6.4: ARA criteria by histopathology, 2005-2010
3.2.6.5: Extra-renal involvement
In patients with lupus nephritis, 53% had mucocutaneous involvement, 35% had arthritis, 9% had serositis, 11%
had cerebral involvements and 40% had haematological involvements (Table 3.2.6.5(a)). Mucocutaneous
involvement, serositis and especially arthritis were more common in females than in males. Neurological
involvements were slightly more common in males (Table & Figure 3.2.6.5 (a)). Of those with mucocutaneous
involvement, the frequency of discoid rash was higher in male and there was no difference in the frequency of
malar rash, photosensitivity or oral ulcers between the two genders (Table & Figure 3.2.6.5 (b).
Table 3.2.6.5 (a): Extra-renal involvement by gender, 2005-2010
Other organs involvement
Male
(n=203)
Female
(n=1488)
Total
(n=1691)
n % n % n %
Cerebral 29 14.3 164 11.0 193 11.4
Haematological 80 39.4 596 40.1 676 40.0
Total 257 2237 2494
Mucocutaneous 95 46.8 803 54.0 898 53.1
Serositis 13 6.4 131 8.8 144 8.5
Arthritis 40 19.7 543 36.5 583 34.5
*Patients may have 1 or more “other organ involvements”
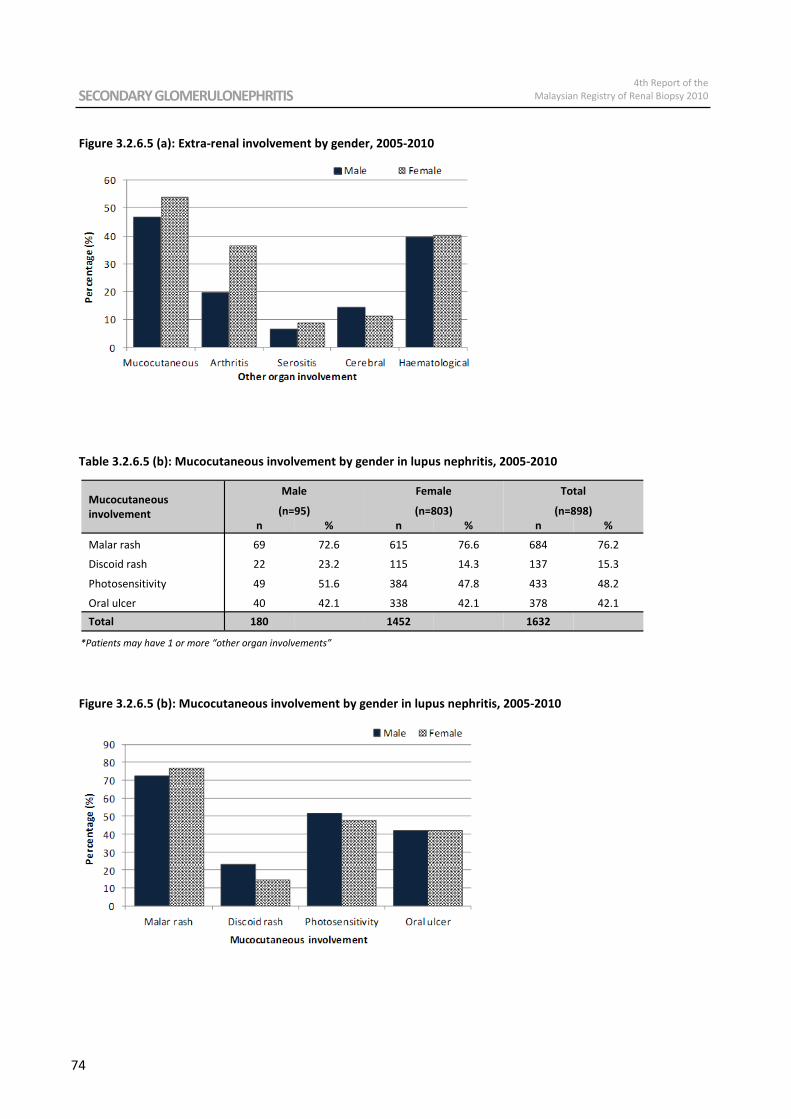
SECONDARY GLOMERULONEPHRITIS 4th Report of the
Malaysian Registry of Renal Biopsy 2010
74
Figure 3.2.6.5 (a): Extra-renal involvement by gender, 2005-2010
Table 3.2.6.5 (b): Mucocutaneous involvement by gender in lupus nephritis, 2005-2010
Figure 3.2.6.5 (b): Mucocutaneous involvement by gender in lupus nephritis, 2005-2010
Mucocutaneous
involvement
Male
(n=95)
Female
(n=803)
Total
(n=898)
n % n % n %
Malar rash 69 72.6 615 76.6 684 76.2
Discoid rash 22 23.2 115 14.3 137 15.3
Photosensitivity 49 51.6 384 47.8 433 48.2
Oral ulcer 40 42.1 338 42.1 378 42.1
Total 180 1452 1632
*Patients may have 1 or more “other organ involvements”
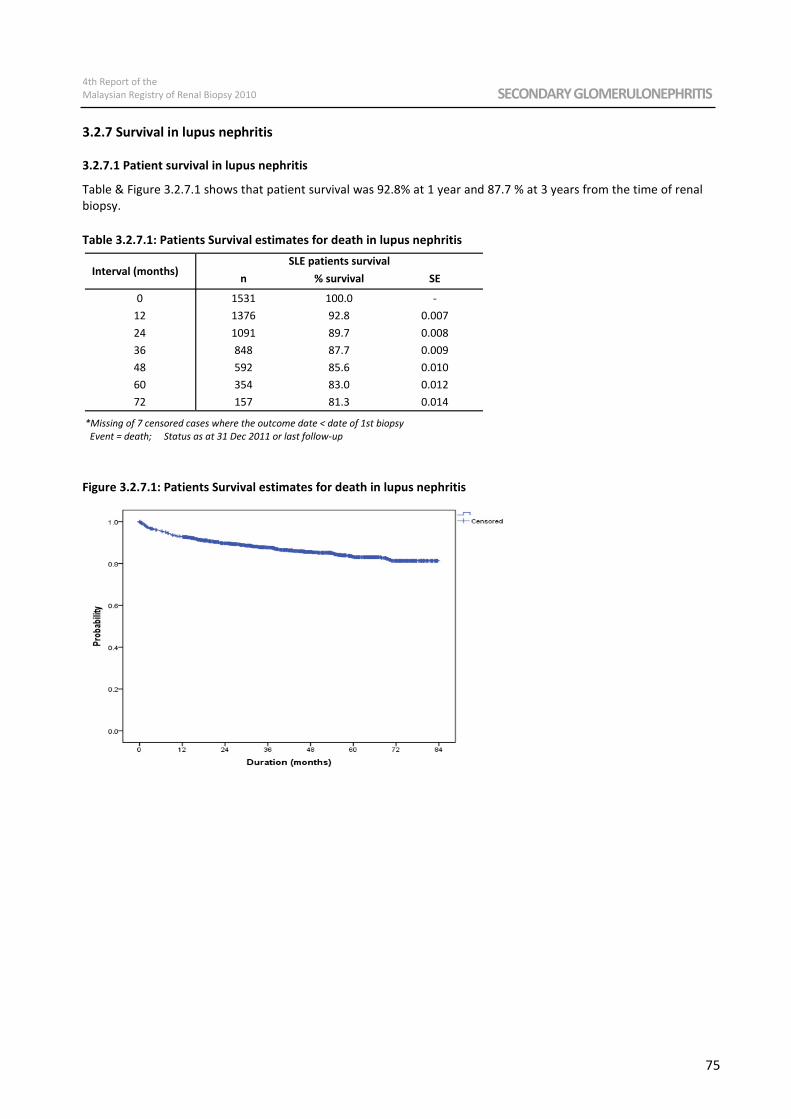
4th Report of the
Malaysian Registry of Renal Biopsy 2010 SECONDARY GLOMERULONEPHRITIS
75
3.2.7 Survival in lupus nephritis
3.2.7.1 Patient survival in lupus nephritis
Table & Figure 3.2.7.1 shows that patient survival was 92.8% at 1 year and 87.7 % at 3 years from the time of renal
biopsy.
Table 3.2.7.1: Patients Survival estimates for death in lupus nephritis
Figure 3.2.7.1: Patients Survival estimates for death in lupus nephritis
Interval (months) n % survival SE
0 1531 100.0 -
12 1376 92.8 0.007
24 1091 89.7 0.008
36 848 87.7 0.009
48 592 85.6 0.010
60 354 83.0 0.012
72 157 81.3 0.014
SLE patients survival
*Missing of 7 censored cases where the outcome date < date of 1st biopsy
Event = death; Status as at 31 Dec 2011 or last follow-up

SECONDARY GLOMERULONEPHRITIS 4th Report of the
Malaysian Registry of Renal Biopsy 2010
76
3.2.7.2: Renal survival in lupus nephritis
Table & Figure 3.2.7.2 shows that renal survival was 98.2% at 1 year and 96.5% at 3 years from the time of renal
biopsy.
Table 3.2.7.2: Renal Survival estimates for lupus nephritis
Figure 3.2.7.2: Renal Survival estimates for lupus nephritis
Interval (months) n % survival SE
0 1531 100.0 -
12 1374 98.2 0.003
24 1086 97.4 0.004
36 846 96.5 0.005
48 590 95.7 0.006
60 353 94.8 0.007
72 157 93.2 0.011
SLE patients survival
*Missing of 4 censored and 3 event cases where the outcome date < date of 1st biopsy
Event = ESRF; Status as at 31 Dec 2011 or died or last follow-up
4th Report of the
Malaysian Registry of Renal Biopsy 2010 PAEDIATRIC RENAL BIOPSIES
77
CHAPTER 4
Paediatric Renal Biopsies
Lee Ming Lee
Lim Yam Ngo
Lynster Liaw
Mirunalini a/p Appadurai
Selva Kumar a/l Sivapuniam
Susan Pee
Wan Jazilah Wan Ismail
Yap Yok Chin
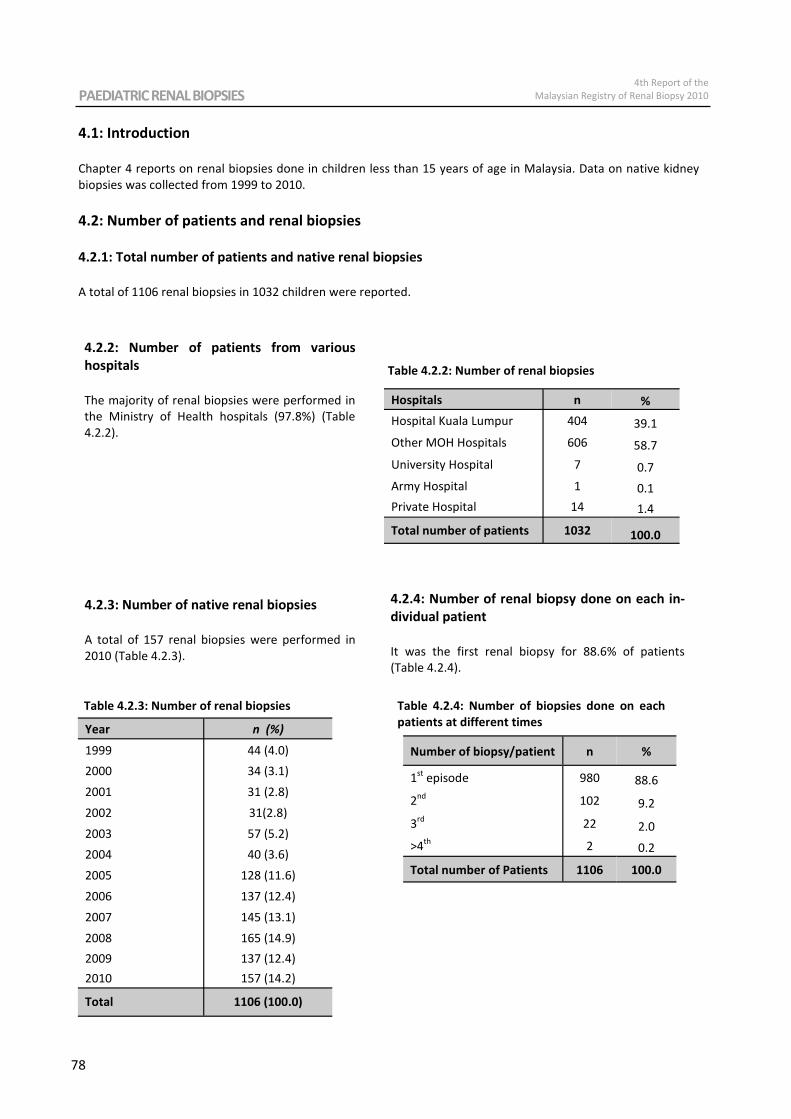
PAEDIATRIC RENAL BIOPSIES 4th Report of the
Malaysian Registry of Renal Biopsy 2010
78
4.1: Introduction Chapter 4 reports on renal biopsies done in children less than 15 years of age in Malaysia. Data on native kidney
biopsies was collected from 1999 to 2010.
4.2: Number of patients and renal biopsies
4.2.1: Total number of patients and native renal biopsies
A total of 1106 renal biopsies in 1032 children were reported.
4.2.2: Number of patients from various
hospitals
The majority of renal biopsies were performed in
the Ministry of Health hospitals (97.8%) (Table
4.2.2).
Table 4.2.2: Number of renal biopsies
Hospitals n %
Hospital Kuala Lumpur 404 39.1
Other MOH Hospitals 606 58.7
University Hospital 7 0.7
Army Hospital 1 0.1
Private Hospital 14 1.4
Total number of patients 1032 100.0
4.2.3: Number of native renal biopsies
A total of 157 renal biopsies were performed in
2010 (Table 4.2.3).
Table 4.2.3: Number of renal biopsies
Year n (%)
1999 44 (4.0)
2000 34 (3.1)
2001 31 (2.8)
2002 31(2.8)
2003 57 (5.2)
2004 40 (3.6)
2005 128 (11.6)
2006 137 (12.4)
2007 145 (13.1)
2008 165 (14.9)
2009 137 (12.4)
2010 157 (14.2)
Total 1106 (100.0)
4.2.4: Number of renal biopsy done on each in-
dividual patient
It was the first renal biopsy for 88.6% of patients
(Table 4.2.4).
Number of biopsy/patient n %
1st
episode 980 88.6
2nd
102 9.2
3rd
22 2.0
>4th
2 0.2
Total number of Patients 1106 100.0
Table 4.2.4: Number of biopsies done on each
patients at different times
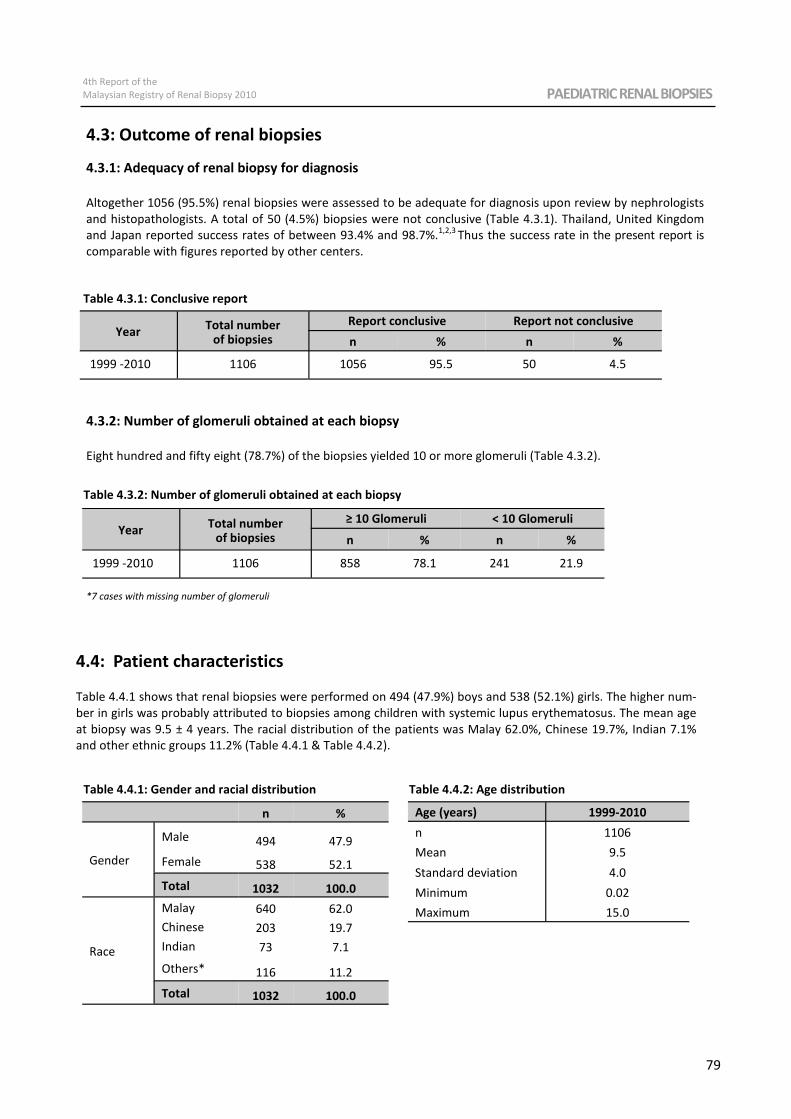
4th Report of the
Malaysian Registry of Renal Biopsy 2010 PAEDIATRIC RENAL BIOPSIES
79
4.3.1: Adequacy of renal biopsy for diagnosis
Altogether 1056 (95.5%) renal biopsies were assessed to be adequate for diagnosis upon review by nephrologists
and histopathologists. A total of 50 (4.5%) biopsies were not conclusive (Table 4.3.1). Thailand, United Kingdom
and Japan reported success rates of between 93.4% and 98.7%.1,2,3
Thus the success rate in the present report is
comparable with figures reported by other centers.
Table 4.3.1: Conclusive report
4.3: Outcome of renal biopsies
4.3.2: Number of glomeruli obtained at each biopsy
Eight hundred and fifty eight (78.7%) of the biopsies yielded 10 or more glomeruli (Table 4.3.2).
Table 4.3.2: Number of glomeruli obtained at each biopsy
Year Total number
of biopsies
≥ 10 Glomeruli
n % n %
1999 -2010 1106 858 78.1 241 21.9
< 10 Glomeruli
*7 cases with missing number of glomeruli
4.4: Patient characteristics
Table 4.4.1 shows that renal biopsies were performed on 494 (47.9%) boys and 538 (52.1%) girls. The higher num-
ber in girls was probably attributed to biopsies among children with systemic lupus erythematosus. The mean age
at biopsy was 9.5 ± 4 years. The racial distribution of the patients was Malay 62.0%, Chinese 19.7%, Indian 7.1%
and other ethnic groups 11.2% (Table 4.4.1 & Table 4.4.2).
Table 4.4.1: Gender and racial distribution
n %
Gender
Male 494 47.9
Female 538 52.1
Total 1032 100.0
Malay 640 62.0
Chinese 203 19.7
Indian 73 7.1
Others* 116 11.2
Total 1032 100.0
Race
Age (years) 1999-2010
n 1106
Mean 9.5
Standard deviation 4.0
Minimum 0.02
Maximum 15.0
Year Total number
of biopsies
Report conclusive
n % n %
1999 -2010 1106 1056 95.5 50 4.5
Report not conclusive
Table 4.4.2: Age distribution
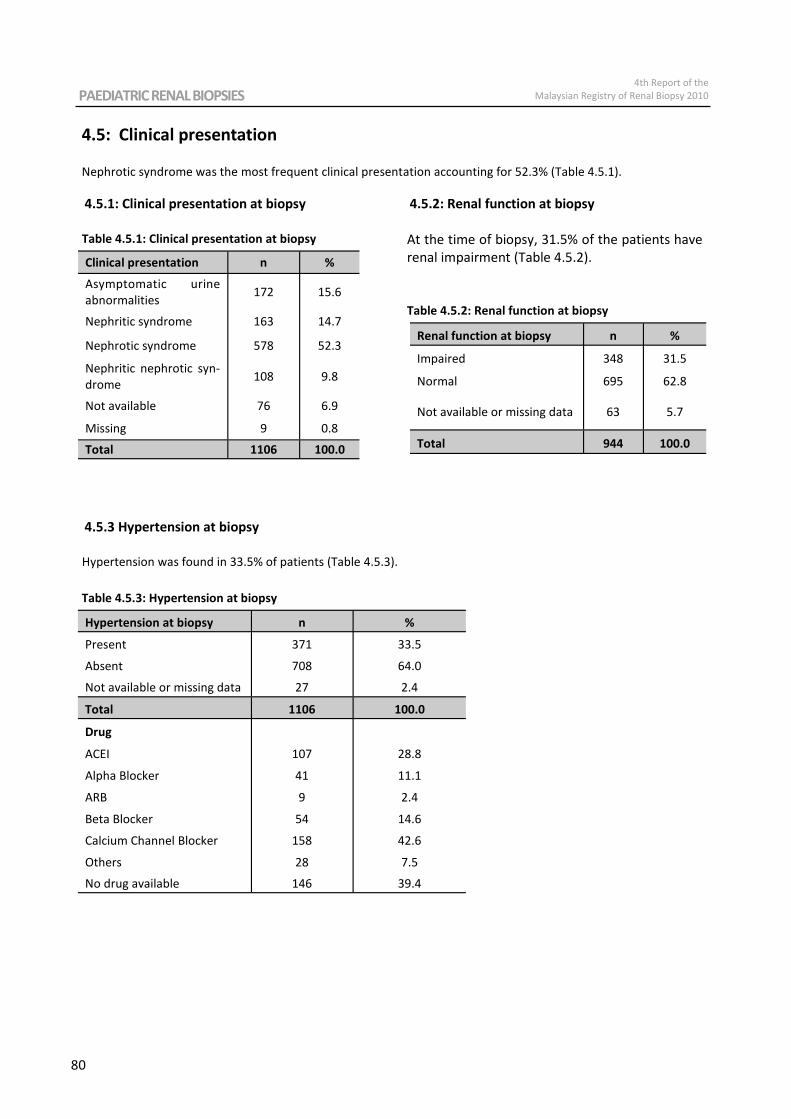
PAEDIATRIC RENAL BIOPSIES 4th Report of the
Malaysian Registry of Renal Biopsy 2010
80
4.5: Clinical presentation Nephrotic syndrome was the most frequent clinical presentation accounting for 52.3% (Table 4.5.1).
4.5.1: Clinical presentation at biopsy
Table 4.5.1: Clinical presentation at biopsy
Clinical presentation n %
Asymptomatic urine
abnormalities 172 15.6
Nephritic syndrome 163 14.7
Nephrotic syndrome 578 52.3
Nephritic nephrotic syn-
drome 108 9.8
Not available 76 6.9
Missing 9 0.8
Total 1106 100.0
4.5.2: Renal function at biopsy
At the time of biopsy, 31.5% of the patients have
renal impairment (Table 4.5.2).
Renal function at biopsy n %
Impaired 348 31.5
Normal 695 62.8
Not available or missing data 63 5.7
Total 944 100.0
Table 4.5.2: Renal function at biopsy
4.5.3 Hypertension at biopsy
Hypertension was found in 33.5% of patients (Table 4.5.3).
Hypertension at biopsy n %
Calcium Channel Blocker 158 42.6
Others 28 7.5
No drug available 146 39.4
Alpha Blocker 41 11.1
ARB 9 2.4
Beta Blocker 54 14.6
Present 371 33.5
Absent 708 64.0
Not available or missing data 27 2.4
Total 1106 100.0
Drug
ACEI 107 28.8
Table 4.5.3: Hypertension at biopsy
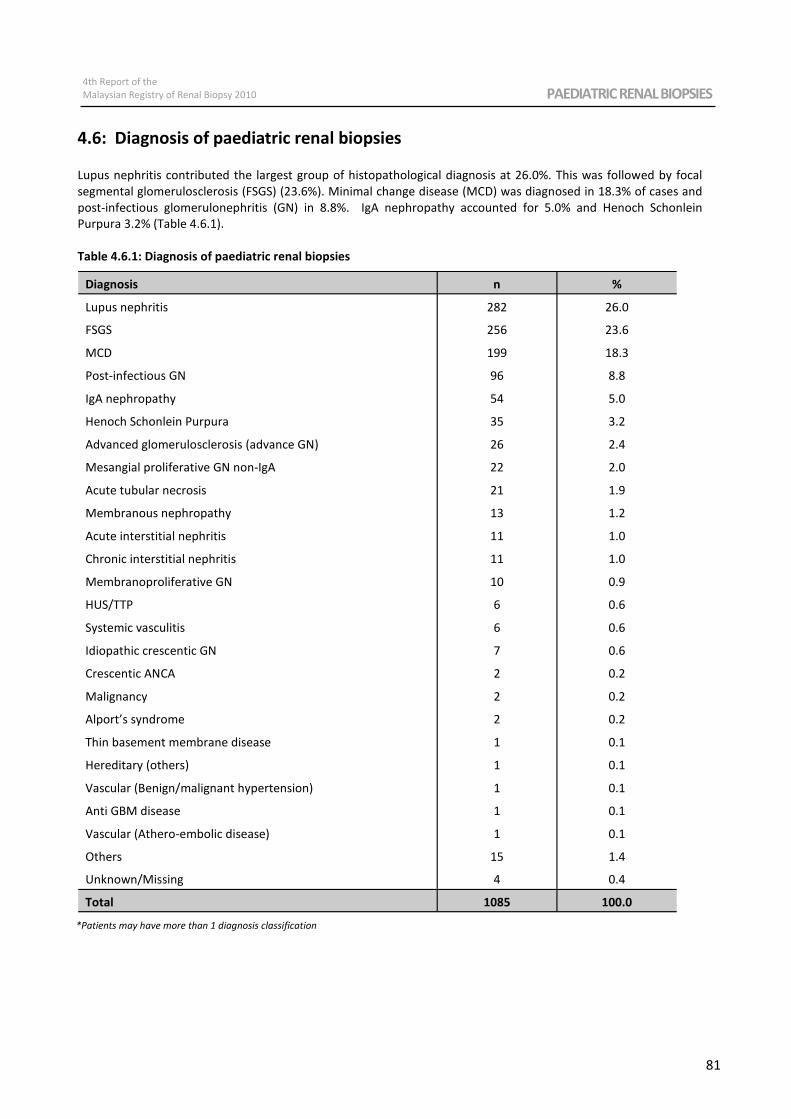
4th Report of the
Malaysian Registry of Renal Biopsy 2010 PAEDIATRIC RENAL BIOPSIES
81
4.6: Diagnosis of paediatric renal biopsies Lupus nephritis contributed the largest group of histopathological diagnosis at 26.0%. This was followed by focal
segmental glomerulosclerosis (FSGS) (23.6%). Minimal change disease (MCD) was diagnosed in 18.3% of cases and
post-infectious glomerulonephritis (GN) in 8.8%. IgA nephropathy accounted for 5.0% and Henoch Schonlein
Purpura 3.2% (Table 4.6.1).
Table 4.6.1: Diagnosis of paediatric renal biopsies
Diagnosis n %
Lupus nephritis 282 26.0
FSGS 256 23.6
MCD 199 18.3
Post-infectious GN 96 8.8
IgA nephropathy 54 5.0
Henoch Schonlein Purpura 35 3.2
Advanced glomerulosclerosis (advance GN) 26 2.4
Mesangial proliferative GN non-IgA 22 2.0
Acute tubular necrosis 21 1.9
Membranous nephropathy 13 1.2
Acute interstitial nephritis 11 1.0
Chronic interstitial nephritis 11 1.0
Membranoproliferative GN 10 0.9
HUS/TTP 6 0.6
Systemic vasculitis 6 0.6
Idiopathic crescentic GN 7 0.6
Crescentic ANCA 2 0.2
Malignancy 2 0.2
Alport’s syndrome 2 0.2
Thin basement membrane disease 1 0.1
Hereditary (others) 1 0.1
Vascular (Benign/malignant hypertension) 1 0.1
Anti GBM disease 1 0.1
Vascular (Athero-embolic disease) 1 0.1
Others 15 1.4
Unknown/Missing 4 0.4
Total 1085 100.0
*Patients may have more than 1 diagnosis classification
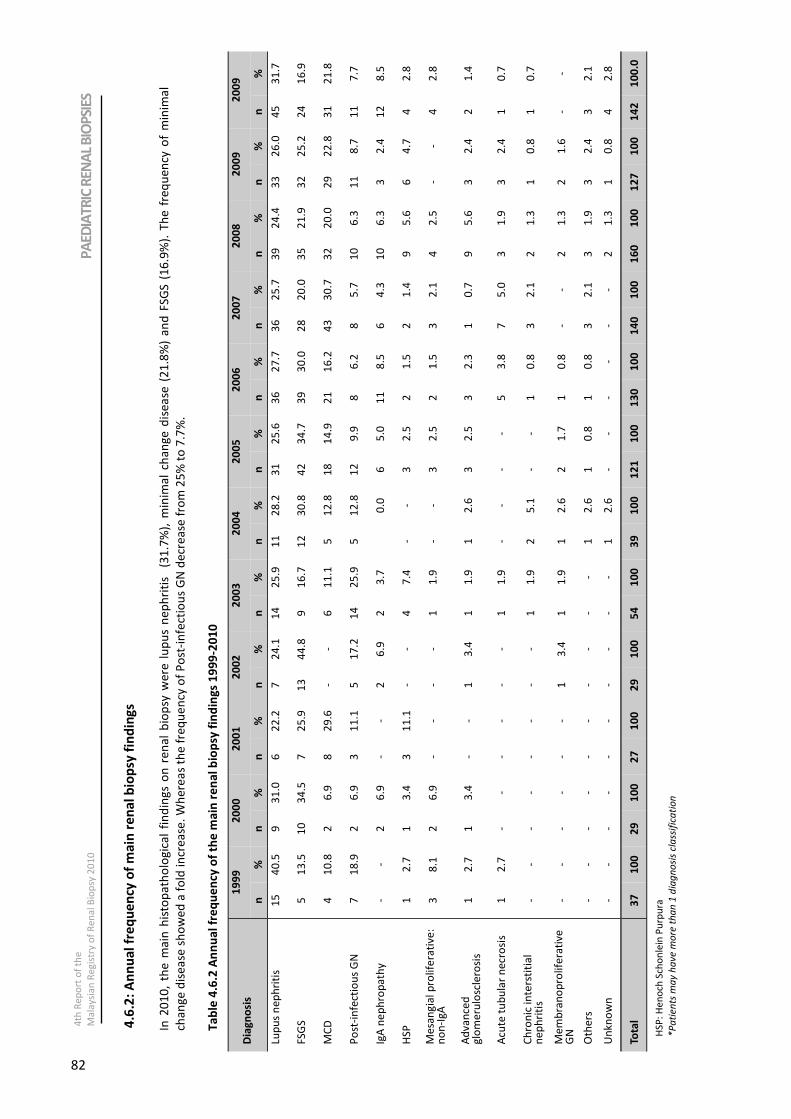
PAEDIATRIC RENAL BIOPSIES 4th Report of the
Malaysian Registry of Renal Biopsy 2010
82
4th
Re
po
rt o
f th
e
Ma
lays
ian
Re
gis
try
of
Re
na
l Bio
psy
20
10
4.6
.2:
An
nu
al
fre
qu
en
cy o
f m
ain
re
na
l b
iop
sy f
ind
ing
s
In 2
01
0,
the
ma
in h
isto
pa
tho
log
ica
l fi
nd
ing
s o
n r
en
al
bio
psy
we
re l
up
us
ne
ph
riti
s (
31
.7%
), m
inim
al
cha
ng
e d
ise
ase
(2
1.8
%)
an
d F
SGS
(1
6.9
%).
Th
e f
req
ue
ncy
of
min
ima
l
cha
ng
e d
ise
ase
sh
ow
ed
a f
old
incr
ea
se.
Wh
ere
as
the
fre
qu
en
cy o
f P
ost
-in
fect
iou
s G
N d
ecr
ea
se f
rom
25
% t
o 7
.7%
.
Ta
ble
4.6
.2 A
nn
ua
l fr
eq
ue
ncy
of
the
ma
in r
en
al
bio
psy
fin
din
gs
19
99
-20
10
HS
P:
He
no
ch S
cho
nle
in P
urp
ura
*P
ati
en
ts m
ay
ha
ve
mo
re t
ha
n 1
dia
gn
osi
s cl
ass
ific
ati
on
19
99
2
00
0
20
01
2
00
2
20
03
2
00
4
20
05
2
00
6
20
07
2
00
8
20
09
2
00
9
n
%
n
%
n
%
n
%
n
%
n
%
n
%
n
%
n
%
n
%
n
%
n
%
Lup
us
ne
ph
riti
s 1
5
40
.5
9
31
.0
6
22
.2
7
24
.1
14
2
5.9
1
1
28
.2
31
2
5.6
3
6
27
.7
36
2
5.7
3
9
24
.4
33
2
6.0
4
5
31
.7
FSG
S 5
1
3.5
1
0
34
.5
7
25
.9
13
4
4.8
9
1
6.7
1
2
30
.8
42
3
4.7
3
9
30
.0
28
2
0.0
3
5
21
.9
32
2
5.2
2
4
16
.9
MC
D
4
10
.8
2
6.9
8
2
9.6
-
- 6
1
1.1
5
1
2.8
1
8
14
.9
21
1
6.2
4
3
30
.7
32
2
0.0
2
9
22
.8
31
2
1.8
Po
st-i
nfe
ctio
us
GN
7
1
8.9
2
6
.9
3
11
.1
5
17
.2
14
2
5.9
5
1
2.8
1
2
9.9
8
6
.2
8
5.7
1
0
6.3
1
1
8.7
1
1
7.7
IgA
ne
ph
rop
ath
y -
- 2
6
.9
- -
2
6.9
2
3
.7
0
.0
6
5.0
1
1
8.5
6
4
.3
10
6
.3
3
2.4
1
2
8.5
HSP
1
2
.7
1
3.4
3
1
1.1
-
- 4
7
.4
- -
3
2.5
2
1
.5
2
1.4
9
5
.6
6
4.7
4
2
.8
Me
san
gia
l pro
life
rati
ve:
n
on
-Ig
A
3
8.1
2
6
.9
- -
- -
1
1.9
-
- 3
2
.5
2
1.5
3
2
.1
4
2.5
-
- 4
2
.8
Ad
van
ced
g
lom
eru
losc
lero
sis
1
2.7
1
3
.4
- -
1
3.4
1
1
.9
1
2.6
3
2
.5
3
2.3
1
0
.7
9
5.6
3
2
.4
2
1.4
Acu
te t
ub
ula
r n
ecr
osi
s 1
2
.7
- -
- -
- -
1
1.9
-
- -
- 5
3
.8
7
5.0
3
1
.9
3
2.4
1
0
.7
Ch
ron
ic in
ters
titi
al
ne
ph
riti
s -
- -
- -
- -
- 1
1
.9
2
5.1
-
- 1
0
.8
3
2.1
2
1
.3
1
0.8
1
0
.7
Me
mb
ran
op
rolif
era
tive
G
N
- -
- -
- -
1
3.4
1
1
.9
1
2.6
2
1
.7
1
0.8
-
- 2
1
.3
2
1.6
-
-
Oth
ers
-
- -
- -
- -
- -
- 1
2
.6
1
0.8
1
0
.8
3
2.1
3
1
.9
3
2.4
3
2
.1
Un
kno
wn
-
- -
- -
- -
- -
- 1
2
.6
- -
- -
- -
2
1.3
1
0
.8
4
2.8
Tota
l 3
7
10
0
29
1
00
2
7
10
0
29
1
00
5
4
10
0
39
1
00
1
21
1
00
1
30
1
00
1
40
1
00
1
60
1
00
1
27
1
00
1
42
1
00
.0
Dia
gn
osi
s
PA
EDIA
TRIC
REN
AL
BIO
PSI
ES
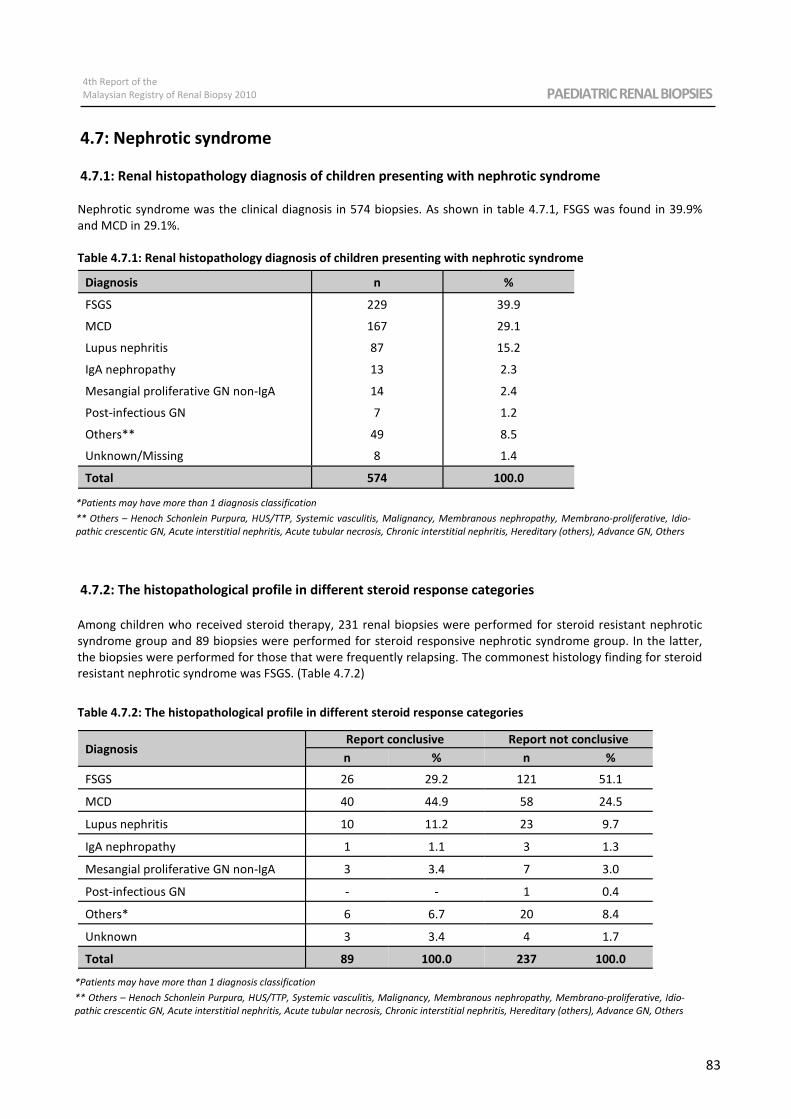
4th Report of the
Malaysian Registry of Renal Biopsy 2010 PAEDIATRIC RENAL BIOPSIES
83
4.7: Nephrotic syndrome
4.7.1: Renal histopathology diagnosis of children presenting with nephrotic syndrome
Nephrotic syndrome was the clinical diagnosis in 574 biopsies. As shown in table 4.7.1, FSGS was found in 39.9%
and MCD in 29.1%.
Table 4.7.1: Renal histopathology diagnosis of children presenting with nephrotic syndrome
4.7.2: The histopathological profile in different steroid response categories
Among children who received steroid therapy, 231 renal biopsies were performed for steroid resistant nephrotic
syndrome group and 89 biopsies were performed for steroid responsive nephrotic syndrome group. In the latter,
the biopsies were performed for those that were frequently relapsing. The commonest histology finding for steroid
resistant nephrotic syndrome was FSGS. (Table 4.7.2)
Table 4.7.2: The histopathological profile in different steroid response categories
Diagnosis n %
FSGS 229 39.9
MCD 167 29.1
Lupus nephritis 87 15.2
IgA nephropathy 13 2.3
Others** 49 8.5
Unknown/Missing 8 1.4
Total 574 100.0
Mesangial proliferative GN non-IgA 14 2.4
Post-infectious GN 7 1.2
*Patients may have more than 1 diagnosis classification
** Others – Henoch Schonlein Purpura, HUS/TTP, Systemic vasculitis, Malignancy, Membranous nephropathy, Membrano-proliferative, Idio-
pathic crescentic GN, Acute interstitial nephritis, Acute tubular necrosis, Chronic interstitial nephritis, Hereditary (others), Advance GN, Others
Diagnosis Report conclusive Report not conclusive
n % n %
Total 89 100.0 237 100.0
Unknown 3 3.4 4 1.7
Mesangial proliferative GN non-IgA 3 3.4 7 3.0
Post-infectious GN - - 1 0.4
FSGS 26 29.2 121 51.1
MCD 40 44.9 58 24.5
Lupus nephritis 10 11.2 23 9.7
IgA nephropathy 1 1.1 3 1.3
Others* 6 6.7 20 8.4
*Patients may have more than 1 diagnosis classification
** Others – Henoch Schonlein Purpura, HUS/TTP, Systemic vasculitis, Malignancy, Membranous nephropathy, Membrano-proliferative, Idio-
pathic crescentic GN, Acute interstitial nephritis, Acute tubular necrosis, Chronic interstitial nephritis, Hereditary (others), Advance GN, Others
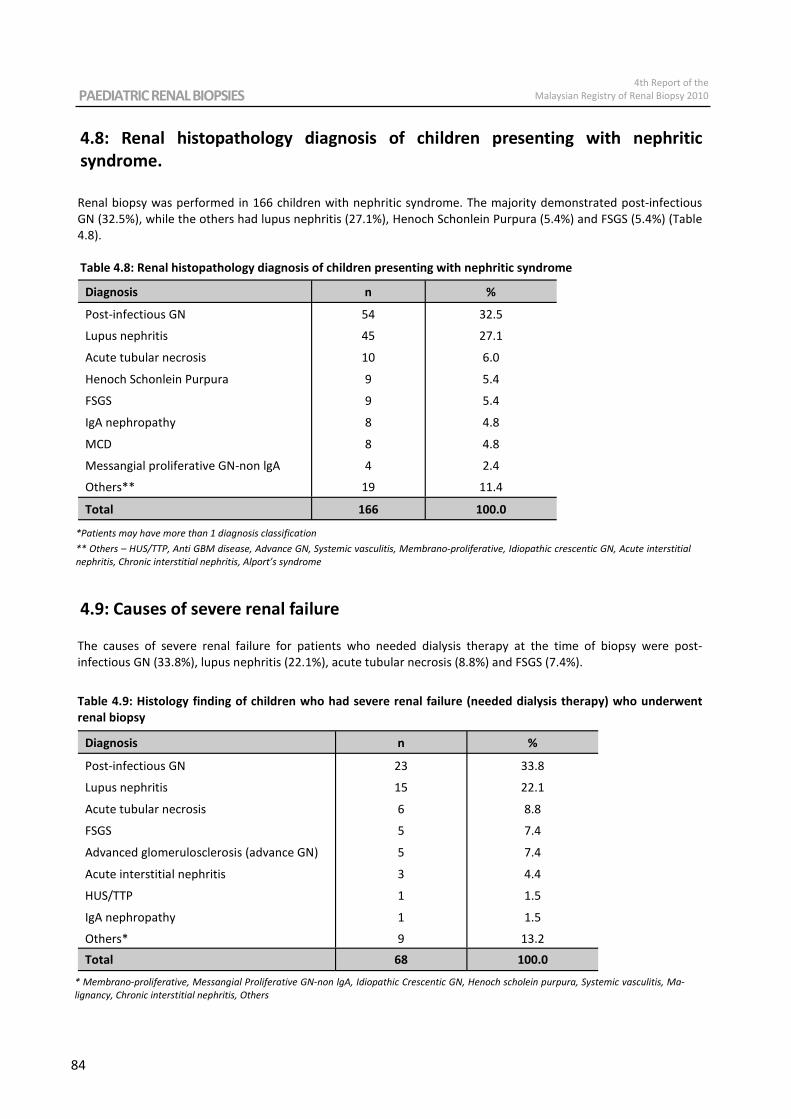
PAEDIATRIC RENAL BIOPSIES 4th Report of the
Malaysian Registry of Renal Biopsy 2010
84
4.8: Renal histopathology diagnosis of children presenting with nephritic
syndrome.
Renal biopsy was performed in 166 children with nephritic syndrome. The majority demonstrated post-infectious
GN (32.5%), while the others had lupus nephritis (27.1%), Henoch Schonlein Purpura (5.4%) and FSGS (5.4%) (Table
4.8).
Table 4.8: Renal histopathology diagnosis of children presenting with nephritic syndrome
4.9: Causes of severe renal failure The causes of severe renal failure for patients who needed dialysis therapy at the time of biopsy were post-
infectious GN (33.8%), lupus nephritis (22.1%), acute tubular necrosis (8.8%) and FSGS (7.4%).
Table 4.9: Histology finding of children who had severe renal failure (needed dialysis therapy) who underwent
renal biopsy
Diagnosis n %
Post-infectious GN 54 32.5
Lupus nephritis 45 27.1
Acute tubular necrosis 10 6.0
Henoch Schonlein Purpura 9 5.4
Messangial proliferative GN-non lgA 4 2.4
Others** 19 11.4
Total 166 100.0
IgA nephropathy 8 4.8
MCD 8 4.8
FSGS 9 5.4
*Patients may have more than 1 diagnosis classification
** Others – HUS/TTP, Anti GBM disease, Advance GN, Systemic vasculitis, Membrano-proliferative, Idiopathic crescentic GN, Acute interstitial
nephritis, Chronic interstitial nephritis, Alport’s syndrome
* Membrano-proliferative, Messangial Proliferative GN-non lgA, Idiopathic Crescentic GN, Henoch scholein purpura, Systemic vasculitis, Ma-
lignancy, Chronic interstitial nephritis, Others
Diagnosis n %
Post-infectious GN 23 33.8
Lupus nephritis 15 22.1
Acute tubular necrosis 6 8.8
FSGS 5 7.4
IgA nephropathy 1 1.5
Others* 9 13.2
Total 68 100.0
Acute interstitial nephritis 3 4.4
HUS/TTP 1 1.5
Advanced glomerulosclerosis (advance GN) 5 7.4
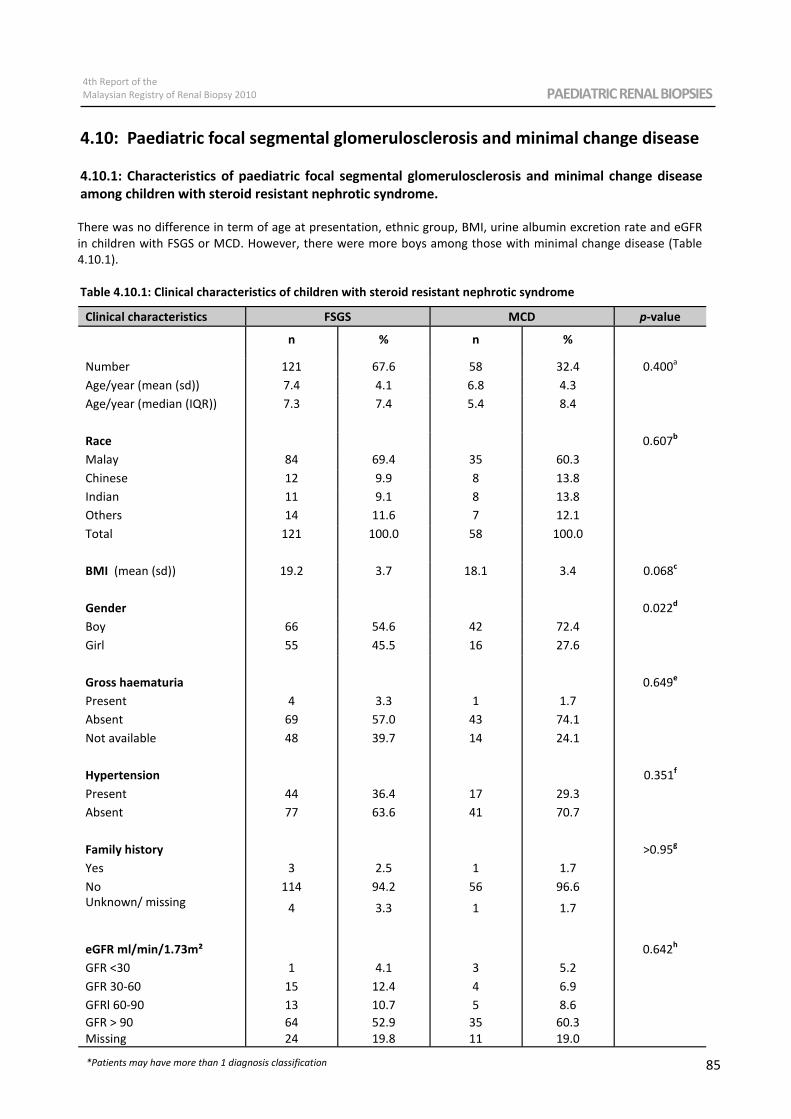
4th Report of the
Malaysian Registry of Renal Biopsy 2010 PAEDIATRIC RENAL BIOPSIES
85
4.10: Paediatric focal segmental glomerulosclerosis and minimal change disease
4.10.1: Characteristics of paediatric focal segmental glomerulosclerosis and minimal change disease
among children with steroid resistant nephrotic syndrome.
There was no difference in term of age at presentation, ethnic group, BMI, urine albumin excretion rate and eGFR
in children with FSGS or MCD. However, there were more boys among those with minimal change disease (Table
4.10.1).
Table 4.10.1: Clinical characteristics of children with steroid resistant nephrotic syndrome
Clinical characteristics FSGS MCD p-value
n % n %
Number 121 67.6 58 32.4 0.400a
Age/year (mean (sd)) 7.4 4.1 6.8 4.3
Age/year (median (IQR)) 7.3 7.4 5.4 8.4
Race 0.607b
Malay 84 69.4 35 60.3
Chinese 12 9.9 8 13.8
Indian 11 9.1 8 13.8
Others 14 11.6 7 12.1
Total 121 100.0 58 100.0
BMI (mean (sd)) 19.2 3.7 18.1 3.4 0.068c
Gender 0.022d
Boy 66 54.6 42 72.4
Girl 55 45.5 16 27.6
Gross haematuria 0.649e
Present 4 3.3 1 1.7
Absent 69 57.0 43 74.1
Not available 48 39.7 14 24.1
Hypertension 0.351f
Present 44 36.4 17 29.3
Absent 77 63.6 41 70.7
Family history >0.95g
Yes 3 2.5 1 1.7
No 114 94.2 56 96.6
Unknown/ missing
4 3.3 1 1.7
eGFR ml/min/1.73m² 0.642h
GFR <30 1 4.1 3 5.2
GFR 30-60 15 12.4 4 6.9
GFRl 60-90 13 10.7 5 8.6
GFR > 90
Missing
64
24
52.9
19.8
35
11
60.3
19.0
*Patients may have more than 1 diagnosis classification
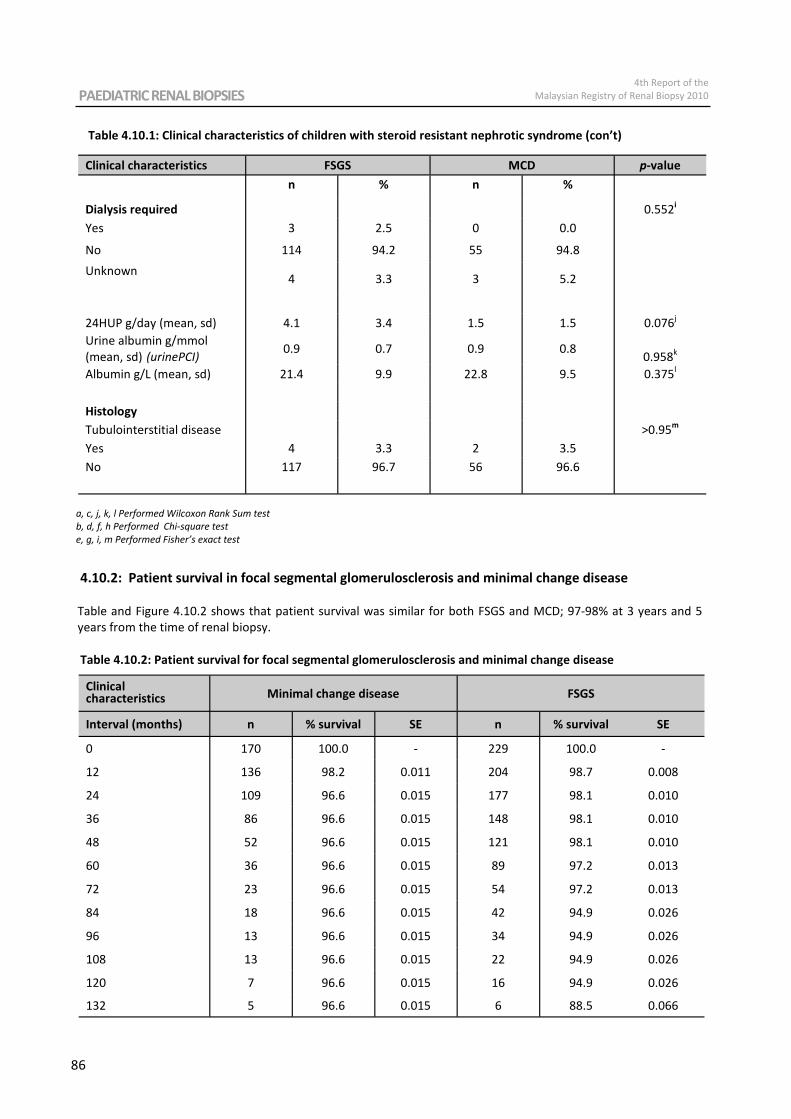
PAEDIATRIC RENAL BIOPSIES 4th Report of the
Malaysian Registry of Renal Biopsy 2010
86
a, c, j, k, l Performed Wilcoxon Rank Sum test
b, d, f, h Performed Chi-square test
e, g, i, m Performed Fisher’s exact test
Clinical characteristics FSGS MCD p-value
n % n %
Dialysis required 0.552i
Yes 3 2.5 0 0.0
No 114 94.2 55 94.8
Unknown
4 3.3 3 5.2
24HUP g/day (mean, sd) 4.1 3.4 1.5 1.5 0.076j
Urine albumin g/mmol
(mean, sd) (urinePCI)
0.9 0.7 0.9 0.8
0.958k
Albumin g/L (mean, sd) 21.4 9.9 22.8 9.5 0.375l
Histology
Tubulointerstitial disease >0.95m
Yes 4 3.3 2 3.5
No 117 96.7 56 96.6
4.10.2: Patient survival in focal segmental glomerulosclerosis and minimal change disease
Table and Figure 4.10.2 shows that patient survival was similar for both FSGS and MCD; 97-98% at 3 years and 5
years from the time of renal biopsy.
Table 4.10.2: Patient survival for focal segmental glomerulosclerosis and minimal change disease
Clinical characteristics Minimal change disease FSGS
Interval (months) n % survival SE n % survival SE
0 170 100.0 - 229 100.0 -
12 136 98.2 0.011 204 98.7 0.008
24 109 96.6 0.015 177 98.1 0.010
36 86 96.6 0.015 148 98.1 0.010
48 52 96.6 0.015 121 98.1 0.010
60 36 96.6 0.015 89 97.2 0.013
72 23 96.6 0.015 54 97.2 0.013
84 18 96.6 0.015 42 94.9 0.026
96 13 96.6 0.015 34 94.9 0.026
108 13 96.6 0.015 22 94.9 0.026
120 7 96.6 0.015 16 94.9 0.026
132 5 96.6 0.015 6 88.5 0.066
Table 4.10.1: Clinical characteristics of children with steroid resistant nephrotic syndrome (con’t)
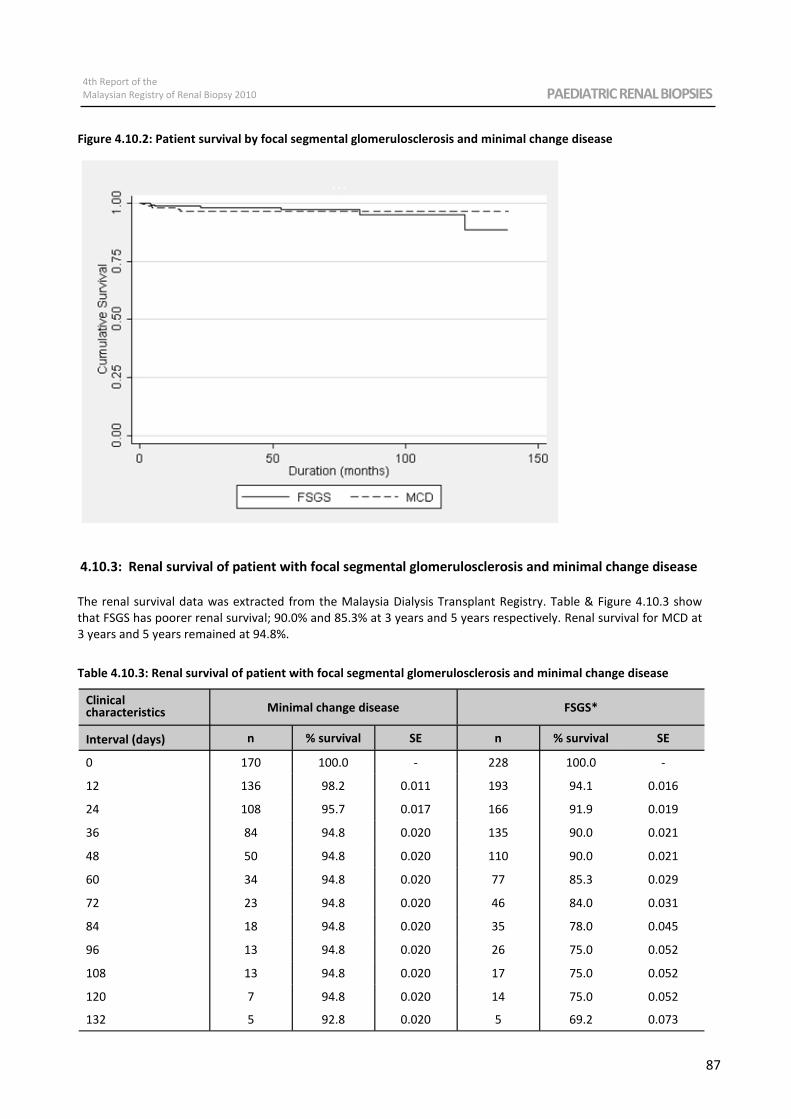
4th Report of the
Malaysian Registry of Renal Biopsy 2010 PAEDIATRIC RENAL BIOPSIES
87
Figure 4.10.2: Patient survival by focal segmental glomerulosclerosis and minimal change disease
4.10.3: Renal survival of patient with focal segmental glomerulosclerosis and minimal change disease
The renal survival data was extracted from the Malaysia Dialysis Transplant Registry. Table & Figure 4.10.3 show
that FSGS has poorer renal survival; 90.0% and 85.3% at 3 years and 5 years respectively. Renal survival for MCD at
3 years and 5 years remained at 94.8%.
Table 4.10.3: Renal survival of patient with focal segmental glomerulosclerosis and minimal change disease
Clinical characteristics Minimal change disease FSGS*
Interval (days) n % survival SE n % survival SE
0 170 100.0 - 228 100.0 -
12 136 98.2 0.011 193 94.1 0.016
24 108 95.7 0.017 166 91.9 0.019
36 84 94.8 0.020 135 90.0 0.021
48 50 94.8 0.020 110 90.0 0.021
60 34 94.8 0.020 77 85.3 0.029
72 23 94.8 0.020 46 84.0 0.031
84 18 94.8 0.020 35 78.0 0.045
96 13 94.8 0.020 26 75.0 0.052
108 13 94.8 0.020 17 75.0 0.052
120 7 94.8 0.020 14 75.0 0.052
132 5 92.8 0.020 5 69.2 0.073
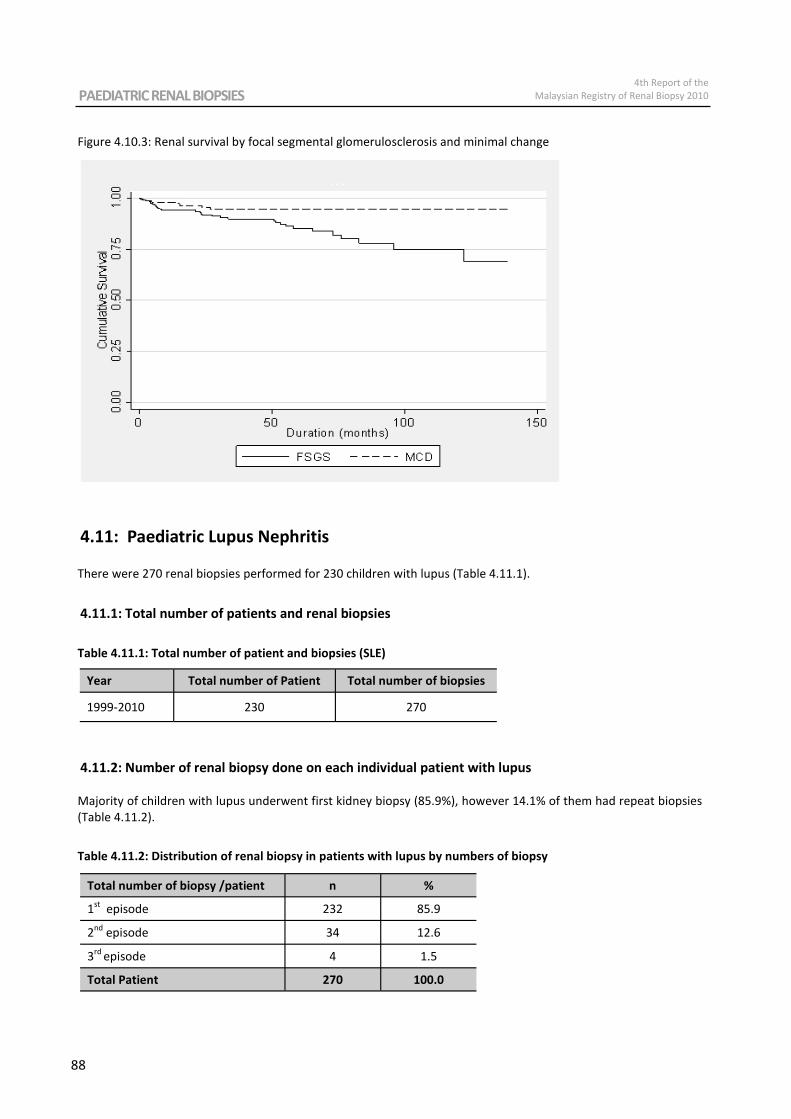
PAEDIATRIC RENAL BIOPSIES 4th Report of the
Malaysian Registry of Renal Biopsy 2010
88
Figure 4.10.3: Renal survival by focal segmental glomerulosclerosis and minimal change
4.11: Paediatric Lupus Nephritis There were 270 renal biopsies performed for 230 children with lupus (Table 4.11.1).
4.11.1: Total number of patients and renal biopsies
Table 4.11.1: Total number of patient and biopsies (SLE)
4.11.2: Number of renal biopsy done on each individual patient with lupus
Majority of children with lupus underwent first kidney biopsy (85.9%), however 14.1% of them had repeat biopsies
(Table 4.11.2).
Table 4.11.2: Distribution of renal biopsy in patients with lupus by numbers of biopsy
Year Total number of Patient
1999-2010 230
Total number of biopsies
270
2nd
episode 34
Total Patient 270
12.6
100.0
Total number of biopsy /patient n %
1st
episode 232 85.9
3rd
episode 4 1.5

4th Report of the
Malaysian Registry of Renal Biopsy 2010 PAEDIATRIC RENAL BIOPSIES
89
4.11.3: Patient characteristics of paediatric lupus nephritis
The female: male ratio was 6.4:1 reflecting the preponderance of lupus in females. The racial distribution for
paediatric lupus nephritis was Malay (62.6%), Chinese (25.7%), Indian (3.0%) and others (8.7%). The mean age of
children with lupus nephritis at the time of biopsy was 11.4 ± 3.1 years. (Table 4.11.3.1, Table 4.11.3.2 & Table
4.11.3.3). At the time of biopsy, 5.9% of the patients needed dialysis therapy and 41.5% has hypertension.
(Table 4.11.3.4 & Table 4.11.3.5). The most frequent clinical presentation at biopsy was nephrotic syndrome
31.1%. (Table 4.11.3.6).
Table 4.11.3.1: Gender distribution for paediatric
lupus nephritis
Gender n %
Male 31 13.5
Female 199 86.5
Total 230 100.0
Table 4.11.3.2: Racial distribution for paediatric
lupus nephritis
Indian 7
Total 230
3.0
100.0
Ethnic n %
Malay 144 62.6
Others* 20 8.7
Chinese 59 25.7
Table 4.11.3.3 Age for paediatric lupus nephritis
Age (years) 1999-2010
n 270
Mean 11.4
Standard deviation 3.1
Minimum 0.1
Maximum 15.0
Table 4.11.3.4 Dialysis therapy for paediatric lupus
nephritis at the time of biopsy
Needed dialysis therapy n %
No 206 76.3
Missing/Not available 48 17.8
Total 270 100.0
Yes 16 5.9
Table 4.11.3.5: Patient with hypertension (SLE)
Hypertension n %
Yes 112 41.5
No 148 54.8
Missing/Not available 10 3.7
Total 270 100.0
Table 4.11.3.6: Clinical presentation at biopsy (SLE)
Clinical presentation n %
Nephritic syndrome 44 16.3
Nephrotic syndrome 84 31.1
Total 270 100.0
Asymptomatic urine abnormalities 70 25.9
Nephritic nephrotic syndrome 46 17.0
Unknown 23 8.5
Missing 3 1.1
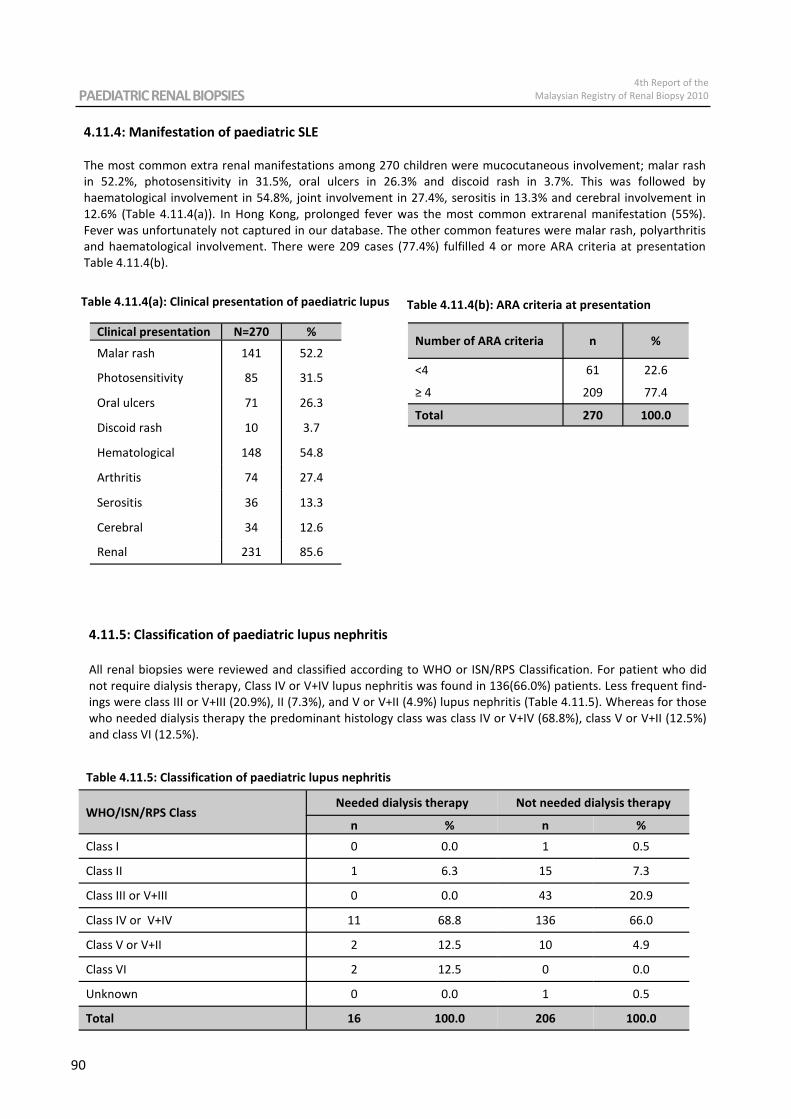
PAEDIATRIC RENAL BIOPSIES 4th Report of the
Malaysian Registry of Renal Biopsy 2010
90
4.11.4: Manifestation of paediatric SLE
The most common extra renal manifestations among 270 children were mucocutaneous involvement; malar rash
in 52.2%, photosensitivity in 31.5%, oral ulcers in 26.3% and discoid rash in 3.7%. This was followed by
haematological involvement in 54.8%, joint involvement in 27.4%, serositis in 13.3% and cerebral involvement in
12.6% (Table 4.11.4(a)). In Hong Kong, prolonged fever was the most common extrarenal manifestation (55%).
Fever was unfortunately not captured in our database. The other common features were malar rash, polyarthritis
and haematological involvement. There were 209 cases (77.4%) fulfilled 4 or more ARA criteria at presentation
Table 4.11.4(b).
Table 4.11.4(a): Clinical presentation of paediatric lupus
Clinical presentation N=270 %
Malar rash 141 52.2
Photosensitivity 85 31.5
Oral ulcers 71 26.3
Discoid rash 10 3.7
Hematological 148 54.8
Arthritis 74 27.4
Serositis 36 13.3
Cerebral 34 12.6
Renal 231 85.6
Number of ARA criteria n %
<4 61 22.6
≥ 4 209 77.4
Total 270 100.0
Table 4.11.4(b): ARA criteria at presentation
4.11.5: Classification of paediatric lupus nephritis
All renal biopsies were reviewed and classified according to WHO or ISN/RPS Classification. For patient who did
not require dialysis therapy, Class IV or V+IV lupus nephritis was found in 136(66.0%) patients. Less frequent find-
ings were class III or V+III (20.9%), II (7.3%), and V or V+II (4.9%) lupus nephritis (Table 4.11.5). Whereas for those
who needed dialysis therapy the predominant histology class was class IV or V+IV (68.8%), class V or V+II (12.5%)
and class VI (12.5%).
Table 4.11.5: Classification of paediatric lupus nephritis
WHO/ISN/RPS Class Needed dialysis therapy Not needed dialysis therapy
n % n %
Class I 0 0.0 1 0.5
Class II 1 6.3 15 7.3
Class III or V+III 0 0.0 43 20.9
Class IV or V+IV 11 68.8 136 66.0
Class V or V+II 2 12.5 10 4.9
Class VI 2 12.5 0 0.0
Unknown 0 0.0 1 0.5
Total 16 100.0 206 100.0
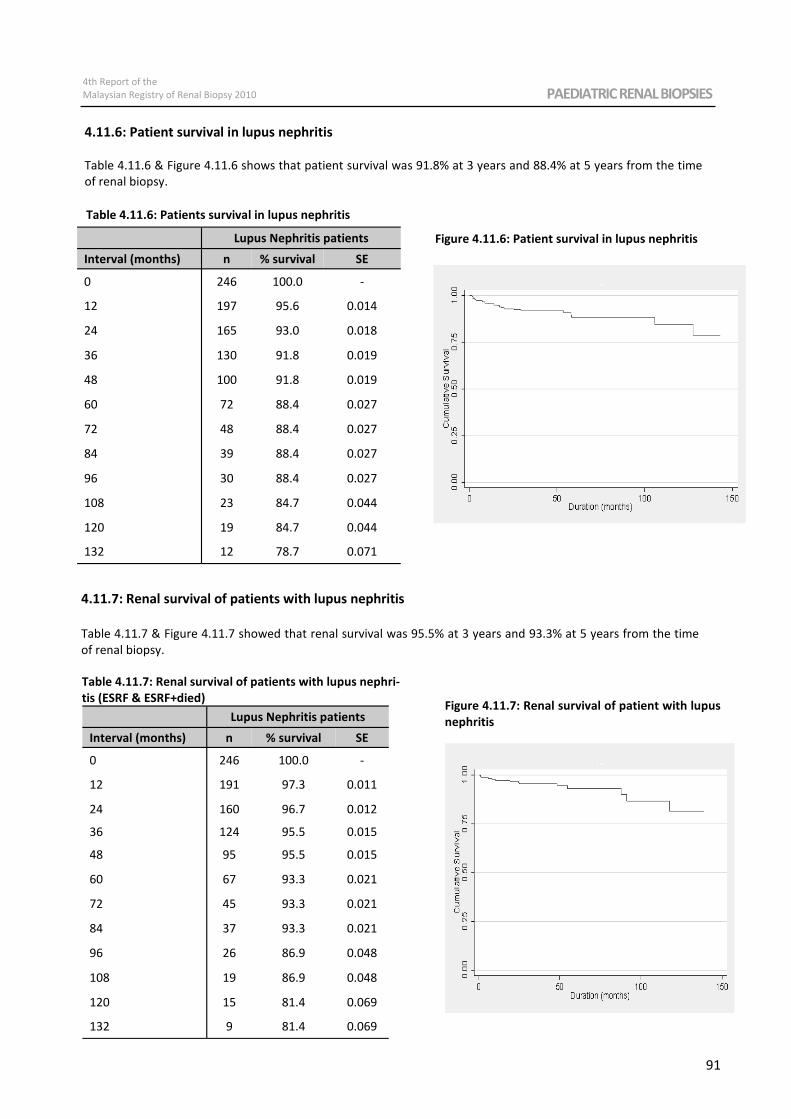
4th Report of the
Malaysian Registry of Renal Biopsy 2010 PAEDIATRIC RENAL BIOPSIES
91
Lupus Nephritis patients
Interval (months) n % survival SE
0 246 100.0 -
12 197 95.6 0.014
84 39 88.4 0.027
96 30 88.4 0.027
108 23 84.7 0.044
120 19 84.7 0.044
132 12 78.7 0.071
24 165 93.0 0.018
36 130 91.8 0.019
48 100 91.8 0.019
60 72 88.4 0.027
72 48 88.4 0.027
Figure 4.11.6: Patient survival in lupus nephritis
Table 4.11.6: Patients survival in lupus nephritis
4.11.7: Renal survival of patients with lupus nephritis
Table 4.11.7 & Figure 4.11.7 showed that renal survival was 95.5% at 3 years and 93.3% at 5 years from the time
of renal biopsy.
Lupus Nephritis patients
Interval (months) n % survival SE
0 246 100.0 -
12 191 97.3 0.011
84 37 93.3 0.021
96 26 86.9 0.048
108 19 86.9 0.048
120 15 81.4 0.069
132 9 81.4 0.069
24 160 96.7 0.012
36 124 95.5 0.015
48 95 95.5 0.015
60 67 93.3 0.021
72 45 93.3 0.021
Table 4.11.7: Renal survival of patients with lupus nephri-
tis (ESRF & ESRF+died) Figure 4.11.7: Renal survival of patient with lupus
nephritis
4.11.6: Patient survival in lupus nephritis
Table 4.11.6 & Figure 4.11.6 shows that patient survival was 91.8% at 3 years and 88.4% at 5 years from the time
of renal biopsy.
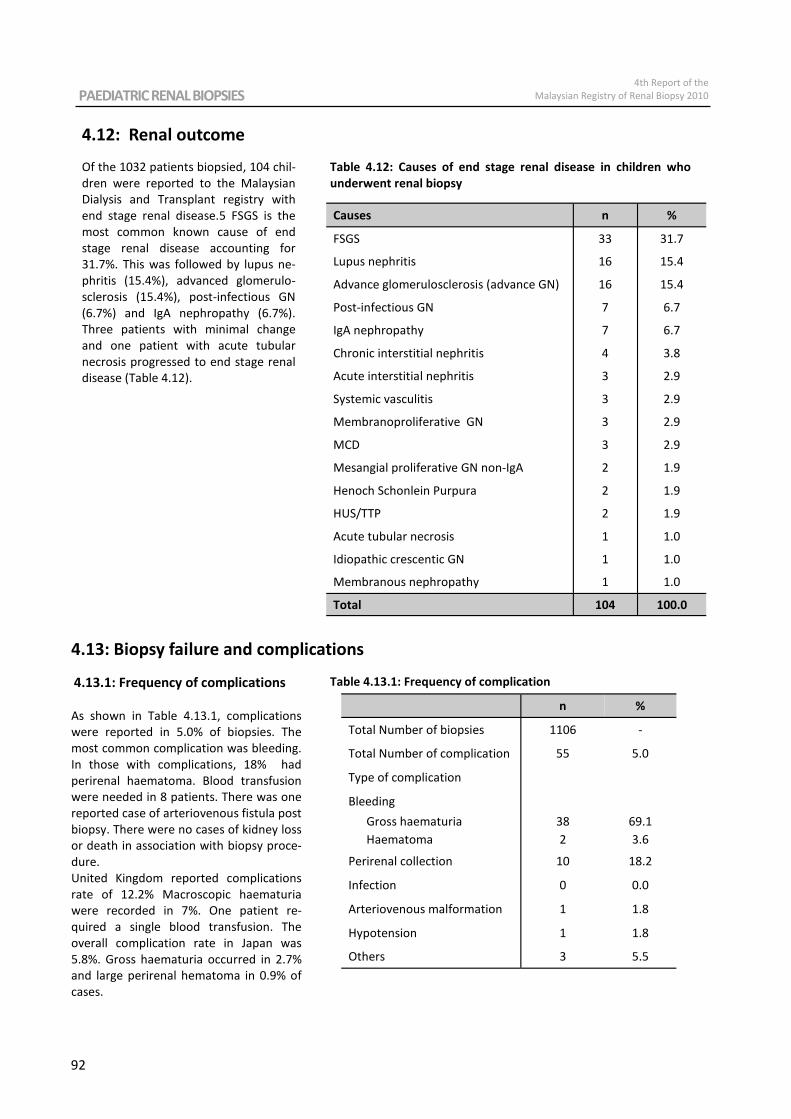
PAEDIATRIC RENAL BIOPSIES 4th Report of the
Malaysian Registry of Renal Biopsy 2010
92
4.12: Renal outcome
Of the 1032 patients biopsied, 104 chil-
dren were reported to the Malaysian
Dialysis and Transplant registry with
end stage renal disease.5 FSGS is the
most common known cause of end
stage renal disease accounting for
31.7%. This was followed by lupus ne-
phritis (15.4%), advanced glomerulo-
sclerosis (15.4%), post-infectious GN
(6.7%) and IgA nephropathy (6.7%).
Three patients with minimal change
and one patient with acute tubular
necrosis progressed to end stage renal
disease (Table 4.12).
Causes n %
FSGS 33 31.7
Lupus nephritis 16 15.4
Advance glomerulosclerosis (advance GN) 16 15.4
Post-infectious GN 7 6.7
IgA nephropathy 7 6.7
Chronic interstitial nephritis 4 3.8
Acute interstitial nephritis 3 2.9
Systemic vasculitis 3 2.9
Membranoproliferative GN 3 2.9
MCD 3 2.9
Mesangial proliferative GN non-IgA 2 1.9
Henoch Schonlein Purpura 2 1.9
HUS/TTP 2 1.9
Acute tubular necrosis 1 1.0
Idiopathic crescentic GN 1 1.0
Membranous nephropathy 1 1.0
Total 104 100.0
Table 4.12: Causes of end stage renal disease in children who
underwent renal biopsy
4.13.1: Frequency of complications
As shown in Table 4.13.1, complications
were reported in 5.0% of biopsies. The
most common complication was bleeding.
In those with complications, 18% had
perirenal haematoma. Blood transfusion
were needed in 8 patients. There was one
reported case of arteriovenous fistula post
biopsy. There were no cases of kidney loss
or death in association with biopsy proce-
dure.
United Kingdom reported complications
rate of 12.2% Macroscopic haematuria
were recorded in 7%. One patient re-
quired a single blood transfusion. The
overall complication rate in Japan was
5.8%. Gross haematuria occurred in 2.7%
and large perirenal hematoma in 0.9% of
cases.
4.13: Biopsy failure and complications
n %
Total Number of biopsies 1106 -
Total Number of complication 55 5.0
Type of complication
Bleeding
Gross haematuria 38 69.1
Haematoma 2 3.6
Perirenal collection 10 18.2
Infection 0 0.0
Arteriovenous malformation 1 1.8
Hypotension 1 1.8
Others 3 5.5
Table 4.13.1: Frequency of complication
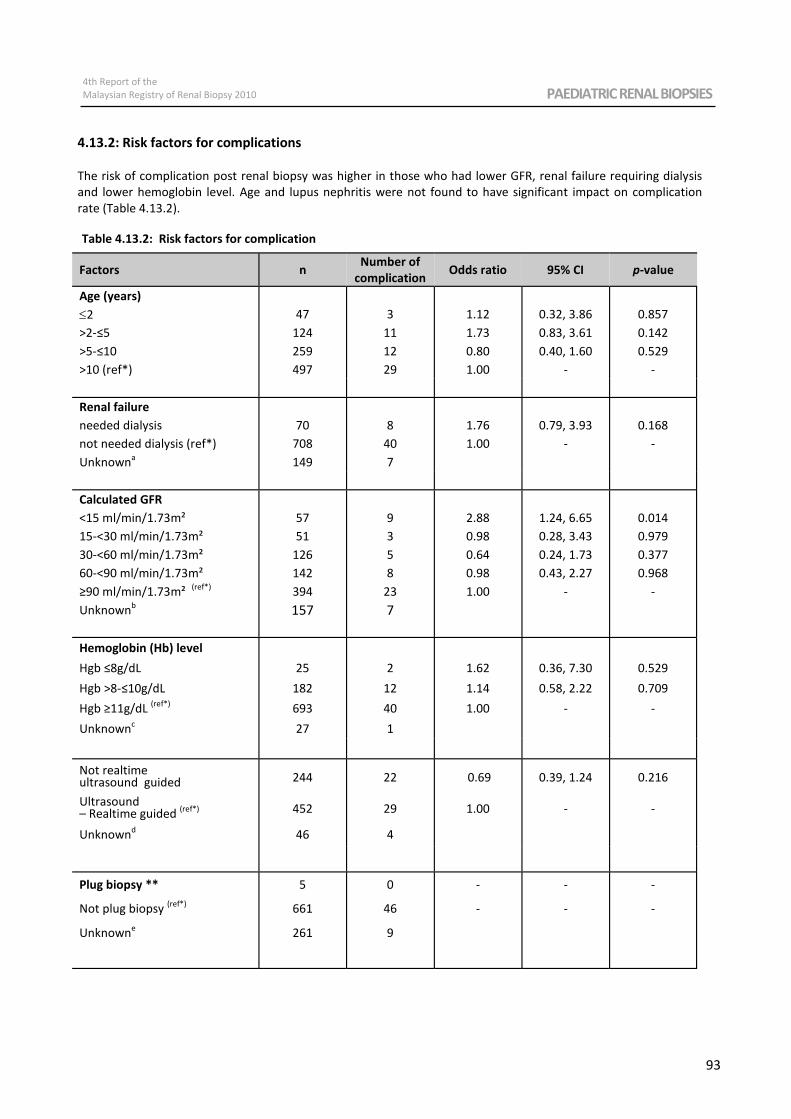
4th Report of the
Malaysian Registry of Renal Biopsy 2010 PAEDIATRIC RENAL BIOPSIES
93
4.13.2: Risk factors for complications
The risk of complication post renal biopsy was higher in those who had lower GFR, renal failure requiring dialysis
and lower hemoglobin level. Age and lupus nephritis were not found to have significant impact on complication
rate (Table 4.13.2).
Factors n Number of
complication Odds ratio 95% CI p-value
Age (years)
≤2 47 3 1.12 0.32, 3.86 0.857
>2-≤5 124 11 1.73 0.83, 3.61 0.142
>5-≤10 259 12 0.80 0.40, 1.60 0.529
>10 (ref*) 497 29 1.00 - -
Renal failure
needed dialysis 70 8 1.76 0.79, 3.93 0.168
not needed dialysis (ref*) 708 40 1.00 - -
Unknowna 149 7
Calculated GFR
<15 ml/min/1.73m² 57 9 2.88 1.24, 6.65 0.014
15-<30 ml/min/1.73m² 51 3 0.98 0.28, 3.43 0.979
30-<60 ml/min/1.73m² 126 5 0.64 0.24, 1.73 0.377
60-<90 ml/min/1.73m² 142 8 0.98 0.43, 2.27 0.968
≥90 ml/min/1.73m² (ref*) 394 23 1.00 - -
Unknownb 157 7
Hemoglobin (Hb) level
Hgb ≤8g/dL 25 2 1.62 0.36, 7.30 0.529
Hgb >8-≤10g/dL 182 12 1.14 0.58, 2.22 0.709
Hgb ≥11g/dL (ref*)
693 40 1.00 - -
Unknownc 27 1
Not realtime ultrasound guided 244 22 0.69 0.39, 1.24 0.216
Ultrasound – Realtime guided
(ref*) 452 29 1.00 - -
Unknownd 46 4
Plug biopsy ** 5 0 - - -
Not plug biopsy (ref*)
661 46 - - -
Unknowne 261 9
Table 4.13.2: Risk factors for complication
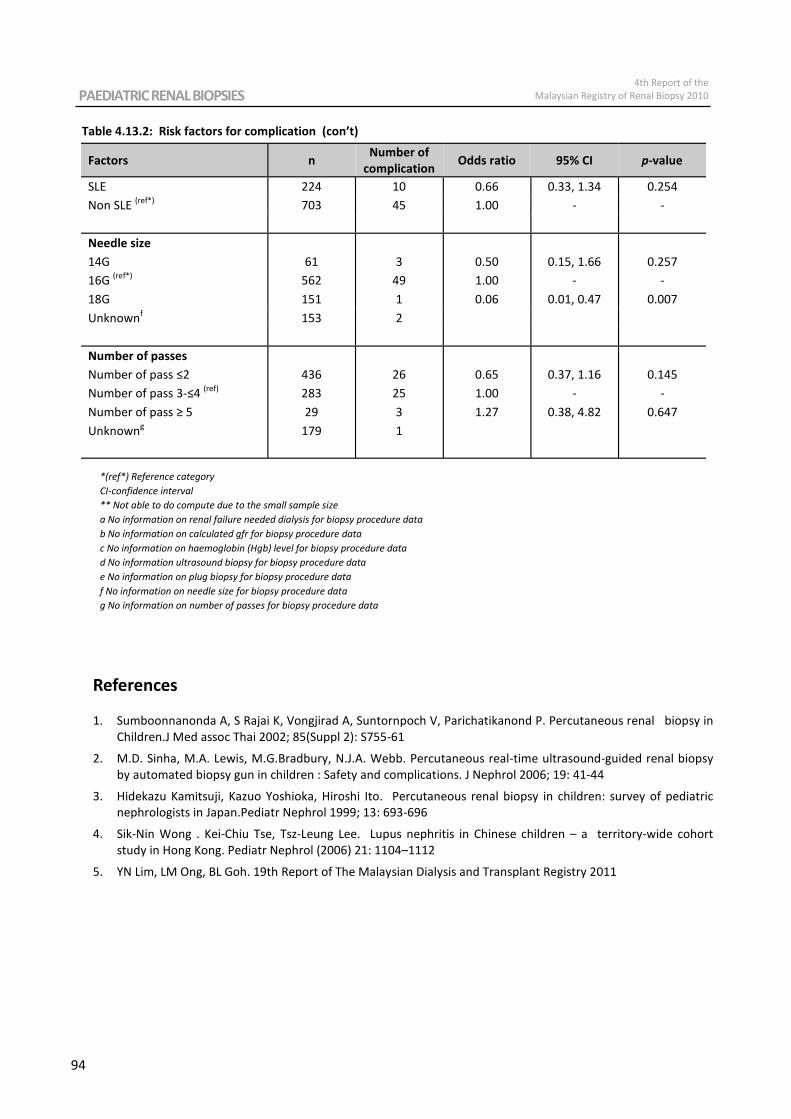
PAEDIATRIC RENAL BIOPSIES 4th Report of the
Malaysian Registry of Renal Biopsy 2010
94
*(ref*) Reference category
CI-confidence interval
** Not able to do compute due to the small sample size
a No information on renal failure needed dialysis for biopsy procedure data
b No information on calculated gfr for biopsy procedure data
c No information on haemoglobin (Hgb) level for biopsy procedure data
d No information ultrasound biopsy for biopsy procedure data
e No information on plug biopsy for biopsy procedure data
f No information on needle size for biopsy procedure data
g No information on number of passes for biopsy procedure data
Table 4.13.2: Risk factors for complication (con’t)
Factors n Number of
complication Odds ratio 95% CI p-value
SLE 224 10 0.66 0.33, 1.34 0.254
Non SLE (ref*) 703 45 1.00 - -
Needle size
14G 61 3 0.50 0.15, 1.66 0.257
16G (ref*) 562 49 1.00 - -
18G 151 1 0.06 0.01, 0.47 0.007
Unknownf 153 2
Number of passes
Number of pass ≤2 436 26 0.65 0.37, 1.16 0.145
Number of pass 3-≤4 (ref) 283 25 1.00 - -
Number of pass ≥ 5 29 3 1.27 0.38, 4.82 0.647
Unknowng 179 1
References
1. Sumboonnanonda A, S Rajai K, Vongjirad A, Suntornpoch V, Parichatikanond P. Percutaneous renal biopsy in
Children.J Med assoc Thai 2002; 85(Suppl 2): S755-61
2. M.D. Sinha, M.A. Lewis, M.G.Bradbury, N.J.A. Webb. Percutaneous real-time ultrasound-guided renal biopsy
by automated biopsy gun in children : Safety and complications. J Nephrol 2006; 19: 41-44
3. Hidekazu Kamitsuji, Kazuo Yoshioka, Hiroshi Ito. Percutaneous renal biopsy in children: survey of pediatric
nephrologists in Japan.Pediatr Nephrol 1999; 13: 693-696
4. Sik-Nin Wong . Kei-Chiu Tse, Tsz-Leung Lee. Lupus nephritis in Chinese children – a territory-wide cohort
study in Hong Kong. Pediatr Nephrol (2006) 21: 1104–1112
5. YN Lim, LM Ong, BL Goh. 19th Report of The Malaysian Dialysis and Transplant Registry 2011

4th Report of the
Malaysian Registry of Renal Biopsy 2010 RENAL ALLOGRAFT BIOPSY
95
CHAPTER 5
Renal Allograft Biopsy
Wong Hin Seng
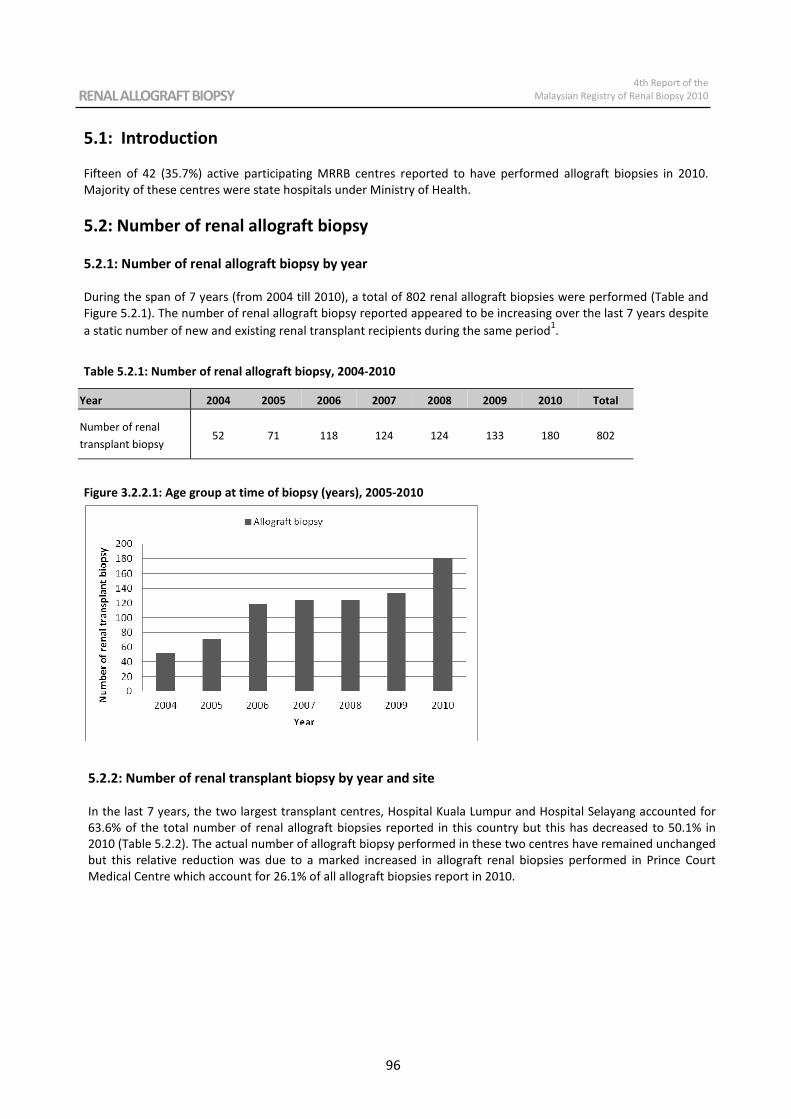
RENAL ALLOGRAFT BIOPSY 4th Report of the
Malaysian Registry of Renal Biopsy 2010
96
5.1: Introduction
Fifteen of 42 (35.7%) active participating MRRB centres reported to have performed allograft biopsies in 2010.
Majority of these centres were state hospitals under Ministry of Health.
5.2: Number of renal allograft biopsy
5.2.1: Number of renal allograft biopsy by year
During the span of 7 years (from 2004 till 2010), a total of 802 renal allograft biopsies were performed (Table and
Figure 5.2.1). The number of renal allograft biopsy reported appeared to be increasing over the last 7 years despite
a static number of new and existing renal transplant recipients during the same period1.
Table 5.2.1: Number of renal allograft biopsy, 2004-2010
Figure 3.2.2.1: Age group at time of biopsy (years), 2005-2010
5.2.2: Number of renal transplant biopsy by year and site
In the last 7 years, the two largest transplant centres, Hospital Kuala Lumpur and Hospital Selayang accounted for
63.6% of the total number of renal allograft biopsies reported in this country but this has decreased to 50.1% in
2010 (Table 5.2.2). The actual number of allograft biopsy performed in these two centres have remained unchanged
but this relative reduction was due to a marked increased in allograft renal biopsies performed in Prince Court
Medical Centre which account for 26.1% of all allograft biopsies report in 2010.
Year 2004 2005 2006 2007 2008 2009 2010 Total
Number of renal
transplant biopsy 52 71 118 124 124 133 180 802
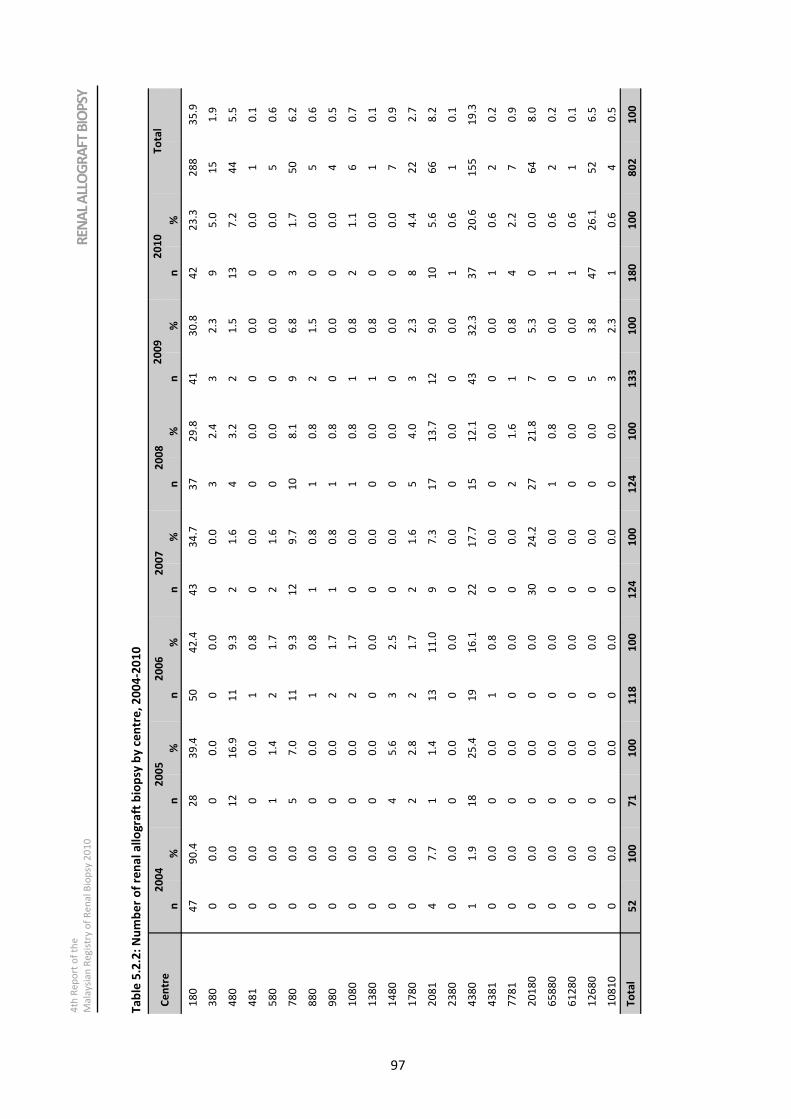
4th Report of the
Malaysian Registry of Renal Biopsy 2010 RENAL ALLOGRAFT BIOPSY
97
Ta
ble
5.2
.2:
Nu
mb
er
of
ren
al
all
og
raft
bio
psy
by
ce
ntr
e,
20
04
-20
10
REN
AL
ALL
OG
RA
FT B
IOP
SY
4th
Re
po
rt o
f th
e
Ma
laysi
an
Re
gis
try o
f R
en
al B
iop
sy 2
01
0
Ce
ntr
e
2
00
4
20
05
2
00
6
20
07
2
00
8
20
09
2
01
0
n
%
n
%
n
%
n
%
n
%
n
%
n
%
18
0
47
9
0.4
2
8
39
.4
50
4
2.4
4
3
34
.7
37
2
9.8
4
1
30
.8
42
2
3.3
2
88
3
5.9
38
0
0
0.0
0
0
.0
0
0.0
0
0
.0
3
2.4
3
2
.3
9
5.0
1
5
1.9
48
0
0
0.0
1
2
16
.9
11
9
.3
2
1.6
4
3
.2
2
1.5
1
3
7.2
4
4
5.5
98
0
0
0.0
0
0
.0
2
1.7
1
0
.8
1
0.8
0
0
.0
0
0.0
4
0
.5
10
80
0
0
.0
0
0.0
2
1
.7
0
0.0
1
0
.8
1
0.8
2
1
.1
6
0.7
10
81
0
0
0.0
0
0
.0
0
0.0
0
0
.0
0
0.0
3
2
.3
1
0.6
4
0
.5
To
tal
52
1
00
7
1
10
0
11
8
10
0
12
4
10
0
12
4
10
0
13
3
10
0
18
0
10
0
80
2
10
0
To
tal
78
0
0
0.0
5
7
.0
11
9
.3
12
9
.7
10
8
.1
9
6.8
3
1
.7
50
6
.2
88
0
0
0.0
0
0
.0
1
0.8
1
0
.8
1
0.8
2
1
.5
0
0.0
5
0
.6
13
80
0
0
.0
0
0.0
0
0
.0
0
0.0
0
0
.0
1
0.8
0
0
.0
1
0.1
14
80
0
0
.0
4
5.6
3
2
.5
0
0.0
0
0
.0
0
0.0
0
0
.0
7
0.9
17
80
0
0
.0
2
2.8
2
1
.7
2
1.6
5
4
.0
3
2.3
8
4
.4
22
2
.7
20
81
4
7
.7
1
1.4
1
3
11
.0
9
7.3
1
7
13
.7
12
9
.0
10
5
.6
66
8
.2
23
80
0
0
.0
0
0.0
0
0
.0
0
0.0
0
0
.0
0
0.0
1
0
.6
1
0.1
43
80
1
1
.9
18
2
5.4
1
9
16
.1
22
1
7.7
1
5
12
.1
43
3
2.3
3
7
20
.6
15
5
19
.3
43
81
0
0
.0
0
0.0
1
0
.8
0
0.0
0
0
.0
0
0.0
1
0
.6
2
0.2
77
81
0
0
.0
0
0.0
0
0
.0
0
0.0
2
1
.6
1
0.8
4
2
.2
7
0.9
20
18
0
0
0.0
0
0
.0
0
0.0
3
0
24
.2
27
2
1.8
7
5
.3
0
0.0
6
4
8.0
65
88
0
0
0.0
0
0
.0
0
0.0
0
0
.0
1
0.8
0
0
.0
1
0.6
2
0
.2
61
28
0
0
0.0
0
0
.0
0
0.0
0
0
.0
0
0.0
0
0
.0
1
0.6
1
0
.1
12
68
0
0
0.0
0
0
.0
0
0.0
0
0
.0
0
0.0
5
3
.8
47
2
6.1
5
2
6.5
48
1
0
0.0
0
0
.0
1
0.8
0
0
.0
0
0.0
0
0
.0
0
0.0
1
0
.1
58
0
0
0.0
1
1
.4
2
1.7
2
1
.6
0
0.0
0
0
.0
0
0.0
5
0
.6
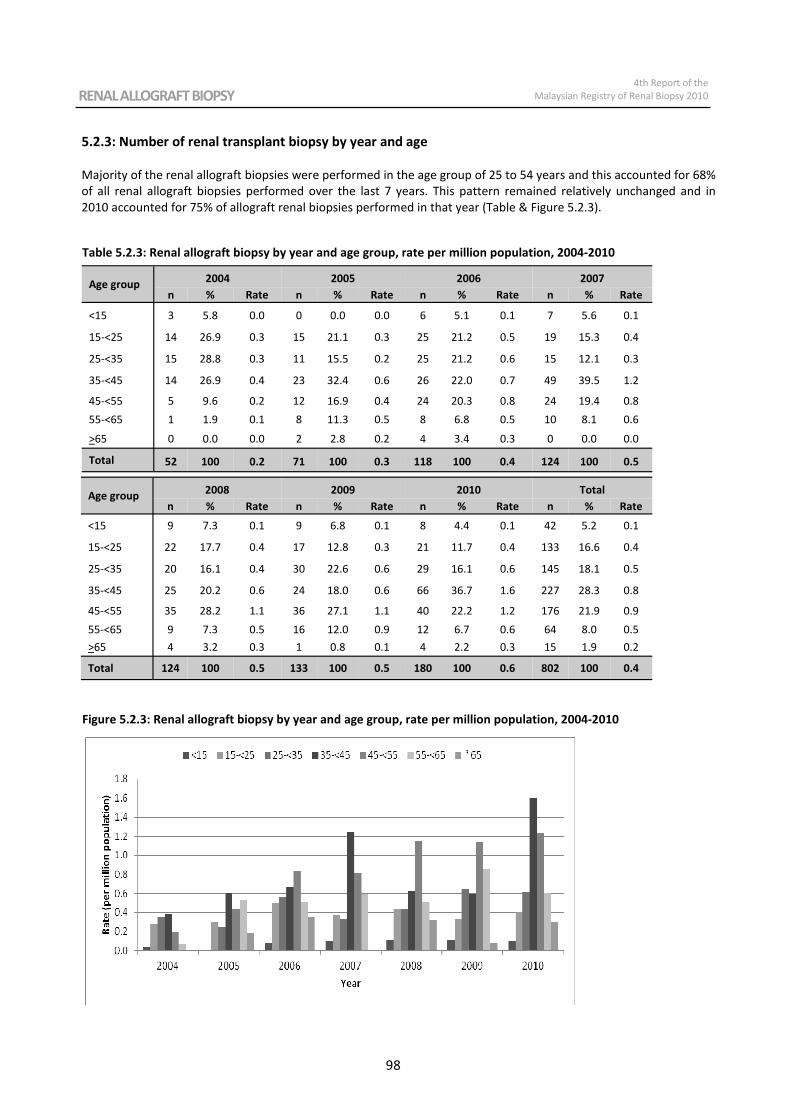
RENAL ALLOGRAFT BIOPSY 4th Report of the
Malaysian Registry of Renal Biopsy 2010
98
Table 5.2.3: Renal allograft biopsy by year and age group, rate per million population, 2004-2010
Figure 5.2.3: Renal allograft biopsy by year and age group, rate per million population, 2004-2010
Age group 2004 2005 2006 2007
n % Rate n % Rate n % Rate n % Rate
<15 3 5.8 0.0 0 0.0 0.0 6 5.1 0.1 7 5.6 0.1
15-<25 14 26.9 0.3 15 21.1 0.3 25 21.2 0.5 19 15.3 0.4
25-<35 15 28.8 0.3 11 15.5 0.2 25 21.2 0.6 15 12.1 0.3
35-<45 14 26.9 0.4 23 32.4 0.6 26 22.0 0.7 49 39.5 1.2
45-<55 5 9.6 0.2 12 16.9 0.4 24 20.3 0.8 24 19.4 0.8
55-<65 1 1.9 0.1 8 11.3 0.5 8 6.8 0.5 10 8.1 0.6
>65 0 0.0 0.0 2 2.8 0.2 4 3.4 0.3 0 0.0 0.0
Total 52 100 0.2 71 100 0.3 118 100 0.4 124 100 0.5
Age group 2008 2009 2010 Total
n % Rate n % Rate n % Rate n % Rate
<15 9 7.3 0.1 9 6.8 0.1 8 4.4 0.1 42 5.2 0.1
15-<25 22 17.7 0.4 17 12.8 0.3 21 11.7 0.4 133 16.6 0.4
25-<35 20 16.1 0.4 30 22.6 0.6 29 16.1 0.6 145 18.1 0.5
35-<45 25 20.2 0.6 24 18.0 0.6 66 36.7 1.6 227 28.3 0.8
45-<55 35 28.2 1.1 36 27.1 1.1 40 22.2 1.2 176 21.9 0.9
55-<65 9 7.3 0.5 16 12.0 0.9 12 6.7 0.6 64 8.0 0.5
>65 4 3.2 0.3 1 0.8 0.1 4 2.2 0.3 15 1.9 0.2
Total 124 100 0.5 133 100 0.5 180 100 0.6 802 100 0.4
5.2.3: Number of renal transplant biopsy by year and age
Majority of the renal allograft biopsies were performed in the age group of 25 to 54 years and this accounted for 68%
of all renal allograft biopsies performed over the last 7 years. This pattern remained relatively unchanged and in
2010 accounted for 75% of allograft renal biopsies performed in that year (Table & Figure 5.2.3).
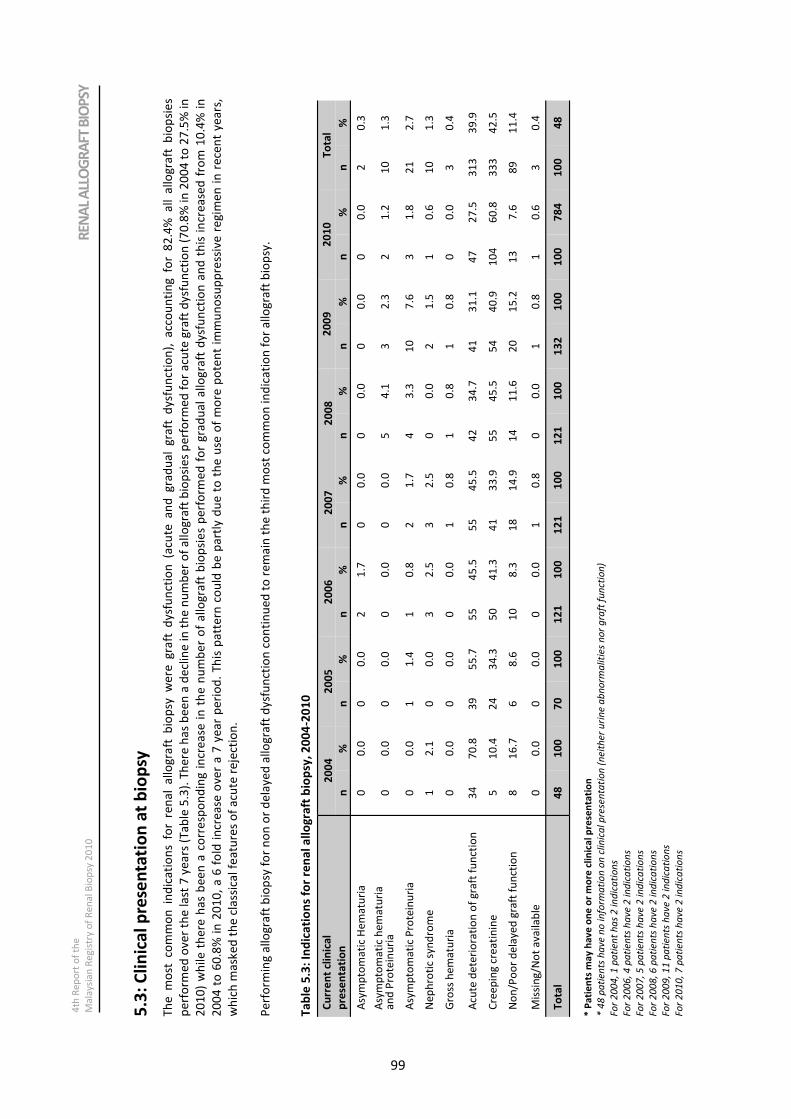
4th Report of the
Malaysian Registry of Renal Biopsy 2010 RENAL ALLOGRAFT BIOPSY
99
REN
AL
ALL
OG
RA
FT B
IOP
SY
4th
Re
po
rt o
f th
e
Ma
laysi
an
Re
gis
try o
f R
en
al B
iop
sy 2
01
0
Cu
rre
nt
clin
ica
l
pre
sen
tati
on
20
04
2
00
5
20
06
2
00
7
20
08
2
00
9
20
10
T
ota
l
n
%
n
%
n
%
n
%
n
%
n
%
n
%
n
%
Asy
mp
tom
ati
c H
em
atu
ria
0
0
.0
0
0.0
2
1
.7
0
0.0
0
0
.0
0
0.0
0
0
.0
2
0.3
Asy
mp
tom
ati
c h
em
atu
ria
a
nd
Pro
tein
uri
a
0
0.0
0
0
.0
0
0.0
0
0
.0
5
4.1
3
2
.3
2
1.2
1
0
1.3
Asy
mp
tom
ati
c P
rote
inu
ria
0
0
.0
1
1.4
1
0
.8
2
1.7
4
3
.3
10
7
.6
3
1.8
2
1
2.7
Ne
ph
roti
c sy
nd
rom
e
1
2.1
0
0
.0
3
2.5
3
2
.5
0
0.0
2
1
.5
1
0.6
1
0
1.3
Acu
te d
ete
rio
rati
on
of
gra
ft f
un
ctio
n
34
7
0.8
3
9
55
.7
55
4
5.5
5
5
45
.5
42
3
4.7
4
1
31
.1
47
2
7.5
3
13
3
9.9
Cre
ep
ing
cre
ati
nin
e
5
10
.4
24
3
4.3
5
0
41
.3
41
3
3.9
5
5
45
.5
54
4
0.9
1
04
6
0.8
3
33
4
2.5
No
n/P
oo
r d
ela
ye
d g
raft
fu
nct
ion
8
1
6.7
6
8
.6
10
8
.3
18
1
4.9
1
4
11
.6
20
1
5.2
1
3
7.6
8
9
11
.4
Mis
sin
g/N
ot
av
ail
ab
le
0
0.0
0
0
.0
0
0.0
1
0
.8
0
0.0
1
0
.8
1
0.6
3
0
.4
To
tal
48
1
00
7
0
10
0
12
1
10
0
12
1
10
0
12
1
10
0
13
2
10
0
10
0
78
4
10
0
48
Gro
ss h
em
atu
ria
0
0
.0
0
0.0
0
0
.0
1
0.8
1
0
.8
1
0.8
0
0
.0
3
0.4
5.3
: C
lin
ica
l p
rese
nta
tio
n a
t b
iop
sy
Th
e m
ost
co
mm
on
in
dic
ati
on
s fo
r re
na
l a
llo
gra
ft b
iop
sy w
ere
gra
ft d
ysf
un
ctio
n (
acu
te a
nd
gra
du
al
gra
ft d
ysf
un
ctio
n),
acc
ou
nti
ng
fo
r 8
2.4
% a
ll a
llo
gra
ft b
iop
sie
s
pe
rfo
rme
d o
ve
r th
e l
ast
7 y
ea
rs (
Ta
ble
5.3
). T
he
re h
as
be
en
a d
ecl
ine
in
th
e n
um
be
r o
f a
llo
gra
ft b
iop
sie
s p
erf
orm
ed
fo
r a
cute
gra
ft d
ysf
un
ctio
n (
70
.8%
in
20
04
to
27
.5%
in
20
10
) w
hil
e t
he
re h
as
be
en
a c
orr
esp
on
din
g i
ncr
ea
se i
n t
he
nu
mb
er
of
all
og
raft
bio
psi
es
pe
rfo
rme
d f
or
gra
du
al
all
og
raft
dy
sfu
nct
ion
an
d t
his
in
cre
ase
d f
rom
10
.4%
in
20
04
to
60
.8%
in
20
10
, a
6 f
old
in
cre
ase
ove
r a
7 y
ea
r p
eri
od
. T
his
pa
tte
rn c
ou
ld b
e p
art
ly d
ue
to
th
e u
se o
f m
ore
po
ten
t im
mu
no
sup
pre
ssiv
e r
eg
ime
n i
n r
ece
nt
ye
ars
,
wh
ich
ma
ske
d t
he
cla
ssic
al
fea
ture
s o
f a
cute
re
ject
ion
.
Pe
rfo
rmin
g a
llo
gra
ft b
iop
sy f
or
no
n o
r d
ela
ye
d a
llo
gra
ft d
ysf
un
ctio
n c
on
tin
ue
d t
o r
em
ain
th
e t
hir
d m
ost
co
mm
on
in
dic
ati
on
fo
r a
llo
gra
ft b
iop
sy.
Ta
ble
5.3
: In
dic
ati
on
s fo
r re
na
l a
llo
gra
ft b
iop
sy,
20
04
-20
10
* P
ati
en
ts m
ay
ha
ve
on
e o
r m
ore
cli
nic
al
pre
sen
tati
on
* 4
8 p
ati
en
ts h
ave
no
in
form
ati
on
on
clin
ica
l p
rese
nta
tio
n (
ne
ith
er
uri
ne
ab
no
rma
liti
es
no
r g
raft
fu
nct
ion
)
Fo
r 2
00
4,
1 p
ati
en
t h
as
2 in
dic
ati
on
s
Fo
r 2
00
6,
4 p
ati
en
ts h
ave
2 in
dic
ati
on
s
Fo
r 2
00
7,
5 p
ati
en
ts h
ave
2 in
dic
ati
on
s
Fo
r 2
00
8,
6 p
ati
en
ts h
ave
2 in
dic
ati
on
s
Fo
r 2
00
9,
11
pa
tie
nts
ha
ve
2 in
dic
ati
on
s
Fo
r 2
01
0,
7 p
ati
en
ts h
ave
2 in
dic
ati
on
s
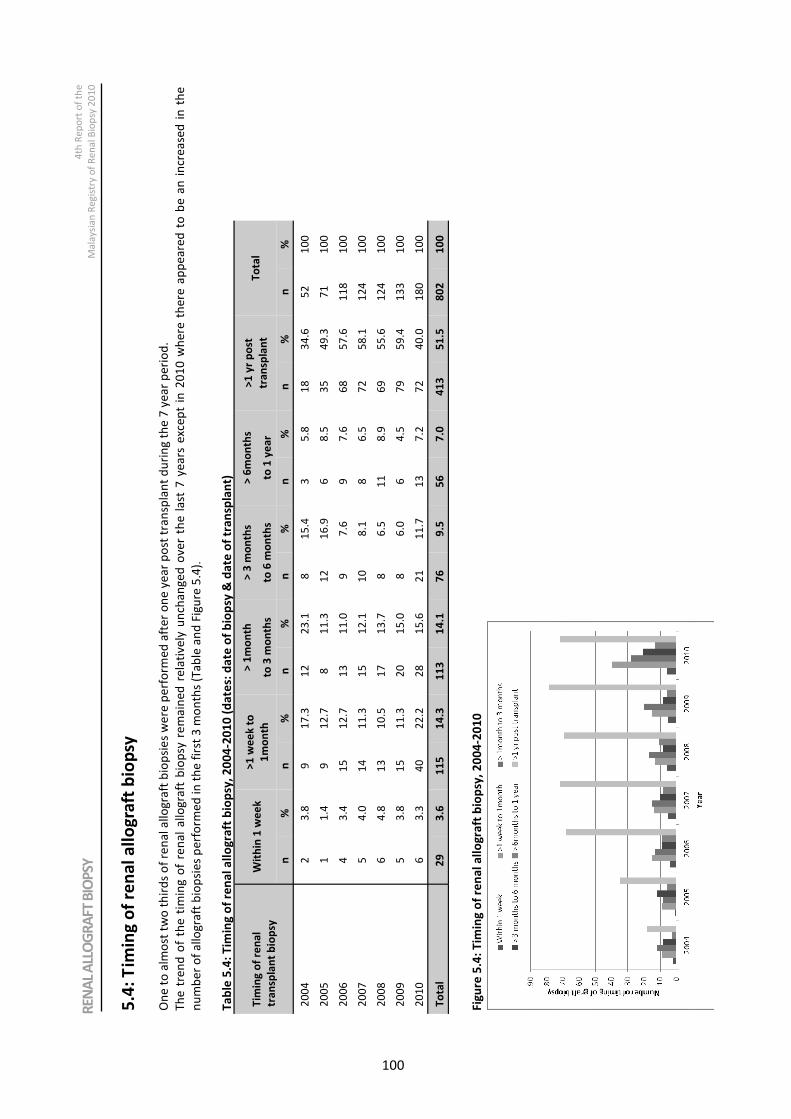
RENAL ALLOGRAFT BIOPSY 4th Report of the
Malaysian Registry of Renal Biopsy 2010
100
Tim
ing
of
ren
al
tra
nsp
lan
t b
iop
sy
Wit
hin
1 w
ee
k
>1
we
ek
to
1m
on
th
> 1
mo
nth
to 3
mo
nth
s
> 3
mo
nth
s
to 6
mo
nth
s
> 6
mo
nth
s
to 1
ye
ar
>1
yr
po
st
tra
nsp
lan
t
To
tal
n
%
n
%
n
%
n
%
n
%
n
%
n
%
20
04
2
3
.8
9
17
.3
12
2
3.1
8
1
5.4
3
5
.8
18
3
4.6
5
2
10
0
20
05
1
1
.4
9
12
.7
8
11
.3
12
1
6.9
6
8
.5
35
4
9.3
7
1
10
0
20
06
4
3
.4
15
1
2.7
1
3
11
.0
9
7.6
9
7
.6
68
5
7.6
1
18
1
00
20
09
5
3
.8
15
1
1.3
2
0
15
.0
8
6.0
6
4
.5
79
5
9.4
1
33
1
00
20
10
6
3
.3
40
2
2.2
2
8
15
.6
21
1
1.7
1
3
7.2
7
2
40
.0
18
0
10
0
To
tal
29
3
.6
11
5
14
.3
11
3
14
.1
76
9
.5
56
7
.0
41
3
51
.5
80
2
10
0
20
07
5
4
.0
14
1
1.3
1
5
12
.1
10
8
.1
8
6.5
7
2
58
.1
12
4
10
0
20
08
6
4
.8
13
1
0.5
1
7
13
.7
8
6.5
1
1
8.9
6
9
55
.6
12
4
10
0
REN
AL
ALL
OG
RA
FT B
IOP
SY
4th
Re
po
rt o
f th
e
Ma
laysi
an
Re
gis
try o
f R
en
al B
iop
sy 2
01
0
5.4
: T
imin
g o
f re
na
l a
llo
gra
ft b
iop
sy
On
e t
o a
lmo
st t
wo
th
ird
s o
f re
na
l a
llo
gra
ft b
iop
sie
s w
ere
pe
rfo
rme
d a
fte
r o
ne
ye
ar
po
st t
ran
spla
nt
du
rin
g t
he
7 y
ea
r p
eri
od
.
Th
e t
ren
d o
f th
e t
imin
g o
f re
na
l a
llo
gra
ft b
iop
sy r
em
ain
ed
re
lati
ve
ly u
nch
an
ge
d o
ve
r th
e l
ast
7 y
ea
rs e
xce
pt
in 2
01
0 w
he
re t
he
re a
pp
ea
red
to
be
an
in
cre
ase
d i
n t
he
nu
mb
er
of
all
og
raft
bio
psi
es
pe
rfo
rme
d i
n t
he
fir
st 3
mo
nth
s (T
ab
le a
nd
Fig
ure
5.4
).
Ta
ble
5.4
: T
imin
g o
f re
na
l a
llo
gra
ft b
iop
sy,
20
04
-20
10
(d
ate
s: d
ate
of
bio
psy
& d
ate
of
tra
nsp
lan
t)
Fig
ure
5.4
: T
imin
g o
f re
na
l a
llo
gra
ft b
iop
sy,
20
04
-20
10
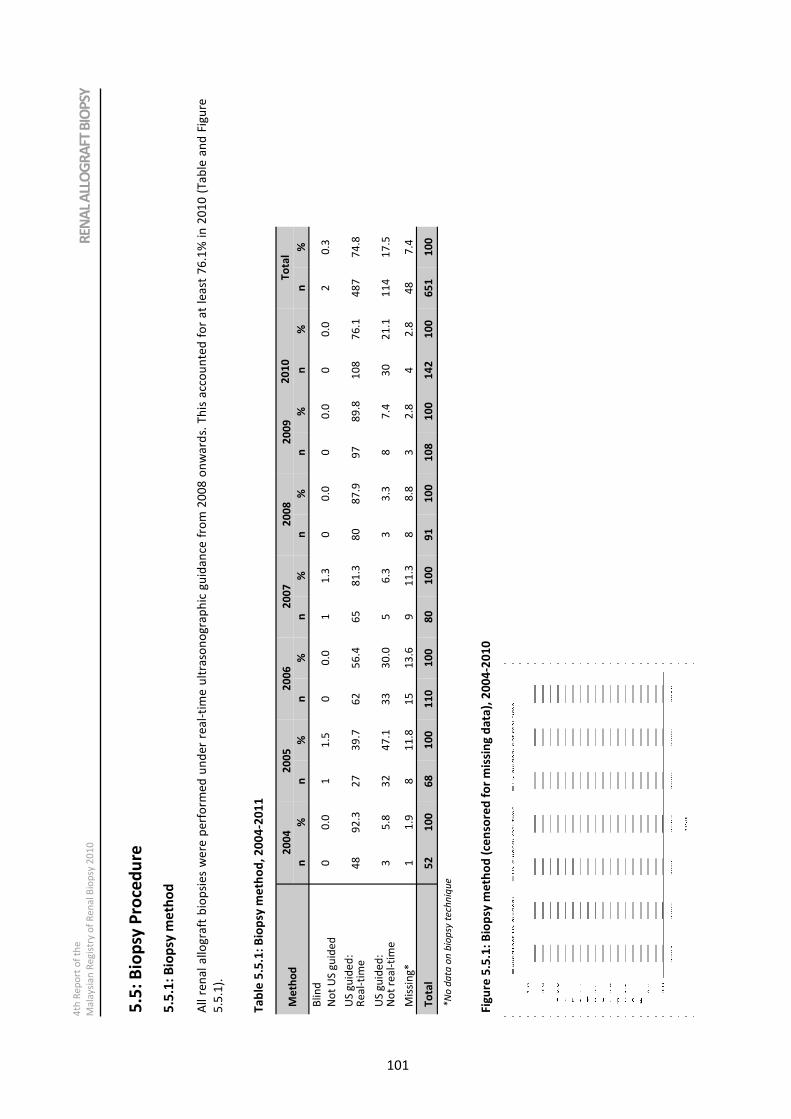
4th Report of the
Malaysian Registry of Renal Biopsy 2010 RENAL ALLOGRAFT BIOPSY
101
REN
AL
ALL
OG
RA
FT B
IOP
SY
4th
Re
po
rt o
f th
e
Ma
laysi
an
Re
gis
try o
f R
en
al B
iop
sy 2
01
0
5.5
: B
iop
sy P
roce
du
re
5.5
.1:
Bio
psy
me
tho
d
All
re
na
l a
llo
gra
ft b
iop
sie
s w
ere
pe
rfo
rme
d u
nd
er
rea
l-ti
me
ult
raso
no
gra
ph
ic g
uid
an
ce f
rom
20
08
on
wa
rds.
Th
is a
cco
un
ted
fo
r a
t le
ast
76
.1%
in
20
10
(T
ab
le a
nd
Fig
ure
5.5
.1).
Ta
ble
5.5
.1:
Bio
psy
me
tho
d,
20
04
-20
11
Fig
ure
5.5
.1:
Bio
psy
me
tho
d (
cen
sore
d f
or
mis
sin
g d
ata
), 2
00
4-2
01
0
Me
tho
d
20
04
2
00
5
20
06
2
00
7
20
08
2
00
9
20
10
T
ota
l
n
%
n
%
n
%
n
%
n
%
n
%
n
%
n
%
Bli
nd
No
t U
S g
uid
ed
0
0
.0
1
1.5
0
0
.0
1
1.3
0
0
.0
0
0.0
0
0
.0
2
0.3
US
gu
ide
d:
Re
al-
tim
e
48
9
2.3
2
7
39
.7
62
5
6.4
6
5
81
.3
80
8
7.9
9
7
89
.8
10
8
76
.1
48
7
74
.8
US
gu
ide
d:
No
t re
al-
tim
e
3
5.8
3
2
47
.1
33
3
0.0
5
6
.3
3
3.3
8
7
.4
30
2
1.1
1
14
1
7.5
Mis
sin
g*
1
1
.9
8
11
.8
15
1
3.6
9
1
1.3
8
8
.8
3
2.8
4
2
.8
48
7
.4
To
tal
52
1
00
6
8
10
0
11
0
10
0
80
1
00
9
1
10
0
10
8
10
0
14
2
10
0
65
1
10
0
*N
o d
ata
on
bio
psy
te
chn
iqu
e
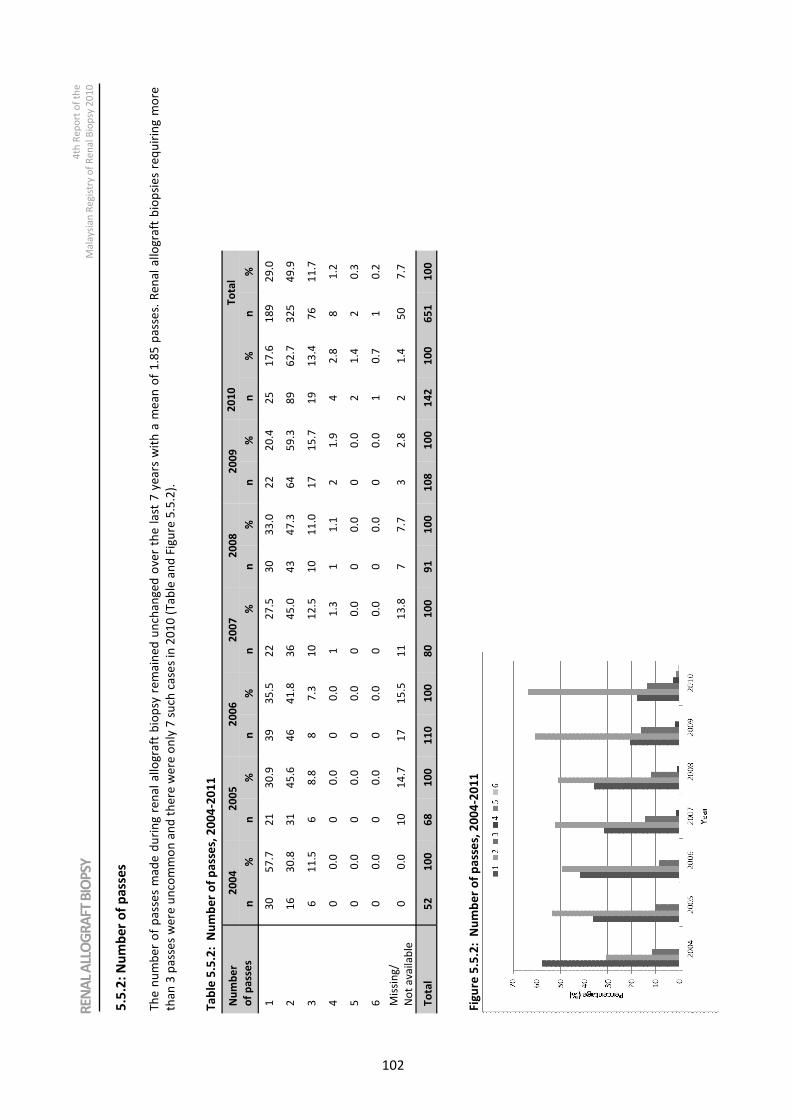
RENAL ALLOGRAFT BIOPSY 4th Report of the
Malaysian Registry of Renal Biopsy 2010
102
Nu
mb
er
of
pa
sse
s
20
04
2
00
5
20
06
2
00
7
20
08
2
00
9
20
10
T
ota
l
n
%
n
%
n
%
n
%
n
%
n
%
n
%
n
%
1
30
5
7.7
2
1
30
.9
39
3
5.5
2
2
27
.5
30
3
3.0
2
2
20
.4
25
1
7.6
1
89
2
9.0
2
16
3
0.8
3
1
45
.6
46
4
1.8
3
6
45
.0
43
4
7.3
6
4
59
.3
89
6
2.7
3
25
4
9.9
3
6
11
.5
6
8.8
8
7
.3
10
1
2.5
1
0
11
.0
17
1
5.7
1
9
13
.4
76
1
1.7
Mis
sin
g/
No
t a
va
ila
ble
0
0
.0
10
1
4.7
1
7
15
.5
11
1
3.8
7
7
.7
3
2.8
2
1
.4
50
7
.7
To
tal
52
1
00
6
8
10
0
11
0
10
0
80
1
00
9
1
10
0
10
8
10
0
14
2
10
0
65
1
10
0
5
0
0.0
0
0
.0
0
0.0
0
0
.0
0
0.0
0
0
.0
2
1.4
2
0
.3
6
0
0.0
0
0
.0
0
0.0
0
0
.0
0
0.0
0
0
.0
1
0.7
1
0
.2
4
0
0.0
0
0
.0
0
0.0
1
1
.3
1
1.1
2
1
.9
4
2.8
8
1
.2
REN
AL
ALL
OG
RA
FT B
IOP
SY
4th
Re
po
rt o
f th
e
Ma
laysi
an
Re
gis
try o
f R
en
al B
iop
sy 2
01
0
5.5
.2:
Nu
mb
er
of
pa
sse
s
Th
e n
um
be
r o
f p
ass
es
ma
de
du
rin
g r
en
al
all
og
raft
bio
psy
re
ma
ine
d u
nch
an
ge
d o
ver
the
la
st 7
ye
ars
wit
h a
me
an
of
1.8
5 p
ass
es.
Re
na
l a
llo
gra
ft b
iop
sie
s re
qu
irin
g m
ore
tha
n 3
pa
sse
s w
ere
un
com
mo
n a
nd
th
ere
we
re o
nly
7 s
uch
ca
ses
in 2
01
0 (
Ta
ble
an
d F
igu
re 5
.5.2
).
Ta
ble
5.5
.2:
Nu
mb
er
of
pa
sse
s, 2
00
4-2
01
1
Fig
ure
5.5
.2:
Nu
mb
er
of
pa
sse
s, 2
00
4-2
01
1
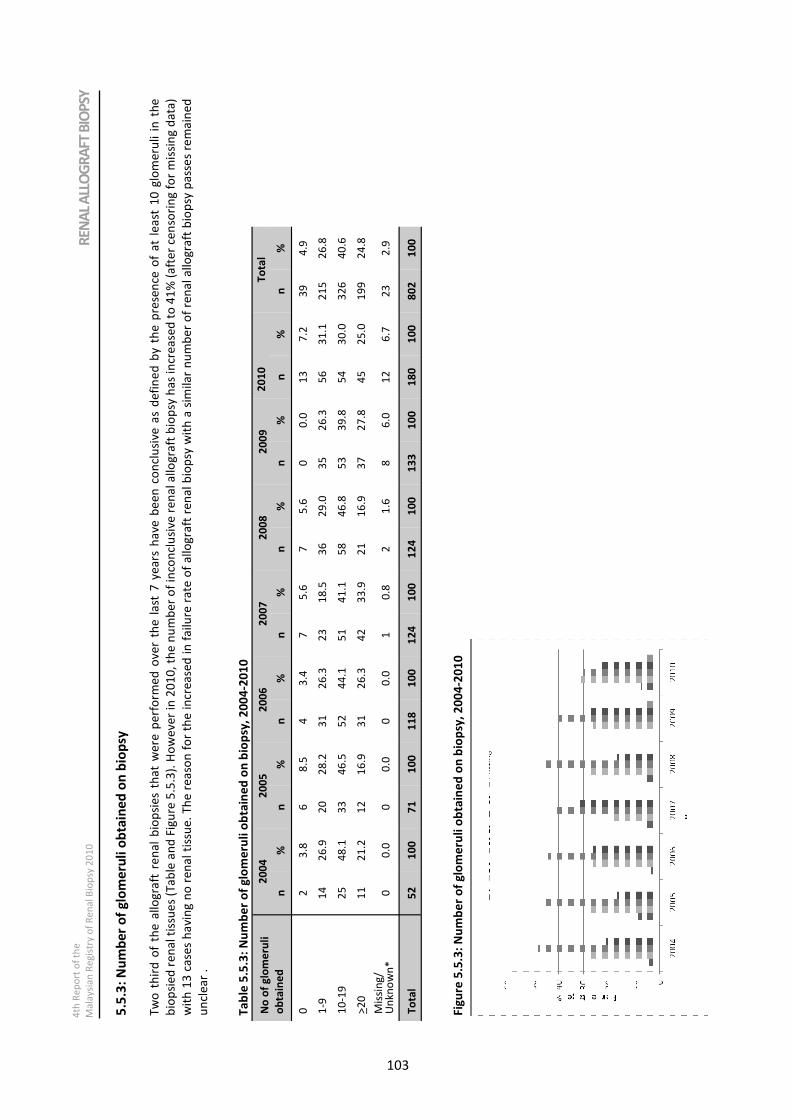
4th Report of the
Malaysian Registry of Renal Biopsy 2010 RENAL ALLOGRAFT BIOPSY
103
No
of
glo
me
ruli
ob
tain
ed
20
04
2
00
5
20
06
2
00
7
20
08
2
00
9
20
10
T
ota
l
n
%
n
%
n
%
n
%
n
%
n
%
n
%
n
%
0
2
3.8
6
8
.5
4
3.4
7
5
.6
7
5.6
0
0
.0
13
7
.2
39
4
.9
1-9
1
4
26
.9
20
2
8.2
3
1
26
.3
23
1
8.5
3
6
29
.0
35
2
6.3
5
6
31
.1
21
5
26
.8
10
-19
2
5
48
.1
33
4
6.5
5
2
44
.1
51
4
1.1
5
8
46
.8
53
3
9.8
5
4
30
.0
32
6
40
.6
>2
0
11
2
1.2
1
2
16
.9
31
2
6.3
4
2
33
.9
21
1
6.9
3
7
27
.8
45
2
5.0
1
99
2
4.8
Mis
sin
g/
Un
kn
ow
n*
0
0
.0
0
0.0
0
0
.0
1
0.8
2
1
.6
8
6.0
1
2
6.7
2
3
2.9
To
tal
52
1
00
7
1
10
0
11
8
10
0
12
4
10
0
12
4
10
0
13
3
10
0
18
0
10
0
80
2
10
0 REN
AL
ALL
OG
RA
FT B
IOP
SY
4th
Re
po
rt o
f th
e
Ma
laysi
an
Re
gis
try o
f R
en
al B
iop
sy 2
01
0
5.5
.3:
Nu
mb
er
of
glo
me
ruli
ob
tain
ed
on
bio
psy
Tw
o t
hir
d o
f th
e a
llo
gra
ft r
en
al
bio
psi
es
tha
t w
ere
pe
rfo
rme
d o
ve
r th
e l
ast
7 y
ea
rs h
ave
be
en
co
ncl
usi
ve a
s d
efi
ne
d b
y t
he
pre
sen
ce o
f a
t le
ast
10
glo
me
ruli
in
th
e
bio
psi
ed
re
na
l ti
ssu
es
(Ta
ble
an
d F
igu
re 5
.5.3
). H
ow
ev
er
in 2
01
0,
the
nu
mb
er
of
inco
ncl
usi
ve r
en
al
all
og
raft
bio
psy
ha
s in
cre
ase
d t
o 4
1%
(a
fte
r ce
nso
rin
g f
or
mis
sin
g d
ata
)
wit
h 1
3 c
ase
s h
avi
ng
no
re
na
l ti
ssu
e.
Th
e r
ea
son
fo
r th
e i
ncr
ea
sed
in
fa
ilu
re r
ate
of
all
og
raft
re
na
l b
iop
sy w
ith
a s
imil
ar
nu
mb
er
of
ren
al
all
og
raft
bio
psy
pa
sse
s re
ma
ine
d
un
cle
ar
.
Ta
ble
5.5
.3:
Nu
mb
er
of
glo
me
ruli
ob
tain
ed
on
bio
psy
, 2
00
4-2
01
0
Fig
ure
5.5
.3:
Nu
mb
er
of
glo
me
ruli
ob
tain
ed
on
bio
psy
, 2
00
4-2
01
0
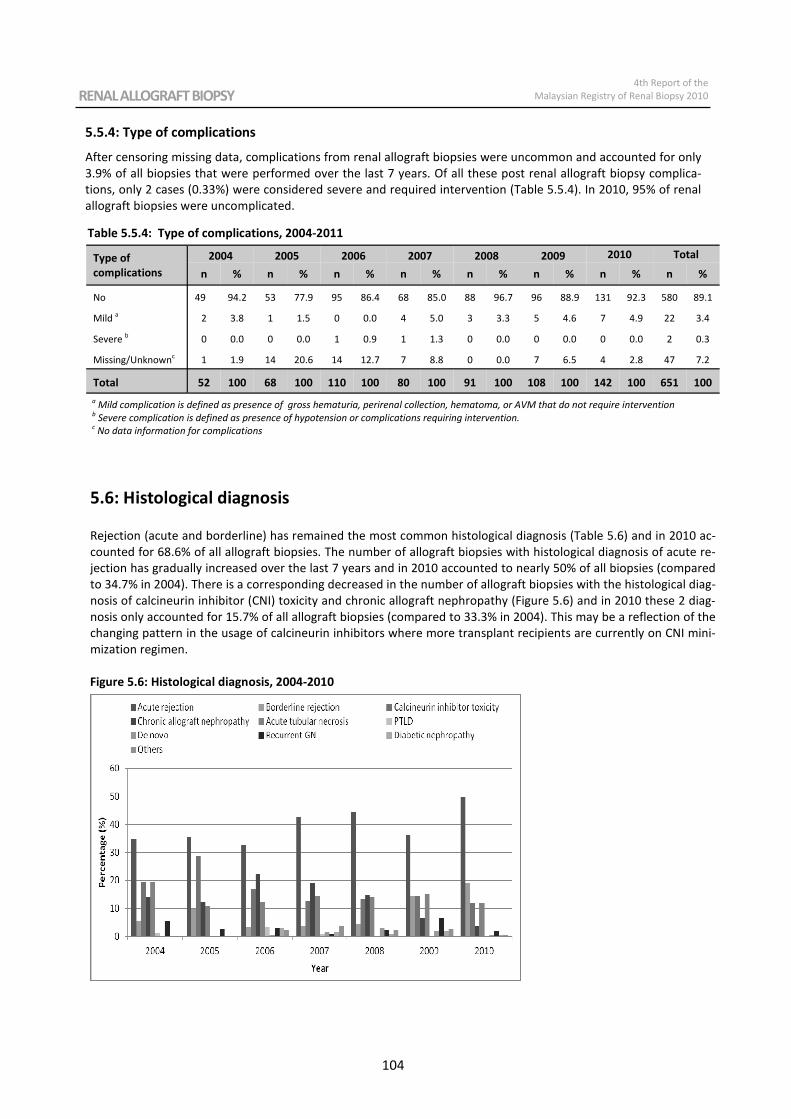
RENAL ALLOGRAFT BIOPSY 4th Report of the
Malaysian Registry of Renal Biopsy 2010
104
5.5.4: Type of complications
After censoring missing data, complications from renal allograft biopsies were uncommon and accounted for only
3.9% of all biopsies that were performed over the last 7 years. Of all these post renal allograft biopsy complica-
tions, only 2 cases (0.33%) were considered severe and required intervention (Table 5.5.4). In 2010, 95% of renal
allograft biopsies were uncomplicated.
Table 5.5.4: Type of complications, 2004-2011
Type of
complications
2004 2005 2006 2007 2008 2009 2010
n % n % n % n % n % n % n % n %
No 49 94.2 53 77.9 95 86.4 68 85.0 88 96.7 96 88.9 131 92.3 580 89.1
Mild a 2 3.8 1 1.5 0 0.0 4 5.0 3 3.3 5 4.6 7 4.9 22 3.4
Severe b 0 0.0 0 0.0 1 0.9 1 1.3 0 0.0 0 0.0 0 0.0 2 0.3
Missing/Unknownc 1 1.9 14 20.6 14 12.7 7 8.8 0 0.0 7 6.5 4 2.8 47 7.2
Total 52 100 68 100 110 100 80 100 91 100 108 100 142 100 651 100
Total
a Mild complication is defined as presence of gross hematuria, perirenal collection, hematoma, or AVM that do not require intervention
b Severe complication is defined as presence of hypotension or complications requiring intervention.
c No data information for complications
5.6: Histological diagnosis
Rejection (acute and borderline) has remained the most common histological diagnosis (Table 5.6) and in 2010 ac-
counted for 68.6% of all allograft biopsies. The number of allograft biopsies with histological diagnosis of acute re-
jection has gradually increased over the last 7 years and in 2010 accounted to nearly 50% of all biopsies (compared
to 34.7% in 2004). There is a corresponding decreased in the number of allograft biopsies with the histological diag-
nosis of calcineurin inhibitor (CNI) toxicity and chronic allograft nephropathy (Figure 5.6) and in 2010 these 2 diag-
nosis only accounted for 15.7% of all allograft biopsies (compared to 33.3% in 2004). This may be a reflection of the
changing pattern in the usage of calcineurin inhibitors where more transplant recipients are currently on CNI mini-
mization regimen.
Figure 5.6: Histological diagnosis, 2004-2010

4th Report of the
Malaysian Registry of Renal Biopsy 2010 RENAL ALLOGRAFT BIOPSY
105
Ta
ble
5.6
His
tolo
gic
al
dia
gn
osi
s, 2
00
4-2
01
0
His
tolo
gic
al
Dia
gn
osi
s
20
04
2
00
5
20
06
2
00
7
20
08
2
00
9
20
10
T
ota
l
n
%
n
%
n
%
n
%
n
%
n
%
n
%
n
%
Acu
te r
eje
ctio
n
25
3
4.7
2
6
35
.6
56
3
2.7
6
0
42
.6
57
4
4.5
5
5
36
.2
79
4
9.7
3
58
4
0.0
Bo
rde
rlin
e r
eje
ctio
n
4
5.6
7
9
.6
6
3.5
5
3
.5
6
4.7
2
2
14
.5
30
1
8.9
8
0
8.9
Ca
lcin
eu
rin
in
hib
ito
r to
xici
ty
14
1
9.4
2
1
28
.8
29
1
7.0
1
8
12
.8
17
1
3.3
2
2
14
.5
19
1
1.9
1
40
1
5.6
Oth
ers
0
0
.0
0
0.0
4
2
.3
5
3.5
3
2
.3
4
2.6
1
0
.6
17
1
.9
To
tal
72
1
00
7
3
10
0
17
1
10
0
14
1
10
0
12
8
10
0
15
2
10
0
15
9
10
0
89
6
10
0
Ch
ron
ic a
llo
gra
ft n
ep
hro
pa
thy
1
0
13
.9
9
12
.3
38
2
2.2
2
7
19
.1
19
1
4.8
1
0
6.6
6
3
.8
11
9
13
.3
Acu
te t
ub
ula
r n
ecr
osi
s 1
4
19
.4
8
11
.0
21
1
2.3
2
0
14
.2
18
1
4.1
2
3
15
.1
19
1
1.9
1
23
1
3.7
PT
LD*
*
1
1.4
0
0
.0
6
3.5
1
0
.7
0
0.0
0
0
.0
0
0.0
8
0
.9
De
no
vo
0
0
.0
0
0.0
1
0
.6
2
1.4
4
3
.1
3
2.0
1
0
.6
11
1
.2
Re
curr
en
t G
N
4
5.6
2
2
.7
5
2.9
1
0
.7
3
2.3
1
0
6.6
3
1
.9
28
3
.1
Dia
be
tic
ne
ph
rop
ath
y
0
0.0
0
0
.0
5
2.9
2
1
.4
1
0.8
3
2
.0
1
0.6
1
2
1.3
* P
ati
en
ts m
ay h
ave
mo
re t
ha
n 1
dia
gn
osi
s cl
ass
ific
ati
on
**
Po
st T
ran
spla
nt
Lym
ph
op
rolife
rati
ve
dis
ea
se
REN
AL
ALL
OG
RA
FT B
IOP
SY
4th
Re
po
rt o
f th
e
Ma
laysi
an
Re
gis
try o
f R
en
al B
iop
sy 2
01
0
i
APPENDIX I
Analysis Criteria And Statistical Methodology

ii
Appendix I
ANALYSIS CRITERIA AND STATISTICAL METHODOLOGY
1. ANALYSIS SETS
This refers to the sets of cases whose data are to be included in the analysis for this report.
All biopsies from 2005-2010
The analysis set in Chapter 1 includes all patients who underwent native and graft kidney biopsies
from 1st
January 2005 to 31st
December 2010.
The analysis set consists of biopsy number where it is defined as number of episodes of distribution of
renal biopsy in patients. Biopsy number was taken for the highest episode only for each patient. This
analysis set was used for analysis in Chapter 1.
All native renal biopsy, 2005-2010
The analysis set in Chapter 1 includes patients who underwent native renal biopsy from 1st
January
2005 to 31st
December 2010.
Primary glomerulonephritis patients
Patients described in Chapter 2 are those whose age are > 15 years old at the time of biopsy with
primary glomerulonephritis on renal biopsies performed in 2005-2010.
Lupus nephritis patients
Patients described in Chapter 3 are those whose age are are > 15 years old at the time of biopsy, were
ticked YES on SLE and were diagnosed lupus nephritis on renal biopsies from 1st
January 2005 to 31st
December 2010.
Paediatric native renal biopsy, 1999-2010
Patients described in Chapter 4 are those whose age are < 15 years old at the time of biopsy were
performed from 1st
January 1999 to 31st
December 2010.
Renal Allograft biopsy
The analysis set is confined to all graft biopsies from 1st
January 2004 to 31st
December 2010.
2. STATISTICAL METHOD
Patient’s characteristics
These sections included the patient’s age at biopsy, gender and ethnic group in every chapter of this
report. In statistics, imputation is the substitution of some value for a missing data point. Therefore,
missing of patient’s age has been considered to replace with technique imputation for chapter 1, 2
and 3. Then we used the imputation values for the analysis set. For ethnic group other than Malay,
Chinese or Indian will be classified as Others. Patient’s centre state was used to describe the reported
renal biopsy by state and is used for the analysis in chapter 1.
Clinical presentation
These sections described clinical presentation at the time of biopsy. Apart from clinical presentation,
chapter 2 and chapter 3 also report on prevalence of hypertension and degree of renal function.
iii
Biopsy data
The biopsy data and outcome on complications are reported in chapter 4 and chapter 5.
Laboratory data
Few variables in this dataset were missing. Those variables are GFR, urine protein, 24hrs urine protein
and urine RBC. Therefore, imputation was done to these variables.
Histological diagnosis
In this section, analysis was confined to available data only and no imputation was done.
Centre survey data
Centre survey data were used to determine the ascertainment rate for each SDP’s and it is reported in
chapter 1.
Hazard ratio
The hazard ratio in survival analysis is the effect of an explanatory variable on the hazard or risk of an
event. The hazard ratio compares groups differing in risk factors. If the hazard ratio is 2.0, then the
rate failure in one group is twice the rate in other group. This was used for analysis in Chapter 4.
Risk ratio
The risk ratio is the risk of an event (diagnosis) relative to exposure. The risk ratio takes on values
between zero and infinity. One is the neutral value and means that there is no difference between the
groups compared. This was used for analysis in Chapter 4.
Survival analysis
The unadjusted survival probabilities were calculated using the Kaplan-Meier method. Survival
analysis involves the modelling of time to event data, in this context, death is considered an event.
Survival rate is a part of survival analysis, indicating the percentage of people in this group who are
alive for a given period of time after diagnosis with the minimal change disease and focal segmental
glomerulosclerosis. This was used for analysis in Chapter 4
Renal allograft biopsy rates
Renal transplant biopsy rate is calculated by the ratio of the count of number of patients in a given
year (according to its age group) to the mid-year population of Malaysia in that year, and expressed as
in per million populations. This was used for analysis in Chapter 5.
American Rheumatological Association (ARA) Criteria
An ARA criterion is defined as YES on SLE clinical presentation and SLE lab data. Eleven criteria have
been considered for ARA. Nine criteria are from SLE clinical presentation with presentation of malar
rash, discoid rash, photosensitivity, oral ulcers, arthritis, serositis, renal, cerebral, and hematological.
However, the other two are from SLE lab data where patient should have positive on ANF, and at least
1 is Positive on dsDNA, ssDNA, Anti-cardiolipin antibody, Anti-phospholipid antibody, Histone, Nucleo,
Ro, La or Sm. This was used for analysis in Chapter 3.
Extra renal involvement criteria
Patients who have at least one of the followings: malar rash, discoid rash, photosensitivity or oral
ulcers will be grouped as Muco-cutaneous for other organ involvement criteria. This was used for
analysis in Chapter 3.
Density of histogram
Density scales the height of the bars so that the sum of their areas equals 1. The density scale is
calculated by the probability of the patients in the interval that concerned and divides with that
interval. This figure was considered in Chapter 2.
Appendix I (con’t)

i
APPENDIX II
Data Management
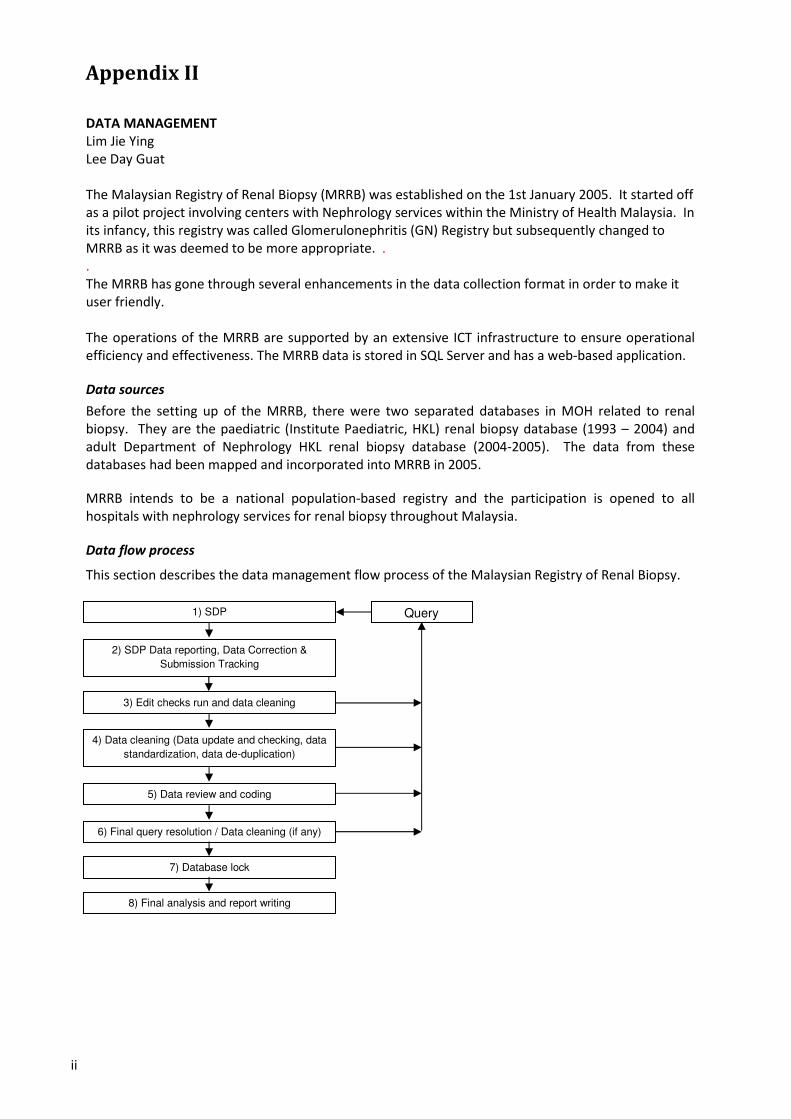
ii
DATA MANAGEMENT
Lim Jie Ying
Lee Day Guat
The Malaysian Registry of Renal Biopsy (MRRB) was established on the 1st January 2005. It started off
as a pilot project involving centers with Nephrology services within the Ministry of Health Malaysia. In
its infancy, this registry was called Glomerulonephritis (GN) Registry but subsequently changed to
MRRB as it was deemed to be more appropriate. .
.
The MRRB has gone through several enhancements in the data collection format in order to make it
user friendly.
The operations of the MRRB are supported by an extensive ICT infrastructure to ensure operational
efficiency and effectiveness. The MRRB data is stored in SQL Server and has a web-based application.
Data sources
Before the setting up of the MRRB, there were two separated databases in MOH related to renal
biopsy. They are the paediatric (Institute Paediatric, HKL) renal biopsy database (1993 – 2004) and
adult Department of Nephrology HKL renal biopsy database (2004-2005). The data from these
databases had been mapped and incorporated into MRRB in 2005.
Appendix II
MRRB intends to be a national population-based registry and the participation is opened to all
hospitals with nephrology services for renal biopsy throughout Malaysia.
Data flow process
This section describes the data management flow process of the Malaysian Registry of Renal Biopsy.
1) SDP
2) SDP Data reporting, Data Correction &
Submission Tracking
3) Edit checks run and data cleaning
4) Data cleaning (Data update and checking, data
standardization, data de-duplication)
5) Data review and coding
6) Final query resolution / Data cleaning (if any)
7) Database lock
8) Final analysis and report writing
Query
iii
Appendix II (con’t)
SDP
Nephrologist or renal physician who provides renal biopsy services in Malaysia.
SDP Data reporting, Data Correction and Submission tracking
Primary source data is reported by SDP via web applications e-Case Report Forms:
• MRRB Patient Notification form (Native Kidney Biopsy).
• MRRB Patient Notification form (Graft Kidney Biopsy).
• MRRB Biopsy Procedure form.
• MRRB Outcome Notification form.
The secondary data source is to determine both renal and mortality outcomes. Verification of both
renal and mortality outcomes can be done through the Malaysian Dialysis and Transplant Registry and
National Vital Registration System respectively.
Edit checks run and Data cleaning
Edit checks identify missing compulsory data, out of range values, inconsistent data, invalid values and
error with de-duplication. Data cleaning is then performed based on the results of edit checks.
Data review and coding
Expert panels and registry manager performed data coding of free text description to its
predetermined coding table or dictionary. The expert panel comprises of members with expertise and
knowledge in the relevant area. They also perform Quality Control function on the assessment of
coding. They ensure that complex medical data are reviewed and assessed to detect clinical nuances.
Final query resolution / data cleaning / database lock
A final edit check was performed to ensure that data is clean. All queries were resolved before
database is locked to ensure data quality and integrity. Final dataset is subsequently locked and
exported to statistician for analysis.
Data release and publication policy
The MRRB is part of the National Renal Registry (NRR), which is owned by the Malaysian Society of
Nephrology (MSN). One of the primary objectives of the Registry is to make data available to the renal
community. The registry’s published report is available on the website http://www.msn.org.my/nrr or
https://www.macr.org.my/emrrb. The report is copyrighted. However it may be freely reproduced
without the permission of the National Renal Registry, Malaysia. Acknowledgement would be
appreciated. Suggested citation is: Rosnawati Y, Wan Jazilah WI ( Eds), 4th
Report of the Malaysian
Registry of Renal Biopsy 2010 Kuala Lumpur 2010.
The Registry encourages original research and publication using MRRB data in part or full. Any
request for raw data or aggregated data must be made in writing (by e-mail, fax, or registered mail).
The researcher is required to submit a completed Data Release Application Form and signed Data
Release Agreement Form, accompanied with a study proposal / mock tables. Such request will require
approval from NRR Advisory Board.
iv
NRR position as follows:
• The NRR does not envisage independent individual publication based entirely on NRR published
results, without further analyses or additional data collection.
• NRR however agrees that investigator shall have the right to publish any information or material
arising in part out of NRR work. In other words, there must be additional original contribution by
the investigator in the work intended for publication.
• NRR encourages the use of its data for research purpose. Any proposed publication or
presentation (e.g. manuscript, abstract or poster) for submission to journal or scientific meeting
that is based in part or entirely on NRR data should be sent to the NRR prior to submission. NRR
will undertake to comment on such documents within 4 weeks. Acknowledgement of the source
of the data would also be appreciated.
• Any formal publication of a research based in part or entirely on NRR data in which the input of
NRR exceeded that of conventional data management and provision will be considered as a joint
publication by investigator and the appropriate NRR personnel.
The Malaysian Society of Nephrology has made a grant towards the cost of running the registry and
the report printing to allow distribution to all members of the association and the source data
producers. The report will also be distributed to relevant Health Authorities and international
registries.
Further copies of the report can be made available with donation of RM60.00 to defray the cost of
printing. The full report is also available in the registry web site www.msn.org.my.
Appendix II (con’t)
i
APPENDIX III
Abbareviations

ii
Appendix III
ABBAREVIATIONS
ADMAN Association of Dialysis Medical Assistants and Nurses
ANCA Antineutrophilic Cytoplasmic Antibody
ARA American Rheumatological Association
AVM Arterio-venous malformation
CRC Clinical Research Centre
CrCl Creatinine Clearance
CRM Clinical Registry Manager
eGFR Calculated Creatinine Clearance based on Schwartz Formula
ESRD End Stage Renal Disease
MCD Minimal Change Disease
FSGS Focal Segmental Glomerulosclerosis
IMN Idiopathic Membranous Nephropathy
GFR Glomerular Filtration Rate
GN Glomerulonephritis
Hb Hemoglobin
HPE Histopathology examination
HSP Henoch Schonlein Purpura
HUS/TTP Haemolytic uremic syndrome / Thrombotic Thrombocytopenic Purpura
IgAN IgA Nephropathy
ISN/RPS International Society Nephrology/ Renal Pathology Society
LN Lupus Nephritis
MCD Minimal Change Disease
MOH Ministry of Health, Malaysia
MOSS Malaysian Organ Sharing System
MRRB Malaysian Registry of Renal Biopsy
MSN Malaysian Society of Nephrology
NRR National Renal Registry
Ref* References
RRT Renal replacement therapy
SDP Source Data Producer
SLE Systemic Lupus Erythromatosus
WHO World Health Organization
i
APPENDIX IV
Formula
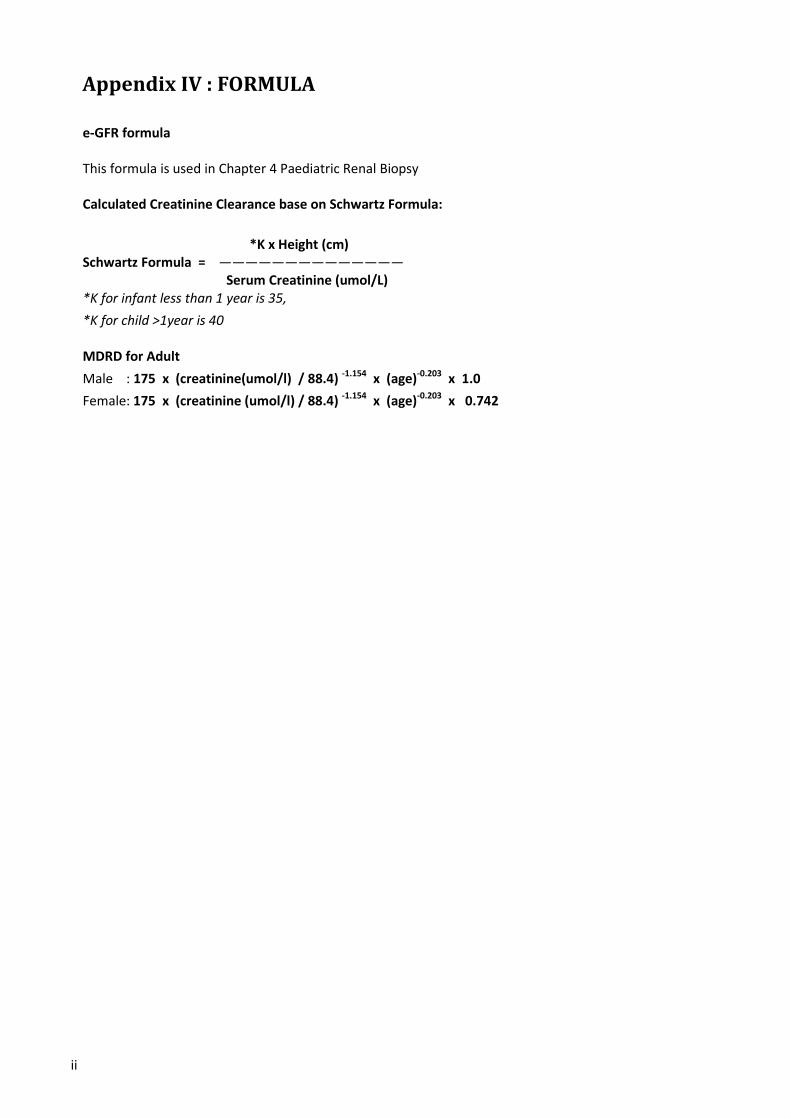
ii
Appendix IV : FORMULA
e-GFR formula
This formula is used in Chapter 4 Paediatric Renal Biopsy
Calculated Creatinine Clearance base on Schwartz Formula:
*K x Height (cm)
Schwartz Formula = ——————————————
Serum Creatinine (umol/L)
*K for infant less than 1 year is 35,
*K for child >1year is 40
MDRD for Adult
Male : 175 x (creatinine(umol/l) / 88.4) -1.154
x (age)-0.203
x 1.0
Female: 175 x (creatinine (umol/l) / 88.4) -1.154
x (age)-0.203
x 0.742