major differences in neurooxidative and neuronitrosative
TRANSCRIPT
Major Differences in Neurooxidative and Neuronitrosative StressPathways Between Major Depressive Disorder and Types I and IIBipolar Disorder
Michael Maes1,2,3,4 & Kamila Landucci Bonifacio1& Nayara Rampazzo Morelli1 & Heber Odebrecht Vargas1 &
Décio Sabbatini Barbosa1& André F. Carvalho5,6
& Sandra Odebrecht Vargas Nunes1
Received: 11 January 2018 /Accepted: 27 March 2018# Springer Science+Business Media, LLC, part of Springer Nature 2018
AbstractAccumulating evidence indicates that oxidative and nitrosative stress (O&NS) pathways play a key role in the pathophysiologyof bipolar disorder (BD) and major depressive disorder (MDD). However, only a handful of studies have directly comparedalterations in O&NS pathways among patients with MDD and BD types I (BPI) and BPII. Thus, the current study comparedsuperoxide dismutase (SOD1), lipid hydroperoxides (LOOH), catalase, nitric oxide metabolites (NOx), malondialdehyde(MDA), and advanced oxidation protein products (AOPP) between mood disorder patients in a clinically remitted state. To thisend 45, 23, and 37 participants with BPI, BPII, and MDD, respectively, as well as 54 healthy controls (HCs) were recruited. Z-unit weighted composite scores were computed as indices of reactive oxygen species (ROS) production and nitro-oxidative stressdriving lipid or protein oxidation. SOD1, NOx, andMDAwere significantly higher inMDD than in the other three groups. AOPPwas significantly higher in BPI than in HCs and BPII patients. BPII patients showed lower SOD1 compared to all other groups.Furthermore, MDD was characterized by increased indices of ROS and lipid hydroperoxide production compared to BPI andBPII groups. Indices of nitro-oxidative stress coupled with aldehyde production or protein oxidation were significantly differentamong the three patient groups (BDII > BDI > MDD). Finally, depressive symptom scores were significantly associated withhigher LOOH and AOPP levels. In conclusion, depression is accompanied by increased ROS production, which is insufficientlydampened by catalase activity, thereby increasing nitro-oxidative damage to lipids and aldehyde production. Increased proteinoxidation with formation of AOPP appeared to be hallmark ofMDD and BPI. In addition, patients with BPII may have protectionagainst the damaging effects of ROS including lipid peroxidation and aldehyde formation. This study suggests that biomarkersrelated to O&NS could aid in the differentiation of MDD, BPI, and BPII.
Keywords Depression . Bipolar disorder . Oxidative and nitrosative stress . Immune . Inflammation
* Michael [email protected]; https://scholar.google.com.br/citations?user=1wzMZ7UAAAAJ&hl=pt-BR&oi=ao
Kamila Landucci [email protected]
Nayara Rampazzo [email protected]
Heber Odebrecht [email protected]
Décio Sabbatini [email protected]
André F. [email protected]
Sandra Odebrecht Vargas [email protected]
1 Health Sciences Graduation Program, Health Sciences Center, StateUniversity of Londrina, Londrina, Paraná, Brazil
2 Department of Psychiatry, Faculty of Medicine, ChulalongkornUniversity, Bangkok, Thailand
3 Department of Psychiatry, Medical University of Plovdiv,Plovdiv, Bulgaria
4 IMPACT Strategic Research Centre, School of Medicine, DeakinUniversity, PO Box 281, Geelong 3220, Vic, Australia
5 Department of Psychiatry, University of Toronto, Toronto, ON,Canada
6 Centre for Addiction & Mental Health, Toronto, ON, Canada
Molecular Neurobiologyhttps://doi.org/10.1007/s12035-018-1051-7
Introduction
Research on the pathophysiology of major depressive disorder(MDD) and bipolar disorder (BD) has highlighted that aber-rations in neurooxidative, neuronitrosative stress, andneuroimmune pathways play a key pathophysiological rolein these disorders [1–7]. Chronic immune activation and in-flammatory processes, as observed in mood disorders, arefrequently accompanied by elevated levels of reactive oxygen(ROS) and nitrogen (RNS) species, including superoxide, per-oxides, nitric oxide (NO), and peroxynitrite, while increasedoxidative and nitrosative damage to lipids and proteins maycause immune activation [3, 5]. There are also data that pointthat activated neurooxidative, neuronitrosative, andneuroimmune pathways are interrelated phenomena in bothmajor depression and bipolar disorder [3, 5, 8].
Both depression and BD are associated with lowered lipid-associated antioxidant defenses including lowered activity oflecithin cholesterol acyltransferase (LCAT), lower levels ofhigh-density lipoprotein (HDL) cholesterol, vitamin E, coen-zyme Q10 and paraoxonase 1 and glutathione peroxidase ac-tivities [9–17]. This specific reduction in lipid-targeted anti-oxidant defenses may contribute to increased ROS levels andoxidative damage to lipid membranes (lipid peroxidation) in-cluding to polyunsaturated fatty acids [18–20]. Lipid hydro-peroxide chain reactions eventually cause the formation ofreactive aldehydes, the end-product of lipid peroxidation, asindicated by increased levels of malondialdehyde (MDA) orthiobarbituric acid reactive substances (TBARS) and in-creased autoimmune responses (IgG- or IgM-mediated) di-rected against oxidatively formed neoepitopes, includingazelaic acid and MDA, oxidized low-density lipoproteincholesterol, and anchorage molecules [21–27]. Signs of lip-id peroxidation coupled with reactive aldehyde productionas measured with plasma TBARS or MDA are now amongthe most frequently reported biomarkers for depression andBD [21, 26–34]. Recent meta-analyses also report elevatedTBARS and MDA concentrations in depression [35, 36]and BD [37, 38]. In both mood disorders, increasedTBARS seem to be associated with severity of illness, sui-cidal behaviors, and the number of manic and/or depressiveepisodes in the year prior to the assay of MDA [8]. Nosignificant differences could be detected in MDA levelsand associated immune-inflammatory biomarkers amongpatients in acute phases of depression versus BD [8, 39].Therefore, it remains unclear whether specific aspects ofthe nitro-oxidative pathways ranging from ROS productionto lipid peroxidation could differ between individuals withdepression and BD. These abnormalities may includechanges in superoxide dismutase (SOD) activity, lipid hy-droperoxide levels (LOOH), catalase activity, increasedROS coupled with RNS, or lipid peroxidation with alde-hyde formation.
Major depression is accompanied not only by increasedROS and lipid peroxidation but also by oxidative damage toproteins as indicated by elevated levels of advanced oxidationprotein products (AOPPs) [40, 41]. AOPPs are formed viaincreased ROS and peroxynitrite production coupled with in-creased myeloperoxidase activity and hypochlorous acid pro-duction [42]. Depression is also characterized by increasedinducible nitric oxide (NO) synthase (iNOS) activity andNO production, which eventually may lead to nitrosativestress and hypernitrosylation [2, 3, 43, 44]. In addition, evi-dence suggests that NO production is elevated in euthymicpatients with BD compared to controls [45]. Therefore, majoraffective disorders are now conceptualized as neurooxidative,neuronitrosative, and neuroimmune disorders, which are char-acterized by nitro-oxidative and nitrosative stress (O&NS)-induced neurotoxic responses leading to aberrations in neuro-protection, neuronal functions, neurogenesis, synaptic plastic-ity, neurotransmitter signaling, and receptor expression [3, 4,46]. Potential differences between depression and BD on spe-cific aspects of O&NS pathways remain under-explored.
Therefore, the aim of the present study was to examinelevels of SOD, LOOH, catalase, NO metabolites (NOx),MDA, and AOPP among clinically stable patients with de-pression, type I BD (BDI), and BPII, as well as healthy con-trols (HCs). The a priori hypothesis was that these mood dis-orders are accompanied by activated O&NS pathways andthat are no significant differences between depression andBD would emerge.
Subjects and Methods
Participants
In this cross-sectional study, we included 54 HCs and 105patients with mood disorders, namely 37 patients withMDD, 45 with BPI, and 23 with BPII. All participants wereBrazilian of both gender and aged 20 to 63 years old. Allparticipants with mood disorders were outpatients admittedto the Psychiatry outpatient clinics at the University Hospitalof the Universidade Estadual de Londrina (UEL), Parana,Brazil. They were all in remission or partial remission, andthe index episode in BD patients was not of (hypo)manicpolarity. The HC sample was derived from the same catch-ment area. The following exclusion criteria were applied forpatients and controls: (a) pregnant women; (b) subjects withmedical illness affecting immune functions, including hepati-tis B and C virus infection, HIV infection, neuroimmune andneurodegenerative disorders (e.g., Alzheimer’s disease, mul-tiple sclerosis, Parkinson’s disease), chronic obstructive pul-monary disease, chronic kidney disease, cancers, autoimmunediseases such as rheumatoid arthritis, type 1 diabetes, andsystemic lupus erythematosus; (c) subjects with other axis-1
Mol Neurobiol
diagnoses according to DSM-IV-TR criteria, including schizo-phrenia, schizo-affective disorder, autism, psycho-organicsyndromes; and (d) subjects who were treated with nonsteroi-dal anti-inflammatory drugs, interferon, glucocorticoids, anti-oxidants, herbal supplements and omega-3 polyunsaturatedfatty acids during the past 4 weeks prior to study enrollment.Some patients with MDD and BD were currently treated withantidepressants (n = 44), atypical antipsychotics (n = 32), lith-ium (n = 26), and other mood stabilizers (n = 33) includingcarbamazepine and valproic acid. All participants providedwritten informed consent to take part in the current study,whose experimental procedures were previously approvedby the Research Ethics Committee at UEL (protocol numberCAAE 34935814.2.0000.5231).
Methods
The clinical diagnoses of MDD, BPI, and BPII were made bya research psychiatrist using the validated BrazilianPortuguese version of the structured clinical interview forDSM-IV interview (SCID) axis I [47] in accordance withDiagnostic and Statistical Manual of Mental Disorders, 4thEdition, Text Revision (DSM-IV-TR) diagnostic criteria [48].Moreover, all participants completed a semi-structured inter-view comprising socio-demographic data (self-perceived eth-nicity, years of education, marital status) and clinical data(number of previous depressive, hypomanic, and manic epi-sodes). We used the 17-item Hamilton Depression RatingScale (HAM-D), translated and adapted for use withBrazilian individuals [49], to measure severity of depression,while severity of manic symptoms was scored employing theBrazilian Portuguese version of the Young Mania RatingScale (YMRS) [50]. The Alcohol, Smoking and SubstanceInvolvement Screening Test (ASSIST) was employed to as-sess substance misuse, namely use of alcohol and hypnotics.This rating scale was developed by the World HealthOrganization [51] and translated into Brazilian Portugueseby Henrique et al. [52]. The diagnosis of nicotine dependencewas made with the Fagerstrom Nicotine Dependence Scale[53], which has been previously validated for use inBrazilian samples [54]. We used two cutoff values yieldingthree groups, namely 0–1, no nicotine dependence; 2–5, milddependence; and ≥ 6, severe dependence.
A diagnosis of metabolic syndrome (MetS) was made ac-cording to the International Diabetes Federation criteria [55],namely presence of three out of the following criteria: (a)abdominal obesity (waist circumference ≥ 90 cm for menand ≥ 80 cm for women in South Asian and SouthAmericans and ≥ 94.0 cm for men and ≥ 80.0 cm for womenin Caucasians); (b) low HDL cholesterol (< 40 mg/dL in menand < 50 mg/dL in women) or use of hypolipidemic drugs;(c) hypertriglyceridemia (triglycerides > 150 mg/dL) or useof hypolipidemic agent; (d) increased fasting glucose
(> 100 mg/dL) or use of oral antidiabetic medications;and (e) increased average blood pressure (130/85 mmHg) orcurrently taking antihypertensive medication. We measuredthe body mass index (BMI) according to the followingformula: weight (in kg) divided by square of height (in m2).
Assays
Peripheral fasting (12 h) blood was sampled at 8 a.m. the sameday as the diagnosis was made and clinical data were collect-ed. We measured the activities of superoxide dismutase(SOD1) and catalase and the concentrations of lipid hydroper-oxides (LOOH), NO metabolites (NOx), malondialdehyde(MDA) and advanced oxidation protein products (AOPP).SOD activity in erythrocytes was determined using the pyro-gallol method described by Marklund and Marklund [56].This technique is based on the inhibition of pyrogallol self-oxidation by SOD in aqueous solution. The assay was con-ducted in a spectrophotometer Helios α, Thermo Spectronic(Waltham, MA, USA) at 420 nm and 37 °C. During 5 min,variation in optical density (OD) was recorded every minute.The level of SOD that inhibited 50% of the pyrogallol oxida-tion was defined as one unit of enzymatic activity. The resultswere expressed U/mg of hemoglobin (Hb). Lipid hydroperox-ides (LOOH) are assayed by chemiluminescence (CL-LOOH)[57, 58]. This method uses the compound tert-butyl hydroper-oxide to start a lipid chain reaction that can be detected byphoton emission during the formation of lipid hydroperoxides.Readings were performed in a Glomax luminometer (TD20/20 Turner Designers, USA) over 1 h at one reading persecond. Results are expressed as relative units of light.Measurement of catalase activity was estimated throughthe difference between the initial reading and the readingconducted 30 s after the addition of 200 mM H2O2 30% at240 nm in a microplate reader (model EnSpire, PerkinElmer, USA) with the temperature maintained at 25 °C.The catalase values are expressed as U/mg Hb. NO metabolite(NOx) levels were assessed indirectly by determining the plas-ma nitrite concentration using an adaptation of the techniquedescribed Navarro-Gonzalvez et al. [59]. This method is basedon the reduction of the nitrate present in the sample to nitrite byoxidation-reduction reactions mediated by the systemcadmium-copper reagent. Thereafter, Griess reagent was addedto induce diazotization, forming a colored complex and subse-quent detection at 540 nm. The quantification of NOx wasmade in a microplate reader Asys Expert Plus, Biochrom(Holliston, MA, USA). The nitric oxide concentration wasexpressed in μM. MDA levels were measured through com-plexation with two molecules of thiobarbituric acid (TBA)using MDA estimation through high performance liquid chro-matography (HPLC Alliance e2695, Waters’, Barueri, SP,Brasil) [60]. Experimental conditions included the use of acolumn Eclipse XDB-C18 (Agilent, USA), mobile phase
Mol Neurobiol
consisting of 65% phosphate buffer (50 nM pH 7.0) and 35%HPLC-grade methanol, flow rate of 1.0 mL/min, temperatureof 30 °C, and wavelength of 532 nm. MDA concentration inthe samples was quantified based on a calibration curve and areexpressed in mmol of MDA/mg proteins. AOPP was quanti-fied using the method described by Hanasand et al. [61] in amicroplate reader, Perkin Elmer, model EnSpire (Waltham,MA, EUA), at a wavelength of 340 nm. AOPP concentrationwas expressed in μM of equivalent chloramine T.
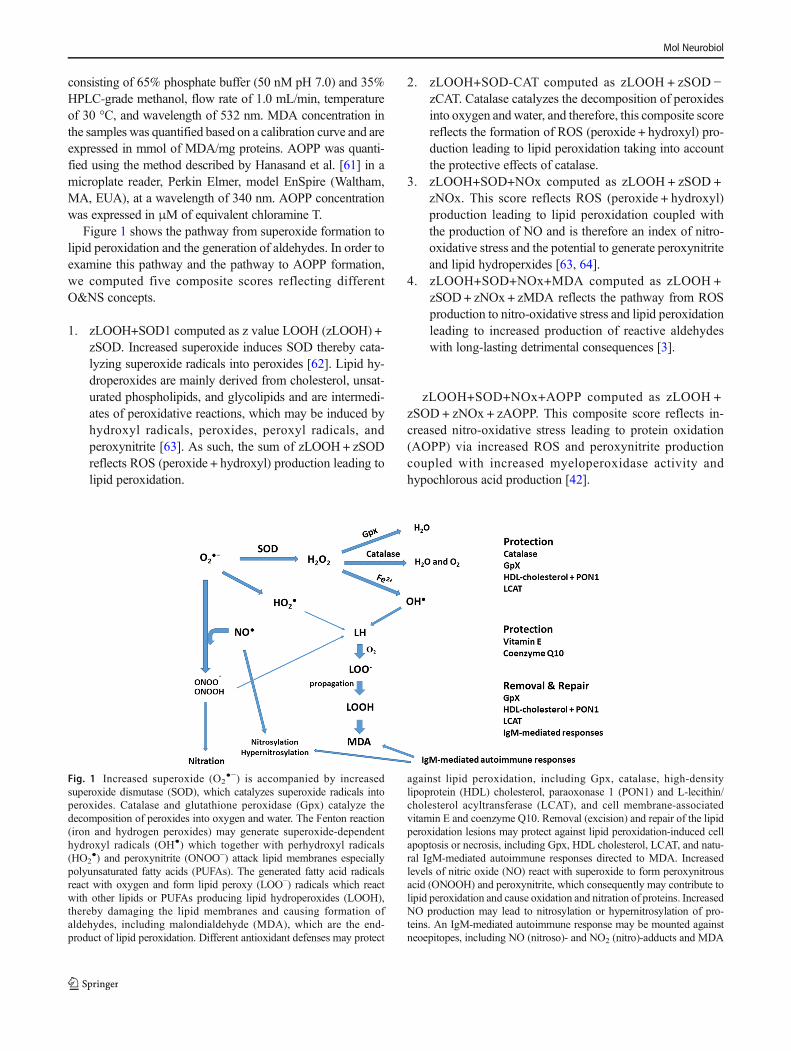
Figure 1 shows the pathway from superoxide formation tolipid peroxidation and the generation of aldehydes. In order toexamine this pathway and the pathway to AOPP formation,we computed five composite scores reflecting differentO&NS concepts.
1. zLOOH+SOD1 computed as z value LOOH (zLOOH) +zSOD. Increased superoxide induces SOD thereby cata-lyzing superoxide radicals into peroxides [62]. Lipid hy-droperoxides are mainly derived from cholesterol, unsat-urated phospholipids, and glycolipids and are intermedi-ates of peroxidative reactions, which may be induced byhydroxyl radicals, peroxides, peroxyl radicals, andperoxynitrite [63]. As such, the sum of zLOOH+ zSODreflects ROS (peroxide + hydroxyl) production leading tolipid peroxidation.
2. zLOOH+SOD-CAT computed as zLOOH + zSOD −zCAT. Catalase catalyzes the decomposition of peroxidesinto oxygen and water, and therefore, this composite scorereflects the formation of ROS (peroxide + hydroxyl) pro-duction leading to lipid peroxidation taking into accountthe protective effects of catalase.
3. zLOOH+SOD+NOx computed as zLOOH + zSOD +zNOx. This score reflects ROS (peroxide + hydroxyl)production leading to lipid peroxidation coupled withthe production of NO and is therefore an index of nitro-oxidative stress and the potential to generate peroxynitriteand lipid hydroperxides [63, 64].
4. zLOOH+SOD+NOx+MDA computed as zLOOH +zSOD + zNOx + zMDA reflects the pathway from ROSproduction to nitro-oxidative stress and lipid peroxidationleading to increased production of reactive aldehydeswith long-lasting detrimental consequences [3].
zLOOH+SOD+NOx+AOPP computed as zLOOH +zSOD + zNOx + zAOPP. This composite score reflects in-creased nitro-oxidative stress leading to protein oxidation(AOPP) via increased ROS and peroxynitrite productioncoupled with increased myeloperoxidase activity andhypochlorous acid production [42].
Fig. 1 Increased superoxide (O2●−) is accompanied by increased
superoxide dismutase (SOD), which catalyzes superoxide radicals intoperoxides. Catalase and glutathione peroxidase (Gpx) catalyze thedecomposition of peroxides into oxygen and water. The Fenton reaction(iron and hydrogen peroxides) may generate superoxide-dependenthydroxyl radicals (OH●) which together with perhydroxyl radicals(HO2
●) and peroxynitrite (ONOO−) attack lipid membranes especiallypolyunsaturated fatty acids (PUFAs). The generated fatty acid radicalsreact with oxygen and form lipid peroxy (LOO−) radicals which reactwith other lipids or PUFAs producing lipid hydroperoxides (LOOH),thereby damaging the lipid membranes and causing formation ofaldehydes, including malondialdehyde (MDA), which are the end-product of lipid peroxidation. Different antioxidant defenses may protect
against lipid peroxidation, including Gpx, catalase, high-densitylipoprotein (HDL) cholesterol, paraoxonase 1 (PON1) and L-lecithin/cholesterol acyltransferase (LCAT), and cell membrane-associatedvitamin E and coenzyme Q10. Removal (excision) and repair of the lipidperoxidation lesions may protect against lipid peroxidation-induced cellapoptosis or necrosis, including Gpx, HDL cholesterol, LCAT, and natu-ral IgM-mediated autoimmune responses directed to MDA. Increasedlevels of nitric oxide (NO) react with superoxide to form peroxynitrousacid (ONOOH) and peroxynitrite, which consequently may contribute tolipid peroxidation and cause oxidation and nitration of proteins. IncreasedNO production may lead to nitrosylation or hypernitrosylation of pro-teins. An IgM-mediated autoimmune response may be mounted againstneoepitopes, including NO (nitroso)- and NO2 (nitro)-adducts and MDA
Mol Neurobiol
Statistical Analyses
Differences in scale variables between diagnostic groupswere assessed using analyses of variance (ANOVAs), whiledifferences in nominal variables between diagnostic groupswere assessed using analyses of contingency tables (χ2
tests). Multivariate GLM analysis with the six O&NS bio-markers or the five z-unit composite scores as dependentvariables were used to assess the effects of diagnosis (pri-mary explanatory variable), while adjusting for age, sex,BMI, years of education, and nicotine dependence. Testsfor between-subject effects were used to delineate the ef-fects of the primary explanatory variable on the separatebiomarkers and composite scores. Model-derived estimatedmarginal means were computed, and post hoc analyseswere used to assess the differences between the diagnosticcategories. Linear multiple regression analyses wereemployed to delineate the associations between one depen-dent variable (the biomarkers) and a set of explanatory var-iables. Binary logistic regression analysis was used to de-lineate the most significant predictors of diagnostic groups.Nagelkerke values are used as effect estimate, and oddsratios and 95% confidence intervals are computed.Results of multiple comparisons were p-corrected for falsediscovery rate according to Benjamini and Hochberg [65].We used the IBM SPSS Windows version 22 and Statistica8 to analyze all data. Statistical significance was set at 0.05,two-tailed.
Results
Descriptive Statistics
Table 1 shows the socio-demographic and clinical data innormal volunteers and patients with mood disorders. Therewere no significant differences in age, sex, marital status,BMI, MetS, and Fagerstrom score between the two groups.After p-correction for false discovery rate, there were nosignificant differences in education (p = 0.085), ethnicity(p = 0.113), and YMRS (p = 0.115) between both samples.The HAM-D score was higher in patients with mood dis-orders as compared with controls (p-correction: p = 0.017).There were no significant differences in the raw O&NSbiomarkers between both groups (unadjusted for con-founders such as age, sex, education, BMI, nicotine depen-dence). The correlation matrix among the six biomarkersshows that (without p-correction) there are significant cor-relations between SOD1 and MDA (r = 0.310, p < 0.001,n = 136) and between LOOH and AOPP (r = 0.352,p < 0.001, n = 137). All other correlation coefficients werenon-significant.
Differences Between the Four Study Groups
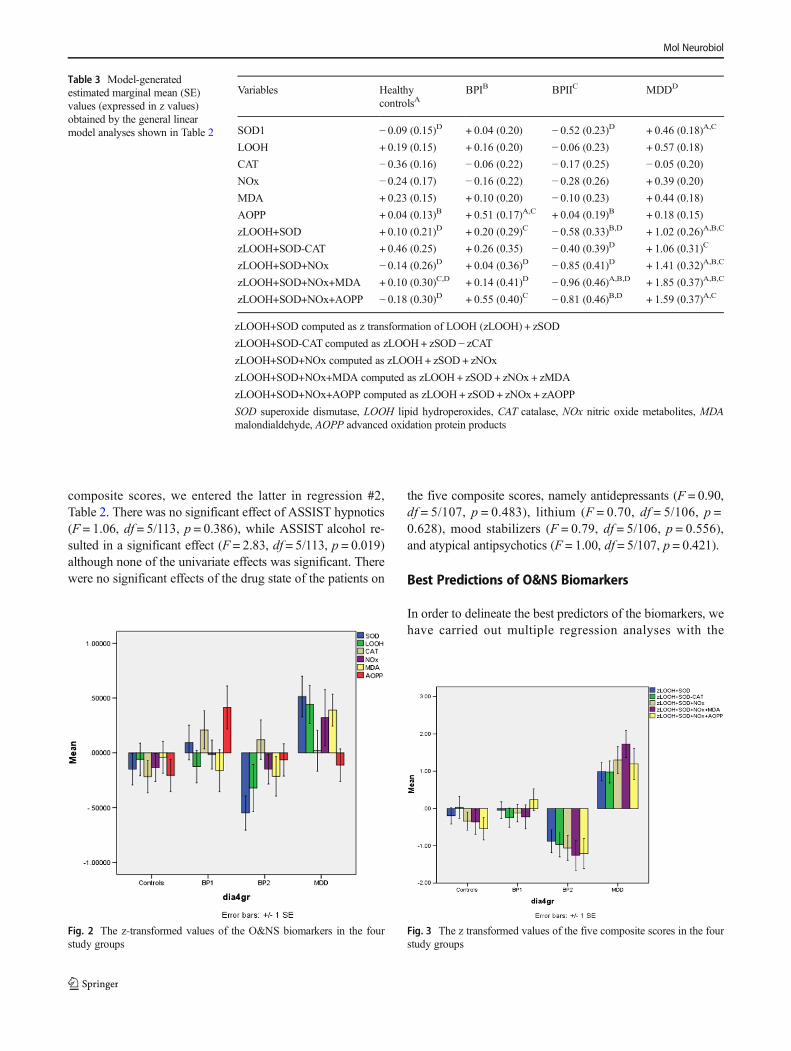
Figure 1 shows the z-transformed values of the six O&NSbiomarkers in the four study groups. Table 2, regression #1,shows the results of multivariate GLM analysis with the sixbiomarkers as dependent variables and diagnosis as primaryexplanatory variable, while adjusting for age, sex, education,nicotine dependence, and BMI. We found a significant effectof diagnosis on the six biomarkers (for sex and education: seebelow). Tests for between-subject effects showed significanteffects of diagnosis on SOD1 and AOPP levels. Table 3 showsthe model-generated estimated marginal mean values afteradjusting for the confounders. Post hoc analyses showed thatSOD1 was significantly higher in MDD patients as comparedwith controls and BPII patients, while those with BPI showedan intermediate position. AOPP levels were significantlyhigher in BPI than in controls and BPII patients, whileMDD patients occupied an intermediate position.
Figures 2 and 3 show the z-transformed values of theO&NS biomarkers and the five composite scores in the fourstudy groups, respectively. Table 2, regression #2, shows theresults of a multivariate GLM analysis with the five compositescores as dependent variables and diagnostic groups as prima-ry explanatory variables, while adjusting for age, sex, educa-tion, nicotine dependence, and BMI. We found a significanteffect of diagnostic groups on the five composite scores. Testsfor between-subject effects showed significant effects on allscores. Table 3 shows that the five scores were significantlyhigher in major depression than in controls (except LOOH+SOD-CAT) and patients with BPII. Moreover, zLOOH+SOD,zLOOH+SOD+NOx, and zLOOH+SOD+NOx+MDA weresignificantly higher in major depression than in BPI.zLOOH+SOD and zLOOH+SOD+NOx+AOPP were signif-icantly higher in BPI than BPII, while LOOH+SOD+NOx+MDAwas significantly lower in BPI than in controls.
Effects of the HAM-D Score
In order to adjust the effects of diagnosis for severity of illness,we have entered the HAM-D score in regression #2, Table 2.The results of this analysis (Table 2, regression #3) show thatdiagnosis and HAM-D were both significant. Nevertheless,the HAM-D was only associated with zLOOH+SOD+NOx+AOPP, while the effects of diagnosis on all five compositescores remained significant. After adding the YMRS scorein regression #2, Table 2, no significant effects of YMRS onthe composite scores was found (F = 0.93, df = 5/113, p =0.462).
We have also examined the differences among the threediagnostic groups after entering the dichotomized HAM-Dscore (cutoff value < 7 versus ≥ 7) as a second factor, therebyadjusting for the remitted versus the non-remitted state (whilealso adjusting for sex, age, education, nicotine dependence,
Mol Neurobiol
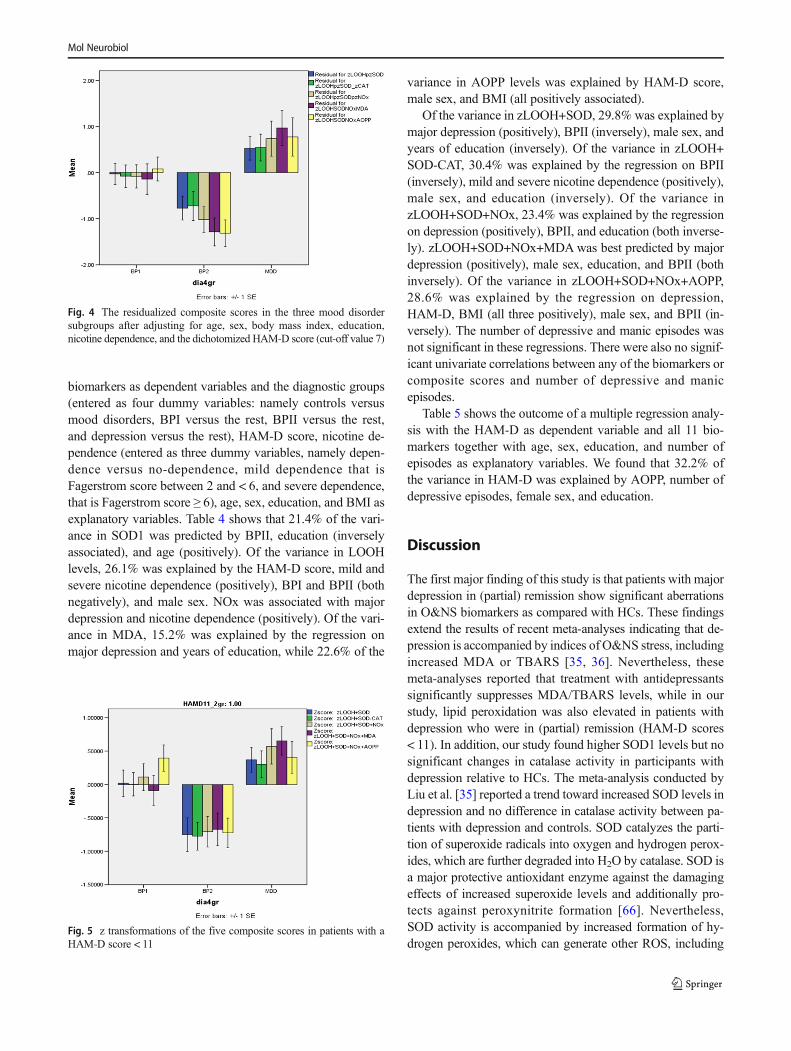
and BMI). Multivariate GLM analysis #4, Table 2, shows asignificant effect of diagnosis, but not of the dichotomizedHAM-D scores. Figure 4 shows the residualized compositescores after regression on age, sex, BMI, education, nicotinedependence, and the dichotomizedHAM-D values in the threemood disorders groups. zLOOH+SOD and zLOOH+SOD-CAT were significantly higher in major depression that inBPI and BPII, while there were no differences between bothBD subtypes (p = 0.066 and p = 0.166, respectively).zLOOH+SOD+NOx, zLOOH+SOD+NOx+MDA, andzLOOH+SOD+NOx+AOPP were significantly different be-tween the three groups and increased from BPII to BPI tomajor depression.
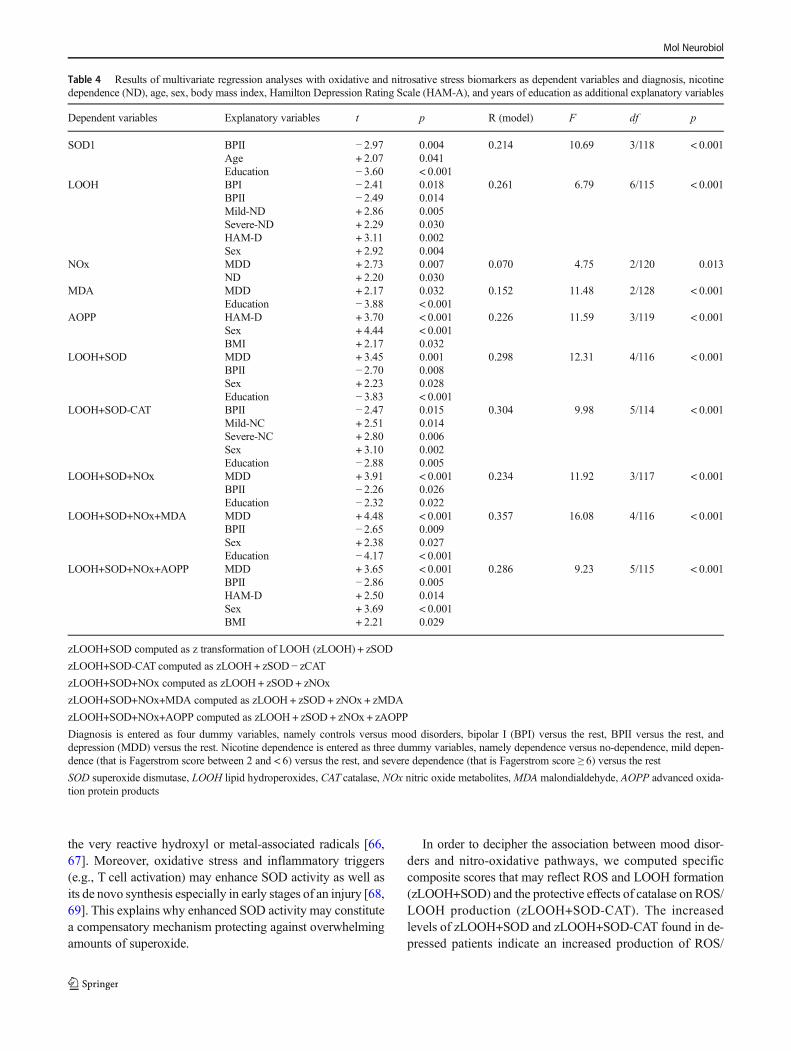
In multivariate GLM analysis #5, Table 2, we examined thedifferences between the three mood disorder groups in sub-jects with a HAM-D score < 11 (14 BP1, 13 BP2, and 22depressed patients). Also, this analysis showed a significanteffect of diagnostic groups with an effect size of 0.306 andunivariate effects on all five scores. Figure 5 shows the unad-justed mean values of the composite scores in the three studygroups with HAM-D values < 11. zLOOH+SOD, zLOOH+SOD-CAT, zLOOH+SOD+NOx, and zLOOH+SOD+NOx+AOPP were significantly higher in depression and BPI than
BPII patients, while there were no significant differences be-tween depressed and BPI patients. zLOOH+SOD+NOx+MDA was significantly different between the three groupsand increased from BPII to PBI to depression.
Effects of Confounding Variables
LOOH (F = 5.46, df = 1/118, p = 0.021; partial eta squared =0.044) and AOPP (F = 23.52, df = 1/118, p < 0.001, partial etasquared = 0.166) were significantly higher in males than fe-males. All five composite scores were significantly higher inmen than in women. Education was significantly and inverse-ly associated with SOD1 (F = 6.91, df = 1/118, p = 0.010, par-tial eta squared = 0.055), MDA (F = 8.90, df = 1/118, p =0.003, partial eta squared = 0.070), zLOOH+SOD (F = 4.71,df = 1/118, p = 0.032, partial eta squared = 0.038), zLOOH+SOD-CAT (F = 5.83, df = 1/118, p = 0.017, partial etasquared = 0.047), and zLOOH+SOD+NOx+MDA (F = 5.65,df = 1/118, p = 0.019, partial eta squared = 0.046). There wereno significant effects of age, nicotine dependence, and BMI onthe biomarkers.
In order to examine possible effects of other confounderson the associations between diagnostic groups and the five
Table 1 Socio-demographic,clinical, and biomarker data ofpatients with mood disorders(MOOD) and healthy controls(HCs)
Variables HC (n = 54) MOOD (n = 105) F/Χ2 df p
Age (years) 43.6 (11.7) 42.7 (10.8) 0.28 1/157 0.598
Sex (M/F) 44/23 30/7 5.09 2 0.078
Education (years) 12.5 (5.8) 10.3 (4.7) 6.76 1/157 0.010
Single/separated-widowed /married 15/10/ 29 22/26/57 1.33 2 0.514
Caucasian/other 34/20 84/21 5.41 1 0.020
Body mass index (kg/m2) 26.3 (4.9) 26.6 (5.0) 0.09 1/149 0.092
Metabolic syndrome (no/yes) 33/20 66/39 0.00 1 0.942
Fagerstrom score 2.8 (3.3) 3.1 (3.4) 0.56 1/157 0.454
Fagerstrom_3 groupsa 30/7/17 53/18/34 0.58 2 0.749
HAM-D [q25 – q75] 2.6 (3.4) [0–4] 9.9 (6.5) [4–13] 58.95 1/157 < 0.001
YMRS 0.8 (1.7) 1.7 (2.5) 4.99 1/157 0.027
Number depressive episodes – 5.1 (4.6) – – –
Number manic episodes – 4.4 (6.2) – – –
SOD1 (U/mg Hb) 91.4 (40.8) 101.0 (41.7) 1.67 1/134 0.199
LOOH (RLU × 106)b 1552 (1011) 1640 (1149) 0.27 1/135 0.607
CAT (U/mg Hb) 57.1 (14.9) 62.0 (14.4) 3.56 1/133 0.061
NOx (μM)b 6.1 (3.2) 6.9 (3.8) 1.34 1/136 0.249
MDA (mmol/mg of protein)b 64.3 (22.1) 65.6 (22.3) 0.12 1/136 0.731
AOPP (μM)b 71.6 (44.6) 85.5 (43.3) 2.72 1/136 0.076
All results are shown as mean (± SD)
F results of analyses of variance, Χ2 results of analyses of contingency tables, HAM-D Hamilton Depressionrating Scale score, Q25 and q75 25% and 75% quartile values, SOD superoxide dismutase, LOOH lipid hydro-peroxides,CATcatalase,NOx nitric oxide metabolites,MDAmalondialdehyde, AOPP advanced oxidation proteinproductsa Three groups using cutoff values 2 and 6 (thus group 1, 0–1; group 2, 3–5; group 3, ≥ 6)b These data are processed in Ln transformation
Mol Neurobiol
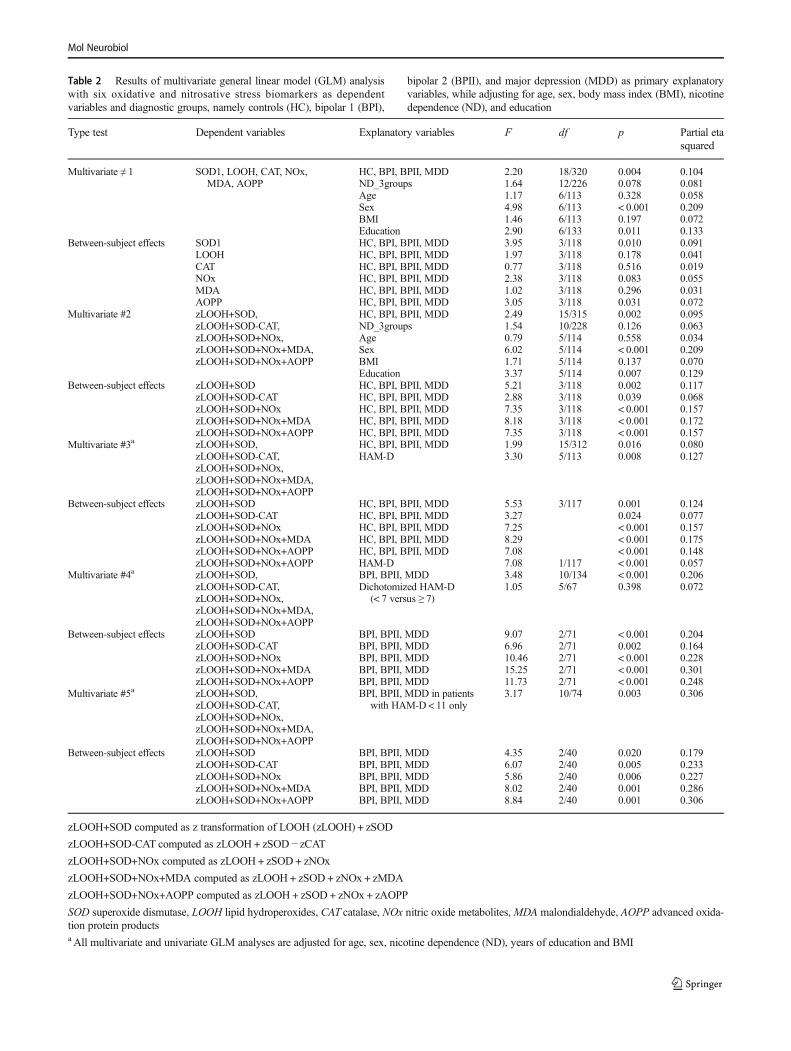
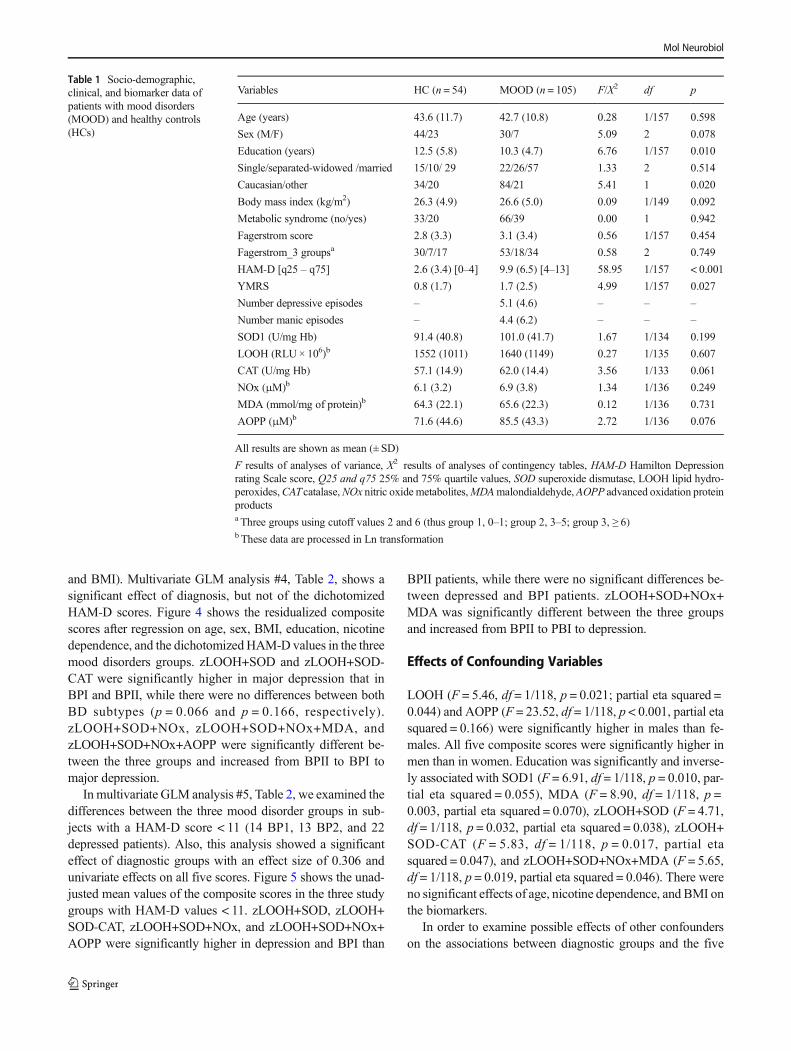
Table 2 Results of multivariate general linear model (GLM) analysiswith six oxidative and nitrosative stress biomarkers as dependentvariables and diagnostic groups, namely controls (HC), bipolar 1 (BPI),
bipolar 2 (BPII), and major depression (MDD) as primary explanatoryvariables, while adjusting for age, sex, body mass index (BMI), nicotinedependence (ND), and education
Type test Dependent variables Explanatory variables F df p Partial etasquared
Multivariate ≠ 1 SOD1, LOOH, CAT, NOx,MDA, AOPP
HC, BPI, BPII, MDDND_3groupsAgeSexBMIEducation
2.201.641.174.981.462.90
18/32012/2266/1136/1136/1136/133
0.0040.0780.328< 0.0010.1970.011
0.1040.0810.0580.2090.0720.133
Between-subject effects SOD1LOOHCATNOxMDAAOPP
HC, BPI, BPII, MDDHC, BPI, BPII, MDDHC, BPI, BPII, MDDHC, BPI, BPII, MDDHC, BPI, BPII, MDDHC, BPI, BPII, MDD
3.951.970.772.381.023.05
3/1183/1183/1183/1183/1183/118
0.0100.1780.5160.0830.2960.031
0.0910.0410.0190.0550.0310.072
Multivariate #2 zLOOH+SOD,zLOOH+SOD-CAT,zLOOH+SOD+NOx,zLOOH+SOD+NOx+MDA,zLOOH+SOD+NOx+AOPP
HC, BPI, BPII, MDDND_3groupsAgeSexBMIEducation
2.491.540.796.021.713.37
15/31510/2285/1145/1145/1145/114
0.0020.1260.558< 0.0010.1370.007
0.0950.0630.0340.2090.0700.129
Between-subject effects zLOOH+SODzLOOH+SOD-CATzLOOH+SOD+NOxzLOOH+SOD+NOx+MDAzLOOH+SOD+NOx+AOPP
HC, BPI, BPII, MDDHC, BPI, BPII, MDDHC, BPI, BPII, MDDHC, BPI, BPII, MDDHC, BPI, BPII, MDD
5.212.887.358.187.35
3/1183/1183/1183/1183/118
0.0020.039< 0.001< 0.001< 0.001
0.1170.0680.1570.1720.157
Multivariate #3a zLOOH+SOD,zLOOH+SOD-CAT,zLOOH+SOD+NOx,zLOOH+SOD+NOx+MDA,zLOOH+SOD+NOx+AOPP
HC, BPI, BPII, MDDHAM-D
1.993.30
15/3125/113
0.0160.008
0.0800.127
Between-subject effects zLOOH+SODzLOOH+SOD-CATzLOOH+SOD+NOxzLOOH+SOD+NOx+MDAzLOOH+SOD+NOx+AOPP
HC, BPI, BPII, MDDHC, BPI, BPII, MDDHC, BPI, BPII, MDDHC, BPI, BPII, MDDHC, BPI, BPII, MDD
5.533.277.258.297.08
3/117 0.0010.024< 0.001< 0.001< 0.001
0.1240.0770.1570.1750.148
zLOOH+SOD+NOx+AOPP HAM-D 7.08 1/117 < 0.001 0.057Multivariate #4a zLOOH+SOD,
zLOOH+SOD-CAT,zLOOH+SOD+NOx,zLOOH+SOD+NOx+MDA,zLOOH+SOD+NOx+AOPP
BPI, BPII, MDDDichotomized HAM-D
(< 7 versus ≥ 7)
3.481.05
10/1345/67
< 0.0010.398
0.2060.072
Between-subject effects zLOOH+SODzLOOH+SOD-CATzLOOH+SOD+NOxzLOOH+SOD+NOx+MDAzLOOH+SOD+NOx+AOPP
BPI, BPII, MDDBPI, BPII, MDDBPI, BPII, MDDBPI, BPII, MDDBPI, BPII, MDD
9.076.9610.4615.2511.73
2/712/712/712/712/71
< 0.0010.002< 0.001< 0.001< 0.001
0.2040.1640.2280.3010.248
Multivariate #5a zLOOH+SOD,zLOOH+SOD-CAT,zLOOH+SOD+NOx,zLOOH+SOD+NOx+MDA,zLOOH+SOD+NOx+AOPP
BPI, BPII, MDD in patientswith HAM-D < 11 only
3.17 10/74 0.003 0.306
Between-subject effects zLOOH+SODzLOOH+SOD-CATzLOOH+SOD+NOxzLOOH+SOD+NOx+MDAzLOOH+SOD+NOx+AOPP
BPI, BPII, MDDBPI, BPII, MDDBPI, BPII, MDDBPI, BPII, MDDBPI, BPII, MDD
4.356.075.868.028.84
2/402/402/402/402/40
0.0200.0050.0060.0010.001
0.1790.2330.2270.2860.306
zLOOH+SOD computed as z transformation of LOOH (zLOOH) + zSOD
zLOOH+SOD-CAT computed as zLOOH+ zSOD − zCAT
zLOOH+SOD+NOx computed as zLOOH+ zSOD + zNOx
zLOOH+SOD+NOx+MDA computed as zLOOH+ zSOD + zNOx + zMDA
zLOOH+SOD+NOx+AOPP computed as zLOOH+ zSOD + zNOx + zAOPP
SOD superoxide dismutase, LOOH lipid hydroperoxides, CAT catalase, NOx nitric oxide metabolites, MDA malondialdehyde, AOPP advanced oxida-tion protein productsa All multivariate and univariate GLM analyses are adjusted for age, sex, nicotine dependence (ND), years of education and BMI
Mol Neurobiol
composite scores, we entered the latter in regression #2,Table 2. There was no significant effect of ASSIST hypnotics(F = 1.06, df = 5/113, p = 0.386), while ASSIST alcohol re-sulted in a significant effect (F = 2.83, df = 5/113, p = 0.019)although none of the univariate effects was significant. Therewere no significant effects of the drug state of the patients on
the five composite scores, namely antidepressants (F = 0.90,df = 5/107, p = 0.483), lithium (F = 0.70, df = 5/106, p =0.628), mood stabilizers (F = 0.79, df = 5/106, p = 0.556),and atypical antipsychotics (F = 1.00, df = 5/107, p = 0.421).
Best Predictions of O&NS Biomarkers
In order to delineate the best predictors of the biomarkers, wehave carried out multiple regression analyses with the
Table 3 Model-generatedestimated marginal mean (SE)values (expressed in z values)obtained by the general linearmodel analyses shown in Table 2
Variables HealthycontrolsA
BPIB BPIIC MDDD
SOD1 − 0.09 (0.15)D + 0.04 (0.20) − 0.52 (0.23)D + 0.46 (0.18)A,C
LOOH + 0.19 (0.15) + 0.16 (0.20) − 0.06 (0.23) + 0.57 (0.18)
CAT − 0.36 (0.16) − 0.06 (0.22) − 0.17 (0.25) − 0.05 (0.20)NOx − 0.24 (0.17) − 0.16 (0.22) − 0.28 (0.26) + 0.39 (0.20)
MDA + 0.23 (0.15) + 0.10 (0.20) − 0.10 (0.23) + 0.44 (0.18)
AOPP + 0.04 (0.13)B + 0.51 (0.17)A,C + 0.04 (0.19)B + 0.18 (0.15)
zLOOH+SOD + 0.10 (0.21)D + 0.20 (0.29)C − 0.58 (0.33)B,D + 1.02 (0.26)A,B,C
zLOOH+SOD-CAT + 0.46 (0.25) + 0.26 (0.35) − 0.40 (0.39)D + 1.06 (0.31)C
zLOOH+SOD+NOx − 0.14 (0.26)D + 0.04 (0.36)D − 0.85 (0.41)D + 1.41 (0.32)A,B,C
zLOOH+SOD+NOx+MDA + 0.10 (0.30)C,D + 0.14 (0.41)D − 0.96 (0.46)A,B,D + 1.85 (0.37)A,B,C
zLOOH+SOD+NOx+AOPP − 0.18 (0.30)D + 0.55 (0.40)C − 0.81 (0.46)B,D + 1.59 (0.37)A,C
zLOOH+SOD computed as z transformation of LOOH (zLOOH) + zSOD
zLOOH+SOD-CAT computed as zLOOH+ zSOD − zCATzLOOH+SOD+NOx computed as zLOOH+ zSOD + zNOx
zLOOH+SOD+NOx+MDA computed as zLOOH+ zSOD + zNOx + zMDA
zLOOH+SOD+NOx+AOPP computed as zLOOH+ zSOD + zNOx + zAOPP
SOD superoxide dismutase, LOOH lipid hydroperoxides, CAT catalase, NOx nitric oxide metabolites, MDAmalondialdehyde, AOPP advanced oxidation protein products
Fig. 2 The z-transformed values of the O&NS biomarkers in the fourstudy groups
Fig. 3 The z transformed values of the five composite scores in the fourstudy groups
Mol Neurobiol
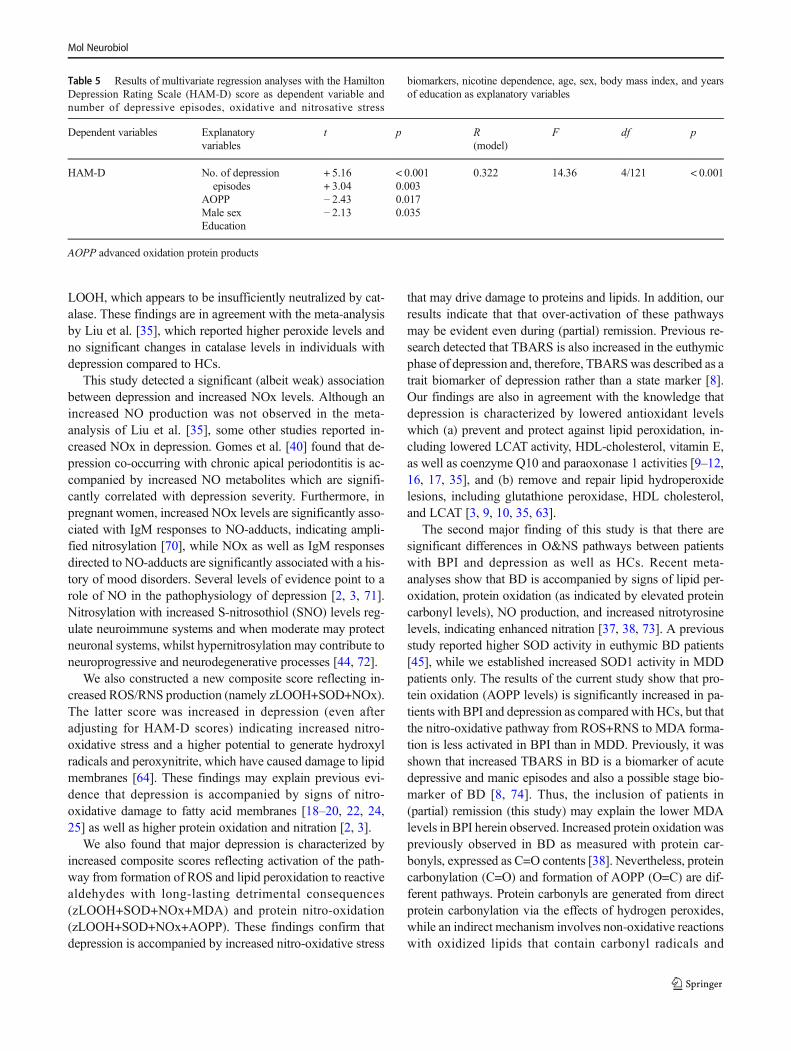
biomarkers as dependent variables and the diagnostic groups(entered as four dummy variables: namely controls versusmood disorders, BPI versus the rest, BPII versus the rest,and depression versus the rest), HAM-D score, nicotine de-pendence (entered as three dummy variables, namely depen-dence versus no-dependence, mild dependence that isFagerstrom score between 2 and < 6, and severe dependence,that is Fagerstrom score ≥ 6), age, sex, education, and BMI asexplanatory variables. Table 4 shows that 21.4% of the vari-ance in SOD1 was predicted by BPII, education (inverselyassociated), and age (positively). Of the variance in LOOHlevels, 26.1% was explained by the HAM-D score, mild andsevere nicotine dependence (positively), BPI and BPII (bothnegatively), and male sex. NOx was associated with majordepression and nicotine dependence (positively). Of the vari-ance in MDA, 15.2% was explained by the regression onmajor depression and years of education, while 22.6% of the
variance in AOPP levels was explained by HAM-D score,male sex, and BMI (all positively associated).
Of the variance in zLOOH+SOD, 29.8% was explained bymajor depression (positively), BPII (inversely), male sex, andyears of education (inversely). Of the variance in zLOOH+SOD-CAT, 30.4% was explained by the regression on BPII(inversely), mild and severe nicotine dependence (positively),male sex, and education (inversely). Of the variance inzLOOH+SOD+NOx, 23.4% was explained by the regressionon depression (positively), BPII, and education (both inverse-ly). zLOOH+SOD+NOx+MDAwas best predicted by majordepression (positively), male sex, education, and BPII (bothinversely). Of the variance in zLOOH+SOD+NOx+AOPP,28.6% was explained by the regression on depression,HAM-D, BMI (all three positively), male sex, and BPII (in-versely). The number of depressive and manic episodes wasnot significant in these regressions. There were also no signif-icant univariate correlations between any of the biomarkers orcomposite scores and number of depressive and manicepisodes.
Table 5 shows the outcome of a multiple regression analy-sis with the HAM-D as dependent variable and all 11 bio-markers together with age, sex, education, and number ofepisodes as explanatory variables. We found that 32.2% ofthe variance in HAM-D was explained by AOPP, number ofdepressive episodes, female sex, and education.
Discussion
The first major finding of this study is that patients with majordepression in (partial) remission show significant aberrationsin O&NS biomarkers as compared with HCs. These findingsextend the results of recent meta-analyses indicating that de-pression is accompanied by indices of O&NS stress, includingincreased MDA or TBARS [35, 36]. Nevertheless, thesemeta-analyses reported that treatment with antidepressantssignificantly suppresses MDA/TBARS levels, while in ourstudy, lipid peroxidation was also elevated in patients withdepression who were in (partial) remission (HAM-D scores< 11). In addition, our study found higher SOD1 levels but nosignificant changes in catalase activity in participants withdepression relative to HCs. The meta-analysis conducted byLiu et al. [35] reported a trend toward increased SOD levels indepression and no difference in catalase activity between pa-tients with depression and controls. SOD catalyzes the parti-tion of superoxide radicals into oxygen and hydrogen perox-ides, which are further degraded into H2O by catalase. SOD isa major protective antioxidant enzyme against the damagingeffects of increased superoxide levels and additionally pro-tects against peroxynitrite formation [66]. Nevertheless,SOD activity is accompanied by increased formation of hy-drogen peroxides, which can generate other ROS, including
Fig. 4 The residualized composite scores in the three mood disordersubgroups after adjusting for age, sex, body mass index, education,nicotine dependence, and the dichotomized HAM-D score (cut-off value 7)
Fig. 5 z transformations of the five composite scores in patients with aHAM-D score < 11
Mol Neurobiol
the very reactive hydroxyl or metal-associated radicals [66,67]. Moreover, oxidative stress and inflammatory triggers(e.g., T cell activation) may enhance SOD activity as well asits de novo synthesis especially in early stages of an injury [68,69]. This explains why enhanced SOD activity may constitutea compensatory mechanism protecting against overwhelmingamounts of superoxide.
In order to decipher the association between mood disor-ders and nitro-oxidative pathways, we computed specificcomposite scores that may reflect ROS and LOOH formation(zLOOH+SOD) and the protective effects of catalase on ROS/LOOH production (zLOOH+SOD-CAT). The increasedlevels of zLOOH+SOD and zLOOH+SOD-CAT found in de-pressed patients indicate an increased production of ROS/
Table 4 Results of multivariate regression analyses with oxidative and nitrosative stress biomarkers as dependent variables and diagnosis, nicotinedependence (ND), age, sex, body mass index, Hamilton Depression Rating Scale (HAM-A), and years of education as additional explanatory variables
Dependent variables Explanatory variables t p R (model) F df p
SOD1 BPIIAgeEducation
− 2.97+ 2.07− 3.60
0.0040.041< 0.001
0.214 10.69 3/118 < 0.001
LOOH BPIBPIIMild-NDSevere-NDHAM-DSex
− 2.41− 2.49+ 2.86+ 2.29+ 3.11+ 2.92
0.0180.0140.0050.0300.0020.004
0.261 6.79 6/115 < 0.001
NOx MDDND
+ 2.73+ 2.20
0.0070.030
0.070 4.75 2/120 0.013
MDA MDDEducation
+ 2.17− 3.88
0.032< 0.001
0.152 11.48 2/128 < 0.001
AOPP HAM-DSexBMI
+ 3.70+ 4.44+ 2.17
< 0.001< 0.0010.032
0.226 11.59 3/119 < 0.001
LOOH+SOD MDDBPIISexEducation
+ 3.45− 2.70+ 2.23− 3.83
0.0010.0080.028< 0.001
0.298 12.31 4/116 < 0.001
LOOH+SOD-CAT BPIIMild-NCSevere-NCSexEducation
− 2.47+ 2.51+ 2.80+ 3.10− 2.88
0.0150.0140.0060.0020.005
0.304 9.98 5/114 < 0.001
LOOH+SOD+NOx MDDBPIIEducation
+ 3.91− 2.26− 2.32
< 0.0010.0260.022
0.234 11.92 3/117 < 0.001
LOOH+SOD+NOx+MDA MDDBPIISexEducation
+ 4.48− 2.65+ 2.38− 4.17
< 0.0010.0090.027< 0.001
0.357 16.08 4/116 < 0.001
LOOH+SOD+NOx+AOPP MDDBPIIHAM-DSexBMI
+ 3.65− 2.86+ 2.50+ 3.69+ 2.21
< 0.0010.0050.014< 0.0010.029
0.286 9.23 5/115 < 0.001
zLOOH+SOD computed as z transformation of LOOH (zLOOH) + zSOD
zLOOH+SOD-CAT computed as zLOOH+ zSOD − zCAT
zLOOH+SOD+NOx computed as zLOOH+ zSOD + zNOx
zLOOH+SOD+NOx+MDA computed as zLOOH+ zSOD + zNOx + zMDA
zLOOH+SOD+NOx+AOPP computed as zLOOH+ zSOD + zNOx + zAOPP
Diagnosis is entered as four dummy variables, namely controls versus mood disorders, bipolar I (BPI) versus the rest, BPII versus the rest, anddepression (MDD) versus the rest. Nicotine dependence is entered as three dummy variables, namely dependence versus no-dependence, mild depen-dence (that is Fagerstrom score between 2 and < 6) versus the rest, and severe dependence (that is Fagerstrom score ≥ 6) versus the restSOD superoxide dismutase, LOOH lipid hydroperoxides, CAT catalase, NOx nitric oxide metabolites, MDA malondialdehyde, AOPP advanced oxida-tion protein products
Mol Neurobiol
LOOH, which appears to be insufficiently neutralized by cat-alase. These findings are in agreement with the meta-analysisby Liu et al. [35], which reported higher peroxide levels andno significant changes in catalase levels in individuals withdepression compared to HCs.
This study detected a significant (albeit weak) associationbetween depression and increased NOx levels. Although anincreased NO production was not observed in the meta-analysis of Liu et al. [35], some other studies reported in-creased NOx in depression. Gomes et al. [40] found that de-pression co-occurring with chronic apical periodontitis is ac-companied by increased NO metabolites which are signifi-cantly correlated with depression severity. Furthermore, inpregnant women, increased NOx levels are significantly asso-ciated with IgM responses to NO-adducts, indicating ampli-fied nitrosylation [70], while NOx as well as IgM responsesdirected to NO-adducts are significantly associated with a his-tory of mood disorders. Several levels of evidence point to arole of NO in the pathophysiology of depression [2, 3, 71].Nitrosylation with increased S-nitrosothiol (SNO) levels reg-ulate neuroimmune systems and when moderate may protectneuronal systems, whilst hypernitrosylation may contribute toneuroprogressive and neurodegenerative processes [44, 72].
We also constructed a new composite score reflecting in-creased ROS/RNS production (namely zLOOH+SOD+NOx).The latter score was increased in depression (even afteradjusting for HAM-D scores) indicating increased nitro-oxidative stress and a higher potential to generate hydroxylradicals and peroxynitrite, which have caused damage to lipidmembranes [64]. These findings may explain previous evi-dence that depression is accompanied by signs of nitro-oxidative damage to fatty acid membranes [18–20, 22, 24,25] as well as higher protein oxidation and nitration [2, 3].
We also found that major depression is characterized byincreased composite scores reflecting activation of the path-way from formation of ROS and lipid peroxidation to reactivealdehydes with long-lasting detrimental consequences(zLOOH+SOD+NOx+MDA) and protein nitro-oxidation(zLOOH+SOD+NOx+AOPP). These findings confirm thatdepression is accompanied by increased nitro-oxidative stress
that may drive damage to proteins and lipids. In addition, ourresults indicate that that over-activation of these pathwaysmay be evident even during (partial) remission. Previous re-search detected that TBARS is also increased in the euthymicphase of depression and, therefore, TBARSwas described as atrait biomarker of depression rather than a state marker [8].Our findings are also in agreement with the knowledge thatdepression is characterized by lowered antioxidant levelswhich (a) prevent and protect against lipid peroxidation, in-cluding lowered LCAT activity, HDL-cholesterol, vitamin E,as well as coenzyme Q10 and paraoxonase 1 activities [9–12,16, 17, 35], and (b) remove and repair lipid hydroperoxidelesions, including glutathione peroxidase, HDL cholesterol,and LCAT [3, 9, 10, 35, 63].
The second major finding of this study is that there aresignificant differences in O&NS pathways between patientswith BPI and depression as well as HCs. Recent meta-analyses show that BD is accompanied by signs of lipid per-oxidation, protein oxidation (as indicated by elevated proteincarbonyl levels), NO production, and increased nitrotyrosinelevels, indicating enhanced nitration [37, 38, 73]. A previousstudy reported higher SOD activity in euthymic BD patients[45], while we established increased SOD1 activity in MDDpatients only. The results of the current study show that pro-tein oxidation (AOPP levels) is significantly increased in pa-tients with BPI and depression as compared with HCs, but thatthe nitro-oxidative pathway from ROS+RNS to MDA forma-tion is less activated in BPI than in MDD. Previously, it wasshown that increased TBARS in BD is a biomarker of acutedepressive and manic episodes and also a possible stage bio-marker of BD [8, 74]. Thus, the inclusion of patients in(partial) remission (this study) may explain the lower MDAlevels in BPI herein observed. Increased protein oxidation waspreviously observed in BD as measured with protein car-bonyls, expressed as C=O contents [38]. Nevertheless, proteincarbonylation (C=O) and formation of AOPP (O=C) are dif-ferent pathways. Protein carbonyls are generated from directprotein carbonylation via the effects of hydrogen peroxides,while an indirect mechanism involves non-oxidative reactionswith oxidized lipids that contain carbonyl radicals and
Table 5 Results of multivariate regression analyses with the HamiltonDepression Rating Scale (HAM-D) score as dependent variable andnumber of depressive episodes, oxidative and nitrosative stress
biomarkers, nicotine dependence, age, sex, body mass index, and yearsof education as explanatory variables
Dependent variables Explanatoryvariables
t p R(model)
F df p
HAM-D No. of depressionepisodes
AOPPMale sexEducation
+ 5.16+ 3.04− 2.43− 2.13
< 0.0010.0030.0170.035
0.322 14.36 4/121 < 0.001
AOPP advanced oxidation protein products
Mol Neurobiol

cleavage of protein backbones as well as α-amidation[75–77]. AOPPs, on the other hand, are generated via in-creased production of ROS and peroxynitrite coupled withincreased myeloperoxidase activity during chlorine stress[42, 76]. The results of the current study suggest that increasedprotein oxidation with generation of AOPPs is associated withBPI and MDD even in (partial) remission, while illness sever-ity seemed to be accompanied by higher AOPP levels.
The third major finding of this study is that patients withBPII show significantly lower SOD1 and LOOH levels andlower zLOOH+SOD+NOx, zLOOH+SOD+NOx+MDA, andzLOOH+SOD+NOX+AOPP scores when compared to allother groups. In addition, BPII patients exhibited lowerAOPP, zLOOH+SOD, zLOOH+SOD+NOx+MDA, andzLOOH+SOD+NOX+AOPP scores as compared to BPI pa-tients and a significantly lower zLOOH+SOD+NOx+MDAscore than HCs. These marked differences among patientswith BPI and BPII in most O&NS pathways measured hereinhave not been previously reported. A previous study foundthat TBARS levels to be significantly increased in BPI andBPII patients compared to controls, while no significant dif-ferences in TBARS between both BD subtypes were observed[8]. These discrepant findings may be explained by differ-ences in study samples regarding phase of illness (acute versuspartial remission). Our results show that the O&NS pathwayfrom ROS production to nitro-oxidative damage is attenuatedin (partially) remitted BPII patients. One hypothesis is thatpatients with BPII could be protected against nitro-oxidativestress or display more adequate removal and repair mecha-nisms of lipid peroxide lesions and that this could explain itsmilder clinical phenotype as compared to BPI. Possible pro-tective and repair mechanisms could be enhanced antioxidantdefenses and better regulation through LCAT or IgM-mediated autoimmune responses [70]. However, no evidenceis available to support this tentative hypothesis. It should bealso noted that our findings are consistent with other levels ofevidence that point to biological differences between BPI andBPII although this remains a relatively unexplored field [78,79].
Another finding is that O&NS pathways in mood disorderscould be modulated by effects of sex, education, and nicotinedependence. Thus, peroxides and AOPP levels and all com-posite scores were significantly higher in males than females.Previously, it was observed that plasma peroxides, but notIgG/IgM responses to oxidized LDL, are significantly greaterin males than females [23] and that males show greater re-sponses in ROS production than females [80]. The currentstudy found that male sex is specifically associated with in-creased lipid hydroperoxide production, while there are nosignificant sex-linked differences in SOD1 or catalase activi-ties. We observed that education is inversely associated withSOD1, the zLOOH+SOD composite score, and MDA forma-tion, suggesting that education has a protective effect on the
generation of ROS, thereby protecting against lipid peroxida-tion and reactive aldehyde production. Such effects may likelybe explained by education resulting in a healthier lifestyle,which may increase protection or repair mechanisms throughfor example nutrition and exercise [81, 82]. Previous studiesreported a strong impact of smoking and nicotine dependenceon different O&NS pathways [83, 84] and that the increasedrisk for development of mood disorders in smokers is in partassociated with smoking-induced oxidative stress pathways[85]. Nevertheless, in the current study, there were only mildassociations between nicotine dependence (mild or severe)and increased LOOH levels, indicating that current smokingmay somewhat increase lipid peroxidation without significanteffects on reactive aldehyde formation and oxidative damageto proteins. Although age is significantly associated with in-creased levels of some, but not all, O&NS pathways andlowered antioxidant enzyme defenses [86, 87], the currentstudy was unable to find relevant associations among ageand the pathways measured herein. One explanation is that astronger impact of diagnosis, sex, and education on O&NSpathways could have blurred the effects of age.
The results of the current study should be interpretedwithinits limitations. Firstly, this is a cross-sectional study, and there-fore, no firm causal inferences can be established. Second, weassayed peripheral biomarkers and the extent to which thesefindings reflect brain alterations remain imprecise.
The current study showed that there is another fundamentalproblem with classifications of mood disorders, which oftenlump both BP types together, while in fact, our results showthat both BPI and BPII may be quite different biological enti-ties, which in addition differ from major depression. Currentpsychiatric nosological diagnoses are heavily debated [88]because mental disorders as defined by the DSM-IV-TR andDSM-5 lack statistical and biological validation [89–91].Most diagnostic categories based on syndromal phenomenol-ogy will soon become a historical footnote [92, 93]. The de-lineation of trans-diagnostic phenotypes as defined in theNIMH Research Domain Criteria (RDoC) system may pro-vide a somewhat better outcome [88, 94]. More specifically,physiosomatic symptoms have emerged as a new phenotypeand the identification of this construct across mood disordersas well as somatizing and psychotic disorders has aided in theidentification of more precise diagnostic biomarkers, includ-ing activated nitro-oxidative pathways [91, 95, 96].Nevertheless, both consensus-based DSM classifications andthe RDoC system miss our point that (a) classifications ofpsychiatric phenomenology should be derived from patternrecognition methods including supervised and unsupervisedlearning, which should be used to refute or consolidateexisting classifications and detect new classifications, whichadditionally should be externally validated by biomarkers [91,97], and (b) trans-diagnostic phenotypes should be derived bypattern recognition methods including deep learning to
Mol Neurobiol
discover pathophysiologically delineated endophenotypes[96, 98]. Nevertheless, the sample size of the current studydid not allow the conduction of unsupervised machine learn-ing analyses in order to provide a more accurate indication ofthe possible clinical utility of the biomarkers herein measuredas a means to aid in the differentiation of mood disorders or todetect relevant endophenotypes.
In conclusion, the current study indicates that alterations inspecific nitro-oxidative pathways may differ among depres-sion, BPI, and BPII. If replicated, these findings open relevantperspectives including the development of a panel of bio-markers that could aid in the differentiation of mood disorders.Furthermore, future studies should explore possible differ-ences in mood disorders in other biomarkers related toO&NS including but not limited to myeloperoxidase, iNOSactivity, protein carbonyls, and IgM-mediated autoimmuneresponses to oxidatively formed neopitopes.
Acknowledgements The authors wish to thank the Centre of Approachand Treatment for Smokers, Psychiatric Unit at UEL, Clinical Laboratoryof the University Hospital and Laboratory of Research and GraduateCollege Hospital (LPG), Brazil.
Author Contributions All authors contributed to the writing up of thepaper. The work was designed by SOVN, MM, DSB, and HOV. Datawere collected by SOVN and HOV. Laboratory analyses were conductedby KLB, NRM, and DSB. Statistics were performed by MM. AFC re-vised the manuscript and provided relevant intellectual content. All au-thors revised and approved the final draft.
Funding This study was supported by Health Sciences PostgraduateProgram at Londrina State University, Parana, Brazil (UEL), andMinistry for Science and Technology of Brazil (CNPq). CNPq number470344/2013-0 and CNPq number 465928/2014-5. MM is supported bya CNPq - PVE fellowship and the Health Sciences Graduate Programfellowship, State University of Londrina.
References
1. Maes M (1993) A review on the acute phase response in majordepression. Rev Neurosci 4(4):407–416
2. Maes M (2008) The cytokine hypothesis of depression: inflamma-tion, oxidative & nitrosative stress (IO&NS) and leaky gut as newtargets for adjunctive treatments in depression. Neuro EndocrinolLett 29(3):287–291
3. Maes M, Galecki P, Chang YS, Berk M (2011) A review on theoxidative and nitrosative stress (O&NS) pathways in major depres-sion and their possible contribution to the (neuro)degenerative pro-cesses in that illness. Prog Neuro-Psychopharmacol Biol Psychiatry35(3):676–692
4. Berk M, Kapczinski F, Andreazza AC, Dean OM, Giorlando F,Maes M, Yücel M, Gama CS et al (2011) Pathways underlyingneuroprogression in bipolar disorder: focus on inflammation, oxi-dative stress and neurotrophic factors. Neurosci Biobehav Rev35(3):804–817
5. Moylan S, Berk M, Dean OM, Samuni Y, Williams LJ, O'Neil A,Hayley AC, Pasco JA et al (2014) Oxidative & nitrosative stress indepression: why so much stress? Neurosci Biobehav Rev 45:46–62
6. Köhler CA, Freitas TH, Maes M, de Andrade NQ, Liu CS,Fernandes BS, Stubbs B, Solmi M et al (2017) Peripheral cytokineand chemokine alterations in depression: a meta-analysis of 82studies. Acta Psychiatr Scand 135(5):373–387
7. Köhler CA, Freitas TH, Stubbs B, Maes M, Solmi M, Veronese N,de Andrade NQ, Morris G et al (2017) Peripheral alterations incytokine and chemokine levels after antidepressant drug treatmentfor major depressive disorder: systematic review andmeta-analysis.Mol Neurobiol. https://doi.org/10.1007/s12035-017-0632-1Review
8. Sowa-Kućma M, Styczeń K, Siwek M, Misztak P, Nowak RJ,Dudek D, Rybakowski JK, Nowak G et al (2018) Are there differ-ences in lipid peroxidation and immune biomarkers between majordepression and bipolar disorder: Effects of melancholia, atypicaldepression, severity of illness, episode number, suicidal ideationand prior suicide attempts. Prog Neuro-Psychopharmacol BiolPsychiatry 81:372–383
9. Maes M, Delanghe J, Meltzer HY, Scharpé S, D'Hondt P, Cosyns P(1994) Lower degree of esterification of serum cholesterol in de-pression: relevance for depression and suicide research. ActaPsychiatr Scand 90(4):252–258
10. Maes M, Smith R, Christophe A, Vandoolaeghe E, Van Gastel A,Neels H, Demedts P, Wauters A et al (1997) Lower serum high-density lipoprotein cholesterol (HDL-C) in major depression and indepressed men with serious suicidal attempts: relationship withimmune-inflammatory markers. Acta Psychiatr Scand 95(3):212–221
11. Maes M, De Vos N, Pioli R, Demedts P, Wauters A, Neels H,Christophe A (2000) Lower serum vitamin E concentrations inmajor depression. Another marker of lowered antioxidant defensesin that illness. J Affect Disord 58(3):241–246
12. Maes M, Mihaylova I, Kubera M, Uytterhoeven M, Vrydags N,Bosmans E (2009) Lower plasma coenzyme Q10 in depression: amarker for treatment resistance and chronic fatigue in depressionand a risk factor to cardiovascular disorder in that illness. NeuroEndocrinol Lett 30(4):462–469
13. Sobczak S, Honig A, Christophe A, Maes M, Helsdingen RW, DeVriese SA, Riedel WJ (2004) Lower high-density lipoprotein cho-lesterol and increased omega-6 polyunsaturated fatty acids in first-degree relatives of bipolar patients. Psychol Med 34(1):103–112
14. Tsuboi H, Tatsumi A, Yamamoto K, Kobayashi F, Shimoi K,Kinae N (2006) Possible connections among job stress, depres-sive symptoms, lipid modulation and antioxidants. J AffectDisord 91(1):63–70
15. Bortolasci CC, Vargas HO, Souza-Nogueira A, Barbosa DS,Moreira EG, Nunes SO, Berk M, Dodd S et al (2014) Loweredplasma paraoxonase (PON)1 activity is a trait marker of majordepression and PON1 Q192R gene polymorphism-smoking inter-actions differentially predict the odds of major depression and bi-polar disorder. J Affect Disord 159:23–30
16. Nunes SO, Piccoli de Melo LG, Pizzo de Castro MR, Barbosa DS,Vargas HO, Berk M, Maes M (2015) Atherogenic index of plasmaand atherogenic coefficient are increased in major depression andbipolar disorder, especially when comorbid with tobacco use disor-der. J Affect Disord 172:55–62
17. Moreira EG, Correia DG, Bonifácio KL, Moraes JB, CavicchioliFL, Nunes CS, Nunes SOV, Vargas HO et al (2017) Lowered PON1activities are strongly associated with depression and bipolar disor-der, recurrence of (hypo)mania and depression, increased disabilityand lowered quality of life. World J Biol Psychiatry 30:1–13
18. PeetM,Murphy B, Shay J, Horrobin D (1998) Depletion of omega-3 fatty acid levels in red blood cell membranes of depressive pa-tients. Biol Psychiatry 43(5):315–319
19. Maes M, Smith R, Christophe A, Cosyns P, Desnyder R, Meltzer H(1996) Fatty acid composition in major depression: decreased ome-ga 3 fractions in cholesteryl esters and increased C20: 4 omega
Mol Neurobiol
6/C20:5 omega 3 ratio in cholesteryl esters and phospholipids. JAffect Disord 38(1):35–46
20. Maes M, Christophe A, Delanghe J, Altamura C, Neels H, MeltzerHY (1999) Lowered omega3 polyunsaturated fatty acids in serumphospholipids and cholesteryl esters of depressed patients.Psychiatry Res 85(3):275–291
21. Bilici M, Efe H, Köroğlu MA, Uydu HA, Bekaroğlu M, Değer O(2001) Antioxidative enzyme activities and lipid peroxidation inmajor depression: alterations by antidepressant treatments. JAffect Disord 64(1):43–51
22. Maes M, Mihaylova I, Leunis JC (2007) Increased serum IgMantibodies directed against phosphatidyl inositol (Pi) in chronicfatigue syndrome (CFS) and major depression: evidence that anIgM-mediated immune response against Pi is one factor underpin-ning the comorbidity between both CFS and depression. NeuroEndocrinol Lett 28(6):861–867
23. Maes M, Mihaylova I, Kubera M, Uytterhoeven M, Vrydags N,Bosmans E (2010) Increased plasma peroxides and serum oxidizedlow density lipoprotein antibodies inmajor depression:markers thatfurther explain the higher incidence of neurodegeneration and cor-onary artery disease. J Affect Disord 125(1–3):287–294
24. Maes M, Mihaylova I, Kubera M, Leunis JC, Geffard M (2011)IgM-mediated autoimmune responses directed against multipleneoepitopes in depression: new pathways that underpin the inflam-matory and neuroprogressive pathophysiology. J Affect Disord135(1–3):414–418
25. MaesM, KuberaM,Mihaylova I, GeffardM, Galecki P, Leunis JC,Berk M (2013) Increased autoimmune responses against auto-epitopes modified by oxidative and nitrosative damage in depres-sion: implications for the pathways to chronic depression andneuroprogression. J Affect Disord 149(1–3):23–29
26. Khanzode SD, Dakhale GN, Khanzode SS, Saoji A, Palasodkar R(2003) Oxidative damage and major depression: the potential anti-oxidant action of selective serotonin re-uptake inhibitors. RedoxRep 8(6):365–370
27. Ozcan ME, Gulec M, Ozerol E, Polat R, Akyol O (2004)Antioxidant enzyme activities and oxidative stress in affective dis-orders. Int Clin Psychopharmacol 19(2):89–95
28. Sarandol A, Sarandol E, Eker SS, Erdinc S, Vatansever E, Kirli S(2007) Major depressive disorder is accompanied with oxidativestress: short-term antidepressant treatment does not alteroxidative-antioxidative systems. Hum Psychopharmacol 22(2):67–73
29. Maes M, Kubera M, Leunis JC, Berk M, Geffard M, Bosmans E(2013) In depression, bacterial translocation may drive inflamma-tory responses, oxidative and nitrosative stress (O&NS), and auto-immune responses directed against O&NS-damaged neoepitopes.Acta Psychiatr Scand 127(5):344–354
30. Ranjekar PK, Hinge A, HegdeMV, Ghate M, Kale A, Sitasawad S,Wagh UV, Debsikdar VB et al (2003) Decreased antioxidant en-zymes and membrane essential polyunsaturated fatty acids inschizophrenic and bipolar mood disorder patients. Psychiatry Res121(2):109–122
31. Machado-Vieira R, Andreazza AC, Viale CI, Zanatto V, Jr CV, daSilva Vargas R, Kapczinski F, Portela LV et al (2007) Oxidativestress parameters in unmedicated and treated bipolar subjects duringinitial manic episode: a possible role for lithium antioxidant effects.Neurosci Lett 421(1):33–36
32. Kunz M, Gama CS, Andreazza AC, Salvador M, Ceresér KM,Gomes FA, Belmonte-de-Abreu PS, Berk M et al (2008) Elevatedserum superoxide dismutase and thiobarbituric acid reactive sub-stances in different phases of bipolar disorder and in schizophrenia.Prog Neuro-Psychopharmacol Biol Psychiatry 32(7):1677–1681
33. Bengesser SA, Lackner N, Birner A, Fellendorf FT, Platzer M,Mitteregger A, Unterweger R, Reininghaus B et al (2015)Peripheral markers of oxidative stress and antioxidative defense in
euthymia of bipolar disorder—gender and obesity effects. J AffectDisord 172:367–374
34. Chowdhury MI, Hasan M, Islam MS, Sarwar MS, Amin MN,Uddin SM, Rahaman MZ, Banik S et al (2017) Elevated serumMDA and depleted non-enzymatic antioxidants, macro-mineralsand trace elements are associated with bipolar disorder. J TraceElem Med Biol 39:162–168
35. Liu T, Zhong S, Liao X, Chen J, He T, Lai S, Jia Y (2015) A meta-analysis of oxidative stress markers in depression. PLoS One10(10):e0138904
36. Mazereeuw G, Herrmann N, Andreazza AC, Khan MM, LanctôtKL (2015) A meta-analysis of lipid peroxidation markers in majordepression. Neuropsychiatr Dis Treat 11:2479–2491
37. Andreazza AC, Kauer-Sant'anna M, Frey BN, Bond DJ,Kapczinski F, Young LT, Yatham LN (2008) Oxidative stressmarkers in bipolar disorder: a meta-analysis. J Affect Disord111(2–3):135–144
38. Brown NC, Andreazza AC, Young LT (2014) An updated meta-analysis of oxidative stress markers in bipolar disorder. PsychiatryRes 218(1–2):61–68
39. Maes M, Meltzer HY, Bosmans E, Bergmans R, Vandoolaeghe E,Ranjan R, Desnyder R (1995) Increased plasma concentrations ofinterleukin-6, soluble interleukin-6, soluble interleukin-2 and trans-ferrin receptor in major depression. J Affect Disord 34(4):301–309
40. Gomes C, Martinho FC, Barbosa DS, Antunes LS, Póvoa HCC,Baltus THL, Morelli NR, Vargas HO et al (2017) Increased rootcanal endotoxin levels are associated with chronic apical periodon-titis, increased oxidative and nitrosative stress, major depression,severity of depression, and a lowered quality of life. MolNeurobiol. https://doi.org/10.1007/s12035-017-0545-z
41. Roomruangwong C, Barbosa DS, Matsumoto AK, Nogueira AS,Kanchanatawan B, Sirivichayakul S, Carvalho AF, Duleu S et al(2017) Activated neuro-oxidative and neuro-nitrosative pathways atthe end of term are associated with inflammation and physio-somatic and depression symptoms, while predicting outcome char-acteristics in mother and baby. J Affect Disord 223:49–58
42. Marsche G, Frank S, Hrzenjak A, Holzer M, Dirnberger S,Wadsack C, Scharnagl H, Stojakovic T et al (2009) Plasma-advanced oxidation protein products are potent high-density lipo-protein receptor antagonists in vivo. Circ Res 104(6):750–757
43. Gałecki P, Gałecka E, Maes M, Chamielec M, Orzechowska A,Bobińska K, Lewiński A, Szemraj J (2012) The expression of genesencoding for COX-2, MPO, iNOS, and sPLA2-IIA in patients withrecurrent depressive disorder. J Affect Disord 138(3):360–366
44. Morris G, Berk M, Klein H, Walder K, Galecki P, Maes M (2017)Nitrosative stress, hypernitrosylation, and autoimmune responses tonitrosylated proteins: new pathways in neuroprogressive disordersincluding depression and chronic fatigue syndrome. Mol Neurobiol54(6):4271–4291
45. Savas HA, Gergerlioglu HS, Armutcu F, Herken H, Yilmaz HR,Kocoglu E, Selek S, Tutkun H et al (2006) Elevated serum nitricoxide and superoxide dismutase in euthymic bipolar patients: im-pact of past episodes. World J Biol Psychiatry 7(1):51–55
46. Maes M, Yirmyia R, Noraberg J, Brene S, Hibbeln J, Perini G,Kubera M, Bob P et al (2009) The inflammatory & neurodegener-ative (I&ND) hypothesis of depression: leads for future researchand new drug developments in depression. Metab Brain Dis24(1):27–53
47. Del-Ben CM, Vilela JAA, Crippa JAS, Hallak JEC, Labate CMet al (2001) Confiabilidade da "Entrevista Clínica Estruturada parao DSM-IV - Versão Clínica" traduzida para o português. Rev BrasPsiquiatr 23:156–159
48. American Psychiatric Association (2000) Diagnostic and statisticalmanual of mental disorders, 4th ed., Text Revision edn. Author,Washington, DC
Mol Neurobiol

49. Moreno RA, Moreno DH (1998) Escalas de depressao deMontgomery & Asberg (MADRS) e de Hamilton (HAM-D) /Hamilton and Montgomery & Asberg depression rating scales.Rev Psiquiatr Clín 25:262–272
50. Vilela JA, Crippa JA, Del-Ben CM, Loureiro SR (2005) Reliabilityand validity of a Portuguese version of the Young Mania RatingScale. Braz J Med Biol Res 38(9):1429–1439
51. WHO ASSIST Working Group (2002) The Alcohol, Smoking andSubstance Involvement Screening Test (ASSIST): development,reliability and feasibility. Addiction 97:1183–1194
52. Henrique IFS, De Micheli D, Lacerda RB, Lacerda LA, FormigoniMLOS (2004) Validação da versão brasileira do teste de triagem doenvolvimento com álcool, cigarro e outras substâncias (ASSIST).Rev Assoc Med Bras 5:199–206
53. Heatherton TF, Kozlowski LT, Frecker RC, Fagerström KO (1991)The Fagerström test for nicotine dependence: a revision of theFagerström tolerance questionnaire. Br J Addict 86(9):1119–1127
54. de Meneses-Gaya C, Zuardi AW, de Azevedo Marques JM, SouzaRM, Loureiro SR, Crippa JA (2009) Psychometric qualities of theBrazilian versions of the Fagerström Test for Nicotine Dependenceand the Heaviness of Smoking Index. Nicotine Tob Res 11(10):1160–1165
55. Alberti KG, Zimmet P, Shaw J (2006) Metabolic syndrome—a newworld-wide definition. A consensus statement from theInternational Diabetes Federation. Diabet Med 23(5):469–480
56. Marklund S, Marklund G (1974) Involvement of the superoxidedismutase anion radical in the autoxidation of pyrogallol and aconvenient assay for superoxide dismutase. Eur J Biochem 47:469–471
57. Gonzalez Flecha B, Llesuy S, Boveris A (1991) Hydroperoxide-initiated chemiluminescence: An assay for oxidative stress in biop-sies of heart, liver, and muscle. Free Radic Biol Med 10:93–100
58. Panis C, Herrera ACSA, Victorino VJ, Campos FC, Freitas LF, DeRossi T, Colado Simao AN, Cecchini AL et al (2012) Oxidativestress and hematological profiles of advanced breast cancer patientssubjected to paclitaxel or doxorubicin chemotherapy. Breast CancerRes Treat 133:89–97
59. Navarro-Gonzalvez JA, Garcia-Benayas C, Arenas J (1998)Semiautomated measurement of nitrate in biological fluids. ClinChem 44:679–681
60. Bastos AS, Loureiro AP, de Oliveira TF, Corbi SC, Caminaga RM,Junior CR, Orrico SR (2012) Quantitation of malondialdehyde ingingival crevicular fluid by a high-performance liquidchromatography-based method. Anal Biochem 423:141–146
61. Hanasand M, Omdal R, Norheim KB, Gransson LG, Brede C,Jonsson G (2012) Improved detection of advanced oxidation pro-tein products in plasma. Clin Chim Acta 413:901–906
62. Hayyan M, Hashim MA, AlNashef IM (2016) Superoxide ion:generation and chemical implications. Chem Rev 116(5):3029–3085
63. Girotti AW (1998) Lipid hydroperoxide generation, turnover, andeffector action in biological systems. J Lipid Res 39(8):1529–1542
64. Pacher P, Beckman JS, Liaudet L (2007) Nitric oxide andperoxynitrite in health and disease. Physiol Rev 87(1):315–424
65. Benjamini Y, Hochberg Y (1995) Controlling the false discoveryrate: a practical and powerful approach to multiple testing. J R StatSoc Ser B Methodol 57:289–300
66. Fukai T, Ushio-Fukai M (2011) Superoxide dismutases: role inredox signaling, vascular function, and diseases. Antioxid RedoxSignal 15(6):1583–1606
67. McCord JM, Edeas MA (2005) SOD, oxidative stress and humanpathologies: a brief history and a future vision. BiomedPharmacother 59(4):139–142
68. Harris ED (1992) Copper as a cofactor and regulator of copper, zincsuperoxide dismutase. J Nutr 122(3 Suppl):636–640
69. Terrazzano G, Rubino V, Damiano S, Sasso A, Petrozziello T, UcciV, Palatucci AT, Giovazzino A et al (2014) Ruggiero G (2014) Tcell activation induces CuZn superoxide dismutase (SOD)-1 intra-cellular re-localization, production and secretion. Biochim BiophysActa 1843(2):265–274
70. Roomruangwong C, Barbosa DS, de Farias CC, Matsumoto AK,Baltus THL, Morelli NR, Kanchanatawan B, Duleu S et al (2017)Natural regulatory IgM-mediated autoimmune responses directedagainst malondialdehyde regulate oxidative and nitrosative path-ways and coupled with IgM responses to nitroso-adducts attenuatedepressive and physiosomatic symptoms at the end of term preg-nancy. Psychiatry Clin Neurosci. https://doi.org/10.1111/pcn.12625
71. Kudlow P, Cha DS, Carvalho AF, McIntyre RS (2016) Nitric oxideand major depressive disorder: pathophysiology and treatment im-plications. Curr Mol Med 16(2):206–215
72. Morris G, Walder K, Carvalho AF, Tye SJ, Lucas K, Berk M, MaesM (2018) The role of hypernitrosylation in the pathogenesis andpathophysiology of neuroprogressive diseases. Neurosci BiobehavRev 84:453–469
73. Goldsmith DR, Rapaport MH, Miller BJ (2016) A meta-analysis ofblood cytokine network alterations in psychiatric patients: compar-isons between schizophrenia, bipolar disorder and depression. MolPsychiatry 21(12):1696–1709
74. Siwek M, Sowa-Kućma M, Styczeń K, Misztak P, Nowak RJ,Szewczyk B, Dudek D, Rybakowski JK et al (2017) Associationsof serum cytokine receptor levels with melancholia, staging of ill-ness, depressive and manic phases, and severity of depression inbipolar disorder. Mol Neurobiol 54(8):5883–5893
75. Dalle-Donne I, Giustarini D, Colombo R, Rossi R, Milzani A(2003) Protein carbonylation in human diseases. Trends Mol Med9(4):169–176
76. Gryszczyńska B, Formanowicz D, Budzyń M, Wanic-KossowskaM, Pawliczak E, Formanowicz P, Majewski W, Strzyżewski KWet al (2017) Advanced oxidation protein products and carbonylatedproteins as biomarkers of oxidative stress in selectedatherosclerosis-mediated diseases. Biomed Res Int 2017:4975264
77. Grimsrud PA, Xie H, Griffin TJ, Bernlohr DA (2008) Oxidativestress and covalent modification of protein with bioactive alde-hydes. J Biol Chem 283(32):21837–21841
78. Lu YA, Lee SY, Chen SL, Chen SH, Chu CH, Tzeng NS, HuangSY, Kuo PH et al (2012) Gene-temperament interactions mightdistinguish between bipolar I and bipolar II disorders: a cross-sectional survey of Han Chinese in Taiwan. J Clin Psychiatry73(3):339–345
79. Caseras X, Lawrence NS,MurphyK,Wise RG, PhillipsML (2013)Ventral striatum activity in response to reward: differences betweenbipolar I and II disorders. Am J Psychiatry 170(5):533–541
80. Katalinic V, Modun D, Music I, Boban M (2005) Gender differ-ences in antioxidant capacity of rat tissues determined by 2,2′-azinobis (3-ethylbenzothiazoline 6-sulfonate; ABTS) and ferric re-ducing antioxidant power (FRAP) assays. Comp Biochem PhysiolPart C Toxicol Pharmacol 140(1):47–52
81. Lobo V, Patil A, Phatak A, Chandra N (2010) Free radicals, anti-oxidants and functional foods: Impact on human health.Pharmacogn Rev 4(8):118–126
82. Moylan S, Eyre HA,MaesM, Baune BT, Jacka FN, Berk M (2013)Exercising the worry away: how inflammation, oxidative and nitro-gen stress mediates the beneficial effect of physical activity onanxiety disorder symptoms and behaviours. Neurosci BiobehavRev 37(4):573–584
83. van der Vaart H, Postma DS, Timens W, ten Hacken NH (2004)Acute effects of cigarette smoke on inflammation and oxidativestress: a review. Thorax 59(8):713–721
84. Donohue JF (2006) Ageing, smoking and oxidative stress. Thorax61(6):461–462
Mol Neurobiol
85. Nunes SO, Vargas HO, Prado E, Barbosa DS, de Melo LP, MoylanS, Dodd S, Berk M (2013) The shared role of oxidative stress andinflammation in major depressive disorder and nicotine depen-dence. Neurosci Biobehav Rev 37(8):1336–1345
86. Andriollo-Sanchez M, Hininger-Favier I, Meunier N, Venneria E,O'Connor JM, Maiani G, Coudray C, Roussel AM (2005) Age-related oxidative stress and antioxidant parameters in middle-agedand older European subjects: the ZENITH study. Eur J Clin Nutr59(Suppl 2):S58–S62
87. Romano AD, Serviddio G, deMatthaeis A, Bellanti F, Vendemiale G(2010) Oxidative stress and aging. J Nephrol 23(Suppl 15):S29–S36
88. Zachar P, Stoyanov DS, Aragona M, Jablensky A (eds) (2014)Alternative perspectives on psychiatric validation: DSM, ICD,RDoC, and Beyond. OUP, Oxford
89. Maes M, Schotte C, Maes L, Cosyns P (1990) Clinical subtypes ofunipolar depression: Part II. Quantitative and qualitative clinicaldifferences between the vital and nonvital depression groups.Psychiatry Res 34(1):43–57
90. Maes M, Cosyns P, Maes L, D'Hondt P, Schotte C (1990) Clinicalsubtypes of unipolar depression: Part I. Avalidation of the vital andnonvital clusters. Psychiatry Res 34(1):29–41
91. Kanchanatawan B, Sriswasdi S, Thika S, Sirivichayakul S,Carvalho AF, Geffard M, Kubera M, Maes M (2018) Deficitschizophrenia is a discrete diagnostic category defined by neuro-immune and neurocognitive features: results of supervised machinelearning. Metab Brain Dis. https://doi.org/10.1007/s11011-018-0208-4
92. Loscalzo J, Kohane I, Barabasi AL (2007) Human disease classifi-cation in the postgenomic era: a complex systems approach to hu-man pathobiology. Mol Syst Biol 3:124
93. MaesM, Nowak G, Caso JR, Leza JC, Song C, KuberaM, Klein H,Galecki P et al (2016) Toward omics-based, systems biomedicine,and path and drug discovery methodologies for depression-inflammation research. Mol Neurobiol 53(5):2927–2935
94. Kendler KS, Parnas J (eds) (2015) Philosophical issues in psychia-try: explanation, phenomenology, and nosology. JHU Press,Baltimore
95. MaesM,Galecki P, Verkerk R, RiefW (2011) Somatization, but notdepression, is characterized by disorders in the tryptophan catabo-lite (TRYCAT) pathway, indicating increased indoleamine 2,3-dioxygenase and lowered kynurenine aminotransferase activity.Neuro Endocrinol Lett 32(3):264–273
96. Maes M, Rief W (2012) Diagnostic classifications in depressionand somatization should include biomarkers, such as disorders inthe tryptophan catabolite (TRYCAT) pathway. Psychiatry Res196(2–3):243–249
97. Maes M, Maes L, Schotte C, Vandewoude M, Martin M, D'HondtP, Blockx P, Scharpé S et al (1990) Clinical subtypes of unipolardepression: Part III. Quantitative differences in various biologicalmarkers between the cluster-analytically generated nonvital andvital depression classes. Psychiatry Res 34(1):59–75
98. Kanchanatawan B, Thika S, Sirivichayakul S, Carvalho AF,Geffard M, Maes M (2018) In Schizophrenia, depression, anxiety,and physiosomatic symptoms are strongly related to psychoticsymptoms and excitation, impairments in episodic memory, andincreased production of neurotoxic tryptophan catabolites: a multi-variate and machine learning study. Neurotox Res. https://doi.org/10.1007/s12640-018-9868-4
Mol Neurobiol