magnitude and determinants of the ratio between
TRANSCRIPT
Univers
ity of
Cap
e Tow
n
Magnitude and Determinants of the Ratio between
Prevalences of Low vision and Blindness in Rapid
Assessment of Avoidable Blindness Surveys
by
DINESH KAPHLE
KPHDIN001
SUBMITTED TO THE UNIVERSITY OF CAPE TOWN
In partial fulfilment of the requirements of the degree
Masters of Public Health (Community Eye Health)
Faculty of Health Sciences
University of Cape Town
Date of submission: 15 March 2016
Supervisor: Prof Susan Lewallen
Division of Ophthalmology, University of Cape Town

The copyright of this thesis vests in the author. No quotation from it or information derived from it is to be published without full acknowledgement of the source. The thesis is to be used for private study or non-commercial research purposes only.
Published by the University of Cape Town (UCT) in terms of the non-exclusive license granted to UCT by the author.
Univers
ity of
Cap
e Tow
n


ACKNOWLEDGEMENTS
1. Prof Susan Lewallen (Supervisor): This mini-dissertation would not have been
possible without the guidance and timely feedback from my supervisor. I am also
grateful to her for assisting me to obtain the Rapid Assessment of Avoidable
Blindness reports which were not available in the repository as well as getting the
permission from the Principal Investigators of the surveys.
2. Professor Colin Cook (Course Convenor): I am thankful to Professor Cook for his
encouragement throughout the study period and particularly for ethical approval.
3. Professor Paul Courtright (Lecturer): My sincere thanks to Professor Courtright for
helping me to select the research topic for the mini-dissertation. In addition, he also
helped to obtain the permission from principal investigator to use a RAAB report.
4. Mr Jordache Ramjith (Lecturer /Biostatistician): I would like to acknowledge Mr
Ramjith for guiding me in the statistical analysis.
5. Karis Moxley (Writing Consultant): I am thankful to Karis Moxley for helping me to
organise the structure and flow of the literature review.
6. Mary Shelton (Senior Reference Librarian): My thanks to Mary Shelton for guiding
me during the literature search.
7. Ms Petra Adams (Programme Administrator): I would like to thank Petra for
assisting me in administrative tasks throughout the study period.
8. All the Principal Investigators of the Rapid Assessment of Avoidable Blindness
surveys, who provided information upon my request. Particularly, Dr Mohamad
Aziz Salowi (Malaysia-2014), Dr. Rohan Chariwala (Gujarat, India-2011), Tawfik
Al-khatib (Lahj, Yemen-2009), Janna Minderhoud (Suriname-2013) and Ala
Paduca (Moldova-2012).
9. Special thanks to my wife, Angela (Reading) Kaphle and my daughter, Anysha
Kaphle, for being supportive and understanding with regards to time management
throughout my study period. Angela also helped to do the proof reading of the
dissertation.
Magnitude and Determinants of the Ratio between
Prevalences of Low vision and Blindness in Rapid
Assessment of Avoidable Blindness Surveys
ABSTRACT
Part A of the dissertation includes the protocol of the study, which was approved by Faculty of Health Sciences Human Research Ethics Committee, University of Cape Town. The study was observational analytical, aiming to determine the magnitude and determinants of the ratio between prevalence of low vision and prevalence of blindness using Rapid Assessment of Avoidable Blindness (RAAB) surveys across World Bank regions. The surveys included in the study were available in the RAAB repository and obtained through permission from the primary investigators. A univariate and multivariate analysis were performed across the regions using the ratio as an outcome variable and potential explanatory variables as follows: prevalence of Uncorrected Refractive Error (URE), Cataract Surgical Coverage (CSC) at visual acuity 3/60, 6/60 and 6/18 for persons, logarithm of Gross Domestic Product (GDP) per capita and health expenditure per capita.
Part B contains the structured literature review. PubMed, Scopus, EBSCOHOST (Africa wide and MEDLINE) and Web of Science databases were used to search for literature using the following key words: rapid assessment, blindness, age-related
cataract, uncorrected refractive error, low vision, visual impairment, avoidable OR
curable OR preventable OR treatable. The summary of the literature review in addition to the gap in the literature is presented in the section.
Part C includes a journal manuscript, which includes methodology and results of the study. The main findings showed that the ratio between prevalence of low vison and prevalence of blindness ranged from 1.35 in Mozambique to 11.03 in India with a median value of 3.90. There was a statistically significant variation of the ratio across the regions: approximately 7.0 in South Asia and approximately 3.0 in Sub-Saharan Africa (χ²=28.23, p<0.001). The variables: prevalence of URE, CSC at visual acuity 3/60, 6/60 and 6/18 for persons, logarithm of GDP per capita and logarithm of health expenditure per capita were found to be statistically significantly associated with the ratio with univariate analysis. However, only prevalence of URE and CSC at 3/60 for persons across the regions were found statistically significant in multivariate analysis.
Part D comprised of appendices used in the mini-dissertation.

Part A: Protocol
Part A: Protocol 2
TABLE OF CONTENTS
List of Abbreviations……………………………………………………………..……..….3
Protocol Synopsis…………………………………………………………………………..4
1. Purpose of the Study……………………………………………………………………7
1.1 Aim and Objectives…………………………………………..…………..…………7
2. Background………………………………………………………………………………8
3. Methodology...………………………………………………………………………….14
3.1 Study Design……………………………………………………………………….14
3.2 Sample Size………………………………………………………………………..14
3.3 Inclusion Criteria….........................................................................................15
3.4 Exclusion Criteria………………………………………………………………….15
3.5 Research Procedures and Data Collection Methods….................................15
3.6 Data Analysis………………………………………………………………………17
3.7 Ethical Approval……………………………………………………………….…..18
3.8 Risks………………………….…………………………………………………….18
3.9 Potential Benefits………………………………………………………………….18
3.10 Informed Consent………………………………………………………………..20
3.11 Privacy and Confidentiality……………………………………………………...20
3.12 Dissemination of the Results…………………………………………………...20
3.13 Logistics…………………………………………………………………………..20
4. References…………………………………….…………………………………….....22
Part A: Protocol 3
LIST OF ABBREVIATIONS
CSC: Cataract Surgical Coverage
CSR: Cataract Surgical Rate
EPI: Expanded Program on Immunization
GDP: Gross Domestic Product
IAPB: International Agency for the Prevention of Blindness
RA: Rapid Assessment
RAAB: Rapid Assessment of Avoidable Blindness
RACSS: Rapid Assessment of Cataract Surgical Services
URE: Uncorrected Refractive Error
WB: World Bank
WHO: World Health Organization
Part A: Protocol 4
PROTOCOL SYNOPSIS
Title of the study
Magnitude and Determinants of the Ratio between Prevalences of Low vision and
Blindness in Rapid Assessment of Avoidable Blindness Surveys
Background
A recent systematic review estimated that there were 285 million visually impaired
people in the world: 39 million blind and 246 million low vision in 2010. People aged
50 years and above contributed 65% and 82% of the total visual impairment and
blindness respectively. Uncorrected refractive error (URE) (43%) and cataracts (33%)
were the major causes of visual impairment whereas cataracts (51%) and glaucoma
(8%) were the major causes of blindness. Cataracts are a cause of visual impairment
as well as blindness because immature cataracts cause visual impairment whereas
mature cataracts cause blindness. In addition, more than a billion people have poor
vision because of lack of eye glasses and more than 100 million of them are visually
impaired because of URE globally. It is estimated that 10% of the total URE ultimately
causes visual impairment.
The prevalence of blindness and low vision vary considerably in different
surveys. For instance the prevalence of blindness was as little as 0.7% in Bagmati,
Nepal to 7% in Al Amaran, Yemen. Similarly, the prevalence of low vision varied from
2.5% in Ngozi and Kayanza, Burundi to 22.2% in Binh Dinh, Vietnam.
Part A: Protocol 5
Hypothesis
Our hypothesis is that there is a positive correlation between the ratio of prevalence
of low vision to prevalence of blindness and the prevalence of Uncorrected Refractive
Error in Rapid Assessment of Avoidable Blindness (RAAB) surveys. Prevalence of
URE, which is a major cause of low vision but not of blindness, differs widely in the
world. Therefore we expect that the variation in the ratio of low vision to blindness
might be explained by the difference in prevalence of URE.
Methodology
Design: Observational analytical
Population: Rapid Assessment of Avoidable Blindness Surveys
Sites: Worldwide
Study duration: October 2015 to March 2016
Instrument and methods: The ratio between prevalences of low vision and blindness
is considered as outcome variable. Data on outcome variable along with other
explanatory variables will be extracted from the reports which are available from RAAB
repository website. For RAAB surveys, whose reports are not available in the
repository, a request to send the report will be sent to the Principal Investigator of the
survey. Univariate and Multivariate regression models will be fitted to identify the
determinants of the variation in the ratio.
Aim and Objectives
Aim
The aim of the study is to determine the magnitude of the ratio of prevalences of low
vision to blindness and the determinants of the ratio in the RAAB surveys.
Part A: Protocol 6
Specific objectives
i. To describe the variation in ratios of prevalence of low vision to blindness in
RAAB surveys across different geographical regions.
ii. To measure the relationship between the outcome variable and other potential
explanatory variables including the prevalence of Uncorrected Refractive Error,
Cataract Surgical Coverage as a proxy for service delivery, Gross Domestic
Product per capita and total health expenditure in the RAAB surveys.
iii. To measure the correlation between the outcome variable and the prevalence
of URE in RAAB surveys.
Part A: Protocol 7
STUDY PROTOCOL
1. PURPOSE OF THE STUDY
The hypothesis of the study is that there is a positive correlation between the ratio of
the prevalences of low vision to blindness and the prevalence of Uncorrected
Refractive Error (URE) in Rapid Assessment of Avoidable Blindness (RAAB) surveys.
The reason for this assumption is that any variation in the ratio might be due to
difference in the prevalence of URE among populations. This is because of the fact
that URE is more likely to cause low vision than to cause blindness.
1.1 Aim and Objectives
Aim
The aim of the study is to determine the magnitude of the ratio of prevalences of low
vision to blindness and the determinants of the ratio in the RAAB surveys.
Specific Objectives
i. To describe the variation in ratios of prevalence of low vision to blindness in
RAAB surveys across different geographical regions. The ratio will be
considered as the outcome variable.
ii. To measure the relationship between the outcome variable and other potential
explanatory variables including the prevalence of Uncorrected Refractive
Errors, Cataract Surgical Coverage (CSC) as a proxy for service delivery, Gross
Domestic Product (GDP) per capita and total health expenditure per capita in
the RAAB surveys.
Part A: Protocol 8
iii. To measure the correlation between the outcome variable and the prevalence
of URE in RAAB surveys.
2. BACKGROUND
A systematic review estimated that there were 285 million visually impaired people in
the world in 2010, of which 39 million were blind and 246 million were low vision.1In
addition, more than a billion people have poor vision because of lack of eye glasses
and more than 100 million of them are visually impaired because of Uncorrected
Refractive Error globally.2 It is estimated that there are 1 to 2 billion people with URE
in the world. The figure on URE was projected from the findings of the Blue Mountain
Eye Study (BMES) in Australia which showed that prevalence of URE is 10 times
larger than the prevalence of visual impairment caused by URE.3 It is important to note
that the BMES study defined URE as any amount of refractive error which could be
corrected with spectacles but had not been. However, blindness surveys such as
RAAB surveys defined URE as refractive error which improves from visual acuity of
less than 6/60 to at least 6/18 with the pinhole test.
According to the International Classification of Diseases (ICD)-10th revision4,
blindness is defined as visual acuity of less than 3/60. Moderate Visual Impairment
(MVI) is defined as visual acuity of less than 6/18 but equal to or better than 6/60 and
Severe Visual Impairment (SVI) is defined as visual acuity of less than 6/60 but equal
to or better than 3/60. All acuities are of the available correction in the better eye. In
addition, MVI and SVI are jointly called low vision. It is essential to note that in the field
of vision rehabilitation, the term “low vision” refers to people who have had medical,
spectacle, and surgical corrections and still have vision less than 6/18 but better than
Part A: Protocol 9
light perception. In this study, low vision will be used as the ICD-10 definition.
Furthermore, it is worth noting that none of the definitions mentioned above account
for visual acuity for near visual tasks.
Globally, cataracts (51%) and glaucoma (8%) are the major causes of blindness
whereas Uncorrected Refractive Error (43%) and cataracts (33%) are the major
causes of visual impairment.1 Cataracts are a cause of visual impairment as well as
blindness because immature cataracts cause visual impairment whereas mature
cataracts cause blindness. It was found that people aged 50 years and above
contributed 65% and 82% of the total populations of visual impaired and blind people
respectively in the world.
Until 2005, Rapid Assessment of Cataract Surgical Services (RACSS) survey
was used to assess blindness and visual impairment in Asia, Africa and Latin
America.5, 6 RACSS surveys use multistage cluster sampling to select the participants.
Within a cluster, the households are selected by the “random walk” method in which
households are chosen based on the orientation of the neck of a spun bottle at every
crossing of the streets. People of age 50 years and above living in the house are
interviewed with the questionnaire as well as examined for vision loss. However, there
are mainly two limitations of the RACSS survey method.7 Firstly, as the selection of
households for the eye examination is done using the random walk method, which
involves an individual’s subjective decision to choose the house to be included in the
survey, it is likely to yield selection bias particularly in larger populations. Secondly the
RACSS survey does not account for other causes of vision loss besides cataracts.
Part A: Protocol 10
Rapid Assessment of Avoidable Blindness (RAAB) methodology was
developed after a national blindness survey conducted in the Gambia in 1996. The
national eye survey was performed to estimate the prevalence and distribution of
visual impairment and blindness.8 The results of the countrywide survey were
compared with another survey which was conducted among people of age 50 years
and above.9 The comparison showed that the causes of blindness and visual
impairment among the 50 years and above group was a good indicator of the causes
in the total population. Furthermore, the distribution of causes of severe visual
impairment and moderate visual impairment was similar in both groups except for
refractive error, which was proportionally more important in the total population than
in the 50 years and above.9
Essentially, RAAB is an upgraded and revised version of the RACSS.5 RAAB
provides more standardised methodology and training for examiners so the results are
easily comparable across different surveys.9 Unlike RACSS, RAAB uses the “compact
segment” sampling method which is a random selection of a segment of the population
as a cluster and includes all the households of that segment. The people of age 50
years and above in the households undergo visual acuity measurement, pinhole acuity
assessment if the visual acuity is less than 6/18 and ocular examination with torchlight
and direct ophthalmoscope. The improvement of visual acuity with pinhole is
considered as a proxy for the presence of refractive error.7 The primary focus of RAAB
is on the prevalence of major causes of avoidable blindness, which are: blindness due
to cataracts, refractive errors, trachoma, onchocerciasis, corneal scarring and
posterior segment diseases such as glaucoma. This is in line with the aim of “VISION
2020: The Right to Sight”, which aims to eliminate avoidable blindness by the year
Part A: Protocol 11
2020.10 Furthermore, RAAB surveys are helpful in assessing CSC, identifying the main
barriers to the uptake of cataract surgery and measuring the outcome after cataract
surgery.10
Despite many advantages, RAAB surveys have some limitations. Because the
eye examination is conducted door-to-door, the diagnostic facilities are limited.
Therefore the exact cause of loss of vision may not be identified for posterior segment
diseases such as glaucoma or diabetic retinopathy. Moreover, RAAB only includes
people aged 50 years and above, therefore the prevalence of blindness in people
under 50 years cannot be estimated. In addition, RAAB measures only blindness or
visual impairment and does not assess other non-vision impairing conditions such as
active trachoma, trichiasis and onchocerciasis.10 It also does not assess early signs
of serious eye diseases such as glaucoma which may be present but not yet have
caused severe vision loss in an individual.
The results of the RAAB surveys along with RACSS surveys are available freely
in the RAAB repository website (http://www.raabdata.info/repository/). The purpose of
the repository is to bring the survey findings in to public access so that interested
researchers can utilise them easily. The RAAB repository displays summary tables
which provide data on sample size, coverage of the survey, proportion of total
blindness and low vision and proportion of blindness related to cataract, refractive
error and diabetic retinopathy. Similarly, CSC, outcome of cataract surgeries and
proportion of intraocular lens insertion are available in the summary. Furthermore,
some of the full reports of the surveys are available in the RAAB repository website
while others can be requested from the principal investigators through a built-in
Part A: Protocol 12
request form within the website. The links to the relevant publications of the surveys
are also available in the website.
Comparison of the survey results show that there is a big variation of
prevalence of blindness and low vision across the regions. A recent systematic review
found that prevalence of blindness varies from 0.1% in Uganda to 9% in Eritrea among
Sub-Saharan African countries.11 The variation of prevalence of blindness was
narrower in Latin American countries which ranged from 1.3% in Argentina to 4% in
Peru.7 Similarly, prevalence of low vision varied from 1.6% in Gambia and Uganda to
17.1% in Ghana in Sub-Saharan Africa whereas the variation was 5.9% in Argentina
to 12.5% in Peru in Latin America.7, 11
There is a broad agreement that cataracts and refractive errors are the leading
causes of blindness and visual impairment, hence they should be the priority diseases
for VISION 2020 programs. The simplest way to reduce blindness and visual
impairment related to cataracts is by performing as many cataract surgeries as
possible with good visual outcomes. If Cataract Surgery Rate (CSR), which is the
number of cataract operations performed in a year per one million of the population,
is high, we can assume that the CSC will be high too. Cataract Surgical Coverage,
which is defined as the proportion of people who received surgery among those who
required it, is the indicator used to measure the extent of the cataract surgical need.12
However, the CSR is dependent upon many factors such as age structure of the
population particularly the proportion of people over 50 years of age, visual acuity
threshold at which cataract operation is set to be performed and accessibility and
affordability of the cataract surgery.13
Part A: Protocol 13
Uncorrected Refractive Error is not only the leading cause of visual impairment,
but also a major cause of disability globally which hugely reduces economic
productivity and educational opportunities as well as overall quality of life.2, 14 Even
though provision of eye glasses is a simple, effective and largely affordable remedy
for URE, the majority of people do not benefit from spectacles in low resource settings.
The main barriers identified are awareness about the services, accessibility of the
services and affordability of the spectacles.2 This shows that there is some relationship
between visual impairment and the economic status of the country.
In addition, it is found that the prevalence of blindness is associated with the
economy of the country. For instance, the estimated prevalence of blindness is 0.25%
in high income countries, whereas the prevalences are 0.50%, 0.75% and more than
1.0% in middle, low and very low income countries respectively.15
The World Health Organization (WHO) estimated the prevalence of low vision
based on the prevalence of blindness for the VISION 2020 programs. For adults, the
prevalence of low vision is estimated to be three to four times the prevalence of
blindness. However, a study of 27 RAAB surveys in 19 Sub-Saharan African countries
found that the ratio between the prevalences of low vision and blindness varied from
1.3 to 6.3.16 The study recommended further research to explore the determinants of
the wide variation.
To the best of our knowledge, there is no evidence on the distribution of the
ratio of prevalences of low vision to blindness in other geographical regions. Therefore,
this study is proposed to find the magnitude and the determinants of the ratio between
Part A: Protocol 14
prevalence of low vision and prevalence of blindness in all the RAAB surveys.
Describing the variation among a larger number of surveys from a wider geographical
area and examining whether it is correlated with the prevalence of URE would
enhance understanding of the epidemiology of visual impairment and blindness
globally and possibly provide a useful indicator for where URE needs to be targeted.
3. METHODOLOGY
3.1 Study Design
The study design will be observational analytical. A retrospective secondary analysis
of cross-sectional survey data will be performed from the previously performed
population based RAAB studies. A pilot study will be conducted including 10 RAAB
surveys to validate the data collection tools.
3.2 Sample Size
In order to calculate a sample size we considered the question of whether the
correlation coefficient between the outcome variable (ratio) and the prevalence of URE
in the populations differs from zero. We wanted to show a correlation coefficient (r) of
0.3 and we used the formula below.17
N= [(Zα +Zβ) ÷C] 2 +3
where
r= expected correlation coefficient
C=0.5 X ln [(1+r) / (1-r)]
N=Total number of subjects required
For a β of 0.2 and a two sided α of 0.01, the sample size we need would be 67 studies.
Part A: Protocol 15
Out of a total of 156 RAAB surveys available in the repository website (as of 10
February, 2016), the reports for 66 surveys are downloadable. The request to send
the reports will be sent to 90 remaining surveys using the request report link of the
repository. The surveys which meet the inclusion criteria and have accessible full
reports will be included in the study.
3.3 Inclusion Criteria
RAAB survey will be included in the study if;
o The coverage of the primary survey was at least 80% of the sample size selected.
o The standard RAAB reports are available in the website or the reports are received
through a built in “Request Report” feature of the website.
3.4 Exclusion Criteria
o If there is more than one survey conducted for the same region, the latest survey
will be used for the analysis.
o Surveys which have missing data for the study variables.
3.5 Research Procedures and Data Collection Methods
All RAAB surveys follow the standard RAAB examination methodology. Each
participant undergoes eye examination in each eye with visual acuity graded into 6
categorises (≥6/18 to no light perception). Visual acuity is measured using a Snellen
tumbling ’E’ chart with an optotype of size 6/18 and 6/36 on either side at 6 metres (or
3 metres distance if required) in daylight with best available correction. When
presenting visual acuity is less than 6/18 in either eye, visual acuity is measured with
a pinhole. Primary cause of visual impairment is recorded as refractive error if the
Part A: Protocol 16
visual acuity improved to at least 6/18 with a pinhole. In cases in which visual acuity
does not improve with a pin-hole, further examination is performed by an
ophthalmologist or ophthalmic clinical officer.
Whenever multiple causes of visual impairment are observed, the most
treatable or preventable condition is recorded as the primary cause of vision loss. For
example if a person has refractive error and cataract, refractive error is recorded as
the primary cause. Similarly if a person has cataract and glaucoma, cataract is
recorded as the primary cause. The RAAB data are initially recorded on standard
forms before being transferred into RAAB software (version 4.02 software, 2007,
International Centre for Eye Health, UK). Crude, age-adjusted prevalences and
causes of blindness and visual impairment are calculated using the RAAB software.
All completed RAAB survey results are made available on the RAAB repository
website; http://www.raabdata.info/repository/.
The Principal Investigator (PI) will assess the eligibility criteria of 156 RAAB
surveys. The surveys which meet the inclusion criteria will be identified using the
inclusion criteria checklist (Appendix 1). The full reports of the identified surveys will
be downloaded, if available from the website. For reports which are not available
online, a request for the report will be sent to the PI of the survey via the built in link of
the website. A second reminder request will be sent if the report is not received within
a month. If the report is not received within two weeks of the reminder the study will
be excluded from the analysis.
Part A: Protocol 17
The relevant data such as prevalence of low vision and blindness, prevalence
of URE and CSC for persons at 3/60, 6/60 and 6/18 will be extracted from the RAAB
reports before entering them in the data capture sheet. The data on GDP per capita
and health expenditure per capita of the countries will be obtained from the World
Bank website for the year the survey was conducted or the closest year available.18, 19
Additional data to be extracted from the standard RAAB reports are shown in the data
capture sheet (Appendix 2).The regions for the data analysis will be classified based
on the World Bank classification; Sub-Saharan Africa, South Asia, Latin America and
Caribbean, East Asia and Pacific, Middle East and North Africa, Europe and Central
Asia and North America.20
3.6 Data Analysis
The data will be initially entered in a Microsoft Excel 2013 data sheet, then it will be
transferred to data analysis statistical software STATA 11 (Stata Corp. College
Station, Texas) for analysis. The ratio of the prevalences of low vision to blindness will
be calculated for each survey, then it will be described as either mean (with confidence
intervals) or median (with interquartile range) based on the normality test. The
relationship between the ratios and the prevalence of URE in the population will be
calculated by using Pearson’s or Spearman’s correlation test, based on the normality
of the ratio. The distribution of the ratios across the geographical regions will be
assessed by using the Analysis of Variance (ANOVA) test. The effect of other
explanatory variables (such as CSC at different visual acuity levels for persons, GDP
per capita and total health expenditure per capita) on the magnitude of ratios will be
explored by using univariate regression analysis. The explanatory variables which
were found to have p value below 0.2 in univariate analysis will be included for
Part A: Protocol 18
multivariate analysis. The significance level will be considered at 5% for two tailed
tests. The description and source of the variables is presented in Table 1.
3.7 Ethical Approval
The ethical approval of the study protocol will be obtained from the University of Cape
Town Departmental Research Committee and the Faculty of Human Research Ethics
Committee. As a part of the standard methodology of RAAB surveys, all RAAB surveys
obtained ethical approval from the relevant ethics committee of the respective region
or province. Participants who were enrolled in the surveys provided verbal consent
for the study. Each individual survey was conducted in accordance with the tenants
of the Declaration of Helsinki. In addition, this study will also adhere to the ethical
principles of the Declaration of Helsinki.
3.8 Risks
The primary RAAB surveys pose minimal risk to the participants. This research will
utilise the data from the previously conducted surveys, therefore it will not have any
harmful effects on the human subjects.
3.9 Potential Benefits
The major benefit of the primary RAAB surveys was to measure the prevalence and
the causes of blindness and visual impairment in different surveyed regions. This could
benefit the population by targeting resources towards the more prevalent conditions.
The current study will identify the magnitude and the determinants of the ratio between
visual impairment and blindness in different regions which will be useful to prioritise
the activities of VISION 2020 programs.
Part A: Protocol 19
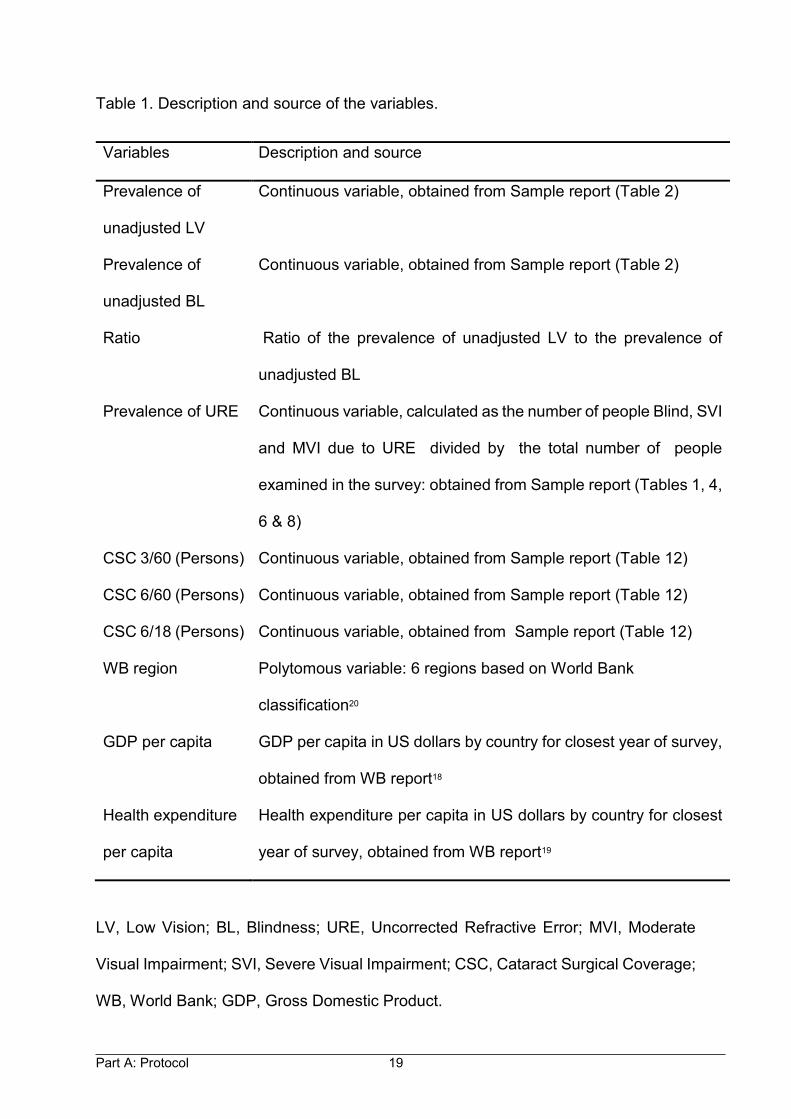
Table 1. Description and source of the variables.
LV, Low Vision; BL, Blindness; URE, Uncorrected Refractive Error; MVI, Moderate
Visual Impairment; SVI, Severe Visual Impairment; CSC, Cataract Surgical Coverage;
WB, World Bank; GDP, Gross Domestic Product.
Variables Description and source
Prevalence of
unadjusted LV
Continuous variable, obtained from Sample report (Table 2)
Prevalence of
unadjusted BL
Continuous variable, obtained from Sample report (Table 2)
Ratio Ratio of the prevalence of unadjusted LV to the prevalence of
unadjusted BL
Prevalence of URE Continuous variable, calculated as the number of people Blind, SVI
and MVI due to URE divided by the total number of people
examined in the survey: obtained from Sample report (Tables 1, 4,
6 & 8)
CSC 3/60 (Persons) Continuous variable, obtained from Sample report (Table 12)
CSC 6/60 (Persons) Continuous variable, obtained from Sample report (Table 12)
CSC 6/18 (Persons) Continuous variable, obtained from Sample report (Table 12)
WB region Polytomous variable: 6 regions based on World Bank
classification20
GDP per capita GDP per capita in US dollars by country for closest year of survey,
obtained from WB report18
Health expenditure
per capita
Health expenditure per capita in US dollars by country for closest
year of survey, obtained from WB report19
Part A: Protocol 20
3.10 Informed Consent
The participants of the primary RAAB surveys provided verbal informed consent. As
this study utilises the data from the previous surveys, there will not be any informed
consent process.
3.11 Privacy and Confidentiality
The extracted data for the study will be kept in a password protected computer file of
the primary investigator to maintain privacy and confidentiality. The data will be
destroyed after 5 years of the completion of the study.
3.12 Dissemination of the Results
This study is a part of the mini-dissertation for the Masters of Public Health, Community
Eye Health track at University of Cape Town. A copy of the dissertation will be made
available at the Health Sciences library. In addition, as a part of the dissertation, a
manuscript describing the study and the findings of the study will be prepared for a
peer reviewed journal and will be submitted for publication.
3.13 Logistics
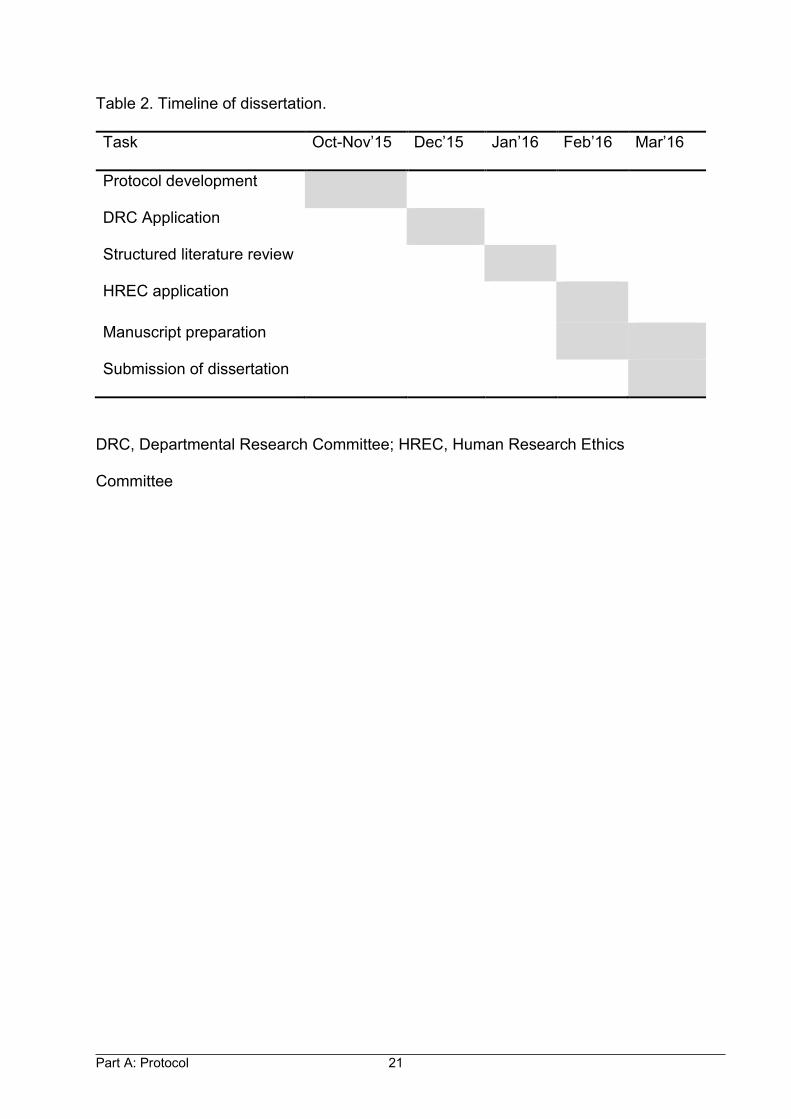
Timeline
The timeline for the dissertation work is shown in Table 2.
Budget and Costs
There was no major cost involved for the dissertation as the secondary data was
collected from online sources.
Part A: Protocol 21
Table 2. Timeline of dissertation.
Task Oct-Nov’15 Dec’15 Jan’16 Feb’16 Mar’16
Protocol development
DRC Application
Structured literature review
HREC application
Manuscript preparation
Submission of dissertation
DRC, Departmental Research Committee; HREC, Human Research Ethics
Committee
Part A: Protocol 22
4. REFERENCES
1. Pascolini D, Mariotti SP. Global estimates of visual impairment: 2010. The Br J
Ophthalmol. 2012;96:614-618.
2. Durr NJ, Dave SR, Lage E, Marcos S, Thorn F, Lim D. From unseen to seen:
Tackling the Global Burden of Uncorrected refractive errors. Annu Rev Biomed
Eng. 2014;16:131-153.
3. Thiagalingam S, Cumming RG, Mitchell P. Factors associated with undercorrected
refractive errors in an older population: the Blue Mountains Eye Study. Br J
Ophthalmol.2002;86(9):1041-1045.
4. World Health Organization. International statistical classification of diseases and
related health problems: 10th edition Geneva: World Health Organization; 2015
[cited 2016 10 February]. Available from: http://apps.who.int/classifications/icd10
/browse /2016/en#/H53-H54.
5. Limburg H, Kumar R, Indrayan A, Sundaram K. Rapid assessment of prevalence
of cataract blindness at district level. Int J Epidemiol.1997;26(5) :1049-1054.
6. Eloff J, Foster A. Cataract surgical coverage: results of a population-based survey
at Nkhoma, Malawi. Ophthalmic Epidemiol. 2000;7(3):219-221.
7. Limburg H, Von-Bischhoffshausen FB, Gomez P, Silva JC, Foster A. Review of
recent surveys on blindness and visual impairment in Latin America. Br J
Ophthalmol. 2008;92(3):315-319.
8. Faal H, Minassian DC, Dolin PJ, Mohamed AA, Ajewole J, Johnson GJ. Evaluation
of a national eye care programme: re-survey after 10 years. Br J Ophthalmol. 2000;
84(9):948-951.
Part A: Protocol 23
9. Dineen B, Foster A, Faal H. A proposed rapid methodology to assess the
prevalence and causes of blindness and visual impairment. Ophthalmic Epidemiol.
2006;13(1):31-34.
10. Kuper H, Polack S, Limburg H. Rapid assessment of avoidable blindness. Comm
Eye Health. 2006;19(60):68-69.
11. Bastawrous A, Dean WH, Sherwin JC. Blindness and visual impairment due to
age-related cataract in Sub-Saharan Africa: a systematic review of recent
population-based studies. Br J Ophthalmol. 2013;97(10):1237-1243.
12. Lewallen S, Schmidt E, Jolley E, Lindfield R, Dean WH, Cook C, et al. Factors
affecting cataract surgical coverage and outcomes: a retrospective cross-sectional
study of eye health systems in Sub-Saharan Africa. BMC Ophthalmol.2015;15(1):
1.
13. Lewallen S, Williams TD, Dray A, Stock BC, Mathenge W, Oye J, et al. Estimating
incidence of vision-reducing cataract in Africa: a new model with implications for
program targets. Arch Ophthalmol. 2010;128(12):1584-1589.
14. Naidoo KS, Jaggernath J. Uncorrected refractive errors. Indian J Ophthalmol. 2012
;60(5):432-437.
15. Dyer G. A manual for VISION 2020:The Right to Sight workshops. London:
International Centre for Eye Health, London School of Hygiene & Tropical
Medicine,2005.
16. Lewallen S, Courtright P, Etya’ale D, Mathenge W, Schmidt E, Oye J, et al.
Cataract incidence in Sub-Saharan Africa: what does mathematical modeling tell
us about geographic variations and surgical needs? Ophthalmic Epidemiol. 2013;
20(5):260-266.
Part A: Protocol 24
17. Hulley SB, Cummings SR, Browner WS, Grady DG, Hearst N, Newman T.
Designing Clinical Research. Chapter 6: Estimating sample size and power.
Philadelphia, PA: Lippincott Williams & Wilkins; 2001.
18. World Bank. GDP per capita [Internet]. Washington: World Bank; 2016 [cited 9
February 2016]. Available from:http://data.worldbank.org/indicator/NY.GDP.
PCAP.CD.
19. World Bank. Health expenditure per capita [Internet]. Washington: World Bank;
2016 [cited 9 February 2016]. Available from:http://data.worldbank.org/indicator/
SH.XPD. PCAP/countries.
20. World Bank. Countries [Internet]. Washington: World Bank; 2016 [cited 9 February
2016]. Available from:http://www.worldbank.org/en/country.

Part B:
Structured Literature Review
Part B: Structured Literature Review 2
TABLE OF CONTENTS
1. Summary…………………………………………………………………………………3
2. Aim of Literature Review…....................................................................................4
3. Study Question………………………………………………..…………...……...........4
4. Literature Search Strategy...…………………………………………………………...4
4.1 Inclusion and Exclusion Criteria…………………………………………………..4
4.2 Quality of Literature…………………………………………………………………5
4.3 Databases... ………………………………………………………………………...5
4.4 Keywords ……………………………………………………………………………5
5 Literature Review………………………………………..……………………………….6
5.1 Definitions of Blindness and Low Vision…………………………………………..6
5.2 Epidemiology of Blindness and Visual Impairment...……………………………7
5.3 Rapid Assessment Methods in Eye Care…………………………………………8
5.3.1 Rapid Assessment of Cataract Surgical Services …......................................9
5.3.2 Rapid Assessment of Avoidable Blindness ….............................................11
5.4 Rapid Assessment of Avoidable Blindness Repository...……………………...13
5.5 Variation of Prevalences of Blindness and Visual Impairment…....................14
5.6 Potential Determining Factors of the Ratio……………………………………...14
5.7. Identification of the Gap…………………………………………………………..16
6. References….......................................................................................................17
Part B: Structured Literature Review 3
1. SUMMARY
There are 32.4 million blind and 191 million moderate and severe visually impaired
people in the world. These data come from a systematic review which included the
results of Rapid Assessment of Avoidable Blindness (RAAB) surveys and Rapid
Assessment of Cataract Surgical Services (RACSS) in addition to unpublished
population based surveys.
The prevalence of blindness and low vision (low vision includes moderate and severe
visual impairment) is found to vary greatly among the surveys. For “VISION 2020: The
Right to Sight initiative”, it is generally estimated that the prevalence of low vision is 3
to 4 times that of blindness. However this estimate is not applicable for all regions. For
instance, it was found that the ratio between the proportion of low vision and the
proportion of blindness in the population varies from 1.30 to 6.30 in Sub-Saharan
Africa. Moreover, there is no evidence for the magnitude of the ratio in other continents
or for the determining factors for the ratio. Therefore we proposed a study to describe
the magnitude of the ratio in different regions as well as to identify the contributing
factors determining the ratio. Our assumption is that prevalence of Uncorrected
Refractive Error (URE) could possibly explain the variation in the ratio since this is the
main cause of severe and moderate visual impairment but not of blindness.
Understanding the factors contributing to the variation would help to prioritise the
ophthalmic services since the provision of spectacles to the people with URE is
considered to be one of the indicators of ophthalmic service delivery in a region.
Part B: Structured Literature Review 4
2. AIM OF THE LITERATURE REVIEW
The aim of the literature review was to identify indexed articles which could provide
the magnitude of the prevalences of low vision and of blindness in RAAB surveys and
potentially explore the variation of ratio of prevalences of low vision and of blindness
in RAAB surveys across different regions.
3. STUDY QUESTION
What is the variation of the ratio between prevalence of low vision and prevalence of
blindness in the RAAB surveys?
What are the determining factors for the variation of the ratio between prevalence of
low vision and prevalence of blindness?
4. LITERATURE SEARCH STRATEGY
4.1 Inclusion and Exclusion Criteria
Inclusion Criteria
Studies which used population based Rapid Assessment of Avoidable Blindness
survey methodology.
Studies which provided the data on prevalence of low vision and prevalence of
blindness.
Studies which had at least 80% of coverage of the sample size.
Exclusion Criteria
Surveys which used methodology of RACSS and custom surveys.
Part B: Structured Literature Review 5
4.2 Quality of Literature
Population based cross-sectional surveys which used multistage cluster sampling,
which is one of the proportional probability sampling techniques for data collection
were included in the study.
4.3 Databases
The literature was searched using the following databases; MEDLINE (through
PubMed), Embase (through Scopus), EBSCO-host (selecting Africa-Wide Information
and MEDLINE) and Web of Science for the articles listed before 8 February 2016 in
the database. For PubMed, articles were filtered using only “Human species”. English
language was used for all the databases to filter the publications. There was no filter
on the article type, text availability and publication dates.
4.4 Keywords
The following keywords were used for the literature search; rapid assessment,
blindness, age-related cataract, uncorrected refractive error, low vision, visual
impairment, avoidable, preventable, curable, treatable.
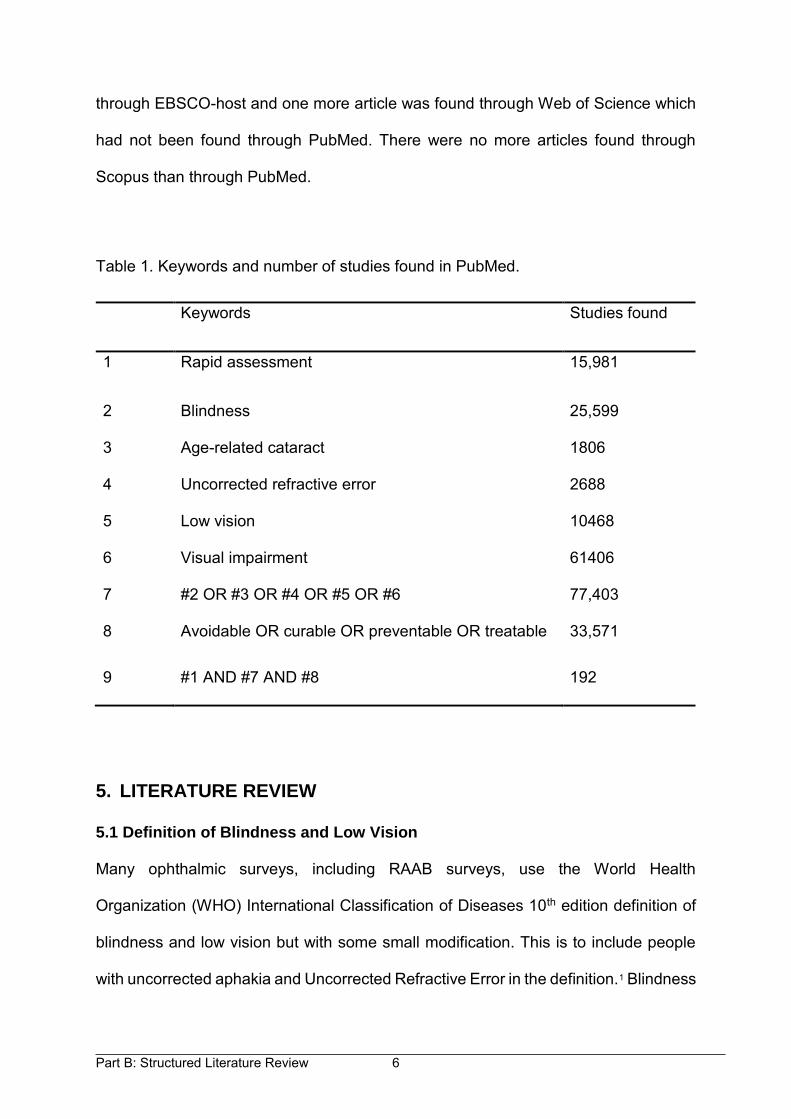
Out of 192 articles identified using the PubMed search, 7 articles were found relevant
to our study and were selected for this literature review. We also searched the
reference list of the included articles using the “snow ball technique”. The keywords
and number of studies found in PubMed is shown in Table 1.
The same keywords were used with minor modification for the other databases
according to the requirements of the databases. Three more articles were found
Part B: Structured Literature Review 6
through EBSCO-host and one more article was found through Web of Science which
had not been found through PubMed. There were no more articles found through
Scopus than through PubMed.
Table 1. Keywords and number of studies found in PubMed.
Keywords Studies found
1 Rapid assessment 15,981
2 Blindness 25,599
3 Age-related cataract 1806
4 Uncorrected refractive error 2688
5 Low vision 10468
6 Visual impairment 61406
7 #2 OR #3 OR #4 OR #5 OR #6 77,403
8 Avoidable OR curable OR preventable OR treatable 33,571
9 #1 AND #7 AND #8 192
5. LITERATURE REVIEW
5.1 Definition of Blindness and Low Vision
Many ophthalmic surveys, including RAAB surveys, use the World Health
Organization (WHO) International Classification of Diseases 10th edition definition of
blindness and low vision but with some small modification. This is to include people
with uncorrected aphakia and Uncorrected Refractive Error in the definition.1 Blindness
Part B: Structured Literature Review 7
is defined as Presenting Visual Acuity (PVA) of less than 3/60 in the better eye
whereas low vision is defined as PVA of less than 6/18 but not less than 3/60 in the
better eye. Recently the WHO replaced the term low vision with Moderate Visual
Impairment (Category 1: PVA worse than 6/18 and equal to or better than 6/60) and
Severe Visual Impairment (Category 2: PVA worse than 6/60 and equal to or better
than 3/60).1
5.2 Epidemiology of Blindness and Visual Impairment
Globally, there are 32.4 million blind and 191 million moderate and severe visually
impaired people.2 It is important to note that these figures are lower than in the global
estimates of visual impairment study.3 Since the estimates of the global burden of
disease study came from more recent and larger published, as well as unpublished,
studies we preferred to use them consistently for the remaining sections of the study.
Worldwide, cataracts (33%) are the leading cause of blindness followed by URE (21%)
and macular degeneration (7%). There are some variations in the causes of blindness
across different regions. Cataracts are the main (>40%) cause of blindness in South
and Southeast Asia, Oceania and Sub-Saharan Africa whereas macular degeneration
is the leading (>15%) cause of blindness in high income regions, Southern Latin
America and Central and Eastern Europe.
Uncorrected Refractive Error (53%) is the leading cause of Moderate and
Severe Visual Impairment (MSVI) followed by cataracts (18%) and macular
degeneration (2%) globally.2 In 2010, people affected by blindness and MSVI caused
by URE were 6.8 (95% Confidence Intervals, CI 4.7-8.8) million and 101.2 (95% CI
87.88; 125.5) million respectively. Furthermore, the age-adjusted combined
Part B: Structured Literature Review 8
prevalence of URE causing blindness and MSVI in adults was 5.7% (95% CI 5.0-
6.9%). Similarly, the proportion of MSVI related to cataracts is smallest in the highest-
income regions (Range 13.0 to 13.8%) and largest in South Asia (21.4%, 95% CI 16.1-
24.2) and Southeast Asia (22.7%, 95% CI 17.9; 27.4).
It is important to note that nearly two-thirds (65%, 95% CI, 61-68) of blindness
and just over three-quarters (76%, 95% CI 73-79) of MSVI is preventable or treatable.
These data come from a systematic review which included 48 population-based
unpublished studies, 4 government reports and 44 rapid assessment surveys
particularly; Rapid Assessment of Cataract Surgical Services surveys and Rapid
Assessment of Avoidable Blindness surveys.
5.3 Rapid Assessment Methods in Eye Care
Studies from various parts of the world have shown that visual impairment affects the
quality of life of individuals.4-6 Quality of life can be improved greatly if avoidable
blindness is eliminated. The WHO along with International Agency for the Prevention
of Blindness (IAPB) introduced an initiative, “VISION 2020: The Right to Sight”, with
the goal to eliminate avoidable blindness by the year 2020.7 The VISION 2020 initiative
initially prioritises five areas based on the magnitude of the problem and cost-effective
treatment options. The priority areas are cataract, trachoma, onchocerciasis,
childhood blindness and refractive errors and low vision.
In order to find out the prevalence of low vision and blindness in the populations
of different countries surveys had to be conducted. Traditional epidemiological surveys
provide accurate information however they are heavily constrained by money and time
Part B: Structured Literature Review 9
particularly in resources limited settings. To overcome this challenge, Rapid
Assessment (RA) methods have been developed. RA methods were used in the 1990s
in eye care for cataract, onchocerciasis and trachoma and more recently in avoidable
blindness and visual impairment.8 The main advantageous features of RA methods
are: use of local resources, simplified sampling methodology and simple examination
and data collection protocol which can be conducted by locally available human
resources.9 The survey is relatively inexpensive so it can be repeated every 5 to 10
years to assess the change of disease burden or to evaluate the impact of an
interventional program.
Rapid Assessment methods have been used to provide global information on
blindness and its causes for populations aged 50 years and above in order to plan for
VISION 2020 programmes and to monitor progress towards the VISION 2020 goal.9
The information obtained from samples of people ≥ 50 years of age can be used to
estimate the prevalence in the total population since we expect that at least 80% of
blindness is found in the population ≥ 50 years.10, 11 Rapid Assessment of Cataract
Surgical Services and Rapid Assessment of Avoidable Blindness are the two widely
used RA methods in eye care.
5.3.1 Rapid Assessment of Cataract Surgical Services
Rapid Assessment of Cataract Surgical Services (RACSS) was one of the earliest RA
methods. It was used to find out information about the age group 50 years and above
on the prevalence of blindness due to cataracts, Cataract Surgical Coverage, visual
outcomes after cataract surgery and barriers for uptake of cataract surgery.12 It was
the first standardised method proposed to measure vision loss and was used until
Part B: Structured Literature Review 10
2005. RACSS uses Expanded Programme on Immunization (EPI) random walk
cluster sampling method.
Expanded Programme on Immunization random walk sampling method divides
the study area into clusters with a comparable number of households and average
number of people in each household based on the recent census data. The clusters
to sample, usually of 40 to 50 households, are then randomly selected.13, 14 The second
stage of the sampling is selection of individual households within the cluster. It is
recommended to start the selection process at the centre of the area, which is
identified as a cluster. One direction is randomly selected at the centre of the cluster,
usually by spinning a bottle and starting with the first household where the neck of the
bottle faces. The adjacent household with the closest door is selected as the second
household and so on. This process carries on until the last household to be sampled
from that cluster is visited.
Despite wide use of the EPI random walk sampling method it has several
limitations. Firstly, clusters are divided based on the population proportion to size
which comes from the census. Unfortunately, census data may not be accurate and
updated in many low and middle income countries. In addition a census conducted
every ten years may not reflect the true population changes and growth rates.
Secondly, the first household within the cluster is selected based on the spun bottle
which is a subjective method, the EPI sampling method is likely to have selection bias.
Moreover, the centrally located households may be systematically different from
peripherally located households, potentially creating selection bias. For example,
households with common features such as higher family income are likely to be
Part B: Structured Literature Review 11
adjacently located. Taking into account design effect is expected to minimise these
biases but cannot eliminate them completely.
The RACSS eye examination protocol comprises of visual acuity measurement
using the modified Snellen tumbling E chart with 6/60 and 6/18 optotype on either side.
The crystalline lens is examined using a torchlight and direct ophthalmoscope and the
fundus is examined by direct ophthalmoscopy. Participants with visual acuity below
6/18 in either eye are referred to the nearest eye care facility for further investigation
or treatment.
RACSS software is available to assist at all stages of the survey: sample
selection, data entry and automated data analysis. The software is designed to
perform the survey easily without the need of experts such as statisticians.
5.3.2 Rapid Assessment of Avoidable Blindness
Rapid Assessment of Avoidable Blindness is essentially a modified, and improved
version of RACSS, commonly used from 2005 onwards.12 RAAB provides information
on the prevalence of visual impairment due to avoidable and correctable causes such
as cataracts, URE, glaucoma, trachoma, onchocerciasis and corneal scarring. Like
RACSS, it also provides data on CSC, barriers to the uptake of cataract surgery and
visual outcome after surgery. RAAB uses compact segment sampling methods to
recruit 2000 to 5000 participants of age 50 years and above, typically at district level.15
Compact segment sampling method is the improved version of cluster sampling
method introduced to overcome the limitations of the EPI method.16 The first stage of
Part B: Structured Literature Review 12
the sampling is the determination of sample size followed by selection of cluster based
on the population proportion to size method. In the second stage sampling a map of
the study clusters is divided into segments with an equal number of individuals in each
segment, usually 50 people of ≥50 years of age. A segment is randomly selected from
each cluster and all the households of the segment included for the survey. All eligible
people in that segment are examined similar to in RACSS methodology except that
the fundus is examined by direct ophthalmoscopy through the pupil which may be
dilated at the discretion of the examiner.
Unlike in EPI random walk method, compact segment sampling method
eliminates the subjectivity while selecting the first household thus minimising possible
bias from household selection. Moreover, this sampling method recommends to revisit
the households when there is no response.16 There is a standardised training package
for RAAB surveys, which can be conducted only under the supervision of certified
RAAB trainers. Inter-observer variation is measured among the teams to maintain the
uniformity before the survey. A kappa score of 0.6, which is considered to be a
moderate strength of inter-observer agreement, is required for a RAAB survey to be
valid.17
Even though RAAB overcomes some of the limitations of RACSS, it still has
some drawbacks. Diagnosis of posterior segment diseases using the direct
ophthalmoscope may not be very accurate and the procedure is difficult to do properly
in the field situation. Moreover, leaving dilation of the pupil to the discretion of the
examiner means that some examinations are performed more thoroughly than others.
Similarly, URE is defined as inability to see 6/60 but can see 6/18 when pinhole is
Part B: Structured Literature Review 13
used. This diagnosis guideline provides a gross estimate of refractive error but cannot
provide information on the severity of the refractive error.
One problem with both RACSS and RAAB surveys is that only the most easily
preventable or curable cause of blindness or visual impairment is reported while in
reality there are often multiple causes contributing equally to the vision loss. For
example this potentially underestimates the impact of diabetic retinopathy, glaucoma
and other diseases when a patient presents with cataract.18 Recently, examination to
detect Diabetic Retinopathy (DR) has been added to the RAAB methodology, which
is also referred to as RAAB+DR.
The major strength of the RAAB is its standardised methodology. Although it is
not perfect, it allows the best possible opportunity to make comparisons of the
prevalence of vision loss and the causes of the vision loss across different settings.
5.4 Rapid Assessment of Avoidable Blindness Repository
The RAAB repository provides safe storage of the results of RACSS and RAAB
surveys conducted worldwide (http://www.raabdata.info/repository/). The freely
available RAAB software assists in sample selection, data entry and data analysis. All
results are presented in a standardised format using the RAAB software. Full reports
of the surveys are either available from the repository or may be requested from the
Principal Investigator (PI). The main aim of freely sharing the information to the public
is that researchers can have easy access to the data for study purposes. However,
the PI or the donor agency determines what information to put in the repository and
what information to provide on request.19 This makes it difficult to generalise the
Part B: Structured Literature Review 14
findings locally or globally merely based on the repository results. If more survey
results were available in the repository then accessing a proper representation of
results would be easier.
5.5 Variation of the Prevalences of Blindness and Visual Impairment
The prevalences of blindness and low vision vary greatly among the RAAB surveys.
For instance a recent systematic review in Sub-Saharan Africa (SSA), which included
17 surveys of 15 counties, found that the prevalence of blindness ranged from 0.1%
in Uganda to 9% in Eritrea.20 In addition, the prevalence of low vision varied from 1.6%
in Gambia and Uganda to 17.1% in Ghana. Similarly a recent review study conducted
using RACSS and RAAB surveys of 12 Latin American countries found that the
prevalence of blindness was between 1.3% in Argentina and 4.2% (PVA <6/60 in the
better eye) in Venezuela.21 A previous review of 9 surveys from Latin America found
the prevalence of blindness similar to that found in the recent review (1.3% in
Argentina and 4% in Peru) whereas the prevalence of low vision was found to be
between 5.9% (in Argentina) and 12.5% (in Guatemala).10 The wide variation in the
prevalences of low vision and blindness in different countries has to be considered in
order to allocate resources appropriately.
5.6 Potential Determining Factors of the Ratio
In order to achieve the goal of VISION 2020, priority has to be given to cataracts and
URE which are the leading causes of blindness and visual impairment respectively.
The simplest way to reduce the visual impairment and blindness related to cataracts
is to perform as many cataract surgeries as possible. By increasing the Cataract
Surgical Rate (CSR), which is the number of cataract surgeries per million population,
Part B: Structured Literature Review 15
we can increase CSC. Cataract Surgical Coverage, which is the proportion of people
who had the surgery among those who needed it, is considered an indicator to
measure what extent of the cataract surgical need is met for a community.22 However,
CSR is dependent upon many other factors such as population structure, particularly
elderly population, visual acuity threshold for the surgery and accessibility and
affordability of the cataract surgical services.23
One of the most important potential determining factors for the ratio of low vision
to blindness is URE. The simplest way to reduce visual impairment and blindness
caused by URE is to identify the refractive errors and provide the appropriate refractive
correction, commonly spectacles. When refractive errors are not corrected, as with
other disabilities, they reduce economic productivity and educational opportunities as
well as quality of life.24, 25 Even though provision of spectacles is a simple, effective,
and largely affordable management for URE, the majority of people do not get
spectacles in low resource settings. The main barriers identified for this are awareness
about the services, accessibility of the services and affordability of the spectacles.24
Since accessibility and affordability of ophthalmic services are the barriers to spectacle
provision, it is likely that there is some relationship between URE and the economic
status of a country.
It is interesting to note that the prevalence of blindness varies with the country’s
economy. For instance it is estimated that the prevalence of blindness is more than
1% in very low income countries whereas it is 0.75%, 0.50% and 0.25% in low, middle
and high income countries respectively.26
Part B: Structured Literature Review 16
Since the data on low vision prevalence is not available for many regions,
prevalence of low vision is estimated based on the prevalence of blindness: it is
estimated to be 3 to 4 times the prevalence of blindness in adults.26 However, there is
a wide variation in the ratio of prevalence of low vision to prevalence of blindness
worldwide. For example the ratio of the prevalence of low vision to blindness was
found to be between 1.3 and 6.3 in 27 RAAB surveys of 19 Sub-Saharan African
countries.27 To understand the variation better, Lewallen et al. recommended further
research which identifies the determining factors of the ratio.27
5.7 Identification of the Gap
To the best of our knowledge, there is no description of the variation of ratio of
prevalence of low vision to blindness in countries other than in Sub-Saharan Africa,
nor is there any exploration into the reasons for the variation. It was found from the
previous review that URE is the most common cause of low vision but is not a common
cause of blindness.28 Since the prevalence of refractive errors vary tremendously in
various parts of the world 24, 25, 28 it is possible that variation in URE would explain the
variation in the ratio of prevalence of low vision to prevalence of blindness. Describing
the variation across a large number of surveys from a wide geographical region and
examining whether it is associated with prevalence of URE would enhance
understanding of epidemiology of visual impairment and blindness globally and
possibly provide useful information for predicting the impact of targeting URE needs.
Therefore this study was proposed to determine the magnitude and the determinants
of the ratio between prevalence of low vision and prevalence of blindness globally,
using data from RAAB surveys.
Part B: Structured Literature Review 17
6. REFERENCES
1. World Health Organization. International statistical classification of diseases
and related health problems: 10th edition [Internet]. Geneva: World Health
Organization; 2015 [cited 2016 10 February]. Available from:http://
apps.who.int/classifications/icd10/browse/2016/en#/H53-H54.
2. Bourne RR, Stevens GA, White RA, Smith JL, Flaxman SR, Price H, et al.
Causes of vision loss worldwide, 1990–2010: a systematic analysis. Lancet.
2013;1(6):e339-e349.
3. Pascolini D, Mariotti SP. Global estimates of visual impairment: 2010. The Br J
Ophthalmol. 2012;96:614-618.
4. Chia EM, Mitchell P, Ojaimi E, Rochtchina E, Wang JJ. Assessment of vision-
related quality of life in an older population subsample: The Blue Mountains Eye
Study. Ophthalmic Epidemiol. 2006;13(6):371-377.
5. Nutheti R, Shamanna BR, Nirmalan PK, Keeffe JE, Krishnaiah S, Rao GN, et
al. Impact of impaired vision and eye disease on quality of life in Andhra
Pradesh. Invest Ophthalmol Vis Sci. 2006;47(11):4742-4748.
6. Wong HB, Machin D, Tan SB, Wong TY, Saw SM. Visual impairment and its
impact on health-related quality of life in adolescents. Am J Ophthalmol. 2009;
147(3):505-511.
7. Thylefors B. A global initiative for the elimination of avoidable blindness. Comm
Eye Health. 1998;11(25):1.
8. Dineen B, Foster A, Faal H. A proposed rapid methodology to assess the
prevalence and causes of blindness and visual impairment. Ophthalmic
Epidemiol. 2006;13(1):31-34.
Part B: Structured Literature Review 18
9. Marmamula S, Keeffe JE, Rao GN. Rapid assessment methods in eye care: An
overview. Indian J Ophthalmol. 2012;60(5):416.
10. Limburg H, Von-Bischhoffshausen FB, Gomez P, Silva JC, Foster A. Review of
recent surveys on blindness and visual impairment in Latin America. Br J
Ophthalmol. 2008;92(3):315-319.
11. Faal H, Minassian DC, Dolin PJ, Mohamed AA, Ajewole J, Johnson GJ.
Evaluation of a national eye care programme: re-survey after 10 years. Br J
Ophthalmol. 2000;84(9):948-951.
12. Limburg H, Kumar R, Indrayan A, Sundaram K. Rapid assessment of
prevalence of cataract blindness at district level. Int J Epidemiol. 1997;26(5):
1049-1054.
13. Bennett S, Woods T, Liyanage WM, Smith DL. A simplified general method for
cluster-sample surveys of health in developing countries. World Health Stat Q.
1991;44(3):98-106.
14. Lemeshow S, Robinson D. Surveys to measure programme coverage and
impact: a review of the methodology used by the expanded programme on
immunization. World Health Stat Q. 1985;38(1):65-75.
15. Kuper H, Polack S, Limburg H. Rapid assessment of avoidable blindness.
Comm Eye Health. 2006;19(60):68-69.
16. Turner AG, Magnani RJ, Shuaib M. A not quite as quick but much cleaner
alternative to the Expanded Programme on Immunization (EPI) Cluster Survey
design. Int J Epidemiol. 1996;25(1):198-203.
17. Altman DG. Practical statistics for medical research. London: Chapman & Hall;
1990.
Part B: Structured Literature Review 19
18. Kempen JH. The need for a revised approach to epidemiological monitoring of
the prevalence of visual impairment. Ophthalmic Epidemiol. 2011;18(3):99-102.
19. International Centre for Eye Health. Home: RAAB Repository [Internet]. Keppel
Street, London, UK: London School of Hygiene & Tropical Medicine; 2014 [cited
2016 30 January]. Available from:http://www.raabdata.info/.
20. Bastawrous A, Dean WH, Sherwin JC. Blindness and visual impairment due to
age-related cataract in sub-Saharan Africa: a systematic review of recent
population-based studies. Br J Ophthalmol. 2013;97(10):1237-1243.
21. Furtado JM, Lansingh VC, Carter MJ, Milanese MF, Peña BN, Ghersi HA, et al.
Causes of blindness and visual impairment in Latin America. Surv Ophthalmol.
2012;57(2):149-177.
22. Lewallen S, Schmidt E, Jolley E, Lindfield R, Dean WH, Cook C, et al. Factors
affecting cataract surgical coverage and outcomes: a retrospective cross-
sectional study of eye health systems in sub-Saharan Africa. BMC Ophthalmol.
2015;15(1):1.
23. Lewallen S, Williams TD, Dray A, Stock BC, Mathenge W, Oye J, et al.
Estimating incidence of vision-reducing cataract in Africa: a new model with
implications for program targets. Arch Ophthalmol. 2010;128(12):1584-1589.
24. Durr NJ, Dave SR, Lage E, Marcos S, Thorn F, Lim D. From unseen to seen:
tackling the global burden of uncorrected refractive errors. Ann Rev Biomed
Eng. 2014;16:131-153.
25. Naidoo KS, Jaggernath J. Uncorrected refractive errors. Indian J Ophthalmol.
2012;60(5):432-437.
Part B: Structured Literature Review 20
26. Dyer G. A manual for VISION 2020:The Right to Sight workshops. London:
International Centre for Eye Health, London School of Hygiene & Tropical
Medicine, 2005.
27. Lewallen S, Courtright P, Etya’ale D, Mathenge W, Schmidt E, Oye J, et al.
Cataract incidence in sub-Saharan Africa: what does mathematical modeling
tell us about geographic variations and surgical needs? Ophthalmic Epidemiol.
2013;20(5):260-266.
28. Sherwin JC, Lewallen S, Courtright P. Blindness and visual impairment due to
uncorrected refractive error in sub-Saharan Africa: review of recent population-
based studies. Br J Ophthalmol. 2012;96(7):927-930.

Part C: Journal Manuscript
Part C: Journal Manuscript 2
TABLE OF CONTENTS
1. Abstract……………..……………………………………………………………………3
2. Introduction……….………………………………………………..…………...…….....4
3. Materials and Methods………………………………………………………………….7
3.1 Study Design ………………………………………………………………………..7
3.2 Examination and Data collection..………………………………………………...7
3.3 Inclusion and Exclusion Criteria…………………………………………………..8
3.4 Statistical Analysis………………………………………………………………….9
3.5 Ethical Considerations…...……………………………………………………….11
4. Results…………………………………………………………………………………..11
4.1 Surveys included in the Study….………………………………………………..11
4.2 Description of the Variables……………………………………………………...11
4.3 Association between the Ratio and other Variables…………………………..14
4.4 Distribution of the Ratio across the Regions…………………………………...15
4.5 Univariate Regression Analysis………….………………………………………16
4.6 Multivariate Regression Analysis…………………………….………………….16
4.7 Interpretation of Multivariate Regression Model….........................................17
5. Discussion……………………………………………………………………………...19
6. References ………………………………………………………………………….....23
OPHTHALMIC EPIDEMIOLOGY
Part C: Journal Manuscript
ORIGINAL ARTICLE
Magnitude and Determinants of the Ratio between Prevalences of
Low vision and Blindness in Rapid Assessment of Avoidable
Blindness Surveys
Dinesh Kaphle*
Faculty of Health Sciences, University of Cape Town
ABSTRACT
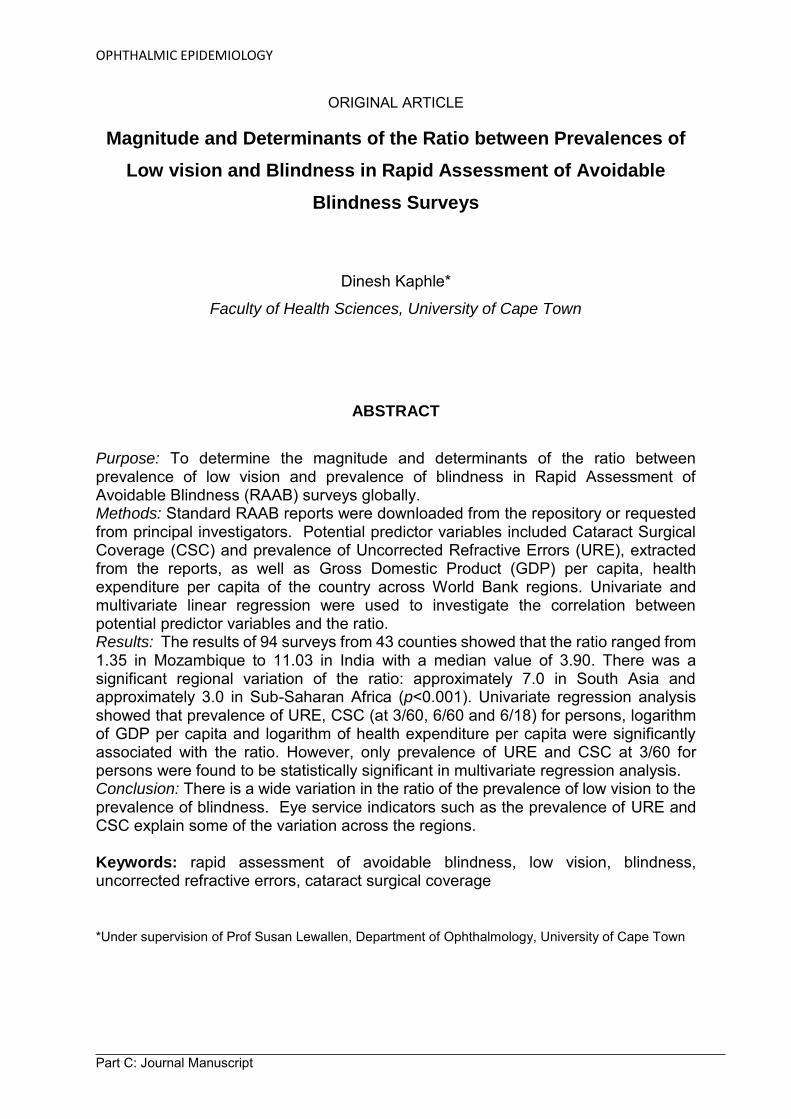
Purpose: To determine the magnitude and determinants of the ratio between prevalence of low vision and prevalence of blindness in Rapid Assessment of Avoidable Blindness (RAAB) surveys globally. Methods: Standard RAAB reports were downloaded from the repository or requested from principal investigators. Potential predictor variables included Cataract Surgical Coverage (CSC) and prevalence of Uncorrected Refractive Errors (URE), extracted from the reports, as well as Gross Domestic Product (GDP) per capita, health expenditure per capita of the country across World Bank regions. Univariate and multivariate linear regression were used to investigate the correlation between potential predictor variables and the ratio. Results: The results of 94 surveys from 43 counties showed that the ratio ranged from 1.35 in Mozambique to 11.03 in India with a median value of 3.90. There was a significant regional variation of the ratio: approximately 7.0 in South Asia and approximately 3.0 in Sub-Saharan Africa (p<0.001). Univariate regression analysis showed that prevalence of URE, CSC (at 3/60, 6/60 and 6/18) for persons, logarithm of GDP per capita and logarithm of health expenditure per capita were significantly associated with the ratio. However, only prevalence of URE and CSC at 3/60 for persons were found to be statistically significant in multivariate regression analysis. Conclusion: There is a wide variation in the ratio of the prevalence of low vision to the prevalence of blindness. Eye service indicators such as the prevalence of URE and CSC explain some of the variation across the regions. Keywords: rapid assessment of avoidable blindness, low vision, blindness, uncorrected refractive errors, cataract surgical coverage *Under supervision of Prof Susan Lewallen, Department of Ophthalmology, University of Cape Town
Part C: Journal Manuscript 4
INTRODUCTION
There are 32.4 million blind and 191 million moderate and severe visually impaired
people in the world.1 Worldwide, cataracts (33%) are the leading cause of blindness
(Presenting Visual Acuity (PVA) of less than 3/60 in the better eye) followed by
Uncorrected Refractive Error (URE) (21%) and macular degeneration (7%).
Uncorrected Refractive Error (53%) is the leading cause of Moderate and Severe
Visual Impairment (MSVI) (PVA of less than 6/18 but not less than 3/60 in the better
eye) followed by cataracts (18%) and macular degeneration (2%). Moderate and
Severe Visual Impairment combined is known as low vision. These data come from a
systematic review which included 48 population-based unpublished studies, 4
government reports and 44 Rapid Assessment of Cataract Surgical Services (RACSS)
and Rapid Assessment of Avoidable Blindness (RAAB) surveys.
Until 2005, Rapid Assessment of Cataract Surgical Services surveys were
conducted to provide information on prevalence of blindness due to cataracts, cataract
surgical coverage, visual outcomes after cataract surgery and barriers for uptake of
cataract surgery in the age group 50 years and above.2 The RACSS uses a modified
Expanded Programme on Immunization (EPI) random walk sampling method which
divides the study area into clusters with equal numbers of households and people in
each household based on recent census data. Then the clusters are randomly
selected.3, 4 The second stage of the sampling is the selection of individual households
within the cluster by spinning a bottle at the street crossing. All the eligible participants
of the selected households go through the standard eye examination.
Part C: Journal Manuscript 5
Selection of households using a spun bottle was considered to lead to potential
selection bias (favoring households nearest the centre of the village). To avoid this
compact segment sampling was introduced with the RAAB methodology. The RAAB
methodology provides information on prevalence of visual impairment due to cataracts
but also includes causes of vision loss such as URE, glaucoma, trachoma,
onchocerciasis, and corneal scarring. RAAB uses a compact segment sampling
method whereby the study area is divided into clusters of, usually, 50 people. The
clusters to be sampled are randomly selected then divided into many segments with
equal numbers of households and people in each segment. A segment is randomly
selected from each cluster and all the households of the segment are included for the
survey. The standard RAAB protocol is used to examine all eligible people in that
segment.
The RAAB repository website provides a safe storage of RACSS and RAAB
survey data conducted worldwide so that researchers, in theory, have access to the
data.5 This is to try to increase use of the data. Full reports of the surveys are either
available from the repository or may be requested from the Principal Investigator (PI).
The PI or the donor agency determines what information to put in the repository and
what information to provide on request. This makes it difficult to generalise the findings
globally merely based on the repository results.
When the RAAB survey results are compared for different countries it can be
seen that the prevalences of blindness and low vision vary widely. For instance a
recent systematic review in Sub-Saharan Africa (SSA), which included 17 surveys of
15 countries, found that the prevalence of blindness was between 0.1% in Uganda
Part C: Journal Manuscript 6
and 9% in Eritea.6 In addition, the prevalence of low vision varied from 1.6% in Gambia
and Uganda to 17.1% in Ghana. Similarly a review study conducted using RACSS and
RAAB surveys of 12 Latin American countries found that the prevalence of blindness
(PVA<3/60 in the better eye) was between 1.3% in Buenos Aires, Argentina and 4.2%
(PVA <6/60 in the better eye) in Venezuela.7
Since the data on prevalence of low vision is not available for many regions, it
is estimated based on the prevalence of blindness. Prevalence of low vision is
estimated to be 3 to 4 times the prevalence of blindness in adults.8 But there is a wide
variation in the ratio of prevalence of low vision to prevalence of blindness across
geographical regions worldwide. For example the ratio of prevalences of low vision to
blindness was found between 1.3 and 6.3 in 27 RAAB surveys of 19 Sub-Saharan
African countries.9
To the best of our knowledge, there is no description of the variation of the
proportion of low vision to blindness in countries other than Sub-Saharan Africa, nor
is there any exploration into the reasons for the variation. URE is the most common
cause of low vision but is not a common cause of blindness.10 Since the prevalence of
refractive error varies tremendously in various parts of the world,10-12 it is possible that
variation in URE would explain the variation in the ratio of prevalence of low vision to
prevalence of blindness. It is also known that the prevalence of blindness differs with
the country’s economy. For instance it is estimated that the prevalence of blindness is
more than 1% in very low income countries whereas it is 0.75%, 0.50% and 0.25% in
low, middle and high income countries respectively.8 Therefore it might be that either
Part C: Journal Manuscript 7
or both of these factors correlates with the ratio of the prevalence of low vision to
blindness and helps explain the variation.
Describing the variation in the ratio of low vision to blindness across a large
number of surveys from a wide geographical region and examining whether it is
associated with prevalence of URE and indicators of a country’s economy would
enhance understanding of epidemiology of visual impairment and blindness globally.
Furthermore it could possibly provide useful information for predicting the impact of
targeting URE needs. Therefore this study aimed to determine the magnitude and the
determinants of the ratio between prevalences of low vision to blindness globally,
using data from RAAB surveys.
MATERIALS AND METHODS
Study Design
The study design was observational analytical. A retrospective secondary analysis
was performed of 94 RAAB surveys, covering 257,757 people of 50 years and above
from 43 counties between 2003 and 2015.
Examination and Data Collection
The detailed methodology for the RAAB survey was previously published, a brief
description of the methodology is mentioned in this paper.13 Visual Acuity (VA) of
eligible participants is measured using a Snellen tumbling E chart, which has optotype
of size 6/18 and 6/60 on either side. Pinhole vision is assessed if the person cannot
see 6/18 in either eye. If the VA improves to at least 6/18 with pinhole, the eye is
recorded to have refractive error. The crystalline lens is examined using both torch
Part C: Journal Manuscript 8
and distant direct ophthalmoscopy in a shaded or dark room. All eyes with VA less
than 6/18 with the available correction are examined with a direct ophthalmoscope to
assess the cause of vision loss. Portable slit lamp may be used to assess the vision
loss if it is available. Only the primary cause of blindness or visual impairment is
recorded as the diagnosis for each eye. If the two eyes have different diagnoses, then
the cause of vision loss for the person is recorded as the diagnosis considered most
easily treated.
All the 217 RAAB surveys listed in the RAAB repository (as of 10 February
2016) were assessed using the inclusion criteria checklist guidelines (Appendix 1).
Those surveys which had the reports in the repository and met the criteria were
identified and selected for the study. Reports of surveys which were eligible for the
study but missing in the repository were requested from the PIs through the request
link in the repository. Finally, surveys which were not listed in the repository but were
known from previous publications using RAAB methodology14 and for which data were
available (KwaZulu-Natal, South Africa-2009 and White Nile, Sennar, Northen,
Kodorfan of Sudan-2010) were also included in the study.
Inclusion and Exclusion Criteria
The inclusion criteria for the study were: the survey should have used the standard
RAAB methodology, the coverage of the survey had to be at least 80% of the sample
size calculated and the survey should have a downloadable standard RAAB report in
the repository OR the report obtained through the request procedure with permission
from the PIs. The exclusion criteria for the study were: the surveys conducted using
RACSS or custom methodology and the surveys with missing data on prevalence of
Part C: Journal Manuscript 9
low vision and blindness AND/OR probable explanatory variables. In addition, the
surveys for which the permission to use the data could not be obtained from the PIs
were excluded from the study.
Statistical Analysis
Data analysis was performed using the statistical software STATA 11 (Stata Corp.
College Station, Texas). The ratio of unadjusted prevalence of low vision to unadjusted
prevalence of blindness was considered as the outcome variable. Continuous
variables were described using mean (standard deviation) or median (inter-quartile
range) based on the normality. Normality of the variables was checked using the
histogram and Shapiro-Wilk test. The associations between the ratio and the potential
explanatory variables were assessed using Spearman’s rank correlation coefficient.
The variation of the ratio in different regions was assessed using analysis of variances
(ANOVA). When the variances were significantly different to one another (checked
using Bartlett’s test), Kruskal-Wallis test was used. Univariate regression analysis was
performed keeping ratio as an outcome variable and the other variables individually
as explanatory variables. Multiple linear regression was fitted using the ratio as the
outcome variable, and the explanatory variables which had p value of below 0.2 in the
univariate analysis. Explanatory variables which had high collinearity were excluded
from the multivariate analysis. Logarithm transformation (base 10) was performed for
the highly skewed variables and the not-normally distributed outcome variable. The
description and source of the variables is shown in Table 1. Probability (p) value below
0.05 was considered statistically significant for two-sided tests.
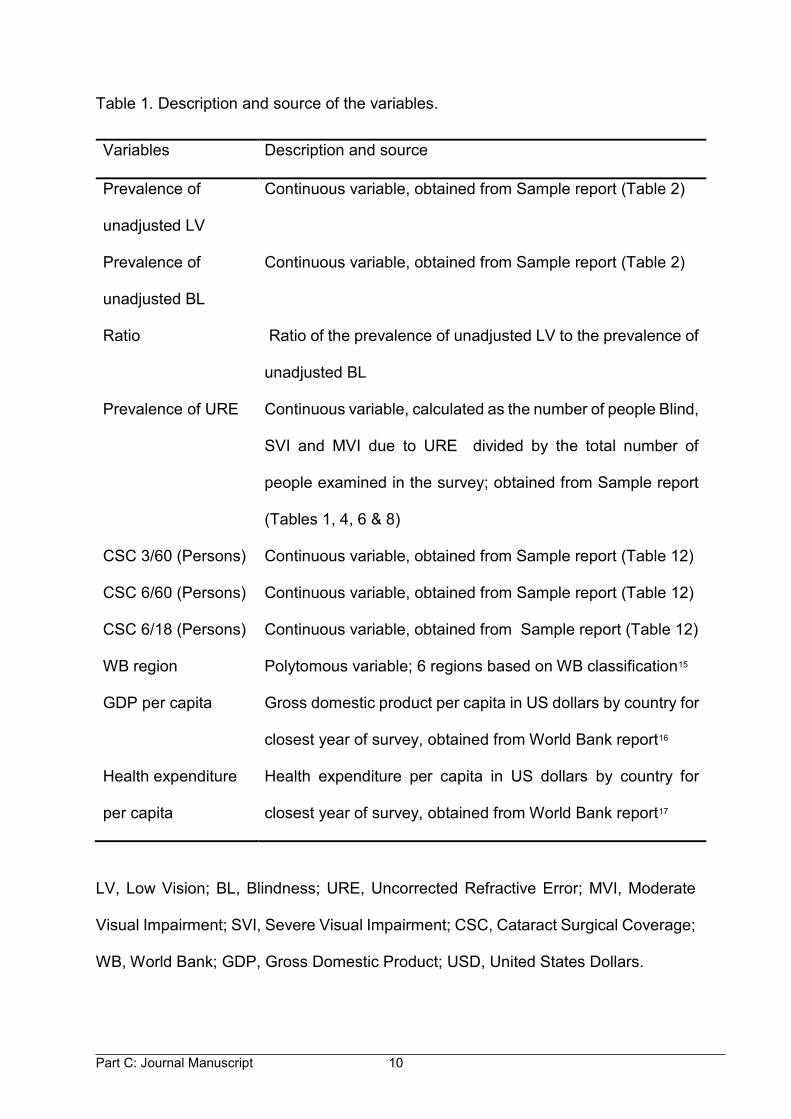
Part C: Journal Manuscript 10
Table 1. Description and source of the variables.
Variables Description and source
Prevalence of
unadjusted LV
Continuous variable, obtained from Sample report (Table 2)
Prevalence of
unadjusted BL
Continuous variable, obtained from Sample report (Table 2)
Ratio Ratio of the prevalence of unadjusted LV to the prevalence of
unadjusted BL
Prevalence of URE Continuous variable, calculated as the number of people Blind,
SVI and MVI due to URE divided by the total number of
people examined in the survey; obtained from Sample report
(Tables 1, 4, 6 & 8)
CSC 3/60 (Persons) Continuous variable, obtained from Sample report (Table 12)
CSC 6/60 (Persons) Continuous variable, obtained from Sample report (Table 12)
CSC 6/18 (Persons) Continuous variable, obtained from Sample report (Table 12)
WB region Polytomous variable; 6 regions based on WB classification15
GDP per capita Gross domestic product per capita in US dollars by country for
closest year of survey, obtained from World Bank report16
Health expenditure
per capita
Health expenditure per capita in US dollars by country for
closest year of survey, obtained from World Bank report17
LV, Low Vision; BL, Blindness; URE, Uncorrected Refractive Error; MVI, Moderate
Visual Impairment; SVI, Severe Visual Impairment; CSC, Cataract Surgical Coverage;
WB, World Bank; GDP, Gross Domestic Product; USD, United States Dollars.
Part C: Journal Manuscript 11
Ethical Considerations
All the RAAB surveys, which were included in the study, obtained verbal consent from
the participants before enrolling them in the survey. Each individual survey was
conducted in accordance with the tenants of the Declaration of Helsinki. The ethical
approval of the study protocol was obtained from the Human Research Ethics
Committee, University of Cape Town (Approval number 069/2016).
RESULTS
Surveys included in the Study
Out of 217 surveys in the repository, 156 were RAAB surveys. The sources of 94
surveys, which were included in the study, are presented in Table 2. A survey from
Negros, Philippines (2005) was excluded from the study because of low coverage
(76%). The largest number of surveys were from Vietnam (16) followed by China (10)
and Nepal (10). Figure 1 presents the sources of the 94 surveys. The description of
the 94 surveys is shown in Tables 7, 8, 9, 10 and 11 of Appendix 6.
Description of the Variables
The ratio of the prevalences of low vision to blindness was the lowest in Nampula,
Mozambique (1.35 times) and it was the highest in Gujarat, India (11.03 times). The
mean (standard deviation), range, median and interquartile range of the ratio and
potential explanatory variables are shown in Table 2.
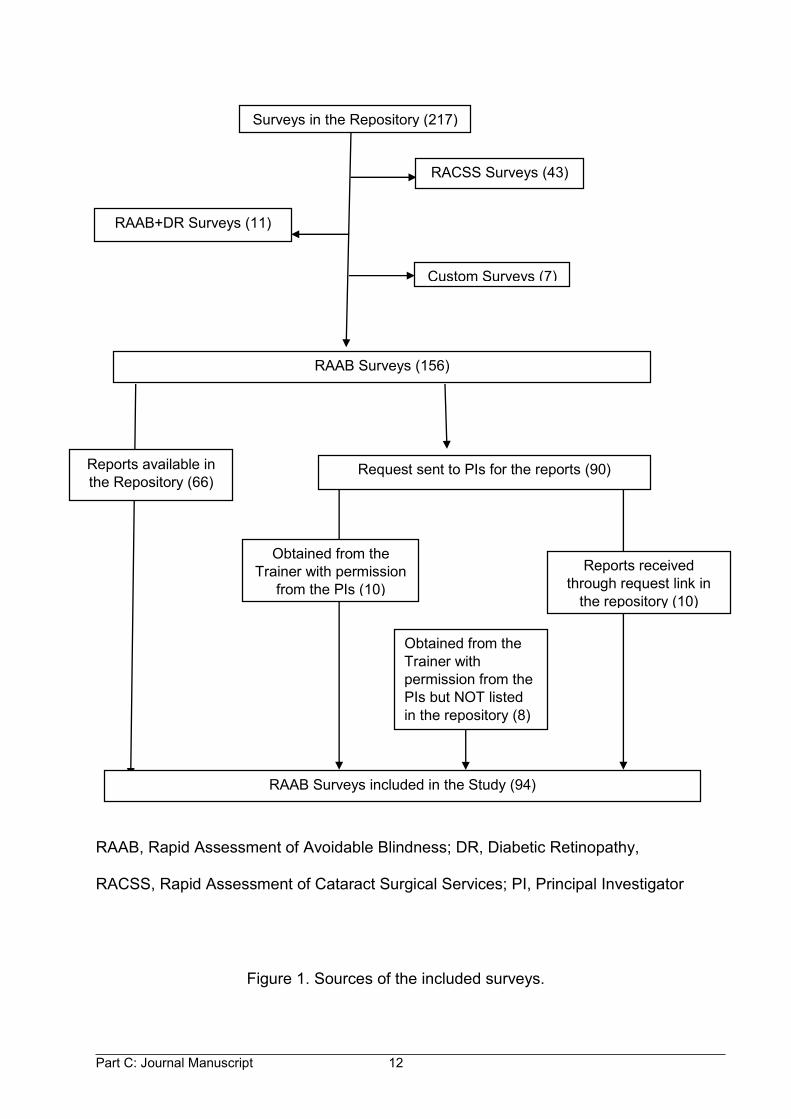
Part C: Journal Manuscript 12
Obtained from the Trainer with permission
from the PIs (10)
RAAB, Rapid Assessment of Avoidable Blindness; DR, Diabetic Retinopathy,
RACSS, Rapid Assessment of Cataract Surgical Services; PI, Principal Investigator
Figure 1. Sources of the included surveys.
RAAB Surveys (156)
Reports available in the Repository (66)
Reports received through request link in
the repository (10)
RAAB Surveys included in the Study (94)
Request sent to PIs for the reports (90)
Obtained from the Trainer with permission from the PIs but NOT listed in the repository (8)
Surveys in the Repository (217)
RACSS Surveys (43)
RAAB+DR Surveys (11)
Custom Surveys (7)
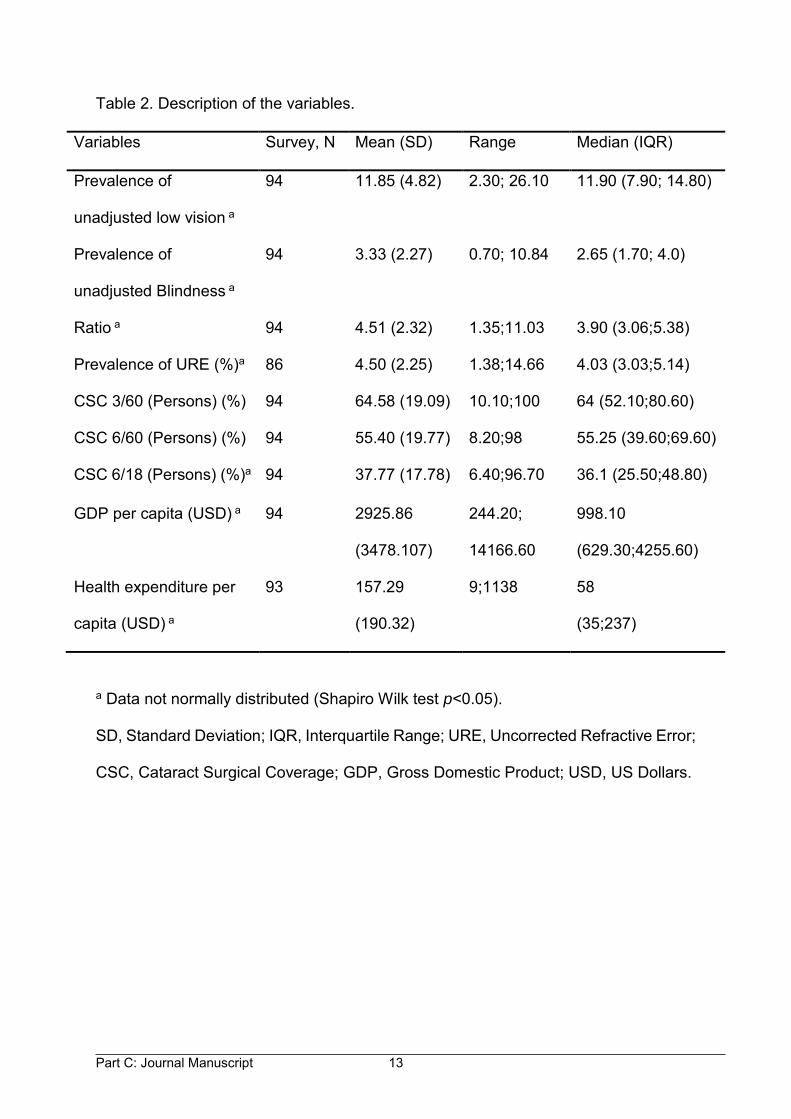
Part C: Journal Manuscript 13
Table 2. Description of the variables.
Variables Survey, N Mean (SD) Range Median (IQR)
Prevalence of
unadjusted low vision a
94 11.85 (4.82) 2.30; 26.10 11.90 (7.90; 14.80)
Prevalence of
unadjusted Blindness a
94 3.33 (2.27) 0.70; 10.84 2.65 (1.70; 4.0)
Ratio a 94 4.51 (2.32) 1.35;11.03 3.90 (3.06;5.38)
Prevalence of URE (%)a 86 4.50 (2.25) 1.38;14.66 4.03 (3.03;5.14)
CSC 3/60 (Persons) (%) 94 64.58 (19.09) 10.10;100 64 (52.10;80.60)
CSC 6/60 (Persons) (%) 94 55.40 (19.77) 8.20;98 55.25 (39.60;69.60)
CSC 6/18 (Persons) (%)a 94 37.77 (17.78) 6.40;96.70 36.1 (25.50;48.80)
GDP per capita (USD) a 94 2925.86
(3478.107)
244.20;
14166.60
998.10
(629.30;4255.60)
Health expenditure per
capita (USD) a
93 157.29
(190.32)
9;1138 58
(35;237)
a Data not normally distributed (Shapiro Wilk test p<0.05).
SD, Standard Deviation; IQR, Interquartile Range; URE, Uncorrected Refractive Error;
CSC, Cataract Surgical Coverage; GDP, Gross Domestic Product; USD, US Dollars.
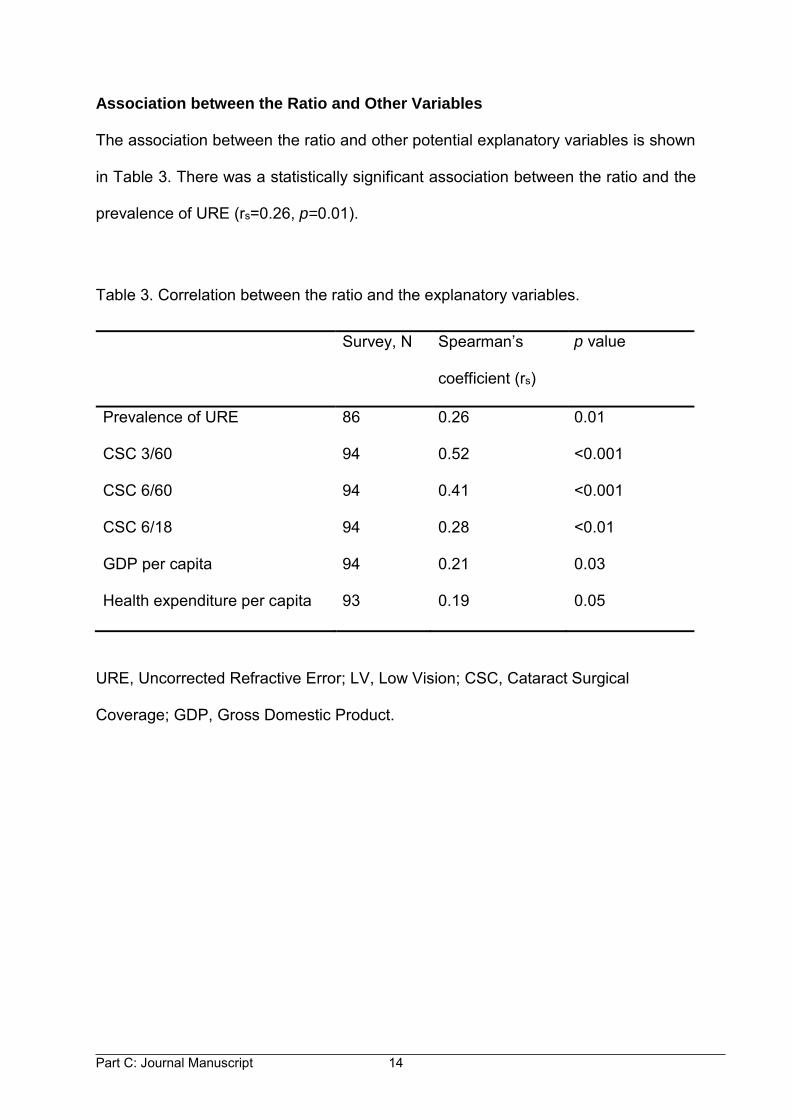
Part C: Journal Manuscript 14
Association between the Ratio and Other Variables
The association between the ratio and other potential explanatory variables is shown
in Table 3. There was a statistically significant association between the ratio and the
prevalence of URE (rs=0.26, p=0.01).
Table 3. Correlation between the ratio and the explanatory variables.
Survey, N Spearman’s
coefficient (rs)
p value
Prevalence of URE 86 0.26 0.01
CSC 3/60 94 0.52 <0.001
CSC 6/60 94 0.41 <0.001
CSC 6/18 94 0.28 <0.01
GDP per capita 94 0.21 0.03
Health expenditure per capita 93 0.19 0.05
URE, Uncorrected Refractive Error; LV, Low Vision; CSC, Cataract Surgical
Coverage; GDP, Gross Domestic Product.
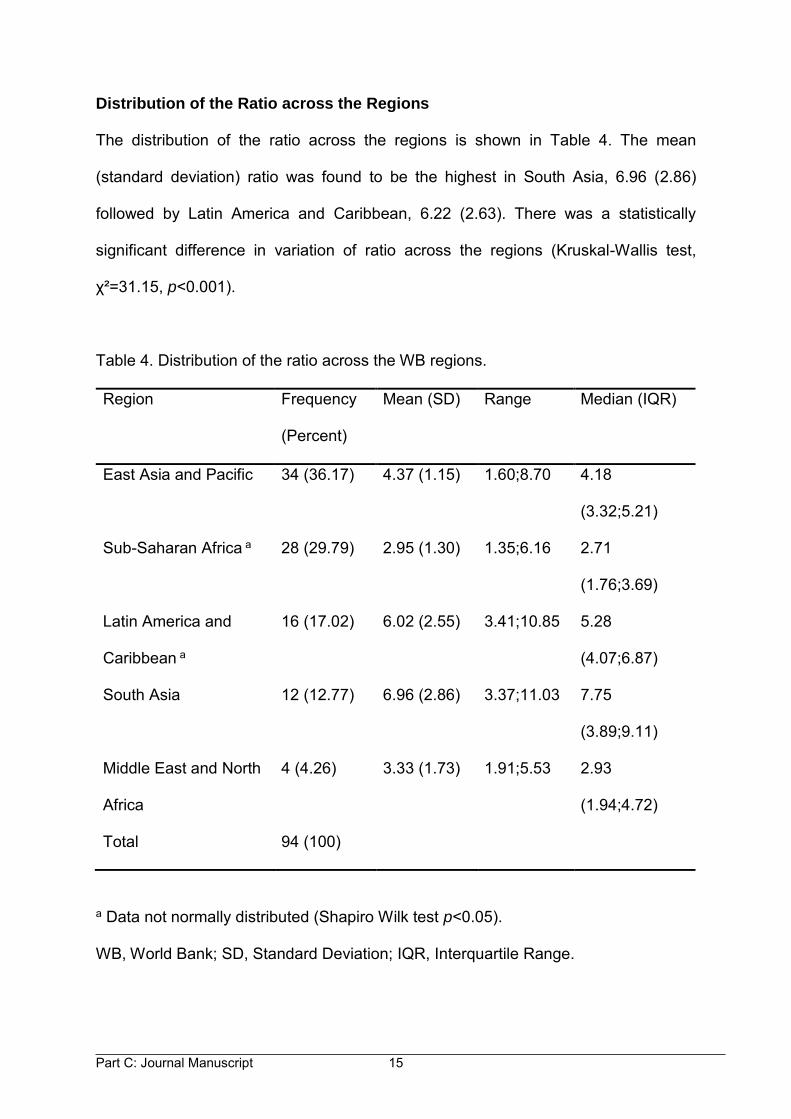
Part C: Journal Manuscript 15
Distribution of the Ratio across the Regions
The distribution of the ratio across the regions is shown in Table 4. The mean
(standard deviation) ratio was found to be the highest in South Asia, 6.96 (2.86)
followed by Latin America and Caribbean, 6.22 (2.63). There was a statistically
significant difference in variation of ratio across the regions (Kruskal-Wallis test,
χ²=31.15, p<0.001).
Table 4. Distribution of the ratio across the WB regions.
Region Frequency
(Percent)
Mean (SD)
Range Median (IQR)
East Asia and Pacific 34 (36.17) 4.37 (1.15)
1.60;8.70 4.18
(3.32;5.21)
Sub-Saharan Africa a 28 (29.79) 2.95 (1.30)
1.35;6.16 2.71
(1.76;3.69)
Latin America and
Caribbean a
16 (17.02) 6.02 (2.55)
3.41;10.85 5.28
(4.07;6.87)
South Asia 12 (12.77) 6.96 (2.86)
3.37;11.03 7.75
(3.89;9.11)
Middle East and North
Africa
4 (4.26) 3.33 (1.73)
1.91;5.53 2.93
(1.94;4.72)
Total 94 (100)
a Data not normally distributed (Shapiro Wilk test p<0.05).
WB, World Bank; SD, Standard Deviation; IQR, Interquartile Range.
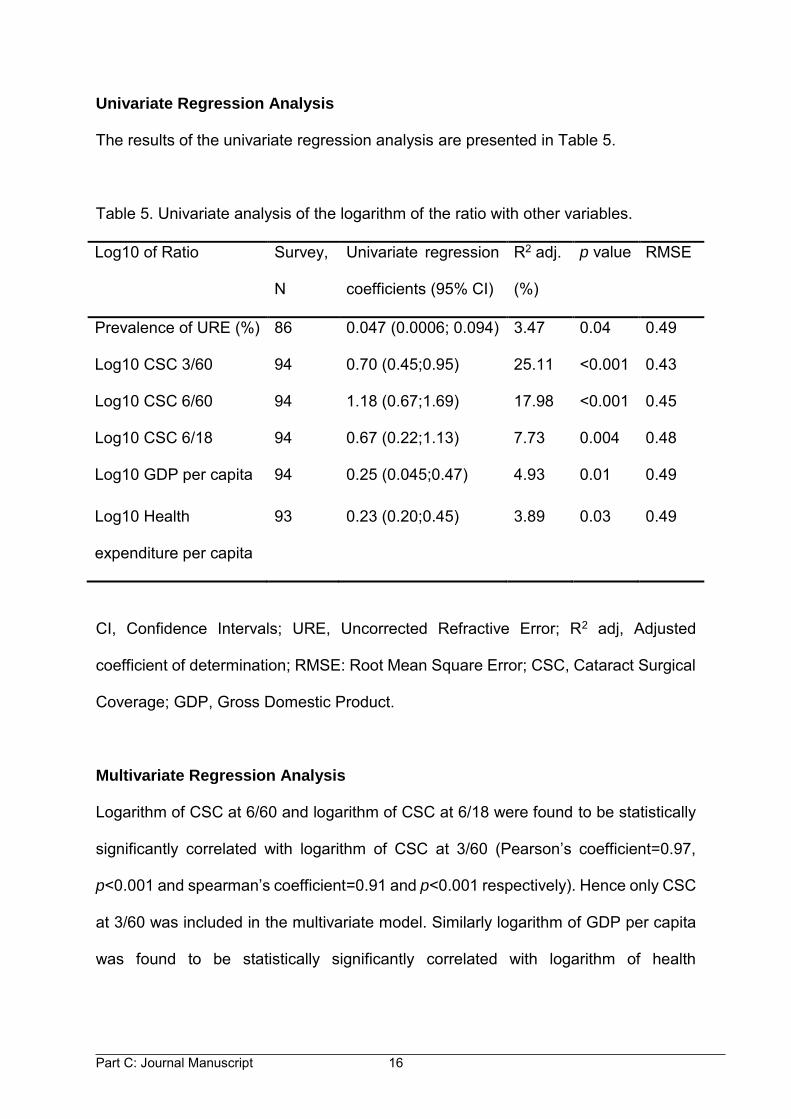
Part C: Journal Manuscript 16
Univariate Regression Analysis
The results of the univariate regression analysis are presented in Table 5.
Table 5. Univariate analysis of the logarithm of the ratio with other variables.
Log10 of Ratio Survey,
N
Univariate regression
coefficients (95% CI)
R2 adj.
(%)
p value RMSE
Prevalence of URE (%) 86 0.047 (0.0006; 0.094) 3.47 0.04 0.49
Log10 CSC 3/60 94 0.70 (0.45;0.95) 25.11 <0.001 0.43
Log10 CSC 6/60 94 1.18 (0.67;1.69) 17.98 <0.001 0.45
Log10 CSC 6/18 94 0.67 (0.22;1.13) 7.73 0.004 0.48
Log10 GDP per capita 94 0.25 (0.045;0.47) 4.93 0.01 0.49
Log10 Health
expenditure per capita
93 0.23 (0.20;0.45) 3.89 0.03 0.49
CI, Confidence Intervals; URE, Uncorrected Refractive Error; R2 adj, Adjusted
coefficient of determination; RMSE: Root Mean Square Error; CSC, Cataract Surgical
Coverage; GDP, Gross Domestic Product.
Multivariate Regression Analysis
Logarithm of CSC at 6/60 and logarithm of CSC at 6/18 were found to be statistically
significantly correlated with logarithm of CSC at 3/60 (Pearson’s coefficient=0.97,
p<0.001 and spearman’s coefficient=0.91 and p<0.001 respectively). Hence only CSC
at 3/60 was included in the multivariate model. Similarly logarithm of GDP per capita
was found to be statistically significantly correlated with logarithm of health
Part C: Journal Manuscript 17
expenditure per capita (spearman’s coefficient=0.94, p<0.001). Hence, logarithm of
GDP per capita was excluded from the model.
East Asia and Pacific was used as the reference region because it had the
largest number of surveys contributing to the study. In addition, the average mean
ratio of East Asia and Pacific region was the closest to the overall mean ratio of all the
surveys. The coefficients with p values of the multivariate regression model are
presented in Table 6.
Interpretation of the Multivariate Regression Model
Prevalence of URE and CSC at 3/60 explained the variability of the ratio of prevalence
of low vision to prevalence of blindness. The effect was statistically significant (p=0.03
and 0.002 respectively). The effect of health expenditure per capita on the ratio was
not statistically significant (p=0.60). On average, keeping prevalence of URE and CSC
at 3/60 constant, South Asia and Latin America and Caribbean had higher logarithms
of the ratio between prevalences of low vision and blindness compared to East Asia
and Pacific. However the effect was not statistically significant (p=0.07 for each). Sub-
Saharan Africa and Middle East and North Africa had lower logarithms of the ratio
compared to East Asia and Pacific. The effect for Sub-Saharan Africa was statistically
significant (p=0.002) but was not statistically significant for Middle East and North
Africa (p=0.11).
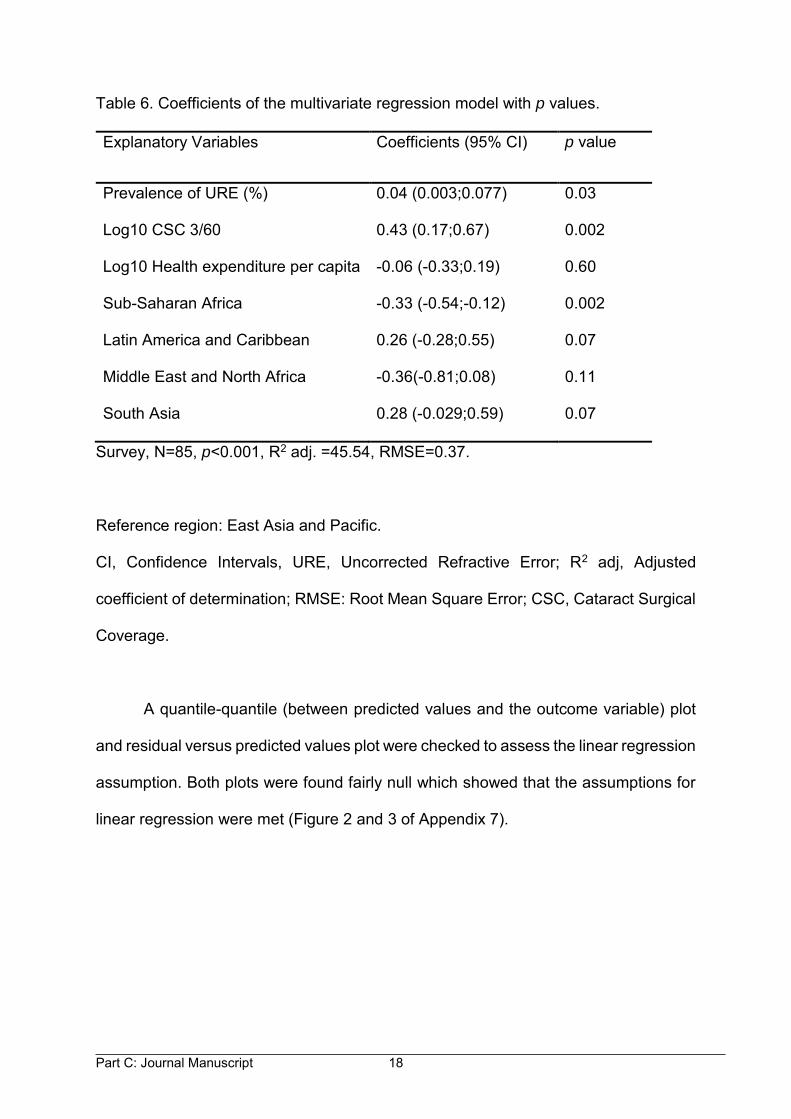
Part C: Journal Manuscript 18
Table 6. Coefficients of the multivariate regression model with p values.
Explanatory Variables Coefficients (95% CI) p value
Prevalence of URE (%) 0.04 (0.003;0.077) 0.03
Log10 CSC 3/60 0.43 (0.17;0.67) 0.002
Log10 Health expenditure per capita -0.06 (-0.33;0.19) 0.60
Sub-Saharan Africa -0.33 (-0.54;-0.12) 0.002
Latin America and Caribbean 0.26 (-0.28;0.55) 0.07
Middle East and North Africa -0.36(-0.81;0.08) 0.11
South Asia 0.28 (-0.029;0.59) 0.07
Survey, N=85, p<0.001, R2 adj. =45.54, RMSE=0.37.
Reference region: East Asia and Pacific.
CI, Confidence Intervals, URE, Uncorrected Refractive Error; R2 adj, Adjusted
coefficient of determination; RMSE: Root Mean Square Error; CSC, Cataract Surgical
Coverage.
A quantile-quantile (between predicted values and the outcome variable) plot
and residual versus predicted values plot were checked to assess the linear regression
assumption. Both plots were found fairly null which showed that the assumptions for
linear regression were met (Figure 2 and 3 of Appendix 7).
Part C: Journal Manuscript 19
DISCUSSION
In this analysis we have documented and described the wide variation in the ratio of
prevalences between low vision and blindness found in RAAB surveys from around
the world and explored several factors which might be correlated with the variation.
We expected that the magnitude of Uncorrected Refractive Error might be
important in explaining the variation. It is known from a previous systematic review in
Sub-Saharan Africa that URE is responsible for low vision rather than blindness10
although this has not been assessed in other regions. We also expected that the
cataract surgical coverage could affect the ratio since places where cataracts are not
operated on, even at very advanced levels might be expected to have relatively higher
prevalences of blindness. We also considered a few basic socioeconomic indicators
such as GDP per capita and health expenditure per capita.
We included a total of 94 RAAB studies from 43 countries. All World Bank
regions were represented although not evenly; 36%, 30%, 17%, 13% and 4% of
studies were from East Asia and Pacific, Sub-Saharan Africa, Latin America and
Caribbean, South Asia, and Middle East and North African regions respectively. It
was interesting to learn that the RAAB Repository provides access for less than 50%
(66/156) of the RAAB studies listed.
The ratio between unadjusted prevalences of low vision to blindness varied
from 1.35 in Mozambique to 11.03 in India. There was a big variation of the ratio across
the regions and it was statistically significant (Kruskal-Wallis test, χ²=28.23, p<0.001).
The highest mean ratio was found in South Asia (approximately 7.0, Range: 3.37 to
Part C: Journal Manuscript 20
11.03) and the lowest ratio was found in Sub-Saharan Africa (approximately 3.0,
Range: 1.35 to 6.16) (Table 4). The ratio was found to be in a similar range in Sub-
Saharan Africa by a previous study9, which relied on almost the same data as this one.
However a 2002 study conducted using 43 studies from 15 World Health Organization
subregions for all-ages found the range of the ratio to be 2.4 to 5.8, which is narrower
than our finding.18
The prevalence of URE varied widely in our study, between 1.38% in Ninh
Thuan, Vietnam-2007 and 14.66% in Ngozi & Kayanza, Burundi-2012. (Table 2). The
large variation of prevalence of URE is in agreement with other literature. A review
conducted in 2008 found that the prevalence of visual impairment caused by URE in
people aged 50 years and above was between 2% and 5% in most regions of the
world but nearly 10% in China and 20% in India and the other South East Asian
countries (Bangladesh, Nepal, Pakistan).19 In addition, as in our hypothesis,
prevalence of URE was found to be positively associated with the ratio (rs=0.26,
p=0.01).
There was a big difference in Cataract Surgical Coverage among the study
surveys. The CSC at 3/60 for persons was 10.1% in the 2011 study in Nampula,
Mozambique and 100% in Central Malaysia in the 2014 study. Similarly the CSC at
6/60 and 6/18 were the lowest in Nampula, Mozambique (8.2% and 6.4% respectively)
and the highest in Central, Malaysia (98% and 96.7% respectively). The variation of
CSC across the surveys reflects the varying level of service provision in the survey
sites.
Part C: Journal Manuscript 21
The univariate regression analysis showed that variation in the ratio of
prevalences between low vision and blindness could potentially be explained by
prevalence of URE, CSC by persons at 3/60, 6/60 and 6/18, logarithm of GDP per
capita and logarithm of health expenditure per capita across the WB regions (Table
5). We used variable CSC at 3/60, but not CSC at 6/60 and CSC at 6/18 for multiple
regression, because blindness is defined on the basis of Presenting Visual Acuity of
3/60 or worse in the better eye. Similarly, we believed that health expenditure per
capita is a better reflection of a country’s wealth spent on eye care than GDP per
capita. We therefore included health expenditure per capita in the multiple regression
analysis. In multivariate regression analysis, prevalence of URE and CSC at 3/60 were
found to be associated with the ratio of prevalences between low vision and blindness
across the regions (Table 6). However logarithm of health expenditure was not
statistically significantly associated with the ratio.
Our study has some limitations. We have included only RAAB surveys so our
study is likely to have the same limitations as the RAAB methodology. RAAB does not
provide an estimate of the prevalence of refractive error itself; instead it provides an
estimate of URE. These may be very similar in low income countries with limited eye
services. Another limitation is the potential variability in methodology among surveys.
In RAAB, URE is supposed to be reserved as a diagnosis for eyes that achieve normal
vision (6/18) with a pinhole; however, sometimes URE is used as the diagnosis in eyes
that do not fulfill this criteria (Lewallen’s unpublished data). It would have been
preferable to use the ratio of age and sex adjusted prevalences of low vison and
blindness in our study. The RAAB studies provide prevalence of URE only for the
sample population so we could not use age-adjusted ratio for our analysis. It would be
Part C: Journal Manuscript 22
interesting to do further analysis on gender adjusted prevalences of low vision and
blindness.
To the best of our knowledge this is the first large study to assess the magnitude
and determinants of the variation of ratio between prevalences of low vision and
blindness using RAAB studies globally. It appears that the prevalence of URE as well
as CSC affect this ratio and explain the wide variations that have been reported. When
making estimates of the magnitude of people with impaired vision in the world, it is
important to realise that the ratio of low vision to blindness will vary widely and not to
assume that it will always be 3 to 4 as was suggested in the early stages of the VISION
2020 initiative when the first attempts to estimate this were made.8 This study helps
us to quantify the variation and to understand some of the factors that influence it.
Part C: Journal Manuscript 23
REFERENCES
1. Bourne RR, Stevens GA, White RA, Smith JL, Flaxman SR, Price H, et al. Causes
of vision loss worldwide, 1990–2010: a systematic analysis. Lancet. 2013;1(6):
e339-e349.
2. Limburg H, Kumar R, Indrayan A, Sundaram K. Rapid assessment of prevalence
of cataract blindness at district level. Int J Epidemiol. 1997;26(5):1049-1054.
3. Bennett S, Woods T, Liyanage WM, Smith DL. A simplified general method for
cluster-sample surveys of health in developing countries. World Health Stat Q.
1991;44(3):98-106.
4. Lemeshow S, Robinson D. Surveys to measure programme coverage and impact:
a review of the methodology used by the expanded programme on immunization.
World Health Stat Q. 1985;38(1):65-75.
5. International Centre for Eye Health. Home: RAAB Repository [Internet]. Keppel
Street, London, UK: London School of Hygiene & Tropical Medicine; 2014 [cited
2016 30 January]. Available from: http://www.raabdata.info/.
6. Bastawrous A, Dean WH, Sherwin JC. Blindness and visual impairment due to
age-related cataract in sub-Saharan Africa: a systematic review of recent
population-based studies. Br J Ophthalmol. 2013;97(10):1237-1243.
7. Furtado JM, Lansingh VC, Carter MJ, Milanese MF, Peña BN, Ghersi HA, et al.
Causes of blindness and visual impairment in Latin America. Surv Ophthalmol.
2012;57(2):149-177.
8. Dyer G. A manual for VISION 2020:The Right to Sight workshops. London:
International Centre for Eye Health, London School of Hygiene & Tropical
Medicine, 2005.
Part C: Journal Manuscript 24
9. Lewallen S, Courtright P, Etya’ale D, Mathenge W, Schmidt E, Oye J, et al.
Cataract incidence in sub-Saharan Africa: what does mathematical modeling tell
us about geographic variations and surgical needs? Ophthalmic Epidemiol. 2013;
20(5):260-266.
10. Sherwin JC, Lewallen S, Courtright P. Blindness and visual impairment due to
uncorrected refractive error in sub-Saharan Africa: review of recent population-
based studies. Br J Ophthalmol. 2012;96(7):927-930.
11. Naidoo KS, Jaggernath J. Uncorrected refractive errors. Indian J Ophthalmol.
2012;60(5):432-437.
12. Durr NJ, Dave SR, Lage E, Marcos S, Thorn F, Lim D. From unseen to seen:
tackling the global burden of uncorrected refractive errors. Annu Rev Biomed Eng.
2014;16:131-153.
13. Kuper H, Polack S, Limburg H. Rapid assessment of avoidable blindness. Comm
Eye Health. 2006;19(60):68-69.
14. Lewallen S, Schmidt E, Jolley E, Lindfield R, Dean WH, Cook C, et al. Factors
affecting cataract surgical coverage and outcomes: a retrospective cross-sectional
study of eye health systems in sub-Saharan Africa. BMC Ophthalmol. 2015;
15(1):1.
15. World Bank. Countries [Internet]. Washington: World Bank; 2016 [cited 9 February
2016]. Available from: http://www.worldbank.org/en/country.
16. World Bank. GDP per capita [Internet]. Washington: World Bank; 2016 [cited 9
February 2016]. Available from:http://data.worldbank.org/indicator/NY.GDP.
PCAP.CD.
Part C: Journal Manuscript 25
17. World Bank. Health expenditure per capita [Internet]. Washington: World Bank;
2016 [cited 9 February 2016]. Available from:http://data.worldbank.org/indicator/
SH.XPD. PCAP/countries.
18. Resnikoff S, Pascolini D, Etya'ale D, Kocur I, Pararajasegaram R, Pokharel GP, et
al. Global data on visual impairment in the year 2002. Bull World Health Organ.
2004;82(11):844-851.
19. Resnikoff S, Pascolini D, Mariotti SP, Pokharel GP. Global magnitude of visual
impairment caused by uncorrected refractive errors in 2004. Bull World Health
Organ. 2008;86(1):63-70.

Part D: Appendices
Part D: Appendices 2
TABLE OF CONTENTS
1. Appendix1: Inclusion Criteria Checklist…….…………………………………………3
2. Appendix 2: Data Capture Sheet………………………………..…………...…….....4
3. Appendix 3: Rapid Assessment of Avoidable Blindness Survey Form...………….5
4. Appendix 4: Ethical Approval Letter…………………………………………………..6
5. Appendix 5: Instructions for Authors ....………………………………………………7
6. Appendix 6: Supplementary Tables...……………………………………………….16
7. Appendix 7: Supplementary Figures………………………………………………...22
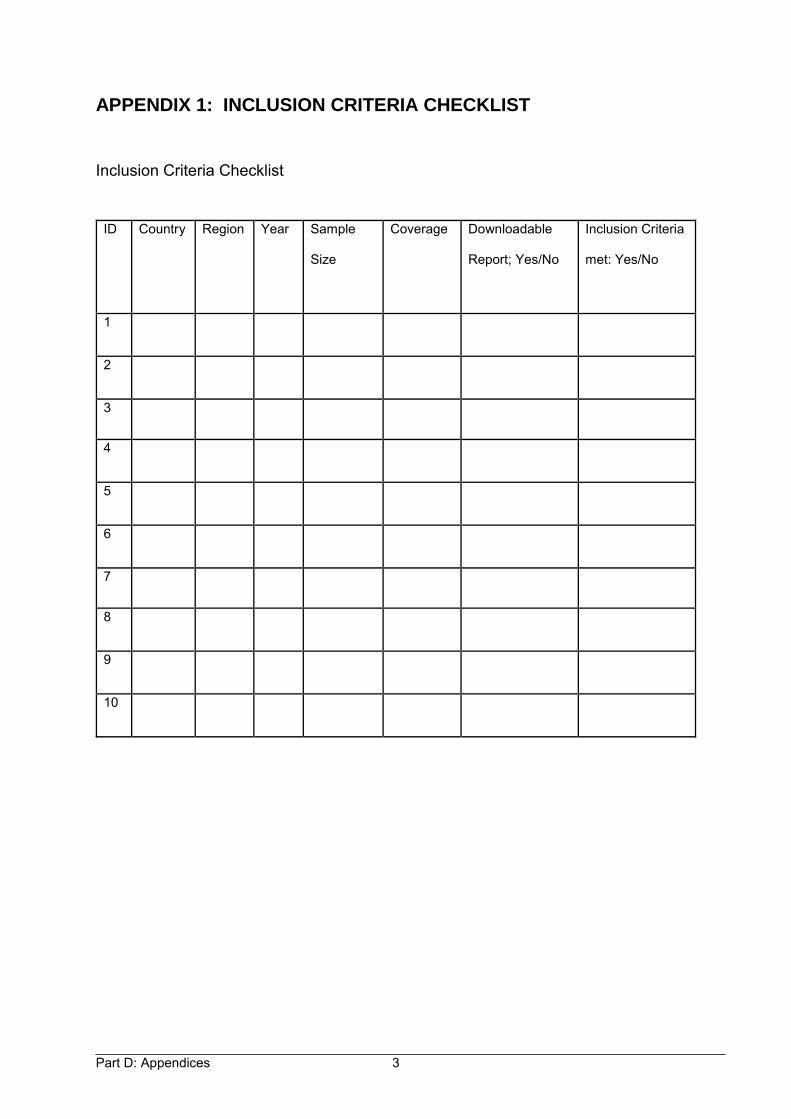
Part D: Appendices 3
APPENDIX 1: INCLUSION CRITERIA CHECKLIST
Inclusion Criteria Checklist
ID Country Region Year Sample
Size
Coverage Downloadable
Report; Yes/No
Inclusion Criteria
met: Yes/No
1
2
3
4
5
6
7
8
9
10
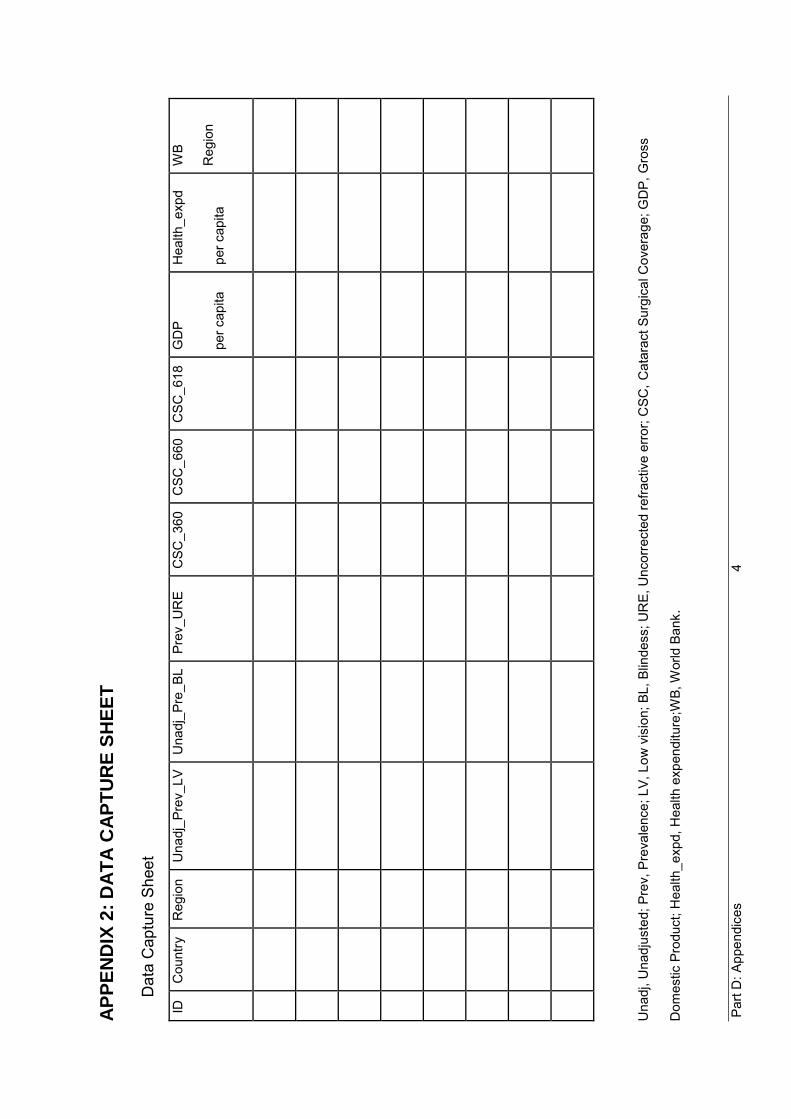
Par
t D: A
ppen
dice
s
4
AP
PE
ND
IX 2
: D
AT
A C
AP
TU
RE
SH
EE
T
Dat
a C
aptu
re S
heet
Una
dj, U
nadj
uste
d; P
rev,
Pre
vale
nce;
LV,
Low
vis
ion;
BL,
Blin
dess
; UR
E, U
ncor
rect
ed re
fract
ive
erro
r; C
SC, C
atar
act S
urgi
cal C
over
age;
GD
P, G
ross
Dom
estic
Pro
duct
; Hea
lth_e
xpd,
Hea
lth e
xpen
ditu
re;W
B, W
orld
Ban
k.
ID
Cou
ntry
R
egio
n U
nadj
_Pre
v_LV
U
nadj
_Pre
_BL
Prev
_UR
E
CSC
_360
C
SC_6
60
CSC
_618
G
DP
per c
apita
Hea
lth_e
xpd
per c
apita
WB
Reg
ion
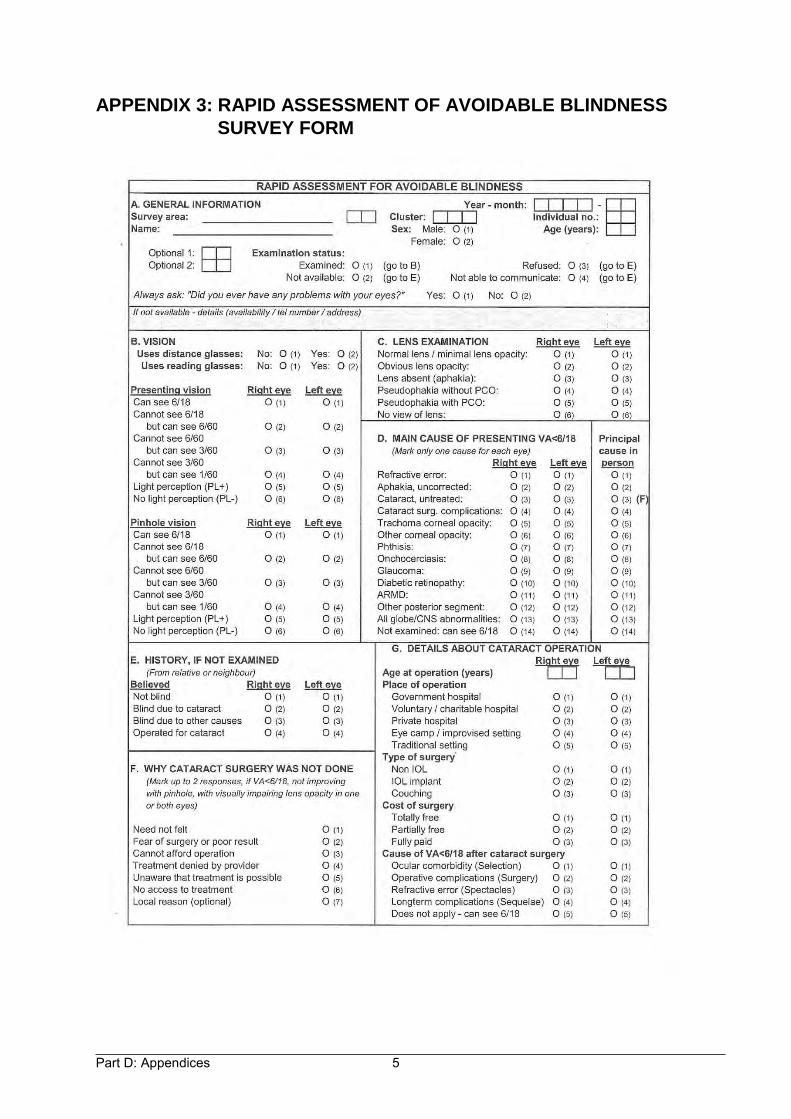
Part D: Appendices 5
APPENDIX 3: RAPID ASSESSMENT OF AVOIDABLE BLINDNESS
SURVEY FORM
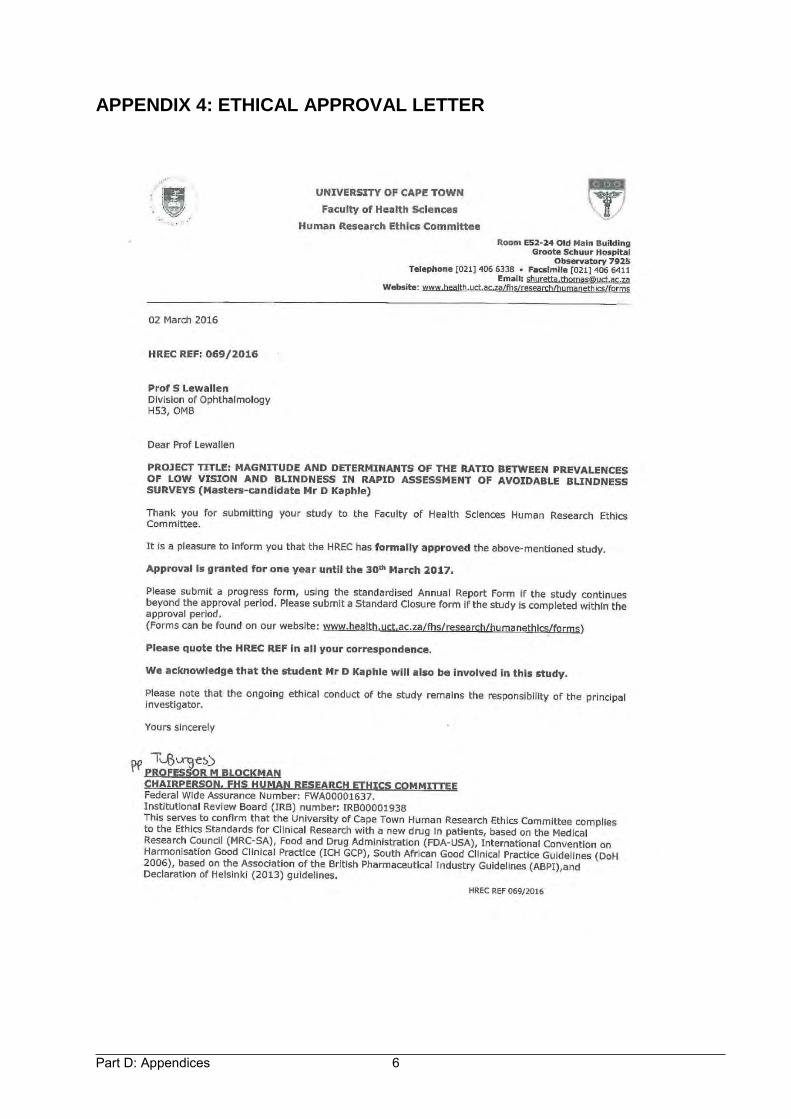
Part D: Appendices 6
APPENDIX 4: ETHICAL APPROVAL LETTER
Part D: Appendices 7
APPENDIX 5: INSTRUCTIONS FOR AUTHORS
Ophthalmic Epidemiology
Official journal of the International Society of Geographic and Epidemiologic
Ophthalmology (ISGEO)
ISSN: 0928-6586 (Print), 1744-5086 (Online)
Publication Frequency: 6 issues per year
Instructions for authors
Thank you for choosing to submit your paper to us. These instructions will ensure we have
everything required so your paper can move through peer review, production and publication
smoothly. Please take the time to read them and follow the instructions as closely as
possible.
Author Services
Should you have any queries, please visit our Author Services website or contact us at
This journal uses ScholarOne Manuscripts (previously Manuscript Central) to peer
review manuscript submissions. Please read the guide for ScholarOne authors before
Part D: Appendices 8
making a submission. Complete guidelines for preparing and submitting your
manuscript to this journal are provided below.
Instructions for Authors
All submissions should be submitted at http://mc.manuscriptcentral.com/nope
All submissions should be typewritten, double spaced, with consecutively numbered
pages.
All abbreviations/acronyms must be defined at first use in abstract, again at first use
in the text and in each and every table or figure, regardless of redundancy
Publishing Ethics
The Editors and Taylor & Francis Group are committed to the highest academic,
professional, legal, and ethical standards in publishing work in this journal. To this end,
we have adopted a set of guidelines, to which all submitting authors are expected to
adhere, to assure integrity and ethical publishing for authors, reviewers, and editors.
Taylor & Francis is a member of the Committee of Publications Ethics (COPE). COPE
aims to provide a forum for publishers and editors of scientific journals to discuss
issues relating to the integrity of their work, including conflicts of interest, falsification
and fabrication of data, plagiarism, unethical experimentation, inadequate subject
consent, and authorship disputes. For more information on COPE please visit
http://publicationethics.org.
Part D: Appendices 9
The following are the files need to make your online submission complete:
I. MANUSCRIPT FILE
1. Cover page –
a) list the title of your submission – no abbreviations or acronyms
b) list all authors in publication order and related affiliations,
c) indicate who is the corresponding author and contact information (especially email),
d) financial support – list all financial support
e) list any proprietary interests or conflicts of interest for any and all authors related to this
submission. If none, please state: None of the authors have any proprietary interests or
conflicts of interest related to this submission.
f) Statement that this submission has not been published anywhere previously and that it
is not simultaneously being considered for any other publication.
g) supply a running head - a shortened version of title, not to exceed 50 characters
2. Abstract – start on new page – not to exceed 250 words, define all abbreviations or
acronyms used at first use, formatted into the following four sections:
a) Purpose,
b) Methods
c) Results
d) Conclusion
3. Text – start on new page, should not exceed 4,000 words - define all abbreviations and
acronyms at first use (even if previously defined in abstract) and should be divided into the
following 5 sections:
a) Introduction,
b) Materials and Methods – should include a statement regarding adherence to the
guidelines of the Declaration of Helsinki as well as advising the name of the institution that
granted the Institutional Review Board approval
Part D: Appendices 10
c) Results,
d) Discussion,
e) References – cite in the text as superscript, consecutively as they appear in the
text. Abstracts should be cited parenthetically within the text as well as any personal
communication or unpublished data. Only published and accepted (in press) articles can be
cited. Submitted articles are not citable.
4. References - Cite in the text by reference number. The references should be numbered
consecutively as they occur in the text. Prepare a numbered reference list. Abstracts and
articles submitted or in press are not proper references. These should be listed as personal
communication. Examples:
Journal: Mohney BG, Robertson DM, Schomberg PJ. Second nonocular tumors in survivors
of heritable retinoblastoma and prior radiation therapy. Am J Ophthalmol. 1998; 126(2):269-
277.
Book: Raven JC, Court JH, Raven J. Manual for Raven' Progressive Matrices and
Vocabulary Scales. London: H.K. Lewis & Co. Ltd., 1986.
II. Tables and Figures: Tables and figures should not be embedded in the text, but should
be included as separate sheets or files. A short descriptive title should appear above each
table with a clear legend and any footnotes suitably identified below. All units must be
included. Figures should be completely labelled, taking into account necessary size
reduction.
Captions should be typed, double-spaced, on a separate sheet. All original figures should be
clearly marked with the number, author’s name, and top edge indicated.
Part D: Appendices 11
III. Illustrations: Illustrations submitted (line drawings, halftones, photos,
photomicrographs, etc.) should be clean originals or digital files. Digital files are
recommended for highest quality reproduction and should follow these guidelines:
300 dpi or higher
sized to fit on journal page
EPS, TIFF, or PSD format only
submitted as separate files, not embedded in text files
Color Reproduction: Color art will be reproduced in color in the online publication at
no additional cost to the author. Color illustrations will also be considered for print
publication; however, the author will be required to bear the full cost involved in color
art reproduction.
Please note that color reprints can only be ordered if print reproduction costs are
paid. Print Rates: $900 for the first page of color; $450 per page for the next three
pages of color. A custom quote will be provided for articles with more than four
pages of color. Art not supplied at a minimum of 300 dpi will not be considered for
print.
IV. COPYRIGHT FORM(s) – available upon article acceptance
It is a condition of publication that authors assign copyright or license the publication
rights of the contents of their articles, including abstracts, to Taylor and Francis. This
enables full copyright protection and dissemination of the article and the Journal, to
the widest possible readership in electronic and print formats. A document to verify
this will be sent upon acceptance for publication. This document should be signed by
the corresponding author and returned to the publisher for archiving.
Part D: Appendices 12
V. ACKNOWLEDGMENTS: The journal will print acknowledgements if requested
by authors, please do not confuse this with financial support. It is requested that
these are kept to a minimum. If you wish to acknowledge those who reviewed,
discussed, translated references, provided extensive statistical assistance, or
provided essential tissue, equipment, or other materials without which the study
could not have been completed, written permission from the person being
acknowledged is required.
OTHER GENERAL INFORMATION:
Submission of a review article needs approval from the Editor-in-Chief prior to
submission.
Permissions: Authors are responsible for obtaining permission to reproduce
copyrighted material from other sources and are required to sign an agreement for
the transfer of copyright to the publisher. As an author you are required to secure
permission if you want to reproduce any figure, table or extract text from any other
source. This applies to direct reproduction as well as "derivative reproduction"
(where you have created a new figure or table which derives substantially from a
copyrighted source).
Page Proofs: All proofs must be corrected and returned to the publisher within 48
hours of receipt. If the manuscript is not returned within the allotted time, the editor
will proofread the article and it will be printed per the editor’s instruction. Only
correction of typographical errors is permitted.
Part D: Appendices 13
Complimentary Policy and Reprints: Authors for whom we receive a valid email
address will be provided an opportunity to purchase reprints of individual articles, or
copies of the complete print issue. These authors will also be given complimentary
access to their final article on Taylor & Francis Online.
SUBMISSION PROCESS:
1. LOG IN AT: http://mc.manuscriptcentral.com/nope
2. REGISTER AS AUTHOR – be sure you are not already in the system
3. SELECT TYPE OF MANUSCRIPT
4. SUPPLY TITLE OF MANUSCRIPT
5. ABSTRACT: Copy and paste your abstract from your manuscript file
6. KEYWORDS: Supply minimum of 5 key words for your submission
7. AUTHORS: enter the names and information of all authors
8. REVIEWERS: You can indicate the names of persons you prefer to or not to
review your submission. This is considered but not guaranteed.
9. DETAILS AND COMMENTS: You must answer certain mandatory questions
Number of figures in your submission
Number of color figures
Number of tables
Number of words
Consent to pay for color figures
Confirm that the manuscript has been submitted solely to this journal and is not
published, in press, or submitted elsewhere
Confirm that all the research meets the ethical guidelines, including adherence
to the legal requirements of the study country and that a statement is included the
Part D: Appendices 14
manuscript regarding IRB approval is required.
Confirm any potential conflict of interests
Confirm you are aware of copyright issues
10. UPLOAD FILES: manuscript: including cover page, abstract text and
references, tables and each figure
11 REVIEW that these are the correct files etc.
12. SUBMIT
Open Access
Articles are eligible for Open Access. Electing this option allows the article to be
made freely available online under a Creative Commons License. Authors of
accepted papers will have the opportunity to purchase open access at proofs stage.
Please note: This option is separate from Taylor and Francis's NIH Fund policy.
NIH Research Policy
NIH policy: NIH-funded authors must submit to PMC, or have submitted on their
behalf, at the point of acceptance, their peer-reviewed author manuscripts, to appear
on PMC no later than 12 months after final publication.
In consideration of the National Institutes of Health (NIH) Public and Open Access
Policies, the Taylor and Francis journals group acknowledges that the broad and
open dissemination of NIH -funded research results can benefit future scientific and
medical research.
As part of our author services program, Taylor and Francis will assist authors in
Part D: Appendices 15
depositing to PubMed Central (PMC) author manuscripts reporting NIH funded
research, on specific request by the author. Upon this request, Taylor and
Francis will deliver to PMC the final peer-reviewed manuscript, which was accepted
for publication and that reflects any author-agreed changes made in response to the
peer review. We will also authorize the manuscript’s public access posting 12
months (NIH) after initial publication in print or electronic form (whichever is sooner).
Following the deposit, authors will receive further communications from the NIH
Manuscript Submission System with respect to the submission.
Authors wishing to submit their funded work to PMC themselves are welcome to do
so providing they follow the terms stated – submitting only the final peer-reviewed
manuscript which was accepted for publication (this manuscript must not be altered
by Publisher’s copyediting and typesetting services) and stating the 12 month (NIH)
embargo period after final publication.
Please note that authors should not deposit post-print manuscripts directly to PMC or
other third party sites for any systematic external distribution by a third party (e.g., to
a listserv or database connected to a public access server).
All authors must comply with our editorial polices.
CrossCheck
Please note that your paper may be sent to CrossCheck for a plagiarism check.
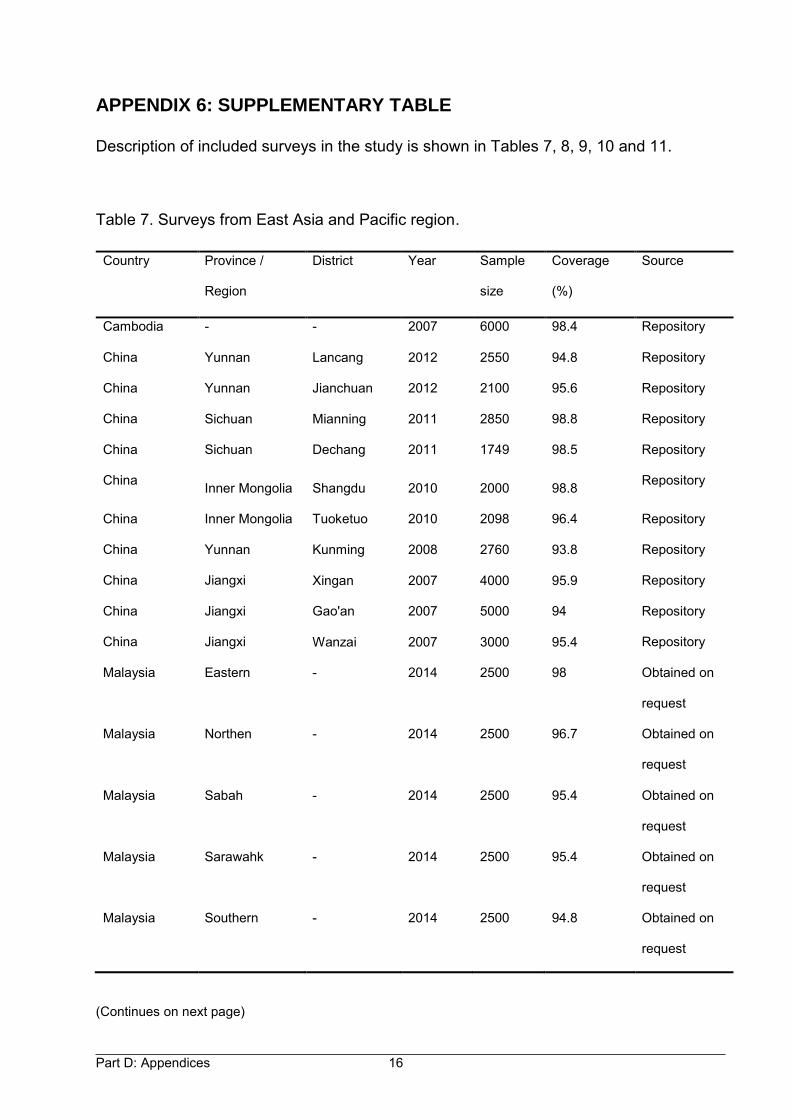
Part D: Appendices 16
APPENDIX 6: SUPPLEMENTARY TABLE
Description of included surveys in the study is shown in Tables 7, 8, 9, 10 and 11.
Table 7. Surveys from East Asia and Pacific region.
(Continues on next page)
Country Province /
Region
District Year Sample
size
Coverage
(%)
Source
Cambodia - - 2007 6000 98.4 Repository
China Yunnan Lancang 2012 2550 94.8 Repository
China Yunnan Jianchuan 2012 2100 95.6 Repository
China Sichuan Mianning 2011 2850 98.8 Repository
China Sichuan Dechang 2011 1749 98.5 Repository
China Inner Mongolia Shangdu 2010 2000 98.8 Repository
China Inner Mongolia Tuoketuo 2010 2098 96.4 Repository
China Yunnan Kunming 2008 2760 93.8 Repository
China Jiangxi Xingan 2007 4000 95.9 Repository
China Jiangxi Gao'an 2007 5000 94 Repository
China Jiangxi Wanzai 2007 3000 95.4 Repository
Malaysia Eastern - 2014 2500 98 Obtained on
request
Malaysia Northen - 2014 2500 96.7 Obtained on
request
Malaysia Sabah - 2014 2500 95.4 Obtained on
request
Malaysia Sarawahk - 2014 2500 95.4 Obtained on
request
Malaysia Southern - 2014 2500 94.8 Obtained on
request
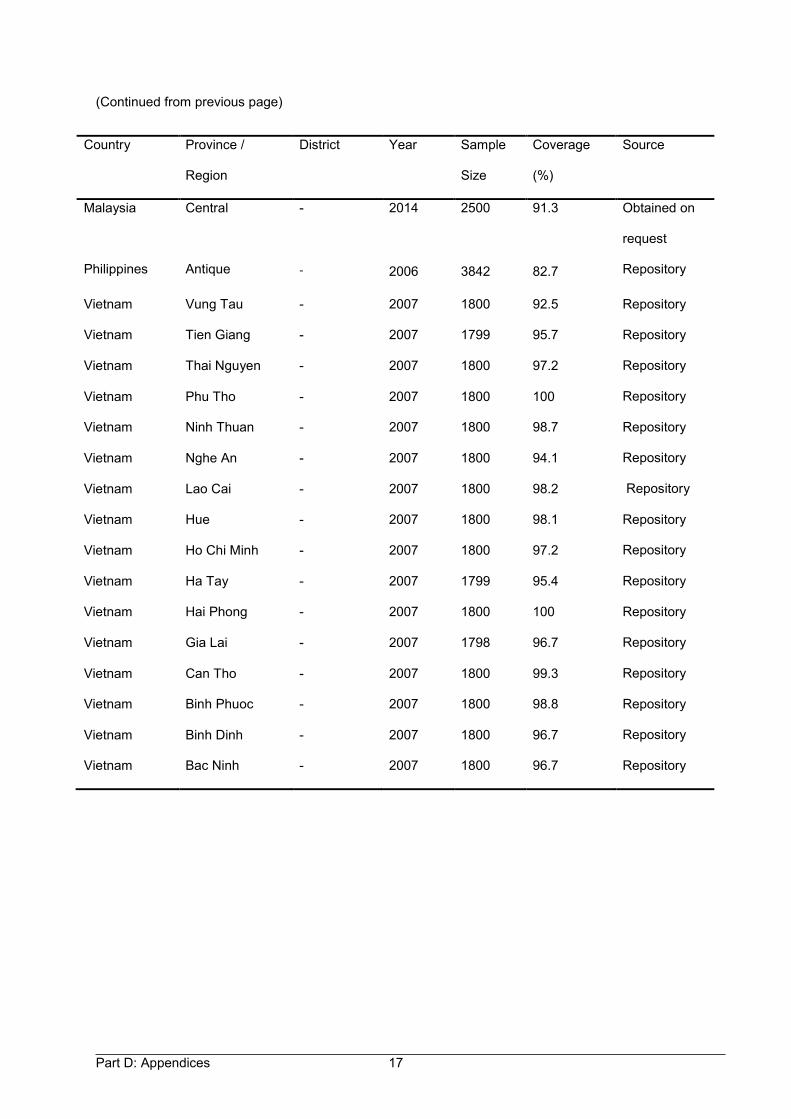
Part D: Appendices 17
(Continued from previous page)
Country Province /
Region
District Year Sample
Size
Coverage
(%)
Source
Malaysia Central - 2014 2500 91.3 Obtained on
request
Philippines Antique - 2006 3842 82.7 Repository
Vietnam Vung Tau - 2007 1800 92.5 Repository
Vietnam Tien Giang - 2007 1799 95.7 Repository
Vietnam Thai Nguyen - 2007 1800 97.2 Repository
Vietnam Phu Tho - 2007 1800 100 Repository
Vietnam Ninh Thuan - 2007 1800 98.7 Repository
Vietnam Nghe An - 2007 1800 94.1 Repository
Vietnam Lao Cai - 2007 1800 98.2 Repository
Vietnam Hue - 2007 1800 98.1 Repository
Vietnam Ho Chi Minh - 2007 1800 97.2 Repository
Vietnam Ha Tay - 2007 1799 95.4 Repository
Vietnam Hai Phong - 2007 1800 100 Repository
Vietnam Gia Lai - 2007 1798 96.7 Repository
Vietnam Can Tho - 2007 1800 99.3 Repository
Vietnam Binh Phuoc - 2007 1800 98.8 Repository
Vietnam Binh Dinh - 2007 1800 96.7 Repository
Vietnam Bac Ninh - 2007 1800 96.7 Repository
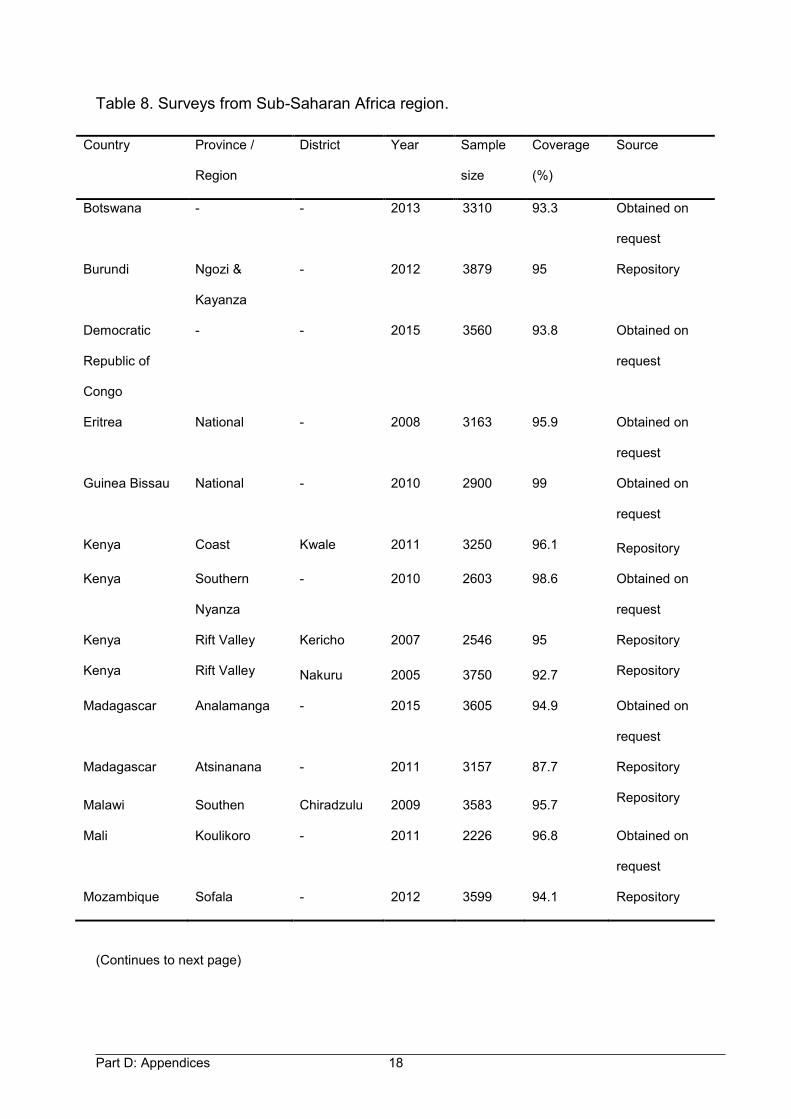
Part D: Appendices 18
Table 8. Surveys from Sub-Saharan Africa region.
(Continues to next page)
Country Province /
Region
District Year Sample
size
Coverage
(%)
Source
Botswana - - 2013 3310 93.3 Obtained on
request
Burundi Ngozi &
Kayanza
- 2012 3879 95 Repository
Democratic
Republic of
Congo
- - 2015 3560 93.8 Obtained on
request
Eritrea National - 2008 3163 95.9 Obtained on
request
Guinea Bissau National - 2010 2900 99 Obtained on
request
Kenya Coast Kwale 2011 3250 96.1 Repository
Kenya Southern
Nyanza
- 2010 2603 98.6 Obtained on
request
Kenya Rift Valley Kericho 2007 2546 95 Repository
Kenya Rift Valley Nakuru 2005 3750 92.7 Repository
Madagascar Analamanga - 2015 3605 94.9 Obtained on
request
Madagascar Atsinanana - 2011 3157 87.7 Repository
Malawi Southen Chiradzulu 2009 3583 95.7 Repository
Mali Koulikoro - 2011 2226 96.8 Obtained on
request
Mozambique Sofala - 2012 3599 94.1 Repository
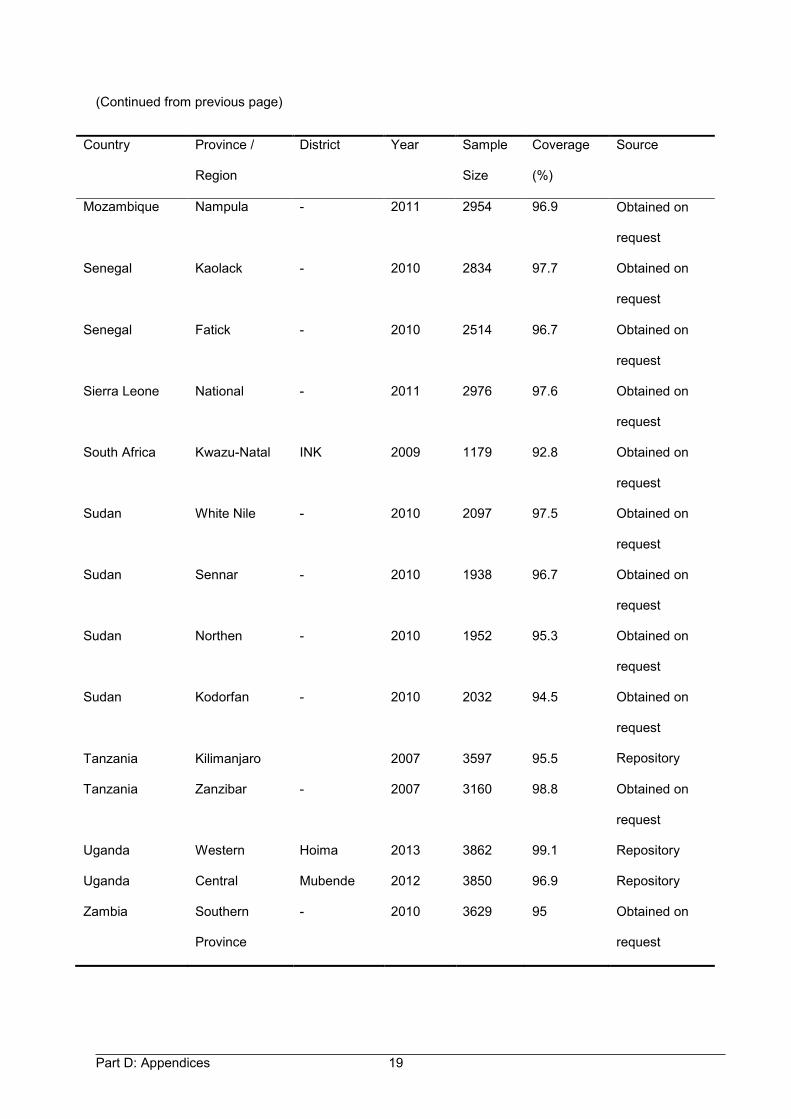
Part D: Appendices 19
(Continued from previous page)
Country Province /
Region
District Year Sample
Size
Coverage
(%)
Source
Mozambique Nampula - 2011 2954 96.9 Obtained on
request
Senegal Kaolack - 2010 2834 97.7 Obtained on
request
Senegal Fatick - 2010 2514 96.7 Obtained on
request
Sierra Leone National - 2011 2976 97.6 Obtained on
request
South Africa Kwazu-Natal INK 2009 1179 92.8 Obtained on
request
Sudan White Nile - 2010 2097 97.5 Obtained on
request
Sudan Sennar - 2010 1938 96.7 Obtained on
request
Sudan Northen - 2010 1952 95.3 Obtained on
request
Sudan Kodorfan - 2010 2032 94.5 Obtained on
request
Tanzania Kilimanjaro 2007 3597 95.5 Repository
Tanzania Zanzibar - 2007 3160 98.8 Obtained on
request
Uganda Western Hoima 2013 3862 99.1 Repository
Uganda Central Mubende 2012 3850 96.9 Repository
Zambia Southern
Province
- 2010 3629 95 Obtained on
request
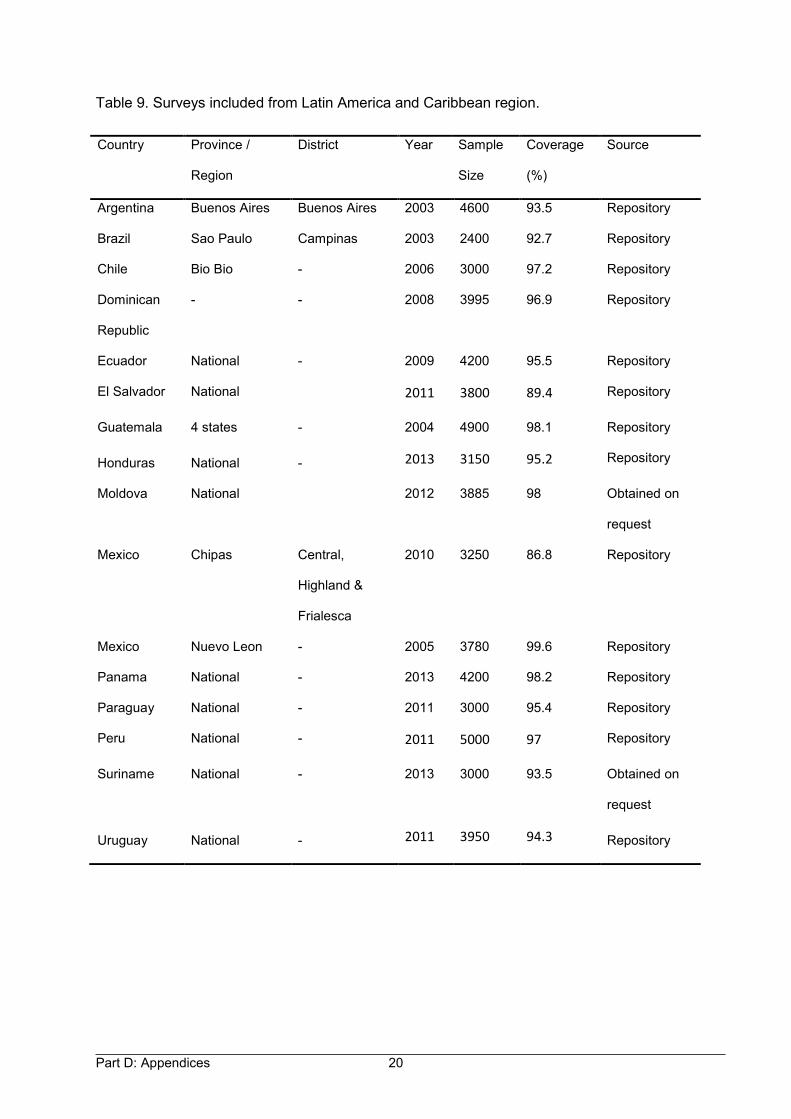
Part D: Appendices 20
Table 9. Surveys included from Latin America and Caribbean region.
Country Province /
Region
District Year Sample
Size
Coverage
(%)
Source
Argentina Buenos Aires Buenos Aires 2003 4600 93.5 Repository
Brazil Sao Paulo Campinas 2003 2400 92.7 Repository
Chile Bio Bio - 2006 3000 97.2 Repository
Dominican
Republic
- - 2008 3995 96.9 Repository
Ecuador National - 2009 4200 95.5 Repository
El Salvador National 2011 3800 89.4 Repository
Guatemala 4 states - 2004 4900 98.1 Repository
Honduras National - 2013 3150 95.2 Repository
Moldova National 2012 3885 98 Obtained on
request
Mexico Chipas Central,
Highland &
Frialesca
2010 3250 86.8 Repository
Mexico Nuevo Leon - 2005 3780 99.6 Repository
Panama National - 2013 4200 98.2 Repository
Paraguay National - 2011 3000 95.4 Repository
Peru National - 2011 5000 97 Repository
Suriname National - 2013 3000 93.5 Obtained on
request
Uruguay National - 2011 3950 94.3 Repository
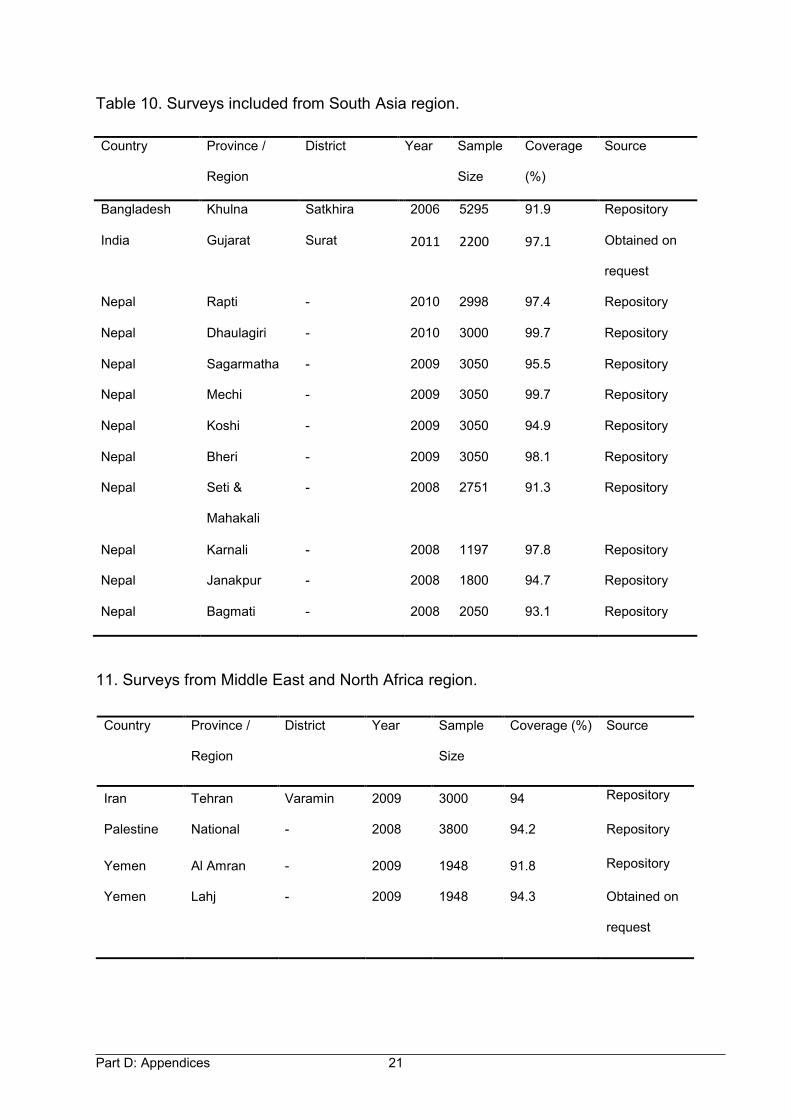
Part D: Appendices 21
Table 10. Surveys included from South Asia region.
11. Surveys from Middle East and North Africa region.
Country Province /
Region
District Year Sample
Size
Coverage
(%)
Source
Bangladesh Khulna Satkhira 2006 5295 91.9 Repository
India Gujarat Surat 2011 2200 97.1 Obtained on
request
Nepal Rapti - 2010 2998 97.4 Repository
Nepal Dhaulagiri - 2010 3000 99.7 Repository
Nepal Sagarmatha - 2009 3050 95.5 Repository
Nepal Mechi - 2009 3050 99.7 Repository
Nepal Koshi - 2009 3050 94.9 Repository
Nepal Bheri - 2009 3050 98.1 Repository
Nepal Seti &
Mahakali
- 2008 2751 91.3 Repository
Nepal Karnali - 2008 1197 97.8 Repository
Nepal Janakpur - 2008 1800 94.7 Repository
Nepal Bagmati - 2008 2050 93.1 Repository
Country Province /
Region
District Year Sample
Size
Coverage (%) Source
Iran Tehran Varamin 2009 3000 94 Repository
Palestine National - 2008 3800 94.2 Repository
Yemen Al Amran - 2009 1948 91.8 Repository
Yemen Lahj - 2009 1948 94.3 Obtained on
request
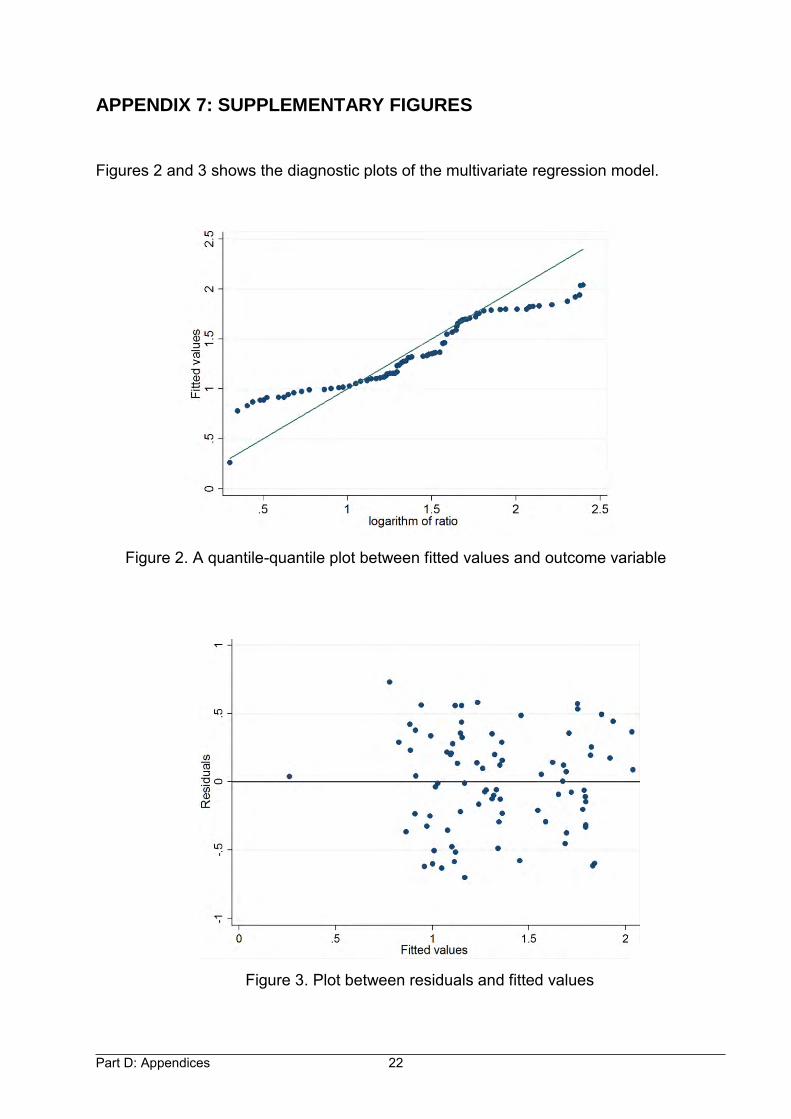
Part D: Appendices 22
APPENDIX 7: SUPPLEMENTARY FIGURES
Figures 2 and 3 shows the diagnostic plots of the multivariate regression model.
Figure 2. A quantile-quantile plot between fitted values and outcome variable
Figure 3. Plot between residuals and fitted values