“magnitude and determinants of the flows of investment ... · saarc cci position paper on...
TRANSCRIPT

“Magnitude and Determinants of the Flows of Investment among
South Asian Countries”
SAARC CCI Position Paper on Investment Regime in SAARC
A Publication of SAARC Chamber of Commerce & Industry
Supported by :
Fridrich-Naumann-Stiftung Fur Die Freiheit

SAARC CCI Position Paper on Investment Regime in SAARC
“Magnitude and Determinants of the Flows of Investmentamong South Asian Countries”
A Publication of SAARC Chamber of Commerce & Industry
Supported by :
Fridrich-Naumann-Stiftung Fur Die Freiheit


Lead author: Muhammad Ayub Mehar Khan(Ph.D)
Academic Group: Mr. Abdul Wassay Haqiqi, Afghanistan Dr. Abdur Rob Khan, Bangladesh Dr. Nawal K Paswan, India Mr. Mdhukar Rana, Nepal Mr. Mujeeb Ahmed Khan, Pakistan Mr. Tilak Collure, Sri Lanka Dr. Selim Raihan, Bangladesh Mr. Muhammad Iqbal Tabish,
Expert group: Mr. Annisul Huq, Bangladesh Mr. Thinly Dorji, BhutanMr. Vikramjit Singh Sahney, IndiaMr. Hamid Ismail, MaldivesMr. Pradeep Kumar Shrestha, NepalMr. Iftikhar Ali Malik, Pakistan Mr. Kosala Wickramanyake, Sri Lanka
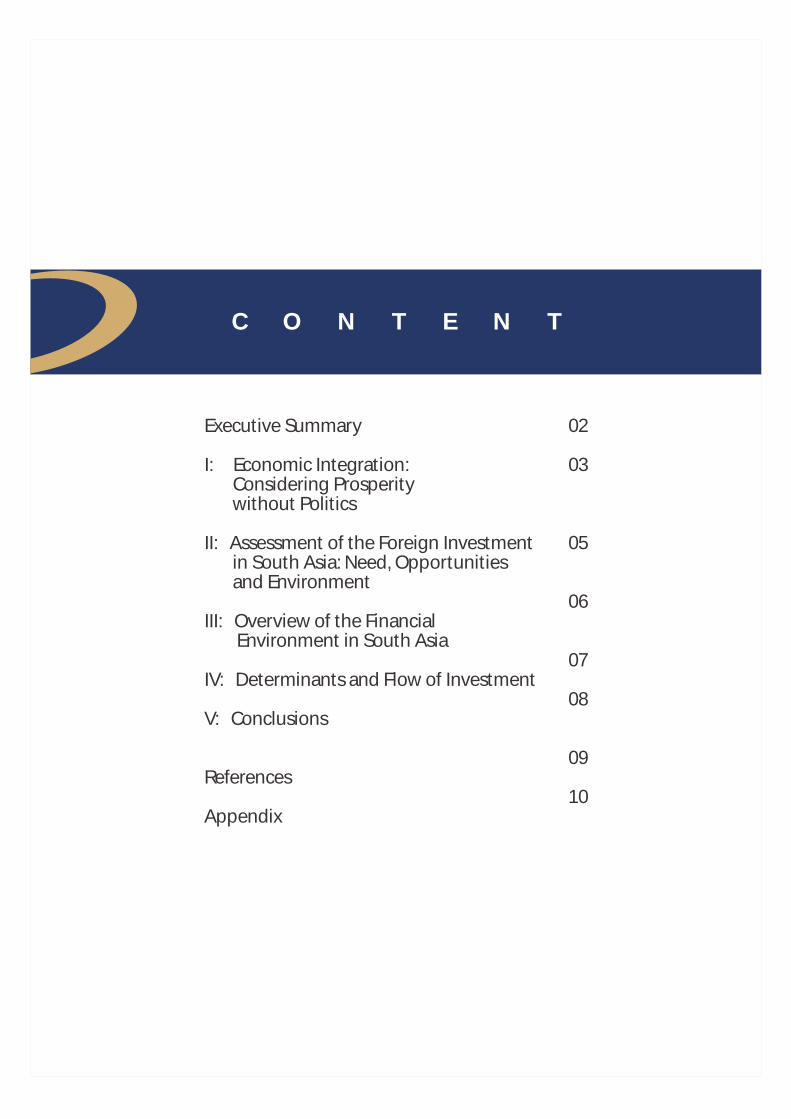
Executive Summary
I: Economic Integration: Considering Prosperity without Politics
II: Assessment of the Foreign Investment in South Asia: Need, Opportunities and Environment
III: Overview of the Financial Environment in South Asia
IV: Determinants and Flow of Investment
V: Conclusions
References
Appendix
02
03
05
06
07
08
09
10
C O N T E N T

TABLESTable 2.1: Flow of Foreign Exchange through Non Trade Sources Table 2.2: Ranking of Investment FactorsTable 2.3: Inflow of Foreign InvestmentTable 2.4: Flow of Foreign Direct InvestmentTable 2.5: Flow of Foreign Direct Investment as % of Gross Fixed Capital FormationTable 2.6: Stocks of Foreign Direct InvestmentTable 2.7: Stocks of Foreign Direct Investment as % of GDPTable 2.8: Cross Boarder Mergers and AcquisitionsTable 2.9: Mergers and Acquisitions (Number of Deals)Table 2.10: Number of International Investment AgreementsTable 2.11: Investment in infrastructure projects with private participationTable 2.12: Doing Business IndicatorsTable 2.13: Major Constraint in InvestmentTable 3.1: Financial Assets by Major TypesTable 3.2: Stock Market IndicatorsTable 3.3: 'P/E' Multipliers and 'P/BV' Ratios in Emerging AsiaTable 3.4: Financial Sector DevelopmentTable 3.5: Financial Sector Development Indexes 1-7 (7 is best)Table 3.6: Financial Access and StabilityTable 3.7: Monetary and Fiscal Policy Indicators Table 3.8: Central Banks' Policy Rates Table 3.9: Interest Rate BehaviorsTable 3.10: Currency Exchange Rates Movement

Executive Summary
02
Economic integration and cross border investment are the integral part of neo liberalism and free trade regime under the banner of globalization. The success and sustainability of free trade regime are essentially linked with cross border free mobilization of factors of production which in turn depends to a large extent on geo political relations among countries. In present day world, free trade regime cannot be avoided by any country on any pretext. Rather, free cross border mobilization of factors of production has become part and parcel of globalization and countries in a region have to adopt free trade policies willingly or unwillingly because economic isolation is no longer possible in the new global scenario.
This study analyzes the possibility of economic integration and cross border investment in South Asian perspective in the larger sphere of trade, investment, factors mobility and formation of a monetary union. Regardless of the impacts of idealogies, political thoughts, history and variation in cultural and linguisticdiversities and sociology, various possibilities and consequences of economic integration of South Asian countries have been considered and discussed in the study.
It is widely considered that economic relations and mutual dependency on economic resources go a long way to diffuse the political tensions and help in averting the cold war or a war like situation. Economic integration is the most effective mechanism for sustainable development of economic relations among nations.
Several observations from the monetary and fiscal environment indicate that there exist disparities between South Asia and the other parts of the world. Lower private sector investment in South Asia invites foreign investment because of lower propensity to save.
This study covers various aspects of cross border mobilization of capital among South Asian countries. The study also includes a brief analysis of the political disputes between the two big nations of South Asia i.e India and Pakistan. The deep rooted historical complications and complexities are reflected in the present day politico-economic relations among the two neighbouring countries. The important thing for all of us is the future well being of South Asia. The economic methodology allows us to discuss the possibilities of economic relations and participation by ignoring the political variables. All recommendations are based on this proposition.
Considering liberalization regime could provide much needed openness in their respective economies, various South Asian countries have revised their investment polices and made appropriate amendments in their regulations. All these changes have brought visible improvements in the financial environment, securities regulations, capital markets' mechanism and regulatory frameworks in these countries. Nevertheless, concerted efforts will have to be made by all the South Asian nations to provide enabling regulatory framework and also a conducive synchronized environment to achieve and sustain the benefits of free trade regime in the new scenario.
The study has also concluded that establishing a common stock exchange - where listing of companies of other countries is possible – may provide a catalyst for investment mobility. But this will be possible only subject to achieving certain preconditions. Those conditions include but not limited to; uniformity in the accounting standards and procedures, synchronization in monetary and fiscal policies and the stock market regulatory framework. The standardization of the corporate governance and convertibility of
“Magnitude and Determinants of the Flows of Investment among South Asian Countries”

03
currency are also the required steps in this direction. All these steps may also be considered as stepping stone towards the establishment of a Monetary Union in South Asia.
In the end, the study suggests the promotion of financing activities in the Small and Medium Enterprises (SMEs) sector through cross border investment relations. This sector can be developed between the South Asian nations on the same pattern and procedure introduced by the South-South Cooperation Program launched by United Nations Development Program (UNDP). Under this Program, joint ventures will be set up and to whom necessary transfer of skill/ technology and funds will be provided through a stock market mechanism headquartered in Shanghai. The business enterprises in SME sectors may contact the country office or national chamber of commerce with their business proposals which in turn forward the same with its certification to Shanghai Stock Exchange SME portal where investors may contact the target company. This mechanism provides a catalyst to promote relation between the countries of the region by transferring funds, skill and technology in the required sectors.
The study has corroborated that this is the only sustainable way to strengthen economic relations without political considerations.
“Magnitude and Determinants of the Flows of Investment among South Asian Countries”

Chapter-I
Economic Integration:
Considering Prosperity
without Politics

Economic Integration: Considering Prosperitywithout Politics
The benefits at large and prosperity in consequence of free trade regime have largely been recognized in post soviet regime by the economic policy makers and leading global think tanks. However, the success and sustainability of free trade regime is closely associated with the dynamism and patterns of competitiveness of domestic industries. This dynamism and competitiveness depend largely on the free mobilization of factors of production from one region to another. Without allowing free mobilization of factors of production, the success and sustainability of free trade in goods and services will remain doubtful. The mobilization of factors of production is always associated with the mobility and migration of labor and across the borders flow of foreign investment. These are two problematic areas which have not been fully addressed in the policy debates and implementation of global policies. This study is mainly concerned with the economic integration through flow of investment among the South Asian countries.
Despite several theoretical disagreements on the merits of economic integration, it can not be avoided in the present environment of new liberalism and free trade regime. Regional economic integration is a subset of free trade policies, which has an ultimate goal to enter into globalization regime. Here, it is worth mentioning that economic integration is not properly understood in South Asia where the policy makers consider economic linkages as economic integration. Economic integration is defined and determined by the complex relations and interaction of the various systems. It requires interaction among the public and private sectors participants from countries in the region. From public sector, ministries of finance, commerce, communication, transportation, foreign affairs, homeland security and interior affairs, planning commission and monetary authorities are the integral part of this strategy, while trade bodies, financial markets' representatives and financial institutions are the natural participants from private sector.
Economic integration covers the transfer and retransfer of economic resources including capital, labor, entrepreneurs and money from one sector or region to the other sector or region. It involves chain of participation and transfer of goods and services. It is something more than economic linkages. Such integrations have been achieved in the past depending on the willingness and systematic gradual planning by the member countries of a bloc or economic union. However, it has now become part and parcel of the globalization and the countries in a region will have to adopt this policy willingly or unwillingly because economic isolation from the neighboring countries is no longer possible in the new global scenario.
Contrary to full economic freedom or free trade, economic integration is termed as the second best option for global trade where barriers on free trade cannot be removed owing to several politico economic and social reasons. Formation of preferential trading areas, free trade areas, customs unions, and economic and monetary unions are the earlier stages of a complete economic integration.
Several important aspects of the economic integration have been discussed in the policy documents and research papers. Limitation and importance of South Asian Association for Regional Cooperation (SAARC), scope of South Asian Preferential Trade Agreement (SAPTA), magnitudes and potentials of economic integration, facilitations and policies' harmonization in trade relations among South Asian countries, South Asian perspective of the 'Railways Mega Project' from Malaysia to Turkey, role of the regulatory and policy making organizations - interior, foreign and commerce ministries and the communication, transportation, tourism development departments and the planning commission in economic integration of South Asian countries, collaborative dimensions of the investment and financing activities including the role of financial institutions, capital markets and monetary authorities, role of the think tanks, and media in exchange of views and dialogs, and the collaboration in research, higher education and technological advancements are the areas which have been classified for developing a sustainable economic integration in South Asia.
06
“Magnitude and Determinants of the Flows of Investment among South Asian Countries”

07
It is widely considered that economic relations and mutual dependency on economic resources diffuse the political tensions and avert the cold war or a war like situation. Economic integration is the most effective mechanism for sustainable development of economic relations among the nations. To assess the success and possibility of economic integration among the nations which have serious political disputes and disagreements require several dynamic models and many complex and complicated variables, which are beyond the scope of this study. Regardless of the impacts of ideologies, political thoughts, history and variations in cultural and linguistic diversities and sociology, this study assess the possibilities and consequences of economic integration of South Asian countries.
The most important issue in the economic integration of South Asian countries relates to geo-political relations between India and Pakistan - two largest countries of the region. Economic methodology allows us to explore the possibility of economic integration among South Asian countries in isolation of the political strategic issues, and in this study we have analyzed the possibility and consequences of economic integration and cross border investment among the South Asian countries without considering the politico-strategic questions. In this regard, it is worth mentioning as a reference from history of the region that a few independent instances of economic cooperation did take place between India and Pakistan even in the presence of geo-political tensions. It will be interesting to mention here that since 1947 to mid 1960s, the mobility of capital and labor were not restricted between India and Pakistan. Several business entities and funds have been transferred across the borders. This free movement of capital did not create any problem and provided facilitation in flourishing business empires across the borders. The process of migration between the countries was not completed in months, it was not stopped till 1953 and even after that it was not stopped rigidly. The creation of Bangladesh in the year 1971 further contributed towards the inflow and outflow of Investment in Pakistan and Bangladesh.
In terms of economic cooperation, Indian demand for granting MFN Status by Pakistan is still pending. India regards this non-reciprocity by Pakistan as one of the major reasons for not signing bilateral Investment Treaty between two major players of South Asia.
On the other hand, the economic integration of EU and NAFTA provide enough encouragement for South Asian countries to initiate the process towards integrating economies through greater political will and resolution of problems. If European Countries like France, German and Netherlands can bury their centuries old rivalry and transform enmity into economic prosperity of their community and countries can maintain economic integration after partition like United States of America and Canada, the South Asian countries particularly India and Pakistan can also follow this noble examples.
When the World is passing through the era of globalization, the South Asian countries in general and India and Pakistan in particular should set aside their critical political issues and start taking concrete steps to introduce free trade policy in the region to bring prosperity to their respective communities.
The model for economic integration of EU through resolution of political issue has seen the greater success and more effective mechanism to give immediate boost to economic integration process. Thus, greater political will shall be required to gain maximum benefits as far as the promotion of intra-SAARC trade and Investment is concerned.
“Magnitude and Determinants of the Flows of Investment among South Asian Countries”

Chapter-II
Assessment of the Foreign
Investment in South Asia: Need,
Opportunities and Environment

Assessment of the Foreign Investment in South Asia: Need, Opportunities and Environment
It has been mentioned in Chapter I that in the globalization regime, cross border mobilization of capital is a required and desirable activity to synchronize the global economic environment and creating business competitiveness. The stock of foreign capital and flow of investment in the South Asian countries show a dismal picture in this regard. Magnitude and consistency of the flow of foreign direct investment, foreign portfolio investment, investment treaties and agreements and mergers and acquisition activities indicate that South Asian countries except India require substantial changes in the their policies and regulatory frame work.
As reflected from table 2.1 below, foreign exchange earnings as percentage of GDP is about 4.3 percent in case of India and Pakistan; while inflow of foreign exchange by FDI is 3.6 percent of GDP for India and 3.3 percent for Pakistan. India also utilized its foreign exchange for investment purpose which was about 1.6 percent of its GDP.
Table 2.1: Flow of Foreign Exchange through Non Trade Sources (2009)
10
IndicatorsBangladesh India Nepal Pakistan Sri
LankaSouth
AsiaWorld
Financing through International Capital (%) 0.1 2.7 0 0.4 1.0 2.2 --
Net Inflow of FDI as % of GDP
1.2 3.6 0 3.3 1.9 3.3 3.0Net outflow of FDI as % of GDP
-- 1.6 -- 0 0.2 1.4 3.5
Workers’ Remittances as % of GDP 11.3 4.3 21.6 4.3 7.3 4.9 0.8
Source: World Bank
The statistics provided in the above table also illustrate that financing through International Capital is only two 2.2% in case of South Asian region, which is much lower than in EU (15%), in NAFTA (10%) and in ASEAN region (7%), which also shows that Investment regime in South Asia is not attractive enough for seeking international capital for financing the projects. Net inflow of FDI as percentage of GDP is 3.3, slightly above that of the World but still small as compared with regions of OECD, ASEAN and APEC and particularly in view of the size of SAARC market. The Net outflow of FDI from SAARC is quite negligible in case of South Asian member states other than India.
Table 2.2: Ranking of Investment Factors
Reason for Investment % Reason for Investment %Large Sales Market 37 Economic Framework 5Work Force Availability 13 Infrastructure 5Free Land / Industrial Site 14 Inputs Availability 3Public Subsidies 12 Innovations Potential 2Constitutional Framework 8 Research Promotion 1
Source: Market Survey (Scala Magazine, Germany)
The unfavorable balance of trade of South Asian countries is also one of the main reasons for South Asian countries to explore the non-trade sources for earning of foreign exchange. Workers' remittances and net flow of foreign direct investment are the non trade sources of foreign exchange earnings. The need of foreign investment by South Asian countries can be gauged by the flow of foreign exchange through these non trade sources. It was noted that workers' remittances are the largest non trade source of foreign exchange earnings for South Asian countries. It is 11 percent of GDP in case of Bangladesh where inflow from FDI is only one percent of GDP.
“Magnitude and Determinants of the Flows of Investment among South Asian Countries”

Table 2.5: Flow of Foreign Direct Investment as % of Gross Fixed Capital Formation
12
Source: UNCTAD
It is to be noted that flow of portfolio investment can not be predicted on long term basis; it is directly related to the current social, political and economic scenario of the country. So far as foreign direct investment inflows are concerned they are largely determined by size of market, availability of work force and public policies. These factors are critically examined before making any recommendations for investment. The size of foreign investment in South Asian bonds (debt) markets is negligible.
Table 2.6: Stocks of Foreign Direct Investment
Source: UNCTAD
A comparison of FDI in South Asian economies indicates that about 50 percent of the inflow of foreign investment is transferred to the outflow. The lower inflow of investment than its outflow is an indicator of the resource gap. It indicates that South Asian countries need more foreign investment
Country 2006 2007 2008Inflow Outflow Inflow Outflow Inflow Outflow
world 13.4 12.9 16 17.4 12.3 13.5South Asia 6.7 9.5 6.4 13.7 8.5 12.7Afghanistan 12.8 -- 10.8 -- 16.7 --Bangladesh 5.3 -- 4 0.1 5.9 0.1India 6.9 4.8 6.5 4.5 9.6 4.1Iran 2.5 0.6 1.9 0.4 1.5 0.4Nepal -0.3 -- 0.2 -- -- --Pakistan 16.4 0.4 18.3 0.3 18.3 0.2Sri Lanka 6.8 0.4 7.5 0.7 7.3 0.6
Country 1990 2000 2008 2009
Inward Outward Inward Outward Inward Outward Inward OutwardWorld 1942 1786 5757 6070 14909 16206 17743 18982South Asia 7 0.4 31 3 186 65 218 82Afghanistan 0 -- 0 -- 0 -- 0 ---Bangladesh 0.5 -- 2 -- 5 -- 5 0India 2 0.1 18 2 123 62 164 77Iran 2 -- 3 -- 21 -- 24 2Nepal 0 -- 0 -- 0.1 -- 0.2 --Pakistan 2 0.2 7 0.5 31 1 18 2Sri Lanka 0.7 0 2 0 4 0.3 5 0.3
(Million $)
“Magnitude and Determinants of the Flows of Investment among South Asian Countries”

11
The table 2.3 below illustrates the flow of foreign investment in South Asian member states for the years 1995 and 2008.
Table 2.3: Inflow of Foreign Investment
Type of Investment Bangladesh India Nepal Pakistan S.Lanka S. Asia World
Equities- FDI 1995 2 2144 -- 723 56 2931 328496
Equities- FDI 2008 973 41169 1 5438 752 48678 182328
Equities- Portfolio 1995 -15 1590 0 10 -- 1585 127074
Equities- Portfolio 2008 10 -15030 -- -270 -488 -15778 -207952
Debt- Bonds 1995 0 285 0 0 0 285 --
Debt- Bonds 2008 0 1754 0 0 -65 1689 --
Debt- Others 1995 -21 955 -5 317 103 1349 --
Debt- Others 2008 112 10028 -1 652 155 10978 --
Source: World Bank
(Million $)
The share of total foreign direct investment is 8.5 percent in South Asia against world average of 12.5 percent. On country vide level; this share is 9.6 percent for India, 17 percent for Afghanistan and 18 percent for Pakistan. Over the period, this share is increasing and shows an overall strong demand for foreign investment in South Asian economies.
Table 2.4: Flow of Foreign Direct Investment
Country 2006 2007 2008 2009Inflow Outflow Inflow Outflow Inflow Outflow Inflow Outflow
World 1461 1397 1979 2147 1697 1858 1114 1101South Asia 28 15 34 18 51 18 41 15Afghanistan 0.2 -- 0.2 -- 0.3 -- 0.2 --Bangladesh 0.8 0 0.7 0 1.1 0 0.7 0India 20 14 25 17 42 18 35 15Iran 2 0.4 2 0.3 1 0.4 3 0.4Nepal 0 -- 0 -- 0 -- 0 --Pakistan 4 0.1 6 0 5 0 2 0Sri Lanka 0.4 0 0.6 0 0.8 0 0.4 0
(Million $)
Source: UNCTAD
South Asia invested only $82 billion abroad, out of these $77 billion invested by India. Despite low magnitude of FDI abroad (outward), it is interesting to note that India invested $48 billion for purchasing (acquisition) of 466 foreign companies over the last three years; while foreign investors acquired 407 Indian companies for $18 billion in the same period. In case of Pakistan, where privatization of public owned business entities is in process, 24 companies were sold to foreign investors for $3 billion, and in the same time one foreign company was acquired for $2 billion.
Share of South Asia in global foreign direct investment has reached 2 percent in 2008; it was less than one percent in 1995. In case of foreign portfolio investment, a net outflow of resources was observed in 2008; though it was favorable in 1995. This phenomenon is consistent for all South Asian economies.
“Magnitude and Determinants of the Flows of Investment among South Asian Countries”

13
Table 2.7: Stocks of Foreign Direct Investment as % of GDP
Source: UNCTAD
The quantum of foreign direct investment in South Asia stands at $218 billion, which is less than 2 percent of world Foreign Direct Investment (FDI) stocks. It is an indictor that South Asia is not well-integrated with the global economy. Global FDI-to-GDP ratio is 22 percent; this ratio is 12 percent in case of South Asia, 21 percent for Pakistan and 10 percent for India.
Table 2.8: Cross Boarder Mergers and Acquisitions
(Million $)
Source: UNCTAD
South Asia badly requires foreign investment to finance it's over all deficit. The number of investment treaties and agreements, cross boarder Mergers and Acquisitions, patterns
Country 1990 2000 2008Inward Outwar Inward Outwar Inward Outwar
World 9.1 8.5 18.1 19.2 22.5 26.9South Asia 5.9 18.4 6.1 20.7 11.6 44.6Afghanistan 0.3 -- 0.6 -- 11.3 --Bangladesh 1.5 0.1 4.8 0.2 5.9 0.1India 0.5 -- 3.7 0.4 9.9 5Iran 2.3 -- 2.5 0.6 6 0.5Nepal 0.3 -- 1.2 -- 1 --Pakistan 4.8 0.6 9.7 0.7 20.9 0.9Sri Lanka 8.5 0.1 9.8 0.5 10.5 0.8
Country 2006 2007 2008Net Sales Net Purchase Net Sales Net Purchase Net Sales Net Purchase
World 636 1031 1031 674 674Banglades 0.3 0 -- -- --India 4 4 29 10 12Iran -- -- -- 0.7 --Nepal 0 -- -- 0 --Pakistan 3 1 -- 1 --Sri Lanka 0
636--7----0-- 0 0 0.3 0
“Magnitude and Determinants of the Flows of Investment among South Asian Countries”

Table 2.9: Mergers and Acquisitions (Number of Deals)
14
Source: UNCTAD
of the inflow and outflow of foreign investment and the contribution of foreign – direct and portfolio- investment in the South Asian economies indicate that countries in the region require lots of improvement in their foreign investment linkages as reflected from tables 2.8 and 2.9.
Table 2.10: Number of International Investment Agreements
Source: UNCTAD
As is evident from the above table, South Asian record shows a rosy picture in the numbers of International Investment Agreements (IIAs). More than 400 IIAs have been signed by South Asian Nations -161 by India and 104 by Pakistan. More than 90 percent of those IIAs are bilateral.
The following table portrays investment in infrastructure projects with private participation in South Asian member countries during the periods from 2000-05 and 2006-08 in four selected sectors viz: Telecom. Energy, Transport and Water and Sanitation.
(As of May 2010)
Country 2006 2007 2008Sales Purchase Sales Purchase Sales Purchase
world 5724 5724 6926 6926 6244 6244Bangladesh 1 -- 1 -- 1 --India 128 134 148 171 131 161Iran -- -- -- -- 3 --Nepal -- -- -- -- -- --Pakistan 7 1 7 -- 10 --Sri Lanka 2 2 4 2 4 2
Country BilateralInvestment
treaties
Double Taxation Treaties (DTTs)
Other IIAs Total IIAs
Afghanistan 3 -- 2 5Bangladesh 28 23 3 54India 78 71 12 161Iran 59 29 1 89Nepal 4 5 4 13Pakistan 47 51 6 104Sri Lanka 27 34 5 66
“Magnitude and Determinants of the Flows of Investment among South Asian Countries”

15
Table 2.11: Investment in infrastructure projects with private participation
Source: World Bank
Foreign direct investment depends to a large extent on the size of market and public policies, where investment decisions are made after detailed scrutiny. The above table shows that opportunities are available in telecommunication, energy, transport and water and sanitation sectors. The recent history shows large private investment made in these sectors.
Table 2.12: Doing Business Indicators (2009)
Doing business indicators play a role of catalyst in creating favorable environment for–both domestic and foreign investors. An overview of these indicators shows that there is no great variation among the South Asian nations. Pakistan is much better in respect of time required to enforce a contract, while India has an advantage so far as investor's protection and resolving insolvency issues are concerned.
In analyzing major constraints in investment, it is interesting to note that despite negative reputation of Pakistan in corruption, the country has much better position in informal payments to public officials as compared to India and Bangladesh, where such payments are much higher. Pakistan is also in a better position in terms of time spent to deal with taxation authorities, where information technology has minimized the role of tax officials. However, the losses due to theft, robbery, vandalism & arson and electric outage are much higher in Pakistan as compared to India. India has great advantages in the field of financing from banks for businesses, formal training for the workers and acquisition of internationally recognized certifications. No other South Asian country can be compared with Indian investors in these fields.
Countries Telecommunications Energy Transport Water andsanitation
2000-05 2006-08 2000-05 2006-08 2000-05 2006-08 2000-05 2006-08
Bangladesh 1294 3358 501 49 0 0 - -
India 20642 24702 8369 28508 4281 19010 113 218
Nepal 109 26 15 -- - - - -
Pakistan 6595 7868 375 2579 154 924 - -
Sri Lanka 766 1024 271 - - - - -
South Asia 29926 37978 9534 31136 4435 19934 113 218
($ millions)
Indicators Bangla-Desh
India Nepal Pakistan SriLanka
LowIncome
Economies
MiddleIncome
Economies
HighIncome
Economies
SouthAsia
World
Time Required to get Permission for Construction (Days) 231 195 424 223 214 291 209 169 241 216
Employment Rigidity Index 28 30 46 43 20 33 27 24 27 27
No. of Procedures to Enforce a Contract 11 46 39 47 40 39 39 35 44 38
Time Required to Enforce a Contract 1442 1420 735 976 1318 605 649 526 1053 607
Investors Protection (Disclosure Index) 6 7 6 6 4 5 5 6 4 5
Time required to Resolve Insolvency/ Closing (years) 4 7 5 2.8 1.7 3.8 3.1 2.1 4.5 3
Source: World Bank
“Magnitude and Determinants of the Flows of Investment among South Asian Countries”

Table 2.13: Major Constraint in Investment (2007): Survey of Enterprises
16
In the absence of lucrative investment opportunities in productive sectors in South Asian countries, the foreign expatriates prefer investments in non-productive sectors like real estate and stock markets, which encourages speculations and unrealistic but unprecedented rise in prices of land. This also remains as one of the constraints for value-addition, innovation and competitiveness of goods and services in South Asian countries. The availability of lucrative investment opportunities in productive sectors not only help generate employment opportunities but also involve overseas workers in true economic growth.
IndicatorsBangla-
DeshIndia Nepal Pakistan Sri
Lanka
Time to deal with tax authorities as % of management time 3.2 6.7 6.5 2.2 3.5Average No. of times to met with tax authorities 1.3 2.6 1.3 1..6 4.9Time required to obtain operating license (Days) 6.0 - 14.5 16.4 49.5Informal payments to public officials (% of firms) 85.1 47.5 15.2 27.2 16.3Losses due to theft, robbery, vandalism & arson (% of 0.1 0.1 0.9 0.5 0.5Firms with female participation in ownership (% of firms) 16.1 9.1 27.4 6.7 -Firms using banks to finance investment (% of firms) 24.7 46.7 17.5 9.7 26.2Value lost due to electric outages (% of sales) 10.6 6.6 27.0 9.9 -Internationally recognized quality certification (% of firms) 7.8 22.5 3.1 9.6 -Average time to clear direct exports through customs 8.4 15.1 5.6 4.8 7.6Firms offering formal training (% of firms) 16.2 15.9 8.8 6.7 32.6
Source: World Bank
“Magnitude and Determinants of the Flows of Investment among South Asian Countries”

Chapter-III
Financial Environment
in South Asian Countries:
Comparison of Policies

Financial Environment in South Asian Countries:Comparison of Policies
Over the last two decades, it has been observed that all the economies in South Asia are opening their borders for investment mobilization. Now, the growing emphasis on economic development in foreign policy is changing the priorities of South Asian states. More and more South Asian countries are emphasizing the importance of access to open markets and increasing foreign investment in their economies.
Since 1991, Indian government has focused on investment-led economic growth, when a debt crisis forced it to undertake market oriented economic reforms. India has gradually moved from a closed economy with heavy central planning to a more privatized economy with lower tariffs. These reforms resulted in a seven percent growth rate for the economy, which was less than 3 percent before the reforms. Consequently, foreign investment in India also increased manifold during this period. On the other hand, Pakistan has openly sought new investment opportunities from countries in Middle East, China, the European Union (EU) and Japan. Nepal and Sri Lanka, both reliant on the Indian economy as a supplier and market for goods, have strived to increase intra regional trade and foreign investment in their developing economies. Similarly, Bangladesh is also looking for new investment opportunities. SAARC Chamber of Commerce and Industry and the various think tanks representing new economic liberalism have strongly advocated the promotion of cross border investment among South Asian countries.
No doubt, strong and sustainable financial linkages are required to promote flows of cross border investment in South Asian countries. However, before recommending a financial integration model, it would be essential as well as appropriate to review the present status of South Asian capital markets. Though, distribution of financial assets, stock market indicators and valuation of the assets in stock market are sufficient to compare the capital markets in South Asian countries, yet the study of various factors of financial sector development is also important to analyze the causal relations between capital markets and financial environment and policies.
To start with, it is important to note that there is a great variation between India and Pakistan – two major economies in South Asia – in the distribution of financial assets. Fairly large part of financial assets in India belongs to the equity market. While, in Pakistan, public debt is the largest part of financial assets while, the major part of financial assets in Bangladesh is in the form of bank deposits. The higher magnitude of public debt securities accompanied with the higher rate of corporate taxes in Pakistan reflects the public borrowing by the government of Pakistan to finance its budget deficit. It is interesting that share of equities securities in total financial assets is about one-third in Pakistan and USA; while it is about 50 percent in case of India and China, which is against the common intuition that peoples in these countries do not prefer to invest in risk free instruments like bonds and bank deposits.
Table 3.1 Financial Assets by Major Types (Billion US $)
18
Assets Bangladesh India Pakistan USA China
Public Debt Securities 25 697 74 5110 599
Private Debt Securities 0 79 1 22302 583
Bank Deposits 36 762 55 10759 5155
Equity Securities 7 1819 70 19947 6226
Total Financial Assets: 68 3357 200 58118 12563
Source: World Economic Forum
“Magnitude and Determinants of the Flows of Investment among South Asian Countries”

19
The worth of South Asian stock markets is less than 0.5 percent of global stock markets in terms of market capitalization, which indicates its extremely lower contribution in global corporate financing activities. Obviously, this share has no consistency with the share of South Asia in global population and geo-economic resources. In South Asia, only India covers about 95 percent of South Asian equity markets, while Pakistan and Bangladesh are other partners and Sri Lanka has grown over the last decade. The other South Asian countries have negligible size of stock markets. South Asia has lower than world average in terms of market capitalization to GDP ratio, value of shares traded as percentage of GDP and value of shares traded as percentage of market capitalization.
Table 3.2: Stock Market Indicators
Source: World Bank
Though, Pakistani market has witnessed the higher volatility in terms of market capitalization and value of shares traded over the last decade. The stock valuation in terms of 'P/E multiplier' and 'price to break up value ratio' shows that Pakistani equities are being sold at lowest value in the region, while Indian equities have higher valuation ratios. If we relate this phenomenon with the value of shares traded as percentage of market capitalization, it can be corroborated that selling pressure in Pakistani market affects the stocks' value more drastically.
Indicator Bang India Nepal Pakistan Sri Lanka SouthAsia
World
Market Capitalization (Billion $) 2000 1.2 148.1 0.8 6.6 1.1 157.7 3,2187.6
Market Capitalization (Billion $) 2009 7.1 1,226.7 4.9 32.2 8.2 1,274.1 --
Market Capitalization as % of GDP 2000 2.5 32.2 14.4 8.9 6.6 26.1 102.2
Market Capitalization as % of GDP 2009 8.4 55.7 38.8 14.3 10.7 47.0 59.2
Value of Shares Traded as % of GDP 2000 1.6 110.8 0.6 44.6 0.9 90.2 152.2
Value of Shares Traded as % of GDP 2009 11.6 90.6 2.9 33.0 2.5 76.5 136.9
Value of Shares Traded as % of Market Capitalization 2000 74.4 133.6 6.9 475.5 11.0 167.9 122.3
Value of Shares Traded as % of Market Capitalization 2009 212.6 116.3 7.5 99.9 14.2 88.9 --
Number of Listed Companies 2000 221 5937 11 762 239 7269 47787
Number of Listed Companies 2009 295 4946 149 650 232 6123 --
Number of Stock Exchanges 2 22 -- 3 1 28 --
The most important observation from recent past is that Pakistani stock market has lower 'P/E' multiplier and price-to-book value ratios as compared to India and other Asian markets. It indicates that securities listed at Pakistani stock market are under valued, and room is available to invest in this market where appreciations in securities' prices are expected.
Table 3.3: 'P/E' Multipliers and 'P/BV' Ratios in Emerging Asia (2008)
Country ‘P/E’ (x) ‘P/BV’ (x)
Pakistan 6.8 1.5
China 11.2 2.5
India 11.7 3.7
Average: Emerging Asia 9.8 2.0 Source: Bloomberg International
“Magnitude and Determinants of the Flows of Investment among South Asian Countries”

Table 3.4: Financial Sector DevelopmentRanking of the Factors and Sub Factors (Based on 55 countries)
20
Table 3.5: Financial Sector Development Indexes 1-7 (7 is the best)
Source: World Economic Forum
Indian equity market is bigger in terms of number of stock exchanges, but trading activities are highly concentrated in Mumbai Stock exchange. Trading activities are concentrated in Karachi Stock Exchange in case of Pakistan, where demutualization and merger of the stock exchanges are in process. South Asia has more than 6000 listed companies but a delisting trend was observed over the last decade in India and Pakistan.
The ranking of countries on the basis of their financial development stages indicates that India is leading in South Asian markets in all the components of financial development except financial stability where Bangladesh is in a better position. The overall financial development has been assessed on the basis of overall 'Financial Development Indexes' constructed by the World Economic Forum (WEF). 'Financial Development Index' is a composition of seven pillars including: Institutional environment, business environment, financial stability, banking financial services, none banking financial services, financial markets and financial access.
Factor\ Country Bangladesh India Pakistan USA China
Main Factors (Pillars)
Financial Development Index (Aggregate) 54 38 49 03 26
Institutional Environment 55 48 52 11 35
Business Environment 55 38 50 10 40
Financial Stability 30 46 48 38 23
Banking Financial System 51 39 46 20 10
Non Banking Financial System 55 17 51 02 12
Financial Markets 44 22 25 01 26
Financial Access 40 48 50 12 30
Sub-factors
Equity Market Development 44 28 27 07 13
Regulations of Securities Exchanges 38 09 42 29 50
Corporate Governance 55 30 48 09 35
Financial Sector Liberalization 55 51 52 13 43
Capital Account Liberalization 45 45 45 01 45
Factor\ Country Bangladesh India Pakistan USA China
Main Factors (Pillars)
Financial Development Index (Aggregate) 2.6 3.3 2.2 5.1 3.9
Institutional Environment 2.5 3.4 3.0 5.6 4.1
Business Environment 2.7 3.5 3.4 5.7 4.1
Financial Stability 4.7 4.2 4.1 4.6 4.8
Banking Financial System 2.4 3.1 2.6 4.2 4.8
Non Banking Financial System 1.0 3.1 1.4 5.9 3.3
Financial Markets 1.7 3.0 2.7 5.7 2.7
Financial Access 3.0 2.8 2.7 4.2 3.3
“Magnitude and Determinants of the Flows of Investment among South Asian Countries”

21
Financial sector liberalization covers capital account liberalization, commitment to WTO agreement for trade in services and domestic financial sector liberalization. Corporate governance covers the extent of incentive-based compensation, efficacy of corporate boards, reliance on professional management, willingness to delegate the power, strength of auditing and reporting standards, ethical behavior of firms, protection of minority shareholders' interests, official supervisory power, and private monitoring of the banking industry, while regulation of securities exchanges is a part of overall legal and regulatory environment.
Table 3.6: Financial Access and Stability
Factor\ Country Bangladesh India Pakistan USA ChinaEase access to credit (Index: 7 is best) 3.70 4.04 3.51 2.75 3.97Financing through equity market (Index: 7 is best) 4.47 5.04 4.22 4.38 3.89Strength of investors’ protection (10 is best) 6.00 6.70 6.30 8.30 5.00NPL as % of total loans 13.00 2.30 8.40 2.30 2.50Private credit bureau coverage as % of total adults 00.00 10.50 1.50 100.00 00.00Public credit registry coverage as % of total adults 0.90 00.00 4.90 00.00 59.00
Source: World Economic Forum
Sub-factors
Equity Market Development 1.7 2.7 2.7 5.0 4.1
Regulations of Securities Exchanges 4.4 5.6 4.2 4.7 4.0
Corporate Governance 3.4 4.6 3.9 5.3 4.4
Financial Sector Liberalization 2.5 1.9 1.9 6.8 3.0
Capital Account Liberalization 1.1 1.1 1.1 2.5 1.1Source: World Economic Forum
Factor\ Country Bangladesh India Pakistan USA China
Table 3.5.1 : Financial Sector Development Indexes 1-7 (7 is the best)
“Magnitude and Determinants of the Flows of Investment among South Asian Countries”

Financial sector liberalization, corporate governance, legal and regulatory issues and contract enforcement are included in the institutional environment. Business environment covers the human capital development indicators, taxes, infrastructure and cost of doing business. Financial stability covers the stability of national currency, banking system and risk of sovereign debt crisis. Banking financial services include the size index, efficiency index and financial information disclosure. Initial public offering (IPOs), merger and acquisition (M & A), insurance and assets securitization are included in the non-banking financial services. Foreign exchange market, derivatives market, equity market and bond market's development are the components of financial markets, while financial access covers the commercial access and retail access.
WEF Financial Development Indexes indicate that India and Pakistan have same positions in equity market development, while capital account liberalization is a weak area in all the South Asian economies. Their position in capital account liberalization is not different from China, which is a socialist country.
India is leading in the corporate governance related factors, while it is one of the weakest areas in Pakistani financial sector. Weak informational efficiency, lack of institutional investment, and weak corporate governance are some of the major causes of weak financial market in Pakistan.
Table 3.7: Monetary and Fiscal Policy Indicators (2008)
22
Source: World Economic Forum
Indicators Bangladesh India Pakistan SouthAsia
USA China World
M2 (Money ad Quasi Money) as % of GDP 61.2 73.3 50.0 -- 57.2 163.1 --Domestic Credit by Banks as % of GDP 59.4 71.6 45.9 69.3 216. 126.2 156.8Domestic Credit to Private Sector as % of GDP 39.2 51.4 29.5 49.5 187. 108.3 129.7Banks Capital to Assets Ratio (2008) 6.5 6.4 10.6 6.9 9.3 6.1 9.0Interest Rate Spread 6.7 6.3 6.0 6.6 -- 3.1 6.0Tax rate on profit (Average) 35.0 64.7 31.6 40.0 46.3 78.5 48.3Highest Tax rate on corporate 28.0 34.0 35.0 -- 40.0 25.0 --
Several observations from the monetary and fiscal environment indicate that the disparities exist between South Asia and other parts of the world. Lower private sector investment in South Asia invites foreign investment because of lower propensity to save. However, the conversion of South Asian currencies in terms of purchasing power parity (PPP) indicates the soundness and power of the currencies, despite economic weaknesses and inflationary pressures. Structure of tax collection indicates zero collection under the head 'social contribution'. As a result, all burdens are transferred to the direct and indirect taxes, which is a cause of higher tax rates in the region.
“Magnitude and Determinants of the Flows of Investment among South Asian Countries”

23
Table 3.8: Central Banks' Policy Rates (2009)
Source: Economic Intelligence Unit, London
Interest rate spread is almost equal in South Asian economies, which is slightly higher than world average; however it is much higher than China. The reason is obvious; China's central planning experience allows it to set the interest rate spread, corporate profits and wages at minimum level, which is not possible in liberal economies. Despite uniformity in the interest rate spread, significant variation has been observed in the central banks' policy discount rates. The rate of interest in Pakistan is almost three times higher as compared to India and Bangladesh. In fact, policy interest rate in Pakistan is being applied by the State Bank of Pakistan as a tool of monetary policy. Consequently, Pakistan is one of the few countries in the world where policy interest rate is 15 percent or more. Interest rates in United States, China, Japan and European Union are much lower than South Asian economies thus providing opportunities of financial expansion to the investors of those countries. The variation of policy interest rates between India and Pakistan are consistent with the market based interest rates for short term financing and long term public borrowing. The exchange rates in terms of US dollar make Pakistan's financial position weaker.
Table 3.9: Interest Rate Behaviors
Source: World Economic Forum
Country Rate (%)
Bangladesh 5.00
India 5.50
Maldives 13.00
Nepal 6.50
Pakistan 15.00
Sri Lanka 11.75
China 3.06
United States America 0.50
Country Short term Interest Rate (%): Latest 3 Months
Long term Interest Rate (%):
10 Years Government Bonds
Pakistan 13.22 9.18
India 6.85 8.30
Highest marginal tax rates for corporate sector are lower than average tax on profits from business incomes in India, China, Bangladesh and United States of America. On fiscal policy front, Pakistan's corporate sector is in disadvantageous position where highest marginal tax rate on corporate sector is higher than average tax on business profits. Pakistan is the only example of such a taxation policy.
This dichotomy leads to discouragement of the corporate sector and stock markets in Pakistan. However, average tax rate on profits from business is lower in Pakistan as compared to other countries except China. More than 75 percent of business profits in China are transferred to the national exchequer, which shows the strong element of government ownership in the centrally planned economy.
“Magnitude and Determinants of the Flows of Investment among South Asian Countries”
Table 3.10: Currency Exchange Rates Movement (Local Currency in term of US $)
24
Institutional environment, business environment and financial stability represent the factors, policies and institutions which are directly concerned with the policy makers. Banking financial system, non-banking financial system and financial markets reflect the financial intermediations which represent the role of financial institutions, while financial access is concerned with the end users of capital, which is mainly the corporate sector of the economy.
In discussion on the factors of overall financial development in South Asia and leading position of India, it is extremely important to note the parameters of the financial access and stability. To get financing either through credit or equity market is easier in India as compared to Pakistan. Even position of India is much better than China and USA. Its impacts on overall financial and corporate sector development are obvious. The ratio of non-performing loans is much less in India than its neighboring countries, which is an indicator that financing activities are being transformed efficiently into economic growth. This achievement is correlated with the strength of investors' protection and the size of private credit bureau coverage. It is extremely important that all these achievements of Indian economy in the field of financial market indicators are based on its liberalization policy adopted after 1990. This financial liberalization and development is a major cause of ultimate economic growth.
Source: World Economic Forum
Country On December 03, 2010 One Year Ago
Pakistan 85.70 83.60
India 45.40 46.40
Bangladesh 71.85 70.45
Maldives 12.95 12.98
Nepal 73.92 75.79
Sri Lanka 111.42 114.42
“Magnitude and Determinants of the Flows of Investment among South Asian Countries”

Chapter-IV
Economic Prosperity
through Cross Border Investment

Economic Prosperity through Cross Border Investment
In the contemporary global scenario, a large part of the responsibility of economic development has been shifted to corporate sector from the governmental agencies. The entire structure and growth of the corporate sector depends on the transparent and prudent financial system. An incorrect judgment regarding the financial patterns in corporate sector may be a cause of heavy distortion in the society by means of volatilities in stock markets, employment opportunities, distribution of income, and demand-supply gap in the commodities' markets. In the present economic structure, overall economic growth depends on the performance of corporate sector, while the financial resources of corporate sector are determined by the performance, gravity and strength of the financial markets in a country.
In discussion on globalization and integration in South Asia, the South Asia Human Development Report (2001) pointed out that globalization process in South Asia has focused on integrating markets for capital goods and services without enhancing the quality of people's lives. Globalization has not been accompanied by the reduction of poverty, while income inequalities have widened in South Asia. The report mentioned that South Asia's integration with trade and capital markets has expanded considerably but the region still remains amongst the least integrated regions in the world. Trade among South Asian countries is very low (less than 5 percent of region's total exports) compared to NAFTA (55 percent) and ASEAN (22 percent).
The seven countries in South Asia represent 23 percent population of the world, which is a visible indicator of the importance of this region. However, the share of South Asia in 'World Domestic Product' is less than 3 percent; it is less than 5 percent in global trade. The share of South Asia in World GDP does not match with its population. It is a source of low per capita income in the region, which is about 1/10th of the world per capita income. It is worth mentioning that GDP is not a stock concept; it is a flow of resources during a year. A shortfall or gap in the resources implies the reduction in overall national wealth in future. It also indicates deficiency of funds for investment. South Asia's share in world's stock market capitalization is less than 2 percent. With 5 percent share in world trade, less than 2 percent share in equity markets, and about 2 percent share in gross world product, South Asia can play a little role in the world economic development.
At present, there are about 6000 listed companies in South Asian countries, which is 12 percent of the companies listed on world stock exchanges, but the number of companies in South Asia does not reflect the capitalization in the region. Unfortunately it is an indicator of the isolation and segregation of the businesses. It shows a trend of the creation of small businesses on family ownership basis. Such type of corporate entities will not be helpful for the economies from the globalization point of view. Economic power cannot be achieved without investment in knowledge-based technologies, sophisticated research and development activities, which require large capital base. The formation of large size corporations (MNCs) with endogenous capital are required to compete in the globalized environment and to improve the share and participation of South Asia in global economy.
Lower private sector investment in South Asia invites foreign investment because of lower propensity to save. However, the conversion of South Asian currencies in terms of purchasing power parity (PPP) indicates the soundness and power of the currencies, despite economic weaknesses and inflationary pressures. Strong and effective physical infrastructure to revive the social and economic relations among the South Asian countries is also required to promote the financial linkages between the countries. To achieve this goal, South Asian economic planners have to create harmonization between the rules and regulations of financial sector of member states. They need synchronization in policies for allocation of funds for investment on their comparative advantage basis. Regulatory bodies and planning authorities need to take initiatives to make a harmonized and uniform investment and financial environment. The gravity and magnitude of economic relations among the South Asian countries show a disappointing picture considering lower than anticipated outcomes of several strategies and efforts to promote their mutual economic
26
“Magnitude and Determinants of the Flows of Investment among South Asian Countries”

27
relations. It was corroborated in various studies that trade relations cannot be promoted without strong politico-cultural relations among the nations. The politico-cultural relations among the nations can be strengthened by the exchange of services including health, education, energy, communications, transportations and financial assets and intermediation. The quantum of trade in merchandizing goods does not reflect the relations between the peoples of partner countries. However, higher trade in services (health, education, tourism, transportation and financial assets,etc.) leads to frequent interactions among the peoples of partner countries. The exchange of financial services provides the cross border investment opportunities, which may lead to ultimate development of trade among the nations.
For sustainable economic and financial infrastructure development, South Asian countries have to mobilize and utilize their resources endogenously. It will improve the efficient utilization of financial resources. It is possible through cross border investment among the South Asian countries. However, to make it practicable the policy makers and planners have to make their financial system transparent, frictionless and efficient.
“Magnitude and Determinants of the Flows of Investment among South Asian Countries”
Chapter-V
Conclusion

Conclusion
The economic indicators, financial markets observations and global data indicate that all South Asian economies require inflow of foreign investment, while their mutual integration may fill the resource gap in some sectors of their economies. It is obvious that financial integration in South Asian economies can improve the efficiency and investment activities in the region. This step is an advanced stage of cross border investment and listing which can create arbitrage opportunities if markets are fundamentally different in their macroeconomic policy and informational efficiency. The study proposes that utilization of financial resources through flow of investment in the areas of specialties can improve the socio-economic and technological advancement in South Asian countries. However, the capital accounts convertibility, permission for cross border investment and synchronization in the monetary and fiscal policies are the prerequisite of financial integration.
The historical experiences of integrated financial markets show that investment mobilization have been successfully achieved in those regions where common currency units are in practice.
In globalization regime, financial markets in South Asia can no longer afford to remain in isolation from each other or from rest of the world. Financial integration provides opportunities not only to the investors; it facilitates the importation of capital at comparable cost. Similarly, it improves the efficient allocation of resources.
The present amendments and adjustments in investment policies are not sufficient to achieve the desired goals in South Asia. Here, it is also recommended that South Asian countries may develop their investment relations on the same patterns which have been developed by the UNDP under the SSGATE program for South-South cooperation. Such programs may lead to joint ventures, transfer of technology /skills, mobility of labor and dependency in some cases, which will lead topromotion of social relations among the peoples; this is the only way to strengthen economic relations without political considerations.
It is to be noted that the need to strengthen international financial systems of SAARC countries by connecting their institutional capacity and surveillance mechanism as well as through closer consultations and coordination of macroeconomic policies was recognized by the tenth summit of SAARC in 1998. In order to enhance SAARC's collective capacity in policy analysis on international, financial, monetary, trade and investment issues, meetings of officials from finance ministries and governors of the central banks have also been organized. A regional agreement on the promotion and protection of investments in the SAARC region, a SAARC arbitration council, and a regional agreement on the avoidance of double taxation was also adopted to facilitate the trade between South Asian countries. Now, these steps can be applied as origination of the integration process in South Asia.Some suggestions for policy formulation:
In view of the findings and conclusion of the study, some key proposals are worked out in respect of South Asia:
1 It has been observed that in sectors like telecommunication, transportation and finance and exploration of mineral resources and natural resources, the South Asian countries have received bulk amount of FDI while the other core sectors like health and education have been given least importance. There is also a need for diversification and identification of areas having potential for investment.
2 The investment in health and education sectors in form of FDI or Joint Ventures between public and private enterprises is squarely productive, which will not only enhance Human Development Index of the region but also help achieve sustainable economic growth.
3 To supplement the efforts of South Asian Economic Integration, the demand for SAARC Investment Treaty is worth consideration. However, it is linked with fiscal and monetary policies, the harmonization of which is time consuming and an uphill task. Till the time, the South Asian countries agree on harmonization of such policies,
30
“Magnitude and Determinants of the Flows of Investment among South Asian Countries”

31
case-to-case basis investment may be considered.
4 The inclusion of services in SAFTA agreed by the Heads of States in 16th Summit provides enormous opportunities for expansion in the scope of cooperation amongst the member states in five identified sectors. The Governments of South Asia may evolve investment treaty based on these sectors as the beginning, the success of which may help unleash the potential in other sectors as well.
5 The Working Group on Investment comprising SAARC Government officials, academicians and representatives of the private sectors may be constituted under the aegis of SAARC to prepare draft of South Asian Investment Treaty.
6 Bilateral Investment Treaties (BITs) exist in member nations of SAARC except India and Pakistan. Common factors of these BITs may be considered as the basis of Regional Investment Treaty in South Asia.
The Regional Investment Treaty in SAARC will help augment the present level of intra-SAARC investment to manifolds and bring enormous opportunities for expansion of business in the region. It will also lead to broaden the sphere of SAFTA into a Comprehensive Economic Cooperation Agreement and subsequently transform South Asia into a strong economic grouping. The Regional Investment Treaty in South Asia is a noble proposal, which is a bit difficult to articulate, however, demonstration of greater political will can help develop it on pattern of EU or NAFTA and help achieving the objective of regional integration of South Asia in true spirit.
REFRENCES:
1 Aleksandar Stojanovic (2004), 'Emerging Electronic Money: Policy Issues and Relevance to Payment Systems in Emerging Economies' in “ Accounting and Finance in Transition (Volume: I) by Zeljko Sevic; London: Greenwich University Press, 2004
2 Anderson, Trevor (2001); “Chamber's Encyclopedia, Vol: 1; No. 6” Houghton Mifflin; October 20013 Arshanapalli, B. and J.Doukas, 1993, International stock market linkages: Evidence from the pre- and post-
October 1987 period, Journal of Banking and Finance, 17, 193-208.4 Barrow, Robert J. (1964); “The Stock Market and Investment”, Review of Financial Studies, Vol. 31 (2), 91-
96.5 Bekeart G., (1995); “Market Integration and Investment Barriers in Emerging Equity Markets”, The World
Bank Economic Review, 9, 75-107.6 Bosworth, Barry (1975); “The Stock Market and the Economy”, Brooking Papers on Economic Activity, Vol.
75 (2), 257-3007 Bracker, K., D. S. Docking and P. Koch, 1999, Economic determinants of evolution in international stock
market integration, Journal of Empirical Finance, 6, 1-27.8 Bracker, K., Dockino, G., and Koch, P (1999), “Economic Determinants of Evolution in International Stock
Market Integration”, Journal of Empirical Finance, 6:1-27. 9 Corhay, A., A.Tourani and J-P.Urbain, 1993, Common stochastic trends in European stock markets,
Economics Letters, 42, 385-390.10 Diamond, Peter (1967), “The Role of a Stock Market in a General Equilibrium Model with Technological
Uncertainty”, American Economic Review, Vol. 57 (3), 759-773.11 Dimitris A. Georgoutsos and Georgios P. Kouretas; Common Stochastic Trends in International Stock
Markets: Testing in an Integrated Framework; Athens University of Economics and Business, GR-10434, Department of Economics, University of Crete GR-74100 Rethymno, Greece June 2001.
12 Errunza, V and Losq, E (1985), “International Asset Pricing Under Mild Segmentation: Theory and Test”, Journal of Finance 40, 105-24.
“Magnitude and Determinants of the Flows of Investment among South Asian Countries”

32
13 Eun, C. and S.Shim, 1989, International transmission of stock market movements, Journal of Financial and Quantitative Analysis, 24, 241-256.
14 Fischer, Stanley and Robert C. Merton (1984), “Macroeconomics and Finance: The Role of the Stock Market”, Carnegie–Rochester Conference Series on Public Policy, Vol. 21 (1), 57-108.
15 Francis B. B. and L. L. Leachman, 1998, Superexogeneity and the dynamic linkages among international equity markets, Journal of International Money and Finance, 17, 475-492.
16 Fukuyama, Francis (1989);”The End of History?” The National Interest, Summer 198917 Fu-you Li (2004); 'On the Path of Dependence of East Asia Monetary Cooperation and its Policy
Coordination: Lesson from Europe; in “ Accounting and Finance in Transition (Volume: I) by Zeljko Sevic; London: Greenwich University Press, 2004
18 Global Financial Data Services (1998); “Global Financial Statistics”; California: 199819 Government of Pakistan (2005), “MTDF: 2005-10”, Islamabad, Ministry of Finance, Planning Commission.20 Gunnar Mirdal (1975); “Asian Drama”; Reprint by the National Bank of Pakistan Karachi 1975.21 Helen V. Milner (1998); “ International Political Economy: Beyond Hegemonic Stability”, Foreign Policy
Spring 199922 Holmstrom, Bengt and Jean Tirole, (1993)“ Market Liquidity and Preference Monitoring”, Journal of
Political Economy Vol. 101 (2), 678-709.23 Huntington, Samuel P. (1994) “The Clash of Civilizations”; Boston: Haevard University Institute for
Strategic Studies at Harvard University.24 International Monetary Fund (1998); “International Financial Statistics”; Washington: IMF, 199825 Joseph E. Stiglitz (1999); “Trade and the Development World: A New Agenda”; Current History November
1999. 26 Kasa, K. (1992), “Common Stochastic Trends in International Stock Markets”, Journal of Monetary
Economics, 29, 95-124.27 Madni, M. Hussain Ahmed (1988); “Tehrik-e-Reshmi Roomal (Urdu)”; Lahore: The Classic 198828 Mehar, Ayub (2000); “From the Corridor of History”; Business Recorder, Karachi (2000)29 Mehar, Ayub (2000); “Political Economy of Muslim World”; Business Recorder, Karachi (2000)30 Mehar, Ayub (2000); “Should Muslim World collaborate with India?”; Business Recorder, Karachi (2000)31 Mehar, Ayub (1999a); “Implications in South Asian Free Economic Zone”; Business Recorder, Karachi
(1999)32 Mehar, Ayub (1999a); “The Growth Secret”; Business Recorder, Karachi (1999)33 Mehar, Ayub (1999b); “Economics of Culture”; Business Recorder, Karachi (1999)34 Mehar, Ayub (1999b); “Global Pattern of Public Finance”; Business Recorder, Karachi (1999)35 Mehar, Ayub (1999c); “The Growth Secret”; Business Recorder, Karachi (1999)36 Mehbub-ul-haq Center of Economic Development (2001); “South Asia Human Development Report
(2001)' Islamabad37 Northwestern University Library (2004); “Government Publications and Maps - League of Nations:
Statistical and Disarmament Documents”; Evanston, IL: Northwestern University Library · 1970 Campus Drive ·
38 Obstfeld, M (1995), “Risk-Taking, Global Diversification, Growth”, American Economic Review, 84:1310-29.
39 Paul Alagidede (2007); How integrated are Africa's stock markets with the rest of the world?; Department of Economics, University of Stirling, Stirling, FK9 4LA, UK
40 Paul Krugman (1999); “Economic Culture Wars”; The Economist, October 24, 1999.41 Portes, R., and Rey, H (2002), “The Determinants of Cross border Equity Flows”, NBER, Working Paper,
Cambridge, M.A42 Rhode Ford (1927); “Bankruptcy of India”; Public Finance (1927)43 Ronald Fuss (2004), 'Financial Liberalization and Stock Price Behavior in Asin Emerging Markets' in “
Accounting and Finance in Transition (Volume: I) by Zeljko Sevic; London: Greenwich University Press,
“Magnitude and Determinants of the Flows of Investment among South Asian Countries”

33
2004th44 Sandman (1930); “Simon Commission Report”; The Hindustan Time; 13 September 1930;
45 Shleifer, A. and R. Vishny (1986); “Large Shareholders and Corporate Control”, Journal 46 SIAM (1999); “International Statistics” Philadelphia, PA (1999)47 Standard and Poor's (2005), Global Stock Market Factbook; McGraw-Hill, New York.48 Stulz, R (1999), “Globalisation of Equity Markets and Cost of Capital”, Working Paper, The Ohio State
University.49 Tabish, Iqbal; “Common Stock Market in South Asia: Possibilities and Consequences”; Unpublished M Phil
Thesis; Karachi Institute of Business and Technology, 201050 The World Bank (2010)' World Development Indicators”; 51 United Nations Conference on Trade and Development (2010); “World Investment Report: Investing in a
Low Carbon Economy”;52 World Bank (2008); World Development Report 2008.53 World Economic Forum (2008), Financial Development Report 2008, Geneva.54 World Investment Report 1991: The Triad in Foreign Direct Investment55 World Investment Report 1992: Transnational Corporations as Engines of Growth56 World Investment Report 1993: Transnational Corporations and Integrated International Production57 World Investment Report 1994: Transnational Corporations, Employment and the Workplace58 World Investment Report 1995: Transnational Corporations and Competitiveness59 World Investment Report 1996: Investment, Trade and International Policy Arrangements60 World Investment Report 1997: Transnational Corporations, Market Structure and Competition Policy61 World Investment Report 1998: Trends and Determinants62 World Investment Report 1999: Foreign Direct Investment and the Challenge of Development63 World Investment Report 2000: Cross-border Mergers and Acquisitions and Development64 World Investment Report 2001: Promoting Linkages65 World Investment Report 2002: Transnational Corporations and Export Competitiveness66 World Investment Report 2003: FDI Policies for Development: National and International Perspectives67 World Investment Report 2004: The Shift Towards Services68 World Investment Report 2005: Transnational Corporations and the Internationalization of R&D.
www.unctad.org/en/docs//wir2005_en.pdf69 World Investment Report 2006: FDI from Developing and Transition Economies: Implications for
Development.www.unctad.org/en/docs//wir2006_en.pdf 70 World Investment Report 2007: Transnational Corporations, Extractive Industries and Development.
www.unctad.org/en/docs//wir2007_en.pdf71 World Investment Report 2008: Transnational Corporations and the Infrastructure Challenge.
www.unctad.org/en/docs/wir2008_en.pdf72 World Investment Report 2009: Transnational Corporations, Agricultural Production and Development.
www. unctad.org/en/docs/wir2009_en.pdf73 World Investment Report 2010: Investing in a Low-Carbon Economy74 World investment Report, 2010: Investing in a Low Carbon Economy; United Nations Conference on Trade
and Development: New York 201075 Zeljko Sevic (2004); 'Considering Market Microstructure at Seven US Ctock Exchanges: A Methodological
Note in “ Accounting and Finance in Transition (Volume: I) by Zeljko Sevic; London: Greenwich University Press, 2004
“Magnitude and Determinants of the Flows of Investment among South Asian Countries”

APPENDIX

APPENDIX
World economic history shows that South Asia had been classified as an affluent economy before 1857. After its association with British Empire, the region has been deteriorating, while Britain's mainland economy started to boost. To compare the world stock markets, we transformed the all local markets' indexes into the uniform basis. For this purpose, we assigned 100 as base value of the stock market index and 1969 was selected as a base year. World economic history provides interesting and important evidences: the inflation in India had been increasing with the declining inflation in Britain. Similarly, consumer goods were available at cheaper prices in India at the time of higher inflation in Britain. It reflects the supply of goods from India to Britain. No body can deny the fact that the value of US dollar was much lower than the value of Indian rupee till 150 years ago. After the freedom movement of 1857, the value of US dollar was started to improve and the relative value of Indian rupee originated to decline. If we study the long-term fluctuations in world stock markets, it would be surprising that Indian Stock market was the world's most precious market. The magnitude of Indian stock market index was significantly higher than the magnitude of other stock markets' indexes (Global Financial Data Services: 1998).
36
ANNUALIZED INFLATION (%)
Duration United India Britain USA Japan Germany
1750-1758 0.02 0.19 -- -- --
1758-1782 1.78 0.96 -- -- --
1782-1825 0.36 0.14 -- -- --
1825-1857 0.77 2.37 -- -- --
1858-1880 1.71 -0.65 -- -- --
1880-1900 2.88 -0.12 -- -- --
1900-1910 0.10 0.33 2.50 1.77 1.84
1910-1940 -0.70 4.63 3.43 4.67 1.29
Pakistan India
1940-1970 5.27 5.27 1.00 2.30 259.33 0.73
1970-1990 9.80 5.55 12.05 5.15 6.90 3.15
1990-1998 14.75 14.13 4.75 3.75 1.61 3.38
2003-2004 4.50 4.60 1.30 2.70 - 0.20 1.80
STOCK MARKET INDEX - (1969 =100)
Year United India Britain USA Japan Germany
1899 -- 77.68 6.54 -- 37.62
1919 600.43 45.66 9.47 431.05 4.25
1939 238.23 40.29 13.57 167.81 15.39
Pakistan India
1969 100.00 100.00 100.00 100.00 100.00 100.00
1989 192.76 659.59 543.78 383.88 4317.16 608.04
1998 143.72 1031.24 1257.64 1335.25 1955.97 1187.98
2004 830.33 1928.18 1012.91 1511.33 1615.90 985.72
“Magnitude and Determinants of the Flows of Investment among South Asian Countries”

37
VALUE OF NATIONAL CURRENCIES IN TERM OF THE US DOLLAR
Year United India Britain Japan Germany
1825 0.41 0.21 -- --
1858 0.76 0.21 -- --
1880 1.30 0.21 -- --
1899 3.07 0.20 2.03 4.20
1909 3.08 0.20 2.02 4.19
1939 3.33 0.25 4.27 2.49
Pakistan India
1969 10.25 11.10 0.42 376.00 3.68
1989 21.39 16.93 0.63 143.68 1.74
1998 49.02 42.50 0.60 112.88 1.67
2004 60.20 45.80 0.56 111.00 0.81
COMPARISON OF ECONOMIC STATUS
Zone Population (Million)
GDP (Equivalen
t Purchasing Power
(Billion $)
Per Capita
Income ($)
Growth Rate (%)
Unemployment (%)
Inflation (%)
Euro-11 290 5942 20490 2.6 11.6 1.8
USA 268 8080 30149 3.8 4.9 2.4
Japan 126 3002 30825 0.9 3.4 1.7
South Asia 1266 1924 1520 4.6 18.0 7.2
SHARE IN THE INTERNATIONAL TRADE AND FINANCE
Zone Share in Global
Exports (%)
Share in Global
Imports (%)
Market Capitalization (Billion
$)
Number of Listed
Companies
Head Quarters of
Top 500 MNCs
Euro 11 20 23 3841 5242 100
USA 16 15 8484 8479 151
Japan 10 8 3089 53 104
South Asia 1 1 140 10102 5
World 100 100 20177 42404 500
“Magnitude and Determinants of the Flows of Investment among South Asian Countries”
Addendum
INVESTMENT REGIME IN SOUTH ASIA
Salient Features of Investment policies
SAARC Member Nations
AFGHANISTAN
Despite political and security issues, the land of Afghanistan has sought a lot of Investment opportunities and UAE bid for investment of $10 billion in Afghanistan. The Investment Promotion Department (IPD) of the Afghan Ministry of Mines has been created to guide, support and assists potential investors in their quest to explore and exploit the mineral wealth of Afghanistan.
Investment & Business Perspectives:
Emerging and new geological data has served to increase understanding of the reality for oil, gas and minerals production, and that enormous potential is only now finding its way into to the mining world. The changes to the mining law which are currently going their way through government examination will reset the legislative framework for exploration and exploitation creating a highly attractive mining environment.
The oil, gas and mining sector is probably the most important source of future, sustainable economic growth in Afghanistan, with its ability to stimulate infrastructure development and offer direct/indirect employment, diverse economic linkages, royalties, taxes and technological innovation.
Moreover the sector supplies energy, industrial minerals and construction materials for reconstruction and nation-building have enormous potential for Investment.
Setting up a business in Afghanistan is a simple process:
The Afghanistan Central Business Registry (ACBR), launched in September 2008, is a “one-stop shop” for the registration of businesses in Afghanistan. The ACBR has been established pursuant to the Laws on Corporations and Limited Liability Companies, Partnerships, Mediation and Arbitration promulgated in January 2007. These laws require that every business be registered at a Central Registry. The ACBR functions as an entity under the Ministry of Commerce and Industry. More information can be found at www.ACBR.gov.af.
The ACBR streamlines and consolidates the many steps required to register a business in Afghanistan – whether done by the entrepreneur forming a business, his/her agent or by the Afghanistan Investment Support Agency (AISA) on their behalf. Additional information can be found at www.aisa.org.af.
The ACBR makes it possible to complete all the steps required for business registration in a short time, at one central location: enrolling in the ACBR system, obtaining a Tax Identification Number (TIN), arranging publication of the business name in the Gazette and paying a single fee, as a single, turn-key service to the prospective foreign investor.
A referral letter to the relevant agency will also be supplied if a license is required. Previously, this process was too long and time-consuming and provided opportunities for corruption. With the establishment of ACBR, both of these elements: required periods of time and opportunities for corruption, were reduced. The streamlined ACBR process reduces the time to register a business to just a few hours. The cost is clear, consistent, and reasonable for all registrants.
Business taxation in Afghanistan:
The fiscal regime for Afghanistan's mining sector, essentially a tax/royalty regime, is regulated by the Minerals Law of 2008 and the Income Tax Law of 2009. The Minerals Law provides that holders of mineral rights and their
40
A country with enormous untapped Investment Potential
“Magnitude and Determinants of the Flows of Investment among South Asian Countries”

41
subcontractors shall pay taxes, customs duties, mineral royalties and other taxes in accordance with the provisions of the Minerals Law and other applicable law.
The Minerals Law imposes:
Royalties to be collected by the MOM and paid to the State TreasurySurface rents to be collected by the Mining Cadastre Department and paid to the State Treasury.The income tax of legal persons, corporations, limited liability companies and general partnerships is 20 percent of its taxable income in the fiscal year.
The income tax of a natural person is the amount calculated in accordance with the following schedule in Afghan [Af]:
TAXABLE INCOME/Month AMOUNT OF TAXFrom 1 AF to12, 500 AF ExemptedFrom 12,501 AF up to 100,000 AF 10%From 100,001 AF and above 20% + 8,750Af
Under Afghanistan's customs tariff, a one percent import duty is levied on raw materials and a two percent import duty is levied on capital goods. The export of marble is subject to a three percent duty.Foreign investors (and in most of these sectors domestic investors as well) in twenty two sectors not only have to be registered with the Commercial Court to be a legal entity, obtain an AISA license, they also have to obtain Sectoral licenses.
InsuranceBankingForeign exchange dealerUniversity and higher educationHospital/clinicDrugstore/pharmacySecurity Pharmaceutical productionTransportation AviationConstructionTelecommunicationsRadio and TVTravel agencyReal estate agencyAnimal clinicPrinting pressFilm productionOil pipelineNatural resources: iron, copper, coal, cementHotelsRestaurants For further information, [email protected]
For further information, [email protected]
“Magnitude and Determinants of the Flows of Investment among South Asian Countries”

BANGLADESH
Private investment from overseas sources is welcome in all areas of the economy with the exception of only five industrial sectors (reserved for public sector) as mentioned earlier. Such investments can be made either independently or through joint venture on mutually beneficial terms and conditions. In other words, 100% foreign direct investment as well as joint venture either with local private sponsor or with public sector is allowed. Foreign investment, however, is specially desired in the following categories:
Export-oriented industries.Industries in the Export Processing Zones. High technology products that will be either import-substitute or export-oriented. Undertaking in which more diversified use of indigenous natural resources is-possible. Basic industries based mainly on local raw materials.Investment towards improvement of quality and marketing of goods manufactured and/or increase of production capacities of existing industries.Labour intensive/technology intensive/capital intensive industries
Why Invest in Bangladesh
Bangladesh is a winning combination with its competitive market, business-friendly environment and cost structure that can give you the best returns.
Industrious low-cost workforce
Bangladesh offers a well-educated, highly adaptive and industrious workforce with the lowest wages and salaries in the region. 57.3% of the population is under 25, providing a youthful group for recruitment. The country has consistently developed a skilled workforce catering to investors needs. English is widely spoken, making communication easy.
Strategic location, regional connectivity and worldwide access
Bangladesh is strategically located next to India, China and ASEAN markets. As the South Asian Free Trade Area (SAFTA) comes into force, investors in Bangladesh will enjoy duty-free access to India and other member countries.
Strong local market and growth
Bangladesh has proved to be an attractive investment location with its 146.6 million population and consistent economic growth leading to strong and growing domestic demand.
Low cost of energy
Energy prices in Bangladesh are the most competitive in the region. Transportation on green compressed natural gas is less than 20% of the diesel price.
Proven export competitiveness
Bangladesh enjoys tariff-free access to the European Union, Canada, Australia and Japan. In Europe, Bangladesh enjoys 60% of the market share and is the top manufacturing exporter amongst 50 least developed countries.
42
An emerging economic power of South Asia
“Magnitude and Determinants of the Flows of Investment among South Asian Countries”

43
Competitive incentives
Bangladesh offers the most liberal FDI regime in South Asia, allowing 100% foreign equity with unrestricted exit policy, easy remittance of royalty, and repatriation of profits and incomes.
Export processing zones
Bangladesh offers export-oriented industrial enclaves with infrastructural facilities and logistical support for foreign investors. The country is also developing its core infrastructures, including roads, highways, surface transport and port facilities for a better business environment.
FDI Magazine of The Financial Times in March 2010 conducted a competition under the head “Global Ranking Competition of Economics Zones” based on the following nine categories of ranking:
Best Overall Global Special Economic Zone Best Economic Potential Best Cost Effectiveness Best Facilities Best Transportation Link Best Incentives Best Promotion Best Airport Best Port
In the competition out of 700 Economic Zones globally 200 participated in the competition. All the zones were evaluated on a 10 point scale on the basis of some set criteria. Among the top 10 of the two categories Chittagong Export Processing Zone, Bangladesh scored 3rd position in the “Best Cost Effectiveness” and also 4th position in the “Best Economic Potential” for 2010-2011. Source: FDI MagazineSource : http://www.boi.gov.bd/about-bangladesh/why-bangladesh
“Magnitude and Determinants of the Flows of Investment among South Asian Countries”

BHUTAN
Investment in Bhutan in ideal for those who love nature, desire its preservation and a keen to contribute towards the economic well-being of the Bhutanese community living in hilly range, which provides a belt with bounty of natural beauty. Though a small country, it provides enormous opportunities for investment in large number of sectors.
FDI in Bhutan
Foreign investment comes primarily from India, and is carried out within the context of Bhutan's special relationship with India. Bhutan's first two Five Year Plans in the 1960s were 100% financed by India. Since then, Bhutan has relied on an increasingly diverse set of countries—Australia, Austria, Finland, Denmark, Japan, the Netherlands, Norway, Canada, Switzerland, Germany, Italy, New Zealand, Italy, New Zealand, Sweden, South Korea, South Korea, United Kingdom and United States—and multilateral institutions—the UN, the World Bank and the Asian Development Bank (ADB)—to provide capital on a concessional basis, though India remains the dominant source.
Why Invest In Bhutan
On private foreign investment, the government's stance is that foreign direct investment (FDI) it is becoming increasingly necessary to meet the country's employment and self-sufficiency goals. FDI is now permitted in certain sectors, including tourism, which allows joint ventures with international hotel and resort chains. Concerns to preserve Bhutan's cultural heritage, its natural environment, and to prevent the emergence of large income inequalities can be expected to take precedence over any opening to foreign investment.
Salient Features of Investment Policy of Bhutan
1 Foreign investors may hold up to 70 per cent of the equity 2 Minimum project size of US$ 1 million in the manufacturing sector 3 Minimum project size of US$ 500,000 in the services sector4 The minimum investment proposed for 100% FDI ownership is Nu 20 million,
Potential Sectors for Investment
A total of 14 sectoral areas are open as follows: 1 Mineral processing2 Forestry and wood-based industries3 Agriculture and agro-processing4 Livestock-based industries5 Light industries including electronics6 Engineering and power-intensive industries7 Tourism including hotels8 Transport services9 Roads and bridges10 Education11 Business infrastructure12 Information technology13 Financial services
44
A Beautiful Valley of South Asia
“Magnitude and Determinants of the Flows of Investment among South Asian Countries”

45
14 Housing
Laws governing and protecting Investments
Guarantees regarding nationalization and expropriation of the foreign investment: in special cases of expropriation due to the national interest, the Investment Law guarantees prompt and full compensation at market rates
Remittance of dividends and repatriation of capital: governed by the Income Tax Act of 2001 and the Foreign Exchange Regulations of Bhutan of 1997
Protection schemes for intellectual property: according to the Industrial Property Act of 2001 and the Copyright Act of 2001. Bhutan is also a member of the World Intellectual Property Organization (WIPO)
Source: http://www.nationsencyclopedia.com/Asia-and-Oceania/Bhutan-FOREIGN-INVESTMENT.html#ixzz19fYwJEyg
“Magnitude and Determinants of the Flows of Investment among South Asian Countries”

INDIA
India is the fifth largest economy in the world (ranking above France, Italy, the United Kingdom, and Russia) and has the third largest GDP in the entire continent of Asia. It is also the second largest among emerging nations. (These indicators are based on purchasing power parity.) India is also one of the few markets in the world which offers high prospects for growth and earning potential in practically all areas of business. Yet, despite the practically unlimited possibilities in India for overseas businesses, the world's most populous democracy has, until fairly recently, failed to get the kind of enthusiastic attention generated by other emerging economies such as China.
Why Invest in India?
India, among the European investors, is believed to be a good investment despite political uncertainty, bureaucratic hassles, shortages of power and infrastructural deficiencies. India presents a vast potential for overseas investment and is actively encouraging the entrance of foreign players into the market. No companies, of any size, aspiring to be a global player can, for long ignore this country, which is expected to become one of the top three emerging economies.
Developing a basic understanding or potential of the Indian market
The Indian middle class is large and growing; wages are low; many workers are well educated and speak English; investors are optimistic and local stocks are up; despite political turmoil, the country presses on with economic reforms.
Diverse Market
The Indian market is widely diverse. The country has 17 official languages, 6 major religions, and ethnic diversity as wide as all of Europe. Thus, tastes and preferences differ greatly among sections of consumers.
Therefore, it is advisable to develop a good understanding of the Indian market and overall economy before taking the plunge. Research firms in India can provide the information to determine how, when and where to enter the market. There are also companies which can guide the foreign firm through the entry process from beginning to end --performing the requisite research, assisting with configuration of the project, helping develop Indian partners and financing, finding the land or ready premises, and pushing through the paperwork required.
Economic Policies- attuning to FDI
The general economic direction in India is toward liberalization and globalization. Despite the process is slow, the economic policies are attuned to create investment friendly regime. The Government protects FDI in the country and offers wide range of sectors for FDI, with enormous lucrative benefits.
1 A foreign company can start operations in India by registration of its company under the Indian Companies Act 1956. Foreign equity in such Indian companies can be upto 100%. At the time of registration it is necessary to have project details, local partner (if any), structure of the company, its management structure and shareholding pattern.
2 A joint venture entails the advantages of established contracts, financial support and distribution-marketing network of the Indian partner. Approval of foreign investments is through either automatic route or Government approval.
46
The emerging Economic Power
“Magnitude and Determinants of the Flows of Investment among South Asian Countries”

47
3 Government of India facilitates Foreign Direct Investment (FDI) and investment from Non-Resident Indians (NRIs) including Overseas Corporate Bodies (OCBs), predominantly owned by them to complement and supplement domestic investment. Foreign technology induction is encouraged both through FDI and through foreign technology collaboration agreement. Foreign Direct Investment and Foreign technology collaboration agreements can be approved either through the automatic route under powers delegated to the Reserve Bank of India (RBI) or otherwise by the Government
4 FDI investments are permitted through financial collaborations, through private equity or preferential allotments, by way of capital markets through Euro issues, and in joint ventures. FDI is not permitted in the arms, nuclear, railway, coal & Coal and lignite, mining of iron, manganese, chrome, gypsum, sulphur, gold, diamonds, copper, zinc.
5 India welcomes investors in Electronics and IT sector. Government of India is striving to bring greater transparency in policies and procedures to provide an investor friendly platform.
Source : http://finmin.nic.in/foreign_investment/fii/index.html; www.mit.gov.in
“Magnitude and Determinants of the Flows of Investment among South Asian Countries”

MALDIVES
The new administration has embarked on a decentralization and regionalization process to strengthen good governance and local democracy. The process will see a significant portion of administrative authority devolved to seven regions. It is envisioned that, in contrast to the highly centralized system that existed previously, many local-level economic and development related decisions will be taken at the regional level. This will lead to more efficient and equitable service delivery, in line with the needs of local people.
The government's regional development plan will use the private sector to provide many local services. The government wishes to create Joint-Ventures (JV) with international strategic partners in areas such as:
1. Real Estate2. Integrated Transport Systems3. Utilities (Electricity, Water and Sewerage)
The government will consider negotiating with interested parties on incentives and parallel investment opportunities together with these specific core products. These incentives include commercial developments in existing urban centres and exclusive rights to market products.
Why Invest in Maldives
The Maldives enjoys a stable and transparent legal system and policy making environment. A foreign investment law guarantees the security of foreign and domestic investments. Furthermore, the Maldives' liberal trade environment, dynamic private sector and development-oriented legal structure all contribute to a climate conducive to trade and investment.
The Maldives is socially cohesive, with a homogenous population that shares one culture, religion and language. Furthermore, the Maldives enjoys political stability, as witnessed by the recent peaceful transfer of power to a new, democratically-elected President. A new constitution, enacted in 2008, that enshrines the separation of powers between the executive, legislature and judiciary, is testament to the country's stature as a modern and forward-looking nation.
Investment Policy
The Investment Policy of Maldives is open and provides vast untapped potential in natural marine resources and the young, energetic and dynamic workforce are strong inducements to invest in the Maldives. The number of foreign companies investing in the Maldives has been increasing yearly for over a decade and foreign companies now provide air transport, resort management, manufacturing, management and accounting services.
The Maldives aims to attract more foreign investment, with an emphasis on attracting investments that:
1. are capital intensive2. enhance transfer of technology3. introduce new skills4. are environmentally friendly
48
A promising Tourism Destination of South Asia
“Magnitude and Determinants of the Flows of Investment among South Asian Countries”

49
Incentives for Investors
1. Right to 100% foreign ownership.2. Legally backed investment guarantee.3. Provision for overseas arbitration of disputes 4. Long term contractual agreements and long term lease of land5. Freedom to use foreign managerial, technical and unskilled workers.6. No foreign exchange restrictions. 7. No restrictions on the repatriations of earnings or profits.
Source : http://www.investmaldives.org/
“Magnitude and Determinants of the Flows of Investment among South Asian Countries”

NEPAL
There are about 1300 Foreign direct investment projects in Nepal that worth approximately US$ 2.60 billion. These projects in the sectors like Agriculture/Forestry; Manufacturing; Energy; Construction; Mineral; Tourism and other Service related industries have generated employment opportunities to almost 95,000 people in Nepal. India, USA, China, UK, Norway, Japan, South Korea and Germany are the leading countries with highest number of projects in Nepal.
Why Invest in Nepal
The Government of Nepal has also created a competitive and investment friendly environment by making the administrative procedures simple and easy and also providing attractive incentives and facilities to the foreign investors making Nepal one of the safest and suitable business destinations in the world.
Nepal being a member of Multilateral Investment Guarantee Agency (MIGA) assures the foreign investors against non-commercial risks like currency transfer, breach of contract, war and civil disturbances in the country. The law of Nepal also assures the security of investments against nationalization.
With the expectation to supplement domestic private investment through foreign capital flows, transfer of technology, enhancement in management skills and productivity and to get into the global market, Nepal finally opened its door for foreign investment by adopting the most liberal economic policies.
Any investor can establish an industry or a project in Nepal with the approval and permission of the Department of Industry under His Majesty's Government of Nepal.
Potent Sectors for Investment
Almost every sector in Nepal is open for investment like Hydropower in which the country has huge potential of about 83,000 MW out of which 43,000 MW is economically viable. In addition to it, manufacturing, energy, tourism, mining, agro based industries are open for investment. But cottage, arm and ammunition industries; explosives and atomic energy; real estate; poultry and fisheries; and some other sensitive industries directly relating to public health, environment and defense are a few exceptions for foreign investment.
Benefits to Foreign Investors
The potential foreign investor is granted six months non-tourist visa for the feasibility study. Until the investment of a foreign investor is retained in Nepal, he/she and his/her dependents will be granted a business visa. If an investor makes a lump sum investment of US$ 100,000 or its equivalent in a convertible currency and as long as he/she retains investment in Nepal, he/she is granted a residential visa along with his/her dependents.
No income tax on (a) dividends (b) export earning (c) interest earned on foreign loan.
Reimbursement of (a) customs duty and sales tax on raw materials meant for industrial use (b) sales tax and excise duty levied on products sold to Export Promotion House (c) the customs duty, sales tax, excise duty and premium levied on raw materials, etc. used for production by an export industry (d) excise duty, sales tax and premium levied on any product and customs duty, excise duty and sales tax levied on the raw materials, auxiliary raw materials, etc., used for the production of goods sold within the country in foreign currency (e) customs duty, sales tax, excise duty and premium levied on inputs used for production of intermediate goods to be used for the production of exportable goods including refund on the sales tax and excise duty paid on intermediate goods on the basis of the
50
A Cultural Hub of South Asia
“Magnitude and Determinants of the Flows of Investment among South Asian Countries”

51
quantity of exports within sixty days from the date of export (f) excise duty or sales tax or both to the industry using duty-and tax-paid raw materials, chemicals and packing materials.
A deduction of (a) 40 % of the value of new additional fixed assets from taxable income to industries which diversify production through reinvestments or expanding installed capacity by 25 % or more or modernize technology or develop ancillary industries (b) up to 50 % from the taxable income for the investment made on process or equipment for non-pollution (c) 10% from gross profit that goes for technology or product development and skill enhancement (d) 5% or less of the gross income, spent on publicity and promotional services, hospitality and any other similar permissible expenses.
15% of income tax on income earned as technical fees as well as royalty.
Exemption of tax, duty and fee on the products, machinery, equipment, tools and raw materials used by an export industry.
Capitalization of pre-operating expenses incurred for skill development and training.
An additional of 10 % rebate on income tax to any industry providing direct employment to 600 or more Nepalese citizens.
No royalty on captive power generation for the industry's own use and no double sales tax on the raw materials and products.
Apart from all these, a foreign investor can employ an expert or technical personnel in the foreign investment project from his/her particular country upon the permission of the Labor Department and these experts can remit up to 75% of their income in convertible currency.
“Magnitude and Determinants of the Flows of Investment among South Asian Countries”

NEPAL
There are about 1300 Foreign direct investment projects in Nepal that worth approximately US$ 2.60 billion. These projects in the sectors like Agriculture/Forestry; Manufacturing; Energy; Construction; Mineral; Tourism and other Service related industries have generated employment opportunities to almost 95,000 people in Nepal. India, USA, China, UK, Norway, Japan, South Korea and Germany are the leading countries with highest number of projects in Nepal.
Why Invest in Nepal
The Government of Nepal has also created a competitive and investment friendly environment by making the administrative procedures simple and easy and also providing attractive incentives and facilities to the foreign investors making Nepal one of the safest and suitable business destinations in the world.
Nepal being a member of Multilateral Investment Guarantee Agency (MIGA) assures the foreign investors against non-commercial risks like currency transfer, breach of contract, war and civil disturbances in the country. The law of Nepal also assures the security of investments against nationalization.
With the expectation to supplement domestic private investment through foreign capital flows, transfer of technology, enhancement in management skills and productivity and to get into the global market, Nepal finally opened its door for foreign investment by adopting the most liberal economic policies.
Any investor can establish an industry or a project in Nepal with the approval and permission of the Department of Industry under His Majesty's Government of Nepal.
Potent Sectors for Investment
Almost every sector in Nepal is open for investment like Hydropower in which the country has huge potential of about 83,000 MW out of which 43,000 MW is economically viable. In addition to it, manufacturing, energy, tourism, mining, agro based industries are open for investment. But cottage, arm and ammunition industries; explosives and atomic energy; real estate; poultry and fisheries; and some other sensitive industries directly relating to public health, environment and defense are a few exceptions for foreign investment.
Benefits to Foreign Investors
The potential foreign investor is granted six months non-tourist visa for the feasibility study. Until the investment of a foreign investor is retained in Nepal, he/she and his/her dependents will be granted a business visa. If an investor makes a lump sum investment of US$ 100,000 or its equivalent in a convertible currency and as long as he/she retains investment in Nepal, he/she is granted a residential visa along with his/her dependents.
No income tax on (a) dividends (b) export earning (c) interest earned on foreign loan.
Reimbursement of (a) customs duty and sales tax on raw materials meant for industrial use (b) sales tax and excise duty levied on products sold to Export Promotion House (c) the customs duty, sales tax, excise duty and premium levied on raw materials, etc. used for production by an export industry (d) excise duty, sales tax and premium levied on any product and customs duty, excise duty and sales tax levied on the raw materials, auxiliary raw materials, etc., used for the production of goods sold within the country in foreign currency (e) customs duty, sales tax, excise duty and premium levied on inputs used for production of intermediate goods to be used for the production of exportable goods including refund on the sales tax and excise duty paid on intermediate goods on the basis of the
52
A Cultural Hub of South Asia
“Magnitude and Determinants of the Flows of Investment among South Asian Countries”

53
quantity of exports within sixty days from the date of export (f) excise duty or sales tax or both to the industry using duty-and tax-paid raw materials, chemicals and packing materials.
A deduction of (a) 40 % of the value of new additional fixed assets from taxable income to industries which diversify production through reinvestments or expanding installed capacity by 25 % or more or modernize technology or develop ancillary industries (b) up to 50 % from the taxable income for the investment made on process or equipment for non-pollution (c) 10% from gross profit that goes for technology or product development and skill enhancement (d) 5% or less of the gross income, spent on publicity and promotional services, hospitality and any other similar permissible expenses.
15% of income tax on income earned as technical fees as well as royalty.
Exemption of tax, duty and fee on the products, machinery, equipment, tools and raw materials used by an export industry.
Capitalization of pre-operating expenses incurred for skill development and training.
An additional of 10 % rebate on income tax to any industry providing direct employment to 600 or more Nepalese citizens.
No royalty on captive power generation for the industry's own use and no double sales tax on the raw materials and products.
Apart from all these, a foreign investor can employ an expert or technical personnel in the foreign investment project from his/her particular country upon the permission of the Labor Department and these experts can remit up to 75% of their income in convertible currency.
“Magnitude and Determinants of the Flows of Investment among South Asian Countries”
PAKISTAN
Pakistan over the last few years has developed itself as a potential market for foreign investors with its liberal investment policy, cheap labour, tax incentives and good return on investments. Five key reasons to invest in Pakistan are:
1 Geo-strategic Location2 Trained Workforce 3 6th largest market with moderate Purchasing Power Parity4 Business friendly and open Investment Policies 5 Solid Financial Markets
Pakistan- the land of Opportunities
Pakistan over the last few years has developed itself as a potential market for foreign investors with its liberal investment policy, cheap labour, tax incentives and good return on investments. Five key reasons to invest in Pakistan are:
6 Geo-strategic Location7 Trained Workforce 8 6th largest market with moderate Purchasing Power Parity9 Business friendly and open Investment Policies 10 Solid Financial Markets
Incentives offered
Pakistan has a very liberal policy on repatriation for foreign direct investors, therefore, investing in Pakistan may give a foreign direct investors the following added advantages
Foreign Direct Investment Incentives in Pakistan?11 Remittance of royalty, technology and franchise fee is allowed to projects in social, service, infrastructure,
agriculture and international chains food franchise.12 Minimum share of the local (Pakistani) partner in a joint venture will be 60:40 for the service sector.
However, 100% foreign equity can be owned for first 5 years.13 The FBR (Federal Board of Revenue) will not question as to the source of investment; however, the FBR
will only want to know whether the investor has paid requisite Income Tax on that specific investment. The FBR will not inquire into the source of the funds.
14 Foreign investors are allowed to invest in industrial project on 100% equity basis without any permission from the government.
15 There is no requirement for a No Objection Certificate from the Provincial Government.16 In addition to manufacturing sector foreign investment on a repatriate-able basis is allowed in services,
infrastructure and social sectors.17 Full repatriation of capital gains, dividends and profits.18 The facility for contracting foreign private loans is available to all those foreign investors who make
investment in the approved sectors.19 Foreign controlled manufacturing concerns are allowed to borrow on the domestic market according to
their requirements.20 Foreign controlled semi-manufacturing and non-manufacturing concerns can access loans equal to @
54
The land of Opportunities
“Magnitude and Determinants of the Flows of Investment among South Asian Countries”

55
75% & 50%, respectively, of their paid up capital including reserves.21 BOI's (Board of Investment) approval is not required for foreign companies to open a bank account.
Investment Policy of Government of Pakistan
For the purposes of foreign investment in Pakistan, the Investment Policy of Pakistan has formed two broad groupings i.e. manufacturing and non-manufacturing/ service sector. Salient features of the Pakistan Investment Policy relating to the manufacturing and services sectors are as follows:
MANUFACTURING SECTOR
22 The entity must be a company incorporated under the Companies Ordinance, 1984. 23 100% foreign equity is permissible on the basis of repatriation of capital and profits (dividend). 24 The amount of foreign equity investment must not be less than US $ 0.3 million.
SERVICE SECTOR:
25 The entity must be a company incorporated under the Companies Ordinance, 1984. 26 The amount of foreign equity investment must not be less than US $ 0.15 million. 27 100% foreign equity is permissible on the basis of repatriation of capital and profits (dividend).
NO GO AREAS (PROHIBITED AREAS)
Government of Pakistan prohibits the following areas for investment:28 Arms and ammunition 29 High explosives 30 Radioactive substances 31 Security printing, currency and mint 32 Alcoholic beverages or liquor
CORPORATE STRUCTURES
Various Corporate structures are available for setting up a place of business in Pakistan for which Masood and Masood, Corporate and Legal Consultants can give you the optimum advice putting into prospective the current Pakistan Legislation and the individual person/companies position.In terms of the Investment Policy of the Government of Pakistan, there are three (03) ways, whereby, a foreign company may have its presence in Pakistan.
33 Liaison Office; 34 Branch Office; and 35 Locally incorporated subsidiary
Foreign Private Investment (Promotion and Protection) Act, 1976 and the Furtherance and Protection of Economic Reforms Act, 1992 provide legal cover for protection of foreign investors/investment in Pakistan.Furthermore, since Pakistan has entered into Bilateral Agreements on Promotion and Protection of Investment with more than 46 countries. These Agreements provide especial advantages.
“Magnitude and Determinants of the Flows of Investment among South Asian Countries”

SRI LANKA
Today, Sri Lanka is ranked as the most liberalized economy in South Asia. Investors are provided with preferential tax rates, constitutional guarantees on investment agreements, exemptions from exchange control and 100% repatriation of profits.
Total foreign ownership is welcome in almost all areas of the economy, with only a few areas limited or restricted to foreigners.
Quality of Life Sri Lanka leads the South Asian region in terms of human development indicators, with its high literacy rate of 91% placing it way ahead of other South Asian nations & on par with those of south east Asia. Its national health indicators are comparable with those of the developed world.
Why Invest in Sri Lanka
Strategic Location- Sri Lanka is strategically located at the cross roads of both east and west sea routes and serves as the point of entry to South Asia.
Highly Literate & Cost Competitive Labour Force:
The Sri Lankan work force accounts for 35% of the total population. Sri Lanka boasts high levels of education. We have the highest literacy rate in South Asia (92%) and approximately 50% of the students who have completed their higher education are trained in technical and business disciplines. English is widely spoken in the country and is the main language used by the business community. Sri Lanka has the lowest labour cost per worker in manufacturing.
Attractive & Transparent Laws
When you sign an agreement with the BOI, the specific incentives granted to an eligible company, which may include tax holidays or preferential tax rates, exemptions from customs duty and foreign exchange controls, remain valid for the entire life of the enterprise.
Constitutional Guarantee for Investments
Sri Lanka has an enviable record of political credibility in the international arena. All major political parties are committed to free enterprise and individual freedom.
The government has never defaulted nor requested rescheduling of any of its international obligations. Significantly this protection extends to foreign investors.
Bilateral investment agreements supported by a constitutional guarantee, provides strong protection for foreign investment for Sri Lanka.
The safety of foreign investment is guaranteed through the acceptance by two third majority of Parliament of the Constitutional Guarantee of Investment Protection Agreements. Under article 157 of the country's constitution, the agreement enjoys the force of law and no legislative, executive or administrative action can be taken to contravene the provisions of a bilateral investment agreement otherwise than in the interests of national security.Bilateral investment agreements are valid for 10 years, and are extended automatically unless terminated by either party. If the agreement is terminated investments already made are protected for another 10 years.
56
Regional Trading Hub
“Magnitude and Determinants of the Flows of Investment among South Asian Countries”

57
A clause in the Sri Lankan constitution ensures the sanctity of the agreements. These agreements provide the following:
· Protection against nationalization. · Prompt and adequate compensation if required. · Free remittance of earnings, capital and business fees. · Settlement of disputes under the International Convention for the Settlement of Investment Disputes
(ICSID).
Efficient Port Facilities
1 According to the Lloyds Register the Colombo Port ranks as No. 01 port of South Asia and the 27th in the World.
2 Throughput has grown at a compound annual rate of 20.3% over the last seven years. 3 Transshipment cargo accounts for 76% of throughput. 4 23 major shipping lines and 7 feeder services operate out of Colombo. 5 The Colombo Port is computerized and linked to all major freight stations.
The Hub Port of South Asia offers:
6 An ideal geographical location with minimum deviation from shipping lines.7 Fully equipped berths for late container vessels. 8 Excellent feeder network. 9 Fast turnaround and round the clock service. 10 EDI facilities with two modern container terminals, with state of the art technology and control systems. 11 The most competitive rates in the region. 12 Multi country consolidation and entrepot cargo. 13 Flexibility to meet customer needs.
Source: http://www.boi.lk
“Magnitude and Determinants of the Flows of Investment among South Asian Countries”

Muhammad Ayub Mehar Khan (Ph.D)Professor, Iqra University KarachiPakistan
Muhammad Ayub Mehar Khan is in economics and financial research and university teaching since last twenty years. He proactively completed several policy research studies on strategic issues. Dr. Mehar has been working on various responsible positions in industry, financial markets and educational institutions in Pakistan. Currently, he is associated as 'Economic Advisor' with the SAARC Chamber of Commerce and Industry. He is also serving as 'Research Professor' in Iqra University Karachi.
Introduction of Academic Author
Abdul Wassay Haqiqi, Senior Advisor to the Ministry of Economy, Professor-American University of Afghanistan,Lecturer & VC-Bakhter University- Afghanistan
Introduction of Lead Author
58
“Magnitude and Determinants of the Flows of Investment among South Asian Countries”
Muhammad Ayub Mehar Khan (Ph.D)Professor, Iqra University KarachiPakistan
Abdul Wassay Haqiqi, Senior Advisor to the Ministry of Economy, Professor-American University of Afghanistan,Lecturer & VC-Bakhter University- Afghanistan Dr Abdur Rob Khan, Associate Professor, International Relations, North South University, Bangladesh
Dr. Nawal K PaswanAsst. Professor, Centre for South Asian Studies, Jawaharlal Nehru University,New Delhi-India
Mr. Mdhukar RanaFormer Finance Minister, Government of Nepal, Nepal
Mr. Mujeeb Ahmed KhanHead Research and Policy Analysis WingTDAP, Pakistan
Mr. Tilak CollureSecretary, Ministry of Industry & Commerce,Government of Sri Lanka
Dr. Selim RaihanExecutive Director SANEM &Associate ProfessorDepartment of EconomicsUniversity of DhakaBangladesh
Muhammad Iqbal TabishSecretary General, SAARC CCI
Mr. Annisul HuqPresidentSAARC Chamber of Commerce and Industry

Email: [email protected], Website: www.saarcchamber.org