macusani yellowcake inc (tsx-v) investor presentation
TRANSCRIPT
TSX-V:YEL FSE:QG1
Investor Presentation
TSX-V:YEL FSE:QG1November 2014
Disclaimer
The particulars contained herein were obtained from sources which we believe reliable but are not guaranteed by us and may be incomplete. The opinions expressed are based upon
our analysis and interpretation and are not to be construed as a solicitation or offer to buy or sell the securities mentioned herein. This presentation includes certain forward-looking
statements concerning the future performance of Macusani's business, operations and financial performance and condition, as well as management's objectives, strategies, beliefs
and intentions. Forward-looking statements are frequently identified by such words as "may", "will", "plan", "expect", "anticipate", "estimate", "intend" and similar words referring to
future events and results. Forward-looking statements are based on the current opinions and expectations of management. Forward-looking statements and forward-looking
information include, but are not limited to, statements with respect to estimated production and mine life; the future price of uranium; the estimation of mineral reserves and
resources; the realization of mineral resource and reserve estimates; the timing and amount of estimated future production; costs of production; success of exploration activities; and
currency exchange rate fluctuations. Except for statements of historical fact relating to Macusani, certain information contained herein constitutes forward-looking statements. All
forward-looking information is inherently uncertain and subject to a variety of assumptions, risks and uncertainties, including the speculative nature of mineral exploration and
development, fluctuating commodity prices, competitive risks, the availability of financing, variations in grades or recovery rates, risks relating to international operations, fluctuating
currency exchange rates, changes in project parameters, the possibility of project cost overruns or unanticipated costs and expenses, labour disputes and other risks of the mining
industry, failure of plant, equipment or processes to operate as anticipated, as described in more detail in the Company's recent securities filings available at www.sedar.com. Actual
events or results may differ materially from those projected in the forward-looking statements and Macusani cautions against placing undue reliance thereon. Neither Macusani nor
its management assume any obligation to revise or update these forward-looking statements.
Qualified Persons
The scientific and technical information contained in this news release relating to preliminary economic assessment was prepared by or under the supervision of, or reviewed and
approved by, Mr. Michael Short, B.E., CEng., FIMMM and Dr Thomas Apelt, PhD, CEng., MAusIMM, of GBM Minerals Engineering Consultants, and/or Mr. Mark Mounde, BEng.,
CEng., MIMMM of Wardell Armstrong International, who are independent technical consultants to the Company and "Qualified Persons" under NI 43-101 Standards of Disclosure for
Mineral Projects.
The scientific and technical information contained in this news release relating to the Mineral Resources was prepared under the supervision of, or reviewed and approved by Mr.
David Young, B.Sc. (Hons), FGSSA, FSAIMM, FAusIMM, Pr Sci Nat (No 400989/83) of The Mineral Corporation that is an independent technical consultant to the Company and a
“Qualified Person” under NI 43-101 Standards of Disclosure for Mineral Projects.
2
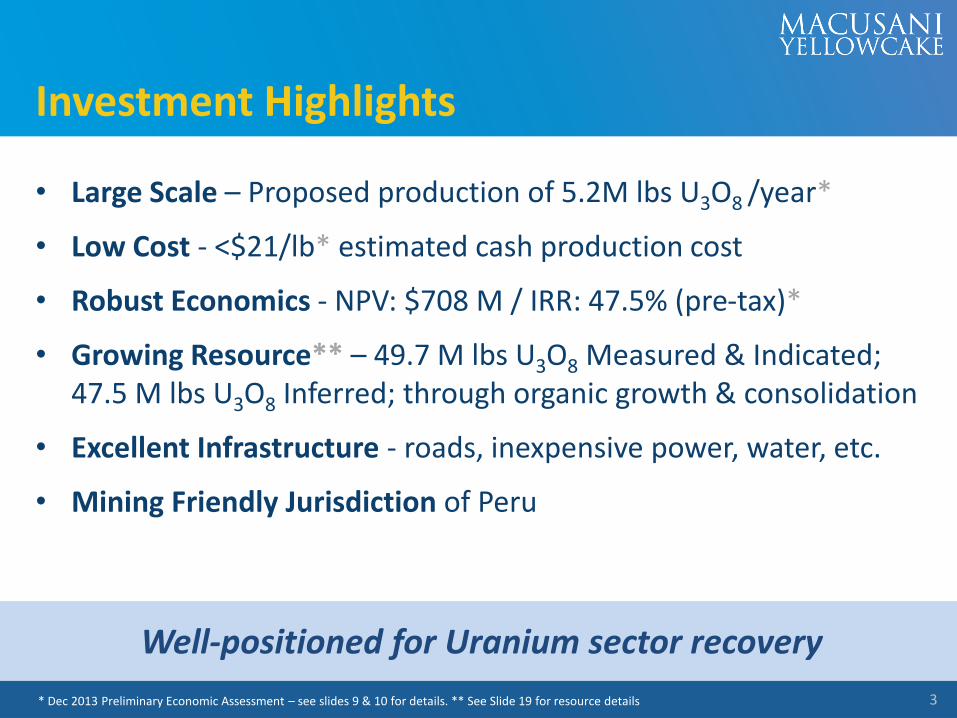
Investment Highlights
• Large Scale – Proposed production of 5.2M lbs U3O8 /year*
• Low Cost - <$21/lb* estimated cash production cost
• Robust Economics - NPV: $708 M / IRR: 47.5% (pre-tax)*
• Growing Resource** – 49.7 M lbs U3O8 Measured & Indicated; 47.5 M lbs U3O8 Inferred; through organic growth & consolidation
• Excellent Infrastructure - roads, inexpensive power, water, etc.
• Mining Friendly Jurisdiction of Peru
Well-positioned for Uranium sector recovery
* Dec 2013 Preliminary Economic Assessment – see slides 9 & 10 for details. ** See Slide 19 for resource details 3
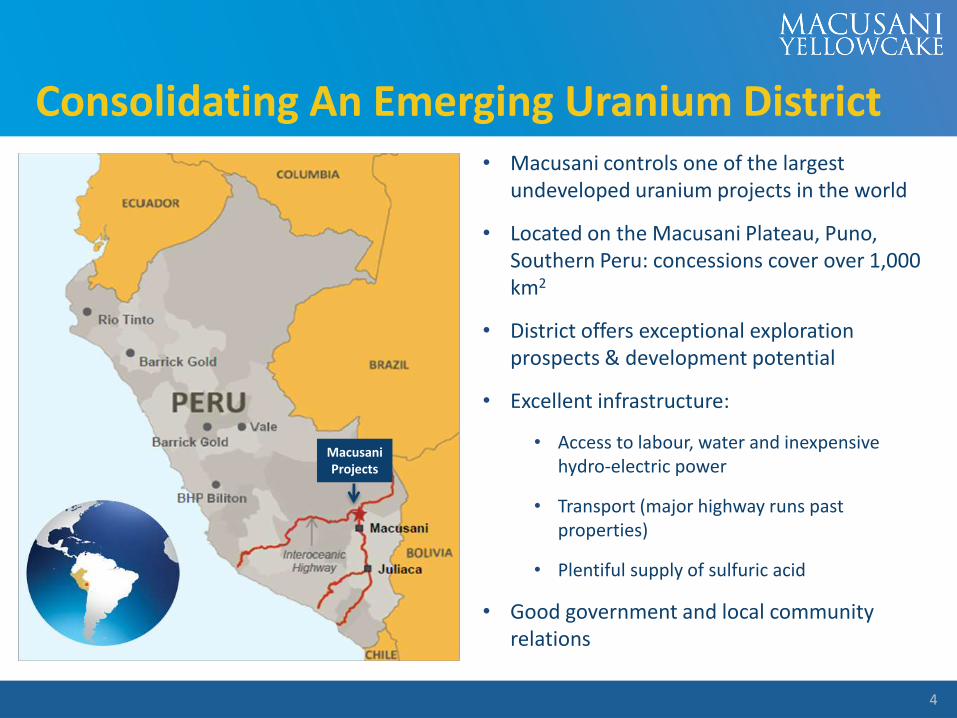
Consolidating An Emerging Uranium District
4
MacusaniProjects
• Macusani controls one of the largest undeveloped uranium projects in the world
• Located on the Macusani Plateau, Puno, Southern Peru: concessions cover over 1,000km2
• District offers exceptional exploration prospects & development potential
• Excellent infrastructure:
• Access to labour, water and inexpensive hydro-electric power
• Transport (major highway runs past properties)
• Plentiful supply of sulfuric acid
• Good government and local community relations
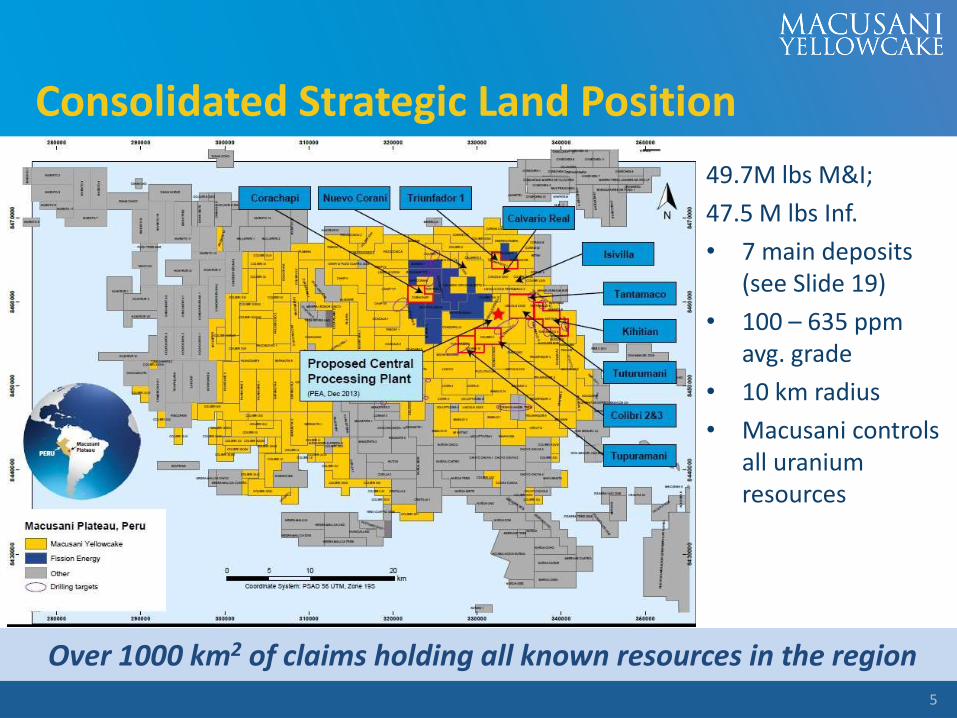
Consolidated Strategic Land Position
5
Over 1000 km2 of claims holding all known resources in the region
49.7M lbs M&I;
47.5 M lbs Inf.
• 7 main deposits (see Slide 19)
• 100 – 635 ppm avg. grade
• 10 km radius
• Macusani controls all uranium resources
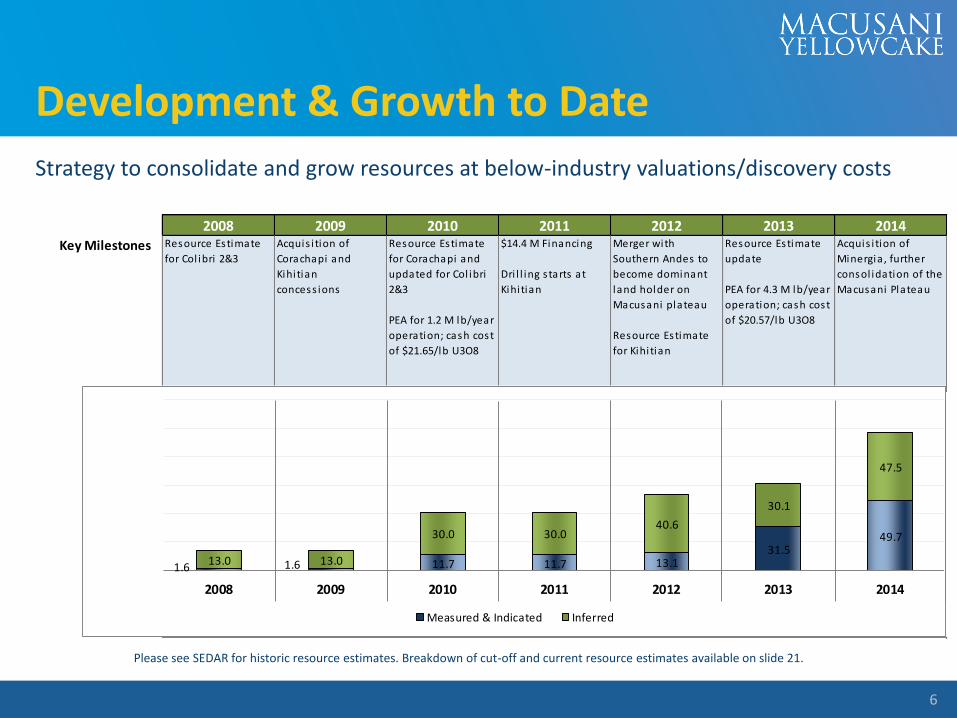
Development & Growth to Date
6
2008 2009 2010 2011 2012 2013 2014
Key Milestones Resource Estimate
for Col ibri 2&3
Acquis i tion of
Corachapi and
Kihi tian
concess ions
Resource Estimate
for Corachapi and
updated for Col ibri
2&3
PEA for 1.2 M lb/year
operation; cash cost
of $21.65/lb U3O8
$14.4 M Financing
Dri l l ing s tarts at
Kihi tian
Merger with
Southern Andes to
become dominant
land holder on
Macusani plateau
Resource Estimate
for Kihi tian
Resource Estimate
update
PEA for 4.3 M lb/year
operation; cash cost
of $20.57/lb U3O8
Acquis i tion of
Minergia , further
consol idation of the
Macusani Plateau
2008 2009 2010 2011 2012 2013 2014
1.6 1.6 11.7 11.7 13.1 31.5
49.7
13.0 13.0
30.0 30.0 40.6
30.1
47.5
2008 2009 2010 2011 2012 2013 2014
Measured & Indicated Inferred
Strategy to consolidate and grow resources at below-industry valuations/discovery costs
Please see SEDAR for historic resource estimates. Breakdown of cut-off and current resource estimates available on slide 21.

2013 PEA Highlights
• Robust financials
• Low cash costs
• Large-scale production
• Manageable CAPEX
• Resource expansion potential
• Prepared by GBM Minerals Engineering Consultants, The Mineral Corp. & Wardell Armstrong International
Paves the way for Pre-Feasibility Study in 20157
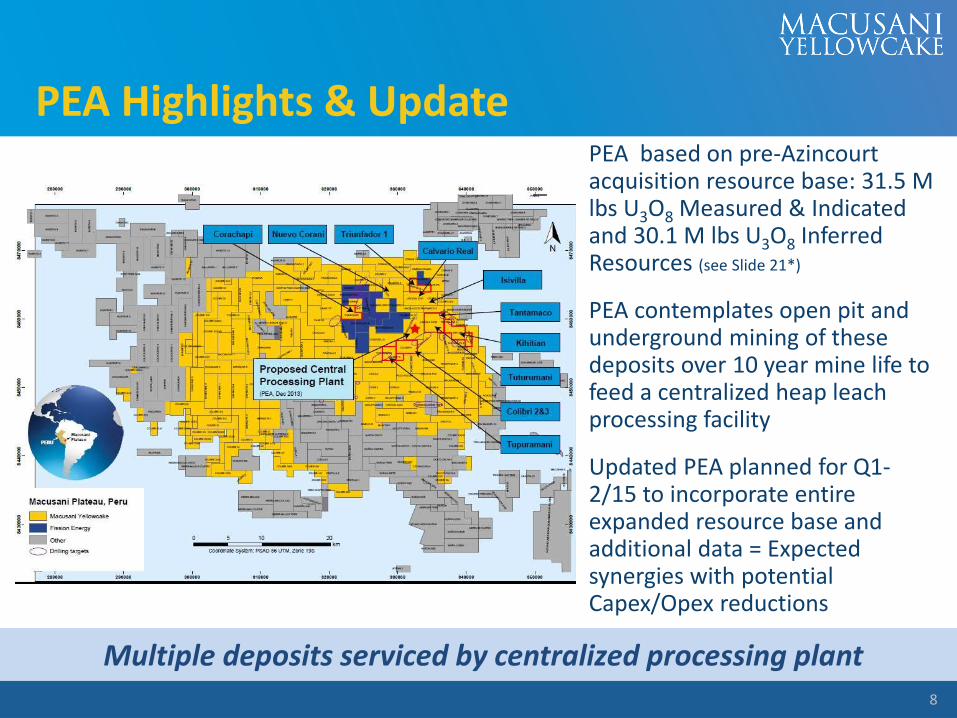
PEA Highlights & Update
8
Multiple deposits serviced by centralized processing plant
PEA based on pre-Azincourtacquisition resource base: 31.5 M lbs U3O8 Measured & Indicated and 30.1 M lbs U3O8 Inferred Resources (see Slide 21*)
PEA contemplates open pit and underground mining of these deposits over 10 year mine life to feed a centralized heap leach processing facility
Updated PEA planned for Q1-2/15 to incorporate entire expanded resource base and additional data = Expected synergies with potential Capex/Opex reductions
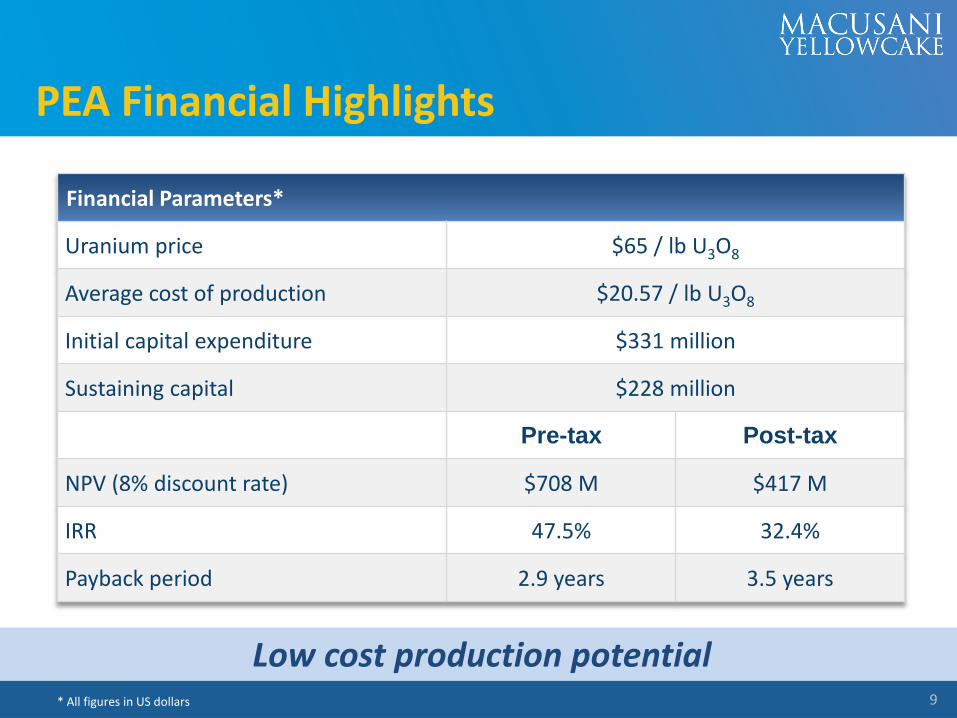
Low cost production potential
PEA Financial Highlights
9* All figures in US dollars
Financial Parameters*
Uranium price $65 / lb U3O8
Average cost of production $20.57 / lb U3O8
Initial capital expenditure $331 million
Sustaining capital $228 million
Pre-tax Post-tax
NPV (8% discount rate) $708 M $417 M
IRR 47.5% 32.4%
Payback period 2.9 years 3.5 years
Large-scale production potential
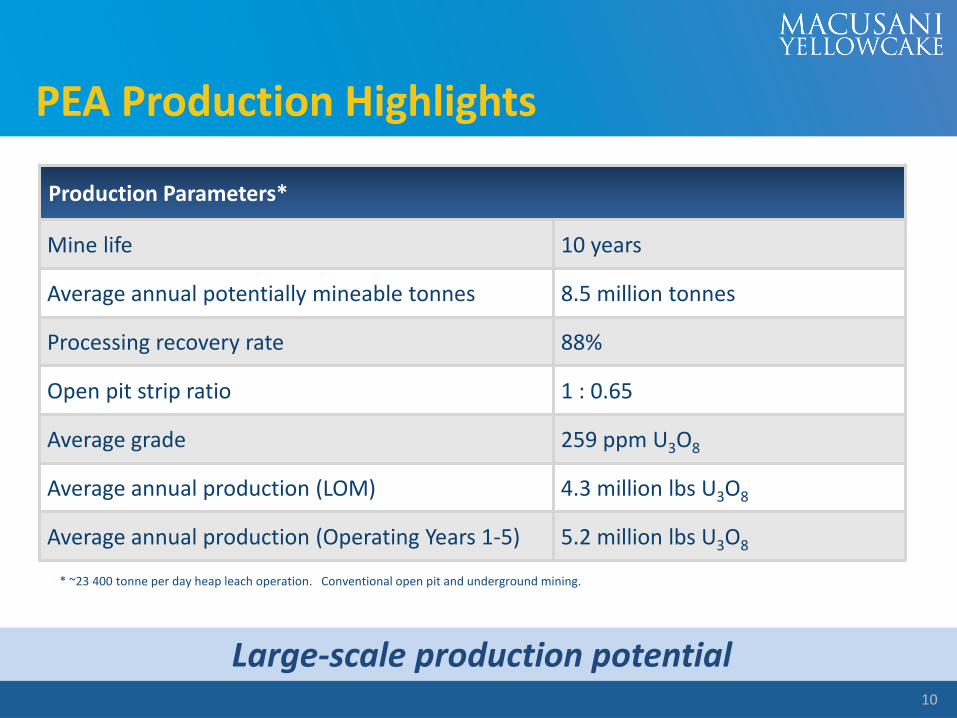
PEA Production Highlights
10
Production Parameters*
Mine life 10 years
Average annual potentially mineable tonnes 8.5 million tonnes
Processing recovery rate 88%
Open pit strip ratio 1 : 0.65
Average grade 259 ppm U3O8
Average annual production (LOM) 4.3 million lbs U3O8
Average annual production (Operating Years 1-5) 5.2 million lbs U3O8
* ~23 400 tonne per day heap leach operation. Conventional open pit and underground mining.
-
4,000,000
8,000,000
12,000,000
16,000,000
20,000,000
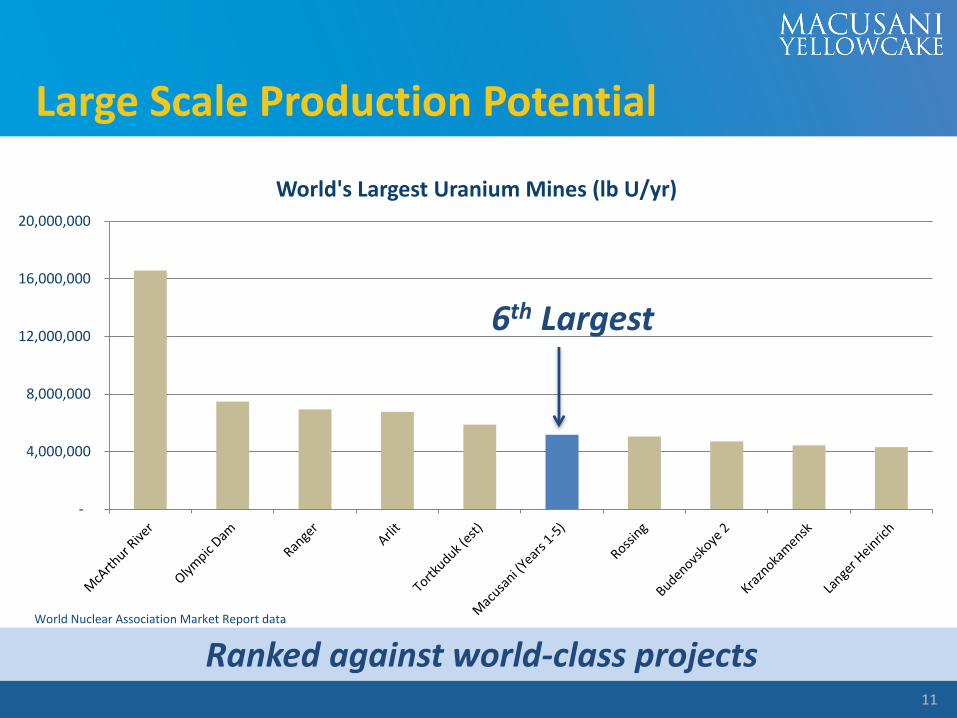
World's Largest Uranium Mines (lb U/yr)
Large Scale Production Potential
Paves way for Pre-Feasibility Study in 2014
6th Largest
World Nuclear Association Market Report data
11
Ranked against world-class projectsWorld Nuclear Association Market Report data
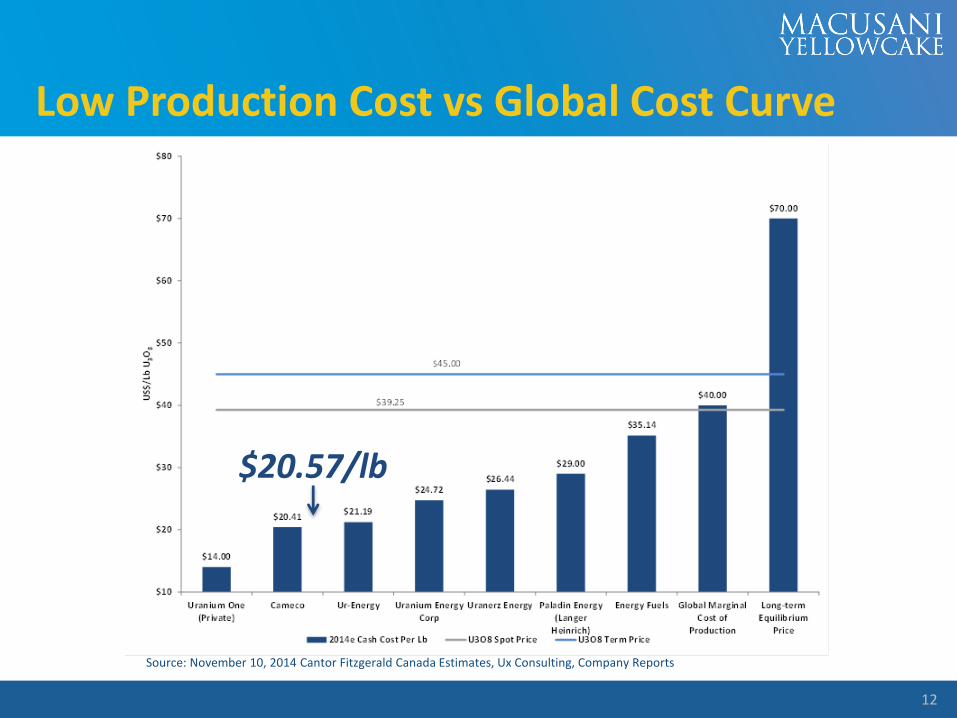
Low Production Cost vs Global Cost Curve
$20.57/lb
Source: November 10, 2014 Cantor Fitzgerald Canada Estimates, Ux Consulting, Company Reports
12
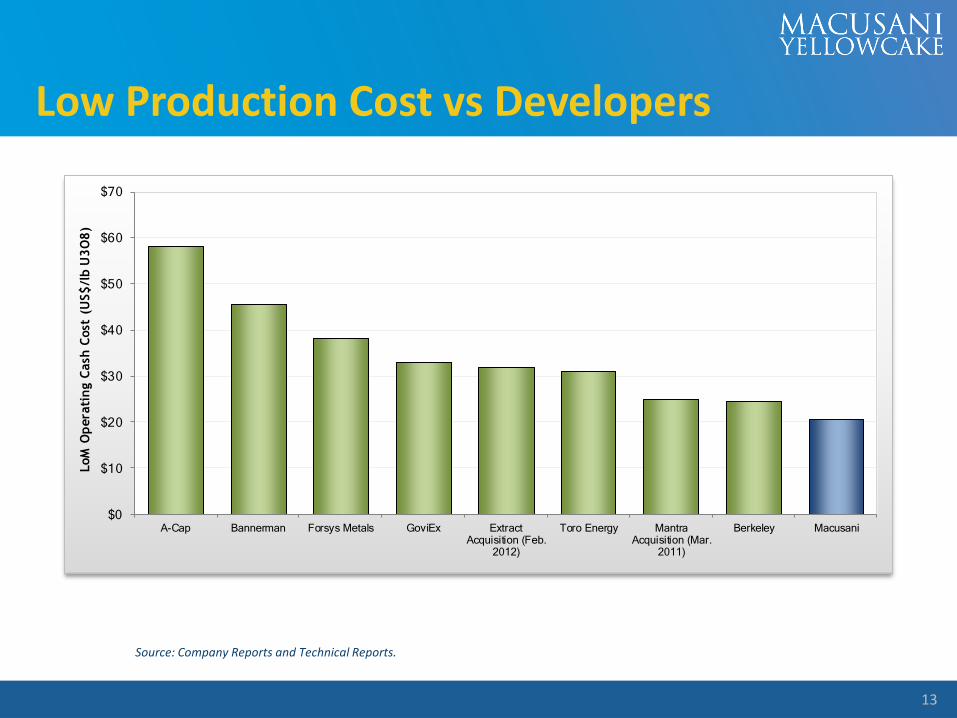
Low Production Cost vs Developers
13
Source: Company Reports and Technical Reports.
$0
$10
$20
$30
$40
$50
$60
$70
A-Cap Bannerman Forsys Metals GoviEx ExtractAcquisition (Feb.
2012)
Toro Energy MantraAcquisition (Mar.
2011)
Berkeley Macusani
LoM
Op
era
tin
g C
ash
Cost
(U
S$
/lb
U3
O8
)
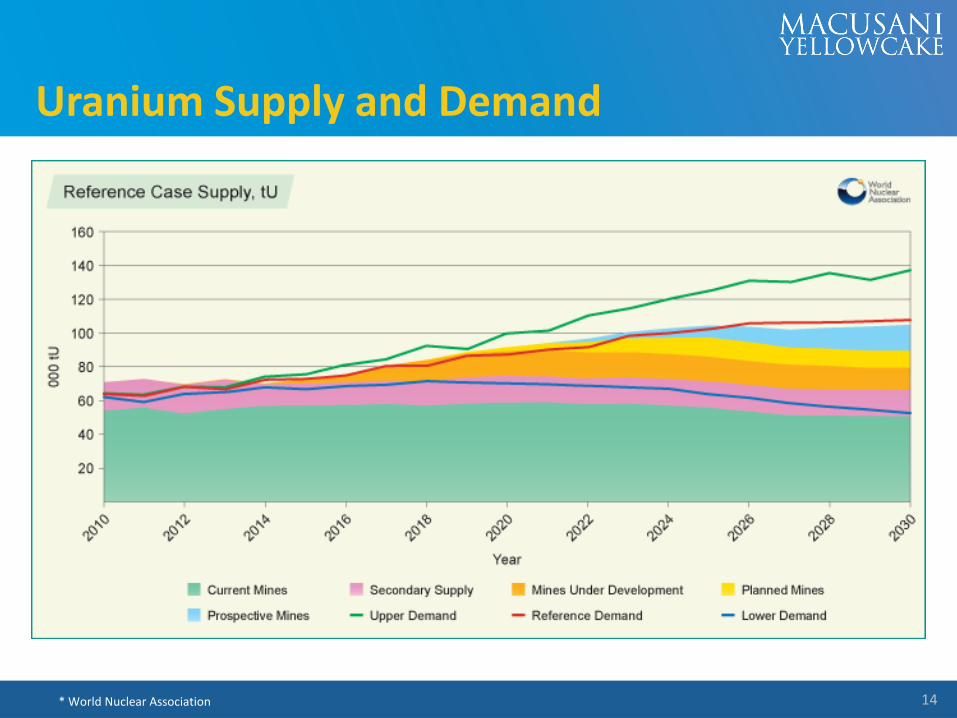
Uranium Supply and Demand
14* World Nuclear Association
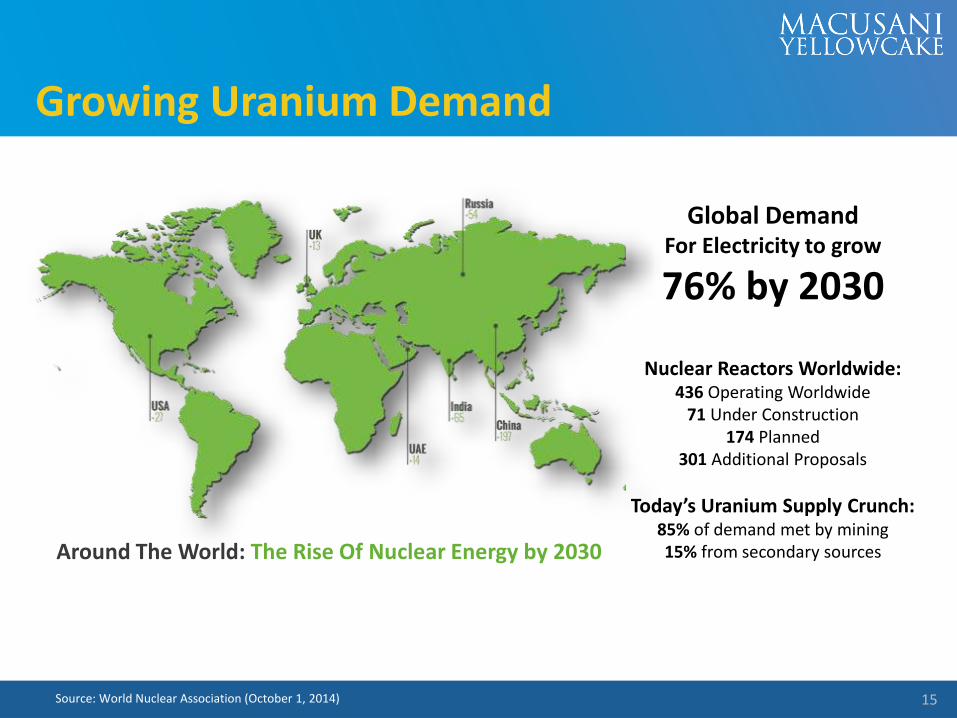
Growing Uranium Demand
15Source: World Nuclear Association (October 1, 2014)
Global Demand For Electricity to grow
76% by 2030
Nuclear Reactors Worldwide:436 Operating Worldwide
71 Under Construction174 Planned
301 Additional Proposals
Today’s Uranium Supply Crunch:85% of demand met by mining15% from secondary sourcesAround The World: The Rise Of Nuclear Energy by 2030
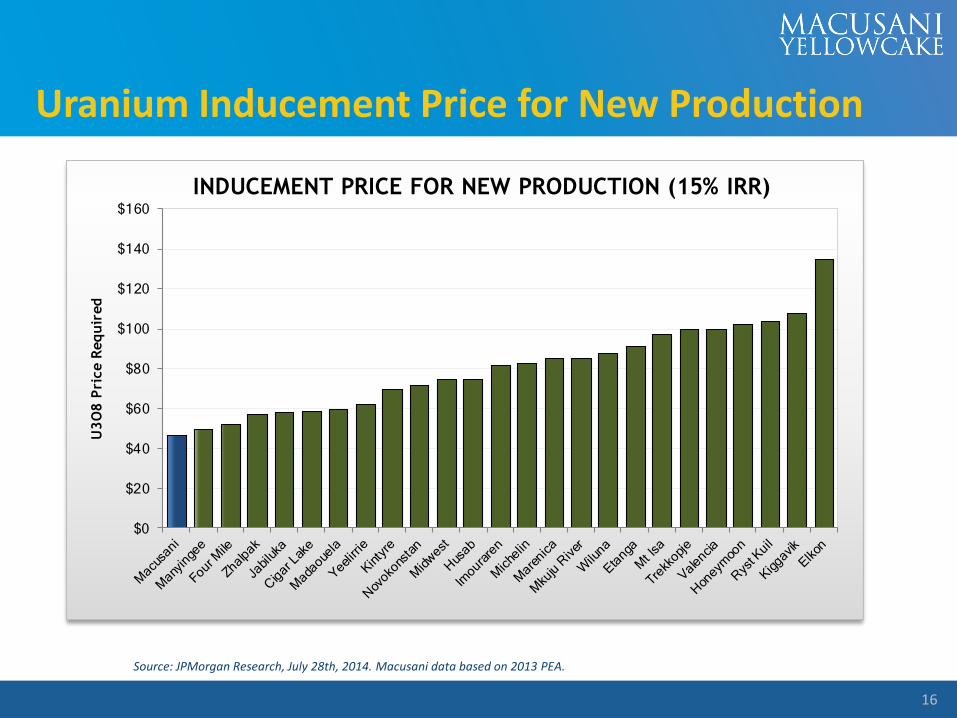
Uranium Inducement Price for New Production
16
Source: JPMorgan Research, July 28th, 2014. Macusani data based on 2013 PEA.
$0
$20
$40
$60
$80
$100
$120
$140
$160
U3
O8
Pri
ce R
eq
uir
ed
INDUCEMENT PRICE FOR NEW PRODUCTION (15% IRR)
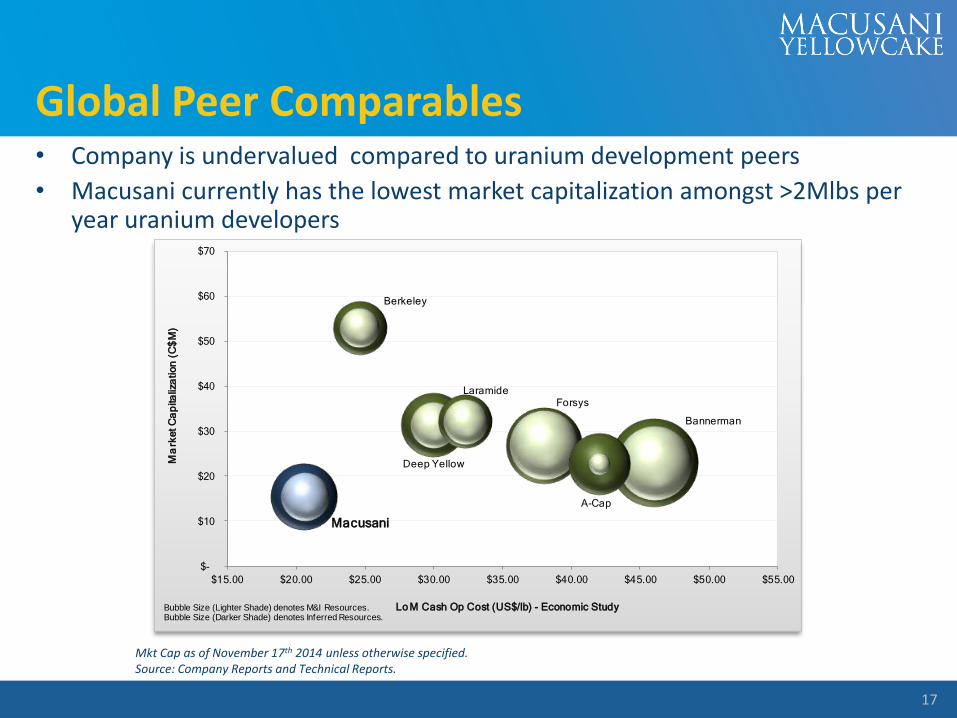
Global Peer Comparables• Company is undervalued compared to uranium development peers
• Macusani currently has the lowest market capitalization amongst >2Mlbs per year uranium developers
17
Mkt Cap as of November 17th 2014 unless otherwise specified.Source: Company Reports and Technical Reports.
Macusani
Bannerman
Berkeley
Deep Yellow
ForsysLaramide
A-Cap
$-
$10
$20
$30
$40
$50
$60
$70
$15.00 $20.00 $25.00 $30.00 $35.00 $40.00 $45.00 $50.00 $55.00
Ma
rke
t C
ap
italiz
ati
on
(C
$M
)
Lo M Cash Op Cost (US$/lb) - Economic StudyBubble Size (Lighter Shade) denotes M&I Resources.Bubble Size (Darker Shade) denotes Inferred Resources.
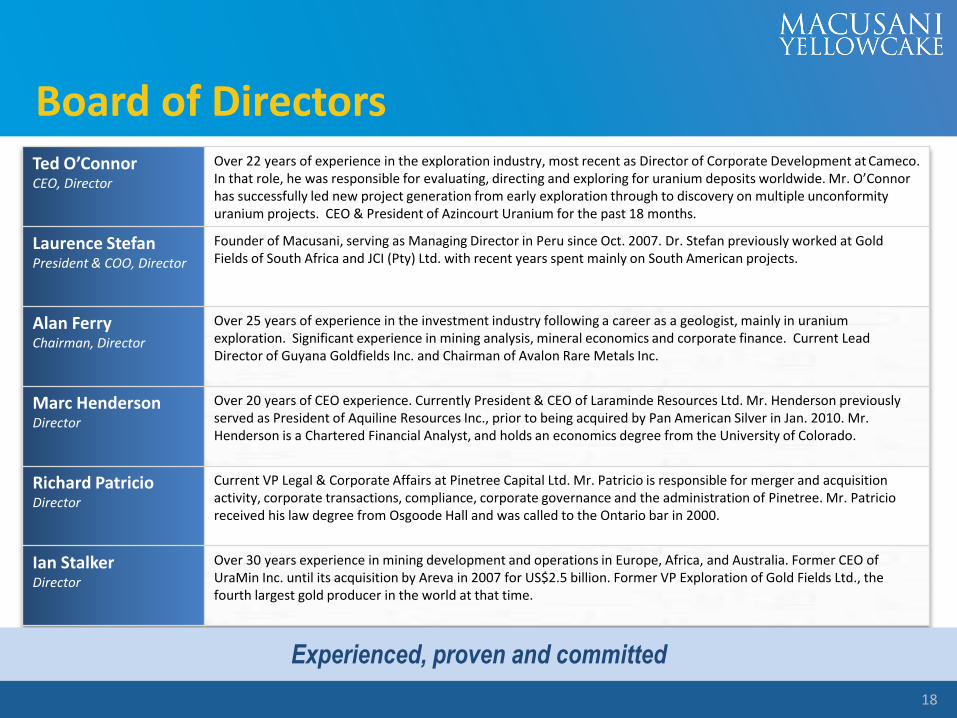
Board of Directors
18
Ted O’ConnorCEO, Director
Over 22 years of experience in the exploration industry, most recent as Director of Corporate Development at Cameco. In that role, he was responsible for evaluating, directing and exploring for uranium deposits worldwide. Mr. O’Connor has successfully led new project generation from early exploration through to discovery on multiple unconformity uranium projects. CEO & President of Azincourt Uranium for the past 18 months.
Laurence StefanPresident & COO, Director
Founder of Macusani, serving as Managing Director in Peru since Oct. 2007. Dr. Stefan previously worked at Gold Fields of South Africa and JCI (Pty) Ltd. with recent years spent mainly on South American projects.
Alan FerryChairman, Director
Over 25 years of experience in the investment industry following a career as a geologist, mainly in uranium exploration. Significant experience in mining analysis, mineral economics and corporate finance. Current Lead Director of Guyana Goldfields Inc. and Chairman of Avalon Rare Metals Inc.
Marc HendersonDirector
Over 20 years of CEO experience. Currently President & CEO of Laraminde Resources Ltd. Mr. Henderson previously served as President of Aquiline Resources Inc., prior to being acquired by Pan American Silver in Jan. 2010. Mr. Henderson is a Chartered Financial Analyst, and holds an economics degree from the University of Colorado.
Richard PatricioDirector
Current VP Legal & Corporate Affairs at Pinetree Capital Ltd. Mr. Patricio is responsible for merger and acquisition activity, corporate transactions, compliance, corporate governance and the administration of Pinetree. Mr. Patricio received his law degree from Osgoode Hall and was called to the Ontario bar in 2000.
Ian StalkerDirector
Over 30 years experience in mining development and operations in Europe, Africa, and Australia. Former CEO of UraMin Inc. until its acquisition by Areva in 2007 for US$2.5 billion. Former VP Exploration of Gold Fields Ltd., the fourth largest gold producer in the world at that time.
Experienced, proven and committed

Macusani: 43-101 Compliant Resources
19
* Resource shown at a 75 ppm U cut-off (88.4 ppm U3O8 cut-off) Conversion of U to U3O8 is 1.179. Source: Technical Report dated September 20, 2013 by The Mineral Corporation: “Mineral Resource Estimates for the Colibri 2 & 3 / Tupuramani, Kihitian and Triunfador Uranium Projects, held by Global Gold S.A.C. in the Puno District of Peru.” & Technical Report dated February 22, 2012 by Foremost Geological Consulting: “Technical Report on the Corachapi and Kihitian Uranium Properties, Macusani District, Department of Puno, Peru.”**Resource shown at a 77 ppm U cut-off (90.7 ppm U3O8 cut-off); Conversion of U to U3O8 is 1.179. Source: Technical Report dated August 31, 2014 by Henkle and Associates “Updated Technical Report of the Macusani and Muñani Uranium Exploration Projects Department of Puno, Perú”, prepared for Macusani Yellowcake Inc.
Project Measured & Indicated InferredTonnes
(Mt)Grade
(ppm U3O8)Contained lbs(Mlbs U3O8)
Tonnes(Mt)
Grade (ppm U3O8)
Contained lbs(Mlbs U3O8)
Kihitian* 8.4 Mt 635 ppm 11.8 Mlbs 12.8 Mt 615 ppm 17.4 Mlbs
Colibri 2 & 3 / Tupuramani*
27.9 Mt 240 ppm 14.7 Mlbs 20.4 Mt 170 ppm 7.7 Mlbs
Corachapi* 11.6 Mt 195 ppm 5.0 Mlbs 3.8 Mt 230 ppm 1.9 Mlbs
Triunfador* - - - 3.5 Mt 409 ppm 3.1 Mlbs
Tantamaco** 32.7 Mt 220 ppm 16.0 Mlbs 13.2 Mt 119 ppm 5.6 Mlbs
Isivilla** 4.5 Mt 150 ppm 1.5 Mlbs 6.9 Mt 420 ppm 6.4 Mlbs
Nuevo Corani** 3.2 Mt 100 ppm 0.7 Mlbs 7.3 Mt 210 ppm 3.4 Mlbs
Tuturumani/Calvario Real**
- - - 6.8 Mt 134 ppm 2.0 Mlbs
Sub-Total 88.3 Mt 256 ppm 49.7 Mlbs 74.7 Mt 288 ppm 47.5 Mlbs
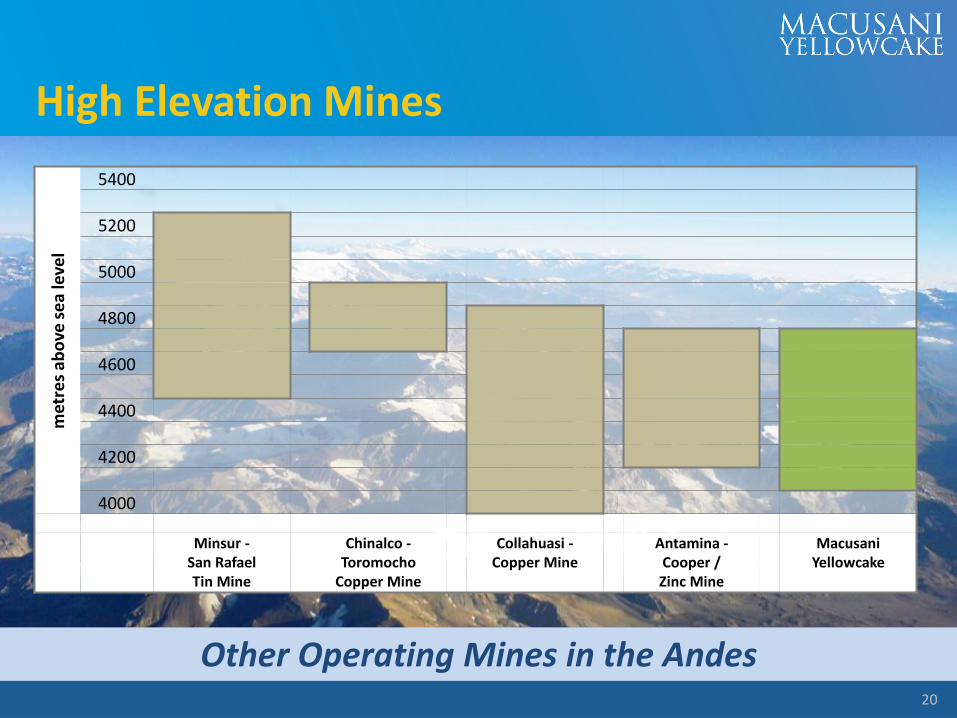
High Elevation Minesm
etre
s ab
ove
se
a le
vel
5400
5200
5000
4800
4600
4400
4200
4000
Minsur -San Rafael Tin Mine
Chinalco -Toromocho
Copper Mine
Collahuasi -Copper Mine
Antamina -Cooper / Zinc Mine
Macusani Yellowcake
Other Operating Mines in the Andes20
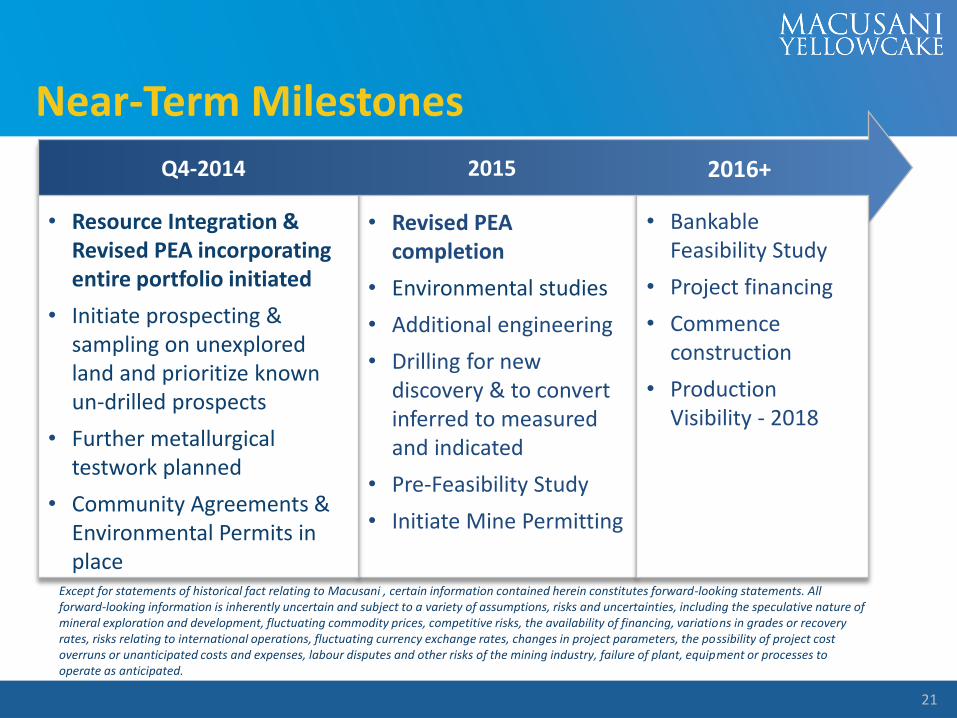
Near-Term Milestones
Except for statements of historical fact relating to Macusani , certain information contained herein constitutes forward-looking statements. All forward-looking information is inherently uncertain and subject to a variety of assumptions, risks and uncertainties, including the speculative nature of mineral exploration and development, fluctuating commodity prices, competitive risks, the availability of financing, variations in grades or recovery rates, risks relating to international operations, fluctuating currency exchange rates, changes in project parameters, the possibility of project cost overruns or unanticipated costs and expenses, labour disputes and other risks of the mining industry, failure of plant, equipment or processes to operate as anticipated.
21
Q4-2014 2016+
• Resource Integration & Revised PEA incorporating entire portfolio initiated
• Initiate prospecting & sampling on unexplored land and prioritize known un-drilled prospects
• Further metallurgical testwork planned
• Community Agreements & Environmental Permits in place
• Bankable Feasibility Study
• Project financing
• Commence construction
• Production Visibility - 2018
• Revised PEA completion
• Environmental studies
• Additional engineering
• Drilling for new discovery & to convert inferred to measured and indicated
• Pre-Feasibility Study
• Initiate Mine Permitting
2015
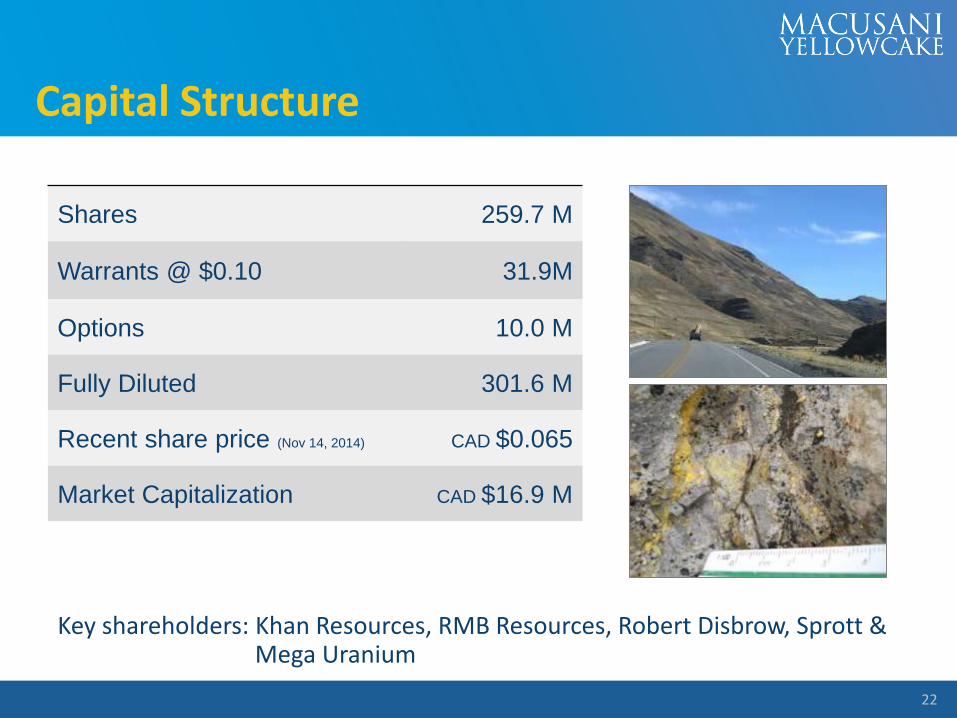
Capital Structure
22
Shares 259.7 M
Warrants @ $0.10 31.9M
Options 10.0 M
Fully Diluted 301.6 M
Recent share price (Nov 14, 2014) CAD $0.065
Market Capitalization CAD $16.9 M
Key shareholders: Khan Resources, RMB Resources, Robert Disbrow, Sprott &Mega Uranium
Contact Information
23
Ted O’ConnorChief Executive Officer & [email protected]
OR
Laurence StefanPresident & Chief Operating [email protected]
www.macyel.com
Head Office 141 Adelaide Street West, Suite 1200Toronto, Ontario M5H 3L5