macroeconomic developments report. december 2015
TRANSCRIPT

MACROECONOMIC
DEVELOPMENTS
REPORT 2015
DECEMBER

MACROECONOMIC DEVELOPMENTS REPORT
December 2015
MACROECONOMIC DEVELOPMENTS REPORTDecember 2015, No 22
© Latvijas Banka, 2015
The source is to be indicated when reproduced.
Latvijas BankaK. Valdemāra iela 2A, Riga, LV-1050, LatviaTel.: +371 67022300 Fax: +371 67022420http://[email protected]

2
MACROECONOMIC DEVELOPMENTS REPORTDecember 2015
CONTENTS
ContentsAbbreviations 3Introduction 41. External sector and Exports 61.1 External economic environment 61.2 Latvia's competitiveness and exports of goods 102. Monetary Policy and Financial Markets 132.1 ECB monetary policy decisions, liquidity and money market developments 132.2 Global financial markets and main decisions of other central banks 142.3 Securities market 172.4 Lending and deposit rates 192.5 Dynamics of domestic loans and deposits 213. Domestic Demand 263.1 Private consumption and investment 263.2 Government expenditure and budget 294. Aggregate supply 314.1 Industry 314.2 Construction and real estate market 344.3 Services 364.4 Labour market 405. Costs and Prices 436. Balance of Payments 467. Conclusions and Forecasts 487.1 Economic developments 487.2 Inflation 50statistics 51Additional Information 102
3
MACROECONOMIC DEVELOPMENTS REPORTDecember 2015
Abbreviations
ABSPP – asset-backed securities purchase programmeAPP – asset purchase programmeBRIC – Brazil, Russia, India and ChinaCBPP3 – third covered bond purchase programmeCIF – cost, insurance and freight at the importer's borderCIS – Commonwealth of Independent StatesCSB – Central Statistical Bureau of LatviaEC – European CommissionECB – European Central BankEONIA – euro overnight index averageESA 2010 – European System of Accounts 2010EU – European UnionEU15 – EU countries before 1 May 2004EU28 – EU countries as of 1 July 2013EURIBOR – Euro Interbank Offered RateEurostat – statistical office of the European UnionFOB – free on board at the exporter's borderFRS – Federal Reserve SystemGDP – gross domestic productHICP – Harmonised Index of Consumer PricesIMF – International Monetary FundJSC – joint stock companyLtd. – limited liability companyLTRO – longer-term refinancing operations MFI – monetary financial institutionOFI – other financial intermediary (other than an insurance corporation or a pension fund) OMXBBGI – OMX Baltic Benchmark Gross indexOMXR – NASDAQ Riga indexSEA – State Employment AgencySJSC – state joint stock companySRS – State Revenue ServiceTLTRO – targeted longer-term refinancing operations UK – United KingdomUN – United Nations OrganisationUS – United States of AmericaVAT – value added taxWTO – World Trade Organisation
ABBREVIATIONS

4
MACROECONOMIC DEVELOPMENTS REPORTDecember 2015
INTROdUCTION
IntroductionThe lower-than-expected actual growth in the first half of 2015 and the downwards revised annual global growth forecasts for the next year suggest further worsening of the global economic growth outlook. Growth moderates mostly on account of declining economic activity in the developing countries and slower economic recovery in the developed countries. The economic growth forecasts have been revised downwards both for the euro area and most of Latvia's major trade partners.
The euro area economic growth forecasts have been revised despite the Eurosystem's successful implementation of the expanded APP. during the first nine months of its implementation, the average asset purchase volume reached 60.2 billion euro per month, consistent with the ECB's target. Overall, securities with the current balance sheet residual value of 598.5 billion euro were purchased under the expanded APP. The fourth and fifth TLTRO tenders were conducted in June and September, increasing the amount of loans granted to euro area credit institutions in TLTROs to 399.4 billion euro.
As a result of the ECB accommodative monetary policy, the excess liquidity in euro area continued to grow, thus reducing money market interest rates to negative record lows. In such an environment, lending rates tend to fall in the euro area, with euro area credit institutions also easing their lending terms and conditions at the same time. The overall recovery of the euro area lending growth notwithstanding, its pace still remains low. The level of interest rates on new loans differs considerably across the euro area countries.
To stimulate the economic growth and push up the low inflation rate, the Governing Council of the ECB at its meeting of 3 december 2015 decided to reduce the interest rate on the deposit facility from –0.20% to –0.30%, leaving the interest rate on the main refinancing operations and that on the marginal lending facility unchanged. Also the expanded APP and the use of fixed-rate tenders with full allotment were extended, reinvestment of the principal payments on the securities purchased under the expanded APP as they mature was started, as well as the purchase of eligible securities of the euro area regional and local governments under the expanded APP began. The ECB President expressed strong commitment to use all available instruments within the ECB's mandate, if necessary, to reach the inflation target.
In the first nine months of 2015, moderate economic growth continued in Latvia, posting a 2.6% increase in GdP, driven by private consumption on the basis of labour market improvements. Exports of goods and services continued to support growth despite the persisting unfavourable external environment. The drop in the value of exports of goods to Russia has been offset by the pick-up in exports to several EU countries, the US and Asia. Exports of services largely expanded on account of Latvia's Presidency of the EU Council. In the reference period, the launch of the JSC KVV Liepājas metalurgs operation also had a positive effect on the economic activity. At the same time, investment activity was weak, raising concern about sustainable economic growth in the medium term.
In line with forecasts, the decrease in Latvia's unemployment rate is moderating as the headline unemployment is close to its natural rate. The rise in wages and salaries remains sustained; however, the average growth in wages and salaries in 2016 will slow down on account of the fading upward effect of legislative amendments. An absence of clear signs suggesting a build-up of macroeconomic imbalances in the labour market at this stage notwithstanding, an increase in wages and salaries exceeding productivity growth should trigger paying particular attention to labour market developments.
Inflation remained low and continued on a downward trend, with the average 12-month inflation reaching 0.3% in October. In 2015, domestic factors (a rise in income and indirect taxes and energy market liberalisation for households) largely offset the downward impact of the external supply factors (declining prices of oil and agricultural products) on inflation.

5
MACROECONOMIC DEVELOPMENTS REPORTDecember 2015
INTROdUCTION
The drop in oil prices has a downward pressure not only on fuel but also on natural gas and heating prices. Food prices fell on account of both global and regional factors – lifting of the milk production quotas in the EU countries and the Russian trade embargo. Core inflation still remains positive due to income growth.
Fiscal developments suggest that a stable tax increase and a steep rise in fixed expenditure, inter alia in wages and salaries and social benefits, could be observed simultaneously. Although the expenditure growth rate moderated after the rapid surge at the beginning of the year, partly related to the Latvian Presidency of the EU Council, it still remained high, considerably exceeding the indicator of the corresponding period of the previous year. Revenue from taxes on labour continued to support the overall increase in tax revenue, accounting for almost half of the overall increase in tax revenue. Although the consolidated general government budget, estimated on a cash flow basis, ran a surplus in the first nine months of 2015, given the expected foreign financial assistance as well as other revenue and expenditure dynamics, the deficit in 2015, estimated on an accrual basis, will be close to the indicator forecast by the Ministry of Finance (1.4% of GdP). For the purposes of financing the government deficit and refinancing the government debt, the Treasury launched 10-year eurobonds in the amount of 500 million euro and with the weighted average yield of 1.45% in the external market on 16 September.
The expected weakening of the external demand was already incorporated in the September forecast; the perception regarding the economic outlook for 2016 has not changed, thus the GdP growth forecast remains the same at 2.7%. Risks related to the country's economic development are currently balanced.
The average annual inflation for 2015 and 2016 will remain low on account of supply-side factors (mostly due to lower oil and food prices). With the economic growth remaining moderate and as a result of planned changes in indirect taxes, a slight increase in inflation is expected in 2016. The risk distribution of the inflation forecast for 2016 is considered balanced.
According to the Ministry of Finance budgetary plans for 2016, the deficit will fall to 1.0% of GdP; however, according to the macroeconomic forecast scenario of Latvijas Banka's experts, the budget deficit will reach 1.6% of GdP. The difference is mostly caused by lower level of tax revenue as a result of slower economic growth, as well as higher estimates of projected social payments.

6
MACROECONOMIC DEVELOPMENTS REPORTDecember 2015
Table 1GdP GROWTH PROJECTIONS FOR LATVIA'S MAJOR TRAdE PARTNERS IN 2015 ANd 2016(%)
20151 20152 20161 20162
Euro area 1.5 1.5 1.7 ↓ 1.6 Estonia 2.5 ↓ 2.0 3.4 ↓ 2.9 Lithuania 2.8 ↓ 1.8 3.2 ↓ 2.6 Germany 1.6 ↓ 1.5 1.7 ↓ 1.6 Finland 0.8 ↓ 0.4 1.4 ↓ 0.9
UK 2.4 ↑ 2.5 2.2 2.2 Russia –3.4 ↓ –3.8 0.2 ↓ –0.6 Poland 3.5 3.5 3.5 3.5 Sweden 2.7 ↑ 2.8 2.8 ↑ 3.0
Sources: April 2015 (Estonia, Lithuania,Finland, Poland and Sweden), July 2015 (euro area, Germany, the UK and Russia) (1) and October 2015 (2) World Economic Outlook (IMF).
1. EXTERNAL SECTOR AND EXPORTS
1. External sector and Exports1.1 External economic environment
The pace of global economic growth has lost some momentum. According to preliminary assessment, the global economic growth was 2.9% in the first half of 2015, falling behind earlier projections by 0.3 percentage point. This weak performance primarily reflected an economic slowdown in developing countries and a more sluggish recovery in advanced economies. As commodity prices were low and uncertainty in global markets was growing due to decelerating economic growth in China and prospective raising of interest rates by the FRS, the IMF revised the global economic growth forecast downwards. The most recent GdP projections provide for a global real GDP increase by 3.1% in 2015 and 3.6% in 2016. Growth projections have been reduced also for Latvia's major trade partners (see Table 1).
GdP in China picked up 6.9% year-on-year in the third quarter, recording the slowest pace of growth since 2009. Growth of industrial production, investment, exports and imports is becoming more moderate, while some advance is observed in retail trade. Such developments are natural due to China's gradual transition to a new model where growth is engineered by domestic demand and the role of services sector is strengthening. The decline in oil prices exerting a negative effect on oil exporting countries is primarily driven by the excessive supply which neither the OPEC countries nor other oil producing economies competing for market shares are going to reduce. In Russia, the low energy prices and western sanctions due to the ongoing conflict in Ukraine are deepening the recession.
Growth in advanced economies is modest, while headline inflation declined, mainly reflecting lower energy and food prices. Growth in the US was balanced in the second quarter (annual pickup of 3.9%) and above the preliminary estimate in the third quarter (2.1%). The US housing market has performed well, and unemployment is close to its natural level. The FRS is considering raising the base rate in the near future. The UK economy is on a gradual recovery track, and the unemployment rate is almost back to its pre-crises level.
In the second quarter, euro area GdP picked up 0.4% quarter-on-quarter in line with projections. Nevertheless, annualised headline inflation was close

7
MACROECONOMIC DEVELOPMENTS REPORTDecember 2015
to zero (–0.1% in September, 0.1% in October). In the reporting period, resilience of the monetary union was undermined by the Greek sovereign debt crisis and uncertainty regarding country's eventual exit from or stay in the euro area; the government of Greece, however, managed to negotiate with the international lenders the third bailout programme and its terms and conditions. Greece has pledged to act to ensure country's economic recovery. Oil price falls are expected to support growth in Europe (as countries in the region are mostly oil importers), and monetary easing is expected to provide an additional impulse to economic activity. The bank lending survey conducted by the ECB suggests that terms and conditions of lending to enterprises improved slightly in the third quarter.
Growth in Latvia's trade partners remained weak (see Chart 1.1). The latest GdP growth estimates were above 3% only for Poland and Sweden. The purchasing managers index (PMI) in manufacturing, suggesting some growth, elevated slightly above 50 points in Latvia's trade partners (see Chart 1.2). The indicator for Russia, having lingered below 50 points over the whole year, also slightly exceeded this threshold in October. In the third quarter, overall trade partners' economic sentiment somewhat improved, in Sweden and Estonia in particular (see Chart 1.3), and deteriorated slightly in the UK (from August) and Germany (in October). In Russia, in turn, it was at a record low.
1. EXTERNAL SECTOR AND EXPORTS
Chart 1.1GdP ANNUAL ANd QUARTERLY GROWTH RATE IN LATVIA'S SELECTEd TRAdE PARTNERS (Q3 2015; %)
Chart 1.2PURCHASING MANAGERS INdEX IN MANUFACTURING IN LATVIA'S MAJOR TRAdE PARTNERS (total seasonally adjusted indicator)

8
MACROECONOMIC DEVELOPMENTS REPORTDecember 2015
In the UK in the second quarter, GdP expanded by 0.7% quarter-on-quarter on account of rising net exports and business investment. Private consumption continued to be the main engine behind the growth. In September, retail trade turnover grew at the fastest pace in two years. Labour market improved, with wages rising and unemployment rate falling. Nevertheless, the recent monthly data show that in the third quarter the UK industrial activity, and consequently also exports, slackened, as the British pound sterling appreciated and economic growth in UK trade partners declined. According to preliminary estimates, GdP growth in the third quarter slowed down to 0.5%.
In Estonia, GdP posted a quarter-on-quarter pickup of 0.7% in the second quarter and, according to preliminary estimation, fell by 0.5% in the third quarter. The economic growth was spurred, on the one hand, by higher value added in trade, real estate and agriculture, and, on the other hand, was slowed down mostly by contracting value added in transport, construction and industry. The trade balance was undermined by the economic decline in Russia and Finland. Modest external demand had a negative effect on industrial production. Preliminary data show that the contribution, positive as a rule, of industry and trade to GdP growth was close to zero in the third quarter. Economic progress is likely to receive a positive impetus from the domestic demand, private consumption in particular, also in the future. Growth in private consumption is driven by higher household incomes and the low inflation.
After having fallen in the first quarter, Lithuania's GdP increased by 0.4% in the second quarter; according to preliminary data, the third quarter pickup has been 0.5%. The domestic demand acted as the key engine of advance. Both private consumption (supported by low prices and rising wages) and investment (including also in construction) are on an upswing. The trade balance is adversely affected by Russia's economic situation and falling dairy product and oil prices. Agriculture records the largest drop in value added.
In Poland, GdP increased by 0.8% in the second quarter; according to preliminary estimation, the third quarter rise has been 0.9%. GdP growth has been driven by domestic demand. Strong labour market indicators and favourable financial situation of households and non-financial corporations continued to boost the domestic demand and to support further economic development. decelerating pace of growth in value added in industry was a drag on overall
1. EXTERNAL SECTOR AND EXPORTS
Chart 1.3ESI IN LATVIA'S MAJOR TRAdE PARTNERS

9
MACROECONOMIC DEVELOPMENTS REPORTDecember 2015
1. EXTERNAL SECTOR AND EXPORTS
advance. Further industrial growth to a large extent will depend on Germany's economic progress. In general, Poland's economy is characterised by dynamic and stable headway determined by private consumption and less subject to external-environment-related risks.
Finland boasted a 0.2% quarter-on-quarter GdP rise in the second quarter (best performance over last seven quarters); in the third quarter, however, preliminary estimation points to a negative growth (–0.6%). despite certain moderate signs of economic recovery in the reporting period, the growth remained very weak. Employment expanded at a sluggish pace, and unemployment rate elevated slightly, to stand at 8.7% in October. Consumer sentiments deteriorated, retail trade turnover contracted, and real incomes grew somewhat. In the second quarter, private consumption dropped by 0.2%. The moderate growth observed in the second quarter was on account of trade balance improvements, which were determined by a 1% rise in exports and 5% drop in imports. However, the weak external demand for Finnish exports, particularly from Russia and Europe, and Russia-imposed sanctions negatively impacted Finland's overall export volumes. Industrial performance was sluggish.
In Germany, economic growth moderated. GdP recorded a 0.4% quarter-on-quarter pickup in the second quarter. Growth was driven by export expansion and at the same time held back by modest investment due to the implications from external environment. The situation deteriorated slightly in the third quarter when, according to preliminary estimate, GdP growth was 0.3%. The economic situation in Germany is currently strongly affected by the Volkswagen emissions violation scandal, migrant crisis, recession in Russia, and China's decelerating economic growth; the overall future implications from these factors for the economy are still indefinable. Along with contracting external demand, exports are narrowing and industrial growth is falling. Low energy prices, however, have a positive effect on population's purchasing power, while wages are growing under the impact of low unemployment rate; hence household consumption figures as a significant contributor to the economic growth.
Quarter-on-quarter, Sweden's GdP picked up 1.1% in the second quarter. The economic growth was underpinned by strong domestic demand, benefitting from strong private consumption and real estate investment. Inflation continued to be low while simultaneously rising somewhat. In June, annual inflation stood at 0.4%, to elevate to 0.9% in October.

10
MACROECONOMIC DEVELOPMENTS REPORTDecember 2015
Sveriges Riksbank was maintaining its expansionary monetary policy aimed at anchoring inflation at the 2% target.
The Russian economy continued on a downward trend, as indicated by the annual fall in GdP growth in the second quarter (–4.6%) and, in line with preliminary estimation, also in the third quarter (–4.1%). Nevertheless, the monthly indicators of GdP growth suggested slight progress (0.1%–0.3%) between August and October, probably signalling some stabilisation of the economy. Russia's trade balance is still adversely impacted by low oil prices which, in turn, caused the Russian ruble to depreciate; as a result, inflation is rising and capital outflowing, forcing the Central Bank of the Russian Federation to react by raising base rates. Likewise, the economic sanctions related to the Russian–Ukrainian conflict continued to affect the economy negatively. Consumer confidence deteriorated fast. The domestic demand remains weak and, combined with the domestic structural factors, is likely to curb economic activity also in the future.
1.2 Latvia's competitiveness and exports of goods
According to the CSB data, Latvia's goods exports and imports increased by 3.2% and 1.7% year-on-year respectively in the second quarter of 2015; in the third quarter, however, both were almost at the previous year's level, with exports gaining only 0.3% and imports losing 0.3% (see Charts 1.4 and 1.5). A slow upward trend has been observed in Latvia's commodity exports further on, mostly on account of determination of businesses and public institutions as well as their ability to cooperate and swiftly react to hurdle formation in external trade.
Both in the second and third quarters, the largest positive contribution to the annual rise in the value of commodity exports came from machinery and electrical equipment, vegetable products, optical instruments and medical apparatus. Some positive albeit lesser was the contribution from manufacture of furniture, paper articles, products of the chemical industry, wood and articles of wood. The annual growth was adversely affected by falling exports of base metals and articles of base metals, animal products, and prepared foodstuffs.
The turnover of Latvia's foreign trade in goods was unstable in the third quarter (in July, exports and imports of goods grew by 5.0% and 6.6% month-on-month respectively; in August in comparison
1. EXTERNAL SECTOR AND EXPORTS
Chart 1.4EXPORTS OF GOOdS(year-on-year; %)
Chart 1.5IMPORTS OF GOOdS (year-on-year; %)

11
MACROECONOMIC DEVELOPMENTS REPORTDecember 2015
with the previous month, both fell by 7.8% un 6.4% respectively; in September, they grew again by 23.1% and 4.8% respectively). In September, exports of goods were spurred by the substantial seasonal increase in exports of vegetable products (worth 114.8 million euro, including exports of wheat and meslin which recorded a 26 times larger increase against August). This significant expansion in exports of cereal products was on account of higher global prices and the record-high cereal harvest in Latvia. Cereal exports from Latvia reached Algeria, Saudi Arabia, France and Spain. At the same time, the sanctions on behalf of Russia, deteriorating trade fundamentals, tightening competition, and continuously weak external demand acted as a drag on exports. Following a two-year break, the JSC KVV Liepājas metalurgs resumed its operation, yet the unfavourable situation in key trade partners' construction product markets and globally falling metal prices are obstacles on the way to radically boosting metal production and rising income from exports.
In the first nine months of 2015, exports of goods expanded by 2.0% year-on-year, with a pickup registered for exports of vegetable products, wood and paper products, chemical products, plastic products, building materials, machinery and electrical equipment, optical products and miscellaneous products. The declining exports to Russia were offset by boosting exports to the EU countries (the UK, denmark, the Netherlands, Estonia, the Czech Republic, etc.), the US and Asian countries (Algeria, United Arab Emirates, Hong Kong, Saudi Arabia, Turkmenistan, Azerbaijan, Japan, etc.). Exports of dairy products contracted most, reflecting adverse effects of the Russian-imposed sanctions, falling dairy product prices on the global scale and the lifting of EU milk quotas. Nevertheless, a number of enterprises in this sector maintain their economic activity and succeed in finding new markets for their output. In 2015, Latvian companies started exporting dairy products to China, Egypt, Turkey, Georgia, Tunis, Serbia, Japan, Belarus, the US and other countries.
According to preliminary data of the WTO, the so-far swift expansion of Latvia's export market share in recent two years has practically come to a halt. Amid weaker demand and affected by the Russian sanctions, the competition in EU markets has tightened, and it is becoming more complicated for Latvian exporting companies to succeed in increasing their market shares. Export expanding in the eastern direction is curbed by unpredictable volatility of national
1. EXTERNAL SECTOR AND EXPORTS

12
MACROECONOMIC DEVELOPMENTS REPORTDecember 2015
1. EXTERNAL SECTOR AND EXPORTS
currencies. As the existing geopolitical situation and slow economic growth in the EU overall strongly interfere with investing activities and boosting exports, intensive search for new markets and bolstering national competitiveness are still decisive for goods exports.
data published by the EC in October imply that the estimation of future production trends and export orders has improved somewhat for Latvian businesses; prospects for export volumes ahead are also brighter. The vision for competitiveness outside the EU and within the domestic market has likewise taken a turn for the better, suggesting ongoing activities of businesses to expand into new markets. The opinion of businesses about competitiveness within the EU, on the other hand, continued to deteriorate on account of generally weak economic activity and demand in Latvia's key export markets. As of the volumes of imports of goods in the first nine months of 2015, they remained almost flat year-on-year, recording a 0.6% increase. The annual increase in imports augmented in July and August, primarily on account of rising imports of intermediate and capital goods; this, in turn, kindles hopes for slightly stronger impetus to goods exports in upcoming months.
Although the environment for exporting is not extremely favourable, Latvian businesses keep demonstrating their capacity to make use of the state-offered support mechanisms effectively and to succeed in export market diversification. Nonetheless, negative risks are prevailing. The scenario of a positive external trade development is mainly threatened by global economic growth which contrary to all expectations for its acceleration remains sluggish. Also the development of goods exports and investment will be constrained by recession and drags on imports in Russia, combined with geopolitical uncertainty.
13
MACROECONOMIC DEVELOPMENTS REPORTDecember 2015
2. Monetary Policy and Financial Markets 2.1 ECB monetary policy decisions, liquidity and money market developments
The Governing Council of the ECB at its monetary policy meetings held in June, July, September and October 2015 decided to keep the key ECB interest rates unchanged. Since September 2014, the interest rate on the main refinancing operations has been kept at the level of 0.05%, on the marginal lending facility – 0.30% and on the deposit facility – –0.20%. At the press conference, following the monetary policy meeting of the Governing Council of the EC, ECB President Mario draghi expressed his readiness to conduct a thorough assessment of the economic situation at the december meeting and, if necessary, to expand the ECB asset purchase programme or change its conditions. He also did not exclude the possibility of reducing the interest rate on deposit facility to reach the ECB inflation target of achieving inflation rates below, but close to, 2% over the medium term. This led to a decline in the future money market interest rates.
The Governing Council of the ECB at its meeting of 3 december 2015 decided to decrease the interest rate on the deposit facility from –0.20% to –0.30%, extend the expanded APP until March 2017, reinvest the nominal value of the securities purchased under the expanded APP as they mature for as long as the ECB considers it necessary, include securities of the euro area regional and local governments in the expanded APP, as well as to use fixed-rate tenders with full allotment at least until the last maintenance period of 2017 or longer, where necessary.
The Eurosystem continued to implement the expanded APP successfully. during the first nine months of its implementation, the average asset purchase volume reached 60.2 billion euro. This is consistent with the ECB aim to purchase assets for a total amount of 60.0 billion euro on a monthly basis. Overall, securities with the current residual balance sheet value of 598.5 billion euro were purchased under the expanded APP, including asset-backed securities totalling 15.2 billion euro, covered bonds in the amount of 137.8 billion euro and government securities of the euro area countries and securities of European supranational institutions for a total of 445.5 billion euro (see Chart 2.1). Since October 2014, the asset purchase programme made it possible
2. MONETARY POLICY ANd FINANCIAL MARKETS

14
MACROECONOMIC DEVELOPMENTS REPORTDecember 2015
to increase the ECB total assets by 32% or 654.2 billion euro to 2.69 trillion euro.
The fourth and fifth TLTRO tenders were conducted in June and September when the Eurosystem allotted 73.8 billion euro and 15.5 billion euro respectively. Latvian credit institutions received 30.0 million euro in each TLTRO. Within the framework of the first five TLTROs, the Eurosystem granted 399.4 billion euro to credit institutions of the euro area, including 220.5 million euro – to Latvian credit institutions. The next TLTRO will take place in december.
The ECB's accommodative monetary policy continued to affect money market developments. Excess liquidity of the euro area increased, exceeding 550 billion euro in November, and this lowered money market interest rates and their volatility. The euro area money market interest rates continued to decline, reaching new historically low rates. Since September, EONIA remained negative and reached a new historical low of –0.15%. The downward trend of 3-month EURIBOR also became more pronounced, i.e. since April, when it first became negative, 3-month EURIBOR has declined to –0.11% (see Chart 2.2).
2.2 Global financial markets and main decisions of other central banks
In the second half of 2015, global financial markets saw securities price adjustments: stock prices fell and became extremely volatile, while bond prices hiked. These moves were underpinned by concerns about China, world's second largest economy, losing growth momentum. Market participants' sentiment was driven by low commodity prices, falling inflation expectations in advanced countries as well as decisions of world's major central banks and the related expectations.
Similar to the ECB, also other major central banks continued to pursue accommodative monetary policy and maintained key interest rates at historically low levels (see Chart 2.3). The FRS, the Bank of England and the Bank of Japan kept their monetary stimuli unchanged. Market participants anticipated the FRS
Chart 2.1BALANCE OF THE EXPANdEd APP ON THE EUROSySTEM'S BALANCE SHEET By PROGRAMME(billions of euro)
Chart 2.2MONEY MARKET INTEREST RATES ANd EXCESS LIQUIdITY IN THE EURO AREA(%)
Chart 2.3BASE RATES (%)
2. MONETARY POLICY ANd FINANCIAL MARKETS

15
MACROECONOMIC DEVELOPMENTS REPORTDecember 2015
to discontinue the period of expansionary monetary policy and to start raising interest rates; at the same time, forecasts about the Bank of Japan extending its asset purchase programme due to anticipated falls in growth and inflation rates became more pronounced.
In July, Sveriges Riksbank revised its base rate downwards, to –0.35%, i.e. by 0.1 percentage point, for the third time in 2015. Furthermore, Sveriges Riksbank extended the government bond purchase programme by additional 45 billion kronor (4.9 billion euro). The Swiss National Bank also voiced its preparedness to expand the implementation of accommodative monetary policy further.
Backed by the accommodative monetary policy of EU central banks, yields on government short-term debt securities hovered close to historically lowest level; moreover, with negative interest rates persisting, a downward trend was experienced in many countries (see Chart 2.4).
Concerns about decelerating growth in China significantly shattered financial markets across the globe. As late as in August, macroeconomic and survey indicators were still pointing to growth losing momentum in China; market participants started to reckon with eventual repercussions for companies also in other economies. While in June the decline of stock prices in China's market had been local and did not affect other markets much, the stock price drop experienced in August spilled over into other markets across the world. In the reporting period, the central bank of China made several moves to prop up the stock market: it banned major stockholders from selling their stakes, allowed its state pension fund to invest in corporate stock, etc. The People's Bank of China likewise boosted lending by several times reducing the main refinancing rate and minimum reserve requirement for credit institutions. In August, the central bank of China introduced radical changes to the methodology of fixing national currency, allowing market to impact its exchange rate more strongly. This resulted in depreciation of the Chinese yuan renminbi rate against the euro by 2%. Consequently, market participants' worries about a further collapse of China's national currency amid decelerating economic growth and decreasing inflation expectations only augmented. due to such uncertainty, financial market participants opted to invest in more secure financial assets, thus heightening volatility and pushing down prices in stock markets of both emerging market and advanced economies. Bond prices, by contrast, stabilised.
Chart 2.42-YEAR GOVERNMENT BONd YIELdS OF EUROPEAN COUNTRIES ANd THE US (%)
2. MONETARY POLICY ANd FINANCIAL MARKETS

16
MACROECONOMIC DEVELOPMENTS REPORTDecember 2015
After adjustments in May and June, yields on government bonds contracted in both leading and peripheral euro area countries (except Greece; see Chart 2.5). Under the pressure of investors' run for safety, the yield on 10-year US government bonds fell, but its spread with the yield on the respective German government bonds increased by 12 basis points as the latter contracted at a faster pace. Between early July and end-November, the yield on 10-year German government bonds shrank by 34 basis points, to 0.47%, while that of the US government dropped by 22 basis points, to 2.21% (see Chart 2.6).
The euro area financial market fluctuated most in the summer months when the Greek government failed to negotiate the sovereign debt crisis solution with international lenders, thus giving rise to worries about Greek exit from the euro area. Concerns also grew with regard to Greek government's capacity to make loan repayments, hence yields on Greek government bonds surged. Greek companies and credit institutions suffered much from the restrictions imposed on the banking system to limit the outflow of currency. It had repercussions for the Greek stock and corporate bond market where prices plunged significantly.
The euro exchange rate against the US dollar temporally appreciated in the third quarter, yet towards end-October the downward trend resumed, and the euro slipped to 1.06 US dollars. The short-lived fall in the value of the US dollar was determined by markets turning away from risky assets, such as stocks, thus unwinding the covered US dollar positions. The volatile exchange rates also triggered changes in market expectations about an eventual FRS's base rate rise and also about the introduction of additional monetary stimuli in the euro area. After having stabilised temporally, the euro depreciated also against other currencies (see Chart 2.7).
2. MONETARY POLICY ANd FINANCIAL MARKETS
Chart 2.510-YEAR GOVERNMENT BONd YIELdS OF EURO AREA PERIPHERAL COUNTRIES (%)
Chart 2.6YIELdS ON GERMAN ANd US 10-YEAR GOVERNMENT BONdS ANd THEIR SPREAdS(basis points)
Chart 2.7EXCHANGE RATE OF US dOLLAR, RUSSIAN RUBLE, BRITISH POUNd STERLING ANd CHINESE YUAN RENMINBI AGAINST EURO (index: 1 January 2015 = 100)
17
MACROECONOMIC DEVELOPMENTS REPORTDecember 2015
2.3 securities market
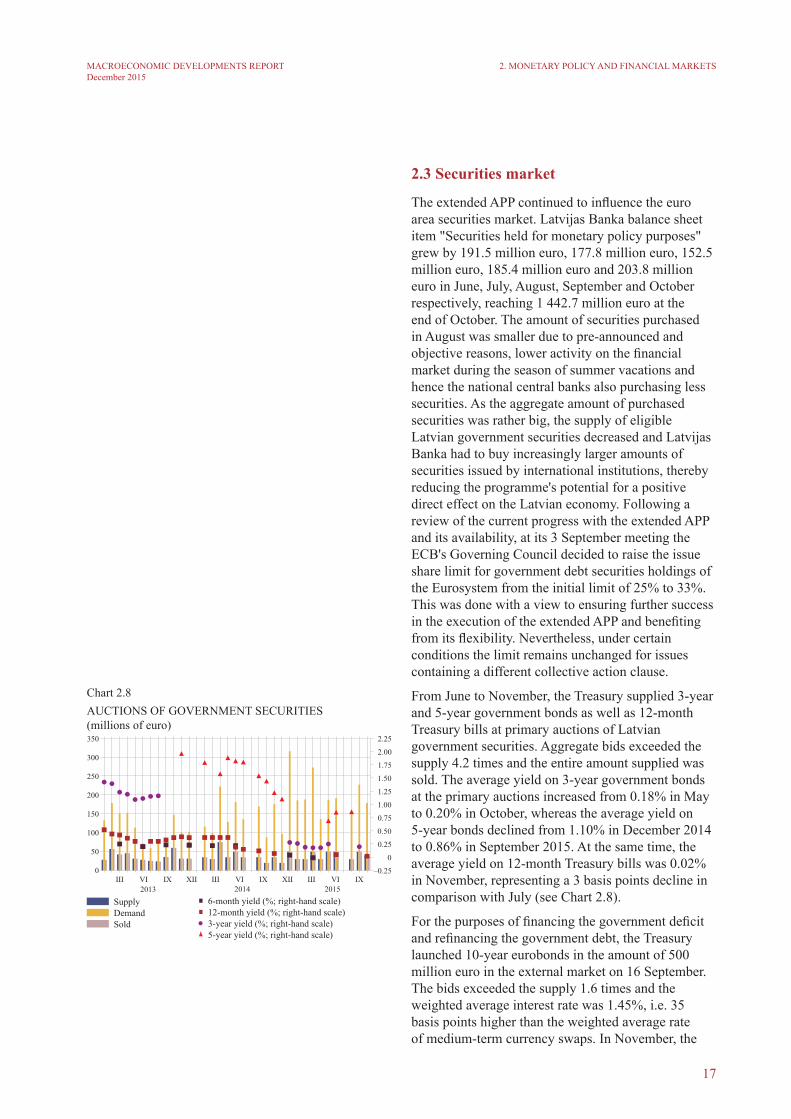
The extended APP continued to influence the euro area securities market. Latvijas Banka balance sheet item "Securities held for monetary policy purposes" grew by 191.5 million euro, 177.8 million euro, 152.5 million euro, 185.4 million euro and 203.8 million euro in June, July, August, September and October respectively, reaching 1 442.7 million euro at the end of October. The amount of securities purchased in August was smaller due to pre-announced and objective reasons, lower activity on the financial market during the season of summer vacations and hence the national central banks also purchasing less securities. As the aggregate amount of purchased securities was rather big, the supply of eligible Latvian government securities decreased and Latvijas Banka had to buy increasingly larger amounts of securities issued by international institutions, thereby reducing the programme's potential for a positive direct effect on the Latvian economy. Following a review of the current progress with the extended APP and its availability, at its 3 September meeting the ECB's Governing Council decided to raise the issue share limit for government debt securities holdings of the Eurosystem from the initial limit of 25% to 33%. This was done with a view to ensuring further success in the execution of the extended APP and benefiting from its flexibility. Nevertheless, under certain conditions the limit remains unchanged for issues containing a different collective action clause.
From June to November, the Treasury supplied 3-year and 5-year government bonds as well as 12-month Treasury bills at primary auctions of Latvian government securities. Aggregate bids exceeded the supply 4.2 times and the entire amount supplied was sold. The average yield on 3-year government bonds at the primary auctions increased from 0.18% in May to 0.20% in October, whereas the average yield on 5-year bonds declined from 1.10% in december 2014 to 0.86% in September 2015. At the same time, the average yield on 12-month Treasury bills was 0.02% in November, representing a 3 basis points decline in comparison with July (see Chart 2.8).
For the purposes of financing the government deficit and refinancing the government debt, the Treasury launched 10-year eurobonds in the amount of 500 million euro in the external market on 16 September. The bids exceeded the supply 1.6 times and the weighted average interest rate was 1.45%, i.e. 35 basis points higher than the weighted average rate of medium-term currency swaps. In November, the
2. MONETARY POLICY ANd FINANCIAL MARKETS
Chart 2.8AUCTIONS OF GOVERNMENT SECURITIES(millions of euro)

18
MACROECONOMIC DEVELOPMENTS REPORTDecember 2015
Treasury announced its intention to redeem up to 525 million US dollar worth of two of its US dollar bond issues maturing in 2020 and 2021. The offer was open until 7 December.
As concerns the secondary market, the bid yield on Latvian government eurobonds launched in the external market and maturing in 2024 increased from 0.47% at the end of April to 0.90% at the end of November (see Chart 2.9). The spread over the bid yield of same maturity German government bonds widened from 20 basis points to 59 basis points. The extended APP, lower inflation expectations, the easing of Greek tensions as well as the declining bid yields of US bonds all exerted a downward pressure on the eurobond bid yields.
The bid yield on US dollar-denominated Latvian government bonds maturing in 2021 grew from 2.54% at the end of April to 2.70% at the end of November, whereas the spread over the bid yield of the same maturity US government bonds widened from 87 basis points to 91 basis points.
A relatively strong increase in the bid yields of bonds in the euro area, including Latvia, was observed in May and June, followed by a gradual decline. The rise was supported by revaluation of the bid yields, once the market participants realised that the extended APP could push the rates in both directions, that the bond market liquidity had deteriorated, volatility had increased and even the extended APP had its limits. It was also supported by the perceived increase in the bid yield in the USA and the unwinding of the Greek debt crisis.
NASdAQ Riga share price index OMXR appreciated by 29.9% from June to November, whereas the Baltic share price index OMXBBGI grew by 5.3%. This rise in Latvia was underpinned by the increase in the prices of JSC Ventspils nafta shares caused by a transaction involving a sale of 43.25% of the shares and resulting in one shareholder acquiring 93.24% of the shares, followed by the mandatory share repurchase offer to the remaining shareholders. Stock market indices decreased by 0.3% and 1.0% in Germany and France respectively, whereas the US stock market index S & P 500 shrank by 1.3% and the Japanese Nikkei 225 by 4.0% (see Chart 2.10). The global stock prices were adversely affected by the weak performance of the BRIC countries: Russia and Brazil had entered a recession, while the growth of China, the second largest global economy, started to decelerate significantly.
2. MONETARY POLICY ANd FINANCIAL MARKETS
Chart 2.9LATVIAN GOVERNMENT BONd BId YIELdS(%)
Chart 2.10STOCK PRICE INdICES(1 January 2015 = 100)

19
MACROECONOMIC DEVELOPMENTS REPORTDecember 2015
2.4 Lending and deposit rates
Overall, credit institutions both in Latvia and the euro area gradually lower credit standards and offer their customers more favourable lending terms and conditions, which, in addition to other factors, have a positive impact on credit demand. A gradual decline in euro money market interest rates and an increase in credit institutions' mutual competition affect interest rates on loans within the euro area, including Latvia. So far, credit institutions in Latvia have not played an active role in narrowing the spread over the euro money market reference interest rate; however, they offer households and non-financial corporations other more favourable lending terms and conditions. The spread between the interest rates on deposits and loans (see Chart 2.11) expanded again after a temporary contraction in April and May.
As a result of the accommodative monetary policy, the euro money market interest rates are decreasing in the euro area as are lending costs of credit institutions of the euro area. Therefore, lending rates follow a downward trend. In addition, due to increased mutual competition, credit institutions of the euro area have eased terms and conditions for all categories of loans in 2015, mainly narrowing the spread over the money market reference interest rate on standard loans. Although differences in interest rates on new loans are decreasing across the euro area countries, the level of interest rates on new loans still differs considerably. In comparison with other euro area countries, the level of interest rates on loans remained relatively high in Latvia (see Chart 2.12).
Large loans of over 1 million euro still dominated in the total amount of new loans granted to non-financial corporations in Latvia. Therefore, interest rates on such loans primarily affected the total weighted average rate of new loans in euro to non-financial corporations. In the reporting period, a gradual decline in EURIBOR interest rates continued to affect interest rates on new loans in euro to non-financial corporations, while the spread over the money market reference interest rate fluctuated approximately at the same level. In the third quarter, due to increasing competition among credit institutions and continuing steady economic growth, some credit institutions lowered credit standards and the spread over the reference interest rate on long-term loans to the large non-financial corporations whose annual turnover exceeded 500 million euro (see Chart 2.13). At the same time, other credit institutions granted higher-risk loans with a higher spread over the money
2. MONETARY POLICY ANd FINANCIAL MARKETS
Chart 2.11SPREAd BETWEEN INTEREST RATES ON NEW LOANS ANd NEW dEPOSITS(percentage points)
Chart 2.12INTEREST RATES ON MFI NEW LOANS IN EURO TO NON-FINANCIAL CORPORATIONS(%)
Chart 2.13MARGINS ON LARGE NEW LOANS IN EURO TO NON-FINANCIAL CORPORATIONS ANd CHANGES IN INTEREST RATES ON LOANS TO THE LARGE NON-FINANCIAL CORPORATIONS(%)

20
MACROECONOMIC DEVELOPMENTS REPORTDecember 2015
market reference interest rate. Overall, the interest rate on new loans in euro granted to non-financial corporations in April and May dropped rapidly, as several credit institutions reviewed lending terms and conditions in relation to their current customers and granted new loans to low-risk non-financial corporations (2.7% in April and 2.6% in May). In June, it returned to the levels seen before and slightly decreased in the coming months (3.4% in October). In October, interest rates on new loans in euro to non-financial corporations were by 0.4 percentage point lower than in the respective period of the previous year (see Chart 2.14).
With the euro money market interest rates declining, the weighted average interest rate on new loans to households for house purchase slowly edged down from 3.1% in April to 3.0% in September; however, the downward trend was weak and unstable. Credit institutions reviewed terms and conditions of the current loans in October. This led to a minor increase in the weighted average interest rate (to 3.2%) on new loans in euro to households for house purchase, but it was 0.1 percentage point lower than in October of the previous year. due to increasing competition among credit institutions and the introduced state support programme for house purchase, several credit institutions granted new loans to households for house purchase on more favourable terms and conditions in the third quarter, e.g. they decreased the value of the collateral necessary for receiving a loan; however, they kept the spread over the money market reference interest rate unchanged.
Credit institutions did not change the spread over the money market reference interest rate on consumer credit and other loans to households either. Some credit institutions offered other more favourable terms and conditions when granting consumer credit and other loans to households, e.g. a longer maturity and higher amount of a loan. Credit institutions were able to do so after increasing a credit institution's risk tolerance level. A higher risk level of consumer credit and other loans granted by credit institutions found its reflection in credit institutions' willingness to compete with the non-bank sector by offering higher-risk loans to households. Customers' demand for more complex but more expensive consumer credit providing various additional opportunities contributed to an increase in interest rates (and also to their volatility) on new euro consumer credit and other loans granted to households. In September, the interest rate on consumer credit and other loans was 1.9 percentage points higher than in the respective period of the
2. MONETARY POLICY ANd FINANCIAL MARKETS
Chart 2.14INTEREST RATES ON MFI NEW SHORT-TERM LOANS IN EURO*(%)
* Floating interest rates and interest rates with an initial interest rate fixation period of up to 1 year.

21
MACROECONOMIC DEVELOPMENTS REPORTDecember 2015
2. MONETARY POLICY ANd FINANCIAL MARKETS
previous year, while in October it was 0.8 percentage point lower.
Since money market indices decreased, the interest rate on new time deposits received from households and non-financial corporations continued to decline slowly, reaching zero (0.15% in April and 0.13% in October) in some credit institutions. With the euro money market interest rates continuing to follow a downward trend, the interest rate on time deposits of households shrank at a slower pace, as households looked for possibilities to deposit their funds at higher interest rates (e.g. longer-term deposits) or other better offers by credit institutions more actively.
2.5 Dynamics of domestic loans and deposits
Overall, development of monetary aggregates in the second and third quarters was characterised by stability, i.e. deposits attracted by credit institutions were on a moderate upward trend (by 3.5% in April–September) and the portfolio of loans granted slightly contracted by 0.1% during six months. The trend continued also in October with marginally stronger positive trends in lending. The household loan portfolio continued to shrink slowly, but lending to non-financial corporations edged up following a minor decrease in the second quarter. This loan portfolio expanded by 0.8% in the third quarter and by 0.4% in October, thus practically discontinuing the contraction of the credit institutions' total domestic loan portfolio as well. In October, deposits received by credit institutions exceeded the level of the respective period of the previous year by 9.1%, but the portfolio of loans granted lagged behind the indicator of October 2014 by 3.2%. Both indicators improved during the last seven months (in March, the annual growth rate of deposits was 5.9%, but the annual rate of decrease in loans stood at –4.3%).
As regards Latvia's contribution to changes of the monetary aggregate M3 of the euro area, overnight deposits made by residents of the euro area with Latvian credit institutions in April–October augmented by 5.1% and deposits redeemable at notice of up to 3 months rose by 5.7%, while deposits with an agreed maturity of up to 2 years declined by 5.7% (see Chart 2.15). Latvia's overall impact on the euro area money supply was on the upside, i.e. Latvia's contribution to M3 went up by 3.6% over the last seven months, and its annual growth rate reached 9.2%.
In general, during the past seven months, i.e. between April and October, household deposits grew by
Chart 2.15LATVIA'S CONTRIBUTION TO THE EURO AREA MONEY SUPPLy(billions of euro)

22
MACROECONOMIC DEVELOPMENTS REPORTDecember 2015
Chart 2.16ANNUAL RATE OF CHANGE IN RESIdENT dEPOSITS(%)
Chart 2.17RESIdENT dEPOSIT dYNAMICS(billions of euro)
Chart 2.18ANNUAL RATE OF CHANGE IN RESIdENT dEPOSITS(%)
2. MONETARY POLICY ANd FINANCIAL MARKETS
2.6%. The annual growth rate of deposits was 6.4% in October. deposits of non-financial corporations picked up by 1.9%, with the annual growth rate reaching 8.8% in October (see Chart 2.16). The increase in deposits received from households in the second and third quarters constituted approximately one third of the uplift in total deposits suggesting that growing income allows boosting consumption. Evidence of this is higher retail turnover and smaller savings. At the same time, the relatively steep rise in deposits by non-financial corporations leads to a conclusion that the moderate but steady economic growth enables entrepreneurs to make savings in their accounts with credit institutions. The increasing deposits by non-financial corporations also enhance their potential for investment which is still a topical issue, as the loan portfolio of credit institutions continues to shrink. dynamics of deposits still mainly depended on the rise in overnight deposits (see Charts 2.17 and 2.18).
23
MACROECONOMIC DEVELOPMENTS REPORTDecember 2015
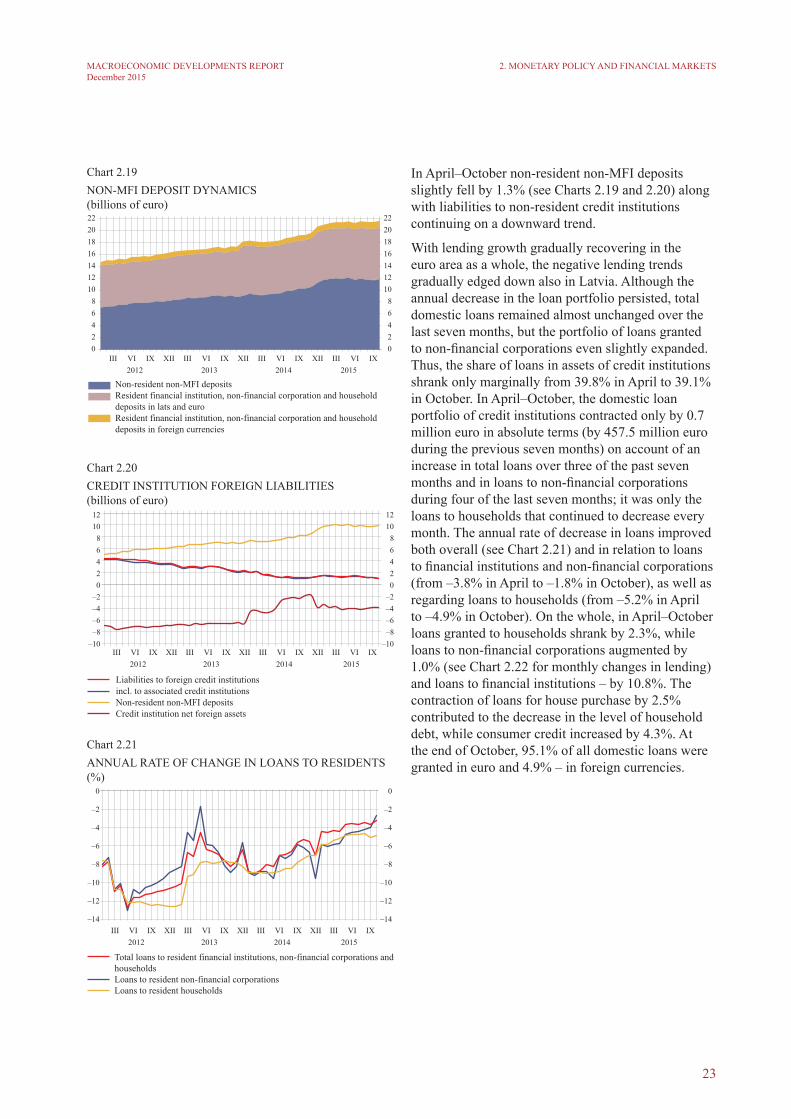
Chart 2.19NON-MFI dEPOSIT dYNAMICS(billions of euro)
Chart 2.20CREdIT INSTITUTION FOREIGN LIABILITIES(billions of euro)
Chart 2.21ANNUAL RATE OF CHANGE IN LOANS TO RESIdENTS(%)
2. MONETARY POLICY ANd FINANCIAL MARKETS
In April–October non-resident non-MFI deposits slightly fell by 1.3% (see Charts 2.19 and 2.20) along with liabilities to non-resident credit institutions continuing on a downward trend.
With lending growth gradually recovering in the euro area as a whole, the negative lending trends gradually edged down also in Latvia. Although the annual decrease in the loan portfolio persisted, total domestic loans remained almost unchanged over the last seven months, but the portfolio of loans granted to non-financial corporations even slightly expanded. Thus, the share of loans in assets of credit institutions shrank only marginally from 39.8% in April to 39.1% in October. In April–October, the domestic loan portfolio of credit institutions contracted only by 0.7 million euro in absolute terms (by 457.5 million euro during the previous seven months) on account of an increase in total loans over three of the past seven months and in loans to non-financial corporations during four of the last seven months; it was only the loans to households that continued to decrease every month. The annual rate of decrease in loans improved both overall (see Chart 2.21) and in relation to loans to financial institutions and non-financial corporations (from –3.8% in April to –1.8% in October), as well as regarding loans to households (from –5.2% in April to –4.9% in October). On the whole, in April–October loans granted to households shrank by 2.3%, while loans to non-financial corporations augmented by 1.0% (see Chart 2.22 for monthly changes in lending) and loans to financial institutions – by 10.8%. The contraction of loans for house purchase by 2.5% contributed to the decrease in the level of household debt, while consumer credit increased by 4.3%. At the end of October, 95.1% of all domestic loans were granted in euro and 4.9% – in foreign currencies.

24
MACROECONOMIC DEVELOPMENTS REPORTDecember 2015
Chart 2.22MONTHLY CHANGE IN LOANS TO RESIdENTHOUSEHOLdS ANd NON-FINANCIAL CORPORATIONS(millions of euro)
Chart 2.23STRUCTURE OF CHANGES IN dOMESTIC LOAN PORTFOLIO(millions of euro)
Chart 2.24CHANGES IN LOANS TO RESIdENTS(millions of euro)
In the second and third quarters, loan investment boosted in several sectors of the economy, including crop and animal production, manufacture of food products and pharmaceutical products, water supply, wholesale, water transport, storage, postal and courier activities, information and communication services, accommodation and catering services, financial and insurance activities, as well as almost in all areas related to public administration, education, health care, art and entertainment. Meanwhile, the largest contraction of loan investment was recorded in forestry, manufacturing of wood, furniture, textile articles, articles of paper, metal and fabricated metal products, energy, construction, retail trade, land transport, as well as real estate activities (see Charts 2.23 and 2.24). In the last 12 months, the loan portfolio expanded in crop and animal production, manufacturing of beverages, wood, chemicals and pharmaceutical preparations, water supply, sale of motor vehicles, storage, postal services, information and communication services and individual financial services.
2. MONETARY POLICY ANd FINANCIAL MARKETS

25
MACROECONOMIC DEVELOPMENTS REPORTDecember 2015
With the loan portfolio shrinking at a slower pace, the credit-to-GdP ratio posted a minimum decrease from 52.6% in the first quarter of 2015 to 51.4% in the third quarter of 2015 (see Chart 2.25). Since the total resident deposits increased and the loans fell, the ratio of loans to residents and resident deposits dropped from 1.31 in April to 1.27 in October (see Chart 2.26).
There is no reason to expect significant changes in deposit and loan dynamics in the coming quarters either. The trend will continue both in relation to a rise in deposits received from non-financial corporations and households, although periods of modest expansion in savings could interchange with individual months of minor contraction. Meanwhile, the aggregate loan portfolio will slowly stabilise, with the annual rate of decline in loans decreasing respectively. Lending to businesses will recover faster both in absolute terms and with annual growth returning to the positive territory probably already in the second half of 2016.
Credit institutions acknowledge that they would be ready to lend funds for the implementation of quality projects of non-financial corporations. Credit resources of credit institutions become increasingly cheap and more available, with the Eurosystem's "Public Sector Securities Purchase Programme" supporting lending. At the same time, risk perception by both credit institutions and non-financial corporations continue to hamper lending development. However, both non-financial corporations and households can gradually give rise to loan demand in relation to participation of the largest credit institutions in the state support programme for house purchase for families. Credit institutions active in the domestic market also report that the amount of new loans has augmented and financial resources made available for corporate lending and loan demand have edged up. Although a steady growth of the loan portfolio in absolute terms cannot be expected yet, the general economic situation, availability of EU funding, increase in leasing transactions and continuation of the state support programme for house purchase for families, as well as the assessment provided by credit institutions themselves and the Association of Commercial Banks of Latvia make it possible to project continued improvement of lending trends in the coming months.
2. MONETARY POLICY ANd FINANCIAL MARKETS
Chart 2.25RESIdENT LOANS TO GdP(%)
Chart 2.26RESIdENT LOAN TO dEPOSIT RATIO

26
MACROECONOMIC DEVELOPMENTS REPORTDecember 2015
3. Domestic DemandAlthough Latvia's economic growth was moderate in the first half of 2015, the second quarter witnessed one of the highest growth rates of the most recent years, with the quarterly GdP growth standing at 1.3% and annual growth at 2.7% (see Chart 3.1). GdP remained on a solid upward path in the third quarter as well, rising by 1.0% and 3.3% quarter-on-quarter and year-on-year respectively.
Looking at GDP by expenditure, private consumption remained one of the most important drivers of growth, the same as in the first quarter (see Chart 3.2). Higher private consumption reflected the positive labour market developments. Although the overall consumer confidence indicator deteriorated in the recent months, the outlook on the expected change in financial situation of household over the next 12 months remained positive; therefore, no significant deceleration of the private consumption growth can be anticipated in the nearest future.
The contribution of exports to GdP growth remained positive in the second and third quarters. Nevertheless, the slow economic growth of the EU, uncertainty surrounding the state of China's economy as well as the conflict between Russia and Ukraine and the related economic sanctions have a negative effect on foreign demand which, in turn, could weigh down on future export development.
An important role in supporting Latvia's exports is played by investment. Following a period of low and even negative growth rates registered since the second quarter of 2014, investment growth was positive in the second and third quarters of 2015 and accelerated significantly.
3.1 Private consumption and investment
In the second quarter of 2015, private consumption increased by 1.1% quarter-on-quarter and by 3.4% year-on-year (see Charts 3.3 and 3.4). The third quarter was marked by further acceleration of the private consumption, with the quarterly and annual growth rates of GdP rising to 1.7% and 4.7% respectively.
3. dOMESTIC dEMANd
Chart 3.1CHANGES IN GdP(at constant prices; %)
Chart 3.2CONTRIBUTION TO ANNUAL CHANGES IN GdP(demand side; percentage points)
Chart 3.3CHANGES IN GdP ANd PRIVATE CONSUMPTION (year-on-year; %)
27
MACROECONOMIC DEVELOPMENTS REPORTDecember 2015
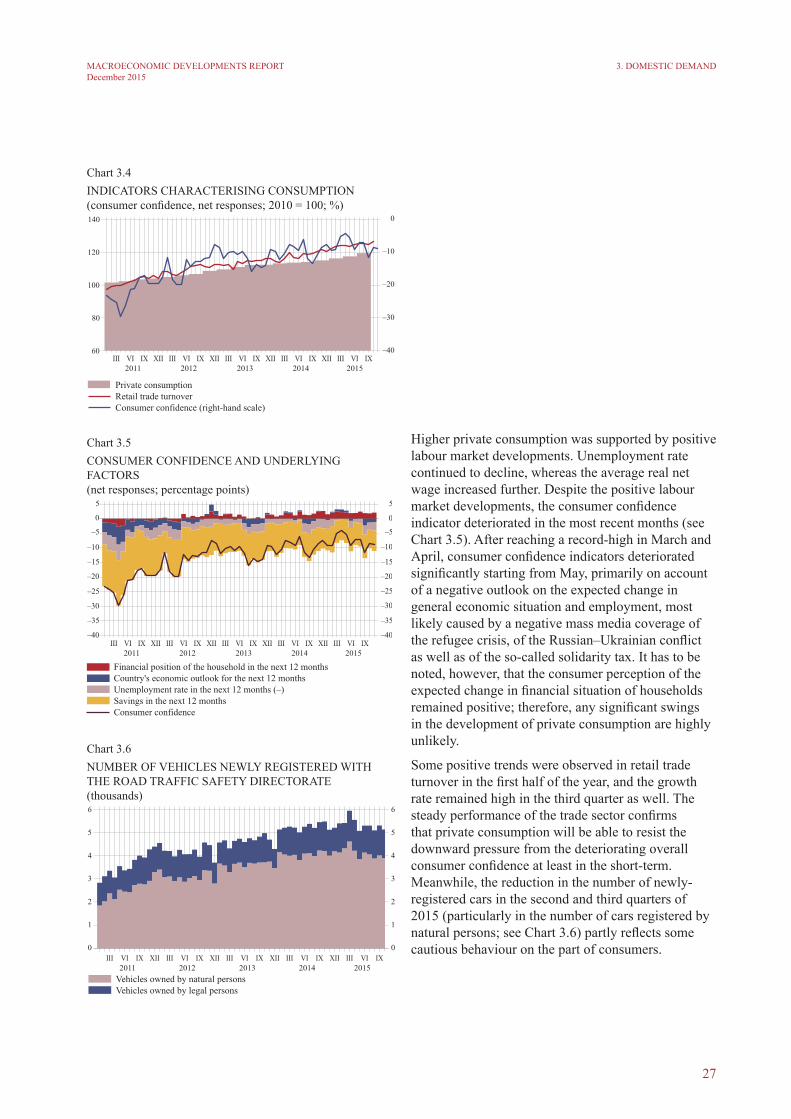
Chart 3.4INdICATORS CHARACTERISING CONSUMPTION(consumer confidence, net responses; 2010 = 100; %)
Chart 3.5CONSUMER CONFIdENCE ANd UNdERLYING FACTORS(net responses; percentage points)
Chart 3.6NUMBER OF VEHICLES NEWLY REGISTEREd WITH THE ROAd TRAFFIC SAFETY dIRECTORATE(thousands)
Higher private consumption was supported by positive labour market developments. Unemployment rate continued to decline, whereas the average real net wage increased further. despite the positive labour market developments, the consumer confidence indicator deteriorated in the most recent months (see Chart 3.5). After reaching a record-high in March and April, consumer confidence indicators deteriorated significantly starting from May, primarily on account of a negative outlook on the expected change in general economic situation and employment, most likely caused by a negative mass media coverage of the refugee crisis, of the Russian–Ukrainian conflict as well as of the so-called solidarity tax. It has to be noted, however, that the consumer perception of the expected change in financial situation of households remained positive; therefore, any significant swings in the development of private consumption are highly unlikely.
Some positive trends were observed in retail trade turnover in the first half of the year, and the growth rate remained high in the third quarter as well. The steady performance of the trade sector confirms that private consumption will be able to resist the downward pressure from the deteriorating overall consumer confidence at least in the short-term. Meanwhile, the reduction in the number of newly-registered cars in the second and third quarters of 2015 (particularly in the number of cars registered by natural persons; see Chart 3.6) partly reflects some cautious behaviour on the part of consumers.
3. dOMESTIC dEMANd

28
MACROECONOMIC DEVELOPMENTS REPORTDecember 2015
Chart 3.7INdICATORS CHARACTERISING INVESTMENT(at constant prices; 2010 = 100; %)
Chart 3.8CONTRIBUTION OF PRIVATE ANd GOVERNMENT INVESTMENT TO GdP(%)
Chart 3.9NON-FINANCIAL INVESTMENT BY SECTOR(% of total non-financial investment)
Long-term economic growth should not be based on consumption alone but also on stable exports, which in turn require investment. Gross fixed capital formation expanded by 3.2% quarter-on-quarter and by 2.4% year-on-year in the second quarter (see Chart 3.7). In the third quarter, the quarterly and annual growth rates were 1.4% and 6.0% respectively. The second quarter development was supported by the increasing government sector as well as private sector investment (see Chart 3.8). Investment figures of the second and third quarters remained promising despite the high degree of uncertainty present in the global economy and the regional geopolitical situation. The future of investment development will be largely dependent on the degree and speed of absorption of the EU funding in the new programming period as well as the lending market developments. Previously, the EU funding was a significant factor supporting investment growth. The transition to the new programming period could initially result in deceleration of investment growth due to slow document preparation.
Construction of buildings had been decreasing since the third quarter of 2014 already and the second quarter of 2015 was no exception, although the fall in this segment was partly offset by the growing construction of engineering buildings. After several quarters of decline, imports of capital goods increased in the third quarter.
Industrial investment contracted following a relatively high level reported in the third quarter of 2014 and accounted for about one fourth of total non-financial investment in the third quarter of 2015 (see Chart 3.9). Capacity utilisation remained broadly unchanged in the third quarter of 2015 in comparison with the first and second quarters of the year and is still close to the average level of the last three years.
3. dOMESTIC dEMANd
29
MACROECONOMIC DEVELOPMENTS REPORTDecember 2015
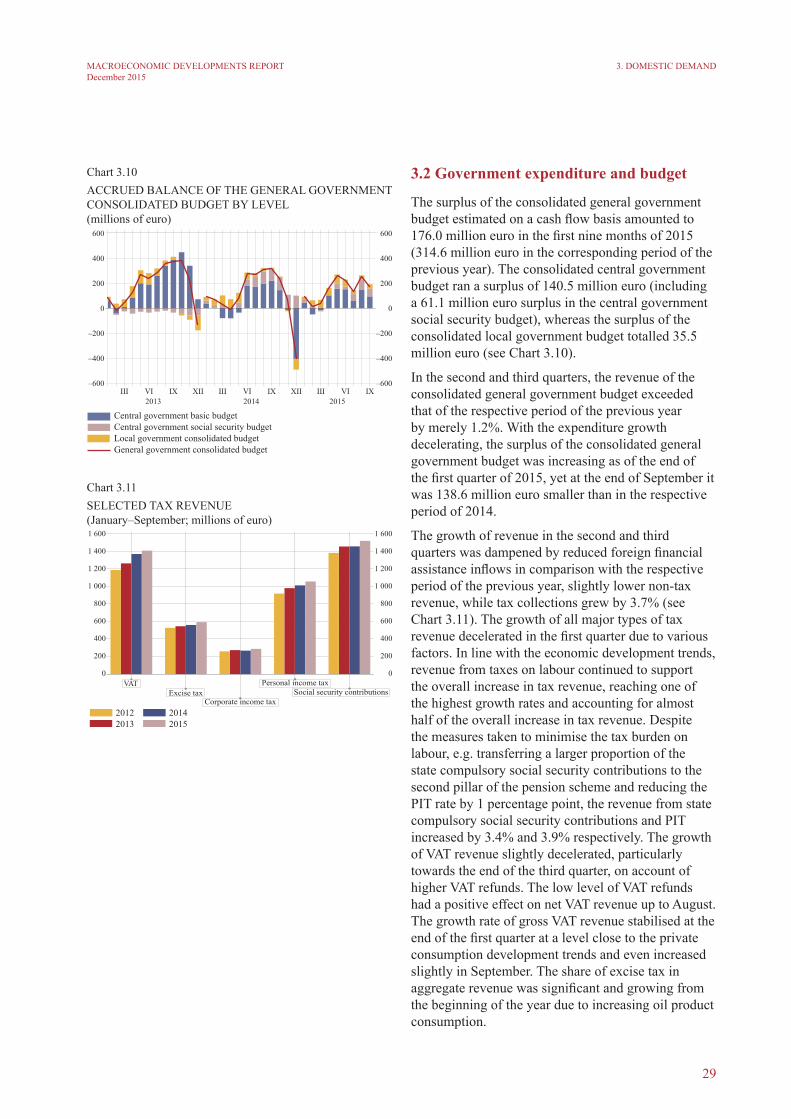
Chart 3.10ACCRUEd BALANCE OF THE GENERAL GOVERNMENT CONSOLIdATEd BUdGET BY LEVEL(millions of euro)
Chart 3.11SELECTED TAX REVENUE(January–September; millions of euro)
3.2 Government expenditure and budget
The surplus of the consolidated general government budget estimated on a cash flow basis amounted to 176.0 million euro in the first nine months of 2015 (314.6 million euro in the corresponding period of the previous year). The consolidated central government budget ran a surplus of 140.5 million euro (including a 61.1 million euro surplus in the central government social security budget), whereas the surplus of the consolidated local government budget totalled 35.5 million euro (see Chart 3.10).
In the second and third quarters, the revenue of the consolidated general government budget exceeded that of the respective period of the previous year by merely 1.2%. With the expenditure growth decelerating, the surplus of the consolidated general government budget was increasing as of the end of the first quarter of 2015, yet at the end of September it was 138.6 million euro smaller than in the respective period of 2014.
The growth of revenue in the second and third quarters was dampened by reduced foreign financial assistance inflows in comparison with the respective period of the previous year, slightly lower non-tax revenue, while tax collections grew by 3.7% (see Chart 3.11). The growth of all major types of tax revenue decelerated in the first quarter due to various factors. In line with the economic development trends, revenue from taxes on labour continued to support the overall increase in tax revenue, reaching one of the highest growth rates and accounting for almost half of the overall increase in tax revenue. despite the measures taken to minimise the tax burden on labour, e.g. transferring a larger proportion of the state compulsory social security contributions to the second pillar of the pension scheme and reducing the PIT rate by 1 percentage point, the revenue from state compulsory social security contributions and PIT increased by 3.4% and 3.9% respectively. The growth of VAT revenue slightly decelerated, particularly towards the end of the third quarter, on account of higher VAT refunds. The low level of VAT refunds had a positive effect on net VAT revenue up to August. The growth rate of gross VAT revenue stabilised at the end of the first quarter at a level close to the private consumption development trends and even increased slightly in September. The share of excise tax in aggregate revenue was significant and growing from the beginning of the year due to increasing oil product consumption.
3. dOMESTIC dEMANd

30
MACROECONOMIC DEVELOPMENTS REPORTDecember 2015
Chart 3.12RATE OF CHANGE IN GENERAL GOVERNMENT CONSOLIdATEd BUdGET EXPENdITURE (year-on-year; %)
Following a steep rise in the first quarter, the growth of the consolidated general government expenditure (see Chart 3.12) gradually decelerated, nevertheless remaining slightly higher than in 2014 (6.2% in the first nine months of 2015). In the first half of the year, expenditure growth was supported by the costs relating to the Latvian Presidency of the EU Council as well as the implementation of several large construction projects, higher spending in the health care sector and the need to compensate the losses incurred in public transportation services. Current expenditure continued on a steep upward trend in the second and third quarters. Wage and salary expenditure increased by 7.2%. Expenditure on social benefits posted an increase of 4.6% supported by the changes in benefit payments introduced at the beginning of 2015, i.e. lifting the cap on social insurance benefits and increasing the family state benefit for the second and third child. As a result of delays experienced in the absorption of the EU funding of the new programming period, the growth of subsidies, grants and capital expenditure slowed and investment even contracted year-on-year in the third quarter.
At the end of the third quarter, the general government debt totalled 8 614.8 million euro on a cash flow basis (34.7% of the forecast GdP for 2015; estimated as 37.7% of the forecast GdP according to ESA 2010 methodology). In September, the Treasury launched bonds in the amount of 500 million euro in the international markets. The amount of debt has decreased by 475.2 million euro since the end of 2014. This has happened on account of a partial repayment of the EC loan at the beginning of the year, totalling 1.2 billion euro.
3. dOMESTIC dEMANd

31
MACROECONOMIC DEVELOPMENTS REPORTDecember 2015
4. AGGREGATE SUPPLY
4. Aggregate supplyTrade (annual growth rate – 4.0%), public administration and defence (3.2%), manufacturing (5.8%) and, to a lesser extent, other services sectors were the contributors to the annual GdP growth by sector in the second quarter. Successful performance of the wood industry and launch of the operation of JSC KVV Liepājas metalurgs contributed to the expansion of manufacturing. Trade grew on account of an increasing retail trade and wholesale, while GdP growth was affected negatively by construction (a fall of 1.9%; a negative annual rate of increase in the residential and non-residential building construction) and transportation and storage (1.5%; the volume of rail freight and cargoes at ports shrank).
In the third quarter, expanding construction (4.6%) as well as a sound performance of trade (5.2%) on account of a buoyant wholesale development, was attributable to a year-on-year GdP growth. Mining and quarrying and energy (5.3%), manufacturing (3.9%), accommodation and catering services (7.9%), public administration and defence (3.9%) and taxes on products (5.8%) also recorded a notable positive annual growth rate.
4.1 Industry
The value added in manufacturing at constant prices recorded a quarter-on-quarter rise of 2.0% (seasonally adjusted data) in the second quarter and a decline of 1.2% in the third quarter of 2015. In the second quarter, the volume of output at constant prices (see Chart 4.1) increased by 2.4%, but shrank by 2.1% in the third quarter. It is worth noting that in comparison with the second quarter of 2014, the volume of output rose by 5.9% in the second quarter of 2015 (the most vigorous annual growth rate since 2012; however, the annual rate of increase narrowed to 3.7% in the third quarter). Launching of the operation of JSC KVV Liepājas metalurgs, ongoing successful performance of the wood industry as well as the manufacture of pharmaceutical products, other transport equipment and furniture, no doubt, helped to overcome a period of stagnation in manufacturing.
Chart 4.1dYNAMICS OF MANUFACTURING OUTPUT(at constant prices; %)

32
MACROECONOMIC DEVELOPMENTS REPORTDecember 2015
As regards manufacturing, it may seem that, given the growth rate only, the situation is not very obvious overall (see Chart 4.2). The expansion of the manufacture of basic metals (information about the sector is not available due to the confidentiality provisions) is attributable to the launching of the operation of JSC KVV Liepājas metalurgs, however, it should be kept in mind that the sitution in the global market is very complex at present. Stagnation of the construction sector has been observed in export markets, while metal prices decline substantially in the global commodity markets, with concerns about the future development of China deepening. Therefore JSC KVV Liepājas metalurgs has encountered several problems: weak demand in export markets, low or even negative profit margins, rather high electricity tariffs as compared with the competitors, etc. Moreover, the capacity utilisation of JSC KVV Liepājas metalurgs is only partial presently, with only one of the two rolling mills operating; while the state-of-the-art electric melting furnace is in downtime. In view of the fact that the operation of JSC KVV Liepājas metalurgs could be irregular in the near future (as has been the case until now) and owing to the significance of the factory for the structure of Latvia's manufacturing, the above development is likely to cause high volatility of the overall manufacturing data.
The situation in the food industry has also to be taken into account. Following the sanctions imposed by Russia, the volume of output shrank substantially in the food industry. The overall situation cannot be viewed as a positive development presently, although some non-financial corporations succeed in finding new export markets. There is certain stability in real terms, the declining volume of output notwithstanding (a particularly buoyant narrowing is observed in the fishing industry); the overall situation is not dramatic. It should be noted that the situation is much worse in nominal terms (i.e. at current prices). With the prices of commodities decreasing on the global stock exchanges and regional competition strengthening under the impact of sanctions, serious problems are faced by the dairy industry, fishing industry and fruit and vegetable processing. In view of the fact that neither global nor regional turning points are to be expected in the food industry, consolidation process is, most likely, inevitable in the near future.
A very negative trend, the decline in the volume of output, has started in the manufacture of non-metallic mineral products (mainly the manufacture of building materials) since the beginning of 2015.
4. AGGREGATE SUPPLY
Chart 4.2ANNUAL INdUSTRIAL OUTPUT CHANGES (Q3 2015; working-day adjusted; %)
33
MACROECONOMIC DEVELOPMENTS REPORTDecember 2015
The above development is apparently related to the stagnation of the construction sector. Taking into account that the manufacture of building materials is normally a leading indicator of the construction sector developments, the situation is not expected to improve markedly in this sector. The manufacture of textile articles still follows a negative path, with the CIS countries accounting for some share of the turnover. According to the preliminary data, improvement of the situation has been observed in the manufacture of wearing apparel in the third quarter after a prolonged decline of the output volume. Given the external conditions, a surprisingly sound situation can be observed in the wood industry. Although the construction market is stagnating in Europe and demand for articles of wood has not increased substantially, the development of the sector is very dynamic. The manufacture of furniture is also on a rise. The sector of the manufacture of computers, optical and electronic products continues to expand robustly, nonetheless concerns persist about the increase accounted for in statistics – whether all of the above expansion is deemed to be industry or some growth refers to trade.
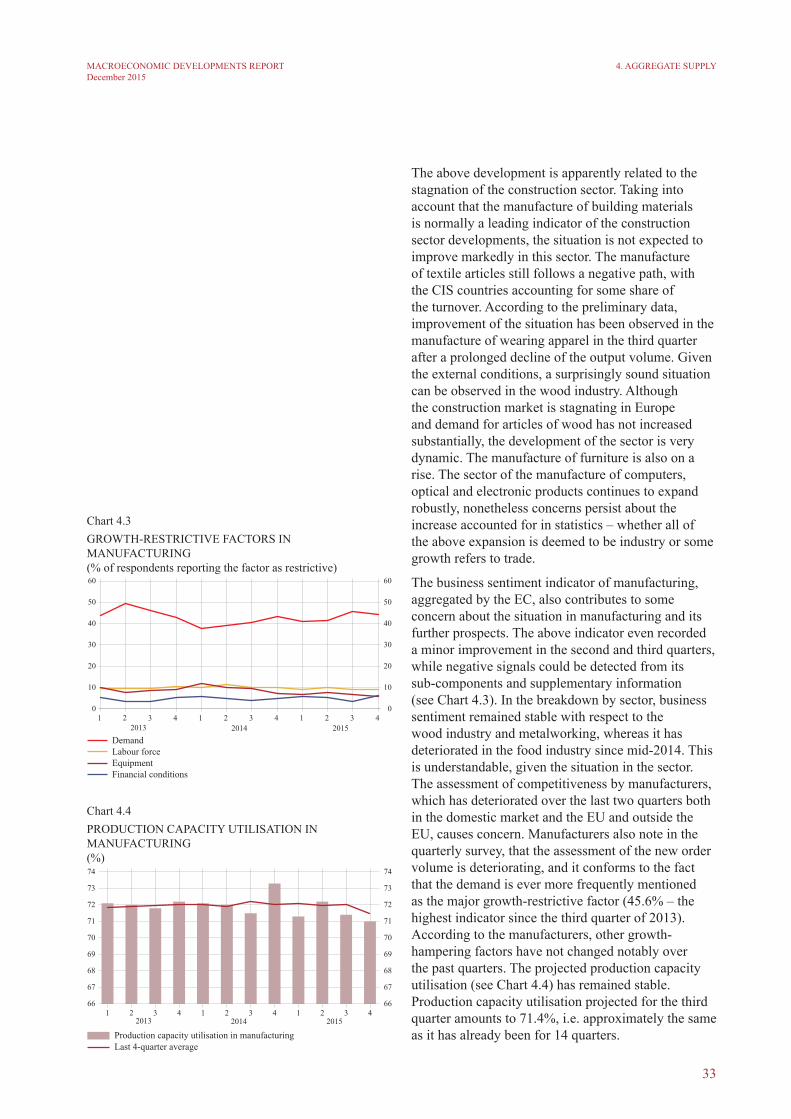
The business sentiment indicator of manufacturing, aggregated by the EC, also contributes to some concern about the situation in manufacturing and its further prospects. The above indicator even recorded a minor improvement in the second and third quarters, while negative signals could be detected from its sub-components and supplementary information (see Chart 4.3). In the breakdown by sector, business sentiment remained stable with respect to the wood industry and metalworking, whereas it has deteriorated in the food industry since mid-2014. This is understandable, given the situation in the sector. The assessment of competitiveness by manufacturers, which has deteriorated over the last two quarters both in the domestic market and the EU and outside the EU, causes concern. Manufacturers also note in the quarterly survey, that the assessment of the new order volume is deteriorating, and it conforms to the fact that the demand is ever more frequently mentioned as the major growth-restrictive factor (45.6% – the highest indicator since the third quarter of 2013). According to the manufacturers, other growth-hampering factors have not changed notably over the past quarters. The projected production capacity utilisation (see Chart 4.4) has remained stable. Production capacity utilisation projected for the third quarter amounts to 71.4%, i.e. approximately the same as it has already been for 14 quarters.
4. AGGREGATE SUPPLY
Chart 4.3GROWTH-RESTRICTIVE FACTORS IN MANUFACTURING(% of respondents reporting the factor as restrictive)
Chart 4.4PROdUCTION CAPACITY UTILISATION IN MANUFACTURING (%)

34
MACROECONOMIC DEVELOPMENTS REPORTDecember 2015
4. AGGREGATE SUPPLY
The adverse situation in some subsectors of manufacturing notwithstanding, the net profitability (the ratio of profit/loss to turnover) has not declined markedly. The four-quarter moving average was above 4% over the past five quarters. This suggests that non-financial corporations are capable of using their internal resources for boosting profitability, although demand-related problems are encountered and remuneration to employees follows an upward trend.
4.2 Construction and real estate market
The value added of the construction sector (seasonally adjusted) recorded a year-on-year decrease of 0.1% and an increase of 2.8% in the second and third quarters respectively.
In the first and second quarters of 2015, construction output at current prices reported a year-on-year decline of 0.1% and 3.4% respectively, expanding by 4.9% in the third quarter. Construction of residential buildings (primarily apartment blocks) accounted for the growth of the construction sector in 2013 and 2014, but the contribution of residential building construction to the annual changes in the overall construction volumes diminished substantially as of the end of 2014 and was even reported to be negative in the second quarter of 2015 (see Chart 4.5), while turning positive again in the third quarter. Construction of residential buildings dropped by 16.0% in the second quarter and rose by mere 3.4% in the third quarter. Weak performance is associated with the amendments made to the Immigration Law tightening the provisions for granting the temporary residence permits to non-residents. As inertia and lagged effect are evidenced in the construction of residential buildings (presently the construction of residential buildings envisaged for non-residential customers is completed while the volume of construction may be significantly lower), the above effect is likely to strengthen in the next quarters. The contribution of the construction of non-residential buildings to the overall construction growth was negative in the second and third quarters in contrast to the previous quarters (3.3 percentage points and 2.5 percentage points respectively). The volume of the construction of non-residential buildings recorded a year-on-year decline of 8.2% in the second quarter and a drop of 7.3% in the third quarter. The construction of administrative buildings and hotels accounted for the highest negative contribution to the annual changes in the second quarter due to a high base level. In the third quarter,
Chart 4.5CONTRIBUTION OF SOME TYPES OF CONSTRUCTION OBJECTS TO ANNUAL CONSTRUCTION GROWTH AT CURRENT PRICES(percentage points)

35
MACROECONOMIC DEVELOPMENTS REPORTDecember 2015
the major negative contributor was the construction of schools, universities and research institutions. The volume of the construction of engineering structures rose by 4.9% and 13.0% in the second and third quarters respectively, thus offsetting in part the shrinking construction of buildings. Construction of motorways and streets as well as local pipelines and communication lines accounted for the major positive contribution to the construction of engineering structures.
The leading indicators of construction suggest that the sector may face challenges in the second half of the year as well. Manufacture of building materials representing the demand of the sector for building materials was particularly weak in the first half of the year. The sentiment indicator of construction, aggregated by the EC, has also been deteriorating notably in recent months. The trend is similar in the segment of the construction of engineering structures, although the construction of buildings reports a more buoyant deterioration. At the same time, the number of months for which the orders are secured still fluctuates around 4–5 months, and it implies that output should not shrink rapidly.
Situation in the construction sector (construction of residential buildings) is closely related to the developments in the real estate market. The amendments to the Immigration Law, adopted in 2014 and stipulating tighter provisions for receiving a temporary residence permit subject to the investment in real estate exerted a substantial impact on the overall situation in the sector. The value added of real estate transactions recorded a quarter-on-quarter growth in the second and third quarters of 2015 by 1.8% and 1.9% respectively. The number of real estate transactions shrank markedly at the end of 2014 and the beginning of 2015, most notably within the segments of interest to non-residents. According to the Land Register data, the number of real estate purchase agreements recorded a year-on-year decrease of 7.4% in the first quarter of 2015, declined by 0.7% in the second quarter and shrank by 6.6% in the third quarter. However, it should be taken into account that the activity in the sector increased notably before the amendments to the Immigration Law took effect in September 2014. Hence the annual changes in the number of real estate purchase agreements will, most likely, be neutral or positive already in the fourth quarter of 2015. Positive feedback has been received from the market players regarding the state support programme for house purchase for new families – interest is considerable. The state
4. AGGREGATE SUPPLY

36
MACROECONOMIC DEVELOPMENTS REPORTDecember 2015
4. AGGREGATE SUPPLY
guarantees for loans for house purchase have been issued to 797 families in the amount of 4.9 million euro since the implementation of the programme (as of the beginning of 2015), including to 465 families in Riga and its vicinity, and to 332 families elsewhere in Latvia. Moreover, the Cabinet of Ministers passed a decision on the allocation of additional funds for the above programme in the amount of 1 million euro on 6 October 2015.
House Price Index continued to follow an upward path in the first and second quarters of 2015 after a notable decrease in the fourth quarter of 2014. However, a year-on-year decline of 4.4% was observed in the second quarter, including a decrease of 12.9% for new housing, and a fall of 1.8% for the secondary housing. A steeper fall in the segment of new housing market is on account of a higher risk exposure of new housing associated with the programme of temporary residence permits. Mortgage lending will, most likely, rebound in the medium term, with household income gradually increasing and labour market conditions gradually improving. This development should contribute to a further moderate expansion of the activity in real estate market and the relevant construction segment.
4.3 services
Public utilities, trade and real estate activities were the major positive contributors to GdP growth in the second and third quarters (see Chart 4.6 for the changes in the value added of the main types of services). The contribution of transportation sector to GdP growth was negative in the second and third quarters. Financial services and professional services also had an adverse impact on GdP growth in the third quarter.
A gradual increase in the purchasing power, with the level of income rising and a very low inflation persisting, boosted the expansion of retail trade in the first ten months of 2015. The retail trade turnover (in real terms) recorded a year-on-year pick-up of 5.8% and notably exceeded the average growth rate of 2014 (3.6%).
It may not always be possible to translate declining prices into a rising consumption of the relevant goods; hence the funds saved may boost the development of other sectors. For instance, if the prices of food products or heat energy have contracted, the consumption of the above cannot be unlimited and presently, for example, the ones who derive benefit in real terms are fuel traders (although the data for September have suggested that the consumption of
Chart 4.6CHANGES IN VALUE AddEd BY MAIN TYPES OF SERVICES(year-on-year; seasonally non-adjusted data; %)

37
MACROECONOMIC DEVELOPMENTS REPORTDecember 2015
fuel may have already reached a certain degree of saturation during the year due to more favourable prices) and merchants of goods for house furnishing (see Chart 4.7). Price developments in the selected segments of services suggest that the population may have spent some of the saved funds for the consumption of services rather than for the purchase of goods.
Retail trade was primarily supported by domestic demand, in the third quarter in particular. Although Latvia's Presidency of the EU Council had a favourable effect on the number of foreign visitors serviced in the first half of the year, it may not be associated with a substantial contribution to the development of retail trade. Among foreign visitors coming to Latvia for recreational purposes, the share of visitors from Russia has declined since the middle of 2014, while the share of travellers from other countries, e.g. Lithuania, is gradually moving up. At the same time, the view about the specificities of consumption and purchasing power of "an average tourist" is changing.
As regards trade, confidence indicators suggest that the sector is facing a labour shortage. The representatives of the major retail networks also confirm the above: since consumer prices do not increase substantially, the sector cannot afford to pay higher wages to the employees and hence the operation of self-service cash registers has been gradually tested in supermarkets. Although the retail trade confidence indicator has fluctuated within a narrow range since the beginning of the year, some of its components pointed to retailer pessimism in September: a smaller share of merchants are expecting an increase in prices or turnover, while the share of merchants who consider that the volume of inventories is on a rise has expanded.
It is planned to raise an excise tax rate on fuel and alcoholic beverages at the beginning of 2016 (in January and April), which will, most likely, be incorporated into prices. However, since the excise tax is not rising vigorously and consumption of the above goods is characterised by lower elasticity than that of many other goods, a deterioration of confidence indicator should not be expected in retail trade under the impact of this factor. Moreover, a more buoyant economic growth is expected in 2016, which may also affect private consumption and the related retail trade development positively.
The value added of the transportation and storage sector (seasonally adjusted) posted a quarter-on-
4. AGGREGATE SUPPLY
Chart 4.7BREAKdOWN BY ANNUAL CHANGES IN RETAIL TRADE TURNOVER(in percentage points)

38
MACROECONOMIC DEVELOPMENTS REPORTDecember 2015
quarter decline of 0.4% in the second quarter and a fall of 1.5% compared to the first quarter of 2014. In the third quarter, transportation services recorded a quarter-on-quarter expansion (by 0.7%), albeit the growth rate of the sector remains negative year-on-year (a decline of 0.3%).
Although the data on value added of the transportation sector have revealed a better performance in the third quarter than in the first two quarters, with the trend that started in the first quarter continuing, negative growth rates can be observed at ports both in the second and third quarters (see Chart 4.8 for the dynamics of cargoes transported by different types of transport). In the second and third quarters of 2015, the volume of cargoes at ports shrank by 5.5% and 5.4% year-on-year respectively. Hence the total volume of cargoes at ports has declined by 5.2% in the first ten months of 2015. The most notable decrease observed at Ventspils Port in the second and third quarters (12.2% and 12.7% respectively) was attributable to a narrowing volume of coal, chemical cargoes and oil cargoes loaded and reloaded. The volume of cargoes loaded and reloaded by JSC Baltic Coal Terminal (due to the sanctions imposed on the owner in Russia) and JSC KĀLIJA PARKS (lost cargoes of potassium salt from Belarus) shrank most markedly. A lower volume of coal cargoes and transhipped containers contributed mainly to a falling cargo volume loaded and reloaded at Riga Port in the second and third quarters (by 1.9% and 4.8% respectively). The shrinking volume of chemical cargoes also affected the performance of Riga Port adversely in the third quarter. However, the above performance results have been much better in recent months than might be expected, given the negative opinion voiced by the representatives of the Freeport of Riga via mass media. An increase in the volume of cargos loaded and reloaded at Liepāja Port has been recorded in the second and third quarters (5.8% and 24.1% respectively). This development was attributable to the launching of the operation of JSC KVV Liepājas metalurgs and a higher volume of oil product cargoes loaded and reloaded in the second quarter and a 60% pick-up in the volume of grain cargoes loaded and reloaded in the third quarter. This rise was primarily on account of the fact that the freight owners from Russia and Kazakhstan had already commenced the transportation of harvest in August rather than in the middle or end of September, as had been the case in the previous years.
The volume of rail freight recorded a year-on-year decline of 0.8% in the second quarter, and freight
Chart 4.8ANNUAL CHANGES IN FREIGHT TURNOVER BY MAIN TYPES OF FREIGHT TRAFFIC (%)
4. AGGREGATE SUPPLY

39
MACROECONOMIC DEVELOPMENTS REPORTDecember 2015
turnover (indicator based on the distance covered and freight weight) dropped by 2.1%. In the third quarter, the freight volume and turnover expanded by 5.8% and 5.2% respectively. Higher volume of rail freight transported to ports in August and September notwithstanding, better performance results have not been observed in recent months. The positive development of rail freight transportation is attributable to an increasing volume of transported oil products, while the volume of transported coal freight has declined. It may also be concluded that overall the rail repairs carried out in Russia have not affected the volume of freight transported in the direction of Latvia so far – the volume of import freights has picked up by 5.4% in the third quarter. The volume of freight transported in the first ten months of 2015 remained broadly unchanged year-on-year (a fall of 0.6%) due to the sound performance in August and September. However, external uncertainties overall, uncertainty about the freight flow from Russia and the relevant risks still remain high. For instance, according to mass media, several port terminals encounter problems since Russia declines the previously ordered rail freight volumes.
The latest preliminary data for October suggest that the volume of cargoes have continued to shrink by 6.2% at ports. The steepest decline has been recorded at Ventspils Port and Riga Port, while expanding grain cargoes and woodchip cargoes have contributed to a higher volume of cargoes transported at Liepāja Port than the volume recorded in October 2014. Contrary to a buoyant growth in August and September, the volume of rail freight recorded a year-on-year fall of 5.2% in October.
In 2015, the dynamics of freight traffic by road accounting for more than a half of the total freightage by land has improved more than that of the port or rail freightage. In the second quarter, the volume of freight traffic by road recorded a 8.7% year-on-year decline, while the turnover (indicator based on the distance covered and freight weight) rose by 4.1%. In the third quarter, with the volume of international freightage expanding, the volume of freight traffic by road increased by 1.9% and the relevant turnover grew even by 10.3%. The volume and turnover of freight traffic by road recorded a year-on-year pickup of 1.3% and 4.0% respectively in the first nine months of 2015 overall. The data conform to the information released in mass media: tight competition with Polish and Lithuanian carriers notwithstanding, Latvian carriers have offset the shrinking demand in Russia by operating more actively in the EU market and, for
4. AGGREGATE SUPPLY

40
MACROECONOMIC DEVELOPMENTS REPORTDecember 2015
instance, in Kazakhstan and Uzbekistan as well.
4.4 Labour market
The Beveridge curve has remained stable over time (see Chart 4.9). The cyclical unemployment component has been close to zero already since early 2013, and headline unemployment is similar to its natural rate (see Chart 4.10). This points to a state of macroeconomic balance. Unemployment will decline further on account of the structural component. As a result, the decrease in the unemployment rate is expected to be relatively slow.
The moderation of the decline in unemployment has been reflected by the dynamics of registered unemployment over the past months. In August and September, the month-on-month decrease in registered unemployment was still driven by the favourable impact of the seasonal factors. However, in August, September and October, the rate of registered unemployment increased for the first time since the crisis (by 0.1 percentage point; 8.3% of the economically active population at the end of October) in comparison with the corresponding period of the previous year. Employment growth varies depending on the statistical data source used (see Chart 4.11); the difference is due to methodological differences and the base effect. In the future, the impact of the factors promoting employment (an increase in the share of the economically active population in the number of working age population and a decline in the unemployment rate) will be similar to that of the factors hampering employment (a drop in the number of population and a decrease in the share of working age population). Therefore, the annual rate of increase in employment could be close to zero. Preliminary data suggest a further fall in net emigration in 2015. For instance, the number of passenger arrivals reported by SJSC Riga International Airport significantly exceeded that of departures for the first time since the respective data are available (see Chart 4.12).
4. AGGREGATE SUPPLY
Chart 4.9BEVERIdGE CURVE: NUMBER OF UNEMPLOYEdPERSONS REGISTEREd WITH THE SEA ANd THAT OFVACANCIES(seasonally adjusted data)
Chart 4.10HEAdLINE ANd NATURAL UNEMPLOYMENT(% of the economically active population; seasonally adjusted data)
Chart 4.11ANNUAL INCREASE IN THE NUMBER OF EMPLOYEd(%)

41
MACROECONOMIC DEVELOPMENTS REPORTDecember 2015
Recent years have witnessed changes in the employment structure in the breakdown by economic sector, with the number of those employed in construction and manufacturing shrinking, but employment in the services sector growing. The most rapid increase in the number of employed has been recorded in information and communication services, professional, scientific and technical activities, accommodation and catering services since early 2010.
A sustained rise in remuneration still persists (in the private sector in particular). A positive wage growth component has been observed also in 2015, and this cannot be explained by labour productivity growth, inflation and legislative amendments (a rise in the minimum wage), with the gap between wages and productivity increasing to the level observed in 2006 (see Chart 4.13). This phenomenon can only be partly attributable to the potential legalisation of so-called "envelope wages", since the national accounts data comprising also the informal economy likewise show similar trends, with the wage share in the composition of value added growing. At the same time, other economic indicators do not point to the deviation from the macroeconomic balance. For instance, the unemployment rate does not fall below the natural rate, the assessment of labour shortage by businesses is still stable and moderate (see Chart 4.14), and the profitability indicators are resilient. In 2016, wage increases are expected to remain somewhat above the labour productivity growth, reflecting structural changes on the income side of the GdP (with the equilibrium level of the wage share in the total value added growing – it is still significantly lower in Latvia than the EU average; see Chart 4.15) rather than the deviation from the macroeconomic balance.
4. AGGREGATE SUPPLY
Chart 4.12OFFICIAL ANd PRELIMINARY INdICATORS FOR NET EMIGRATION(thousand people per quarter)
Chart 4.13REAL WAGE AND SALARy AND LABOURPROdUCTIVITY INdEX(Q1 2005 = 100; seasonally adjusted data)
Chart 4.14PERCENTAGE OF BUSINESSES WHO FINd LABOUR SHORTAGE AN IMPORTANT OBSTACLE TO BUSINESS GROWTH(%)

42
MACROECONOMIC DEVELOPMENTS REPORTDecember 2015
The annual rate of increase in the average monthly gross wage and salary could decrease to 5% in 2016. This will be determined by both the residual component (wage growth exceeding labour productivity increase) of wage growth and a slower rise in the minimum wage. Moreover, the rate of increase in net wages will decline more than that in gross wage and salary in 2016, since legislative amendments are no longer expected to facilitate a steeper increase in net wages and salaries in comparison with gross wages and salaries as was the case in 2014 and 2015 (raising the monthly untaxed minimum of personal income significantly and lowering the rate of compulsory social security contributions by employee in 2014 as well as reducing the PIT rate in 2015 respectively). A slower rise in net wages could hinder the dynamics of private consumption.
4. AGGREGATE SUPPLY
Chart 4.15SHARE OF LABOUR REMUNERATION IN THE GROSS VALUE AddEd IN THE EU COUNTRIES(2014)

43
MACROECONOMIC DEVELOPMENTS REPORTDecember 2015
5. Costs and PricesIn May–October 2015, the prices of commodities (mainly oil and agricultural products) in the global market continued to have a significant effect on the annual inflation rate in Latvia. The impact of external supply-side factors was largely offset by domestic factors (increases in income and indirect taxes, and the electricity market liberalisation for households); however, the 12-month average inflation remained low and continued to decline to stand at 0.3% in October (see Chart 5.1). This indicator is close to the most recent forecast of the average annual inflation for 2015.
According to the tariff plan, JSC Latvijas Gāze continued to lower natural gas tariffs for its industrial customers (thus further lowering tariffs for the upcoming heating season) and households due to a drop in global oil product prices. Hence the fall in oil prices (see Chart 5.2) which followed a temporary rise in May has substantially affected consumer prices in Latvia not only directly (through fuel prices) but also indirectly. In the first 10 months of 2015, the overall contribution of the decline in fuel, natural gas and heating prices to annual inflation exceeded 1 percentage point.
Headline inflation declined further on account of the food price dynamics which is affected by both global and local factors. Global food prices continued on a downward trend until August (see Chart 5.3), resuming an increase in September when the largest exporters of dairy products scaled down production. The number of the food commodity groups recording price rises on the global market increased in October. Combined effects of both the lifting of the milk production quotas in the EU countries and the Russian trade embargo were still locally observed: the period of sanctions was extended, thus depriving exporters waiting for the export activity in Russia to recover of the opportunity to boost exports, but at the same time high levels of supply were maintained in the internal market of the EU.
The dynamics of the global commodity prices contributed to a further decrease in the annual rate of growth in producer prices, thus industrial producer prices for domestically sold goods (see Chart 5.4) did not exert any pressure on the level of consumer prices. Low inflation in the euro area did not facilitate inflation growth in Latvia either, with the impact of the prices of tradable goods on inflation remaining low. Even the rise in prices of wearing apparel and
Chart 5.1 CHANGES IN HICP BY COMPONENT(percentage points)
Chart 5.2BRENT CRUdE OIL PRICES ON GLOBAL MARKET(EUR/barrel)
Chart 5.3GLOBAL FOOd PRICES(average monthly indicator of 2002–2004 = 100)
5. COSTS ANd PRICES
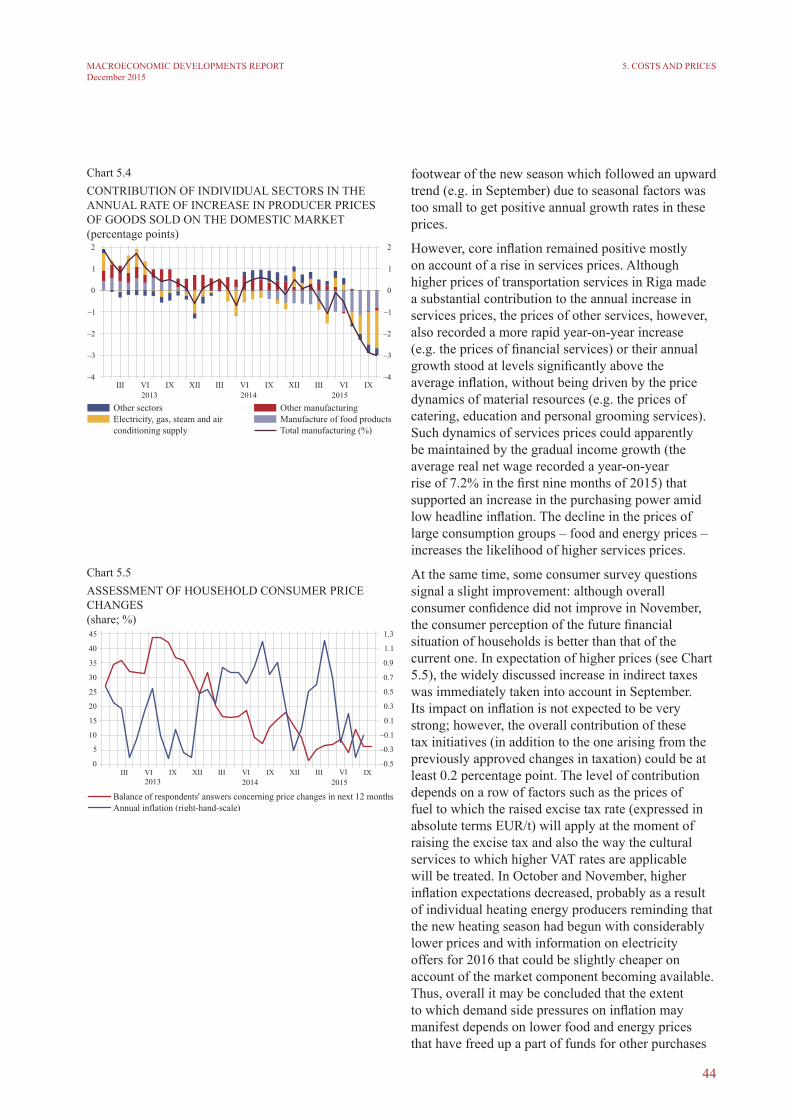
44
MACROECONOMIC DEVELOPMENTS REPORTDecember 2015
footwear of the new season which followed an upward trend (e.g. in September) due to seasonal factors was too small to get positive annual growth rates in these prices.
However, core inflation remained positive mostly on account of a rise in services prices. Although higher prices of transportation services in Riga made a substantial contribution to the annual increase in services prices, the prices of other services, however, also recorded a more rapid year-on-year increase (e.g. the prices of financial services) or their annual growth stood at levels significantly above the average inflation, without being driven by the price dynamics of material resources (e.g. the prices of catering, education and personal grooming services). Such dynamics of services prices could apparently be maintained by the gradual income growth (the average real net wage recorded a year-on-year rise of 7.2% in the first nine months of 2015) that supported an increase in the purchasing power amid low headline inflation. The decline in the prices of large consumption groups – food and energy prices – increases the likelihood of higher services prices.
At the same time, some consumer survey questions signal a slight improvement: although overall consumer confidence did not improve in November, the consumer perception of the future financial situation of households is better than that of the current one. In expectation of higher prices (see Chart 5.5), the widely discussed increase in indirect taxes was immediately taken into account in September. Its impact on inflation is not expected to be very strong; however, the overall contribution of these tax initiatives (in addition to the one arising from the previously approved changes in taxation) could be at least 0.2 percentage point. The level of contribution depends on a row of factors such as the prices of fuel to which the raised excise tax rate (expressed in absolute terms EUR/t) will apply at the moment of raising the excise tax and also the way the cultural services to which higher VAT rates are applicable will be treated. In October and November, higher inflation expectations decreased, probably as a result of individual heating energy producers reminding that the new heating season had begun with considerably lower prices and with information on electricity offers for 2016 that could be slightly cheaper on account of the market component becoming available. Thus, overall it may be concluded that the extent to which demand side pressures on inflation may manifest depends on lower food and energy prices that have freed up a part of funds for other purchases
5. COSTS ANd PRICES
Chart 5.4CONTRIBUTION OF INdIVIdUAL SECTORS IN THE ANNUAL RATE OF INCREASE IN PROdUCER PRICES OF GOOdS SOLd ON THE dOMESTIC MARKET(percentage points)
Chart 5.5ASSESSMENT OF HOUSEHOLd CONSUMER PRICE CHANGES(share; %)
45
MACROECONOMIC DEVELOPMENTS REPORTDecember 2015
and services and the households' assessment of the development of the economic situation in the country and the financial position of a family.
Changes in the excise tax on tobacco and alcoholic beverages and the prices of some tradable goods which (like the prices of services) may have reacted to the growing purchasing power had some positive impact on inflation in the middle of 2015. For instance, the prices of household appliances, audio, video, photo and data processing equipment have resumed growth after a lengthy decrease. The prices of personal grooming, sports and recreational goods increased in the first 10 months of 2015 in contrast to the drop observed in the corresponding period of 2014. At the same time, the prices of books and stationery also posted a rise in annual terms.
5. COSTS ANd PRICES

46
MACROECONOMIC DEVELOPMENTS REPORTDecember 2015
6. Balance of PaymentsIn the second quarter of 2015, the current account deficit of Latvia's balance of payments amounted to 148.3 million euro (2.4% of GdP; see Chart 6.1), and the quarter-on-quarter increase mostly resulted from lower inflows of EU fund financing. At the same time, the current account deficit rose to 190.3 million euro (3.0% of GdP) in the third quarter.
In the second quarter, the foreign trade deficit in goods amounted to 593.2 million euro (9.8% of GdP), and the quarter-on-quarter rise was on account of a more rapid increase in imports in goods in comparison with exports, with the annual growth rate of both indicators persisting (see Chart 6.2). At the same time, the foreign trade surplus in services (440.8 million euro or 7.3% of GdP) recorded a minor quarter-on-quarter increase. The rise was mainly driven by higher spending of foreign travellers in Latvia associated with seasonal factors and the Latvian Presidency of the EU Council.
In the third quarter, the goods deficit (614.8 million euro or 9.6% of GdP) and the deficit of the primary income account (87.9 million euro or 1.4% of GdP) were not offset by the services surplus (453.3 million euro or 7.0% of GdP) and the surplus of the secondary income account (59.2 million euro or 0.9% of GdP). Exports and imports of goods increased equally rapidly quarter-on-quarter (by 4.1% and 4.0% respectively). The services surplus continued to rise, and (like before) it was driven by spending of foreign travellers in Latvia.
In the second quarter, the balance of the primary income account became negative on account of an increase in reinvested earnings (29.6 million euro or 0.5% of GdP). In the third quarter, the rise in the deficit of the primary income account was affected by the fact that practically no inflows of EU funding were seen in the course of the quarter, while the deficit of reinvested earnings and dividends remained similar to the level observed in the second quarter. In the second quarter, the balance of the secondary income account turned positive (33.7 million euro or 0.6% of GdP) due to the lower contributions to the EU budget.
The surplus of the financial account was 147.6 million euro or 2.4% of GdP in the second quarter. Portfolio investment of Latvijas Banka and credit institutions in foreign debt securities amounted to 184.8 million euro and 200.0 million euro respectively. Inflows of foreign direct investment in Latvia amounted to 113.6 million
Chart 6.1CURRENT ACCOUNT OF LATVIA'S BALANCE OF PAYMENTS ANd ITS COMPONENTS(% of GdP)
Chart 6.2RATE OF CHANGE IN EXPORTS ANd IMPORTS OF GOOdS ANd SERVICES (year-on-year; %)
6. BALANCE OF PAYMENTS

47
MACROECONOMIC DEVELOPMENTS REPORTDecember 2015
euro (1.9% of GdP; see Chart 6.3). Major investment flows came from Sweden, Norway and the US. In the third quarter, the balance of the financial account was negative (136.4 million euro or 2.1% of GdP). This was largely affected by the rise in the amount of Latvian government securities (494.8 million euro), while inflows of foreign direct investment in Latvia persisted (158.7 million euro or 2.5% of GdP). The largest investment flows came from Cyprus, Estonia and Luxembourg. Investment of Latvian credit institutions in foreign debt securities decreased along with a decline in non-resident deposits.
Pursuant to the data revision policy, publishing of data for the second quarter of 2015 also incorporates data revisions for 2014 and the first quarter of 2015.
6. BALANCE OF PAYMENTS
Chart 6.3FOREIGN dIRECT INVESTMENT IN LATVIA(% of GdP)
48
MACROECONOMIC DEVELOPMENTS REPORTDecember 2015
7. Conclusions and Forecasts7.1 Economic developments
In the first nine months of 2015, moderate economic growth persisted in Latvia: annual GdP growth stood at 2.6% (seasonally adjusted data). In view of the external environment conditions, such a result is satisfactory; however, it cannot be considered positive in the context of real convergence. Following a revision of the national account data, it is obvious that the economic growth in Latvia has moderated with each subsequent year. On the one hand, it is mostly a result of external developments: slow euro area growth, unfavourable geopolitical situation, economic weakness of and sanctions imposed by Russia, effects stemming from the Greek sovereign debt crisis, and other factors. On the other hand, it has to be admitted that Latvia is also facing structural problems. Moreover, it should be noted that in the first half of 2015 the real macroeconomic data situation improved as a result of the launch of the JSC KVV Liepājas metalurgs operation having a positive effect on both the manufacturing and GdP data.
At this stage the Latvian economy grows mostly on account of private consumption or an increase in the household spending. As to contribution by sector, the economic growth is driven by manufacturing, trade, public utilities, and, to a lesser extent, other business services. In recent years, the economic growth in Latvia was maintained as a result of persistent improvement in labour market conditions: declining unemployment, growing employment and a relatively rapid rise in wages and salaries. Nevertheless, this process has some limitations. The potential of a decline in unemployment rate is limited by the natural unemployment rate, with the headline unemployment rate already being close to it. That, in turn, implies that the share of economic growth potential, based on the decline in unemployment, has considerably decreased. According to Latvijas Banka forecasts, the next few years will see the unemployment rate fall and the average wages and salaries rise at a slower pace than before.
As regards sectors, the dynamics of transport and construction changed in 2015. Construction output, particularly that of residential buildings, gradually contracted as a result of a review of temporary residence permit issuance principles in 2014. The construction growth rate is likely to decrease in the
7. CONCLUSIONS ANd FORECASTS
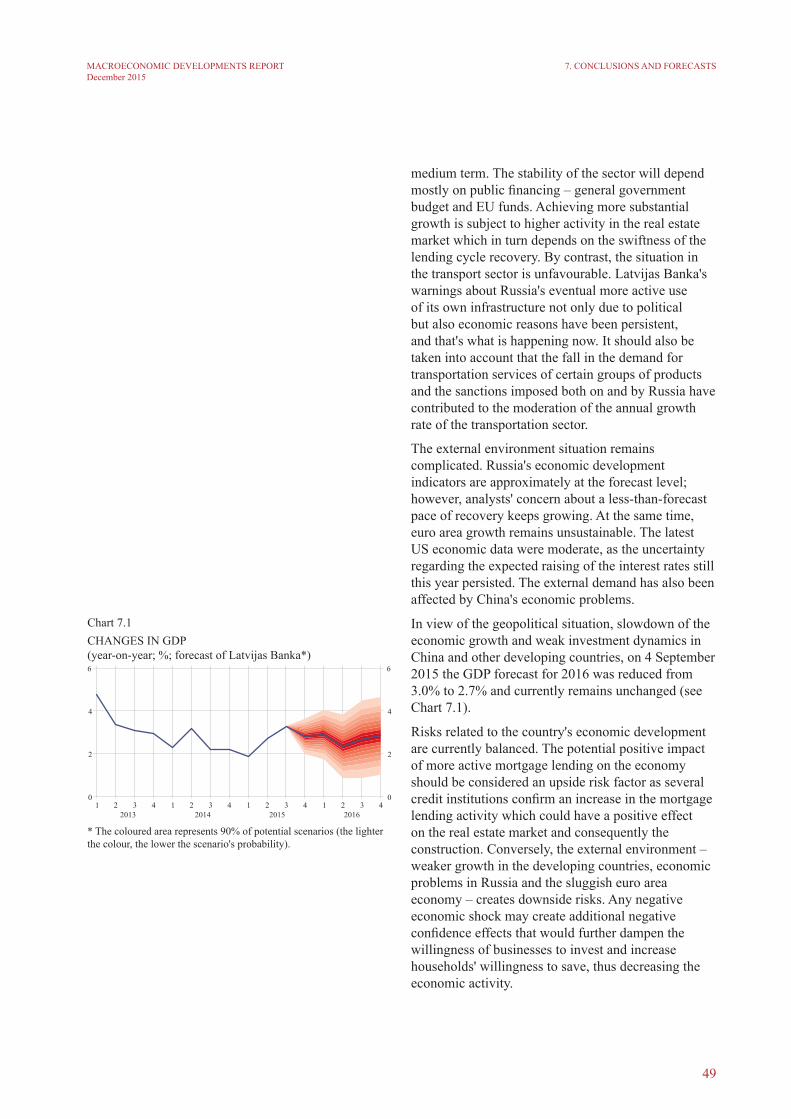
49
MACROECONOMIC DEVELOPMENTS REPORTDecember 2015
medium term. The stability of the sector will depend mostly on public financing – general government budget and EU funds. Achieving more substantial growth is subject to higher activity in the real estate market which in turn depends on the swiftness of the lending cycle recovery. By contrast, the situation in the transport sector is unfavourable. Latvijas Banka's warnings about Russia's eventual more active use of its own infrastructure not only due to political but also economic reasons have been persistent, and that's what is happening now. It should also be taken into account that the fall in the demand for transportation services of certain groups of products and the sanctions imposed both on and by Russia have contributed to the moderation of the annual growth rate of the transportation sector.
The external environment situation remains complicated. Russia's economic development indicators are approximately at the forecast level; however, analysts' concern about a less-than-forecast pace of recovery keeps growing. At the same time, euro area growth remains unsustainable. The latest US economic data were moderate, as the uncertainty regarding the expected raising of the interest rates still this year persisted. The external demand has also been affected by China's economic problems.
In view of the geopolitical situation, slowdown of the economic growth and weak investment dynamics in China and other developing countries, on 4 September 2015 the GdP forecast for 2016 was reduced from 3.0% to 2.7% and currently remains unchanged (see Chart 7.1).
Risks related to the country's economic development are currently balanced. The potential positive impact of more active mortgage lending on the economy should be considered an upside risk factor as several credit institutions confirm an increase in the mortgage lending activity which could have a positive effect on the real estate market and consequently the construction. Conversely, the external environment – weaker growth in the developing countries, economic problems in Russia and the sluggish euro area economy – creates downside risks. Any negative economic shock may create additional negative confidence effects that would further dampen the willingness of businesses to invest and increase households' willingness to save, thus decreasing the economic activity.
Chart 7.1CHANGES IN GdP(year-on-year; %; forecast of Latvijas Banka*)
* The coloured area represents 90% of potential scenarios (the lighter the colour, the lower the scenario's probability).
7. CONCLUSIONS ANd FORECASTS

50
MACROECONOMIC DEVELOPMENTS REPORTDecember 2015
7.2 Inflation
Average annual inflation for 2015 and 2016 will remain low on account of the supply-side factors. The inflation forecast for 2016 remains unchanged at 1.3% (see Chart 7.2).
The forecast of the average annual inflation for 2016 is slightly higher than in 2015 due to expected moderate economic growth and changes in indirect taxes. The rapid fall in energy and food prices seen in the global market in 2015 is unlikely to be experienced again in 2016. These prices have relatively low base levels in the global market.
Increases in the excise tax rates on fuel (from January) and alcoholic beverages (from April) and the application of the basic VAT rate to the management of the housing stock fees from July are the major tax changes that will directly affect the prices of goods and services.
The risk distribution of the inflation forecast for 2016 is considered balanced.
A minor drop could be recorded in energy prices if Iran returns with its oil supply on the oil market, as well as in energy bills for those consumers who will enter into new contracts without contract termination fees (obviously the users of Elektrum universal service with a 12 month contract) on account of a fall in commodity exchange prices. Nevertheless, food prices have a low base in the global markets, the major milk exporters are scaling down production, and the estimate of the global cereal stock-to-use ratio for the new season has slightly decreased (albeit remaining relatively high).
A higher inflation rate could be expected in 2017 as a result of the liberalisation of the natural gas market in Latvia and an accelerated increase in global commodity prices after a low base period.
7. CONCLUSIONS ANd FORECASTS
Chart 7.2HICP CHANGES(year-on-year; %; forecast of Latvijas Banka*)
* The coloured area represents 90% of potential scenarios (the lighterthe colour, the lower the scenario's probability).

51
MACROECONOMIC DEVELOPMENTS REPORTDecember 2015
STATISTICS
statistics List of tables
1. Monetary Indicators and Interest Rates 542.ab Real Sector Indicators and Prices 553. Analytical Accounts of the Central Bank 564. Monetary Aggregates and Counterparts in the Euro Area: Latvian Contribution 575. Key ECB Interest Rates 586. Assets and Liabilities of Latvijas Banka 597. Aggregated Balance Sheet of MFIs (excluding Latvijas Banka) 618. Consolidated Balance Sheet of MFIs 629.ab Aggregated Balance Sheet of MFIs (excluding Latvijas Banka) 6310. Monetary Survey MFI's (excluding Latvijas Banka) 6611.ab Foreign Assets and Liabilities of MFIs (excluding Latvijas Banka) 6712. Selected Items in the Monthly Financial Position Report of MFIs (excluding Latvijas Banka) by Group of Countries 6813. Maturity Profile of deposits of Resident Financial Institutions, Non-Financial
Corporations and Households 6914.a deposits by Financial Institutions 7014.b deposits by Non-Financial Corporations 7214.c deposits by Households 7314.d deposits by Government and Non-Residents 7315. Maturity Profile of Loans to Resident Financial Institutions, Non-Financial
Corporations and Households 7416.a Loans to Financial Institutions and Non-Financial Corporations 7416.b Loans to Households 7516.c Loans to Government and Non-Residents 7517.ab Loans to Financial Institutions and Non-Financial Corporations in the National
Economy 7618. Lending to Resident Financial Institutions, Non-Financial Corporations and
Households 7719.a Holdings of Securities Other than Shares 7819.b Holdings of Shares and Other Equity 7820.a Currency Breakdown of Resident deposits 7920.b Currency Breakdown of Non-Resident deposits 7920.c Currency Breakdown of Loans to Residents 8020.d Currency Breakdown of Loans to Non-Residents 8020.e Currency Breakdown of Holdings of Resident Securities Other than Shares 8120.f Currency Breakdown of Holdings of Non-Resident Securities Other than
Shares 8120.g Currency Breakdown of debt Securities Issued by MFIs 8221.a Weighted Average Interest Rates Charged by MFIs in Transactions with
Resident Non-Financial Corporations and Households in Euro 8221.b Weighted Average Interest Rates Charged by MFIs in Transactions with
Resident Non-Financial Corporations and Households in US dollars 8621.c Weighted Average Interest Rates Charged by MFIs in Transactions with Resident
Non-Financial Corporations (new business) 9022. Lending in the Interbank Markets 9123. Interest Rates in the domestic Interbank Market 9224. Principal Foreign Exchange Transactions (by type, counterparty and currency) 92
52
MACROECONOMIC DEVELOPMENTS REPORTDecember 2015
STATISTICS
25. Non-cash Foreign Exchange Transactions 9326. Euro Foreign Exchange Reference Rates Published by the ECB 9327. Weighted Average Exchange Rates (cash transactions) 9428. Structure of Government Securities 9529. Auctions of Government Securities in the Primary Market 9630. dynamics of GdP 9631. Changes in the Average Monthly Wages and Salaries and Unemployment 9732. Latvian Foreign Trade Balance 9733. Main Export Goods of Latvia 9834. Main Import Goods of Latvia 9835. Latvian Foreign Trade Partners 9936. Convenience and Extended Credit, Revolving Loans and Overdraft to Resident
Non-financial Corporations and Households 9937.a Loans to Resident Non-financial Corporations in the Breakdown
by Residual Maturity and by Interest Rate Reset Period 10037.b Loans to Resident Households in the Breakdown by Residual Maturity and
by Interest Rate Reset Period 100

53
MONETARY INDICATORS AND INTEREST RATES
2014 2015
Q1 Q2 Q3 Q4 Q1 Q2 Q3
Overnight deposits1 (Latvian
contribution to the euro area M1) –0.8 16.0 6.5 7.8 –0.8 12.2 13.4 14.2
Latvian contribution to the euro
area M21 –2.0 7.9 3.7 5.2 –2.0 6.9 9.0 9.5
Latvian contribution to the euro
area M31 x x x x x 6.7 8.5 9.1
Loans to resident financial
institutions, non-financial
corporations and households1 –7.1 –8.7 –7.0 –5.6 –7.1 –4.3 –3.6 –3.7
Deposits of resident financial
institutions, non-financial
corporations and households1 3.4 11.4 9.9 10.8 3.4 5.9 7.3 9.0
Long-term interest rate for
convergence assessment purposes2 2.51 3.14 2.69 2.34 1.86 0.81 0.85 1.08
EURIBOR (3-month loans)3 0.210 0.295 0.299 0.165 0.082 0.046 –0.006 –0.028
Weighted average yield on
government bonds 1.64 1.84 1.74 1.74 1.34 0.25 0.74 0.94
OMXR3 436.9 460.3 430.8 435.8 419.1 421.5 439.3 464.4
1.
2014 2015
VII VIII IX X XI XII I II III IV V VI VII VIII IX
Overnight deposits1 (Latvian
contribution to the euro area M1) 3.9 3.6 7.8 4.5 1.8 –0.8 8.8 12.3 12.2 13.6 15.2 13.4 14.0 11.7 14.2
Latvian contribution to the euro
area M21 1.8 1.4 5.2 2.3 0.7 –2.0 4.3 7.8 6.9 8.8 9.2 9.0 9.5 8.2 9.5
Latvian contribution to the euro
area M31 x x x x x x 4.1 7.7 6.7 8.3 8.8 8.5 9.0 7.7 9.1
Loans to resident financial
institutions, non-financial
corporations and households1 –6.9 –6.6 –5.6 –5.3 –5.5 –7.1 –4.4 –4.5 –4.3 –4.4 –3.7 –3.6 –3.7 –3.5 –3.7
Deposits of resident financial
institutions, non-financial
corporations and households1 10.6 10.4 10.8 9.1 7.9 3.4 3.8 4.9 5.9 7.4 7.2 7.3 8.4 7.9 9.0
Long-term interest rate for
convergence assessment purposes2 2.40 2.35 2.28 2.18 1.77 1.63 1.10 0.78 0.56 0.42 0.84 1.28 1.25 0.96 1.03
EURIBOR (3-month loans)3 0.205 0.192 0.097 0.083 0.081 0.081 0.063 0.048 0.027 0.005 –0.010 –0.014 –0.018 –0.028 –0.037
Weighted average yield on
government bonds 1.84 – 1.54 1.44 1.24 1.14 0.35 0.35 0.25 0.25 0.25 0.74 0.84 – 0.94
OMXR3 450.1 429.3 427.2 420.8 420.0 416.3 418.6 421.6 424.2 432.7 442.0 443.7 440.1 440.1 512.9
1 Year-on-year changes (%).
2 Average secondary market yield of 10-year government bonds.
3 Average of the period.
4 Weighted average primary market yield of 5-year government bonds.
5 Weighted average primary market yield of 3-year government bonds.

54
REAL SECTOR INDICATORS AND PRICES
2014 2015
Q1 Q2 Q3 Q4 Q1 Q2 Q3
Industrial output1
Increase/decrease2 (at constant
prices; working day adjusted data; %) –0.1 0.3 1.8 –0.6 –1.7 4.2 5.9 3.7
Cargoes loaded and unloaded at ports
Turnover (thousands of tons) 74 175 20 749 18 637 16 206 18 632 19 810 17 605 15 292
Increase/decrease2 (%) 5.2 9.4 3.6 –2.2 9.6 –4.5 –5.5 –5.4
Retail trade turnover 1, 3, 4
Turnover (at current prices; millions of euro) 6 469.1 1 429.6 1 608.8 1 725.5 1 705.2 1 479.0 1 652.3 1 750.5
Increase/decrease2 (at constant prices; %) 3.6 2.2 4.8 3.5 4.0 7.4 5.4 5.0
Unemployment rate (%) 8.5 9.8 8.9 8.2 8.5 9.2 8.6 8.3
Producer prices1 (increase/decrease compared
with the previous period; %) 0.4 0.2 0.0 0.5 –0.6 –0.1 0 –0.7
Consumer price inflation
Year-on-year basis (%) 0.6 0.4 0.7 0.8 0.6 0 0.8 –0.1
Quarter-on-quarter basis (%) x 0.6 0.7 –0.5 –0.3 0 1.5 –1.4
Financial surplus/deficit in the consolidated general government budget
Surplus/deficit (millions of euro) –399.0 27.0 248.9 38.7 –713.6 34.5 183.0 –41.5
Ratio to GDP (%) 1.7 0.5 4.2 0.6 11.0 0.6 3.0 0.6
1 Data are calculated according to the Statistical classification of economic activites in the European Community (NACE Rev. 2) . 2 Year-on-year basis. 3 Sale of motor vehicles and motorcycles not included. 4 Data have been revised.
2.a

55
ANALYTICAL ACCOUNTS OF THE CENTRAL BANK
(at end of period; millions of euro)
2014 2015
VII VIII IX X XI XII I II III IV V VI VII VIII IX
Latvia's contribution to the euro
area monetary base 4 528.9 4 484.6 4 627.5 4 429.1 4 617.1 6 381.1 5 105.7 5 716.5 5 826.0 6 485.8 6 573.3 6 696.0 6 799.1 6 826.1 7 199.9
Currency in circulation 3 783.0 3 782.4 3 788.6 3 803.0 3 824.7 3 957.7 3 883.8 3 894.7 3 929.1 3 966.3 3 986.1 4 023.6 4 079.3 4 070.2 4 063.0
Current accounts (covering
the minimum reserve system) 745.9 702.2 838.9 626.1 792.4 2 073.4 1 221.9 1 821.8 1 896.9 2 519.5 2 587.2 2 672.4 2 719.8 2 755.9 3 136.9
Deposit facility and other
liabilities related to monetary
policy operations 0 0 0 0 0 350.0 0 0 0 0 0 0 0 0 0
Credit 1 586.4 1 577.2 1 656.9 1 628.8 1 634.5 1 670.7 1 987.3 2 069.1 2 285.9 2 437.7 2 659.7 2 902.1 3 103.0 3 132.6 3 325.2
To MFIs in the euro area 497.2 496.2 564.9 560.7 557.5 570.5 673.8 690.8 730.1 713.5 721.0 753.5 757.9 714.9 732.0
To the General government
sector in the euro area 272.7 274.1 273.5 281.2 281.1 306.5 505.6 518.6 597.7 773.2 1 030.5 1 064.5 1 065.2 1 051.7 1 129.7
To other euro area residents 816.5 806.9 818.5 786.9 795.8 793.7 807.9 859.7 958.1 951.1 908.2 1 084.1 1 279.9 1 366.0 1 463.5
Foreign assets outside the euro
area 2 815.4 2 830.6 2 837.6 2 798.4 2 764.3 2 867.1 3 296.7 3 183.8 3 237.8 3 113.4 3 248.4 3 189.3 3 193.1 3 264.7 3 358.9
Foreign liabilities outside the
euro area 5.2 28.9 5.4 23.2 73.7 24.0 27.3 14.7 10.4 14.0 5.0 5.8 20.6 22.5 2.3
REAL SECTOR INDICATORS AND PRICES
2014 2015
VII VIII IX X XI XII I II III IV V VI VII VIII IX
Industrial output1, 2
Increase/decrease3 (at constant prices;
working day adjusted data; %) –2.6 –1.0 1.8 1.7 –4.2 –2.8 3.1 1.4 7.6 7.8 5.8 4.1 7.5 2.4 1.3
Cargoes loaded and unloaded at ports
Turnover (thousands of tons) 5 393 5 300 5 513 6 080 6 380 6 172 6 651 6 188 6 972 6 455 5 612 5 538 5 042 5 020 5 229
Increase/decrease2 (%) –1.8 –7.4 3.9 14.6 19.6 –2.9 0 –10.0 –3.5 –2.1 –9.8 –4.8 –6.5 –4.4 –5.2
Retail trade turnover 1, 2, 4
Turnover (at current prices;
millions of euro) 585.0 582.7 557.8 568.3 530.2 606.7 484.3 465.8 528.0 532.2 550.8 566.7 597.8 593.2 554.8
Increase/decrease3 (at constant
prices; %) 4.0 3.2 3.2 4.5 4.6 3.1 6.9 9.0 6.4 3.6 5.0 6.8 4.2 5.4 4.3
Unemployment rate (%) 8.6 8.4 8.2 8.2 8.3 8.5 9.0 9.1 9.2 8.8 8.6 8.6 8.6 8.5 8.3
Producer prices1 (increase/decrease
compared with the previous period; %) 0.2 0 0.1 –0.5 –0.1 –0.4 0.1 –0.1 –0.1 –0.1 0 0.4 –0.5 –0.6 –0.3
Consumer price inflation
Year-on-year basis (%) 0.6 0.8 1.0 0.7 0.9 0.2 –0.4 –0.1 0.4 0.5 1.2 0.6 0 0.1 –0.5
Month-on-month basis (%) –0.4 –0.6 0.5 0 –0.3 –0.6 0.1 0.3 0.8 0.6 0.6 –0.2 –1.0 –0.5 –0.1
Annual core inflation (%) 1.6 1.7 1.7 1.2 1.7 1.5 1.8 1.4 1.7 1.5 2.0 1.6 1.3 1.5 1.4
Financial surplus/deficit in the
consolidated general government
budget (millions of euro) –10.9 47.4 2.2 –74.2 –172.2 –467.2 89.1 –78.8 24.2 120.5 102.6 –40.1 –85.9 117.6 –73.2
1 Data are calculated according to the Statistical classification of economic activites in the European Community (NACE Rev. 2) . 2 Data have been revised.
3 Year-on-year basis. 4 Sale of motor vehicles and motorcycles not included.
2.b
3.

56
MONETARY AGGREGATES AND COUNTERPARTS IN THE EURO AREA: LATVIAN CONTRIBUTION
(at end of period; millions of euro)
2014 2015
VII VIII IX X XI XII I II III IV V VI VII VIII IX
Monetary aggregates: Latvian contribution
M3 9 919.8 10 071.4 10 080.3 10 081.3 10 236.9 10 599.4 10 418.7 10 617.8 10 627.1 10 695.4 10 678.9 10 696.2 10 814.9 10 851.5 10 994.7
Repurchase agreements 0 0 0 0 0 0 0 0 0 0 0 0 0 0 0
Money market fund
shares and units 64.6 64.6 62.8 59.7 56.2 40.6 23.4 17.4 15.2 12.8 10.7 5.4 0 0 0
Debt securities issued
with maturity of up to
2 years 31.6 31.9 32.2 34.8 32.5 36.8 31.1 52.5 48.9 47.6 52.6 47.8 61.0 60.0 59.3
Deposits with agreed
maturity of up to 2 years 1 687.0 1 624.7 1 647.2 1 578.7 1 593.7 1 532.4 1 421.4 1 451.0 1 440.4 1 457.2 1 386.9 1 446.6 1 368.1 1 347.4 1 311.2
Deposits redeemable at
notice of up to 3 months 541.0 542.4 553.3 567.2 578.6 687.9 697.6 713.8 698.7 715.5 706.6 703.4 724.2 724.6 733.7
Overnight deposits 7 595.5 7 807.7 7 784.8 7 840.9 7 975.9 8 301.7 8 245.2 8 383.1 8 424.0 8 462.3 8 522.0 8 493.0 8 661.5 8 719.5 8 890.5
Counterparts of monetary aggregates and longer-term financial liabilities: Latvian contribution
Deposits of central
government 1 513.9 1 532.7 1 615.6 1 613.7 1 561.6 1 283.3 658.6 594.3 625.5 759.0 826.6 860.8 710.3 764.3 1 136.5
Longer-term financial
liabilities 3 965.2 4 010.0 4 003.6 4 144.6 4 173.8 4 017.9 4 073.6 4 130.3 4 000.2 4 041.1 4 120.3 4 119.7 4 152.9 4 164.6 4 226.6
Deposits with agreed
maturity of over 2 years 429.0 430.6 432.9 449.3 448.1 440.4 444.4 443.7 445.3 440.9 439.9 438.9 441.1 442.2 443.2
Deposits redeemable at
notice of over 3 months 4.7 4.6 4.7 4.7 4.6 4.7 5.0 5.1 5.1 5.1 5.1 5.2 5.2 5.1 5.1
Debt securities issued
with maturity of over
2 years 18.1 19.0 19.2 20.4 20.5 40.3 40.8 53.7 59.1 59.7 63.9 63.5 64.0 43.8 43.2
Capital and reserves 3 392.0 3 430.6 3 417.6 3 534.3 3 563.9 3 532.5 3 583.4 3 627.8 3 490.6 3 535.4 3 611.4 3 612.0 3 642.6 3 673.5 3 735.2
Credit to euro area residents 14 481.1 14 499.7 14 543.6 14 479.7 15 386.4 15 115.5 15 639.8 15 604.7 15 471.2 15 834.2 16 113.4 16 092.6 16 004.4 16 038.8 16 116.2
Credit to general
government 1 374.0 1 379.5 1 344.9 1 326.4 1 257.9 1 198.5 1 611.4 1 675.3 1 681.9 2 084.8 2 316.5 2 340.2 2 330.2 2 302.4 2 338.9
Credit to other euro area
residents 14 142.2 14 165.2 14 132.4 14 114.9 14 128.5 13 917.0 14 028.4 13 929.4 13 789.3 13 749.4 13 796.9 13 752.4 13 674.2 13 736.4 13 777.3
Loans 13 301.6 13 322.4 13 340.5 13 309.1 13 295.4 13 005.2 13 103.1 13 004.1 12 983.8 12 958.4 13 013.1 12 961.9 12 915.9 12 974.6 12 996.8
Net external assets outside
euro area 41.7 129.3 169.5 30.1 68.1 –1 574.4 –284.7 –316.6 184.6 –494.7 –547.4 –247.7 –516.1 –323.3 –287.6
4.

57
KEY ECB INTEREST RATES
(percentages per annum)
With effect from
(dd.mm.yyyy)
Deposit facility Main refinancing operations Marginal lending facility
Fixed rate tenders Variable rate tenders
Fixed rate Minimum bid rate
01.01.1999 2.00 3.00 – 4.50
04.01.1999 2.75 3.00 – 3.25
22.01.1999 2.00 3.00 – 4.50
09.04.1999 1.50 2.50 – 3.50
05.11.1999 2.00 3.00 – 4.00
04.02.2000 2.25 3.25 – 4.25
17.03.2000 2.50 3.50 – 4.50
28.04.2000 2.75 3.75 – 4.75
09.06.2000 3.25 4.25 – 5.25
28.06.2000 3.25 – 4.25 5.25
01.09.2000 3.50 – 4.50 5.50
06.10.2000 3.75 – 4.75 5.75
11.05.2001 3.50 – 4.50 5.50
31.08.2001 3.25 – 4.25 5.25
18.09.2001 2.75 – 3.75 4.75
09.11.2001 2.25 – 3.25 4.25
06.12.2002 1.75 – 2.75 3.75
07.03.2003 1.50 – 2.50 3.50
06.06.2003 1.00 – 2.00 3.00
06.12.2005 1.25 – 2.25 3.25
08.03.2006 1.50 – 2.50 3.50
15.06.2006 1.75 – 2.75 3.75
09.08.2006 2.00 – 3.00 4.00
11.10.2006 2.25 – 3.25 4.25
13.12.2006 2.50 – 3.50 4.50
14.03.2007 2.75 – 3.75 4.75
13.06.2007 3.00 – 4.00 5.00
09.07.2008 3.25 – 4.25 5.25
08.10.2008 2.75 – – 4.75
09.10.2008 3.25 – – 4.25
15.10.2008 3.25 3.75 – 4.25
12.11.2008 2.75 3.25 – 3.75
10.12.2008 2.00 2.50 – 3.00
21.01.2009 1.00 2.00 – 3.00
11.03.2009 0.50 1.50 – 2.50
08.04.2009 0.25 1.25 – 2.25
13.05.2009 0.25 1.00 – 1.75
13.04.2011 0.50 1.25 – 2.00
13.07.2011 0.75 1.50 – 2.25
09.11.2011 0.50 1.25 – 2.00
14.12.2011 0.25 1.00 – 1.75
11.07.2012 0 0.75 – 1.50
08.05.2013 0 0.50 – 1.00
13.11.2013 0 0.25 – 0.75
11.06.2014 –0.10 0.15 – 0.40
10.09.2014 –0.20 0.05 – 0.30
09.12.2015 –0.30 0.05 – 0.30
5.

58
ASSETS AND LIABILITIES OF LATVIJAS BANKA
(at end of period; millions of euro)
2014 2015
VII VIII IX X XI XII I II III IV V VI VII VIII IX
ASSETS
Gold and gold receivables 206.5 208.0 205.2 199.9 202.5 210.8 238.5 228.8 235.4 229.1 231.6 223.5 210.8 215.1 213.9
Claims on non-euro area
residents denominated in
foreign currency 2 396.7 2 408.1 2 416.4 2 390.9 2 355.7 2 441.4 2 818.3 2 739.2 2 784.8 2 671.0 2 813.2 2 774.3 2 792.4 2 861.7 2 974.8
Claims on euro area
residents denominated in
foreign currency 469.8 472.0 515.0 500.8 508.7 486.2 598.0 655.8 617.2 578.4 582.7 598.9 637.0 591.5 558.3
Claims on non-euro area
residents denominated in
euro 212.2 214.4 216.0 207.6 206.1 215.0 239.9 215.8 217.6 213.2 203.7 191.5 189.9 187.9 170.3
Lending to euro area credit
institutions related to
monetary policy operations
denominated in euro 6.0 6.0 31.0 25.0 25.0 85.5 85.5 85.5 160.5 170.5 170.5 200.5 201.5 200.5 235.5
Main refinancing
operations 0 0 0 0 0 0 0 0 0 0 0 0 1.0 0 5.0
Longer-term refinancing
operations 6.0 6.0 31.0 25.0 25.0 85.5 85.5 85.5 160.5 170.5 170.5 200.5 200.5 200.5 230.5
Fine-tuning reverse
operations 0 0 0 0 0 0 0 0 0 0 0 0 0 0 0
Structural reverse
operations 0 0 0 0 0 0 0 0 0 0 0 0 0 0 0
Marginal lending facility 0 0 0 0 0 0 0 0 0 0 0 0 0 0 0
Credits related to margin
calls 0 0 0 0 0 0 0 0 0 0 0 0 0 0 0
Other claims on euro area
credit institutions
denominated in euro 4.5 3.1 7.0 0.3 0.2 4.5 23.4 1.1 4.4 1.9 8.0 0.4 0.2 0.1 2.7
Securities of euro area
residents denominated in
euro 1 106.2 1 096.1 1 103.9 1 102.7 1 100.6 1 095.4 1 280.4 1 326.7 1 503.8 1 687.0 1 898.5 2 102.2 2 264.4 2 340.5 2 528.5
Securities held for
monetary policy
purposes 0 0 0 0 0 0 0 0 190.3 354.8 531.8 723.3 901.1 1 053.5 1 238.9
Other securities 1 106.2 1 096.1 1 103.9 1 102.7 1 100.6 1 095.4 1 280.4 1 326.7 1 313.5 1 332.1 1 366.7 1 378.9 1 363.3 1 286.9 1 289.6
Intra-Eurosystem claims 3 214.5 3 221.9 3 242.0 3 266.9 3 281.3 3 393.3 3 349.8 3 372.7 3 412.2 3 456.3 3 500.4 3 554.7 3 614.2 3 640.6 3 649.6
Other assets 116.7 118.5 121.0 138.7 144.0 92.5 107.0 103.6 117.1 214.8 118.0 128.9 131.3 175.2 135.3
Total assets 7 733.1 7 748.2 7 857.6 7 832.9 7 824.1 8 024.5 8 740.9 8 729.2 9 053.0 9 222.2 9 526.5 9 774.8 10 041.6 10 213.1 10 469.0
6.

59
ASSETS AND LIABILITIES OF LATVIJAS BANKA (CONT.)
(at end of period; millions of euro)
2014 2015
VII VIII IX X XI XII I II III IV V VI VII VIII IX
LIABILITIES
Banknotes in circulation 3 680.0 3 684.8 3 684.3 3 697.5 3 718.3 3 849.2 3 699.2 3 709.8 3 744.8 3 782.3 3 802.5 3 839.4 3 894.6 3 885.3 3 877.5
Liabilities to euro area
credit institutions related
to monetary policy
operations denominated in
euro 745.9 702.2 838.9 626.1 792.4 2 423.4 1 221.9 1 821.8 1 896.9 2 519.5 2 587.2 2 672.4 2 719.8 2 755.9 3 136.9
Current accounts
(covering the minimum
reserve system) 745.9 702.2 838.9 626.1 792.4 2 073.4 1 221.9 1 821.8 1 896.9 2 519.5 2 587.2 2 672.4 2 719.8 2 755.9 3 136.9
Deposit facility 0 0 0 0 0 350.0 0 0 0 0 0 0 0 0 0
Fixed-term deposits 0 0 0 0 0 0 0 0 0 0 0 0 0 0 0
Fine-tuning reverse
operations 0 0 0 0 0 0 0 0 0 0 0 0 0 0 0
Deposits related to
margin calls 0 0 0 0 0 0 0 0 0 0 0 0 0 0 0
Other liabilities to euro
area credit institutions
denominated in euro 0 0 0 0 4.4 0.5 0 3.8 0 4.8 0 0.7 2.7 10.5 1.1
Liabilities to other euro
area residents denominated
in euro 129.1 147.0 135.9 166.4 180.2 126.9 95.4 83.2 88.6 59.0 45.1 71.7 95.5 95.2 84.2
General government 69.2 77.0 67.9 87.2 103.7 50.9 38.8 28.2 34.0 33.2 20.2 47.4 28.2 28.4 16.9
Other liabilities 60.0 70.0 68.0 79.1 76.5 76.0 56.5 55.0 54.6 25.7 24.9 24.3 67.3 66.8 67.3
Liabilities to non-euro area
residents denominated in
euro 5.2 28.9 5.4 23.2 73.7 24.0 27.3 14.7 10.4 11.6 5.0 5.8 20.6 18.6 2.1
Liabilities to euro area
residents denominated in
foreign currency 138.6 139.3 142.6 143.9 142.2 144.6 150.7 152.3 156.9 152.5 153.2 153.7 155.0 152.1 151.5
Liabilities to non-euro area
residents denominated in
foreign currency 0 0 0 0 0 0 0 0 0 2.4 0 0 0 3.8 0.2
Intra-Eurosystem liabilities 2 429.6 2 429.8 2 395.1 2 548.7 2 304.5 797.0 2 735.3 2 212.2 2 386.9 1 983.2 2 207.6 2 330.8 2 450.2 2 587.4 2 502.9
Other liabilities 141.0 143.6 179.3 143.2 117.9 180.1 314.9 236.9 265.2 227.5 245.3 231.5 231.1 226.0 224.1
Capital and reserves 463.7 472.7 476.1 483.9 490.5 478.9 496.2 494.5 503.2 479.3 480.7 468.9 472.2 478.2 488.5
Total liabilities 7 733.1 7 748.2 7 857.6 7 832.9 7 824.1 8 024.5 8 740.9 8 729.2 9 053.0 9 222.2 9 526.5 9 774.8 10 041.6 10 213.1 10 469.0
6.

60
AGGREGATED BALANCE SHEET OF MFIs (EXCLUDING LATVIJAS BANKA)
(at end of period; millions of euro)
2014 2015
VII VIII IX X XI XII I II III IV V VI VII VIII IX
ASSETS
Loans to euro area
residents 17 582.5 17 546.9 17 668.8 17 789.0 17 796.9 19 600.1 17 872.3 17 836.4 17 766.6 18 321.8 18 707.2 18 481.3 18 506.5 18 319.5 18 789.9
General
government 29.4 29.2 28.6 29.8 30.8 58.1 79.0 79.5 79.0 78.1 79.6 79.5 78.3 77.7 79.0
Other residents 13 301.6 13 322.4 13 340.5 13 309.1 13 295.4 13 005.2 13 103.1 13 004.1 12 983.8 12 958.4 13 013.1 12 961.9 12 915.9 12 974.6 12 996.8
MFIs 4 251.5 4 195.4 4 299.7 4 450.2 4 470.7 6 536.8 4 690.2 4 752.8 4 703.8 5 285.3 5 614.5 5 439.9 5 512.2 5 267.2 5 714.1
Holdings of
securities other than
shares issued by
euro area residents 1 795.7 1 804.0 1 744.2 1 723.1 1 696.8 1 764.4 1 981.2 2 022.7 1 786.3 1 919.3 1 946.4 1 972.1 1 926.7 1 931.5 1 887.4
General
government 1 071.9 1 076.3 1 042.8 1 015.4 946.0 834.0 1 026.8 1 077.2 1 005.2 1 233.6 1 206.4 1 196.3 1 186.6 1 172.9 1 130.3
Other residents 245.4 247.6 180.3 177.5 191.1 292.0 280.4 268.7 159.3 146.7 136.9 139.7 109.9 110.5 108.8
MFIs 478.5 480.1 521.1 530.3 559.8 638.4 674.0 676.7 621.8 539.0 603.0 636.2 630.1 648.1 648.3
Holdings of money
market fund shares
or units issued by
euro area residents 4.3 4.4 4.6 4.6 4.6 4.7 5.0 0.5 0.5 0.5 0.5 0.5 0 0 0
Holdings of shares/
other equity issued
by euro area
residents 620.5 620.5 636.9 653.6 667.2 644.8 713.7 725.4 715.3 713.4 715.9 719.9 717.5 720.5 740.8
External1 assets 8 112.0 8 161.8 8 540.9 8 531.6 8 919.2 7 800.6 9 148.8 9 328.9 9 832.6 9 115.2 9 194.8 9 193.9 9 235.0 9 263.3 9 145.8
Fixed assets 125.4 125.6 125.6 124.7 124.1 126.0 125.1 123.9 137.9 138.7 140.2 140.1 139.7 140.2 139.1
Remaining assets 791.3 779.6 753.5 796.6 800.6 912.0 918.9 888.3 999.4 1 044.5 975.9 911.6 936.4 890.8 893.3
Total assets 29 031.8 29 042.9 29 474.5 29 623.3 30 009.4 30 852.6 30 765.0 30 926.1 31 238.6 31 253.4 31 681.0 31 419.5 31 461.8 31 265.8 31 596.3
LIABILITIES
Currency in
circulation x x x x x x x x x x x x x x x
Deposits of euro
area residents 13 471.6 13 472.1 13 623.5 13 547.8 13 638.3 13 941.3 13 342.0 13 343.8 13 540.5 13 729.8 13 794.7 13 901.1 13 713.2 13 616.6 13 912.2
Central
government 1 306.1 1 316.4 1 405.1 1 382.5 1 315.7 1 087.9 469.1 413.9 434.5 573.2 653.2 659.8 527.0 583.8 968.1
Other residents 10 197.3 10 340.1 10 354.9 10 361.6 10 524.4 10 891.1 10 761.1 10 941.6 10 958.9 11 055.3 11 035.7 11 062.9 11 132.8 11 172.0 11 316.3
MFIs 1 968.2 1 815.7 1 863.5 1 803.6 1 798.2 1 962.3 2 111.8 1 988.3 2 147.1 2 101.3 2 105.8 2 178.4 2 053.4 1 860.8 1 627.7
Money market fund
shares or units held
by euro area
residents 65.2 65.2 63.3 60.2 56.8 45.4 28.5 17.9 15.7 13.4 11.3 5.9 0 0 0
Debt securities
issued with a
maturity of over
2 years held by euro
area residents 18.1 19.0 19.2 20.4 20.5 40.3 40.8 53.7 59.1 59.7 63.9 63.5 64.0 42.0 42.2
Capital and reserves 2 928.3 2 957.9 2 941.5 3 050.4 3 073.4 3 053.6 3 087.2 3 133.2 2 987.5 3 056.1 3 130.7 3 143.1 3 170.4 3 195.3 3 246.7
External1 liabilities 10 880.6 10 834.2 11 203.6 11 276.7 11 541.7 12 217.4 12 703.0 12 814.5 12 875.5 12 709.2 12 984.5 12 625.2 12 923.6 12 830.3 12 790.8
Remaining
liabilities 1 668.1 1 694.4 1 623.3 1 667.8 1 678.6 1 554.6 1 563.5 1 563.0 1 760.3 1 685.2 1 695.9 1 680.7 1 590.5 1 581.6 1 604.5
Total liabilities 29 031.8 29 042.9 29 474.5 29 623.3 30 009.4 30 852.6 30 765.0 30 926.1 31 238.6 31 253.4 31 681.0 31 419.5 31 461.8 31 265.8 31 596.3
1 Non-euro area countries.
7.

61
CONSOLIDATED BALANCE SHEET OF MFIs
(at end of period; millions of euro)
2014 2015
VII VIII IX X XI XII I II III IV V VI VII VIII IX
ASSETS
Loans to residents 12 931.4 12 957.2 12 970.6 12 908.9 12 891.3 12 628.2 12 647.1 12 581.2 12 549.6 12 520.3 12 583.0 12 539.3 12 503.6 12 547.7 12 535.9
General government 29.4 29.2 28.6 29.8 30.8 58.1 79.0 79.5 79.0 78.1 79.6 79.5 78.3 77.7 79.0
Other residents 12 902.0 12 928.1 12 942.0 12 879.1 12 860.5 12 570.1 12 568.1 12 501.7 12 470.6 12 442.2 12 503.4 12 459.8 12 425.3 12 469.9 12 457.0
Holdings of securities
other than shares
issued by other
residents 749.9 741.7 758.2 731.8 732.7 719.1 798.0 835.0 927.5 1 153.1 1 369.7 1 421.0 1 411.8 1 405.5 1 346.9
General government 713.5 705.7 721.2 694.7 696.9 682.3 759.0 800.6 892.4 1 135.3 1 351.9 1 399.4 1 390.3 1 384.5 1 326.0
Other residents 36.4 36.0 37.0 37.1 35.8 36.8 39.0 34.4 35.1 17.8 17.7 21.6 21.5 21.0 21.0
Holdings of shares
and other equity
issued by other
residents 527.1 526.7 541.3 557.8 565.9 583.1 572.9 580.0 558.1 555.9 556.7 562.3 560.7 555.1 575.2
Foreign assets 20 622.9 20 702.5 20 999.1 21 477.2 21 696.0 21 264.9 23 083.2 22 744.7 23 155.4 22 475.6 22 945.4 22 769.6 23 121.7 23 022.6 23 319.7
Fixed assets 167.1 167.5 167.3 166.2 165.2 166.2 165.1 163.6 177.4 178.0 179.5 179.2 178.6 178.9 177.6
Remaining assets 446.9 442.3 429.9 424.9 420.4 489.6 425.4 397.0 439.9 426.1 398.0 425.3 394.2 408.9 399.5
Total assets 35 445.3 35 537.9 35 866.5 36 266.7 36 471.5 35 851.0 37 691.7 37 301.5 37 807.9 37 308.9 38 032.3 37 896.8 38 170.6 38 118.7 38 354.9
LIABILITIES
Currency outside
MFIs 3 609.4 3 615.6 3 615.3 3 636.4 3 652.6 3 746.3 3 552.6 3 576.6 3 593.6 3 616.5 3 672.3 3 702.5 3 756.0 3 743.8 3 736.6
Deposits of central
government 1 513.1 1 531.9 1 614.6 1 612.9 1 560.8 1 282.6 657.7 593.4 624.5 758.1 825.6 859.8 709.4 763.3 1 135.5
Deposits of other
general government
and other residents 9 189.4 9 292.0 9 241.2 9 284.7 9 413.1 9 733.0 9 530.4 9 661.2 9 733.0 9 754.9 9 740.0 9 793.9 9 965.0 10 019.9 10 080.5
Money market fund
shares and units 64.6 64.6 62.8 59.7 56.2 44.8 28.0 17.4 15.2 12.8 10.7 5.4 0 0 0
Debt securities issued1 440.8 449.9 468.4 516.0 487.3 63.2 60.7 58.0 63.3 63.9 71.8 69.4 81.1 58.4 58.1
Capital and rezerves 3 392.0 3 430.6 3 417.6 3 534.3 3 563.9 3 532.5 3 583.4 3 627.8 3 490.7 3 535.4 3 611.4 3 612.0 3 642.6 3 673.5 3 735.2
External liabilities1 15 808.4 15 719.4 16 022.7 16 199.4 16 248.3 16 092.4 18 746.3 18 231.3 18 566.2 17 929.6 18 462.5 18 204.4 18 454.9 18 292.3 18 032.5
Remaining liabilities 1 435.6 1 441.8 1 437.2 1 436.3 1 501.4 1 372.6 1 546.5 1 535.7 1 721.7 1 636.1 1 636.7 1 649.2 1 562.4 1 568.0 1 576.6
Excess of inter-MFI
liabilities –8.0 –8.0 –13.4 –12.9 –12.2 –16.4 –13.9 0.1 –0.3 1.6 1.3 0.1 –0.8 –0.5 –0.2
Total liabilities 35 445.3 35 537.9 35 866.5 36 266.7 36 471.5 35 851.0 37 691.7 37 301.5 37 807.9 37 308.9 38 032.3 37 896.8 38 170.6 38 118.7 38 354.9
1 The debt securities issued are presented in accordance with the residence of a holder, i.a. in the position "External liabili ties" or "Debt securities issued" starting with December 2014.
8.

62
AGGREGATED BALANCE SHEET OF MFIs (EXCLUDING LATVIJAS BANKA )
(at end of period; millions of euro)
2014 2015
VII VIII IX X XI XII I II III IV V VI VII VIII IX
MFI reserves 919.4 876.4 1 012.2 792.7 964.5 2 635.0 1 411.4 1 998.9 2 092.0 2 729.7 2 761.8 2 854.9 2 905.0 2 944.7 3 326.2
Vault cash in euro 173.5 174.3 173.3 166.6 172.1 211.3 189.5 177.1 195.1 210.2 174.6 182.5 185.2 188.8 189.2
Deposits with
Latvijas Banka 745.9 702.2 838.9 626.1 792.4 2 423.7 1 221.9 1 821.8 1 896.9 2 519.5 2 587.2 2 672.4 2 719.8 2 755.9 3 136.9
Foreign assets 12 939.5 13 004.2 13 216.3 13 712.8 13 940.1 13 369.4 14 482.5 14 168.8 14 404.8 13 738.5 14 098.5 13 732.5 13 819.6 13 549.1 13 643.0
Claims on the central
government 719.6 711.5 726.4 699.6 707.2 718.0 799.5 828.2 846.3 915.5 940.4 961.4 951.1 945.1 888.9
Loans 6.4 6.1 5.5 5.2 10.6 36.6 53.1 52.9 52.6 51.9 52.7 52.9 51.7 51.0 51.8
Holdings of
securities other
than shares 713.2 705.4 720.9 694.5 696.6 681.3 746.4 775.3 793.7 863.6 887.8 908.5 899.4 894.1 837.1
Claims on the local
government 23.3 23.4 23.4 24.9 20.4 21.7 26.2 26.9 26.7 26.5 27.2 26.9 26.9 27.1 27.4
Loans 23.0 23.1 23.1 24.6 20.1 21.4 25.9 26.6 26.4 26.2 26.9 26.6 26.6 26.7 27.1
Holdings of
securities other
than shares 0.3 0.3 0.3 0.3 0.3 0.3 0.3 0.3 0.3 0.3 0.3 0.3 0.3 0.3 0.3
Claims on the
financial institutions 980.0 987.1 1 018.3 1 048.0 1 044.3 1 060.9 1 039.6 1 041.2 1 034.6 1 046.4 1 076.2 1 135.4 1 117.3 1 071.9 1 023.6
Loans 535.5 542.9 566.4 579.6 569.1 569.0 555.8 554.4 568.9 600.5 628.6 678.0 662.5 631.7 636.3
Holdings of
securities other
than shares 18.5 18.5 20.0 20.0 18.7 20.5 22.7 18.2 18.9 1.4 1.3 1.3 1.3 1.2 1.5
Holdings of shares
and other equity 426.0 425.6 431.9 448.4 456.5 471.4 461.2 468.7 446.8 444.5 446.3 456.0 453.4 439.0 385.7
Claims on public
non-financial
corporations 744.5 743.1 731.6 721.5 709.3 678.3 657.0 655.4 653.5 670.3 664.6 663.5 660.0 677.9 681.8
Loans 740.8 739.8 728.8 718.6 706.5 676.1 654.9 653.3 651.5 665.8 660.1 657.6 654.2 672.6 676.7
Holdings of
securities other
than shares 3.7 3.3 2.8 2.9 2.9 2.1 2.1 2.1 2.0 4.5 4.5 5.9 5.8 5.3 5.0
Holdings of shares
and other equity 0 0 0 0 0 0 0 0 0 0 0 0 0 0 0
Claims on private
non-financial
corporations 5 966.9 6 016.0 6 020.1 5 974.2 5 995.7 5 828.4 5 865.9 5 832.3 5 797.6 5 743.8 5 793.3 5 731.6 5 733.1 5 818.5 5 888.9
Loans 5 851.6 5 900.7 5 896.4 5 850.5 5 872.0 5 702.5 5 740.0 5 706.7 5 672.1 5 620.5 5 670.9 5 610.9 5 611.4 5 688.0 5 685.0
Holdings of
securities other
than shares 14.2 14.2 14.2 14.2 14.2 14.1 14.2 14.2 14.2 11.9 11.9 14.4 14.4 14.4 14.4
Holdings of shares
and other equity 101.1 101.1 109.4 109.4 109.4 111.7 111.7 111.4 111.3 111.3 110.5 106.3 107.3 116.0 189.5
Claims on
households 5 774.1 5 744.7 5 750.4 5 730.3 5 712.9 5 622.5 5 617.4 5 587.3 5 578.1 5 555.4 5 543.7 5 513.3 5 497.1 5 477.7 5 458.9
Loans 5 774.1 5 744.7 5 750.4 5 730.3 5 712.9 5 622.5 5 617.4 5 587.3 5 578.1 5 555.4 5 543.7 5 513.3 5 497.1 5 477.7 5 458.9
Holdings of
securities other
than shares 0 0 0 0 0 0 0 0 0 0 0 0 0 0 0
Fixed assets 125.4 125.6 125.6 124.7 124.1 126.0 125.1 123.9 137.9 138.7 140.2 140.1 139.7 140.2 139.1
Other assets 444.8 440.2 427.8 422.9 418.4 488.3 423.1 393.9 436.0 422.2 392.0 417.8 385.6 398.8 369.9
Claims on resident
MFIs 393.7 370.2 421.9 371.1 372.0 303.7 316.9 268.8 230.5 265.9 242.3 241.5 226.3 214.9 148.7
Holdings of MFI
securities other than
shares 0 0 0 0 0 0 0 0 0 0 0 0 0 0 0
Money market fund
shares and units 0.5 0.5 0.5 0.5 0.5 0.5 0.5 0.5 0.5 0.5 0.5 0.5 0 0 0
Holdings of MFI
shares and other
equity 0 0 0 0 0 0 0 0 0 0 0 0 0 0 0
TOTAL ASSETS 29 031.8 29 042.9 29 474.5 29 623.3 30 009.4 30 852.6 30 765.0 30 926.1 31 238.6 31 253.4 31 681.0 31 419.5 31 461.8 31 265.8 31 596.3
9.a

63
AGGREGATED BALANCE SHEET OF MFIs (EXCLUDING LATVIJAS BANKA)
(at end of period; millions of euro)
2014 2015
VII VIII IX X XI XII I II III IV V VI VII VIII IX
Overnight deposits in
euro 5 886.6 5 945.4 5 869.3 5 903.8 5 983.4 6 312.7 6 150.6 6 219.8 6 244.4 6 267.9 6 273.2 6 338.0 6 493.8 6 511.0 6 591.0
Financial institutions 346.1 372.3 269.4 265.3 295.9 402.9 375.1 398.8 349.2 322.7 355.1 392.4 420.2 448.8 432.9
Public non-financial
corporations 302.5 309.1 314.8 318.6 306.8 283.7 287.2 295.5 333.3 357.3 382.3 348.3 357.4 358.8 322.7
Private non-financial
corporations 2 259.5 2 290.3 2 261.6 2 274.8 2 298.6 2 464.5 2 355.3 2 380.5 2 417.9 2 364.7 2 323.1 2 339.5 2 433.5 2 429.1 2 552.1
Households 2 978.5 2 973.7 3 023.5 3 045.1 3 082.0 3 161.6 3 133.0 3 145.0 3 144.1 3 223.3 3 212.7 3 257.8 3 282.7 3 274.3 3 283.3
Time deposits in euro 1 711.0 1 689.0 1 704.8 1 654.1 1 671.5 1 609.8 1 520.8 1 521.6 1 502.4 1 533.6 1 452.9 1 495.9 1 408.1 1 390.8 1 346.2
Financial institutions 301.2 295.0 311.7 283.8 289.5 285.4 284.3 258.6 250.5 258.7 249.2 265.7 258.9 269.6 255.1
Public non-financial
corporations 182.2 181.3 175.5 159.5 146.9 120.7 58.9 58.8 80.5 62.9 45.7 49.1 50.9 61.9 69.4
Private non-financial
corporations 251.2 236.2 237.5 217.3 252.5 251.4 253.8 296.9 266.5 314.9 277.3 313.6 249.3 231.8 192.7
Households 976.3 976.6 980.0 993.6 982.7 952.2 923.8 907.3 904.9 897.1 880.7 867.5 848.9 827.5 828.9
Deposits redeemable at
notice in euro 496.7 499.5 508.2 522.7 536.2 632.8 639.1 655.2 637.7 656.0 646.7 642.0 662.1 665.5 674.9
Financial institutions 4.9 3.1 2.5 7.2 14.4 21.1 21.5 14.8 1.8 1.6 1.1 1.1 0.9 1.1 1.1
Public non-financial
corporations 13.4 13.6 13.9 14.1 14.3 13.3 0.8 15.3 15.9 25.2 21.7 13.7 19.2 19.2 22.3
Private non-financial
corporations 42.2 38.1 39.1 40.5 36.9 59.1 60.3 56.5 46.8 50.6 41.2 37.8 41.7 42.9 41.7
Households 436.2 444.7 452.8 460.9 470.6 539.3 556.5 568.6 573.1 578.6 582.7 589.4 600.3 602.4 609.8
Repos in euro 0 0 0 0 0 0 0 0 0 0 0 0 0 0 0
Foreign currency
deposits of residents 823.8 863.3 876.6 908.2 922.2 921.5 965.3 994.5 1 055.0 1 035.4 1 083.9 1 057.6 1 105.3 1 136.7 1 153.6
Financial institutions 35.5 45.1 38.7 55.7 52.2 60.3 57.1 64.5 51.3 78.6 70.7 56.3 56.4 87.4 84.0
Public non-financial
corporations 5.9 5.8 7.4 9.7 9.3 8.0 6.2 7.1 7.8 7.9 7.4 6.7 9.0 8.6 9.1
Private non-financial
corporations 265.5 276.6 287.6 290.4 312.6 300.0 314.2 323.8 381.1 342.7 390.1 375.7 408.0 412.4 438.7
Households 516.9 535.8 542.9 552.3 548.1 553.2 587.8 599.1 614.8 606.1 615.8 619.0 631.9 628.3 621.8
Deposits of central
government 1 305.3 1 315.6 1 404.0 1 381.8 1 314.9 1 087.2 468.2 412.9 433.6 572.3 652.2 658.8 526.1 582.9 967.1
Overnight deposits in
euro 46.9 25.7 136.7 130.5 178.2 204.4 134.6 195.7 214.6 364.9 371.2 344.5 280.4 333.6 435.7
Time deposits in euro 1 250.1 1 283.1 1 260.5 1 245.5 1 130.7 877.0 315.6 190.5 174.6 181.1 246.9 282.1 215.3 218.4 498.9
Deposits redeemable
at notice and repos in
euro 2.6 2.6 2.6 2.6 1.9 1.7 13.2 22.2 39.4 22.0 29.1 26.6 24.5 24.2 27.6
Foreign currency
deposits 5.7 4.2 4.2 3.2 4.1 4.1 4.8 4.5 5.0 4.3 5.0 5.5 6.0 6.7 4.9
Deposits of local
government 212.0 226.1 214.8 218.5 223.2 180.3 198.1 215.1 238.9 236.4 258.4 236.0 228.3 249.2 247.5
Overnight deposits in
euro 208.1 222.3 210.7 214.4 219.3 176.4 194.1 211.4 235.3 232.8 254.8 232.5 221.4 242.3 238.2
Time deposits in euro 0.4 0.4 0.4 0.4 0.7 0.7 0.7 0.4 0.3 0.3 0.3 0.3 3.8 3.8 6.1
Deposits redeemable
at notice and repos in
euro 3.5 3.5 3.7 3.7 3.2 3.2 3.2 3.2 3.2 3.2 3.2 3.2 3.1 3.1 3.1
Foreign currency
deposits 0 0 0.1 0.1 0.1 0.1 0.1 0.1 0.1 0.1 0.1 0.1 0.1 0.1 0.1
9.b

64
AGGREGATED BALANCE SHEET OF MFIs (EXCLUDING LATVIJAS BANKA) (CONT.)
(at end of period; millions of euro)
2014 2015
VII VIII IX X XI XII I II III IV V VI VII VIII IX
Foreign liabilities1 13 338.1 13 223.9 13 549.9 13 590.4 13 857.3 15 216.3 15 870.4 15 965.8 16 106.0 15 918.1 16 206.3 15 837.9 15 952.5 15 648.9 15 507.2
Liabilities to Latvijas
Banka 6.0 6.0 31.0 25.0 25.0 85.5 85.5 85.5 160.5 170.5 170.5 200.5 201.5 200.5 235.5
Money market fund
shares and units 65.2 65.2 63.3 60.2 56.8 45.4 28.5 17.9 15.7 13.4 11.3 5.9 0 0 0
Debt securities issued1 440.8 449.9 468.4 516.0 487.3 63.2 60.7 58.0 63.3 63.9 71.8 69.4 81.1 58.4 58.1
Capital and reserves 2 928.3 2 957.9 2 941.5 3 050.4 3 073.4 3 053.6 3 087.2 3 133.2 2 987.5 3 056.1 3 130.7 3 143.1 3 170.4 3 195.3 3 246.7
Residents 1 011.6 1 035.9 1 019.6 1 128.4 1 144.5 1 382.6 1 413.9 1 459.9 1 019.5 968.2 1 041.4 1 053.2 1 080.5 1 101.8 1 145.1
Retained earnings of
the reporting year 212.3 242.2 241.4 276.7 302.9 312.8 33.0 64.7 104.9 148.9 192.4 220.6 258.2 290.5 315.0
Non-residents 1 916.7 1 922.0 1 922.0 1 922.0 1 929.0 1 671.0 1 673.3 1 673.3 1 968.0 2 087.9 2 089.3 2 089.9 2 089.9 2 093.5 2 101.5
Provisions 1 043.6 1 044.6 1 044.2 1 035.4 1 029.9 946.3 947.9 942.5 950.7 946.1 943.1 933.2 934.7 929.1 922.8
Other liabilities (incl.
subordinated liabilities) 388.9 394.1 389.9 398.6 468.4 410.3 439.8 434.9 612.6 516.3 536.3 559.3 472.3 483.3 497.1
Liabilities to resident
MFIs 385.4 362.3 408.5 358.2 359.8 287.7 302.9 269.1 230.2 267.5 243.6 241.7 225.5 214.3 148.6
TOTAL LIABILITIES 29 031.8 29 042.9 29 474.5 29 623.3 30 009.4 30 852.6 30 765.0 30 926.1 31 238.6 31 253.4 31 681.0 31 419.5 31 461.8 31 265.8 31 596.3
Memo items
Trust assets 1 452.3 1 447.8 1 499.1 1 513.1 1 461.4 1 523.3 1 555.4 1 576.0 1 582.7 1 557.9 1 675.6 1 716.0 1 744.6 1 595.7 1 555.4
Foreign 1 303.2 1 300.0 1 358.7 1 377.5 1 327.8 1 347.6 1 375.0 1 425.8 1 436.8 1 414.5 1 529.7 1 572.2 1 601.8 1 453.2 1 415.0
Domestic 149.1 147.8 140.5 135.6 133.6 175.7 180.4 150.2 145.9 143.4 145.9 143.8 142.8 142.4 140.4
Trust liabilities 1 452.3 1 447.8 1 499.1 1 513.1 1 461.4 1 523.2 1 555.2 1 575.9 1 582.7 1 557.8 1 675.6 1 716.0 1 744.6 1 595.7 1 555.4
Foreign 1 361.8 1 357.9 1 409.3 1 422.7 1 371.2 1 420.8 1 449.7 1 468.2 1 483.6 1 460.8 1 575.6 1 616.7 1 645.1 1 507.4 1 467.9
Domestic 90.5 89.9 89.8 90.4 90.2 102.3 105.5 107.7 99.1 97.0 100.0 99.2 99.5 88.2 87.5
9.b
1 The debt securities issued are presented in accordance with the residence of a holder, i.a. in the position "External liabili ties" or "Debt securities issued" starting with December 2014.

65
MONETARY SURVEY OF MFIs (EXCLUDING LATVIJAS BANKA)
(at end of period; millions of euro)
Overnight deposits (resident) Deposits with agreed maturity and redeemable at notice (resident) Total
Households Financial
institutions and
private
non-financial
corporations
Public
non-financial
corporations
Households Financial
institutions and
private
non-financial
corporations
Public
non-financial
corporations
2014
VII 6 454.4 3 286.3 2 861.4 306.7 2 463.8 1 621.7 644.9 197.2 8 918.1
VIII 6 548.0 3 297.2 2 937.5 313.3 2 449.2 1 633.5 619.2 196.5 8 997.2
IX 6 471.9 3 348.6 2 804.4 318.9 2 487.0 1 650.7 643.7 192.6 8 959.0
X 6 542.8 3 379.6 2 838.8 324.4 2 446.0 1 672.3 596.2 177.5 8 988.8
XI 6 631.4 3 417.7 2 901.6 312.2 2 481.9 1 665.9 650.9 165.2 9 113.4
XII 6 959.0 3 492.2 3 179.3 287.6 2 517.7 1 714.1 665.4 138.1 9 476.7
2015
I 6 840.6 3 488.1 3 061.7 290.8 2 435.2 1 712.9 659.9 62.3 9 275.8
II 6 914.0 3 508.8 3 107.5 297.7 2 477.0 1 711.2 686.8 79.0 9 391.0
III 6 990.5 3 516.7 3 137.8 336.0 2 449.0 1 720.2 627.3 101.5 9 439.5
IV 7 015.0 3 598.6 3 055.7 360.7 2 477.9 1 706.5 678.8 92.6 9 492.9
V 7 055.9 3 593.3 3 077.4 385.1 2 400.8 1 698.6 630.3 71.9 9 456.7
VI 7 072.8 3 647.6 3 074.6 350.5 2 460.7 1 686.0 707.5 67.2 9 533.5
VII 7 268.4 3 685.1 3 223.3 360.1 2 401.0 1 678.8 645.8 76.5 9 669.4
VIII 7 327.9 3 681.7 3 285.1 361.1 2 376.0 1 650.8 637.8 87.4 9 703.9
IX 7 415.6 3 682.0 3 409.0 324.6 2 350.2 1 662.0 589.3 98.9 9 765.8
Net foreign
assets
Net domestic assets Total
Credit to residents Other items (net)
General
government
(net)
Households Financial
institutions and
private
non-financial
corporations
Public
non-financial
corporations
2014
VII –398.6 12 691.1 –774.4 5 774.1 6 946.9 744.5 –3 374.4 9 316.7 8 918.1
VIII –219.7 12 683.9 –806.9 5 744.7 7 003.0 743.1 –3 467.0 9 216.9 8 997.2
IX –333.6 12 651.3 –869.0 5 750.4 7 038.3 731.6 –3 358.7 9 292.6 8 959.0
X 122.3 12 598.2 –875.7 5 730.3 7 022.1 721.5 –3 731.7 8 866.5 8 988.8
XI 82.8 12 651.8 –810.4 5 712.9 7 040.0 709.3 –3 621.2 9 030.6 9 113.4
XII –1 847.9 12 662.4 –527.7 5 622.5 6 889.3 678.3 –1 337.8 11 324.6 9 476.7
2015
I –1 388.0 13 339.4 159.5 5 617.4 6 905.5 657.0 –2 675.6 10 663.8 9 275.8
II –1 797.0 13 343.3 227.1 5 587.3 6 873.5 655.4 –2 155.3 11 188.0 9 391.0
III –1 701.1 13 264.3 200.5 5 578.1 6 832.2 653.5 –2 123.7 11 140.6 9 439.5
IV –2 179.6 13 149.2 133.3 5 555.4 6 790.2 670.3 –1 476.7 11 672.5 9 492.9
V –2 107.8 13 134.8 57.0 5 543.7 6 869.5 664.6 –1 570.3 11 564.5 9 456.7
VI –2 105.4 13 137.3 93.5 5 513.3 6 867.0 663.5 –1 498.4 11 638.9 9 533.5
VII –2 132.8 13 231.1 223.6 5 497.1 6 850.4 660.0 –1 428.9 11 802.2 9 669.4
VIII –2 099.9 13 186.0 140.0 5 477.7 6 890.4 677.9 –1 382.2 11 803.8 9 703.9
IX –1 864.2 12 754.9 –298.3 5 458.9 6 912.5 681.8 –1 124.9 11 630.0 9 765.8
10.

66
FOREIGN ASSETS AND LIABILITIES OF MFIs (EXCLUDING LATVIJAS BANKA)
(at end of period; millions of euro)
2014 2015
VII VIII IX X XI XII I II III IV V VI VII VIII IX
Claims on MFIs 8 306.8 8 360.1 8 654.2 8 886.2 9 066.9 8 400.8 9 006.7 8 471.4 8 183.3 7 342.6 7 710.8 7 527.9 7 547.6 7 358.1 7 655.8
Loans
Overnight 4 939.7 4 579.1 5 154.1 5 281.2 5 501.5 5 211.5 5 376.7 4 919.6 4 883.6 4 731.6 5 013.9 4 965.6 5 017.6 5 047.3 5 340.3
Short-term 2 227.4 2 641.7 2 258.5 2 288.3 2 208.3 1 770.9 2 197.2 2 081.3 1 762.5 1 174.8 1 183.3 1 036.0 1 020.0 808.1 840.2
Long-term 39.0 36.6 42.7 31.3 31.4 41.3 43.4 31.3 23.4 22.6 22.8 24.2 21.6 21.5 19.7
Redeemable
at notice 0 0 0 0 0 67.3 0 3.0 0 0 0 11.0 11.0 11.0 11.0
Holdings of
securities
other than
shares 1 013.1 1 015.0 1 111.0 1 127.9 1 168.2 1 165.8 1 245.1 1 294.3 1 372.5 1 265.7 1 342.5 1 347.1 1 337.4 1 336.0 1 309.1
Holdings of
shares and
other equity 4.9 5.0 5.2 5.2 5.2 5.3 5.5 1.1 1.2 1.2 1.3 1.3 1.3 1.2 1.2
Other claims 82.7 82.7 82.7 152.3 152.3 138.8 138.8 140.8 140.0 146.8 147.0 142.9 138.7 133.0 134.3
Claims on
non-MFIs 4 412.5 4 422.5 4 368.2 4 577.7 4 619.9 4 709.7 5 128.2 5 342.0 5 811.3 5 944.9 5 938.8 5 851.7 5 866.1 5 849.3 5 607.4
Loans
Short-term 655.4 668.8 596.5 717.6 735.9 712.1 787.3 806.8 839.5 842.1 902.9 872.4 892.4 915.4 921.9
Long-term 1 140.8 1 162.1 1 188.2 1 261.5 1 259.7 1 286.6 1 318.5 1 315.5 1 368.9 1 341.4 1 328.3 1 290.0 1 293.1 1 275.3 1 318.2
Holdings of
securities
other than
shares
General
government
sector 1 748.2 1 651.2 1 610.4 1 611.6 1 605.6 1 629.6 1 838.1 2 022.1 2 222.9 2 427.4 2 307.1 2 305.5 2 314.3 2 360.6 2 053.6
Private
sector 760.9 832.0 863.0 874.8 901.8 1 005.1 1 072.3 1 084.0 1 253.7 1 207.3 1 271.1 1 259.1 1 246.3 1 170.5 1 188.8
Holdings of
shares and
other equity 58.3 59.5 60.9 63.0 61.6 28.7 64.4 66.0 69.1 67.5 69.3 66.1 63.4 60.3 60.6
Other claims 49.0 49.0 49.2 49.2 55.4 47.6 47.6 47.6 57.1 59.2 60.1 58.6 56.7 67.1 64.3
Vault cash in
foreign
currencies 47.1 56.5 41.5 41.8 43.2 45.4 41.2 38.2 42.2 38.9 39.6 41.6 40.3 38.4 45.6
Other assets
Other assets 173.0 165.1 152.4 207.0 210.1 212.5 306.3 317.3 368.0 412.1 409.3 311.3 365.6 303.3 334.2
Total foreign
assets 12 939.5 13 004.2 13 216.3 13 712.8 13 940.1 13 368.4 14 482.5 14 168.9 14 404.8 13 738.5 14 098.5 13 732.5 13 819.6 13 549.1 13 643.0
Memo items
Trust assets 1 303.2 1 300.0 1 358.7 1 377.5 1 327.8 1 347.6 1 375.0 1 425.8 1 436.8 1 414.5 1 529.7 1 572.2 1 601.8 1 453.2 1 415.0
11.a

67
SELECTED ITEMS IN THE MONTHLY FINANCIAL POSITION REPORT OF MFIs (EXCLUDING LATVIJAS BANKA) BY
GROUP OF COUNTRIES
(excluding Latvia; at end of period; millions of euro)
Claims on MFIs Loans to non-MFIs Liabilities to MFIs Deposits by non-MFIs
EU Other
countries and
international
institutions
EU Other
countries and
international
institutions
EU Other
countries and
international
institutions
EU Other
countries and
international
institutions
incl. euro area
countries
incl. euro
area countries
incl. euro area
countries
incl. euro area
countries
2014
VII 5 488.1 3 111.9 1 718.1 762.1 399.7 1 034.1 2 574.4 1 576.8 715.9 3 056.9 1 068.0 6 788.4
VIII 5 562.3 3 123.0 1 695.1 758.7 394.3 1 072.2 2 385.5 1 447.4 720.3 3 153.2 1 117.5 6 742.7
IX 5 509.8 3 039.0 1 945.5 664.5 398.5 1 120.2 2 394.5 1 424.0 725.8 3 273.7 1 182.1 7 001.0
X 5 822.0 3 453.0 1 778.8 817.5 430.0 1 161.6 2 400.9 1 420.4 721.9 3 289.1 1 155.1 6 982.5
XI 5 893.4 3 306.3 1 847.8 811.5 434.9 1 184.1 2 466.1 1 413.4 720.3 3 445.5 1 188.6 7 080.7
XII 5 079.7 3 809.4 2 012.1 796.1 435.2 1 202.7 2 635.7 1 589.2 743.0 3 665.0 1 234.8 7 561.3
2015
I 5 910.9 3 151.4 1 706.4 830.3 535.0 1 275.5 2 784.3 1 723.4 744.6 3 853.1 1 288.1 7 870.5
II 5 308.8 2 662.2 1 726.3 801.5 502.4 1 320.8 2 683.9 1 633.7 740.5 3 935.1 1 336.4 7 932.0
III 4 998.6 2 576.4 1 671.0 823.4 513.2 1 385.0 2 706.9 1 756.4 699.7 3 926.3 1 281.4 8 065.9
IV 4 140.7 2 499.9 1 788.2 819.4 516.1 1 364.0 2 545.4 1 663.3 745.7 3 928.6 1 327.0 7 980.7
V 4 425.7 2 785.0 1 794.2 808.1 509.7 1 423.1 2 629.0 1 691.6 777.6 3 918.8 1 321.6 8 167.6
VI 4 224.3 2 526.0 1 812.4 777.1 502.1 1 385.3 2 714.7 1 736.2 747.7 3 939.5 1 294.3 7 807.2
VII 4 302.1 2 566.1 1 768.1 760.6 490.7 1 424.8 2 590.5 1 626.4 770.6 3 923.8 1 236.0 7 990.9
VIII 4 042.5 2 296.4 1 845.3 798.5 504.6 1 392.3 2 462.5 1 446.0 753.3 3 850.8 1 219.8 7 902.8
IX 4 377.9 2 428.5 1 833.3 831.9 539.8 1 408.2 2 425.5 1 243.7 722.7 3 883.2 1 304.1 7 798.7
FOREIGN ASSETS AND LIABILITIES OF MFIs (EXCLUDING LATVIJAS BANKA)
(at end of period; millions of euro)
2014 2015
VII VIII IX X XI XII I II III IV V VI VII VIII IX
Liabilities to MFIs
Overnight 531.4 516.3 553.1 547.5 468.0 384.5 733.5 681.1 642.1 322.0 692.4 545.7 341.5 402.7 335.1
Short-term 409.0 268.1 458.4 482.0 663.8 1 049.1 1 088.0 1 203.6 1 304.7 1 583.3 1 333.9 1 543.1 1 746.1 1 580.8 1 581.8
Long-term 2 349.9 2 321.4 2 108.7 2 093.4 2 054.6 1 945.1 1 707.4 1 539.6 1 459.7 1 385.8 1 380.3 1 373.5 1 273.6 1 232.7 1 231.3
Redeemable at
notice 0 0 0 0 0 0 0 0 0 0 0 0 0 0 0
Of which
liabilities to
associated and
affiliated MFIs 3 200.0 3 024.0 3 049.7 3 055.7 3 122.5 3 303.3 3 457.4 3 356.2 3 342.0 3 240.5 3 323.8 3 381.9 3 280.3 3 158.8 3 109.5
Non-MFI deposits
Overnight 8 886.6 8 932.7 9 301.9 9 290.2 9 570.8 10 213.5 10 746.0 10 878.3 10 987.0 10 894.2 11 083.0 10 775.5 10 964.8 10 801.5 10 727.7
Short-term 368.3 356.6 338.9 349.7 322.8 329.1 290.9 295.2 286.7 297.4 267.0 244.0 216.9 218.1 215.4
Long-term 510.6 523.9 540.5 541.5 538.9 556.0 578.0 588.4 615.8 622.7 639.0 632.4 633.5 633.0 638.8
Redeemable at
notice 79.7 82.6 93.4 90.3 93.6 127.8 108.6 105.2 102.6 95.1 97.3 94.8 99.5 101.0 100.1
Other liabilities
Other liabilities1 202.5 222.3 155.0 195.9 144.8 611.2 618.0 674.3 707.3 717.8 713.3 628.9 676.6 679.2 677.1
Total foreign
liabilities2 13 338.1 13 223.9 13 549.9 13 590.4 13 857.3 15 216.3 15 870.4 15 965.7 16 106.0 15 918.1 16 206.3 15 837.9 15 952.5 15 648.9 15 507.2
Memo items
Trust liabilities 1 361.8 1 357.9 1 409.3 1 422.7 1 371.2 1 420.8 1 449.7 1 468.2 1 483.6 1 460.8 1 575.6 1 616.7 1 645.1 1 507.4 1 467.9
1 Including subordinated liabilities.
2 The debt securities issued are presented in accordance with residence of a holder starting with December 2014.
11.b
12.

68
MATURITY PROFILE OF DEPOSITS OF RESIDENT FINANCIAL INSTITUTIONS, NON-FINANCIAL CORPORATIONS AND
HOUSEHOLDS
(at end of period; millions of euro)
2014 2015
VII VIII IX X XI XII I II III IV V VI VII VIII IX
Overnight deposits
Amount 6 454.4 6 548.0 6 471.9 6 542.8 6 631.4 6 959.0 6 840.6 6 914.0 6 990.5 7 015.0 7 055.9 7 072.8 7 268.4 7 327.9 7 415.6
%1 72.4 72.8 72.2 72.8 72.8 73.4 73.7 73.6 74.1 73.9 74.6 74.2 75.2 75.5 75.9
Time deposits
Maturity of 1–6 months
Amount 458.1 417.1 419.9 383.4 428.2 372.4 305.8 346.0 353.1 313.8 281.4 312.5 254.3 237.6 235.2
%1 5.1 4.6 4.7 4.3 4.7 3.9 3.3 3.7 3.7 3.3 3.0 3.3 2.6 2.4 2.4
Maturity of 6–12 months
Amount 892.1 908.1 934.4 899.1 885.5 860.4 831.2 826.1 786.8 817.9 782.7 793.9 765.3 762.0 727.6
%1 10.0 10.1 10.4 10.0 9.7 9.1 9.0 8.8 8.3 8.6 8.3 8.3 7.9 7.9 7.5
Long-term
Amount 576.2 583.6 581.7 599.5 591.6 600.1 602.6 593.4 612.5 633.2 632.2 653.1 659.4 654.5 656.5
%1 6.5 6.4 6.5 6.7 6.5 6.3 6.5 6.3 6.5 6.7 6.7 6.9 6.8 6.7 6.7
Maturity of
1–2 years
Amount 267.6 274.0 268.0 270.9 262.7 267.4 266.8 259.1 278.6 303.8 303.8 325.0 330.4 324.2 324.1
%1 3.0 3.0 3.0 3.0 2.9 2.8 2.9 2.8 3.0 3.2 3.2 3.4 3.4 3.3 3.3
Maturity of over
2 years
Amount 308.5 309.7 313.8 328.6 328.9 332.7 335.7 334.3 333.9 329.4 328.5 328.1 329.0 330.3 332.4
%1 3.5 3.4 3.5 3.7 3.6 3.5 3.6 3.6 3.5 3.5 3.5 3.4 3.4 3.4 3.4
Deposits redeemable at notice
Up to 3 months
Amount 532.8 535.7 546.2 559.3 571.9 679.9 690.5 706.5 691.6 707.8 699.4 696.1 716.8 716.8 725.8
%1 5.9 6.0 6.1 6.1 6.2 7.2 7.4 7.5 7.3 7.4 7.3 7.2 7.4 7.4 7.4
Over 3 months
Amount 4.7 4.6 4.7 4.7 4.6 4.7 5.0 5.1 5.1 5.1 5.1 5.2 5.2 5.1 5.1
%1 0.1 0.1 0.1 0.1 0.1 0.1 0.1 0.1 0.1 0.1 0.1 0.1 0.1 0.1 0.1
Repos
Amount 0 0 0 0 0 0 0 0 0 0 0 0 0 0 0
%1 0 0 0 0 0 0 0 0 0 0 0 0 0 0 0
Total deposits 8 918.1 8 997.2 8 959.0 8 988.8 9 113.4 9 476.7 9 275.8 9 391.1 9 439.5 9 492.8 9 456.7 9 533.5 9 669.4 9 703.9 9 765.7
1 As percent of total deposits of resident financial institutions, non-financial corporations and households.
13.
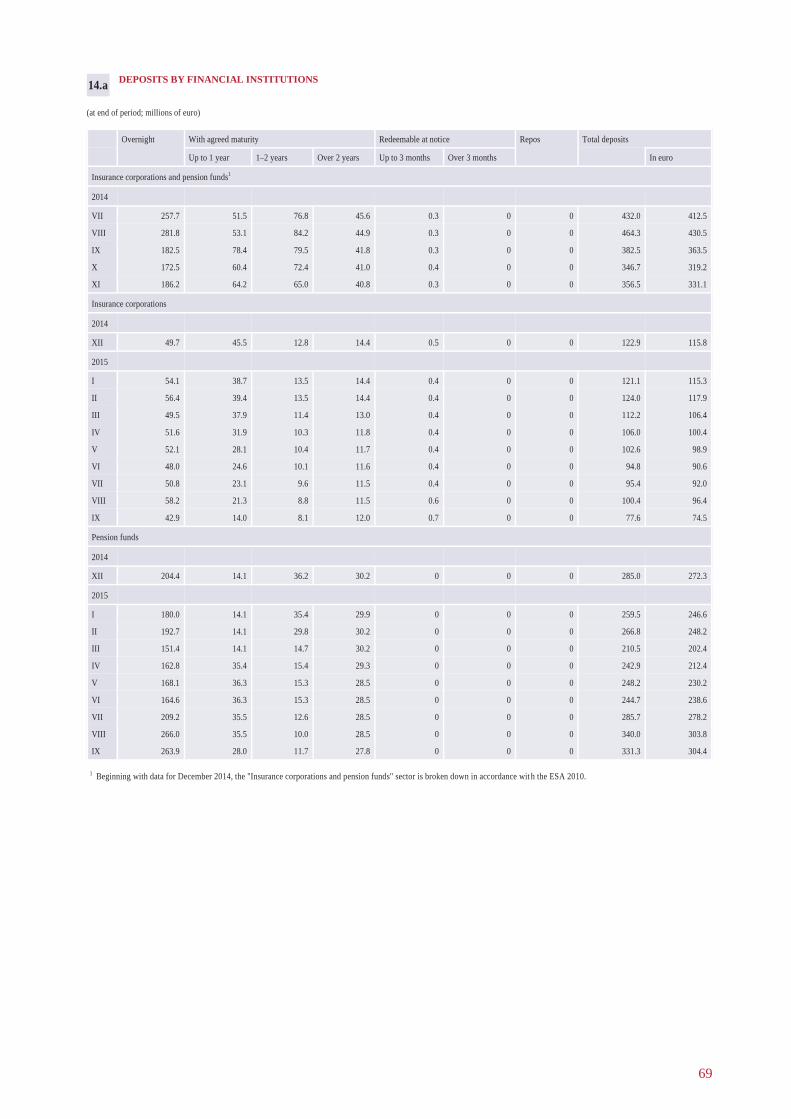
69
DEPOSITS BY FINANCIAL INSTITUTIONS
(at end of period; millions of euro)
Overnight With agreed maturity Redeemable at notice Repos Total deposits
Up to 1 year 1–2 years Over 2 years Up to 3 months Over 3 months In euro
Insurance corporations and pension funds1
2014
VII 257.7 51.5 76.8 45.6 0.3 0 0 432.0 412.5
VIII 281.8 53.1 84.2 44.9 0.3 0 0 464.3 430.5
IX 182.5 78.4 79.5 41.8 0.3 0 0 382.5 363.5
X 172.5 60.4 72.4 41.0 0.4 0 0 346.7 319.2
XI 186.2 64.2 65.0 40.8 0.3 0 0 356.5 331.1
Insurance corporations
2014
XII 49.7 45.5 12.8 14.4 0.5 0 0 122.9 115.8
2015
I 54.1 38.7 13.5 14.4 0.4 0 0 121.1 115.3
II 56.4 39.4 13.5 14.4 0.4 0 0 124.0 117.9
III 49.5 37.9 11.4 13.0 0.4 0 0 112.2 106.4
IV 51.6 31.9 10.3 11.8 0.4 0 0 106.0 100.4
V 52.1 28.1 10.4 11.7 0.4 0 0 102.6 98.9
VI 48.0 24.6 10.1 11.6 0.4 0 0 94.8 90.6
VII 50.8 23.1 9.6 11.5 0.4 0 0 95.4 92.0
VIII 58.2 21.3 8.8 11.5 0.6 0 0 100.4 96.4
IX 42.9 14.0 8.1 12.0 0.7 0 0 77.6 74.5
Pension funds
2014
XII 204.4 14.1 36.2 30.2 0 0 0 285.0 272.3
2015
I 180.0 14.1 35.4 29.9 0 0 0 259.5 246.6
II 192.7 14.1 29.8 30.2 0 0 0 266.8 248.2
III 151.4 14.1 14.7 30.2 0 0 0 210.5 202.4
IV 162.8 35.4 15.4 29.3 0 0 0 242.9 212.4
V 168.1 36.3 15.3 28.5 0 0 0 248.2 230.2
VI 164.6 36.3 15.3 28.5 0 0 0 244.7 238.6
VII 209.2 35.5 12.6 28.5 0 0 0 285.7 278.2
VIII 266.0 35.5 10.0 28.5 0 0 0 340.0 303.8
IX 263.9 28.0 11.7 27.8 0 0 0 331.3 304.4
1 Beginning with data for December 2014, the "Insurance corporations and pension funds" sector is broken down in accordance wit h the ESA 2010.
14.a
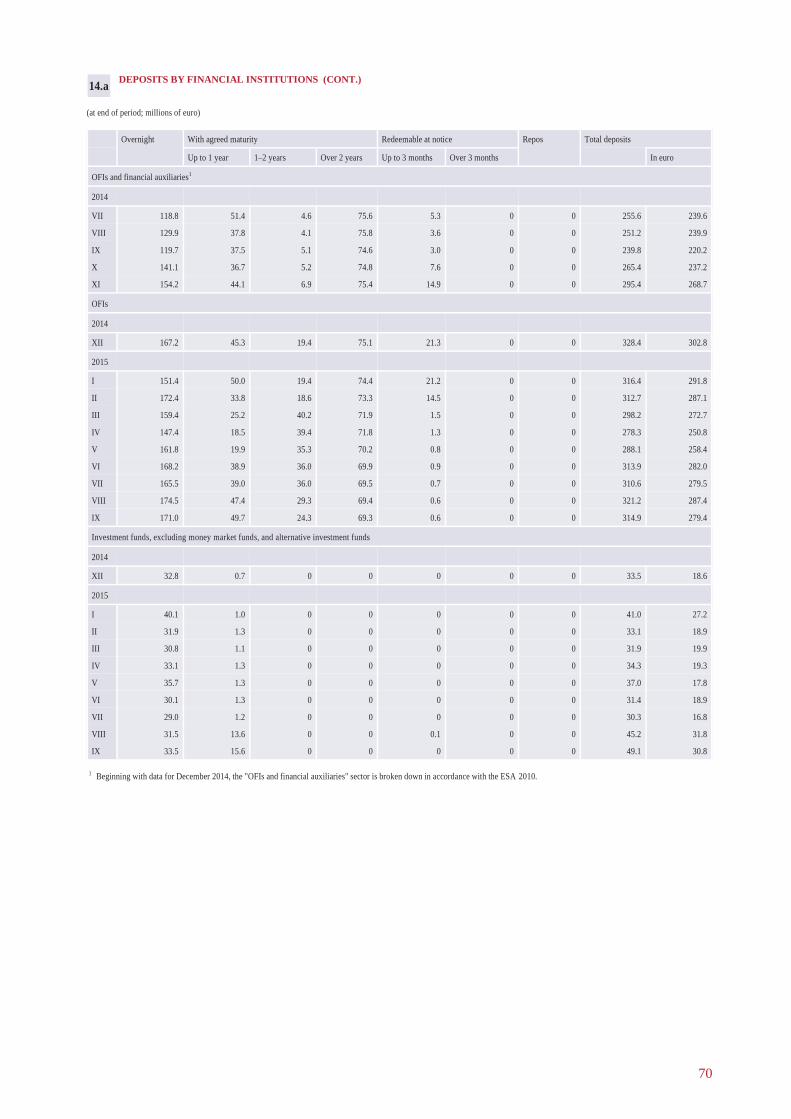
70
DEPOSITS BY FINANCIAL INSTITUTIONS (CONT.)
(at end of period; millions of euro)
Overnight With agreed maturity Redeemable at notice Repos Total deposits
Up to 1 year 1–2 years Over 2 years Up to 3 months Over 3 months In euro
OFIs and financial auxiliaries1
2014
VII 118.8 51.4 4.6 75.6 5.3 0 0 255.6 239.6
VIII 129.9 37.8 4.1 75.8 3.6 0 0 251.2 239.9
IX 119.7 37.5 5.1 74.6 3.0 0 0 239.8 220.2
X 141.1 36.7 5.2 74.8 7.6 0 0 265.4 237.2
XI 154.2 44.1 6.9 75.4 14.9 0 0 295.4 268.7
OFIs
2014
XII 167.2 45.3 19.4 75.1 21.3 0 0 328.4 302.8
2015
I 151.4 50.0 19.4 74.4 21.2 0 0 316.4 291.8
II 172.4 33.8 18.6 73.3 14.5 0 0 312.7 287.1
III 159.4 25.2 40.2 71.9 1.5 0 0 298.2 272.7
IV 147.4 18.5 39.4 71.8 1.3 0 0 278.3 250.8
V 161.8 19.9 35.3 70.2 0.8 0 0 288.1 258.4
VI 168.2 38.9 36.0 69.9 0.9 0 0 313.9 282.0
VII 165.5 39.0 36.0 69.5 0.7 0 0 310.6 279.5
VIII 174.5 47.4 29.3 69.4 0.6 0 0 321.2 287.4
IX 171.0 49.7 24.3 69.3 0.6 0 0 314.9 279.4
Investment funds, excluding money market funds, and alternative investment funds
2014
XII 32.8 0.7 0 0 0 0 0 33.5 18.6
2015
I 40.1 1.0 0 0 0 0 0 41.0 27.2
II 31.9 1.3 0 0 0 0 0 33.1 18.9
III 30.8 1.1 0 0 0 0 0 31.9 19.9
IV 33.1 1.3 0 0 0 0 0 34.3 19.3
V 35.7 1.3 0 0 0 0 0 37.0 17.8
VI 30.1 1.3 0 0 0 0 0 31.4 18.9
VII 29.0 1.2 0 0 0 0 0 30.3 16.8
VIII 31.5 13.6 0 0 0.1 0 0 45.2 31.8
IX 33.5 15.6 0 0 0 0 0 49.1 30.8
1 Beginning with data for December 2014, the "OFIs and financial auxiliaries" sector is broken down in accordance with the ESA 2010.
14.a

71
DEPOSITS BY NON-FINANCIAL CORPORATIONS
(at end of period; millions of euro)
Overnight With agreed maturity Redeemable at notice Repos Total deposits
Up to 1 year 1–2 years Over 2 years Up to 3 months Over 3 months In euro
Public non-financial corporations
2014
VII 306.7 182.9 0.1 0.8 13.4 0 0 504.0 498.1
VIII 313.3 182.0 0.1 0.8 13.6 0 0 509.8 504.0
IX 319.0 177.9 0.1 0.8 13.9 0 0 511.6 504.1
X 324.4 162.6 0.1 0.8 14.1 0 0 501.9 492.2
XI 312.2 150.6 0.1 0.2 14.3 0 0 477.3 468.0
XII 287.6 124.5 0.1 0.2 13.3 0 0 425.7 417.6
2015
I 290.8 61.3 0.1 0.2 0.8 0 0 353.1 346.9
II 297.7 63.4 0.1 0.2 15.3 0 0 376.7 369.6
III 336.0 85.3 0.1 0.2 15.9 0 0 437.5 429.7
IV 360.7 67.1 0.1 0.2 25.2 0 0 453.3 445.4
V 385.1 50.0 0.1 0.2 21.7 0 0 457.0 449.6
VI 350.5 53.3 0.1 0.2 13.7 0 0 417.8 411.1
VII 360.1 57.0 0.1 0.2 19.2 0 0 436.5 427.5
VIII 361.1 64.1 3.9 0.2 19.2 0 0 448.5 439.9
IX 324.6 72.5 3.9 0.2 22.3 0 0 423.5 414.4
Private non-financial corporations
2014
VII 2 484.9 253.7 20.5 16.1 43.5 0 0 2 818.6 2 553.0
VIII 2 525.8 241.5 18.6 15.8 39.3 0 0 2 841.1 2 564.5
IX 2 502.2 251.3 14.6 17.4 40.4 0 0 2 825.8 2 538.3
X 2 525.2 220.8 15.1 20.0 41.7 0 0 2 822.9 2 532.5
XI 2 561.1 269.3 11.7 20.5 38.0 0 0 2 900.6 2 588.0
XII 2 725.2 248.1 20.3 21.1 60.3 0 0 3 075.0 2 775.0
2015
I 2 636.2 241.8 22.9 21.1 61.6 0 0 2 983.6 2 669.4
II 2 654.1 301.0 24.1 20.5 58.0 0 0 3 057.8 2 733.9
III 2 746.8 273.7 23.2 20.3 48.4 0 0 3 112.4 2 731.2
IV 2 660.9 309.7 30.1 20.1 52.1 0 0 3 072.9 2 730.2
V 2 659.7 278.9 30.5 19.9 42.7 0 0 3 031.8 2 641.6
VI 2 663.7 327.2 46.0 19.5 40.9 0 0 3 097.3 2 720.1
VII 2 768.7 266.2 48.2 19.3 44.6 0 0 3 147.0 2 738.2
VIII 2 754.9 248.5 48.0 19.0 45.7 0 0 3 116.1 2 703.7
IX 2 897.7 226.5 38.5 18.1 44.5 0 0 3 225.2 2 786.5
14.b
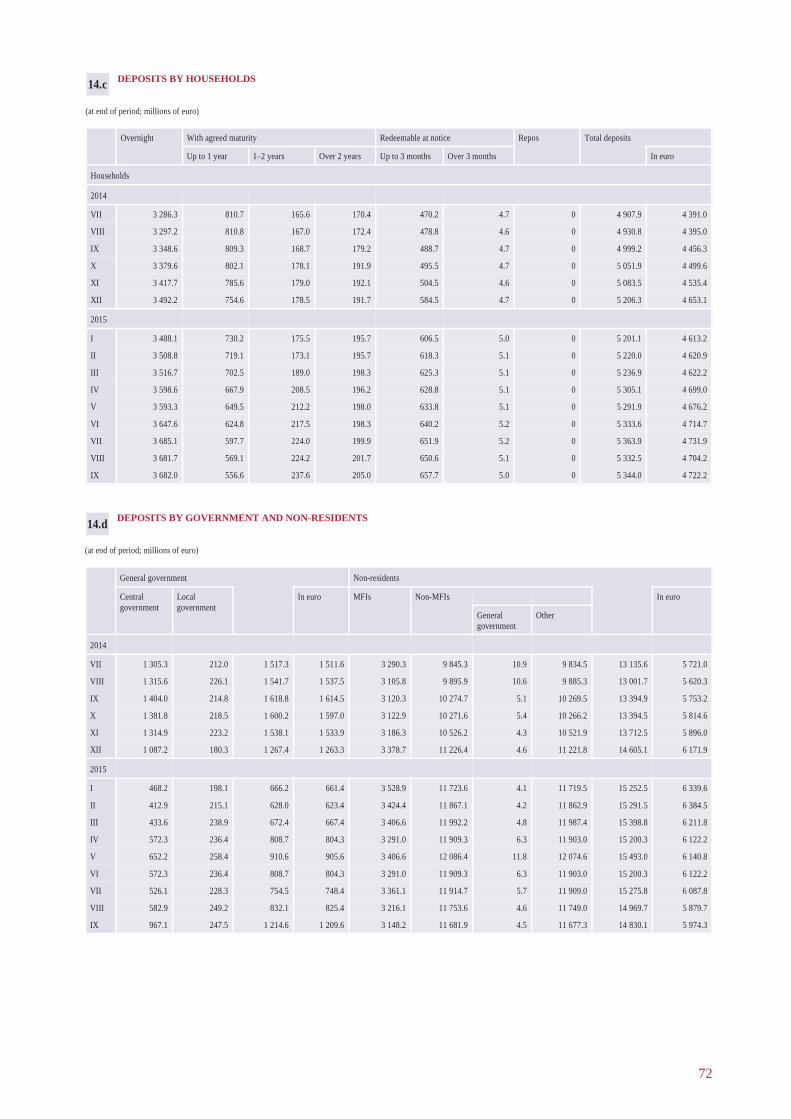
72
DEPOSITS BY GOVERNMENT AND NON-RESIDENTS
(at end of period; millions of euro)
General government Non-residents
Central
government
Local
government
In euro MFIs Non-MFIs In euro
General
government
Other
2014
VII 1 305.3 212.0 1 517.3 1 511.6 3 290.3 9 845.3 10.9 9 834.5 13 135.6 5 721.0
VIII 1 315.6 226.1 1 541.7 1 537.5 3 105.8 9 895.9 10.6 9 885.3 13 001.7 5 620.3
IX 1 404.0 214.8 1 618.8 1 614.5 3 120.3 10 274.7 5.1 10 269.5 13 394.9 5 753.2
X 1 381.8 218.5 1 600.2 1 597.0 3 122.9 10 271.6 5.4 10 266.2 13 394.5 5 814.6
XI 1 314.9 223.2 1 538.1 1 533.9 3 186.3 10 526.2 4.3 10 521.9 13 712.5 5 896.0
XII 1 087.2 180.3 1 267.4 1 263.3 3 378.7 11 226.4 4.6 11 221.8 14 605.1 6 171.9
2015
I 468.2 198.1 666.2 661.4 3 528.9 11 723.6 4.1 11 719.5 15 252.5 6 339.6
II 412.9 215.1 628.0 623.4 3 424.4 11 867.1 4.2 11 862.9 15 291.5 6 384.5
III 433.6 238.9 672.4 667.4 3 406.6 11 992.2 4.8 11 987.4 15 398.8 6 211.8
IV 572.3 236.4 808.7 804.3 3 291.0 11 909.3 6.3 11 903.0 15 200.3 6 122.2
V 652.2 258.4 910.6 905.6 3 406.6 12 086.4 11.8 12 074.6 15 493.0 6 140.8
VI 572.3 236.4 808.7 804.3 3 291.0 11 909.3 6.3 11 903.0 15 200.3 6 122.2
VII 526.1 228.3 754.5 748.4 3 361.1 11 914.7 5.7 11 909.0 15 275.8 6 087.8
VIII 582.9 249.2 832.1 825.4 3 216.1 11 753.6 4.6 11 749.0 14 969.7 5 879.7
IX 967.1 247.5 1 214.6 1 209.6 3 148.2 11 681.9 4.5 11 677.3 14 830.1 5 974.3
14.d
DEPOSITS BY HOUSEHOLDS
(at end of period; millions of euro)
Overnight With agreed maturity Redeemable at notice Repos Total deposits
Up to 1 year 1–2 years Over 2 years Up to 3 months Over 3 months In euro
Households
2014
VII 3 286.3 810.7 165.6 170.4 470.2 4.7 0 4 907.9 4 391.0
VIII 3 297.2 810.8 167.0 172.4 478.8 4.6 0 4 930.8 4 395.0
IX 3 348.6 809.3 168.7 179.2 488.7 4.7 0 4 999.2 4 456.3
X 3 379.6 802.1 178.1 191.9 495.5 4.7 0 5 051.9 4 499.6
XI 3 417.7 785.6 179.0 192.1 504.5 4.6 0 5 083.5 4 535.4
XII 3 492.2 754.6 178.5 191.7 584.5 4.7 0 5 206.3 4 653.1
2015
I 3 488.1 730.2 175.5 195.7 606.5 5.0 0 5 201.1 4 613.2
II 3 508.8 719.1 173.1 195.7 618.3 5.1 0 5 220.0 4 620.9
III 3 516.7 702.5 189.0 198.3 625.3 5.1 0 5 236.9 4 622.2
IV 3 598.6 667.9 208.5 196.2 628.8 5.1 0 5 305.1 4 699.0
V 3 593.3 649.5 212.2 198.0 633.8 5.1 0 5 291.9 4 676.2
VI 3 647.6 624.8 217.5 198.3 640.2 5.2 0 5 333.6 4 714.7
VII 3 685.1 597.7 224.0 199.9 651.9 5.2 0 5 363.9 4 731.9
VIII 3 681.7 569.1 224.2 201.7 650.6 5.1 0 5 332.5 4 704.2
IX 3 682.0 556.6 237.6 205.0 657.7 5.0 0 5 344.0 4 722.2
14.c

73
MATURITY PROFILE OF LOANS TO RESIDENT FINANCIAL INSTITUTIONS, NON-FINANCIAL CORPORATIONS AND
HOUSEHOLDS
(at end of period; millions of euro)
2014 2015
VII VIII IX X XI XII I II III IV V VI VII VIII IX
Short-term
Amount 2 026.3 2 039.4 2 036.0 2 027.3 2 021.2 1 829.1 1 853.5 1 853.6 1 868.8 1 841.4 1 853.3 1 850.3 1 784.7 1 822.1 1 773.2
%1 15.7 15.7 15.7 15.7 15.7 14.6 14.7 14.8 15.0 14.8 14.8 14.8 14.4 14.6 14.2
Maturity of 1–5 years
Amount 2 570.1 2 605.8 2 638.4 2 633.9 2 595.4 2 505.1 2 502.0 2 467.0 2 446.7 2 434.9 2 463.1 2 474.7 2 523.7 2 521.8 2 498.6
%1 19.9 20.2 20.4 20.5 20.2 19.9 19.9 19.7 19.6 19.6 19.7 19.9 20.3 20.2 20.1
Maturity of over 5 years
Amount 8 305.6 8 282.8 8 267.7 8 217.9 8 243.9 8 235.8 8 212.6 8 181.0 8 155.1 8 165.9 8 187.0 8 134.8 8 116.9 8 126.0 8 185.1
%1 64.4 64.1 63.9 63.8 64.1 65.5 65.4 65.5 65.4 65.6 65.5 65.3 65.3 65.2 65.7
Total loans 12 902.0 12 928.1 12 942.0 12 879.1 12 860.5 12 570.1 12 568.1 12 501.7 12 470.6 12 442.2 12 503.4 12 459.8 12 425.3 12 469.9 12 457.0
1 As percent of total loans to resident financial institutions, non-financial corporations and households.
15.

74
LOANS TO FINANCIAL INSTITUTIONS AND NON-FINANCIAL CORPORATIONS
(at end of period; millions of euro)
Insurance corporations and
pension funds
OFIs and financial auxiliaries Public non-financial corporations Private non-financial corporations
Up to
1 year
In euro Up to
1 year
In euro Up to
1 year
1–5
years
Over
5 years
In euro Up to
1 year
1–5
years
Over
5 years
In euro
2014
VII 0 0 0 203.9 535.5 509.9 4.4 76.6 659.8 740.8 522.3 1 384.3 1 930.0 2 537.3 5 851.6 5 662.9
VIII 0 0 0 207.3 542.9 516.7 6.8 75.5 657.4 739.8 520.7 1 397.1 1 963.0 2 540.6 5 900.7 5 706.1
IX 0 0 0 208.2 566.4 538.8 7.5 78.4 643.0 728.8 508.5 1 401.6 1 980.0 2 514.9 5 896.5 5 680.3
X 0 0 0 212.8 579.6 552.5 6.2 79.2 633.3 718.6 501.3 1 389.9 1 966.5 2 494.2 5 850.5 5 639.8
XI 0 0 0 203.8 569.1 544.4 4.7 79.9 621.9 706.5 490.1 1 403.9 1 921.2 2 546.9 5 872.0 5 658.9
XII1 0 0 0 x x x 11.8 69.9 594.4 676.1 471.3 1 245.3 1 847.4 2 609.8 5 702.5 5 503.9
2015
I 0 0 0 x x x 8.8 59.7 586.3 654.9 449.9 1 279.6 1 857.3 2 603.2 5 740.0 5 502.8
II 0 0 0 x x x 15.7 61.3 576.3 653.3 448.0 1 283.4 1 818.4 2 604.9 5 706.7 5 469.7
III 0 0 0 x x x 8.8 61.3 581.5 651.5 444.3 1 288.0 1 797.4 2 586.7 5 672.1 5 427.2
IV 0.2 0.2 0.2 x x x 7.7 60.8 597.3 665.8 459.3 1 263.2 1 758.1 2 599.2 5 620.5 5 393.5
V 0 0 0 x x x 8.6 60.1 591.4 660.1 453.5 1 257.8 1 776.8 2 636.3 5 670.9 5 444.4
VI 0.1 0.1 0.1 x x x 9.3 66.6 581.7 657.6 448.8 1 257.8 1 776.9 2 617.5 5 652.2 5 431.4
VII 0 0 0 x x x 10.4 66.6 577.2 654.2 449.1 1 202.0 1 823.9 2 623.2 5 649.1 5 444.0
VIII 0 0 0 x x x 10.6 70.8 591.2 672.6 470.2 1 239.8 1 820.7 2 627.5 5 688.0 5 470.0
IX 0 0 0 x x x 10.8 72.3 593.6 676.7 474.0 1 201.6 1 785.9 2 697.5 5 685.0 5 470.0
16.a
Investment funds, excluding money market funds, and alternative
investment funds
Other financial institutions
Up to 1 year In euro Up to 1 year 1–5 years Over 5 years In euro
2014
XII 0 0 0 197.0 284.5 87.4 568.9 541.6
2015
I 0 0 0 189.7 282.8 83.1 555.7 527.6
II 0 0.1 0 185.2 286.3 82.8 554.3 526.1
III 0 0.5 0 201.7 286.4 80.3 568.3 539.2
IV 0.2 0.2 0 205.6 313.8 80.6 600.1 555.3
V 0 0 0 222.3 324.1 82.2 628.6 582.4
VI 0.2 0.2 0 225.3 329.2 82.0 636.5 591.1
VII 0 0 0 218.9 329.6 76.4 624.8 578.9
VIII 0.2 0.2 0 223.8 331.9 75.7 631.4 586.7
IX 0 0 0 218.9 342.1 75.3 636.3 592.7
1 Beginning with data for December 2014, the "OFIs and financial auxiliaries" sector is broken down in accordance with the ESA 2010.

75
LOANS TO HOUSEHOLDS
(at end of period; millions of euro)
Households
Consumer credit Lending for house purchase Other lending In euro
Up to
1 year
1–5 years Over
5 years
Up to
1 year
1–5 years Over
5 years
Up to
1 year
1–5 years Over
5 years
2014
VII 509.3 200.9 126.2 182.3 4 847.4 168.0 125.7 4 553.7 417.3 64.8 59.8 292.7 5 774.1 5 608.5
VIII 511.4 201.2 128.8 181.4 4 821.6 163.7 123.6 4 534.3 411.7 63.4 59.7 288.5 5 744.7 5 578.6
IX 513.2 199.5 131.5 182.2 4 803.7 159.0 120.6 4 524.0 433.5 60.2 63.1 310.3 5 750.4 5 581.9
X 517.0 200.2 134.0 182.8 4 782.3 158.7 117.1 4 506.6 431.0 59.6 62.3 309.1 5 730.3 5 562.1
XI 514.9 197.2 135.1 182.7 4 767.7 155.4 114.5 4 497.8 430.3 56.1 61.5 312.7 5 712.9 5 545.6
XII 436.9 152.7 124.5 159.7 4 723.1 149.0 116.2 4 457.9 462.5 73.3 62.6 326.7 5 622.5 5 453.9
2015
I 437.4 154.3 124.7 158.4 4 717.2 147.3 115.2 4 454.7 462.8 73.7 62.2 326.9 5 617.4 5 431.7
II 436.7 152.1 126.1 158.5 4 678.0 145.3 105.5 4 427.2 472.6 71.8 69.5 331.2 5 587.3 5 405.6
III 440.4 150.9 128.9 160.6 4 661.6 143.2 100.3 4 418.1 476.1 75.8 72.5 327.8 5 578.1 5 391.2
IV 442.8 149.4 132.1 161.3 4 641.6 139.6 97.7 4 404.2 471.1 75.5 72.4 323.2 5 555.4 5 372.8
V 446.9 150.2 135.5 161.1 4 629.5 138.3 96.2 4 395.0 467.4 76.1 70.4 321.0 5 543.7 5 360.1
VI 447.1 147.7 138.2 161.2 4 605.1 136.1 93.6 4 375.3 461.1 73.9 70.1 317.1 5 513.3 5 336.4
VII 450.7 146.7 142.4 161.6 4 587.2 133.6 91.4 4 362.3 459.2 73.2 69.8 316.2 5 497.1 5 323.5
VIII 453.7 146.8 144.2 162.6 4 568.7 130.3 91.4 4 347.0 455.3 70.6 62.8 322.0 5 477.7 5 310.2
IX 452.1 142.3 146.1 163.8 4 557.0 128.6 90.0 4 338.4 449.7 71.1 62.2 316.5 5 458.9 5 292.6
16.b
LOANS TO GOVERNMENT AND NON-RESIDENTS
(at end of period; millions of euro)
General government Non-residents
Central
government
Local
government
In euro MFIs Non-MFIs In euro
General
government
Other
2014
VII 6.4 23.0 29.4 29.4 7 206.1 1 796.1 0 1 796.1 9 002.2 3 898.4
VIII 6.1 23.1 29.2 29.2 7 257.4 1 830.9 0 1 830.9 9 088.3 4 112.4
IX 5.5 23.1 28.6 28.6 7 455.3 1 784.7 0 1 784.7 9 240.0 4 270.8
X 5.2 24.6 29.8 29.8 7 600.8 1 979.1 0 1 979.1 9 580.0 4 579.7
XI 10.6 20.1 30.8 30.8 7 741.2 1 995.7 0 1 995.7 9 736.9 4 642.3
XII 36.6 21.4 58.1 58.1 7 091.8 1 998.7 0 1 998.7 9 090.6 3 992.9
2015
I 53.1 25.9 79.0 79.0 7 617.3 2 105.8 0 2 105.8 9 723.1 4 394.8
II 52.9 26.6 79.5 79.5 7 035.1 2 122.3 0 2 122.3 9 157.4 3 922.9
III 52.6 26.4 79.0 79.0 6 669.6 2 208.4 0 2 208.4 8 878.0 3 861.3
IV 51.9 26.2 78.1 78.1 5 928.9 2 183.5 0 2 183.5 8 112.4 3 167.8
V 52.7 26.9 79.6 79.6 6 219.9 2 231.2 0 2 231.2 8 451.1 3 405.9
VI 52.9 26.6 79.5 79.5 6 036.7 2 162.4 0 2 162.4 8 199.1 3 344.7
VII 51.7 26.6 78.3 78.3 6 070.2 2 185.5 0 2 185.5 8 255.7 3 247.4
VIII 51.0 26.7 77.7 77.7 5 887.8 2 190.7 0 2 190.7 8 078.6 3 094.5
IX 51.8 27.1 79.0 79.0 6 211.3 2 240.1 0 2 240.1 8 451.4 3 349.2
16.c

76
LOANS TO FINANCIAL INSTITUTIONS AND NON-FINANCIAL CORPORATIONS IN THE NATIONAL ECONOMY
(at end of Q2 2015, millions of euro; structure, %)
With residual maturity of up to
1 year
With residual maturity of over
1 and up to 5 years
With residual maturity of over
5 years
Total loans
Amount % Of which
in euro
% Amount % Of which
in euro
% Amount % Of which
in euro
% Amount % Of which
in euro
%
2 175.9 100.0 2 045.8 100.0 3 774.3 100.0 3 501.0 100.0 995.4 100.0 924.5 100.0 6 945.6 100.0 6 471.3 100.0 Total
A Agriculture, forestry and
fishing 151.9 7.0 131.1 6.4 243.3 6.4 243.0 6.9 46.1 4.6 46.1 5.0 441.2 6.4 420.2 6.5
B Mining and quarrying 7.6 0.3 7.3 0.4 15.8 0.4 15.8 0.4 0 0 0 0 23.4 0.3 23.1 0.4
C Manufacturing 326.3 15.0 319.4 15.6 464.2 12.3 444.7 12.7 87.3 8.8 87.3 9.5 877.8 12.6 851.4 13.2
D Electricity, gas, steam
and air conditioning
supply 69.3 3.2 67.4 3.3 316.4 8.4 191.7 5.5 30.2 3.0 30.2 3.3 415.9 6.0 289.3 4.5
E Water supply; sewerage,
waste management and
remediation activities 11.0 0.5 11.0 0.5 37.1 1.0 37.1 1.1 37.1 3.7 37.1 4.0 85.1 1.2 85.2 1.3
F Construction 113.0 5.2 113.0 5.5 154.1 4.1 136.7 3.9 204.6 20.6 173.0 18.7 471.7 6.8 422.7 6.5
G Wholesale and retail
trade; repair of motor
vehicles and motorcycles 392.5 18.0 358.6 17.5 221.4 5.9 209.4 6.0 21.4 2.2 21.4 2.3 635.2 9.2 589.4 9.1
H Transportation and
storage 82.9 3.8 77.5 3.8 238.3 6.3 224.1 6.4 214.3 21.5 214.3 23.2 535.5 7.7 515.9 8.0
I Accommodation and
food service activities 32.3 1.5 32.3 1.6 83.1 2.2 83.1 2.4 11.1 1.1 11.1 1.2 126.6 1.8 126.5 2.0
J Information and
communication 4.8 0.2 4.8 0.2 59.5 1.6 58.3 1.7 6.8 0.7 6.8 0.7 71.1 1.0 69.9 1.1
K Financial and insurance
activities 230.4 10.6 211.8 10.4 514.1 13.6 464.5 13.3 3.6 0.4 3.0 0.3 748.1 10.8 679.3 10.5
L Real estate activities 657.7 30.2 643.6 31.5 1 275.9 33.8 1 241.7 35.5 220.3 22.1 181.5 19.6 2 153.9 31.0 2 066.8 31.9
M Professional, scientific
and technical activities 5.7 0.3 5.7 0.3 10.3 0.3 10.3 0.3 18.5 1.9 18.5 2.0 34.5 0.5 34.5 0.5
N Administrative and
support service activities 36.5 1.7 9.0 0.4 17.5 0.4 17.5 0.5 0.6 0.1 0.6 0.1 54.6 0.8 27.1 0.4
O Public administration
and defence; compulsory
social security 0.3 0 0.3 0 1.7 0 1.7 0 19.1 1.9 19.1 2.1 21.2 0.3 21.1 0.3
P Education 0.9 0 0.9 0 14.0 0.4 14.0 0.4 0.9 0.1 0.9 0.1 15.8 0.2 15.8 0.2
Q Human health and social
work activities 3.3 0.2 3.3 0.2 14.8 0.4 14.8 0.4 0.4 0 0.4 0 18.5 0.3 18.5 0.3
R Arts, entertainment and
recreation 4.5 0.2 4.5 0.2 7.1 0.2 6.8 0.2 4.4 0.4 4.4 0.5 16.0 0.2 15.7 0.2
S Other service activities 45.0 2.1 44.3 2.2 85.8 2.3 85.8 2.4 68.8 6.9 68.8 7.4 199.6 2.9 198.9 3.1
17.a

77
LOANS TO FINANCIAL INSTITUTIONS AND NON-FINANCIAL CORPORATIONS IN THE NATIONAL ECONOMY
(at end of Q3 2015, millions of euro; structure, %)
With residual maturity of up to
1 year
With residual maturity of over
1 and up to 5 years
With residual maturity of over
5 years
Total loans
Amount % Of which
in euro
% Amount % Of which
in euro
% Amount % Of which
in euro
% Amount % Of which
in euro
%
2 194.7 100.0 2 068.0 100.0 3 843.6 100.0 3 578.6 100.0 958.7 100.0 889.9 100.0 6 997.1 100.0 6 536.5 100.0 Total
A Agriculture, forestry
and fishing 137.6 6.3 116.5 5.6 243.1 6.3 242.7 6.8 47.4 4.9 47.4 5.3 428.2 6.1 406.6 6.2
B Mining and quarrying 9.9 0.4 9.7 0.5 13.0 0.3 13.0 0.4 0 0 0 0 22.9 0.3 22.7 0.4
C Manufacturing 287.3 13.1 277.4 13.4 498.5 13.0 482.7 13.5 53.1 5.5 53.1 6.0 838.9 12.0 813.2 12.4
D Electricity, gas, steam
and air conditioning
supply 77.2 3.5 74.5 3.6 305.4 7.9 187.5 5.2 29.1 3.0 29.1 3.3 411.7 5.9 291.1 4.5
E Water supply; sewerage,
waste management and
remediation activities 10.4 0.5 10.4 0.5 36.2 0.9 36.2 1.0 46.2 4.8 46.2 5.2 92.8 1.3 92.8 1.4
F Construction 98.1 4.5 98.1 4.7 146.4 3.8 129.3 3.6 190.7 19.9 159.7 17.9 435.1 6.2 387.1 5.9
G Wholesale and retail
trade; repair of motor
vehicles and
motorcycles 430.6 19.6 398.1 19.3 217.2 5.6 205.6 5.7 21.1 2.2 21.1 2.4 668.9 9.6 624.8 9.6
H Transportation and
storage 75.3 3.4 70.8 3.4 306.7 8.0 292.1 8.2 218.0 22.7 218.0 24.5 600.0 8.6 580.9 8.9
I Accommodation and
food service activities 32.3 1.5 32.3 1.6 83.6 2.2 83.6 2.3 10.8 1.1 10.8 1.2 126.7 1.8 126.7 1.9
J Information and
communication 3.5 0.2 3.5 0.2 59.6 1.6 58.5 1.6 7.2 0.8 7.2 0.8 70.3 1.0 69.2 1.1
K Financial and insurance
activities 210.3 9.6 188.9 9.1 541.9 14.1 488.8 13.7 3.1 0.3 2.5 0.3 755.3 10.8 680.2 10.4
L Real estate activities 720.4 32.8 706.7 34.2 1 209.3 31.5 1 175.9 32.9 224.1 23.4 187.0 21.0 2 153.7 30.8 2 069.6 31.7
M Professional, scientific
and technical activities 5.7 0.3 5.7 0.3 8.8 0.2 8.8 0.2 6.5 0.7 6.5 0.7 21.0 0.3 21.0 0.3
N Administrative and
support service
activities 28.6 1.3 8.4 0.4 37.6 1.0 37.6 1.1 1.4 0.2 1.4 0.2 67.6 1.0 47.4 0.7
O Public administration
and defence;
compulsory social
security 0.5 0 0.5 0 1.3 0 1.3 0 26.6 2.8 26.6 3.0 28.4 0.4 28.4 0.4
P Education 0.8 0 0.8 0 18.2 0.5 18.2 0.5 0.9 0.1 0.9 0.1 20.0 0.3 19.9 0.3
Q Human health and
social work activities 1.8 0.1 1.8 0.1 19.2 0.5 19.2 0.5 0.4 0 0.4 0 21.4 0.3 21.4 0.3
R Arts, entertainment and
recreation 5.3 0.2 5.0 0.2 6.5 0.2 6.5 0.2 4.4 0.5 4.4 0.5 16.3 0.2 15.9 0.3
S Other service activities 59.1 2.7 58.9 2.9 91.1 2.4 91.1 2.6 67.6 7.1 67.6 7.6 217.8 3.1 217.6 3.3
17.b
LENDING TO RESIDENT FINANCIAL INSTITUTIONS, NON-FINANCIAL CORPORATIONS AND HOUSEHOLDS
(at end of period; millions of euro)
2014 2015
III VI IX XII III1 VI IX
Commercial credit 2 212.3 2 269.8 2 339.3 2 200.7 2 259.5 2 201.6 2 225.8
Industrial credit 2 167.9 2 197.7 2 217.0 2 155.1 2 087.4 2 201.5 2 212.9
Reverse repo 0.6 0.3 0.3 2.1 2.7 1.3 2.2
Financial leasing 49.7 50.8 49.3 49.5 51.7 53.2 55.2
Consumer credit 324.7 328.3 335.9 329.9 322.7 343.2 348.8
Mortgage loans 7 024.0 6 946.5 6 859.5 6 757.1 6 667.2 6 562.5 6 506.5
Factoring 3.3 3.5 2.4 4.3 3.5 4.6 3.8
Other credit 1 188.0 1 102.8 1 116.2 1 075.1 1 096.6 1 102.7 1 109.6
Total loans 12 970.6 12 899.6 12 920.0 12 573.8 12 491.3 12 470.7 12 464.7
1 Data have been revised.
18.

78
HOLDINGS OF SHARES AND OTHER EQUITY
(at end of period; millions of euro)
Shares and other equity
MFIs Other residents Non-residents In euro
2014
VII 0.5 527.1 194.9 722.6 605.2
VIII 0.5 526.7 196.2 723.4 604.7
IX 0.5 541.3 198.0 739.9 615.4
X 0.5 557.8 269.7 828.0 693.3
XI 0.5 565.9 274.4 840.9 707.0
XII 0.5 583.1 220.3 804.0 702.7
2015
I 0.5 572.9 256.3 829.7 734.9
II 0.5 580.0 255.5 836.1 737.5
III 0.5 558.1 267.5 826.2 722.9
IV 0.5 555.9 274.7 831.1 733.4
V 0.5 556.7 277.7 835.0 734.8
VI 0.5 562.3 268.8 831.7 735.6
VII 0 560.7 260.1 820.8 727.0
VIII 0 555.1 261.6 816.7 727.2
IX 0 575.2 260.4 835.6 740.5
19.b
HOLDINGS OF SECURITIES OTHER THAN SHARES
(at end of period; millions of euro)
Securities other than shares
MFIs General government Other residents Non-residents In euro
incl. long-term incl. long-term incl. long-term incl. long-term
2014
VII 0 0 713.5 517.0 36.4 36.4 3 522.2 2 878.9 4 272.1 1 587.7
VIII 0 0 705.7 522.8 36.0 36.0 3 498.2 2 978.7 4 239.9 1 592.6
IX 0 0 721.2 554.5 37.0 37.0 3 584.5 3 134.7 4 342.7 1 519.4
X 0 0 694.7 555.0 37.1 37.1 3 614.3 3 180.1 4 346.1 1 493.3
XI 0 0 696.9 556.1 35.8 35.8 3 675.5 3 265.5 4 408.2 1 443.8
XII 0 0 681.6 571.0 36.8 36.8 3 800.5 3 490.6 4 519.0 1 310.1
2015
I 0 0 746.7 608.9 39.0 39.0 4 155.5 3 539.4 4 941.2 1 422.0
II 0 0 775.6 644.6 34.4 34.4 4 400.4 3 749.7 5 210.5 1 393.2
III 0 0 794.0 676.5 35.1 35.1 4 849.0 4 068.1 5 678.1 1 288.6
IV 0 0 863.9 741.0 17.8 17.8 4 900.4 3 923.1 5 782.1 1 461.3
V 0 0 888.1 778.1 17.7 17.7 4 920.8 4 169.1 5 826.6 1 395.2
VI 0 0 908.8 813.8 21.6 21.6 4 911.8 4 094.6 5 842.2 1 373.7
VII 0 0 899.7 829.4 21.5 21.5 4 898.0 4 097.0 5 819.2 1 336.5
VIII 0 0 894.4 824.4 21.0 21.0 4 867.2 4 103.2 5 782.6 1 335.7
IX 0 0 837.4 782.4 21.0 21.0 4 551.4 4 037.2 5 409.8 1 283.4
19.a

79
CURRENCY BREAKDOWN OF RESIDENT DEPOSITS
(at end of period)
MFIs Non-MFIs
Outstanding
amount (all
currencies;
millions of
euro)
Structure (%) Outstanding
amount (all
currencies;
millions of
euro)
Structure (%)
In euro In foreign currencies In euro In foreign currencies
incl. USD incl. JPY incl. CHF incl. GBP incl. USD incl. JPY incl. CHF incl. GBP
2014
VII 391.4 33.6 66.4 62.3 0 0.1 3.8 10 435.4 92.1 7.9 6.2 0 0.2 0.5
VIII 368.3 42.3 57.7 53.9 0 0.1 3.6 10 538.9 91.8 8.2 6.5 0 0.1 0.5
IX 439.5 33.7 66.3 63.9 0 0.1 2.0 10 577.8 91.7 8.3 6.6 0 0.1 0.5
X 383.2 42.3 57.7 51.2 0 0.1 6.1 10 589.0 91.4 8.6 6.8 0 0.1 0.5
XI 384.8 41.1 58.9 52.9 0 0.1 5.7 10 651.5 91.3 8.7 6.9 0 0.1 0.5
XII 373.2 49.1 50.9 43.3 0 0.1 5.2 10 744.1 91.4 8.6 6.8 0 0.1 0.5
2015
I 388.5 38.8 61.2 54.2 0 0.1 3.8 9 942.1 90.2 9.8 7.9 0 0.1 0.9
II 354.6 41.6 58.4 54.0 0 0.1 3.9 10 019.0 90.0 10.0 6.9 0 0.1 0.7
III 390.7 54.2 45.8 45.5 0 0.1 0.1 10 112.0 89.5 10.5 8.6 0 0.2 0.7
IV 438.0 51.9 48.1 46.6 0 0.1 1.3 10 301.5 89.9 10.1 8.2 0 0.2 0.7
V 414.1 55.0 45.0 43.8 0 0.2 0.9 10 367.3 89.5 10.5 8.6 0 0.2 0.7
VI 442.2 57.4 42.6 41.5 0 0.2 0.8 10 428.3 89.8 10.2 8.3 0 0.2 0.7
VII 427.0 57.4 42.6 39.2 0 0.2 3.1 10 423.9 89.3 10.7 8.7 0 0.2 0.7
VIII 414.8 57.4 42.6 39.1 0 0.2 3.1 10 536.0 89.1 10.9 8.7 0.1 0.2 0.8
IX 384.0 71.5 28.5 24.8 0 0.3 3.3 10 980.3 89.4 10.6 8.6 0.1 0.1 0.8
20.a
CURRENCY BREAKDOWN OF NON-RESIDENT DEPOSITS
(at end of period)
MFIs Non-MFIs
Outstanding
amount (all
currencies;
millions of
euro)
Structure (%) Outstanding
amount (all
currencies;
millions of
euro)
Structure (%)
In euro In foreign currencies In euro In foreign currencies
incl. USD incl. JPY incl. CHF incl. GBP incl. USD incl. JPY incl. CHF incl. GBP
2014
VII 3 290.3 86.9 13.1 3.7 0 1.9 1.6 9 845.3 29.1 70.9 65.0 0 0.5 1.7
VIII 3 105.8 86.6 13.4 3.5 0 2.0 1.7 9 895.9 29.6 70.4 64.8 0.1 0.6 1.6
IX 3 120.3 86.6 13.4 3.4 0 1.9 1.7 10 274.7 29.7 70.3 64.8 0 0.5 1.6
X 3 122.9 86.0 14.0 3.7 0 2.3 1.8 10 271.6 30.4 69.6 64.7 0.1 0.5 1.7
XI 3 186.3 85.9 14.1 4.1 0 2.3 1.7 10 526.2 30.0 70.0 65.1 0.1 0.5 1.7
XII 3 378.7 85.4 14.6 4.3 0 2.3 1.7 11 226.4 29.3 70.7 65.4 0.1 0.5 1.7
2015
I 3 528.9 87.0 13.0 4.3 0 2.3 1.6 11 723.6 27.9 72.1 66.3 0.1 0.5 1.6
II 3 424.4 87.5 12.5 3.8 0 1.9 1.6 11 867.1 28.6 71.4 65.2 0.1 0.4 1.6
III 3 406.6 86.0 14.0 5.2 0 1.9 1.6 11 992.2 27.4 72.6 68.9 0 0.4 1.6
IV 3 291.0 86.1 13.9 4.9 0 2.0 1.6 11 909.3 27.6 72.4 68.6 0.1 0.4 1.7
V 3 406.6 85.7 14.3 5.6 0 1.9 1.6 12 086.4 26.6 73.4 69.1 0.1 0.3 1.7
VI 3 462.4 85.9 14.1 5.5 0 1.9 1.5 11 746.7 27.4 72.6 68.5 0.1 0.3 1.9
VII 3 361.1 85.1 14.9 6.4 0 1.9 1.6 11 914.7 27.1 72.9 69.0 0.1 0.3 1.9
VIII 3 216.1 85.1 14.9 6.0 0 1.9 1.7 11 753.6 26.7 73.3 69.3 0.1 0.4 1.8
IX 3 148.2 86.0 14.0 4.9 0 1.9 1.6 11 681.9 28.0 72.0 68.1 0.1 0.3 1.9
20.b

80
CURRENCY BREAKDOWN OF LOANS TO RESIDENTS
(at end of period)
Non-MFIs
Outstanding amount
(all currencies;
millions of euro)
Structure (%)
In euro In foreign currencies
incl. USD incl. JPY incl. CHF incl. GBP
2014
VII 12 931.4 95.4 4.6 2.1 0 0.7 0.5
VIII 12 957.2 95.3 4.7 2.1 0 0.7 0.5
IX 12 970.6 95.1 4.9 2.3 0 0.7 0.5
X 12 908.9 95.2 4.8 2.3 0 0.7 0.5
XI 12 891.3 95.2 4.8 2.3 0 0.7 0.5
XII 12 628.1 95.3 4.7 2.2 0 0.7 0.5
2015
I 12 647.1 94.8 5.2 2.6 0 0.8 0.5
II 12 581.2 94.8 5.2 2.6 0 0.8 0.5
III 12 549.6 94.7 5.3 2.7 0 0.8 0.5
IV 12 520.3 94.7 5.3 2.7 0 0.8 0.5
V 12 583.0 94.7 5.3 2.7 0 0.8 0.5
VI 12 539.3 94.8 5.2 2.6 0 0.8 0.5
VII 12 503.6 95.0 5.0 2.5 0 0.7 0.5
VIII 12 547.7 95.0 5.0 2.5 0 0.7 0.5
IX 12 535.9 95.0 5.0 2.5 0 0.7 0.5
20.c
CURRENCY BREAKDOWN OF LOANS TO NON-RESIDENTS
(at end of period)
MFIs Non-MFIs
Outstanding
amount (all
currencies;
millions of
euro)
Structure (%) Outstanding
amount (all
currencies;
millions of
euro)
Structure (%)
In euro In foreign currencies In euro In foreign currencies
incl. USD incl. JPY incl. CHF incl. GBP incl. USD incl. JPY incl. CHF incl. GBP
2014
VII 7 206.1 45.3 54.7 49.1 0.3 0.5 1.7 1 796.1 35.1 64.9 62.5 0 0.1 1.3
VIII 7 257.4 48.0 52.0 45.3 0.4 0.6 2.2 1 830.9 34.3 65.7 63.5 0 0.1 1.0
IX 7 455.3 48.9 51.1 45.2 0.4 0.6 1.7 1 784.7 35.1 64.9 62.8 0 0.1 1.2
X 7 600.8 51.3 48.7 42.9 0.2 0.5 1.8 1 979.1 34.5 65.5 63.5 0 0.1 1.1
XI 7 741.2 51.2 48.8 42.6 0.6 0.5 2.3 1 995.7 34.2 65.8 63.7 0 0.1 1.3
XII 7 090.9 46.5 53.5 46.8 0.6 0.7 2.1 1 998.8 34.6 65.4 63.8 0 0 1.3
2015
I 7 617.3 48.9 51.1 45.8 0.1 0.6 2.0 2 105.8 31.9 68.1 66.4 0 0.1 1.2
II 7 035.1 46.7 53.3 46.8 0.1 1.2 2.2 2 122.3 30.2 69.8 67.8 0 0.1 1.4
III 6 669.6 47.8 52.2 45.1 0.2 1.4 2.6 2 208.4 30.5 69.5 67.7 0 0.1 1.3
IV 5 928.9 41.9 58.1 50.0 0.4 1.6 3.0 2 183.5 31.3 68.7 67.0 0 0.1 1.2
V 6 219.9 43.8 56.2 48.6 0.4 1.4 2.7 2 231.2 30.7 69.3 67.6 0 0.1 1.2
VI 6 036.7 44.3 55.7 46.1 0.8 1.8 3.4 2 162.4 31.0 69.0 67.1 0 0.1 1.3
VII 6 070.2 42.5 57.5 48.2 0.9 1.7 3.1 2 185.5 30.5 69.5 67.6 0 0.2 1.2
VIII 5 887.8 41.1 58.9 48.8 1.2 1.9 3.4 2 190.7 30.9 69.1 67.4 0 0.2 1.1
IX 6 211.3 42.1 57.9 47.9 1.1 1.8 3.4 2 240.1 32.7 67.3 65.7 0 0.2 1.1
20.d
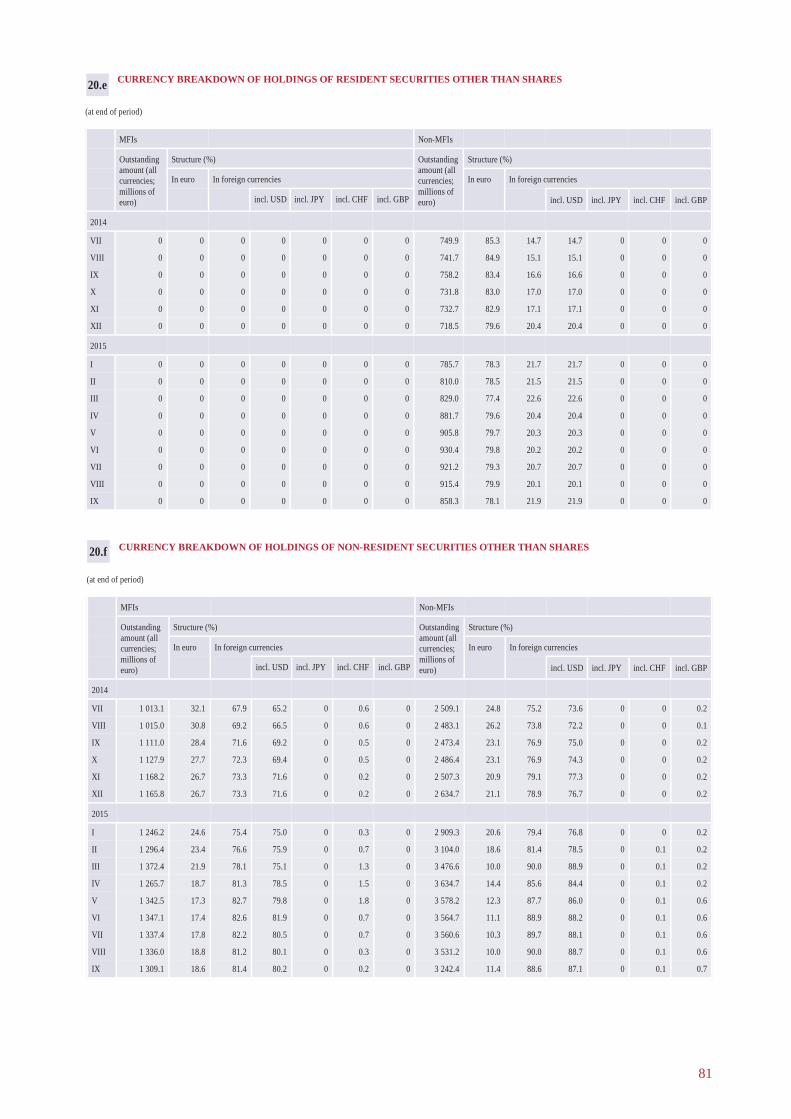
81
CURRENCY BREAKDOWN OF HOLDINGS OF NON-RESIDENT SECURITIES OTHER THAN SHARES
(at end of period)
MFIs Non-MFIs
Outstanding
amount (all
currencies;
millions of
euro)
Structure (%) Outstanding
amount (all
currencies;
millions of
euro)
Structure (%)
In euro In foreign currencies In euro In foreign currencies
incl. USD incl. JPY incl. CHF incl. GBP incl. USD incl. JPY incl. CHF incl. GBP
2014
VII 1 013.1 32.1 67.9 65.2 0 0.6 0 2 509.1 24.8 75.2 73.6 0 0 0.2
VIII 1 015.0 30.8 69.2 66.5 0 0.6 0 2 483.1 26.2 73.8 72.2 0 0 0.1
IX 1 111.0 28.4 71.6 69.2 0 0.5 0 2 473.4 23.1 76.9 75.0 0 0 0.2
X 1 127.9 27.7 72.3 69.4 0 0.5 0 2 486.4 23.1 76.9 74.3 0 0 0.2
XI 1 168.2 26.7 73.3 71.6 0 0.2 0 2 507.3 20.9 79.1 77.3 0 0 0.2
XII 1 165.8 26.7 73.3 71.6 0 0.2 0 2 634.7 21.1 78.9 76.7 0 0 0.2
2015
I 1 246.2 24.6 75.4 75.0 0 0.3 0 2 909.3 20.6 79.4 76.8 0 0 0.2
II 1 296.4 23.4 76.6 75.9 0 0.7 0 3 104.0 18.6 81.4 78.5 0 0.1 0.2
III 1 372.4 21.9 78.1 75.1 0 1.3 0 3 476.6 10.0 90.0 88.9 0 0.1 0.2
IV 1 265.7 18.7 81.3 78.5 0 1.5 0 3 634.7 14.4 85.6 84.4 0 0.1 0.2
V 1 342.5 17.3 82.7 79.8 0 1.8 0 3 578.2 12.3 87.7 86.0 0 0.1 0.6
VI 1 347.1 17.4 82.6 81.9 0 0.7 0 3 564.7 11.1 88.9 88.2 0 0.1 0.6
VII 1 337.4 17.8 82.2 80.5 0 0.7 0 3 560.6 10.3 89.7 88.1 0 0.1 0.6
VIII 1 336.0 18.8 81.2 80.1 0 0.3 0 3 531.2 10.0 90.0 88.7 0 0.1 0.6
IX 1 309.1 18.6 81.4 80.2 0 0.2 0 3 242.4 11.4 88.6 87.1 0 0.1 0.7
20.f
CURRENCY BREAKDOWN OF HOLDINGS OF RESIDENT SECURITIES OTHER THAN SHARES
(at end of period)
MFIs Non-MFIs
Outstanding
amount (all
currencies;
millions of
euro)
Structure (%) Outstanding
amount (all
currencies;
millions of
euro)
Structure (%)
In euro In foreign currencies In euro In foreign currencies
incl. USD incl. JPY incl. CHF incl. GBP incl. USD incl. JPY incl. CHF incl. GBP
2014
VII 0 0 0 0 0 0 0 749.9 85.3 14.7 14.7 0 0 0
VIII 0 0 0 0 0 0 0 741.7 84.9 15.1 15.1 0 0 0
IX 0 0 0 0 0 0 0 758.2 83.4 16.6 16.6 0 0 0
X 0 0 0 0 0 0 0 731.8 83.0 17.0 17.0 0 0 0
XI 0 0 0 0 0 0 0 732.7 82.9 17.1 17.1 0 0 0
XII 0 0 0 0 0 0 0 718.5 79.6 20.4 20.4 0 0 0
2015
I 0 0 0 0 0 0 0 785.7 78.3 21.7 21.7 0 0 0
II 0 0 0 0 0 0 0 810.0 78.5 21.5 21.5 0 0 0
III 0 0 0 0 0 0 0 829.0 77.4 22.6 22.6 0 0 0
IV 0 0 0 0 0 0 0 881.7 79.6 20.4 20.4 0 0 0
V 0 0 0 0 0 0 0 905.8 79.7 20.3 20.3 0 0 0
VI 0 0 0 0 0 0 0 930.4 79.8 20.2 20.2 0 0 0
VII 0 0 0 0 0 0 0 921.2 79.3 20.7 20.7 0 0 0
VIII 0 0 0 0 0 0 0 915.4 79.9 20.1 20.1 0 0 0
IX 0 0 0 0 0 0 0 858.3 78.1 21.9 21.9 0 0 0
20.e

82
CURRENCY BREAKDOWN OF DEBT SECURITIES ISSUED BY MFIs
(at end of period)
Outstanding amount (all currencies; millions of euro) Structure (%)
In euro In foreign currencies
2014
VII 440.8 31.6 68.4
VIII 449.9 31.6 68.4
IX 468.4 30.6 69.4
X 516.0 30.2 69.8
XI 487.3 30.7 69.3
XII 513.4 32.7 67.3
2015
I 537.4 30.7 69.3
II 599.2 29.4 70.6
III 628.0 29.3 70.7
IV 611.4 30.3 69.7
V 626.0 30.8 69.2
VI 562.1 31.2 68.8
VII 639.3 30.8 69.2
VIII 632.6 31.2 68.8
IX 614.2 32.2 67.8
20.g
WEIGHTED AVERAGE INTEREST RATES CHARGED BY MFIs IN TRANSACTIONS WITH RESIDENT NON-FINANCIAL
CORPORATIONS AND HOUSEHOLDS IN EURO
(%)
1. Interest rates on deposits (new business)
2014 2015
VII VIII IX X XI XII I II III IV V VI VII VIII IX
Deposits from households
Overnight1 0.07 0.07 0.07 0.07 0.06 0.05 0.05 0.06 0.05 0.05 0.05 0.05 0.05 0.05 0.05
With agreed maturity
Up to 1 year 0.29 0.38 0.30 0.33 0.32 0.61 0.54 0.37 0.31 0.28 0.24 0.31 0.20 0.23 0.20
Over 1 and up to 2 years 0.98 1.09 1.31 1.35 0.95 0.99 1.01 0.95 1.64 1.61 0.83 0.80 0.98 0.98 1.25
Over 2 years 1.47 2.61 3.12 2.51 3.34 1.64 1.92 2.09 1.11 2.04 1.37 1.60 2.70 1.97 3.64
Redeemable at notice2
Up to 3 months 0.14 0.14 0.11 0.09 0.09 0.08 0.09 0.06 0.08 0.07 0.07 0.07 0.07 0.07 0.07
Over 3 months x x x x x x x x x x x x x x x
Deposits from non-financial corporations
Overnight1 0.08 0.07 0.06 0.05 0.06 0.05 0.05 0.05 0.05 0.05 0.06 0.05 0.06 0.07 0.07
With agreed maturity
Up to 1 year 0.08 0.03 0.07 0.05 0.05 0.05 0.03 0.04 0.03 0.04 0.02 0.05 0.01 0.03 0.02
Over 1 and up to 2 years x 0.40 1.23 x 0.43 1.86 0.10 0.51 1.57 0.34 0.99 0.30 x x 0.91
Over 2 years 0.75 x 0.53 0.12 1.65 0.24 0.28 0.20 0.14 x 0.04 x x x 2.04
Repos – – – – – – – – – – – – – – –
1 End-of-period.
2 For this instrument category, households and non-financial corporations are merged and allocated to the household sector.
21.a

83
WEIGHTED AVERAGE INTEREST RATES CHARGED BY MFIs IN TRANSACTIONS WITH RESIDENT NON-FINANCIAL
CORPORATIONS AND HOUSEHOLDS IN EURO (CONT.)
(%)
21.a
2. Interest rates on deposits (outstanding amounts)
2014 2015
VII VIII IX X XI XII I II III IV V VI VII VIII IX
Households
Overnight1 0.07 0.07 0.07 0.07 0.06 0.05 0.05 0.06 0.05 0.05 0.05 0.05 0.05 0.05 0.05
With agreed maturity
Up to 2 years 0.84 0.83 0.83 0.83 0.84 0.83 0.82 0.80 0.82 0.84 0.83 0.83 0.83 0.83 0.83
Over 2 years 3.57 3.56 3.62 3.38 3.42 3.19 3.10 3.10 3.08 3.07 3.04 3.03 2.98 2.97 2.97
Redeemable at notice2
Up to 3 months 0.14 0.14 0.11 0.09 0.09 0.08 0.09 0.06 0.08 0.07 0.07 0.07 0.07 0.07 0.07
Over 3 months x x x x x x x x x x x x x x x
Non-financial corporations
Overnight1 0.08 0.07 0.06 0.05 0.06 0.05 0.05 0.05 0.05 0.05 0.06 0.05 0.06 0.07 0.07
With agreed maturity
Up to 2 years 0.48 0.49 0.47 0.55 0.40 0.39 0.41 0.39 0.33 0.30 0.28 0.27 0.29 0.29 0.28
Over 2 years 1.53 1.49 1.32 1.28 1.13 0.93 0.98 0.91 0.91 1.03 1.04 1.04 1.04 0.90 1.04
Repos – – – – – – – – – – – – – – –
1 End-of-period.
2 For this instrument category, households and non-financial corporations are merged and allocated to the household sector.
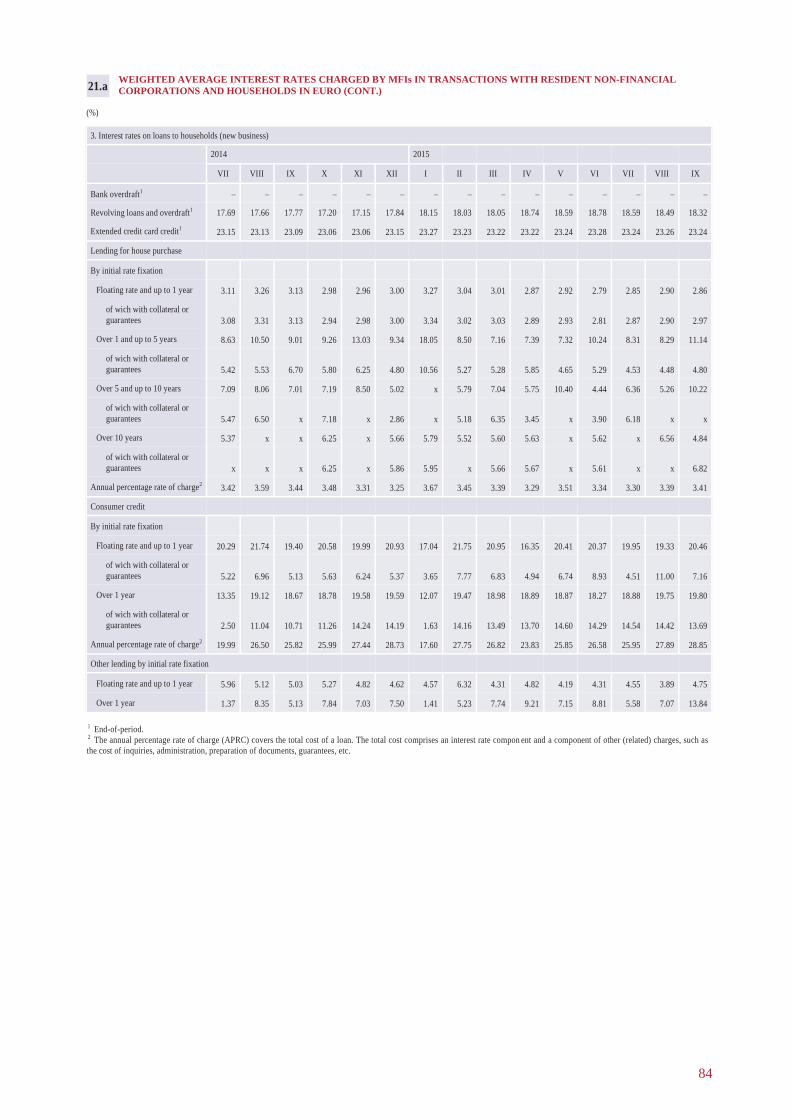
84
WEIGHTED AVERAGE INTEREST RATES CHARGED BY MFIs IN TRANSACTIONS WITH RESIDENT NON-FINANCIAL
CORPORATIONS AND HOUSEHOLDS IN EURO (CONT.)
(%)
21.a
1 End-of-period.
2 The annual percentage rate of charge (APRC) covers the total cost of a loan. The total cost comprises an interest rate compon ent and a component of other (related) charges, such as
the cost of inquiries, administration, preparation of documents, guarantees, etc.
3. Interest rates on loans to households (new business)
2014 2015
VII VIII IX X XI XII I II III IV V VI VII VIII IX
Bank overdraft1 – – – – – – – – – – – – – – –
Revolving loans and overdraft1 17.69 17.66 17.77 17.20 17.15 17.84 18.15 18.03 18.05 18.74 18.59 18.78 18.59 18.49 18.32
Extended credit card credit1 23.15 23.13 23.09 23.06 23.06 23.15 23.27 23.23 23.22 23.22 23.24 23.28 23.24 23.26 23.24
Lending for house purchase
By initial rate fixation
Floating rate and up to 1 year 3.11 3.26 3.13 2.98 2.96 3.00 3.27 3.04 3.01 2.87 2.92 2.79 2.85 2.90 2.86
of wich with collateral or
guarantees 3.08 3.31 3.13 2.94 2.98 3.00 3.34 3.02 3.03 2.89 2.93 2.81 2.87 2.90 2.97
Over 1 and up to 5 years 8.63 10.50 9.01 9.26 13.03 9.34 18.05 8.50 7.16 7.39 7.32 10.24 8.31 8.29 11.14
of wich with collateral or
guarantees 5.42 5.53 6.70 5.80 6.25 4.80 10.56 5.27 5.28 5.85 4.65 5.29 4.53 4.48 4.80
Over 5 and up to 10 years 7.09 8.06 7.01 7.19 8.50 5.02 x 5.79 7.04 5.75 10.40 4.44 6.36 5.26 10.22
of wich with collateral or
guarantees 5.47 6.50 x 7.18 x 2.86 x 5.18 6.35 3.45 x 3.90 6.18 x x
Over 10 years 5.37 x x 6.25 x 5.66 5.79 5.52 5.60 5.63 x 5.62 x 6.56 4.84
of wich with collateral or
guarantees x x x 6.25 x 5.86 5.95 x 5.66 5.67 x 5.61 x x 6.82
Annual percentage rate of charge2 3.42 3.59 3.44 3.48 3.31 3.25 3.67 3.45 3.39 3.29 3.51 3.34 3.30 3.39 3.41
Consumer credit
By initial rate fixation
Floating rate and up to 1 year 20.29 21.74 19.40 20.58 19.99 20.93 17.04 21.75 20.95 16.35 20.41 20.37 19.95 19.33 20.46
of wich with collateral or
guarantees 5.22 6.96 5.13 5.63 6.24 5.37 3.65 7.77 6.83 4.94 6.74 8.93 4.51 11.00 7.16
Over 1 year 13.35 19.12 18.67 18.78 19.58 19.59 12.07 19.47 18.98 18.89 18.87 18.27 18.88 19.75 19.80
of wich with collateral or
guarantees 2.50 11.04 10.71 11.26 14.24 14.19 1.63 14.16 13.49 13.70 14.60 14.29 14.54 14.42 13.69
Annual percentage rate of charge2 19.99 26.50 25.82 25.99 27.44 28.73 17.60 27.75 26.82 23.83 25.85 26.58 25.95 27.89 28.85
Other lending by initial rate fixation
Floating rate and up to 1 year 5.96 5.12 5.03 5.27 4.82 4.62 4.57 6.32 4.31 4.82 4.19 4.31 4.55 3.89 4.75
Over 1 year 1.37 8.35 5.13 7.84 7.03 7.50 1.41 5.23 7.74 9.21 7.15 8.81 5.58 7.07 13.84
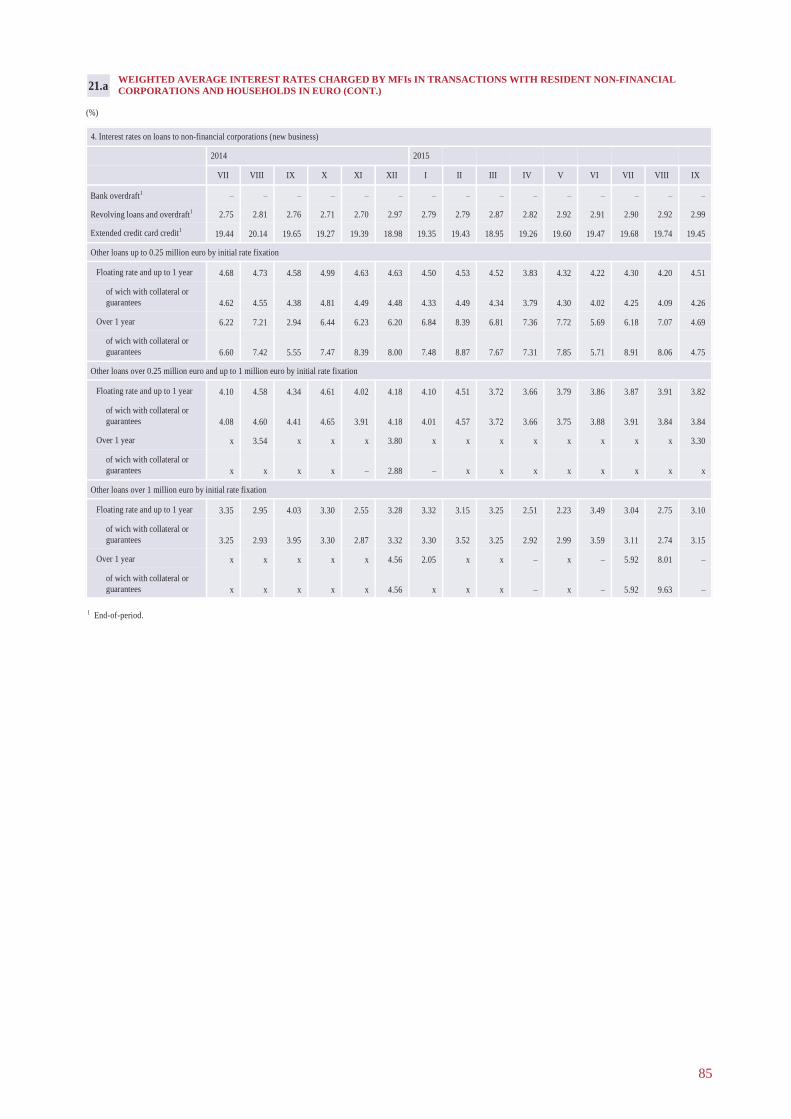
85
WEIGHTED AVERAGE INTEREST RATES CHARGED BY MFIs IN TRANSACTIONS WITH RESIDENT NON-FINANCIAL
CORPORATIONS AND HOUSEHOLDS IN EURO (CONT.)
(%)
21.a
4. Interest rates on loans to non-financial corporations (new business)
2014 2015
VII VIII IX X XI XII I II III IV V VI VII VIII IX
Bank overdraft1 – – – – – – – – – – – – – – –
Revolving loans and overdraft1 2.75 2.81 2.76 2.71 2.70 2.97 2.79 2.79 2.87 2.82 2.92 2.91 2.90 2.92 2.99
Extended credit card credit1 19.44 20.14 19.65 19.27 19.39 18.98 19.35 19.43 18.95 19.26 19.60 19.47 19.68 19.74 19.45
Other loans up to 0.25 million euro by initial rate fixation
Floating rate and up to 1 year 4.68 4.73 4.58 4.99 4.63 4.63 4.50 4.53 4.52 3.83 4.32 4.22 4.30 4.20 4.51
of wich with collateral or
guarantees 4.62 4.55 4.38 4.81 4.49 4.48 4.33 4.49 4.34 3.79 4.30 4.02 4.25 4.09 4.26
Over 1 year 6.22 7.21 2.94 6.44 6.23 6.20 6.84 8.39 6.81 7.36 7.72 5.69 6.18 7.07 4.69
of wich with collateral or
guarantees 6.60 7.42 5.55 7.47 8.39 8.00 7.48 8.87 7.67 7.31 7.85 5.71 8.91 8.06 4.75
Other loans over 0.25 million euro and up to 1 million euro by initial rate fixation
Floating rate and up to 1 year 4.10 4.58 4.34 4.61 4.02 4.18 4.10 4.51 3.72 3.66 3.79 3.86 3.87 3.91 3.82
of wich with collateral or
guarantees 4.08 4.60 4.41 4.65 3.91 4.18 4.01 4.57 3.72 3.66 3.75 3.88 3.91 3.84 3.84
Over 1 year x 3.54 x x x 3.80 x x x x x x x x 3.30
of wich with collateral or
guarantees x x x x – 2.88 – x x x x x x x x
Other loans over 1 million euro by initial rate fixation
Floating rate and up to 1 year 3.35 2.95 4.03 3.30 2.55 3.28 3.32 3.15 3.25 2.51 2.23 3.49 3.04 2.75 3.10
of wich with collateral or
guarantees 3.25 2.93 3.95 3.30 2.87 3.32 3.30 3.52 3.25 2.92 2.99 3.59 3.11 2.74 3.15
Over 1 year x x x x x 4.56 2.05 x x – x – 5.92 8.01 –
of wich with collateral or
guarantees x x x x x 4.56 x x x – x – 5.92 9.63 –
1 End-of-period.
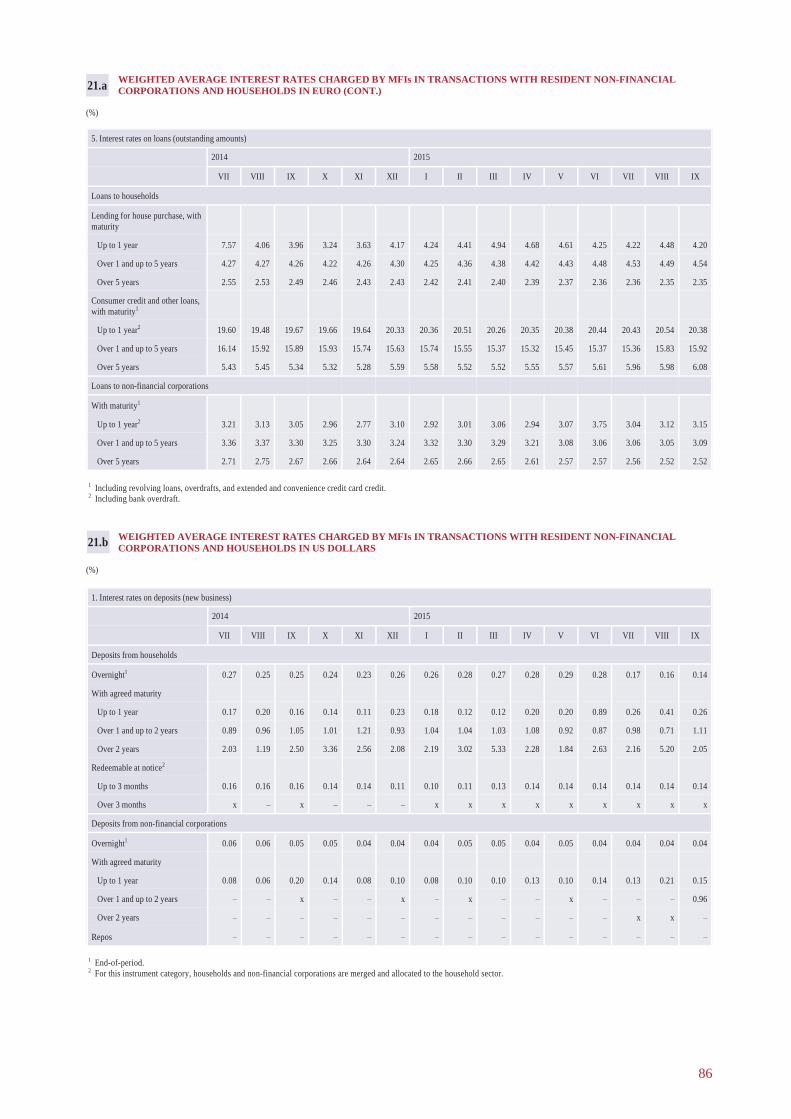
86
WEIGHTED AVERAGE INTEREST RATES CHARGED BY MFIs IN TRANSACTIONS WITH RESIDENT NON-FINANCIAL
CORPORATIONS AND HOUSEHOLDS IN EURO (CONT.)
(%)
21.a
1 Including revolving loans, overdrafts, and extended and convenience credit card credit.
2 Including bank overdraft.
1 End-of-period.
2 For this instrument category, households and non-financial corporations are merged and allocated to the household sector.
WEIGHTED AVERAGE INTEREST RATES CHARGED BY MFIs IN TRANSACTIONS WITH RESIDENT NON-FINANCIAL
CORPORATIONS AND HOUSEHOLDS IN US DOLLARS
(%)
21.b
5. Interest rates on loans (outstanding amounts)
2014 2015
VII VIII IX X XI XII I II III IV V VI VII VIII IX
Loans to households
Lending for house purchase, with
maturity
Up to 1 year 7.57 4.06 3.96 3.24 3.63 4.17 4.24 4.41 4.94 4.68 4.61 4.25 4.22 4.48 4.20
Over 1 and up to 5 years 4.27 4.27 4.26 4.22 4.26 4.30 4.25 4.36 4.38 4.42 4.43 4.48 4.53 4.49 4.54
Over 5 years 2.55 2.53 2.49 2.46 2.43 2.43 2.42 2.41 2.40 2.39 2.37 2.36 2.36 2.35 2.35
Consumer credit and other loans,
with maturity1
Up to 1 year2 19.60 19.48 19.67 19.66 19.64 20.33 20.36 20.51 20.26 20.35 20.38 20.44 20.43 20.54 20.38
Over 1 and up to 5 years 16.14 15.92 15.89 15.93 15.74 15.63 15.74 15.55 15.37 15.32 15.45 15.37 15.36 15.83 15.92
Over 5 years 5.43 5.45 5.34 5.32 5.28 5.59 5.58 5.52 5.52 5.55 5.57 5.61 5.96 5.98 6.08
Loans to non-financial corporations
With maturity1
Up to 1 year2 3.21 3.13 3.05 2.96 2.77 3.10 2.92 3.01 3.06 2.94 3.07 3.75 3.04 3.12 3.15
Over 1 and up to 5 years 3.36 3.37 3.30 3.25 3.30 3.24 3.32 3.30 3.29 3.21 3.08 3.06 3.06 3.05 3.09
Over 5 years 2.71 2.75 2.67 2.66 2.64 2.64 2.65 2.66 2.65 2.61 2.57 2.57 2.56 2.52 2.52
1. Interest rates on deposits (new business)
2014 2015
VII VIII IX X XI XII I II III IV V VI VII VIII IX
Deposits from households
Overnight1 0.27 0.25 0.25 0.24 0.23 0.26 0.26 0.28 0.27 0.28 0.29 0.28 0.17 0.16 0.14
With agreed maturity
Up to 1 year 0.17 0.20 0.16 0.14 0.11 0.23 0.18 0.12 0.12 0.20 0.20 0.89 0.26 0.41 0.26
Over 1 and up to 2 years 0.89 0.96 1.05 1.01 1.21 0.93 1.04 1.04 1.03 1.08 0.92 0.87 0.98 0.71 1.11
Over 2 years 2.03 1.19 2.50 3.36 2.56 2.08 2.19 3.02 5.33 2.28 1.84 2.63 2.16 5.20 2.05
Redeemable at notice2
Up to 3 months 0.16 0.16 0.16 0.14 0.14 0.11 0.10 0.11 0.13 0.14 0.14 0.14 0.14 0.14 0.14
Over 3 months x – x – – – x x x x x x x x x
Deposits from non-financial corporations
Overnight1 0.06 0.06 0.05 0.05 0.04 0.04 0.04 0.05 0.05 0.04 0.05 0.04 0.04 0.04 0.04
With agreed maturity
Up to 1 year 0.08 0.06 0.20 0.14 0.08 0.10 0.08 0.10 0.10 0.13 0.10 0.14 0.13 0.21 0.15
Over 1 and up to 2 years – – x – – x – x – – x – – – 0.96
Over 2 years – – – – – – – – – – – – x x –
Repos – – – – – – – – – – – – – – –
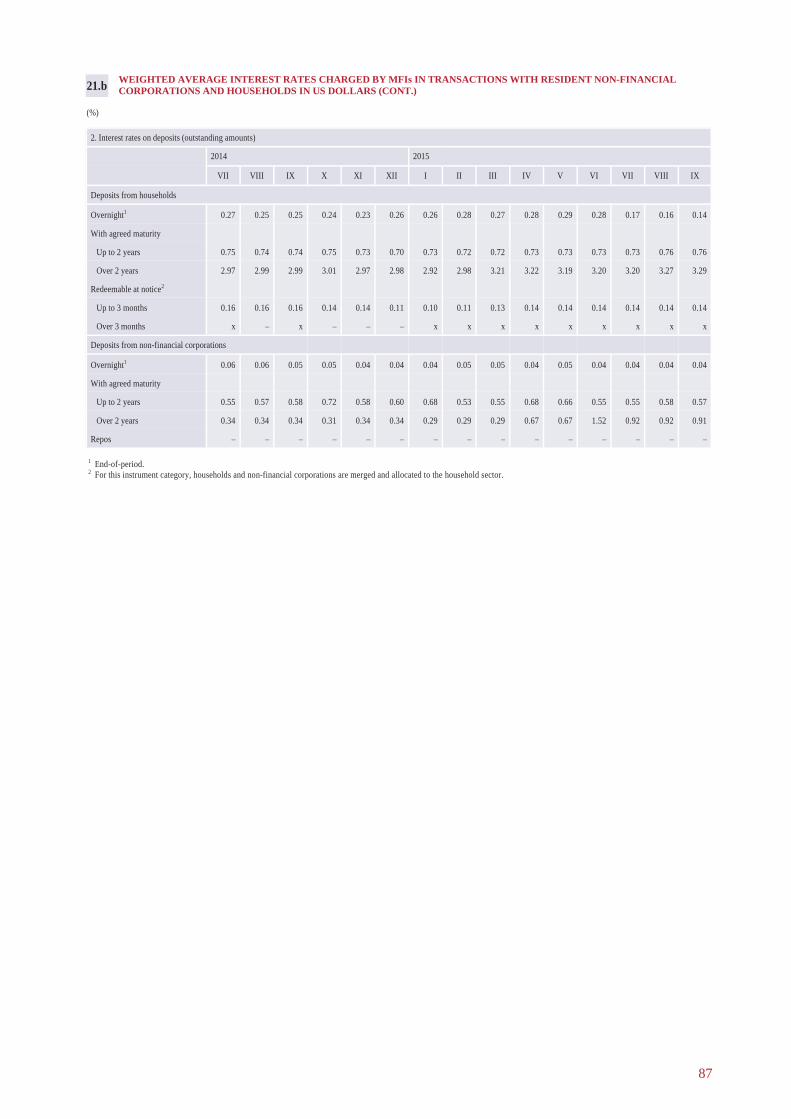
87
WEIGHTED AVERAGE INTEREST RATES CHARGED BY MFIs IN TRANSACTIONS WITH RESIDENT NON-FINANCIAL
CORPORATIONS AND HOUSEHOLDS IN US DOLLARS (CONT.)
(%)
21.b
1 End-of-period.
2 For this instrument category, households and non-financial corporations are merged and allocated to the household sector.
2. Interest rates on deposits (outstanding amounts)
2014 2015
VII VIII IX X XI XII I II III IV V VI VII VIII IX
Deposits from households
Overnight1 0.27 0.25 0.25 0.24 0.23 0.26 0.26 0.28 0.27 0.28 0.29 0.28 0.17 0.16 0.14
With agreed maturity
Up to 2 years 0.75 0.74 0.74 0.75 0.73 0.70 0.73 0.72 0.72 0.73 0.73 0.73 0.73 0.76 0.76
Over 2 years 2.97 2.99 2.99 3.01 2.97 2.98 2.92 2.98 3.21 3.22 3.19 3.20 3.20 3.27 3.29
Redeemable at notice2
Up to 3 months 0.16 0.16 0.16 0.14 0.14 0.11 0.10 0.11 0.13 0.14 0.14 0.14 0.14 0.14 0.14
Over 3 months x – x – – – x x x x x x x x x
Deposits from non-financial corporations
Overnight1 0.06 0.06 0.05 0.05 0.04 0.04 0.04 0.05 0.05 0.04 0.05 0.04 0.04 0.04 0.04
With agreed maturity
Up to 2 years 0.55 0.57 0.58 0.72 0.58 0.60 0.68 0.53 0.55 0.68 0.66 0.55 0.55 0.58 0.57
Over 2 years 0.34 0.34 0.34 0.31 0.34 0.34 0.29 0.29 0.29 0.67 0.67 1.52 0.92 0.92 0.91
Repos – – – – – – – – – – – – – – –

88
1 End-of-period.
2 The annual percentage rate of charge (APRC) covers the total cost of a loan. The total cost comprises an interest rate compon ent and a component of other (related) charges, such as the
cost of inquiries, administration, preparation of documents, guarantees, etc.
WEIGHTED AVERAGE INTEREST RATES CHARGED BY MFIs IN TRANSACTIONS WITH RESIDENT NON-FINANCIAL
CORPORATIONS AND HOUSEHOLDS IN US DOLLARS (CONT.)
(%)
21.b
3. Interest rates on loans to households (new business)
2014 2015
VII VIII IX X XI XII I II III IV V VI VII VIII IX
Bank overdraft1 – – – – – – – – – – – – – – –
Revolving loans and overdraft1 14.51 14.62 21.04 17.62 17.32 13.82 14.38 13.86 10.91 9.43 13.03 12.84 15.80 15.78 13.70
Extended credit card credit1 24.66 24.80 24.87 24.92 25.02 25.24 26.32 25.76 26.01 24.36 24.82 25.25 25.03 24.97 24.63
Lending for house purchase
By initial rate fixation
Floating rate and up to 1 year 3.22 2.45 2.13 4.93 x 2.29 2.86 2.84 5.59 2.42 2.76 2.29 x 3.43 2.45
of wich with collateral or
guarantees 3.80 2.45 x 4.98 x 1.90 3.06 2.84 5.70 2.40 3.04 2.08 x 3.43 3.58
Over 1 and up to 5 years – x – – x x – – x x x – – – –
of wich with collateral or
guarantees – x – – x x – – – – – – – – –
Over 5 and up to 10 years – – – – – x – x – – – – – – –
of wich with collateral or
guarantees – – – – – x – – – – – – – – –
Over 10 years – – – – – x x – – – – x x x –
of wich with collateral or
guarantees – – – – – – x – – – – – – – –
Annual percentage rate of charge2 3.48 2.54 2.15 4.98 4.65 4.80 3.18 3.02 6.15 2.63 3.20 2.89 x 4.13 2.51
Consumer credit
By initial rate fixation
Floating rate and up to 1 year 17.27 x x 17.79 x x x x 18.40 10.41 16.60 x x x 18.21
of wich with collateral or
guarantees – x – – x – – – – x x x x x x
Over 1 year x – x – – – – – – – – x x x –
of wich with collateral or
guarantees – – – – – – – – – – – – – – –
Annual percentage rate of charge2 17.35 17.88 17.55 17.87 18.89 17.57 16.91 17.37 18.40 10.41 16.71 14.66 x x 18.21
Other lending by initial rate fixation
Floating rate and up to 1 year 4.82 x 4.21 x x 3.76 3.21 4.84 4.11 3.65 4.60 4.91 4.54 5.36 3.76
Over 1 year – x – – x 3.50 – – – – – x – – –

89
WEIGHTED AVERAGE INTEREST RATES CHARGED BY MFIs IN TRANSACTIONS WITH RESIDENT NON-FINANCIAL
CORPORATIONS AND HOUSEHOLDS IN US DOLLARS (CONT.)
(%)
21.b
1 End-of-period.
4. Interest rates on loans to non-financial corporations (new business)
2014 2015
VII VIII IX X XI XII I II III IV V VI VII VIII IX
Bank overdraft1 – – – – – – – – – – – – – – –
Revolving loans and overdraft¹ 4.01 4.05 3.80 3.58 3.55 3.71 3.45 3.45 3.53 3.69 3.68 3.69 3.85 3.73 4.06
Extended credit card credit¹ 15.91 16.13 19.11 21.72 17.40 20.72 20.56 20.31 22.15 22.60 19.13 21.18 16.09 18.60 20.76
Other loans up to 0.25 million euro by initial rate fixation
Floating rate and up to 1 year x x x x x x x x x 3.62 3.76 6.83 x x x
of wich with collateral or
guarantees – x x x – x – – x x 3.67 6.83 x x x
Over 1 year – – – x x x x – – x – – – x x
of wich with collateral or
guarantees – – – – – x – – – – – – – – –
Other loans over 0.25 million euro and up to 1 million euro by initial rate fixation
Floating rate and up to 1 year x x x x – x – x 4.19 x 4.38 5.09 x x x
of wich with collateral or
guarantees x x x x – x – x x x 4.38 x – x –
Over 1 year – – x – – – x – x – – – – – –
of wich with collateral or
guarantees – – x – – – x – – – – – – – –
Other loans over 1 million euro by initial rate fixation
Floating rate and up to 1 year – x x – x x – – 6.82 3.50 2.91 x x x x
of wich with collateral or
guarantees – x x – x x – – 6.82 3.52 2.89 x x x x
Over 1 year – – x – – – – – – – – – – – –
of wich with collateral or
guarantees – – x – – – – – – – – – – – –
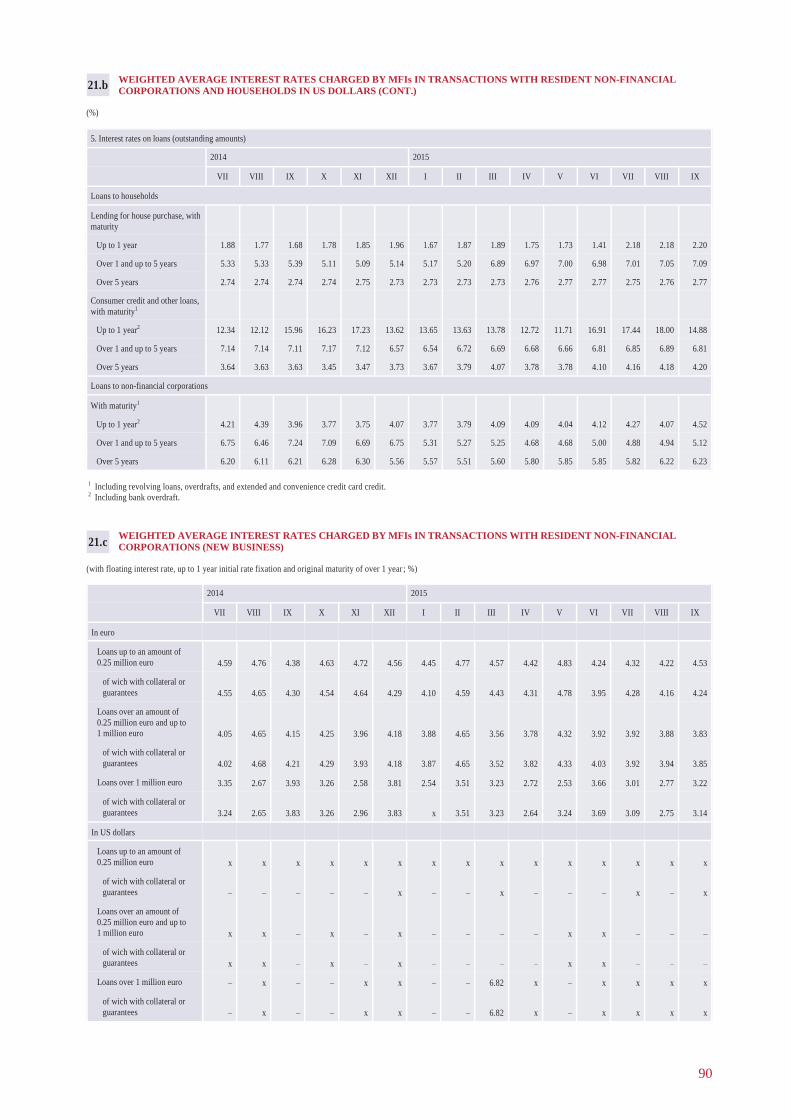
90
WEIGHTED AVERAGE INTEREST RATES CHARGED BY MFIs IN TRANSACTIONS WITH RESIDENT NON-FINANCIAL
CORPORATIONS AND HOUSEHOLDS IN US DOLLARS (CONT.)
(%)
21.b
1 Including revolving loans, overdrafts, and extended and convenience credit card credit.
2 Including bank overdraft.
5. Interest rates on loans (outstanding amounts)
2014 2015
VII VIII IX X XI XII I II III IV V VI VII VIII IX
Loans to households
Lending for house purchase, with
maturity
Up to 1 year 1.88 1.77 1.68 1.78 1.85 1.96 1.67 1.87 1.89 1.75 1.73 1.41 2.18 2.18 2.20
Over 1 and up to 5 years 5.33 5.33 5.39 5.11 5.09 5.14 5.17 5.20 6.89 6.97 7.00 6.98 7.01 7.05 7.09
Over 5 years 2.74 2.74 2.74 2.74 2.75 2.73 2.73 2.73 2.73 2.76 2.77 2.77 2.75 2.76 2.77
Consumer credit and other loans,
with maturity1
Up to 1 year2 12.34 12.12 15.96 16.23 17.23 13.62 13.65 13.63 13.78 12.72 11.71 16.91 17.44 18.00 14.88
Over 1 and up to 5 years 7.14 7.14 7.11 7.17 7.12 6.57 6.54 6.72 6.69 6.68 6.66 6.81 6.85 6.89 6.81
Over 5 years 3.64 3.63 3.63 3.45 3.47 3.73 3.67 3.79 4.07 3.78 3.78 4.10 4.16 4.18 4.20
Loans to non-financial corporations
With maturity1
Up to 1 year2 4.21 4.39 3.96 3.77 3.75 4.07 3.77 3.79 4.09 4.09 4.04 4.12 4.27 4.07 4.52
Over 1 and up to 5 years 6.75 6.46 7.24 7.09 6.69 6.75 5.31 5.27 5.25 4.68 4.68 5.00 4.88 4.94 5.12
Over 5 years 6.20 6.11 6.21 6.28 6.30 5.56 5.57 5.51 5.60 5.80 5.85 5.85 5.82 6.22 6.23
2015 2014
VII VIII IX X XI XII I II III IV V VI VII VIII IX
In euro
Loans up to an amount of
0.25 million euro 4.59 4.76 4.38 4.63 4.72 4.56 4.45 4.77 4.57 4.42 4.83 4.24 4.32 4.22 4.53
of wich with collateral or
guarantees 4.55 4.65 4.30 4.54 4.64 4.29 4.10 4.59 4.43 4.31 4.78 3.95 4.28 4.16 4.24
Loans over an amount of
0.25 million euro and up to
1 million euro 4.05 4.65 4.15 4.25 3.96 4.18 3.88 4.65 3.56 3.78 4.32 3.92 3.92 3.88 3.83
of wich with collateral or
guarantees 4.02 4.68 4.21 4.29 3.93 4.18 3.87 4.65 3.52 3.82 4.33 4.03 3.92 3.94 3.85
Loans over 1 million euro 3.35 2.67 3.93 3.26 2.58 3.81 2.54 3.51 3.23 2.72 2.53 3.66 3.01 2.77 3.22
of wich with collateral or
guarantees 3.24 2.65 3.83 3.26 2.96 3.83 x 3.51 3.23 2.64 3.24 3.69 3.09 2.75 3.14
In US dollars
Loans up to an amount of
0.25 million euro x x x x x x x x x x x x x x x
of wich with collateral or
guarantees – – – – – x – – x – – – x – x
Loans over an amount of
0.25 million euro and up to
1 million euro x x – x – x – – – – x x – – –
of wich with collateral or
guarantees x x – x – x – – – – x x – – –
Loans over 1 million euro – x – – x x – – 6.82 x – x x x x
of wich with collateral or
guarantees – x – – x x – – 6.82 x – x x x x
WEIGHTED AVERAGE INTEREST RATES CHARGED BY MFIs IN TRANSACTIONS WITH RESIDENT NON-FINANCIAL
CORPORATIONS (NEW BUSINESS)
(with floating interest rate, up to 1 year initial rate fixation and original maturity of over 1 year ; %)
21.c

91
Loans to non-resident MFIs Total loans
Overnight Up to 1 month 1–3 months Over 3 months
2014
VII 37 444.9 4 329.6 10.0 134.1 41 918.6 43 739.2
VIII 33 004.2 5 373.2 146.7 78.0 38 602.1 40 688.2
IX 36 708.4 4 183.5 132.2 30.8 41 054.9 43 282.8
X 36 497.9 4 819.3 10.4 23.6 41 351.2 43 878.5
XI 37 016.8 4 999.9 175.4 6.4 42 198.5 44 333.6
XII 43 359.7 5 344.8 73.6 27.0 48 805.1 51 161.9
2015
I 46 084.6 4 324.9 186.1 212.4 50 808.0 52 817.6
II 44 231.6 3 923.9 275.4 1.9 48 432.8 50 511.7
III 43 118.7 3 568.7 136.1 2.3 46 825.8 48 887.0
IV 33 779.9 3 659.0 104.4 30.6 37 573.9 38 697.5
V 24 057.7 1 947.7 27.6 23.7 26 056.7 27 095.5
VI 26 932.0 2 721.0 21.2 5.9 29 680.1 30 808.1
VII 32 391.8 1 907.6 84.4 31.9 34 415.7 35 472.8
VIII 30 512.1 1 633.5 63.3 3.5 32 212.4 33 224.8
IX 33 115.0 1 579.0 20.9 0.9 34 715.8 35 692.9
LENDING IN THE INTERBANK MARKETS
(transactions; millions of euro)
Loans to resident MFIs
In euro In foreign currencies
Overnight Up to
1 month
1–3 months Over
3 months
Overnight Up to
1 month
1–3 months Over
3 months
2014
VII 5.0 142.7 0.4 – 148.1 1 075.6 596.8 0.1 – 1 672.5 1 820.6
VIII 56.7 144.8 0.2 – 201.7 1 238.1 646.3 – – 1 884.4 2 086.1
IX 140.7 92.4 – – 233.1 1 265.9 728.9 – – 1 994.8 2 227.9
X 230.1 92.2 0.4 – 322.7 1 397.0 807.6 – – 2 204.6 2 527.3
XI 170.0 100.7 0.4 – 271.1 1 131.4 732.6 – – 1 864.0 2 135.1
XII 90.0 47.9 – – 137.9 1 497.4 719.1 1.5 0.9 2 218.9 2 356.8
2015
I – 16.7 0.5 – 17.2 1 475.8 516.6 – – 1 992.4 2 009.6
II – 16.9 0.2 – 17.1 1 540.9 520.9 – – 2 061.8 2 078.9
III 0.1 17.0 – – 17.1 1 308.3 735.8 – – 2 044.1 2 061.2
IV 0.4 16.7 0.7 – 17.8 435.8 670.0 – – 1 105.8 1 123.6
V – 16.8 0.5 – 17.3 397.7 623.8 – – 1 021.5 1 038.8
VI – 17.0 – – 17.0 435.5 675.1 0.4 – 1 111.0 1 128.0
VII – 17.0 0.5 – 17.5 209.8 829.8 – – 1 039.6 1 057.1
VIII – 17.6 – – 17.6 240.2 754.2 0.4 – 994.8 1 012.4
IX – 17.0 – – 17.0 313.1 647.0 – – 960.1 977.1
22.

92
INTEREST RATES IN THE DOMESTIC INTERBANK MARKET
(% per annum)
2014 2015
VII VIII IX X XI XII I II III IV V VI VII VIII IX
Weighted average interest rates on loans in euro
Overnight 0 0 0 0 0 0 – – –0.2 –0.2 – – – – –
Up to 1 month 0.03 0.02 0.01 0 0 0.01 0 0 0 –0.1 –0.2 –0.2 –0.2 –0.2 –0.2
1–3 months 0.1 0.2 – –0.02 0.02 – 0 0 – 0 –0.2 – 0 – –
Over 3 months – – – – – – – – – – – – – – –
Weighted average interest rates on loans in foreign currencies
Overnight 0.1 0.1 0.1 0.1 0.1 0.1 0.1 0.1 0.1 0.1 0.2 0.1 0.2 0.2 0.2
Up to 1 month 0.04 0.1 0.1 0.1 0.1 0.1 0.1 0.1 0.1 0.1 0.1 0.1 0.1 0.1 0.1
1–3 months 0.02 – – – – 0.03 – – – – – 0.1 – 0.1 –
Over 3 months – – – – – 0.1 – – – – – – – – –
PRINCIPAL FOREIGN EXCHANGE TRANSACTIONS (BY TYPE, COUNTERPARTY AND CURRENCY)1
(millions of euro)
2014 2015
VII VIII IX X XI XII I II III IV V VI VII VIII IX
Type of transaction
Spot exchange
transactions 19 735.1 14 935.3 23 141.0 23 092.3 16 121.9 19 749.3 18 736.8 22 507.1 17 479.0 16 185.0 11 577.1 14 396.3 16 469.5 13 686.3 19 438.7
Forward exchange
contracts 530.1 346.9 557.1 440.2 315.2 464.3 435.8 280.2 475.6 395.9 300.8 390.8 394.4 235.2 362.3
Currency swap
arrangements 46 450.0 41 110.5 38 817.2 30 816.7 17 947.6 27 079.3 28 316.8 30 621.8 32 636.9 31 497.1 29 387.0 31 558.6 30 438.1 28 498.9 31 271.5
Counterparties
Resident MFIs 2 191.4 1 151.3 1 453.2 645.5 590.9 557.3 352.5 329.7 558.4 605.1 546.7 855.4 684.8 944.7 1 383.6
Resident other financial
intermediaries, financial
auxiliaries, insurance
corporations and pension
funds 72.6 47.9 253.5 15.5 27.8 132.3 55.6 24.4 159.2 160.2 62.4 151.9 82.3 58.8 111.4
Resident government,
non-financial corporations
and non-profit institutions
serving households 392.5 315.4 385.5 436.2 239.4 392.4 290.8 242.2 291.6 284.1 231.3 310.3 264.2 220.1 392.9
Non-resident MFIs 34 654.0 33 666.1 37 381.2 32 242.5 20 204.5 25 152.0 26 793.9 33 191.9 31 793.7 27 591.4 25 992.4 27 324.6 28 722.2 25 937.5 30 731.7
Non-resident other
financial intermediaries,
financial auxiliaries,
insurance corporations
and pension funds 6 493.3 5 758.0 6 828.9 4 240.3 2 108.4 4 433.0 3 736.7 3 596.1 4 816.1 5 060.8 3 193.5 4 584.9 4 298.9 4 668.0 4 606.9
Non-resident government,
non-financial corporations
and non-profit institutions
serving households 20 133.0 13 572.3 15 206.6 15 149.1 8 902.1 14 594.6 14 340.1 15 196.8 12 174.4 13 760.6 10 447.7 11 308.0 11 961.3 9 517.1 13 094.6
Households 2 778.5 1 881.6 1 006.5 1 620.2 2 311.5 2 031.4 1 919.6 828.1 798.0 615.7 790.9 1 810.6 1 288.4 1 074.2 751.4
Currencies
Total in all currencies 66 715.3 56 392.6 62 515.4 54 349.2 34 384.6 47 292.9 47 489.3 53 409.1 50 591.4 48 077.9 41 265.0 46 345.7 47 302.0 42 420.4 51 072.5
incl. USD for EUR 35 515.6 29 351.1 33 851.0 28 018.3 16 115.4 25 129.7 30 262.5 34 282.3 30 882.0 24 720.3 22 955.2 22 860.7 21 388.1 20 872.5 23 987.1
incl. GBP for EUR 366.3 441.8 468.7 680.6 498.6 233.0 490.8 323.6 1 023.1 1 145.8 1 113.6 1 195.7 1 191.2 998.9 1 346.1
incl. other currencies for
EUR 2 392.6 2 150.1 2 073.5 2 093.1 2 046.2 1 496.8 2 314.3 2 139.8 2 063.4 2 546.1 2 060.5 3 513.1 2 605.5 1 647.2 1 890.3
1 Including the cash and non-cash transactions performed by credit institutions. The volume of cash and non-cash transactions has been translated into euro applying the exchange rate of
the respective foreign currency as set by Latvijas Banka on the last day of the reporting month.
23.
24.

93
NON-CASH FOREIGN EXCHANGE TRANSACTIONS1
(millions of euro)
2014 2015
VII VIII IX X XI XII I II III IV V VI VII VIII IX
USD for EUR
Amount 35 492.4 29 329.6 33 829.7 28 000.2 16 103.3 25 111.4 30 246.1 34 267.7 30 867.5 24 708.3 22 942.5 22 851.1 21 375.5 20 862.4 23 977.8
%2 53.2 52.0 54.1 51.5 46.9 53.1 63.5 64.0 61.0 51.4 55.6 49.3 45.2 49.2 46.9
GBP for EUR
Amount 358.8 435.5 463.6 673.5 493.7 221.8 484.6 319.1 1 017.6 1 137.2 1 106.5 1 187.7 1 179.7 989.9 1 334.2
%2 0.5 0.8 0.7 1.2 1.4 0.5 1.0 0.6 2.0 2.4 2.7 2.6 2.5 2.3 2.6
Other currencies (except
USD and GBP) for EUR
Amount 2 385.5 2 143.4 2 067.3 2 087.7 2 043.1 1 490.3 2 469.3 2 198.4 2 060.3 2 542.5 2 057.8 3 508.9 2 630.6 1 651.2 1 893.1
%2 3.6 3.8 3.3 3.8 5.9 3.2 5.2 4.1 4.1 5.3 5.0 7.6 5.6 3.9 3.7
RUB for USD
Amount 7 804.5 8 534.9 8 747.9 9 006.8 6 994.5 7 041.1 3 882.4 6 073.3 5 930.1 9 308.2 6 719.5 6 960.9 9 958.0 9 259.0 12 461.4
%2 11.7 15.1 14.1 16.6 20.3 14.9 8.1 11.3 11.7 19.4 16.3 15.0 21.0 21.8 24.4
GBP for USD
Amount 9 841.6 6 514.3 9 380.0 5 955.9 3 434.3 6 208.5 3 846.5 5 178.8 4 441.8 4 430.9 2 761.2 3 360.9 3 561.8 2 715.6 2 284.5
%2 14.8 11.6 15.0 11.0 10.0 13.1 8.1 9.7 8.8 9.2 6.7 7.3 7.5 6.4 4.5
SEK for USD
Amount 462.1 416.2 384.5 299.1 20.4 30.6 44.9 49.7 67.9 71.2 98.5 40.4 50.8 56.3 69.2
%2 0.7 0.7 0.6 0.6 0.1 0.1 0.1 0.1 0.1 0.1 0.2 0.1 0.1 0.1 0.1
Other currencies (except
EUR, RUB, GBP and
SEK) for USD
Amount 8 111.7 7 491.3 6 997.8 7 231.2 4 568.3 6 052.5 4 951.9 3 578.8 4 918.9 4 593.1 4 074.5 6 567.3 6 144.9 5 481.1 7 164.4
%2 12.2 13.3 11.2 13.3 13.3 12.8 10.4 6.7 9.7 9.6 9.9 14.2 13.0 12.9 14.0
Other currencies (except
EUR and USD) for other
currencies
Amount 2 228.0 1 499.2 619.8 1 061.8 704.8 1 105.2 1 715.0 1 905.6 1 296.6 1 287.6 1 492.6 1 852.8 2 413.8 1 435.9 1 965.0
%2 3.3 2.7 1.0 2.0 2.1 2.3 3.6 3.5 2.6 2.6 3.6 3.9 5.1 3.4 3.8
1 Including non-cash transactions performed by credit institutions, reported by major currency. 2 As per cent of the total.
25.
EURO FOREIGN EXCHANGE REFERENCE RATES PUBLISHED BY THE ECB
(end-of-period; foreign currency vs 1 EUR)
2015 2014
VII VIII IX X XI XII I II III IV V VI VII VIII IX
USD 1.3379 1.3188 1.2583 1.2524 1.2483 1.2141 1.1305 1.1240 1.0759 1.1215 1.0970 1.1189 1.0967 1.1215 1.1203
GBP 0.7928 0.7953 0.7773 0.7843 0.7953 0.7789 0.7511 0.7278 0.7273 0.7267 0.7190 0.7114 0.7041 0.7275 0.7385
JPY 137.6600 137.1100 138.1100 140.1800 147.6900 145.2300 133.0800 134.0500 128.9500 133.2600 135.9500 137.0100 136.3400 136.0700 134.6900
CHF 1.2169 1.2061 1.2063 1.2067 1.2018 1.2024 1.0468 1.0636 1.0463 1.0486 1.0341 1.0413 1.0565 1.0825 1.0915
26.

94
WEIGHTED AVERAGE EXCHANGE RATES (CASH TRANSACTIONS)1
(foreign currency vs EUR)
2014 2015
VII VIII IX X XI XII I II III IV V VI VII VIII IX
USD
Buy 1.3642 1.3432 1.3006 1.2759 1.2568 1.2421 1.1739 1.1419 1.0948 1.0876 1.1256 1.1325 1.1113 1.1239 1.1336
Sell 1.3554 1.3353 1.2893 1.2637 1.2443 1.2324 1.1594 1.1229 1.0771 1.0770 1.1158 1.1187 1.0990 1.1120 1.1191
GBP
Buy 0.8078 0.8094 0.8042 0.7971 0.7978 0.7972 0.7768 0.7529 0.7333 0.7301 0.7280 0.7271 0.7146 0.7209 0.7379
Sell 0.7950 0.7983 0.7913 0.7856 0.7866 0.7868 0.7652 0.7385 0.7177 0.7179 0.7179 0.7165 0.7055 0.7108 0.7269
JPY
Buy 142.3464 143.8699 143.0721 142.4171 146.5523 151.0591 138.6371 138.1045 135.9340 132.3356 142.9270 150.0833 140.3156 140.0501 138.8534
Sell 137.0976 139.0408 139.4604 135.8566 136.4692 143.4504 136.0851 131.9304 127.8662 127.5718 132.9672 138.6587 134.1366 135.0062 133.4481
SEK
Buy 9.5185 9.3027 9.3117 9.2929 9.3453 9.6079 9.6123 9.6325 9.3813 9.4574 9.4404 9.4043 9.5703 9.6598 9.5262
Sell 9.1009 9.0562 9.0882 9.0991 9.1337 9.3204 9.3084 9.3539 9.1350 9.2105 9.1803 9.1624 9.4991 9.3759 9.3308
RUB
Buy 47.6471 48.9239 49.5005 52.2568 56.4581 69.8752 75.5179 73.3908 65.3114 57.1519 56.9532 61.7894 63.3437 72.8490 75.2334
Sell 46.3340 47.7862 48.5698 50.7592 56.2473 67.7851 72.1270 70.7611 63.5742 55.8186 55.4048 59.8144 61.7016 70.9720 73.0790
CHF
Buy 1.2326 1.2316 1.2250 1.2277 1.2208 1.2211 1.0896 1.0813 1.0736 1.0546 1.0620 1.0603 1.0656 1.0937 1.1095
Sell 1.1853 1.2117 1.2045 1.2034 1.2004 1.1978 1.0987 1.0542 1.0559 1.0315 1.0336 1.0378 1.0354 1.0711 1.0826
1 Including the weighted average exchange rates of cash transactions performed by credit institutions and currency exchange bur eaus.
27.

95
STRUCTURE OF GOVERNMENT SECURITIES
(at end of period; millions of euro)
2014 2015
VII VIII IX X XI XII I II III IV V VI VII VIII IX
Stock of government
securities outstanding 1 066.8 1 052.6 1 051.7 1 040.4 1 058.6 1 046.5 1 126.5 1 142.1 1 157.1 1 232.1 1 247.4 1 282.4 1 255.7 1 255.7 1 187.6
Residents 1 018.1 1 004.8 1 007.3 996.2 997.4 981.7 1 061.8 1 087.7 1 100.8 1 164.9 1 183.4 1 218.8 1 190.4 1 190.9 1 121.4
Non-financial
corporations 28.8 28.8 28.7 28.7 29.7 29.7 29.7 29.7 29.7 29.7 30.4 30.4 30.4 30.4 30.2
Central bank 0 0 0 0 0 0 0.3 0.3 11.4 14.6 18.7 37.6 37.6 37.6 37.6
Credit institutions 453.7 445.7 448.0 422.8 425.9 397.0 444.1 467.0 474.0 535.3 556.6 574.5 563.3 565.0 492.0
Money market funds 11.5 10.3 10.4 10.4 6.8 6.1 4.4 0.9 0.3 0.3 0.3 0 0 0 0
Other financial
intermediaries excluding
investment funds 82.9 80.8 77.0 77.0 73.2 69.2 69.2 69.2 66.2 66.2 65.5 65.5 62.5 62.5 55.4
Financial auxiliaries 8.6 8.6 8.6 8.6 8.6 8.6 8.6 8.6 8.6 8.6 8.6 8.6 8.6 8.6 1.7
Insurance corporations
and pension funds 424.3 422.3 425.8 440.1 444.2 462.3 496.7 502.9 500.5 499.8 493.0 491.9 477.7 476.6 494.4
Insurance
corporations x x x x x 62.9 92.9 94.3 94.0 134.3 132.9 139.8 110.1 110.1 110.8
Pension funds x x x x x 399.4 403.8 408.6 406.5 365.5 360.1 352.1 367.6 366.6 383.6
Central government 0 0 0 0 0 0 0 0 0 0 0 0 0 0 0
Households 4.4 4.5 4.5 4.3 4.4 4.0 4.0 3.9 3.8 3.8 3.7 3.7 3.7 3.6 3.5
Non-profit institutions
serving households 3.8 3.8 4.3 4.3 4.7 4.8 4.8 5.3 6.4 6.7 6.7 6.7 6.7 6.7 6.7
Non-residents 48.7 47.8 44.4 44.2 61.2 64.9 64.8 54.4 56.3 67.3 64.1 63.7 65.4 64.8 66.2
Non-financial
corporations 0 0 0 0 0 0 0 0 0 0 0 0 0 0 0
Credit institutions 31.3 31.0 26.6 26.0 35.5 36.2 36.4 31.6 32.2 41.7 41.4 41.6 41.6 41.6 41.0
Money market funds 0 0 0 0 0 0 0 0 0 0 0 0 0 0 0
MFIs excluding central
banks, credit institutions
and money market funds 0 0 0 0 0 0 0 0 0 0 0 0 0 0 0
Other financial
intermediaries excluding
investment funds 0 0 0 0 0 0 0 0 0 0 0 0 0 0 0
Financial auxiliaries 17.3 16.7 17.6 18.0 25.6 28.6 28.2 22.6 24.0 25.5 22.5 21.9 23.6 23.0 25.1
Insurance corporations
and pension funds 0 0 0 0 0 0 0 0 0 0 0 0 0 0 0
Central government 0 0 0 0 0 0 0 0 0 0 0 0 0 0 0
Households 0.1 0.1 0.1 0.1 0.1 0.1 0.1 0.1 0.1 0.1 0.1 0.1 0.1 0.1 0.1
Non-profit institutions
serving households 0 0 0 0 0 0 0 0 0 0 0 0 0 0 0
28.

96
AUCTIONS OF GOVERNMENT SECURITIES IN THE PRIMARY MARKET
(Q2 and Q3 2015)
Date (dd.mm.) Initial maturity (months) Supply (thousands of euro) Demand (thousands of euro) Purchase (thousands of euro) Weighted average discount rate
(%)
Competitive multi-price auctions
15.04. 12 16 000 98 900 16 000 –0.012
22.04. 36 24 000 94 500 24 000 0.181
13.05. 36 24 000 104 995 24 000 0.184
03.06. 60 16 000 63 075 16 000 0.693
17.06. 36 24 000 76 300 24 000 0.250
08.07. 60 24 000 69 700 24 000 0.846
22.07. 12 16 000 53 900 16 000 0.045
02.09. 60 24 000 94 525 24 000 0.863
Primary placement of government securities via outright sales of securities
15.04. 12 4 000 20 001 4 000 –0.012
22.04. 36 6 000 59 000 6 000 0.181
13.05. 36 6 000 30 751 6 000 0.184
03.06. 60 4 000 31 500 4 000 0.693
17.06. 36 6 000 16 010 6 000 0.250
08.07. 60 6 000 31 500 6 000 0.846
22.07. 12 4 000 36 060 4 000 0.045
02.09. 60 6 000 55 000 6 000 0.863
29.
DYNAMICS OF GDP
20141 2015
Q1 Q2 Q3 Q4 Q11 Q2 Q3
At current prices (millions of euro) 23 580.9 5 254.5 5 831.2 6 163.3 6 331.9 5 385.7 6 070.3 6 439.8
At constant prices2 (millions of euro) 20 876.4 5 183.8 5 206.3 5 228.1 5 246.5 5 280.0 5 347.4 5 399.6
Annual growth rate (%) 2.4 2.3 3.2 2.2 2.2 1.9 2.7 3.3
Gross value added 2.0 2.9 2.0 1.7 2.0 1.5 2.7 2.8
1 Data have been revised.
2 Chain-linked; average prices in 2010. Quarterly data seasonally adjusted.
30.
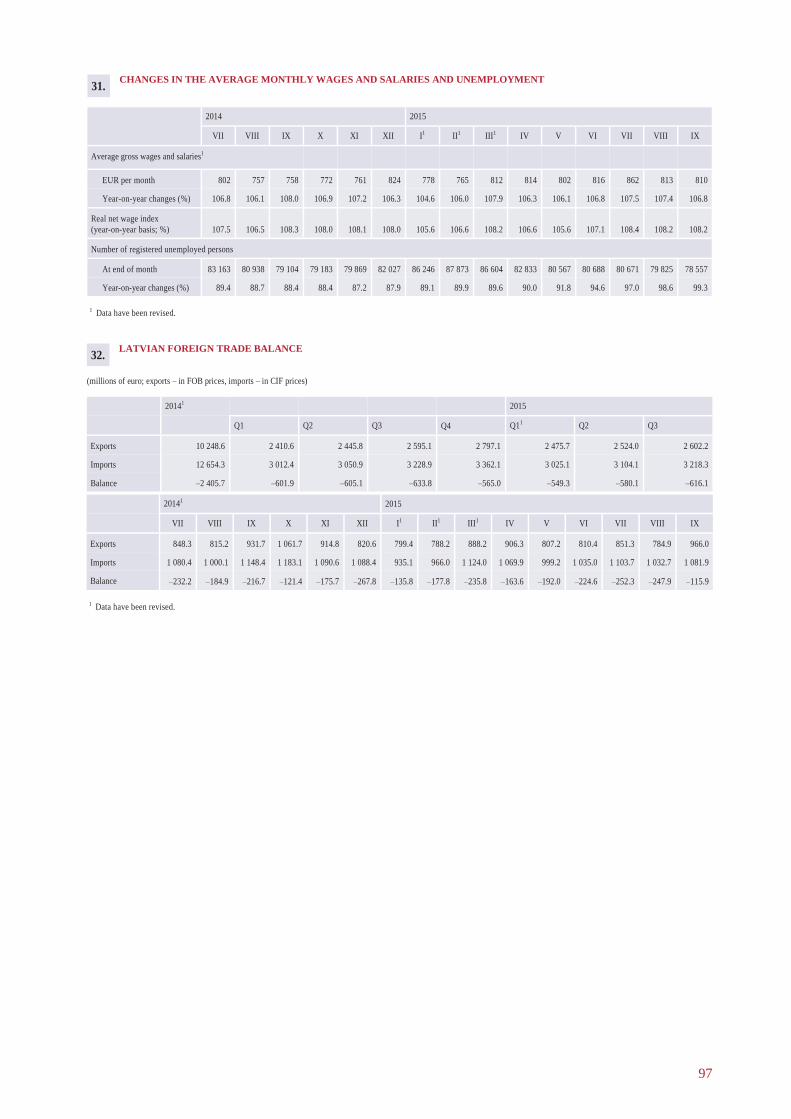
97
LATVIAN FOREIGN TRADE BALANCE
(millions of euro; exports – in FOB prices, imports – in CIF prices)
20141 2015
Q1 Q2 Q3 Q4 Q11 Q2 Q3
Exports 10 248.6 2 410.6 2 445.8 2 595.1 2 797.1 2 475.7 2 524.0 2 602.2
Imports 12 654.3 3 012.4 3 050.9 3 228.9 3 362.1 3 025.1 3 104.1 3 218.3
Balance –2 405.7 –601.9 –605.1 –633.8 –565.0 –549.3 –580.1 –616.1
CHANGES IN THE AVERAGE MONTHLY WAGES AND SALARIES AND UNEMPLOYMENT
2014 2015
VII VIII IX X XI XII I1 II1 III1 IV V VI VII VIII IX
Average gross wages and salaries1
EUR per month 802 757 758 772 761 824 778 765 812 814 802 816 862 813 810
Year-on-year changes (%) 106.8 106.1 108.0 106.9 107.2 106.3 104.6 106.0 107.9 106.3 106.1 106.8 107.5 107.4 106.8
Real net wage index
(year-on-year basis; %) 107.5 106.5 108.3 108.0 108.1 108.0 105.6 106.6 108.2 106.6 105.6 107.1 108.4 108.2 108.2
Number of registered unemployed persons
At end of month 83 163 80 938 79 104 79 183 79 869 82 027 86 246 87 873 86 604 82 833 80 567 80 688 80 671 79 825 78 557
Year-on-year changes (%) 89.4 88.7 88.4 88.4 87.2 87.9 89.1 89.9 89.6 90.0 91.8 94.6 97.0 98.6 99.3
1 Data have been revised.
20141 2015
VII VIII IX X XI XII I1 II1 III1 IV V VI VII VIII IX
Exports 848.3 815.2 931.7 1 061.7 914.8 820.6 799.4 788.2 888.2 906.3 807.2 810.4 851.3 784.9 966.0
Imports 1 080.4 1 000.1 1 148.4 1 183.1 1 090.6 1 088.4 935.1 966.0 1 124.0 1 069.9 999.2 1 035.0 1 103.7 1 032.7 1 081.9
Balance –232.2 –184.9 –216.7 –121.4 –175.7 –267.8 –135.8 –177.8 –235.8 –163.6 –192.0 –224.6 –252.3 –247.9 –115.9
1 Data have been revised.
31.
32.

98
MAIN EXPORT GOODS OF LATVIA
(in FOB prices)
20141 2015
Q11 Q2 Q3
Millions of
euro
% Millions of
euro
% Millions of
euro
% Millions of
euro
%
Total 10 248.6 100.0 2 475.7 100.0 2 524.0 100.0 2 602.2 100.0
Agricultural and food products 1 981.1 19.3 374.7 15.1 374.1 14.8 514.0 19.8
Mineral products 849.1 8.3 186.7 7.6 174.3 6.9 202.7 7.8
Products of the chemical and allied industries 699.7 6.8 172.3 7.0 187.1 7.4 186.0 7.1
Plastics and articles thereof; rubber and articles
thereof 320.4 3.1 76.0 3.1 82.5 3.3 83.1 3.2
Wood and articles of wood 1 700.0 16.6 435.5 17.6 440.9 17.5 430.4 16.5
Pulp of wood; paper and paperboard 214.2 2.1 56.4 2.3 59.0 2.3 64.7 2.5
Textiles and textile articles 421.8 4.1 123.2 5.0 90.3 3.6 83.6 3.2
Articles of stone, plaster, cement, glassware and
ceramic products 228.3 2.2 60.0 2.4 63.3 2.5 70.4 2.7
Base metals and articles of base metals 925.2 9.0 216.5 8.7 249.0 9.9 238.1 9.2
Machinery and mechanical appliances; electrical
equipment 1 724.5 16.9 493.4 19.9 474.4 18.8 468.1 18.0
Transport vehicles 528.3 5.2 119.8 4.8 144.9 5.7 104.9 4.0
Miscellaneous manufactured articles 321.3 3.1 86.2 3.5 91.0 3.6 81.7 3.1
Other goods 334.8 3.3 75.0 3.0 93.3 3.7 74.4 2.9
1 Data have been revised.
33.
MAIN IMPORT GOODS OF LATVIA
(in CIF prices)
20141 2015
Q11 Q2 Q3
Millions of
euro
% Millions of
euro
% Millions of
euro
% Millions of
euro
%
Total 12 654.3 100.0 3 025.1 100.0 3 104.1 100.0 3 218.3 100.0
Agricultural and food products 1 995.8 15.7 439.9 14.6 470.1 15.2 506.4 15.7
Mineral products 1 841.0 14.5 358.7 11.9 352.2 11.4 405.4 12.6
Products of the chemical and allied industries 1 196.3 9.5 323.0 10.7 320.7 10.3 343.7 10.7
Plastics and articles thereof; rubber and articles
thereof 733.9 5.8 173.9 5.7 180.6 5.8 189.3 5.9
Wood and articles of wood 330.5 2.6 94.9 3.1 94.9 3.1 90.9 2.8
Pulp of wood; paper and paperboard 305.3 2.4 71.8 2.4 71.8 2.3 82.8 2.6
Textiles and textile articles 587.0 4.6 161.4 5.3 121.2 3.9 135.4 4.2
Articles of stone, plaster, cement, glassware and
ceramic products 236.4 1.9 52.5 1.7 60.6 2.0 61.7 1.9
Base metals and articles of base metals 1 044.4 8.3 249.6 8.3 273.3 8.8 265.1 8.2
Machinery and mechanical appliances; electrical
equipment 2 538.9 20.1 663.1 21.9 693.5 22.3 687.8 21.4
Transport vehicles 975.1 7.7 227.7 7.5 245.4 7.9 220.6 6.9
Miscellaneous manufactured articles 299.0 2.4 74.8 2.5 75.9 2.4 76.6 2.4
Other goods 570.7 4.5 133.9 4.4 144.0 4.6 152.7 4.7
1 Data have been revised.
34.

99
LATVIAN FOREIGN TRADE PARTNERS
(exports – in FOB prices, imports – in CIF prices)
2015 Q11 Q2 Q3
Millions of euro % of the total Millions of euro % of the total Millions of euro % of the total
Exports Imports Balance Exports Imports Exports Imports Balance Exports Imports Exports Imports Balance Exports Imports
Total 2 475.7 3 025.1 –549.3 100.0 100.0 2 524.0 3 104.1 –580.1 100.0 100.0 2 602.2 3 218.3 –616.1 100.0 100.0
Euro area
countries 1 242.5 1 657.2 –414.7 50.2 54.8 1 241.4 1 823.2 –581.8 49.2 58.7 1 306.8 1 894.4 –587.6 50.2 58.9
EU28 countries 1 880.3 2 329.0 –448.7 76.0 77.0 1 847.2 2 489.3 –642.0 73.2 80.2 1 899.8 2 574.0 –674.1 73.0 80.0
incl. Germany 173.6 321.0 –147.4 7.0 10.6 161.1 351.3 –190.3 6.4 11.3 168.9 356.1 –187.2 6.5 11.1
Sweden 140.3 98.5 41.8 5.7 3.3 136.1 108.4 27.8 5.4 3.5 133.6 102.7 30.9 5.1 3.2
UK 127.8 50.2 77.6 5.2 1.7 136.6 54.1 82.5 5.4 1.7 135.7 70.5 65.2 5.2 2.2
Finland 45.7 150.0 –104.3 1.8 5.0 42.0 166.7 –124.8 1.7 5.4 55.9 191.7 –135.8 2.1 6.0
Denmark 106.4 62.4 44.1 4.3 2.1 100.1 70.1 30.0 4.0 2.3 105.9 72.5 33.4 4.1 2.3
Netherlands 70.8 111.3 –40.5 2.9 3.7 59.2 121.9 –62.7 2.3 3.9 59.0 119.3 –60.3 2.3 3.7
Lithuania 455.6 496.4 –40.8 18.4 16.4 485.7 557.4 –71.7 19.2 18.0 520.0 604.8 –84.8 20.0 18.8
Estonia 303.4 236.4 67.0 12.3 7.8 297.7 249.1 48.6 11.8 8.0 306.3 249.7 56.6 11.8 7.8
Poland 171.3 365.3 –194.0 6.9 12.1 149.1 349.1 –200.0 5.9 11.2 147.2 335.2 –187.9 5.7 10.4
CIS 255.5 382.8 –127.3 10.3 12.6 305.2 340.0 –34.8 12.1 10.9 315.6 354.9 –39.3 12.1 11.0
incl. Russia 166.0 266.5 –100.4 6.7 8.8 212.1 227.0 –14.9 8.4 7.3 210.4 250.0 –39.6 8.1 7.8
Other countries 339.9 313.3 26.6 13.7 10.4 371.5 274.9 96.7 14.7 8.9 386.8 289.5 97.3 14.9 9.0
incl. USA 35.7 28.2 7.5 1.4 0.9 38.7 17.4 21.3 1.5 0.6 38.2 18.0 20.2 1.5 0.6
Norway 55.2 14.6 40.6 2.2 0.5 63.0 13.2 49.8 2.5 0.4 53.3 12.2 41.1 2.0 0.4
China 34.4 119.1 –84.7 1.4 3.9 25.4 98.0 –72.6 1.0 3.2 23.6 108.3 –84.7 0.9 3.4
1 Data have been revised.
35.
CONVENIENCE AND EXTENDED CREDIT, REVOLVING LOANS AND OVERDRAFT TO RESIDENT NON-FINANCIAL
CORPORATIONS AND HOUSEHOLDS
(at end of period; millions of euro)
Non-financial corporations Households
Revolving loans and
overdraft
Convenience credit Extended credit Revolving loans and
overdraft
Convenience credit Extended credit
2014
VII 904.2 1.8 1.3 64.1 12.9 121.9
VIII 961.6 1.6 1.3 64.6 13.0 121.7
IX 951.9 1.8 1.3 64.0 11.3 122.1
X 966.0 1.9 1.2 66.0 11.3 121.1
XI 974.3 1.7 1.2 64.4 11.1 119.1
XII 761.8 1.6 1.0 57.4 7.2 114.8
2015
I 767.6 1.6 1.0 58.0 7.2 112.7
II 770.7 1.6 1.0 56.7 7.3 110.8
III 768.2 1.8 1.0 56.9 7.5 111.6
IV 742.4 1.8 1.0 51.9 7.3 111.0
V 725.7 1.7 1.1 53.1 7.3 111.3
VI 719.5 1.7 1.1 51.8 7.4 111.4
VII 724.1 1.7 1.0 51.6 7.4 110.1
VIII 734.7 1.6 1.1 52.2 7.1 110.4
IX 732.7 1.8 1.1 51.7 6.9 111.7
36.

100
LOANS TO RESIDENT NON-FINANCIAL CORPORATIONS IN THE BREAKDOWN BY RESIDUAL MATURITY AND BY
INTEREST RATE RESET PERIOD
(at end of period; millions of euro)
In euro
With original maturity of over 1 year With original maturity of over 2 years
with a residual maturity
of up to 1 year
with a residual maturity of
over 1 year and interest
rate reset period ≤1 year
with a residual maturity
of up to 2 years
with a residual maturity of
over 2 years and interest
rate reset period ≤2 years
2014
IX 4 905.4 1 055.2 3 344.5 4 631.9 1 610.7 2 891.7
XII 4 812.8 769.6 3 853.1 4 558.9 1 426.9 2 987.2
2015
III 4 705.7 841.5 3 639.0 4 485.5 1 502.4 2 817.9
VI 4 691.7 850.4 3 661.0 4 507.7 1 493.5 2 878.8
IX 4 833.5 977.7 3 662.6 4 634.0 1 489.6 2 986.0
37.a
LOANS TO RESIDENT HOUSEHOLDS IN THE BREAKDOWN BY RESIDUAL MATURITY AND BY INTEREST RATE RESET
PERIOD
(at end of period; millions of euro)
In euro
With original maturity of over 1 year With original maturity of over 2 years
with a residual maturity
of up to 1 year
with a residual maturity of
over 1 year and interest
rate reset period ≤1 year
with a residual maturity
of up to 2 years
with a residual maturity of
over 2 years and interest
rate reset period ≤2 years
2014
IX 5 173.2 227.3 4 195.7 5 118.0 415.6 4 243.2
XII 5 089.9 210.0 4 220.7 5 044.4 317.2 4 227.5
2015
III 5 033.0 223.3 4 128.9 4 986.6 337.0 4 176.0
VI 4 989.8 224.6 4 110.6 4 947.0 351.5 4 195.3
IX 4 962.6 223.0 4 106.2 4 920.0 353.9 4 197.2
37.b
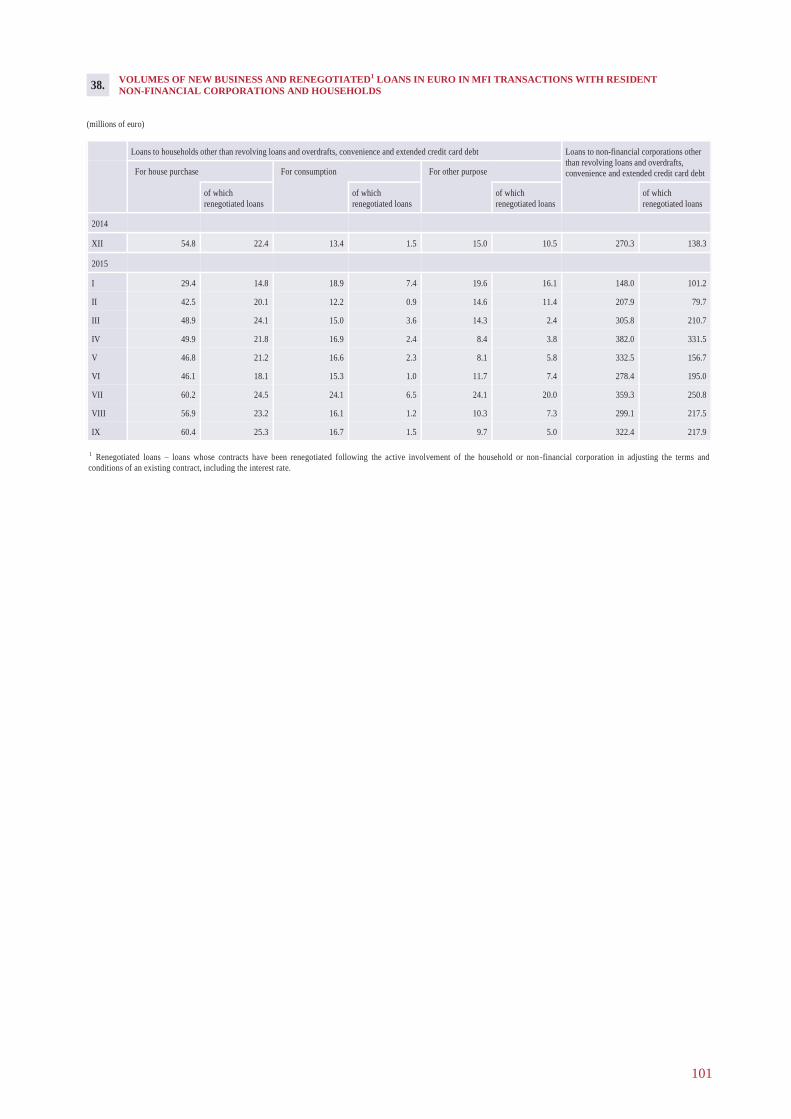
101
VOLUMES OF NEW BUSINESS AND RENEGOTIATED1 LOANS IN EURO IN MFI TRANSACTIONS WITH RESIDENT
NON-FINANCIAL CORPORATIONS AND HOUSEHOLDS
(millions of euro)
Loans to households other than revolving loans and overdrafts, convenience and extended credit card debt Loans to non-financial corporations other
than revolving loans and overdrafts,
convenience and extended credit card debt For house purchase For consumption For other purpose
of which
renegotiated loans
of which
renegotiated loans
of which
renegotiated loans
of which
renegotiated loans
2014
XII 54.8 22.4 13.4 1.5 15.0 10.5 270.3 138.3
2015
I 29.4 14.8 18.9 7.4 19.6 16.1 148.0 101.2
II 42.5 20.1 12.2 0.9 14.6 11.4 207.9 79.7
III 48.9 24.1 15.0 3.6 14.3 2.4 305.8 210.7
IV 49.9 21.8 16.9 2.4 8.4 3.8 382.0 331.5
V 46.8 21.2 16.6 2.3 8.1 5.8 332.5 156.7
VI 46.1 18.1 15.3 1.0 11.7 7.4 278.4 195.0
VII 60.2 24.5 24.1 6.5 24.1 20.0 359.3 250.8
VIII 56.9 23.2 16.1 1.2 10.3 7.3 299.1 217.5
IX 60.4 25.3 16.7 1.5 9.7 5.0 322.4 217.9
1 Renegotiated loans – loans whose contracts have been renegotiated following the active involvement of the household or non -financial corporation in adjusting the terms and
conditions of an existing contract, including the interest rate.
38.

Additional InformationGeneral notesThe cut-off date for the information used in this report is 4 december 2015.
The Macroeconomic Developments Report published by Latvijas Banka is based on data provided by the CSB, ECB, the Treasury, NASdAQ Riga, Euribor-EBF and Latvijas Banka.
data sources for charts are EC (Charts 1.1, 1.3, 3.4, 3.5, 4.3, 4.4, 4.10, 4.11, 4.14, 4.15 and 5.5), Rosstat (Chart 1.1), Markit (Chart 1.2), CSB (Charts 1.4, 1.5, 2.25, 3.1–3.4, 3.7–3.9, 4.1, 4.2, 4.5–4.9, 4.11–4.13, 5.1, 5.4, 6.2 and 6.3), Bloomberg (Charts 2.1–2.7, 2.9 and 2.10), the Treasury (Charts 2.8 and 3.10–3.12), Latvijas Banka (Charts 2.11–2.26, 4.9, 4.13, 4.15, 5.1, 6.1– 6.3, 7.1 and 7.2), ECB (Chart 2.12), Road Traffic Safety directorate (Chart 3.6), SEA (Chart 4.9), SRS (Chart 4.11), Reuters (Chart 5.2) and Food and Agriculture Organization of the United Nations (Chart 5.3).
data sources for Statistics tables are Latvijas Banka (Tables 1, 3, 4, 6–25, 27, 28 and 36–38), NASdAQ Riga (Table 1), the Treasury (Tables 1, 2ab and 29), Euribor-EBF (Table 1), CSB (Tables 2ab and 30–35) and ECB (Tables 5 and 26).
Details may not add because of rounding-off.
FOB value is the price of a commodity on the border of the exporting country, including the transportation and insurance costs only up to the border.
CIF value is the price of a commodity on the border of the importing country, including the transportation and insurance costs only up to the border.
"–" – no transactions in the period; "x" – no data available, no computation of indicators possible or insufficient number of respondents to publish information.
Money and banking sectorCalculation of monetary aggregates includes the balance sheet data of Latvijas Banka and information from the financial position reports of other MFIs, prepared using methodology of Latvijas Banka (see Latvijas Banka Regulation No. 132 "Regulation for Compiling the 'Monthly Financial Position Report' of Monetary Financial Institutions" of 16 May 2014).
In the publication, the following terms have been used:
MFIs – financial institutions forming the money-issuing sector. In Latvia, MFIs include Latvijas Banka, credit institutions and other MFIs in compliance with the List of Monetary Financial Institutions of the Republic of Latvia compiled by Latvijas Banka. In the EU, MFIs include the ECB, the national central banks of the euro area, credit institutions and other MFIs (money market funds) in compliance with the original List of MFIs published by the ECB.
Non-MFIs – entities other than MFIs.
Financial institutions – other financial intermediaries, excluding insurance corporations and pension funds, (hereinafter, OFIs), financial auxiliaries, insurance corporations and pension funds.
OFIs – financial corporations that are primarily engaged in financial intermediation by incurring liabilities in forms other than currency, deposits and close substitutes for deposits from their customers other than MFIs, or insurance technical reserves. OFIs are corporations engaged in lending (e.g. financial leasing companies, factoring companies, export/import financing companies), investment funds, investment brokerage companies, financial vehicle corporations, financial holding corporations, and venture capital corporations. OFIs data include also financial auxiliaries' data.
102
AddITIONAL INFORMATIONMACROECONOMIC dEVELOPMENTS REPORTDecember 2015

Financial auxiliaries – financial corporations that are primarily engaged in auxiliary financial activities, i.e. activities that are closely related to financial intermediation but are not financial intermediation themselves, e.g. investment brokers who do not engage in financial intermediation services on their own behalf, corporations that provide infrastructure for financial markets, central supervisory institutions of financial institutions and the financial market provided that they are separate institutional units. In Latvia, the FCMC and the NASdAQ Riga shall also be regarded as financial auxiliaries. Financial auxiliaries' data are included in OFIs data.
Non-financial corporations – economic entities producing goods or providing non-financial services with the aim of gaining profit or other yield.
Households – natural persons or groups of natural persons whose principal activity is consumption and who produce goods and services exclusively for their own consumption, as well as non-profit institutions serving households. The following are also regarded as households in the Republic of Latvia: persons engaged in individual entrepreneurship provided that they have not registered their activity with the Commercial Register of the Enterprise Register of the Republic of Latvia.
Holdings of securities other than shares – financial assets, which are instruments of the holder, usually negotiable and traded or compensated on secondary markets and which do not grant the holder any ownership rights over the issuing institutional unit.
The following information is published in accordance with the ECB methodology:
1) Assets and liabilities of Latvijas Banka (Table 6), expanding the range of reported financial instruments;
2) Aggregated balance sheet of MFIs (excluding Latvijas Banka), i.e. the sum of the harmonised balance sheets of Latvia's MFIs, excluding Latvijas Banka (Table 7);
3) monetary aggregates and their components (Table 4) reflect Latvia's contributions to the euro area monetary aggregates and their counterparts. These are obtained from the consolidated balance sheet of MFIs. Latvia's contributions to the following monetary aggregates are calculated and published:– overnight deposits in all currencies held with MFIs; – deposits redeemable at a period of notice of up to and including 3 months (i.e. short-term savings deposits) made in all currencies and deposits with an agreed maturity of up to and including 2 years (i.e. short-term time deposits) in all currencies held with MFIs.– repurchase agreements, debt securities with a maturity of up to and including 2 years issued by MFIs, and money market fund shares and units.
The monetary aggregates of Latvijas Banka (Table 3) are also published comprising the national contribution to the euro area monetary base and the counterparts, as well as a monetary survey of Latvia's MFIs (excluding Latvijas Banka; Table 10).
In view of the fact that Latvijas Banka collects more comprehensive information, the following is also published:
1) consolidated balance sheet of MFIs obtained by netting out inter-MFI positions in the aggregated balance sheet of Latvia's MFIs (Table 8). due to slight accounting methodology differences, the sum of the inter-MFI positions is not always zero; therefore, the balance is reported under the item Excess of inter-MFI liabilities.
2) Aggregated balance sheet of Latvia's MFIs (excluding Latvijas Banka) which is the sum of the harmonised balance sheets (Tables 9ab);
3) Information characterising foreign assets and foreign liabilities of MFIs (excluding Latvijas Banka; Tables 11ab), including selected items in the monthly financial position report of MFIs (excluding Latvijas Banka) by group of countries (Table 12);
103
AddITIONAL INFORMATIONMACROECONOMIC dEVELOPMENTS REPORTDecember 2015

4) Information characterising the maturity profile and types of deposits (including repo agreements) of Latvia's financial institutions, non-financial corporations and households with MFIs (excluding Latvijas Banka; Tables 13 and 14abc) as well as government and non-resident deposits (Table 14d). deposits redeemable at notice have been grouped by period of notice. Long-term deposits include deposits with the original maturity of over 1 year. The breakdown of MFI (excluding Latvijas Banka) deposits by currency is provided in Tables 20ab;
5) Information characterising the maturity profile and types of MFI (excluding Latvijas Banka) loans to Latvia's financial institutions, non-financial corporations and households (Tables 15, 16ab, 17, 18, 36 and 37) as well as government and non-resident loans (Table 16c). The breakdown of MFI (excluding Latvijas Banka) loans by currency is provided in Tables 20cd;
6) Information characterising MFI (excluding Latvijas Banka) securities holdings (Tables 19ab and 20ef);
7) Information characterising debt securities issued by MFIs (excluding Latvijas Banka; Table 20g).
Interest ratesThe interest rates calculation includes information from MFI reports prepared in compliance with Latvijas Banka Regulation No. 133 "Regulation for Compiling Interest Rate Reports of Monetary Financial Institutions" of 16 May 2014. Based on the methodology laid out in the above Regulation, credit institutions, branches of foreign credit institutions and particular credit unions registered in the Republic of Latvia have to provide information on interest rates on deposits and loans applied in transactions with resident non-financial corporations and households.
Information on interest rates on deposits and loans applied in transactions with non-financial corporations and households provided by credit institutions, branches of foreign credit institutions and credit unions registered in the Republic of Latvia is collected (Table 21). Interest rate statistics is collected on new business and outstanding amounts. All rates included in the interest rate statistics are weighted average rates. When preparing the interest rate statistics, credit institutions use annualised agreed rates (AAR) or narrowly defined effective rates (NdER) and annual percentage rate of charge (APRC). Credit institutions have to select the calculation of the AAR or the NdER based on the terms and conditions of the agreement. The NdER can be calculated on any deposit or loan. In addition to the AAR or the NdER, the APRC is reported for loans to households for house purchase and consumer credits.
The interest rates on new business with overnight deposits and deposits redeemable at notice and on their outstanding amounts coincide.
Interest rates on new loans are reported on the basis of the initial rate fixation period set in the agreement, whereas overdraft interest rates are reported on loan balances.
When reporting the interest rates on consumer credit and other credit to households with the maturity of up to 1 year and loans to non-financial corporations with the maturity of up to 1 year, interest rates on overdraft are included.
Interbank market lending interest rates (Table 23) are reported as weighted average interest rates on new business, aggregating the information submitted by credit institutions, prepared based on the methodology of Latvijas Banka (see Latvijas Banka Regulation No. 102 "Regulation for Compiling the 'Report on Monetary Market Transactions'" of 16 May 2013).
104
AddITIONAL INFORMATIONMACROECONOMIC dEVELOPMENTS REPORTDecember 2015

Foreign exchange and exchange ratesInformation characterising the foreign currency selling and buying transactions is reported based on the methodology of Latvijas Banka (see Latvijas Banka Regulation No. 36 "Regulation for Purchasing and Selling Cash Foreign Currency" of 13 May 2009 and Latvijas Banka Regulation No. 101 "Regulation for Compiling Reports on Foreign Currency Purchases and Sales" of 16 May 2013). The principal foreign exchange transactions (Table 24) comprise the cash and non-cash transactions conducted by credit institutions and branches of foreign credit institutions, reported by transaction type and counterparty, and currency. Non-cash foreign exchange transactions (Table 25) comprise non-cash transactions performed by credit institutions and branches of foreign credit institutions, reported by major currency.
The euro reference rates published by the ECB (Table 26) are reported as monthly mathematical averages. Weighted average exchange rates (cash transactions; Table 27) are reported based on the information provided by credit institutions and branches of foreign credit institutions as well as currency exchange bureaus.
105
AddITIONAL INFORMATIONMACROECONOMIC dEVELOPMENTS REPORTDecember 2015