macro research report submitted to indian institute of ...research report abstract: this research...
TRANSCRIPT

Macro Research Report submitted to
Indian Institute of Banking & Finance for the Year 2017-18 Titled:
Shadow banking in India: Do bank run Asset Management Companies (AMCs)
perform liquidity transformation through exposure to Non-Banking Finance
Companies (NBFC) in their debt oriented schemes and will this increase the
systemic risk of a bank due to a possible joint exposure to NBFCs?
Principal Investigator: Jaslene Bawa1.
Co-Investigator: Sankarshan Basu2
Co-Investigator: Asish Saha3.
1 Assistant Professor, Finance and Accounting, FLAME University, Pune. E-mail: [email protected], Mobile: 8349501141 2 Professor, Finance and Accounting, Indian Institute of Management, Bangalore, E-mail: [email protected] 3 Professor, Finance and Accounting, FLAME University, Pune, E-mail: [email protected]

2
Research Report Abstract:
This research studies the joint exposure that Indian banks face through their balance sheet i.e. direct
lending, investment and their off-balance sheet i.e. stand by letter of credit (SBLC) issued on behalf of
Indian Non-banking finance companies (NBFC) for their commercial paper and an indirect exposure
to the same NBFC through its asset management arms. Using data from Reserve Bank of India, Micro
Finance Institutions Network, monthly portfolio disclosure of asset management companies’ and
annual reports of NBFCs and banks during the period 2012 to 2018, Ministry of Corporate Affairs
(MCA) index charges, company shelf prospectus the paper tries to address three questions: first,
whether a joint exposure exists to a particular NBFC at a bank level and at the banks’ mutual fund arm
level; second, whether asset management arms of these banks function as shadow banks and
undertake liquidity transformation through investing in NBFC floated debentures and commercial
paper and how this adds to the joint exposure of the Indian banks; and third whether the banks
financial interdependency with these financial institutions such as NBFCs and mutual funds affects the
overall systemic risk. The paper uses the Bai – Perron (1998) model with multiple structural breaks for
assessing the liquidity transformation in debt schemes and the Diebold – Yilmaz (2009, 2012 and 2014)
models to estimate the return spill-over effect (financial interdependency)4.
4 We thank Mr. Rohit Goel, Research Officer in the International Monetary Fund (IMF) Monetary and Capital Markets Department for his help with the financial interdependency portion of this report. e-mail: [email protected]

3
Acknowledgements:
I would like to thank Indian Institute of Banking and Finance (IIBF) and FLAME University for providing
me this opportunity of conducting a study on the topic of Shadow Banking in India. I would also like
to thank the IIBF reviewer committee who helped improve this research with their valuable inputs,
the co-investigators of this research and Mr. Rohit Goel who has helped us with the interdependency
portion of the study.

4
Table of Contents
S. No Topic Page No.
Research Abstract 2
Acknowledgement 3
1. Introduction 7
1. A Backdrop 10
1. B How does a NBFC default affect the entire financial system? 14
2. Shadow banking: Overview 32
3. Overview of Non-Banking Finance Companies (NBFC) in India 39
4. NBFCs loan growth higher than Scheduled Commercial Banks 44
5. How are these NBFCs funding their loan growth? 50
5. A How did the commercial paper funding lead to asset liability
mismatch problems?
54
5. B Joint exposure of AMC to banks and NBFCs 64
5. C Results for Proposition I 66
6. Financial institutions interdependency 72
6. A Scenarios 84
6. B Parent banks’ exposure to its own subsidiary NBFCs: Indian banking
system connectedness with other Financial Institutions
89
6. C Results for Proposition II and Hypothesis II 92
6. D Results for Proposition III and Hypothesis III 116
7. Data Sources and Methodology 128
7. A Bai-Perron – Least Squares Method 129
7. B Diebold Model for Joint Exposure (Network Connectivity) 132
8. Concluding remarks and recommendations 135
9. About the Research Investigators 138
10. References 140
11. Appendix 143

5
List of Tables
Table No Table Title Page No.
1 Bond spread change over a Three week period when a NBFC debt i.e. IL&FS
was downgraded to “D”
18
2 Number and Asset size of NBFC ND-SI 40
3 Sector-wise fund exposure of 20 Scheduled Commercial Banks and Gross
NPAs as on 31 March 2018
46
4 NBFC funding composition as a percentage of total NBFC assets and
borrowings
51
5 Commercial Paper Issuances between 30 April 2018 to 15 November 2018
and rate of interest
57
6 Select NBFC Asset Liability maturity 59
7 Sector–wise (NBFC, Real Estate and others) allocation of debt schemes from
March 2015 to March 2019
67
8 Joint exposure of Parent bank through NBFC – mutual fund arm to other
banks and NBFCs
71
9 Direct net exposure of Banks, AMCs and Insurance Companies to NBFCs 79
10 Select banks’ exposure to NBFCs 81
11 Cross-holding across Financial Institutions in India 90
12 Result for breakpoint regression 98
13 Result for least square regression with control for redemption (t-1) 100
14 Result for breakpoint regression with control for redemption (t-1) 101
15 Top 18 MMFs contribute 74% AuM under MMMF category 106
16 ICICI Liquid Fund cash relationship with individual securities 107
17 Percentage of Schemes Underperforming the benchmark from March 2013
to September 2018
110
18 Common Exposure of NBFC at both mutual fund portfolio and Parent Bank
loan level
112
19 Select Open-ended debt funds exposure to IL&FS debt securities 123

6
List of Diagrams
Diagram No Diagram Title Page No
1 NIFTY Bank Index falls ~11% over the period 31 August 2018 to 28 September 2018
21
2 Standby Letter of Credit (SBLC) usage to evergreen bad loans at domestic bank 29
3 Bank exposure to OFIs using bank funding and growth 38
4 SCB non-food bank credit growth (y-o-y) 47
5 NBFC loan growth Vis a Vis SCB loan growth 48
6 Sequential development of propositions and testing 62
7 Scheduled commercial banks investment in mutual funds during the period 2003 to
2018
73
8 CBLO trade value growth (y-o-y) during period Apr 2010 to May 2018 76
9 MF CBLO exposure from Jan 2012 to May 2018 77
10 Financial Interdependency among financial institutions and banks 83
11 Scenario A - Transmission of funds (without bank guarantee) 85
12 Scenario B - Transmission of funds (with bank guarantee) 87
13 NBFC exposure to Debt schemes January 2012 – January 2018 93
14 Sectoral deployment of credit by NBFCs 95
15 Scenario C - Transmission of funds (with bank guarantee and stand by letter of
credit)
103
16 Spill over between Private sector and Public sector banks and NBFCs - HFCs 117
17 Pairwise spill over between Parent Bank and its NBFC 120
18 Pairwise spill over between Private, Public sector banks and HFCs 121
19 NAV day on day growth of Franklin India Corporate Debt Fund (July 2, 2018 to
August 2, 2018) i.e. erstwhile Franklin Corporate Income Builder Fund and Franklin
India Credit Risk Fund i.e. erstwhile Franklin Corporate debt opportunities Fund
122
20 NAV day on day growth of Select Open-Ended Debt Mutual Funds (August 31, 2018
to October 2, 2018) [i.e. erstwhile Principal PNB Asset Management now Principal
Mutual Fund] that had exposure to IL&FS debt securities
125-126
21 Spill over in other segments 126
Matrix No 1 Spill over between Private sector and Public – sector banks and NBFCs – HFCs 120
7
1. Introduction:
This study begins with describing how the global financial markets suffered due to the sub-prime crisis
in 2007-08 as a number of financial institutions (such as mutual funds) had an exposure to debt
instruments that were backed by poor quality mortgage assets. These financial institutions had
undertaken maturity and liquidity transformation similar to a traditional bank. These institutions were
suggested to have functioned like a “shadow bank”. These shadow banking activities went undetected
under the regulatory framework that generated a fall out. This created a very high systemic risk for
the whole financial system. Although shadow banking is highly pervasive in the developed countries
such as U.S. and Europe, also it is extremely prevalent in the emerging economies since these
economies have a large population that has no access to traditional banking. In an emerging economy
like India shadow banks function in the form of Non-banking Finance Companies (NBFCs) and they
lend to corporate and retail borrowers with a reasonable credit history function (Acharya at.al, 2013).
These NBFCs act as a complement to the traditional banking system. However, they aren’t regulated
as closely as Indian banks. Over the recent past, the loan book growth of these NBFCs has
outperformed the Indian banks loan book growth. This NBFC loan book growth is mostly funded
through bank loans and asset management companies (AMC). Owing to the slowdown in the banking
sector due to high levels of non-performing assets, the banks’ loan disbursal to NBFCs had reduced
and the NBFC funding reliance shifted to increased borrowing from AMC (through investment in NBFC
floated commercial papers and debentures) mostly through commercial paper.
More than 50% of the Net Asset Value (NAV) of AMCs debt oriented schemes have an exposure to
NBFC floated securities (commercial paper, securitization and debentures). A striking feature of the
top most AMCs that contribute nearly 50% of the assets under management in the industry is that a
large part of them are bank run or financial institution run. This brings us to the point where banks

8
undertake a dual exposure to NBFCs through 1) Direct lending and investment 2) Investment through
AMC held portfolio.
The Reserve bank of India (RBI) duly monitors the NBFC exposure limit at the bank and the AMC level
separately. However, consolidated risk monitoring is still far from reality. Basel III pillar disclosures
deliberate on the consolidated risk for the bank and the AMC (as these AMCs are majority owned
subsidiaries of banks) on a group level. But this is yet to be implemented across Indian banks.
AMCs may resort to undertake the function of liquidity transformation on behalf of their parent banks
as they fund NBFC floated securities using investor money. NBFCs have a heavy funding dependency
on commercial paper in which bank and financial institution run AMCs are the largest investors. Owing
to the short-term maturity of commercial paper (CP) that NBFCs use to fund loans of longer maturity
to NBFC customers. When an NBFC raises a large portion of its total funding through CPs this situation
generates a high roll-over risk and may lead to funding drying up in case the AMC does not roll over
the CP.
Typically, it has generated an asset liability mismatch (ALM) for majority of the NBFCs barring a few
such as HDFC. The occurrence of recent events in the market such as default on the part of
Infrastructure Leasing and Financial Services (IL&FS) on its debt securities worth INR. 37.61 billion i.e.
22.84% of the debt on its books and IL&FS having a consolidated debt level worth INR. 9,100 billion5.
With this default event, the entire NBFC segment faced a temporary upheaval in the form of liquidity
drying up and the Reserve Bank of India (RBI) and the Government had to step in and introduce a slew
of measures to curb the panic in the market. We will discuss this event, its impact on the fund schemes
5 Bloomberg Quint, Finance Ministrys’ Reading of How Big the IL&FS Crisis is?, 08 October 2018, available on the internet at, https://www.bloombergquint.com/business/finance-ministrys-reading-of-how-big-is-the-ilfs-crisis#gs.vpIH6Dw, accessed on 01 December 2018

9
NAV that had an exposure to IL&FS and the measures undertaken on behalf of the RBI to calm the
nerves of investors and market participants later in this report.
The occurrence of these events over the past two to three months have re-affirmed that NBFCs can
pose a systemic risk to the entire financial system as a joint exposure exists between financial
institutions and banks. This report has primarily attempted to answer three questions and to establish
the extent of fallout a NBFC can have on its peers and other financial institutions and banks:
a) Does joint/dual exposure to NBFCs exist in the present Indian financial system?
b) Do bank run AMCs through their open-ended debt-oriented schemes indulge in liquidity
transformation?
c) Does the banks systemic risk increase due to the joint/dual exposure to NBFCs?
These three propositions are later presented in this study in a diagrammatic format in Diagram No. 6.
Each subsequent proposition is based on proving the previous proposition true.
This research report is categorized into eight sections. The first section provides a backdrop that
covers the United States Financial crisis, NBFCs in India, their dependency on AMC funding, how an
NBFC default can affect the financial system, and how an AMC investor is different from a bank
depositor, the second section covers the overview of shadow banking in the global and Indian market,
the third section covers the overview of non-banking finance companies (NBFC) in India, the fourth
section covers the NBFC loan growth, the fifth section covers how the NBFCs have been funding their
loan growth and the sixth section describes the financial interdependency among banks and asset
management companies, the seventh section gives a brief about the data sources, the possible
methodology that was employed for this research and the section eight provides the concluding
remarks.

10
1.A. Backdrop:
The global financial markets suffered due to the sub-prime crisis in 2007 – 2008 as a number of
financial institutions (such as mutual funds) had an exposure to debt instruments that were backed
by poor quality mortgage assets. These financial institutions had undertaken maturity6 and liquidity
transformation7 similar to a traditional bank. These institutions were suggested to have functioned
like a “shadow bank”. These shadow banking activities went undetected under the regulatory
framework and subsequently generated a fall out in terms of a very high systemic risk for the whole
financial system. This meant that the systemic risk generated under shadow banking was transmitted
across a number of financial institutions and markets and adversely impacted the normal-functioning
of the financial system. Shadow banking is highly pervasive in the developed economies such as the
U.S. and Europe and the 2008 crisis brought to the fore the after-effects of how interconnected the
financial institutions were and the high-level of systemic risk these interconnected financial
institutions generated for the whole system due to the collapse of one of the peers. Shadow banking
exists in emerging economies such as India and China and is more prevalent in the Chinese financial
markets than Indian markets. However, shadow banking is catching up in India. The level of
interconnectedness that exists among these financial institutions in these countries and the level of
systemic risk generated through this interconnectedness is still largely unexplored. Unlike developed
economies, these economies have a large population that has limited or no access to traditional
banking services. This gives rise to the establishment of financial institutions that serve as
complements to the traditional banks.
6 Maturity transformation is where the financial institutions borrow money from the market and depositors for a short duration, however they lend for a short or longer duration. 7 Liquidity transformation is where the financial institution funds the illiquid assets (long term loans) with liquid liabilities (short-term deposits)

11
For example, an emerging economy like India has outfits in the form of Non – Banking Finance
Companies (NBFCs) that serve as a complement to the traditional banking system (See Appendix:
Exhibit No. A). Indian banks provide 58.7% of the Indian households (India has 246.74 million
households: Census data 20118) with banking facilities. However, banking penetration in urban areas
is 67.76% of total Indian households and 54.4% of Indian households in the rural area. In comparison
to developed nations banking penetration in India remains on the lower side i.e. 53% in 2014 (i.e.
468.81 million account holders). However, 43% of these 468.81 million accounts remain dormant9
(See: Global Findex data10). To fill the gap of this low banking penetration, NBFCs undertake market
liquidity, maturity transformation and risk sharing (Ghosh et al., 2012) and tend to function as shadow
banks.
NBFC setups lack regulation at a par with traditional Indian banks and at times have different norms
altogether. For example, the non-performing assets (NPA) recognition at Indian banks occurs when a
borrower defaults on repayment of the principal loan amount or interest payment on the loan for a
period of 90 days. However, in the case of a NBFCs the NPA recognition occurs at 180 days. The time
frame for banking NPA recognition and NBFC NPA recognition is gradually moving towards
convergence. However, this NPA norm recognition convergence is yet to be fully implemented. This
is an example indicating how NBFCs and Indian banks have divergent norms.
Another example of divergent norms is in the context of Asset Liability Management (ALM). Unlike a
traditional bank that accept deposits (current, savings and term deposits) to fund their loan books,
8 Census India 2011, Number of Households availing banking services and number of households having each of the specified assets, available on the internet at, http://www.censusindia.gov.in/2011census/Hlo-series/HH12.html, accessed on 20 Jun 2018 9 The Indian Express, 10 Nov 2015, In India bank account penetration surges, but 43% dormant, available on the internet at, http://indianexpress.com/article/india/india-news-india/in-india-bank-account-penetration-surges-but-43-dormant/, accessed on 20 Jun 2018 10 World Bank Global Financial Inclusion Index 2014, South Asia, Key Indicators, available on the internet at, http://datatopics.worldbank.org/financialinclusion/country/india, accessed on 20 Jun 2018

12
these NBFCs fund their loan book through borrowing from the markets (i.e. issuing commercial paper
(CP) and debentures) and banks.
Banks and asset management companies (AMC) fund these NBFCs through subscribing to the debt
market issuances such as commercial paper and debentures. The NBFCs proportion of funding
composition decision i.e. to borrow from banks or through CPs and debenture issuances depends on
the interest rate cycle in the economy. Lately, NBFCs reliance on bank funding has reduced whereas
dependence on AMC funding (through investment in NBFC floated commercial papers and
debentures) has increased as the interest rates in the economy were favourable. Many NBFCs fund
their customer loans with long-term maturity with commercial papers (CPs) that have short-term
maturity. This has generated an Asset Liability Mismatch and majority of the NBFCs are not subject to
Asset Liability Management guidelines. At present, ALM guidelines are applicable to non-deposit-
taking NBFCs with asset size of INR.1 billion and above and to those deposit-taking companies which
have a deposit base of INR. 200 million and more11.
AMCs finance these NBFCs through their scheme portfolio under the open-ended liquid, money
market and short-term debt schemes. We observe that these scheme (liquid, money market and
short-term debt) portfolios consist of more than 50% of the Net Asset Value (NAV) exposure towards
NBFC floated debt securities. On an aggregate level, the 42 Indian AMCs have a total Assets Under
Management (AuM) worth INR. 25 trillion of which debt forms 58.6% i.e. INR. 14.75 trillion (31 August
11 EconomicTimes Website, Soon, bank type asset liability management norms for NBFCs, available on the internet at, https://economictimes.indiatimes.com/industry/banking/finance/soon-bank-type-asset-liability-management-norms-for-nbfcs/articleshow/67295625.cms, accessed on 2 January 2019

13
2018)12. Of this amount raised through debt schemes, approximately INR. 2.49 trillion is invested in
NBFC commercial paper (58% of INR. 2.49 trillion) and debentures (42% of INR. 2.49 trillion).
In case an AMC has a portfolio exposure to a NBFC floated debt security which defaults it can have a
ripple effect on the entire financial system. In the following sub-section we shall elaborate how an
NBFC default affects various stakeholders in the financial system.
12 SEBI website, Deployment of Debt Funds, available on the internet at, https://www.sebi.gov.in/statistics/mutual-fund/deployment-of-funds-by-all-mutual-funds.html, accessed on 03 October 2018.

14
1.B. How does a NBFC default affect the entire financial system?
Out of the 42 Indian AMCs, eleven are bank sponsored and contribute to 47% of the total mutual fund
industry Assets Under Management (AuM). Now, if a bank sponsored NBFC has portfolio exposure to
a NBFC debt paper that has a default status. The AMC will have to mark down the exposure by 50%
with immediate effect. The parent bank may also have an exposure to the same NBFC through a bank
loan, the parent bank may have issued Letters of Undertaking (LoU) on behalf of the NBFC. Hence, the
very same NBFC may have borrowed both from banks and the debt market i.e. AMC exposure to NBFC
floated debt securities. Default on the NBFCs’ part may affect the financial system in four ways
a) the liquidity at the AMC/s on account of redemptions,
b) will lead to recognition of a non-performing asset (NPA) at a bank level,
c) reduction in the liquidity in the debt market
d) reduction in share price of peer NBFCs and Banks
Let us explain how the entire financial system is adversely affected through a live example of
Infrastructure Leasing and Financing Services limited (IL&FS)13, a government-owned NBFC based in
India. IL&FS has the following subsidiaries: IL&FS Transportation and Network Limited (ITNL), IL&FS
Financial Services, IL&FS Energy Development Centre, IL&FS Wind Energy Limited etc.
In June 2018, the IL&FS subsidiary IL&FS Transportation Networks Limited (ITNL) had delayed
redemption on its commercial paper worth INR.1 billion. However, by evening of the due date they
13 IL&FS Limited was incorporated in 1987 with the objective of promoting infrastructure projects in the country. IL&FS was promoted by the Central Bank of India (CBI), Housing Development Finance Corporation Limited (HDFC) and Unit Trust of India (now, Specified Undertaking of Unit Trust of India - SUUTI). While SUUTI has largely exited (stake of 0.82% as on March 31, 2018), the shareholding has broadened over the years with the participation of many institutional shareholders. As on March 31, 2018, Life Insurance Corporation of India (LIC) and ORIX Corporation Japan were the largest shareholders in IL&FS with their stake holding at 25.34% and 23.54% respectively, while Abu Dhabi Investment Authority (ADIA), HDFC, CBI and SBI stake holding are at 12.56%, 9.02%, 7.67% and 6.42% respectively

15
had redeemed the commercial paper and paid in full. In late September 2018, IL&FS Financial Services,
an Indian based government-owned NBFC defaulted on its commercial paper redemption for the third
time in a row. What was the issue at hand? On 08 September 2018, IL&FS Financial Services
commercial paper worth INR. 40 billion was downgraded to a credit rating of “D” carrying a default
status. Subsequently, on 17 September 2018, the parent IL&FSs’ commercial paper worth INR. 25
billion received a rating downgrade to “D” accompanied by a rating downgrade in other debt
instruments such as non-convertible debentures worth INR. 52.25 billion and long-term loans worth
INR. 3.5 billion. The reason behind the downgrade was the inability of the ITNL to meet the
redemption obligations due on 14 September 2018 and on 15 September 2018, ITNL received notices
on delays and defaults in servicing some inter-corporate deposits accepted by IL&FS14. To provide a
sense of the magnitude of commercial paper outstanding for IL&FS and its subsidiaries - ITNL had
commercial paper outstanding worth INR. 20 billion, IL&FS Financial Services had commercial paper
outstanding worth INR. 40 billion and IL&FS alone had commercial paper outstanding worth INR. 25
billion in the market. This made the ball park figure of IL&FS commercial paper outstanding at INR. 85
billion.
Typically, debt mutual fund schemes had invested in the commercial paper of IL&FS and its
subsidiaries worth INR. 29 billion15. This is approximately 34% of the total commercial paper
outstanding for both IL&FS and its subsidiaries. AMCs such as Bank Of India AXA had an exposure16
worth INR. 1.04 billion, Union Mutual Fund INR. 990 million, Principal Mutual Fund INR. 11.4 billion,
14 ICRA, Infrastructure Leasing and Financial Services Limited, 17 September 2018, available on the internet at, http://www.ilfsindia.com/media/2051/changes-in-revised-credit-rating-17092018.pdf, accessed on 05 October 2018. 15 EconomicTimes, Bond credit rating downgrades: How safe are the ‘safer’ debt mutual fund categories?, available on the internet at, https://economictimes.indiatimes.com/wealth/invest/bond-credit-rating-downgrades-how-safe-are-the-safer-debt-mutual-fund-categories/articleshow/65910015.cms, accessed on 24 September 2018 16 MoneyControl, 25 mutual funds with INR.2700 crore of IL&FS bonds take a hit, available on the internet at, https://www.moneycontrol.com/news/business/mutual-funds/25-mutual-funds-with-rs-2700-crore-of-ilfs-bonds-take-a-hit-2950281.html, accessed on 24 September 2018

16
Kotak MF INR. 7.98 billion and a few others such as (Motilal Oswal, DSP Mutual Fund, Invesco etc) to
IL&FS debt securities. As a result of the downgrade, the market value of the IL&FS debt securities on
the books of the AMCs was reduced by 50% and this adversely affected the Net Asset Value (NAV) of
these schemes as they witnessed a dip between the range of 1.63% - 8.24% (See: Table No. 19 and
Diagram No. 20). As a measure to protect mutual fund investor unit holders interest, Principal mutual
fund house had temporarily suspended new investments into its debt plans (Principal Cash
Management Fund, Principal Ultra Short Term Fund, Principal Low Duration Fund, and Principal
Arbitrage Fund) with effect from 10 September 201817. However, the problem at hand was not only
faced by the mutual funds, Indian banks such as Union Bank of India, Punjab National Bank (PNB) and
others also had a large exposure to IL&FS loans worth INR. 570 billion. Now, in this case both PNB and
Union bank had a dual exposure to IL&FS in the form of:
1. On-balance sheet exposure - direct lending and investment and off-balance sheet exposure -
standby letter of credit (SBLC) – [explained later in Diagram No. 2]
2. Investment - bank sponsored AMC portfolio.
So, this IL&FS downgrade didn’t only affect the banks or the mutual fund who had an exposure to it
but also the peers that didn’t have exposure to it. Following the credit rating downgrade of IL&FS, the
Indian financial system that covers debt and equity market and its participants were affected in seven
ways:
a) Peer NBFCs witnessed a drop in their share price
b) Peer NBFCs debt paper was sold at a discount to generate liquidity
17 Principal India Webiste, Notice cum addendum to the scheme information document (SID) and key information memorandum (KIM) of schemes of Principal mutual fund (No. 41/2018), 09 September 2018, available on the internet at, https://www.principalindia.com/media/uploads/notice_ad_-_suspension_of_subscription_-090918.pdf, accessed on 03 October 2018.

17
c) Debenture spread for AAA rated debt securities widened indicating liquidity risk increase
d) Mutual Fund schemes that had an exposure to IL&FS debt securities witnessed a drastic drop
in their Net Asset Values (NAV)
e) Mutual Fund houses borrowed heavily in the Collateralized Borrowing and Lending
Obligations (CBLO) market
f) Commercial Paper issuances dropped
g) Banks witnessed a drop in their share price
a) Peer NBFCs witnessed a drop in their share price
There were rumours that Dewan Housing Finance Limited (DHFL), another large NBFC had
also defaulted on their commercial paper interest and principal repayment and DSP
Investment Managers sold-off their exposure to DHFL debt securities at a steep discount. This
rumour led to a 43% drop in the share price of DHFL on 21 Sep 201818. A similar share price
drop was witnessed across peer NBFCs such as India bulls Housing Finance and LIC Housing
Finance in the range of 15% - 20%.
b) Peer NBFCs debt paper was sold at a discount to generate liquidity
DSP mutual funds initiative to sell DHFL debt securities was partly attributed to the corporate
advance tax payment redemption demand and partly to maintain liquidity as the IL&FS papers
were fully illiquid. DSP credit risk fund had an exposure of 3.26% stake in IL&FS Energy
Development Corporation, a subsidiary of IL&FS Ltd. The value of this exposure was marked
18 MoneyControl, 24 Sep 2018, available on the internet at, https://www.moneycontrol.com/news/business/explained-why-dhfl-and-other-nbfc-stocks-took-a-beating-on-friday-2979741.html, accessed on 24 Sep 2018

18
down by 50% due to the credit rating downgrade to “D” i.e. default status19. To generate
liquidity in the mutual fund scheme, the fund managers sold a peer NBFC debt paper.
c) Debenture spread for AAA rated debt securities widened indicating liquidity risk increase
Due to the IL&FS rating downgrade an after effect was witnessed in the debt market as
corporate debenture spreads increased for the AAA rated bonds issued for various time
period maturity buckets ranging from 1 year to 7 years. Over a period of three weeks, the
bond spreads for five out of the six buckets increased in the range of 20 – 80%. The highest
increase in spreads was witnessed for the AAA 3- 5 year debentures. However, long-term
debentures with maturity greater than seven years didn’t witness an increase as the markets
factored in the short-term liquidity crunch that might be resolved in the future. The increase
can be witnessed for the various maturity buckets in Table No. 1.
Table No. 1: Bond spread change over a Three week period when a NBFC debt i.e. IL&FS
was downgraded to “D”
Debenture Maturity Spread (bps) Percentage Increase/Decrease
31 Aug 2018 28 Sep 2018 Less than 1 year 106.01 143.27 35.15% 1 year to Less than 2 year 102.55 123.58 20.51% 2 year to Less than 3 year 87.1 105.69 21.34% 3 year to Less than 5 year 51.19 92.02 79.76% 5 year to Less than 7 year 56.65 69 21.80% Greater than 7 year 54.38 29.9 -45.02%
Source: Created by authors, available from market update CCIL website
19 EconomicTimes, 22 Sep 2018, DHFL paper sale by DSP triggered panic, available on the internet at, https://economictimes.indiatimes.com/markets/stocks/news/dhfl-paper-sale-by-dsp-triggered-panic/articleshow/65908110.cms, accessed on 30 Sep 2018

19
d) Mutual Fund schemes that had an exposure to IL&FS debt securities witnessed a drastic
drop in their Net Asset Values (NAV)
18 open-ended mutual fund schemes had an exposure to IL&FS debt securities20. The top 8
schemes that had the highest percentage exposure to IL&FS debt securities were Motilal
Oswal Ultra Short Term, Principal Cash Management Fund, Principal Ultra Short Term Fund,
Invesco India Credit Risk Fund, DSP Credit Risk Fund, BOI AXA Credit Risk Fund, Tata Corporate
Bond Fund and Union Liquid Fund (See Table No. 19) in the range of 3.99% to 9.87% of their
Assets Under Management as on 31 August 2018. Owing to the IL&FS rating downgrade the
NAV of these schemes has decreased in the range of 1.63% to 8.24% over the period 31 Aug
2018 to 28 Sep 2018.
e) Commercial Paper issuances dropped
The commercial paper issuance during the fortnight 15 Sep 2018 to INR.1124.06 billion, a 28%
decrease from INR. 1,561.20 billion on 31 Aug 2018 (Source: RBI database). This also
suggested that the money market reacted to the IL&FS rating downgrade with a decrease in
raising and rolling over Commercial Paper.
f) Mutual Fund houses borrowed heavily in the Collateralized Borrowing and Lending
Obligations (CBLO) market
The sixth indicator was the Mutual fund borrowing in the CBLO segment increased from
INR.313.26 billion to INR. 1175.99 billion, up 275% over a period of three weeks. Collateralised
Borrowing and Lending Obligations (CBLO) - a repo window run by Clearing Corporation of
India Limited (CCIL) is an alternative to the inter-bank market where financial institutions and
20 EconomicTimes, How the IL&FS Fiasco wiped out an entire years’ gain in liquid funds, available on the internet at, https://economictimes.indiatimes.com/markets/stocks/news/how-the-ilfs-fiasco-wiped-out-an-entire-years-gains-in-liquid-funds/articleshow/66027283.cms, accessed on 02 October 2018.

20
banks lend and borrow against government securities. However, this market is smaller
compared to the inter-bank market. Mutual funds began borrowing in the CBLO market in
order to maintain liquidity to meet corporate advance tax redemptions and retail investor
redemptions in case there were any further rating downgrades of debt instruments and
debenture spreads continued to increase. This example of a NBFC debt paper rating
downgrade and the subsequent effect on peer NBFCs in the financial system suggests that
AMCs perform the function of converting illiquid debt securities into liquid assets to meet
investor redemptions.
h) Banks share prices witnessed a drop
The NIFTY Bank index21 also witnessed a dip of around 11% over the period 31 August 2018
to 28 September 2018 with the largest drop in the range of 2-3% witnessed during the period
September 21 – 24, 2018. One would argue that the NIFTY Bank index drop could also be
attributed to the issues faced at Yes Bank with respect to the tussle regarding the extension
of the term of their CEO Rana Kapur and the proposed merger between Bank of Baroda, Dena
and Vijaya Bank. Yes Bank is a part of the NIFTY Bank Index and forms ~3% of the index
weightage. During the same period, HDFC Bank share price dipped 2.71%, ICICI Bank dipped
11.45%, Kotak Mahindra Bank dipped 12.01%, Axis Bank dipped 5.70%, State Bank of India
dipped 15.37%, Indusind Bank dipped 12.06%, Yes Bank dipped 62.63%, RBL dipped 20.32%,
Federal Bank dipped 13.72% and Bank of Baroda dipped 43.00%. Bank of Baroda (BoB) dipped
over the news of a possible merger between the public sector banks Dena, Vijaya and BoB.
21 NIFTY Bank Index is formed of 12 Indian banks such as HDFC bank (37.04) , ICICI Bank (16.93), Kotak Mahindra (13.12), Axis (9.36), State Bank of India (SBI) (8.57), Indusind Bank (7.43), Yes Bank (2.92), RBL (1.66), Federal bank (1.21) and Bank of Baroda (0.82). The weights that these banks form of the index are mentioned in the brackets. The index is based on the free float market capitalization method. The details are available on the NSE website, https://nseindia.com/content/indices/ind_nifty_bank.pdf, accessed on 04 October 2018.

21
Yes bank contributed to 18% of the total fall in the NIFTY Bank Index and BoB contributed to
3.5% of the NIFTY Bank index fall.
However, one can suggest that the bank index fell over worries of liquidity in the debt
segment, financial markets and the possible impact that the IL&FS debt default would have
on the bank financial statements.
Diagram No. 1: NIFTY Bank Index falls ~11% over the period 31 August 2018 to 28
September 2018
Source: Created by authors
To calm the financial market and restore liquidity in the system, the Reserve Bank of India (RBI)
introduced liquidity in the system through allowing an additional 2% of the Net Demand and Time
Liabilities (NDTL) to be considered under the Facility to Avail Liquidity for Liquidity Coverage Ratio
(FALLCR).
Liquidity Coverage Ratio (LCR)22 is maintained to ensure that sufficient liquid assets (at least 90% of
the total cash outflows) are available at a bank to meet financial obligations in a 30-day liquidity stress
22 The liquidity coverage ratio (LCR) refers to high quality liquid assets (HQLA) held by financial institutions to meet short-term obligations in case of a idiosyncratic and market-wide shock. The LCR is a ratio that enables a generic stress test to anticipate market-wide shocks. LCR is formed of two components: a) Value of High Quality Liquid Assets in stressed conditions and b) Total net cash
-3.00%
-2.50%
-2.00%
-1.50%
-1.00%
-0.50%
0.00%
0.50%
1.00%
1.50%
31-A
ug-1
8
02-S
ep-1
8
04-S
ep-1
8
06-S
ep-1
8
08-S
ep-1
8
10-S
ep-1
8
12-S
ep-1
8
14-S
ep-1
8
16-S
ep-1
8
18-S
ep-1
8
20-S
ep-1
8
22-S
ep-1
8
24-S
ep-1
8
26-S
ep-1
8
28-S
ep-1
8
22
scenario. In India, banks maintain a portion of their net demand and time liabilities (NDTL) under a
reserve requirement - statutory liquidity ratio (SLR) where banks hold SLR in the form of liquid
securities (such as cash, government securities and SDL). These government securities are highly liquid
and can be sold easily to raise money. Under the present regulatory requirement, SLR is maintained
at 19.5% of NDTL. Let us explain this concept of LCR and FALLCR with an example, Bank A has INR. 100
in NDTL and it maintains INR. 19.5 in SLR.
In 2015, Indian banks implemented the Basel III norms of LCR23 under which these banks had to
maintain sufficient liquid assets to meet financial obligations in a 30 day liquidity stress scenario. Now,
these banks already maintained INR. 19.5 out of the INR. 100 NDTL as SLR which comprised of high
quality liquid assets such as government securities. But the RBI recommended that in order to
compute the LCR, the Indian banks could only use a part of the securities held under SLR (56% of the
government securities from SLR – INR. 19.5 i.e. INR. 1124) as of 21 Jul 2016. This meant that the Indian
banks had to keep aside more than the INR. 19.5 in high quality liquid assets (HQLA)25 to meet their
LCR requirements. This technically reduced the amount available for lending at the banks. In
September 2018, RBI allowed Indian banks to consider INR. 13 out of the INR. 19.5 for computation
of LCR. Hence, in this way the RBI reduced the pressure on banks to hold more liquid assets to
outflows. The LCR assures that financial institutions have the necessary assets on hand to ride out any short-term liquidity disruptions. HQLA refers to assets that can be easily and immediately be converted into cash in a private market to meet the banks’ liquidity requirements for a 30 calendar day liquidity stress scenario. Basel Committee on Banking Supervision, Basel III: The Liquidity Coverage Ratio and liquidity risk monitoring tools, January 2013, available on the internet at, https://www.bis.org/publ/bcbs238.pdf, accessed on 04 October 2018. 23 Basel Committee on Banking Supervision, Regulatory Consistency Assessment Programme: Assessment of Basel III LCR Regulations - India, June 2015, available on the internet at, https://www.bis.org/bcbs/publ/d321.pdf, accessed on 03 October 2018 24 RBI Notifications, Basel III Framework on Liquidity Standards – Liquidity Coverage Ratio (LCR), Liquidity Risk Monitoring Tools and LCR Disclosure Standards, 21 July 2016, available on the internet at, https://rbi.org.in/scripts/FS_Notification.aspx?Id=10522&fn=2&Mode=0, accessed on 03 October 2018 25 Assets allowed as the Level 1 High Quality Liquid Assets (HQLAs) for the purpose of computing the LCR of banks, inter alia, include (a) Government securities in excess of the minimum SLR requirement and, (b) within the mandatory SLR requirement, (i) Government securities to the extent allowed by RBI under Marginal Standing Facility (MSF) [presently 2 per cent of the bank's NDTL] and (ii) under Facility to Avail Liquidity for Liquidity Coverage Ratio (FALLCR) [presently 11 per cent of the bank's NDTL].
23
compute the LCR and increased liquidity by allowing them to hold INR. 2 less than before. This figure
of INR. 13 is the FALLCR26 that a bank can consider to compute LCR.
Typically, Indian banks hold 28% in SLR, this implies that they hold INR.8.5 more than the SLR
requirement i.e. INR.19.5. This INR.8.5 is used to compute the LCR under Basel III norms. In addition
to this now these banks can use INR.13 out of the INR.19.5 under SLR. So LCR numerator is calculated
as INR.13 (from SLR) + INR.8.5 (excess above INR.19.5 held as government securities) = INR.21.5. Now,
the banks have INR.100 – INR.19.5 – INR.8.5 = INR.72 for lending.
Earlier this was INR.11 (from SLR i.e. INR.19.5) + INR. 8.5 (excess above INR.19.5 held as government
securities) = INR.19.5 for LCR calculation. Here, the bank would have to provide another INR.2 to make
sure that the LCR requirements are met i.e. INR.21.5. So earlier, the bank was left with INR. 100 –
INR.19.5 -INR.8.5 – INR.2 = INR.70 for lending. By increasing the FALLCR, the RBI has increased the
funds available at banks for lending and indirectly increased liquidity in the financial system. Typically,
banks have to maintain an ascertained Cash Reserve Ratio (CRR) in addition to the Statutory Liquidity
Ratio (SLR) requirement. So, if a bank has deposits worth INR.100 and it maintains a 5% CRR and a
19.5% SLR on the deposits; the total amount available to the bank for lending is 100 – 5%*100 – 19.5%
of 100 = INR.100 – INR.5 – INR.19.5 = INR.75.5. In addition to this the banks have a priority sector
lending requirement. This PSL requirement earmarks 40% of the available funds from INR.75.5 to be
lent to the priority sector such as agriculture, micro enterprises, advances to the weaker sections
education, housing, social infrastructure etc. This implies that out of the INR.75.5 - 40%*INR.75.5
should be advanced to the priority sector i.e. INR.30.5. After all these requirements are met, the bank
26 RBI website, Basel III Framework on Liquidity Standards – Liquidity Coverage Ratio (LCR), Liquidity Risk Monitoring Tools and LCR Disclosure Standards, 27 September 2018, available on the internet at, https://www.rbi.org.in/scripts/BS_CircularIndexDisplay.aspx?Id=11380, accessed on 03 October 2018.

24
is left with INR.45.5 to lend to other categories and industries27. When these PSL targets are met the
bank gets a PSL certificate. The banks with a PSL certificate can sell it to the banks that haven’t met
the PSL targets. Hence, the bank that has met PSL targets can earn an extra non-interest income
through sale of the PSL certificates. In this sale of PSL certificates, the credit risk of the original Priority
sector loan will remain with the originator28. The SLR and CRR requirement in India is the highest
among other nations, this additional priority sector lending (PSL) target further restrains their capacity
to lend compared with other nations29.
Although, the Reserve bank of India (RBI) duly monitors the NBFC exposure limit at the bank and the
AMC level separately and banks may attempt to consolidate the risk level under the Basel III pillar.
These AMCs may undertake liquidity transformation on behalf of their parent banks. Using investor
money, the fund managers at the respective AMCs subscribe to NBFC floated debt securities that may
not be very liquid as indicated in the case of IL&FS. Since AMC investors can redeem their investments
from an open-ended scheme at any point in time, the AMC may undertake the function of converting
illiquid into liquid assets to meet investor redemption demands similar to a bank meeting the
depositor withdrawal demands. Hence, the fund manager may require to hold a certain cash balance
to meet the investor redemptions (There are no regulatory cash balance requirements to be
maintained by Indian AMCs).
27 RBI website, 01 Aug 2018, Priority Sector Lending – Targets and Classifications, available on the internet at, https://m.rbi.org.in/Scripts/FAQView.aspx?Id=87, accessed on 01 December 2018 28 NDTV, 11 April 2016, Priority Sector Lending Certificate Guidelines to benefit Banks: Moodys, available on the internet at, https://www.ndtv.com/business/banks-to-benefit-from-rbis-priority-sector-lending-guidelines-moodys-1392733, accessed on 01 December 2018. 29 The Financial Express, 27 April 2015, Monetary Policy Transmission and banking regulations, available on the internet at, https://www.financialexpress.com/opinion/monetary-policy-transmission-and-banking-regulations/67086/, accessed on 01 December 2018.

25
As we place forward the argument that AMCs convert illiquid into liquid assets through investor
redemption; one may raise the point that there is a fundamental difference between an AMC investor
and a bank depositor:
1. A bank depositor deposits money in the bank with an objective of earning a fixed amount of
interest on his/her deposit and assumes that the deposit will be paid on demand when desired
and a certain portion is guaranteed under the deposit insurance scheme.
2. An AMC investor invests money in an open-ended AMC scheme with an objective of earning
a return based on a certain risk undertaken and assumes that the investment can be
redeemed at any point in time. However, here the investor bears in mind that the AMC
scheme returns can also be negative (where the investor may lose his capital invested in the
scheme) and there is no guarantee of the invested capital.
Given this scenario, there is a possibility that at an AMC – an investors entire capital can be wiped off
unlike a bank deposit that carries a deposit insurance and capital buffers. However, this scenario
where an AMC investor loses the entire capital is rare. Example, in case an investor wishes to redeem
INR.1 million from a debt scheme of a mutual fund. This mutual fund scheme is formed of individual
debt securities floated by various financial institutions and corporates. The mutual fund may use their
cash buffer i.e. hypothetically INR. 10 million maintained to meet the investor redemption. However,
the mutual fund manager will have to still replenish the cash buffer to the previous level i.e. 10 million
in anticipation of future redemptions. So, the fund manager can replenish his cash buffer either – a)
by selling off a portion of the debt securities portfolio held or b) by borrowing in the Collateralised
Borrowing and Lending Obligations (CBLO) market c) approaching the parent bank for extending a
credit line d) rely on other peer schemes in the mutual fund house and borrow cash to replenish the
cash buffer. In this manner, the fund manager replenishes the cash buffer to the original level of INR.
10 million.
26
Now, in case a debt security such as IL&FS been downgraded to default status, the mutual fund has
5% exposure to this IL&FS debt paper. So what happens is, the debt scheme has to mark down the
value of this exposure by 50% effectively. This affects the Net Asset Value (NAV) of the scheme.
Thereafter, an investor approaches the scheme for redemption of INR. 1 million. The fund manager
may rely on his cash buffer of INR. 10 million to pay for the investor redemption. However, in this
scenario, the fund manager may face difficulty to replenish the cash buffer to the original INR. 10
million as there is a rating downgrade, which affects the debt market. If the fund manager approaches
the debt market to sell-off another debt security, he will have to do so at a discount which is what
happened with DHFL debt paper. Second, if there is a further redemption demand of INR. 1 million.
The fund manager may rely on selling off other debt securities in the portfolio but at steep discounts,
as the market is shaken with a debt paper downgrade. Another option would be to approach the CBLO
market if the scheme holds enough government securities on the basis of which they can borrow the
INR.1 million, or they can approach other schemes in the fund house for replenishing the cash buffer
to the position of INR. 10 million. This default situation of a debt security in the portfolio of the mutual
fund scheme gives rise to a liquidity risk that may not only be limited to an investor redemption or an
AMC but may also spread to other participants in the financial system. In this example, we have
considered a single mutual fund house as a standalone situation. In realistic terms, a number of
mutual fund houses may have exposure to the debt security that has defaulted. These mutual fund
houses may have various exposure limits to the debt security. Now, if an investor redemption occurs
simultaneously at these mutual fund houses. The mutual fund houses would want to replenish their
cash buffer to the original position. However, since the sale of the defaulted asset may not be possible
as it has become illiquid, the debt market may witness a simultaneous sale of peer debt securities or

27
borrowing from other schemes or in the CBLO market to sustain their cash buffers. This may generate
a temporary liquidity problem in the financial system.
This situation may get complicated if not only the debt issuer defaults (NBFC such as IL&FS) on the
debt securities (commercial paper and debentures) but also on bank loan taken. In this scenario, both
AMCs and banks will be affected this extends to the systemic risk definition. Systemic risk comprises
a financial system, a pool of interconnected institutions that have a mutually favourable business
relationship through which illiquidity, insolvency, and losses can quickly propagate during periods of
financial distress (Billio et al., 2012).
Let us explain this in detail, the systemic risk that arises when a scheme or a fund house has exposure
to a particular NBFC that defaults on honouring their debt security payment and bank loan repayment.
In case an NBFC fails to service the debt i.e. repay interest or principal amount on maturity (debenture
or commercial paper or bank loan). This would make the debt instrument illiquid. However, debt
instruments such as commercial paper may have a Standby Letter of Credit (SBLC) which guarantees
repayment in case of default and shifts the onus on the SBLC issuing bank.
Now, the above situation generates exposure not only for the bank which may directly lend or invest
in a NBFC, but also through the off-balance sheet SBLC issued in favour of the NBFC and the exposure
of the bank sponsored AMC to NBFC issued debt securities. Failure of the NBFC will lead to a NPA
recognition at the bank level, registration of mark to market losses at the write-off of defaulted debt
securities and invoking of SBLC. AMCs will be affected to the extent that there might be a dip in the
NAV. This creates a moral hazard issue for the banks and the financial system on the whole leading us
to three unanswered questions. The questions have been developed in a sequential manner and only

28
when the predecessor question is true we have proceeded to the subsequent questions testing in this
report.
a) Does joint/dual exposure to NBFCs exist in the present Indian financial system?
b) Do bank run AMCs through their open-ended debt-oriented schemes indulge in liquidity
transformation?
c) Does the banks systemic risk increase due to the joint/dual exposure to NBFCs?
The issue with SBLC is explained with an example, a Bank A based in India that has a loan exposure
worth INR. 1,000 to a company Z or a NBFC X at T0. The principal and interest is due on the loan after
a year at T1 is INR.500. Both the lender and borrower at T1-t know that the borrower will be unable to
service the loan. In this scenario, Bank A issues an SBLC to the borrower – NBFC X and Company Z.
This SBLC issuance and discounting functions as a platform to delay the recognition of the loan as a
non-performing asset (NPA). How is this done?, the lender (Bank A) issues a SBLC on behalf of the
borrower (Company Z/NBFC X) promising to pay another bank (Bank B) in case the borrower fails to
repay. Unlike usual Letters of Credit (LOC) the SBLC may not be linked to a trade or is not contingent
upon the borrower performing an obligation. The borrower may use its wholly-owned offshore
subsidiary (NBFC X/Company Z foreign subsidiary) to discount the SBLC from a bank abroad (Bank B –
foreign subsidiary). The local lender bank (Bank A) – which issues the SBLC – communicates through
a SWIFT system to inform Bank B – foreign subsidiary and authenticates the instruments’ veracity.
The funds obtained through the discounting are remitted by NBFC X/Company Zs foreign subsidiary
to NBFC X/Company Zs domestic account. Thereafter, NBFC X/ Company Z uses this SBLC discounted

29
money to repay the original lender (Bank A)30. Through this mechanism, the borrower avoids a
situation of default and downgrade of the debt undertaken.
In case the borrower would not have opted for the SBLC discounting route, Bank A would recognize
the Company Z / NBFC X account as a non-performing asset (NPA) immediately. Through the SBLC
issuing route the bank delays the issue faced by the borrower.
Diagram No. 2: Standby Letter of Credit (SBLC) usage to evergreen bad loans at domestic bank
Source: Created by authors
In this study, we have considered 42 Indian scheduled commercial banks and their eleven Asset
Management Companies (AMCs). These 42 banks comprise of 21 Public and 21 Indian Private Sector
Banks that extend 96% of the loans and advances in the organized Indian banking system (See
Appendix: Exhibit No. B for list of banks included in this study). The sample of Public sector banks
consists of the merged entity of State Bank of India. Post April 2017, State Bank of India and its five
30 EconomicTimes, Banks and Companies are using standby letter of credit to avert loan default, downgrade, 11 Feb 2014, available on the internet at, https://economictimes.indiatimes.com/industry/banking/finance/banking/banks-and-companies-are-using-standby-letter-of-credit-to-avert-loan-default-downgrade/articleshow/30180192.cms, accessed on 30 Sep 2018
Issues SBLC worth INR.500 at T1-t
Bank A NBFC X/Company Z
Loan given worth INR.1000 at T0
Repays Loan part principal + Interest from discounted SBLC less discount < INR.500 at T1
NBFC X/Company Z
Foreign subsidiary
Bank B –
foreign subsidiary
Gives Bank A issued SBLC w
orth IN
R.500 at T1-t to its foreign
subsidiary
Discounts SBLC worth INR.500 at T1-t
Pays discounted SBLC amount INR.500 Less discount at T1-t
Tran
smitt
ed S
BLC
less
dis
coun
t am
ount
to N
BFC
X/Co
mpa
ny Z
Send
s SW
IFT
mes
sage
to
Bank
B fo
r SB
LC is
sued
Unable to repay INR.500 at T1-t

30
subsidiaries (State Bank of Hyderabad, State Bank of Bikaner and Jaipur, State Bank of Mysore, State
Bank of Patiala and State Bank of Travancore) and Bhartiya Mahila Bank31 were merged into one bank
now referred to as State Bank of India (SBI). In September 2018, three public sector banks Bank of
Baroda, Vijaya Bank and Dena Bank were proposed to be merged into one entity32. This will bring the
number of public sector banks to 19 in the near future. Life Insurance Corporation (LIC), a government
owned insurance company has acquired a 51% stake in public sector bank - IDBI Bank33. We have
excluded foreign banks34 and small finance banks (SFB)35 from this study as they contribute a minor
portion to the total bank lending business.
Of these 42 banks, we have eleven bank sponsored AMCs that contribute to 47% of the total assets
under management (equity and debt schemes). Of these eleven AMCs, private sector bank sponsored
AMCs form 35% of the total AUM in the mutual fund industry and public – sector bank sponsored
AMCs form the remainder 12% (See Appendix: Exhibit No. C for list of Asset Management Companies
included in this study). Among the public sector bank sponsored AMCs, Principal bought out the entire
stake of Punjab National Bank in Principal PNB Asset Management Company (AMC)36. So, from August
31 NDTV, 01 April 2017, Five Associate Banks, Bhartiya Mahila Bank merge with SBI, available on the internet at, https://www.ndtv.com/business/five-associate-banks-bharatiya-mahila-bank-merge-with-sbi-1676064, accessed on 03 October 2018. 32 The Hindu Business Line, 17 September 2018, Vijaya Bank, Dena Bank and Bank of Baroda to merge: Govt, available on the internet at, https://www.thehindubusinessline.com/money-and-banking/vijaya-bank-dena-bank-bob-to-merge-govt/article24968935.ece, accessed on 03 October 2018 33 Business Today, 01 April 2018, LIC-IDBI deal: Cabinet approves LICs acquisition of 51% stake in IDBI Bank, available on the internet at, https://www.businesstoday.in/current/economy-politics/lic-idbi-deal-cabinet-approves-lic-proposal-to-buy-51pc-stake-in-idbi-bank/story/280874.html, accessed on 03 October 2018. 34 Foreign banks operate in India through branches or wholly-owned subsidiaries. They operate in either mode but not both. The domestic banking regulations apply to these foreign banks. These banks are set up by non-resident Indians (NRI) who hold a majority stake in the branch or the wholly owned subsidiary (WOS). For more details information on Foreign banks are available on the Reserve Bank of India (RBI) website at, https://rbidocs.rbi.org.in/rdocs/content/pdfs/CF06072017_AN.pdf, accessed on 11 Aug 2018. 35 Small Finance Banks (SFB) are regulated and license to operate under the RBI guidelines and perform basic banking functions of accepting deposits and lending to unserved and underserved sections such as small business units, small and marginal farmers, micro and small industries and unorganized sector entities. These are scheduled commercial banks that have to open at least 25% of their branches in the rural unbanked areas and have to extend 75% of their adjusted net banking credit (ANBC) to the priority sector. Priority sector includes: Agriculture, Micro, Small, Medium Enterprises (MSME), Export credit, Education, Housing, Social Infrastructure, Renewable energy and others. More details please refer to the RBI Compendium of Guidelines for Small Finance Banks – Financial Inclusion and Development, available at the RBI website, https://rbidocs.rbi.org.in/rdocs/content/pdfs/CF06072017_AN.pdf, accessed on 11 Aug 2018 36 MoneyControl, 29 August 2018, Principal buys out entire stake of PNB in Principal PnB Asset Management Company (AMC), available on the internet at, https://www.moneycontrol.com/news/business/mutual-funds/principal-buys-out-entire-stake-of-pnb-in-principal-pnb-asset-management-company-2893791.html, accessed on 03 October 2018.

31
2018, there are 10 bank sponsored AMCs. The study period considered is from Jan 2012 to Jan 2018
extended to May 2018 wherever data is available.

32
2. Shadow Banking Overview:
Shadow banking has been an area of interest post the 2007 – 2008 US financial crisis. In the
developed economies such as US and Europe, money market mutual funds (MMMF) and debt
mutual fund schemes were considered as shadow banks who undertook the function of credit
intermediation without having access to central bank liquidity facilities and deposit insurance
guarantee facilities (See: Chernenko and Sunderam (2014); Duygan – Bump et.al. (2013)). These
mutual fund schemes also fell prey to the sub-prime mortgage default crisis that occurred in the
US during 2007 – 2008. A number of these mutual fund schemes had an exposure to debt
instruments that were backed by poor quality assets such as residential and commercial
mortgages. When the crisis occurred the mutual fund schemes were faced with heavy investor
redemption demands and were unable to liquidate the underlying sub-prime mortgage assets
backed by securities (commercial paper, asset backed securities, bonds). The redemptions
subjected mutual fund schemes to a fire sale or suspension of investor redemptions till a suitable
action plan was ascertained.
An example of a MMMF is the Reserve Primary Fund that held US$785 million in Lehmann issued
securities and became illiquid when the fund was unable to meet investor redemption demand37.
Three European debt mutual fund schemes38 such as BNP Paribas ABS Eonia39, BNP Paribas
Euribor (French domiciled) and Parvest Dynamic ABS (Luxembourg domiciled) had an exposure of
35% of their assets to US sub-prime Asset Backed Securities (ABS) in July 2007. BNP Paribas
37 Securities Exchange Commission website, Reserve Primary Fund Distributes Assets to Investors, 29 Jan 2010, available on the internet at, https://www.sec.gov/news/press/2010/2010-16.htm, accessed on 20 Jun 2018 38 Asset Back Securities (ABS) Fund by definition must invest at least 80% of their assets in securitized assets such as asset backed securities. 39 BNP Paribas Documents, Background Information on suspension and reopening of ABS funds in August, available on the internet at, https://invest.bnpparibas.com/sites/default/files/documents/5761.pdf, accessed on 20 Jan 2018.

33
suspended redemptions for 20 days from August 8, 2007 to August 28, 2007 to contain the
downfall. The concept of shadow banking has gradually evolved where, credit intermediation
takes place outside the conventional banking system. In this system, a non-banking financial
institution engages in liquidity, credit and maturity transformation. However, unlike a bank these
non-banking financial institutions don’t have access to the central bank liquidity facilities and
deposit insurance guarantee facilities like a bank.
These U.S and European based non-banking financial institutions (such as money market mutual
funds) faced systemic risks which surfaced during the 2008 financial crisis and went undetected
under the regulatory framework. To resolve this issue the US and European financial markets
introduced a number of reforms in the industry such as increasing disclosures of monthly portfolio
holdings, introducing floating net asset value (NAV) for institutional floated funds, enhancing
diversification and setting single institution exposure limit to 10% - 15%, imposing a 2%
redemption fees on liquidation in case the weekly liquid assets dips below 30% of its total assets
etc40. Similarly, the Financial Stability board (FSB) has actively undertaken efforts to monitor and
measure shadow banking so that the unforeseen systemic risks are minimized, and opportunities
created through shadow banking benefit the overall financial system.
Shadow banking is more prominent in the US system and less pervasive in the European region.
However, in emerging economies such as India; non-banking financial institutions such as NBFCs
(shadow banks) serve as complements to the existing banking institutions due to skewed banking
penetration levels across the country. In India these NBFCs that fill the banking gap are the form
of Non-Banking Financial Companies (NBFC). NBFCs in India operate as shadow banks and
undertake liquidity, maturity transformation and leverage activities similar to banks (See: Acharya
40 SEC adopts Money market Fund reform rules, 2014, available on the internet at, https://www.sec.gov/news/press-release/2014-143, accessed on 20 Jun 2018

34
et. al. (2013)). Shadow banking in India is estimated at USD190 billion which is the 15th largest in
the world. Among BRICS, India is the third largest shadow banking sector. However, in terms of
growth India’s OFI sector has grown at an annualized rate of 15.5% over the last five years, second
only to China’s staggering 47% CAGR within the BRICS. Furthermore, bank funding from OFIs is
growing at a pace of 18.7% CAGR which compares with a median of 9.5% and is the fastest
amongst BRIS countries.
Shadow banking was coined by McCulley41 and subsequently, Adrian and Shin (2009) suggested
what functions a financial institution should perform to be termed as a shadow bank. Primarily, a
financial institution should undertake liquidity transformation, maturity transformation and
credit transformation. These activities are conducted by unregulated institutions or under
unregulated conditions. In India, however each financial institution may be regulated in some
form or the other but there may be liquidity transformation and maturity transformation which
may not occur in the sense of a traditional bank. Earlier studies have considered mutual funds and
shadow banking i.e. mutual funds undertake liquidity and maturity transformation in open-ended
mutual fund schemes. This is a function similar to a traditional bank. However, these mutual funds
do not provide an insurance for the investor funds in case of a run on the fund house and these
funds don’t have a capital buffer to offset losses. Typically, large funds absorb the losses of heavy
redemptions internally and at some point, the Net Asset Value (NAV) is subject to volatility. In
both cases, the mutual fund houses may witness erosion of their fund base. Sunderam and
Cherenko (2014), Duygan – Bump et. al. (2013), Sunderam and Cherenko (2016), Shek, Shim and
Shin (2017), Morris, Shim and Shin (2017) and Jiang et. al. (2017) have studied mutual fund and
shadow banking in the above context.
41 Federal Reserve Bank of Atlanta, Shadow Banking Interview of Paul McCulley, available on the internet at, https://www.frbatlanta.org/news/conferences-and-events/conferences/2012/120409-fmc/media/mcculley-interview.aspx, accessed on 11 Aug 2018

35
A few academicians have studied shadow banking and financial stability (Bengtsson, 2013).
Academicians such as Goldstein et. al. (2015), Hanouna et. al. (2015), SEC (2015), Feroli et. al.
(2014) and Chen et. al. (2010) have examined liquidity transformation and financial stability
problems. The occurrence of an event that threatens the stability of or public confidence in the
financial system (De Bandt and Hartmann, 2000) is defined as a ‘Systemic risk’. Systemic risk
comprises a financial system, a pool of interconnected institutions that have a mutually
favourable business relationship through which illiquidity, insolvency, and losses can quickly
propagate during periods of financial distress (Billio et al., 2012). This implies that the systemic
risk affects a number of financial institutions or markets in a strong sense thereby severely
impacting the general well-functioning of the financial system.
While, banks play a major role in the traditional definition of systemic risk where a single bank is
vulnerable to depositor runs, we emphasize that the definition of systemic risk goes beyond the
traditional definition where failure is transmitted from one institution, market, system to another.
This is similar to a contagion-effect where a single institution faced with failure is connected to
other financial institutions and markets and the failure risk faced by this single institution spreads
across to other institutions and markets. Acharya et. al. (2017), Song (2017) have examined
systemic risk in the financial system for banks’. However, they have failed to consider that banks
and other financial institutions such as asset management companies and other non-bank
financial institutions may have a mutually beneficial business relationship with each other. Hence,
considering systemic risk among the same category of institutions – banks, may not capture the
systemic risk at the level of the financial system.
36
Reinhart and Rogoff (2009) considered four “L”s – Leverage, Liquidity, Losses and Linkages.
Literature has already covered the first three Ls extensively and measures are well established for
the same. A common theme across systemic events is that they involve the financial system i.e.
connections and interactions between financial institutions and mutual beneficiary parties.
Therefore, to gain a comprehensive perspective of the systemic risk faced at the financial system
it is important to capture the degree of connectivity of market participants.
For example, in China; shadow banking is in the form of bank floated wealth management
products (WMPs) that give an opportunity to a bank depositor to invest their excess deposit funds
in their bank accounts in money market instruments and bonds with short -term maturity.
However, these WMPs tend to invest funds in risky assets and people are under the belief that
these WMPs to some extent are bank guaranteed (Acharya et. al. (2017)). In case, these WMPs
fail, this situation might lead to loss of deposit funds for bank depositors of the bank that may
later on lead to a bank run. Hence, this gives rise to an interconnectedness between the money
market funds, debt funds and bank deposits. Hence, to assess the systemic risk in Chinas’ financial
system it would be important to study the degree of connectivity between these two institutions.
In India, the NBFCs function as a complement to the Indian banking system and cater to the
unbanked segments. These NBFCs serve as shadow banks with many of these NBFCs being bank
sponsored. While not directly comparable, these can pose similar risks especially under a risk
aversion situation given the significant liquidity, maturity and leverage transformations
undertaken by these institutions. NBFCs typically raise funds from Banks (through term-loans,
working capital loans), Asset Management Companies, Insurance and other financial institutions
(through commercial paper and debentures) for lending to their end borrowers. Many a times,
the NBFC, AMC and Bank may have an exposure to the same borrower/s. This common borrower
may have taken a bank loan, raised money in the market through commercial paper and
37
debentures and may have also a loan exposure to the NBFC. In case, this borrower/s defaults and
is unable to service the debt and interest payment for the respective bank loan or debt instrument
such as commercial paper and debentures and loan repayment for the NBFC. It would generate a
systemic risk for the whole Indian financial system. This borrower holds exposure to the NBFC,
Bank and AMC. Hence, a default on this borrower’s part may impact all the three in varied
degrees.
Furthermore, a detailed analysis of the shadow banking system in India is also important given
the higher interconnectedness within the financial system. In India, bank claims on the Other
Financial Intermediaries (OFI) stand at 11.0% of the overall bank assets. This compares with a
median of 3.6% (3.5% for China) and is the third highest within the Financial Stability Board
universe (behind Belgium and Ireland), reflecting the high scope of spillovers from a potential
credit shock (spillovers are analysed in detail in Proposition III). Interconnectedness from the
funding side is in-line with peers with banks’ liabilities to the OFIs standing at 3.5% of bank assets
(compared with 1.6% for China, and 3.7% median)42. India’s non-bank sector is also significantly
exposed to global shocks with OFI claims on the rest of the world constituting 44% of the OFI
assets which is the highest amongst the biggest nations and compares with a median of 7.7%.
42 Global Shadow Banking Monitor, Financial Stability Board, 2017 http://www.fsb.org/wp-content/uploads/P050318-1.pdf

38
Diagram No. 3: Bank exposure to OFIs using bank funding and growth
Bank exposures to OFIs and banks use of funding from OFIs
Growth in OFI assets and bank funding from OFIs
Source: Created by authors
Hence, it is important to study the degree of connectivity between the banks, NBFCs and the
AMCs in question in order to understand the totality of the systemic risk faced by the Indian
Financial system in case such a default event occurs. OFIs refer to those financial corporations
that are primarily engaged in financial intermediation—that is, corporations that channel funds
from lenders to borrowers through their own account or in auxiliary financial activities that are
closely related to financial intermediation—but are not classified as deposit takers (IMF 2004a).
OFIs include insurance corporations; pension funds; securities dealers; investment funds; finance,
leasing, and factoring companies; and asset management companies. In the case of India, we can
consider NBFCs as OFIs.

39
3. Overview of Non-Banking Finance Companies (NBFC) in India
NBFCs are registered under The Companies Act, 1956 and engage in the business of loans and
advances, leasing, hire-purchase, insurance business, chit funds, trading, acquisition of securities
such as shares, bonds, debentures and others43. In March 2018, there are 11,402 NBFCs of which
249 are NBFC Non-deposit taking Systematically Important (NBFC ND SI). These 249 NBFC ND SI
form 86% of the total assets of the NBFC sector44. Table No. 2, displays the asset size and the
number of NBFC ND-SI from 2014 till 2018. We observe in Table No. 2 that the number of NBFC
ND SI have more than halved from 493 in 2014 to 229 in 2018. This reduction was attributed to a
revision in the regulatory guideline that increased the threshold asset size requirement of these
NBFC ND SI from INR 1 billion to INR 5 billion (See Table No. 2) thereby disqualifying a number of
the NBFCs with the prior granted status of NBFC ND SI.
Public limited companies’ form 47.7% of the total NBFC ND SI whereas private limited companies
contribute for the remainder 45.45%. The asset size for private limited companies reduced from
INR. 6,856 billion to INR. 2,810 billion and the asset size increased for the public listed companies
from INR.1,705 to INR.9,806 billion. The reason behind an increase in the asset base of public
listed firms can be attributed to the initial public offerings (IPO)45 launched by MAS Financial
Services, Ujjivan Financial Services, IndoStar Capital Finance, ICICI Securities and a few others and
the capital raised through debentures and commercial paper borrowings.
43 Reserve Bank of India website, Frequently Asked Questions, Definition of NBFC, 10 Jan 2017, available on the internet at, https://www.rbi.org.in/Scripts/FAQView.aspx?Id=92, accessed on 26 Jan 2018. 44 FSB 2017 report, available on the internet at, https://rbidocs.rbi.org.in/rdocs/Publications/PDFs/7CHA7201709E69A4012B24EE590B260B1F151BB97.PDF, accessed on 15 Jan 2017. 45 MoneyControl, NBFCs laugh their way to the bank as rich investors try to cash in on IPOs, available on the internet at, http://www.moneycontrol.com/news/business/ipo/nbfcs-laugh-their-way-to-the-bank-as-rich-investors-try-to-cash-in-on-ipo-mania-2328453.html, accessed on 15 Jan 2017.

40
Table No. 2: Number and Asset size of NBFC ND-SI
Ownership March 2014 March 2015 March 2016 March 2017 March 2018 No. Asset Size
( In INR bn)
No. Asset Size ( In INR bn)
No. Asset Size ( In INR bn)
No. Asset Size ( In INR bn)
No. Asset Size ( In INR bn)
Total 493 12742 471 15232 220 14833 220 16917 249 20,064 Government 15 4181 15 5337 15 5765 15 6280 15 7448 Non-government
478 8561 456 9895 205 9068 205 10637 234 12616
Public Ltd. (1) 252 1705 243 2120 105 2026 105 8268 105 9806 Private Ltd. (2) 226 6856 213 7775 100 7041 100 2369 129 2810
Source: Created by authors, Reserve Bank of India, Financial Stability Report, Report on Trend and
Progress of Banking in India 2016-17 and 2017-18, Page 142 and Page 40
Despite a reduction in the number of NBFCs due to the asset threshold limits the NBFC has
witnessed a double – digit loan growth over a period. The Indian NBFC sector has witnessed loan
growth from INR. 7,233.52 billion in March 2012 to INR. 17,993.35 billion in March 2018, a 16.40%
compounded annual growth (CAGR) rate over the six – year period. This complementary financing
system has been outperforming the loan growth of scheduled commercial banks (SCB)46. (For
more details on NBFC loan growth please refer to Section No. 4 ).
A few reasons attributable to the growth in the NBFC loan outstanding are:
1. The inability of SCBs to undertake higher lending activities due to the huge pile of non-
performing assets (NPA) that have been accumulated since the financial crisis in 2007-08
in the banking system. 11 Public sector banks are under Prompt Corrective Action (PCA)47
where a few of them have been restricted from undertaking lending activities since they
46 RBI website, SCB definition: All banks included in the second schedule to the Reserve Bank of India Act, 1934. They are categorized into five different categories: 1) State Bank and its associates, 2) Nationalised banks, 3) Private sector banks, 4) Foreign banks and 5) Regional Rural Banks.; available on the internet at, https://www.rbi.org.in/scripts/PublicationsView.aspx?id=14655, accessed on 28 Jan 2018. 47 Reserve Bank of India (RBI), Revised Prompt Corrective Action (PCA) Framework for Banks, available on the internet at, https://rbi.org.in/scripts/NotificationUser.aspx?Mode=0&Id=10921, accessed on 25 July 2018

41
are at Threshold 3. Although this situation has improved over the months and banks have
begun lending as capital has been infused into the banks by the government.
2. The growth in NBFC loan may be attributed to the revised norms, where Reserve Bank of
India increased the borrowing limit for individual borrowers from INR. 50,000 to INR.
100,000 in April 2015.
Unlike a traditional bank that accepts deposits to support the business of lending. NBFCs borrow
from the financial market to fund their lending activities. Debentures, bank borrowing (term-
loans, working capital loans), commercial paper and borrowing from other financial institutions
forms roughly 60% - 70% of a NBFCs total borrowing and more than 50% of their balance sheet
(For more details please refer to Section No. 5).
Bank granted term-loans and working capital loans to NBFCs are worth INR 2.06 trillion and INR
668 billion and forms 18% of the NBFC lending book as on 31 March 2017. Banks have an exposure
to NBFC floated commercial paper (INR. 631 billion), NBFC issued debentures (INR. 1381 billion)
and this forms 13.12% of the NBFC lending book. Overall bank exposure to NBFCs amounts to INR.
4.9 trillion48.
48 Bank exposure includes scheduled commercial banks such as private sector banks and public sector banks and foreign banks.

42
Banks are not the only ones who hold an exposure to NBFCs. Asset Management Companies
(AMCs) subscribe to NBFC floated securities such as debentures and commercial paper. The net
exposure49 that AMCs have to NBFCs has steadily increased year on year from INR. 83 billion in
March 2012 to INR. 3,818 billion in March 201850. A number of these AMCs are bank sponsored
and hence this introduces dual exposure at the bank level.
Banks may face a twin exposure to a particular NBFC through:
1) Direct exposure: Loans and investments on their bank balance sheet
2) Indirect exposure: Portfolio investment in debentures and commercial paper of a NBFC
through the bank sponsored mutual fund arm.
3) Indirect exposure: Issue of Stand by letter of credit for issuance of commercial paper and
debentures
However, the indirect exposure through the bank run AMC to the same NBFC is not fully
accounted for in the banking system. RBI sets limits on the exposure taken by banks51 and AMCs52
independently to NBFCs. However, the RBI doesn’t provide any guidelines that cover joint
exposure to a particular NBFC undertaken by a bank and the same bank run AMC especially on
the off-balance sheet side and the with respect to the structured obligations (that may have
exposure AMCs).
49 The AMCs included here are Bank run, Financial Institutions run and Corporate run AMCs 50 Reserve Bank of India, Financial Stability Report, 2013, 2014, 2015, available on the internet at, https://rbi.org.in/Scripts/FsReports.aspx, accessed on 23 Jan 2018 51 Banks have a direct exposure limit for the NBFC lending activities and investment activities capped at 10% to 15% (of the banks’ capital funds as per the last audited financial statements) for a single NBFC/NBFC Asset Financing Company/ NBFC Infrastructure Finance Company. RBI exposure limit to a single NBFC, available on the internet at, https://www.rbi.org.in/scripts/BS_ViewMasCirculardetails.aspx?id=9875, accessed on 19 Jan 2018. 52 AMCs have an exposure limit of 25-30% to the NBFC sector and a single issuer limit of 10-15% of the net asset value (NAV). Live Mint, SEBI relaxes debt fund exposure limit for housing finance companies, 11 Aug 2016, available on the internet at, http://www.livemint.com/Money/kJdEWM3z3hecPWSwKMvZtK/Sebi-relaxes-debt-fund-exposure-limit-for-housing-finance-co.html, accessed on 23 Jan 2018.

43
With this background we arrive at our first proposition for this research “Does Joint exposure
among financial institutions exist?” and we sequentially develop the remainder two propositions
based on the positive outcome from proposition I. We elaborate more about the first proposition
in section 5.

44
4. NBFCs loan growth higher than Scheduled Commercial Banks
The Indian NBFC sector has witnessed loan growth from INR. 7,233.52 billion in March 2012 to
INR. 17,993.35 billion in March 2018, a 16.40% compounded annual growth (CAGR) rate over the
past six year period. This complementary financing system has been outperforming the loan
growth of scheduled commercial banks (SCB)53. These SCBs cater to 95% of the banking
population. However, over the past few years since 2012 onwards the quarter on quarter loan
growth of the NBFC sector has outperformed that of the SCBs.
Diagram No. 5 displays the loan outstanding growth rates for both NBFC sector and Scheduled
Commercial Banks (SCBs) for the period March 2012 to September 2017 on a quarterly basis. SCB
loan growth on a quarter to quarter basis has been on the lower side of 1-5%, whereas NBFC loans
and advances portfolio growth has moved in the range of -2% to 14%. Eleven of the eighteen
quarters over the period March 2012 to September 2017, NBFC loan outstanding growth rate was
higher than the SCB loan outstanding growth rate.
A few reasons attributable to the growth in the NBFC loan outstanding are:
1) The inability of SCBs to undertake higher lending activities due to the huge pile of non-
performing assets (NPA) that have been accumulated since the financial crisis in 2007-08 in the
banking system. 11 Public sector banks are under Prompt Corrective Action (PCA)54 where a few
of them have been restricted from undertaking lending activities since they are at Threshold 3
53 RBI website, SCB definition: All banks included in the second schedule to the Reserve Bank of India Act, 1934. They are categorized into five different categories: 1) State Bank and its associates, 2) Nationalised banks, 3) Private sector banks, 4) Foreign banks and 5) Regional Rural Banks.; available on the internet at, https://www.rbi.org.in/scripts/PublicationsView.aspx?id=14655, accessed on 28 Jan 2018. 54 Reserve Bank of India (RBI), Revised Prompt Corrective Action (PCA) Framework for Banks, available on the internet at, https://rbi.org.in/scripts/NotificationUser.aspx?Mode=0&Id=10921, accessed on 25 July 2018

45
In March 2018, the banking NPAs of scheduled commercial banks were around INR. 9899.84
billion (i.e. 11.60%55 of the total advances at INR. 85343.50 billion56). Table no. 3 presents the
sector-wise fund based exposure of 20 banks (16 Public sector banks and 4 Private sector banks)
to three sectors such as Iron and Steel, Textile and Infrastructure (Power, Road, Rail, Port, Telecom
and others). These three sectors form 30.15% of the total INR. 9899.84 billion gross NPAs. These
top 20 banks in Table no. 3 form 84% of the total banking loans and advances and contribute to
98.27% of the total NPAs in the banking system57. These 16 Public sector banks contribute to
87.74% of the total NPAs in the banking system followed by Public sector banks contributing
10.54% of the total NPAs. Dena, UCO, IDBI and Canara bank have the highest exposure to the Iron
and Steel sector. Canara bank has the highest exposure to the Textile sector. IDBI has the highest
exposure to Infrastructure that includes power, road, rail, port, telecom and others. IDBI reports
highest Gross NPAs followed by Punjab National Bank (PNB). Banks such as IDBI, Oriental Bank of
Commerce, Central Bank of India, Allahabad Bank, UCO Bank, Corporation Bank, Bank of India,
Indian Overseas Bank, Dena Bank, Bank of Maharashtra are all under Prompt Corrective Action
(PCA) whereas PNB, Canara bank and Union bank are on the watchlist to be put under PCA if their
profit turns negative for two consecutive years.
55 Chapter II: Financial Institutions: Soundness and Resiliencem Reserve Bank of India Publications, 26 June 2018, available on the internet at, https://rbi.org.in/Scripts/PublicationReportDetails.aspx?UrlPage=&ID=902, accessed on 14 July 2018. 56 RBI Bulletin, Business in India: All Scheduled Banks and All Scheduled Commercial Banks, 11 June 2018, available on the internet at, https://rbi.org.in/Scripts/BS_ViewBulletin.aspx?Id=17609, accessed on 14 July 2018 57 Reserve Bank of India, Statistical Tables Relating to Banks in India, available on the internet at, https://dbie.rbi.org.in/DBIE/dbie.rbi?site=publications#!4, accessed on 14 July 2018.

46
Table No. 3: Sector-wise fund exposure of 20 Scheduled Commercial Banks and Gross NPAs as on 31 March 2018
The table presents the funded exposure of 20 scheduled commercial banks of which 16 are public sector and 4 are private sector banks. Column number 2 to 4 mention the contribution of Iron and steel, Textile and Infrastructure sector to the total funded exposure mentioned in INR billion. Column 5 presents the total funded exposure of the respective bank which includes both domestic and international fund based credit exposure. Column no. 6 presents the gross NPA of each bank and column no. 7 to 9 presents the contribution of each of the three sectors to NPAs. Column no. 10 is a ratio that indicates the asset quality of each bank which is computed by dividing the gross NPA by fund based exposure i.e. column no.6 divided by column no.5.
Bank Name Iron and
Steel
Textile Infrastructure Fund based
exposure (in INR
bn)
Gross NPA (in INR bn)
Iron and
Steel
Textile Infrastructure Gross NPA to Funded
Exposure
(1) (2) (3) (4) (5) (6) (7) (8) (9) (10)
Public Sector Banks
SBI 3.43% 1.84% 10.71% 20744.63 2251.05 24% 7% 26% 10.85%
IDBI 6.25% 3.36% 21.01% 2508.72 1088.49 32% 43.39%
PNB 5.10% 2.14% 9.68% 4783.96 895.44 NA NA NA 18.72%
Canara 6.16% 5.13% 17.11% 4014.74 476.99 24.59% 4.13% 21.55% 11.88% Oriental Bank of Commerce
4.09% 2.97% 5.92% 2461.37 261.34 2.96% NA NA 10.62%
BoB 4.35% 3.83% 8.20% 5353.01 570.60 17.09% 5.84% 16.50% 10.66%
Indian Bank 2.15% 2.17% 11.29% 2256.88 119.90 31.64% 4.59% 26.83% 5.31% Central Bank of India
3.08% 2.25% 14.88% 2881.56 381.31 NA NA NA 13.23%
Allahabad Bank 4.69% 2.88% 11.24% 2029.44 265.63 21.69% 5.96% 10.68% 13.09%
UCO Bank 6.40% 1.73% 14.46% 1074.70 305.50 18.45% 3.62% 19.71% 28.43% Corporation Bank 4.22% 4.40% 15.42% 1280.05 222.13 NA NA NA 17.35%
Union Bank 3.50% 2.86% 12.55% 4251.33 493.70 1.65% 0.44% 2.25% 11.61% Bank of India 2.90% 2.22% 10.96% 4020.80 623.93 11.01% 4.56% 17.82% 15.52%
Indian Overseas Bank
4.53% 1.90% 10.01% 2201.23 381.80 NA NA NA 17.34%
Dena Bank 6.45% 4.84% 15.66% 742.39 163.61 17.35% 8.62% 15.00% 22.04% Bank of Maharashtra 2.59% 2.41% 8.65% 1092.05 184.33 19.67% 3.55% 10.16% 16.88%
Private Sector Banks
HDFC 1.55% 2.04% 7.82% 7841.86 93.00 2.55% 2.30% 4.28% 1.19%
ICICI 1.95% 0.45% 6.34% 8811.59 567.04 20% 6.44%
Axis 1.50% 1.15% 6.25% 6441.09 342.49 10.15% 39.12% 5.32%
Indusind
Kotak Bank 2.17% 2.14% 3.18% 2352.98 40.71 13.87% 1.73%
Source: Compiled by authors from Pillar 3 disclosures of scheduled commercial banks (SCB).

47
This exposure is considered at a point in time and not on a longitudinal basis, since more or less
the securities held have remained similar, secondly, we are not conducting a longitudinal analysis
of how the exposure is changing.
The GNPA has been steadily rising owing the RBI withdrawing the restructured assets scheme.
With the withdrawal of the restructured asset window, banks NPAs have almost doubled. This has
led to low lending as the banks didn’t have enough funds to lend (as the previous funds were not
repaid by defaulting borrowers and these banks had to provide for the NPAs). Sensing the rising
NPA issue, the RBI announced the PCA mechanism under which 11 banks were placed and these
PCA norms led to curtailment of standard banking operations. In Graph No. we observe that
during early 2017 the credit growth dipped drastically with some recovery witnessed around June
2017 to early 2018. However, the growth hasn’t reached the 2012 levels.
Diagram No. 4: SCB non-food bank credit growth (y-o-y)
Source: RBI Bulletin, Scheduled Commercial Banks Business in India
3%
5%
7%
9%
11%
13%
15%
17%
19%
Jun-
12
Oct
-12
Feb-
13
Jun-
13
Oct
-13
Feb-
14
Jun-
14
Oct
-14
Feb-
15
Jun-
15
Oct
-15
Feb-
16
Jun-
16
Oct
-16
Feb-
17
Jun-
17
Oct
-17
Feb-
18Drastic dip in lending growth

48
To fill the lacuna created by the banking sector, NBFC lending witnessed an increase.
2) The growth in NBFC loan may be attributed to the revised norms, where Reserve Bank of
India increased the borrowing limit for individual borrowers from INR. 50,000 to INR. 100,000
in April 201558. Hence, these two reasons have mostly contributed the NBFCs growth as they
have partially substituted for the SCBs; since the SCB credit offtake has reached an all-time low.
Diagram no. 5 presents the comparison between loan growth of both SCBs and NBFCs over a
period March 2013 to March 2018. NBFC loan growth outstrips the growth of SCBs. The loan books
served as a complement to Indian banks. NBFI loan book increased to INR. 18,585 billion, up
156.93% over the past six years since 2012. NBFC loan growth outstripped bank loan growth in 17
out of the 21 quarters under study.
Diagram No. 5: NBFC loan growth Vis a Vis SCB loan growth
Source: Created by the authors, Reserve Bank of India, Financial Stability report
58CARE Ratings, NBFC-Microfinance Institutions- Update on Regulatory Changes, April 2015, available on the internet at, http://www.careratings.com/upload/NewsFiles/SplAnalysis/Microfinance%20Sector%20-%20Update%20on%20Regulatory%20Changes%20docx.pdf, accessed on 22 Jan 2018
0.00%
10.00%
20.00%
01 M
arch
201
3
01 Ju
ne 2
013
01 S
epte
mbe
r 201
3
01 D
ecem
ber 2
013
01 M
arch
201
4
01 Ju
ne 2
014
01 S
epte
mbe
r 201
4
01 D
ecem
ber 2
014
01 M
arch
201
5
01 Ju
ne 2
015
01 S
epte
mbe
r 201
5
01 D
ecem
ber 2
015
01 M
arch
201
6
01 Ju
ne 2
016
01 S
epte
mbe
r 201
6
01 D
ecem
ber 2
016
01 M
arch
201
7
01 Ju
ne 2
017
01 S
epte
mbe
r 201
7
01 D
ecem
ber 2
017
01 M
arch
201
8
NBFC loan Growth (y-o-y) SCB loan Growth (y-o-y)

49
NBFCs loan growth has been in double digits owing to the banks facing NPA problems. 11 state run banks
are under PCA where their lending and expansion activities have been curbed. RBI has put restrictions on
Dena bank59, Allahabad bank60 for fresh lending. For IDBI, not only is the lending restricted but a LIC has
been approached to acquire 51% stake in IDBI to ensure inflow of capital61. In Dec 2016 quarter, the NBFC
loan growth was the least (8.5% y-o-y) compared to the previous quarters. The reason behind it was the
demonetization that occurred in Nov 2016 where INR. 500 and INR. 1000 currency notes were
withdrawn.62 Majority of the borrowers in NBFCs belong to medium to small means of income. Maximum
business of these NBFCs conducted via cash was affected drastically and during demonetization loan
delinquency rates increased drastically as borrowers were unable to honor their instalment payments.
NBFCs in the form of Micro-Finance Institutions (MFIs) faced high delinquency rates in the range of 11-
37%63. Most of the NBFCs after the demonetization period rolled over the loans of the borrowers
especially such as Janalakshmi financial services, Ujjivan Financial services, Bandhan, Fincare etc. This
helped improve the aesthetics of their financial statements as their loan amounts were shown repaid and
delinquency rates came down. However, Janalakshmi has not been unable to handle the rollover of loans
successfully and have been facing higher delinquency rates. First Half 2018 Gross NPA was reported at
29.9%. Even their pass through certificates (PTC) were downgraded to a ‘D’ rating64.
59 The Hindu, 11 May 2018, RBI bars Dena bank from lending, hiring, available on the internet at, https://www.thehindu.com/business/rbi-bars-dena-bank-from-lending-hiring/article23856962.ece, accessed on 25 July 2018 60 The Times of India, 14 May 2018, RBI puts deposit, lending restrictions on Allahabad Bank, available on the internet at, https://timesofindia.indiatimes.com/business/india-business/rbi-puts-deposit-lending-restrictions-on-allahabad-bank/articleshow/64163095.cms, accessed on 25 July 2018 61 The Hindu Business Line, 17 July 2018, LIC may an open offer to buy IDBI bank shares, available on the internet at, https://www.thehindubusinessline.com/money-and-banking/lic-may-make-an-open-offer-to-buy-idbi-shares/article24445703.ece, accessed on 25 July 2018 62 The Hindu, 08 November 2016, Demonetisation of Rs.500 and Rs.1000 notes: RBI explains, available on the internet at, https://www.thehindu.com/news/national/Demonetisation-of-Rs.-500-and-Rs.-1000-notes-RBI-explains/article16440296.ece, accessed on 25 July 2018 63 Micro Finance Institutions Micrometer reports, available on the internet at, http://mfinindia.org/resource-center/mfin-publications/, accessed on 25 July 2018 64 ICRA reports, 18 January 2018, Janalakshmi Financial Services, available on the internet at, https://www.icra.in/Rationale/GetRationaleFile/66568~Janalakshmi%20Financial-R-18012018.pdf, accessed on 25 July 2018

50
5. How are these NBFCs funding their loan growth?
A NBFC funds its lending activities through 70% borrowing on its balance sheet. The funding
composition of a NBFC typically forms debentures, bank borrowing, commercial paper, borrowing
from other financial institutions etc. Table No. 4 presents’ the funding composition of Indian
NBFCs over the period 2013 to 2018. The funding composition of NBFCs is based on the interest
rate cycle, typically when the interest rates go up the NBFCs depend on the banks for borrowing
as Marginal Cost of funds based Lending Rate (MCLR)65 is sticky; when the interest rates come
down the NBFCs depend on the market debt securities such as commercial paper, debentures etc.
Debentures and banks (47% of total NBFC total assets) have been a major source of funding for
NBFCs. A decline is witnessed in the bank borrowing as a percentage of total NBFC assets from
19% to 15% of the NBFC balance sheet (INR. 19,671 billion) in March 2017. This is in light of the
slowing banking system that is laden with non-performing assets as a result of which banks are
unable to make new loans. However, in 2018 the bank borrowing has increased and returned to
the previous levels.66 Market interest rates were on a decline from November 2013 to January
2018. The base rate of a leading public sector lender suggests that in November 2013 the rate was
10% which consistently declined to 8.65% till January 201867.
65 Definition of MCLR available on the Reserve Bank of India (RBI) website, https://m.rbi.org.in/scripts/FAQView.aspx?Id=111, accessed on 11 August 2018. MCLR is the lowest interest rate that a lender can offer. MCLR is closely linked with the repo rate and fund costs of the banks. Thus, if there is a change in the repo rate, it will have an impact on the bank loan rate offered to a borrower. 66 The Economic Times, NBFCs lower exposure to banks rely on commercial papers and bonds, available on the internet at, https://economictimes.indiatimes.com/industry/banking/finance/nbfcs-lower-exposure-to-bank-loans-rely-on-commercial-papers-and-bonds/articleshow/45697536.cms, accessed on 23 Jun 2018 67 State Bank of India base rate (historical) available on the website at, https://www.sbi.co.in/portal/web/interest-rates/base-rate-historical-data, accessed on 11 August 2018
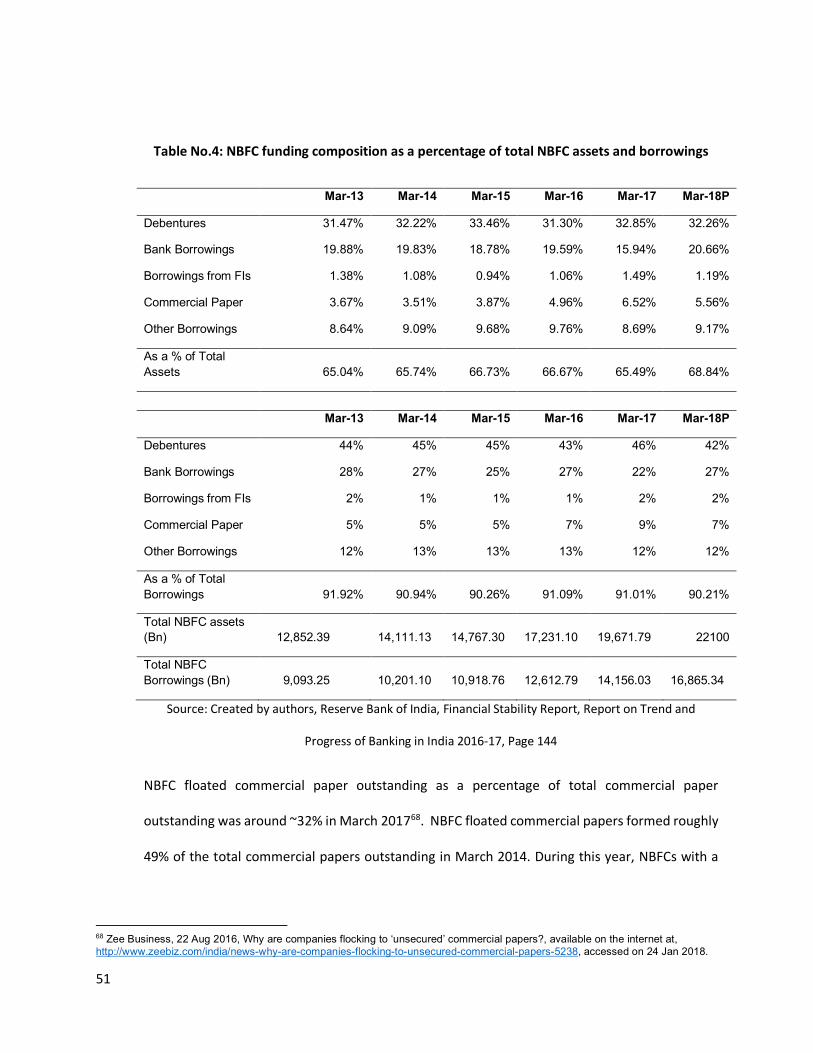
51
Table No.4: NBFC funding composition as a percentage of total NBFC assets and borrowings
Mar-13 Mar-14 Mar-15 Mar-16 Mar-17 Mar-18P
Debentures 31.47% 32.22% 33.46% 31.30% 32.85% 32.26%
Bank Borrowings 19.88% 19.83% 18.78% 19.59% 15.94% 20.66%
Borrowings from FIs 1.38% 1.08% 0.94% 1.06% 1.49% 1.19%
Commercial Paper 3.67% 3.51% 3.87% 4.96% 6.52% 5.56%
Other Borrowings 8.64% 9.09% 9.68% 9.76% 8.69% 9.17%
As a % of Total Assets 65.04% 65.74% 66.73% 66.67% 65.49% 68.84%
Mar-13 Mar-14 Mar-15 Mar-16 Mar-17 Mar-18P
Debentures 44% 45% 45% 43% 46% 42%
Bank Borrowings 28% 27% 25% 27% 22% 27%
Borrowings from FIs 2% 1% 1% 1% 2% 2%
Commercial Paper 5% 5% 5% 7% 9% 7%
Other Borrowings 12% 13% 13% 13% 12% 12%
As a % of Total Borrowings 91.92% 90.94% 90.26% 91.09% 91.01% 90.21%
Total NBFC assets (Bn) 12,852.39
14,111.13
14,767.30
17,231.10
19,671.79 22100
Total NBFC Borrowings (Bn) 9,093.25
10,201.10
10,918.76
12,612.79
14,156.03
16,865.34
Source: Created by authors, Reserve Bank of India, Financial Stability Report, Report on Trend and
Progress of Banking in India 2016-17, Page 144
NBFC floated commercial paper outstanding as a percentage of total commercial paper
outstanding was around ~32% in March 201768. NBFC floated commercial papers formed roughly
49% of the total commercial papers outstanding in March 2014. During this year, NBFCs with a
68 Zee Business, 22 Aug 2016, Why are companies flocking to ‘unsecured’ commercial papers?, available on the internet at, http://www.zeebiz.com/india/news-why-are-companies-flocking-to-unsecured-commercial-papers-5238, accessed on 24 Jan 2018.

52
high credit rating could raise funds through CPs at a rate that was 150 basis points lower than the
average bank base rates69. Again around 2016 – 2017, the NBFC floated CP share in the total CP
outstanding increased from 24% to a steady 32% owing to increased demand from AMCs and a
funding rate lower than the average bank base rates70. Hence, NBFC floated CP funding has
witnessed a phenomenal increase as a portion of NBFC funding during the period 2012 to 2018.
These NBFC floated commercial papers have investor participation from asset management
companies (AMCs), banks and insurance companies. AMCs are major participants of these
commercial papers71. The net exposure72 that AMCs have to NBFCs has steadily increased year on
year from INR. 83 billion in March 2012 to INR 4056 billion in March 201873.
Indian banks direct exposure to the NBFC sector is INR. 4.9 trillion74 of which NBFC floated
commercial paper and debentures forms 40% (of the total INR. 4,996 billion) as on March 2017.
Bank loans in the form of term loans and working capital loans still form the bulk of the exposure
(55% of INR 4,996 billion). The 2017, Consolidated NBFC balance sheet break indicates that share
capital and reserves form roughly 14 – 15% of the total NBFC D assets and 23% for the NBFC NDSI
assets. The bank borrowing as reported in the gross deployment of RBI data is INR. 4,964 billion.
However, taking an average of reporting as 92% of the gross bank deployment to NBFCs the figure
is calculated at INR.4566 billion i.e. 92% of INR.4964 billion. The rest of the figures are estimated
69 The Economic Times, NBFCs lower exposure to bank loans, rely on commercial papers and bonds, 31 Dec 2014, available on the internet at, https://economictimes.indiatimes.com/industry/banking/finance/nbfcs-lower-exposure-to-bank-loans-rely-on-commercial-papers-and-bonds/articleshow/45697536.cms, accessed on 26 Jan 2018. 70 India Infoline, Issuance of commercial paper rises, 03 Mar 2017, available on the internet at, https://www.indiainfoline.com/article/news-top-story/issuance-of-commercial-paper-rises-117030300249_1.html, accessed on 26 Jan 2018. 71 The Financial Express, Yields on NBFC commercial papers rise ahead of IPOs, 8 Sep 2017, available on the internet at, http://www.financialexpress.com/market/yields-on-nbfc-commercial-papers-rise-ahead-of-ipos/846066/, accessed on 26 Jan 2018 72 The AMCs included here are Bank run, Financial Institutions run and Corporate run AMCs 73 Reserve Bank of India, Financial Stability Report, 2013, 2014, 2015, available on the internet at, https://rbi.org.in/Scripts/FsReports.aspx, accessed on 23 Jan 2018 74 Bank exposure includes scheduled commercial banks such as private sector banks and public sector banks and foreign banks.
53
using the following assumptions for March 2018. Debentures is taken as an average of past 5 years
ratio to the total assets i.e. 32.26% of INR.22,100 billion, borrowings from FI at 1.19% of
INR.22,100 billion, Inter-Corporate Borrowings at 2% of total assets, Public deposits at 1.4% of
total assets, commercial paper for NBFCs is 33% of the total CP issuances over a period of 3 years.
CP outstanding in March 2018 were INR. 3,725 billion75.
This higher dependence on the commercial paper funding due to lower bank lending to NBFCs
and in order to keep the marginal cost of funds on the lower side has led to asset liability mismatch
problems among NBFCs.
75 CP outstanding published in RBI weekly statistical supplement. RBI website, available on the internet at, https://dbie.rbi.org.in/DBIE/dbie.rbi?site=publications, accessed on 15 January 2019.

54
5. A How did the commercial paper funding lead to asset liability mismatch problems?
Asset Liability Mismatch (ALM) is considered to be a comprehensive and dynamic framework for
measurement, monitoring and managing the market risk for NBFCs. When does a asset liability
mismatch occur?
1. The primary source of funds for a NBFC is commercial paper (CP), debentures and bank loans.
These funds raised through the CP need to be repaid to the investor or lender within a period
of 1- 5 years.
2. The NBFCs usually provide loans for a longer period of time such as more than 5 years in case
of a home loan or any other kind of infrastructure loan.
3. So when an NBFC provides a long term loan from funds with a shorter maturity, this situation
is called an asset liability mismatch. This gives rise to two cases which are explained
subsequently.
One would ask, why is it such an issue with an NBFC and not a bank. In case of a bank, the bank
relies on depositor funds to lend. However, in case of NBFC these NBFCs can’t accept demand
deposits. NBFCs can accept public deposits only if the NBFC is an investment grade institution and
to an extent of 1.5 times its net owned funds (NOF). In addition to this, the NBFC can accept
deposits between a period of 12 months to 60 months and can pay a maximum interest of
12.5%76. Hence, unlike a bank the NBFC faces more challenges to raise funds for its asset base of
loans. The second issue is that in case a NBFC issues long-term debentures – this type of
investment brings along with it the liability of a higher interest rate compared to the interest rate
76 RBI website, All you wanted to know about NBFCs, 10 January 2017, available on the internet at, https://www.rbi.org.in/Scripts/FAQView.aspx?Id=92, accessed on 01 December 2018.

55
charged on the commercial paper. Hence, to take the benefit of the lower interest rate of the
commercial paper, NBFCs resorted to higher level of CP borrowing in the money market.
Case 1 for an asset liability mismatch: Shorter duration liability funding long-term loan
An NBFC may finance a loan granted worth INR. 5,000 for a duration of five years backed by
commercial paper worth INR. 5000 issued with a maturity period of 91 days. Now post 91 days,
the commercial paper has matures and the NBFC will have to either repay the amount to the
commercial paper investor or roll over the commercial paper for another 91 days. In this case, the
NBFC will have to ascertain that the CP is rolled over every 91 days otherwise, they will have to
arrange for the INR.5000 from another source.
Case 2 for an asset liability mismatch: mix of shorter duration liability funding long-term loan
An NBFC may finance a loan granted worth INR. 5,000 for a duration of five years backed by
commercial paper worth INR. 3,000 issued with a maturity period of 91 days, debenture worth
INR. 1,000 issued with a maturity period of 182 days and a bank loan worth INR. 1,000 that has to
be repaid monthly through instalments with interest. Now post 91 days, the commercial paper
has matures and the NBFC will have to either repay the amount to the commercial paper investor
or roll over the commercial paper for another 91 days. In this case, the NBFC will have to ascertain
that the CP is rolled over every 91 days otherwise, they will have to arrange for the INR. 5,000
from another source.
The total commercial paper outstanding in the market was worth INR. 5,876.9 billion as on 31
October 2018 of which INR. 1,200 billion (i.e. 20% of the commercial paper market) belonging to
NBFCs was due for a roll-over between the months’ October to December 201877. In November
77 The Financial Express, 23 October 2018, Indian NBFCs need to repay about Rs.1.2 lakh crore of commercial paper debt in October-December, available on the internet at, https://www.financialexpress.com/industry/banking-finance/indian-nbfcs-need-to-repay-about-rs-1-2-lakh-crore-of-commercial-paper-debt-in-october-december/1358391/, accessed on 01 December 2018

56
alone, INR. 700 billion of the INR. 950 billion was due for redemption due to maturity of the
instruments for top 50 NBFCs. These CPs function by rolling over for the coming period instead of
repayment. However, the roll-over rate for top 50 NBFCs was at 40% of the average monthly
issuances between June and August 2018 i.e. INR. 1,802 billion.
Table No. 5 displays the total commercial paper outstanding in the financial market at different
time periods during April to mid-November. The Table in the first column indicates the amount of
commercial paper outstanding, followed by the amount issued in column no. 2 and the range of
the interest rate at which these commercial papers are issued in column no. 3 and finally in
column no. 4 is the percentage of issuances in comparison to the total amount of commercial
paper outstanding. The fourth column gives us a sense of the magnitude of the issuances in
comparison to the outstanding. Typically, these paper become due for maturity every 90 days or
so, in this situation every quarter, the same paper may be redeemed or may be rolled over. If the
paper is redeemed the outstanding commercial paper reduces. However, when the paper is rolled
over, the issuances may increase – but the net effect on the outstanding will remain unchanged.
When new paper is issued the amount is added to the outstanding.
Hence the total outstanding commercial paper (t) = Previous balance of outstanding commercial
paper (t-1) + New issuances (t) – Redemptions (t)
In case of roll over;
Total outstanding commercial paper (t) = Previous balance (t-1) + (new issuances (t) + roll over (t) ) –
redemptions (t). This new issuance also includes a portion from the roll overs.

57
Table No. 5: Commercial Paper Issuances between 30 April 2018 to 15 November 2018 and
rate of interest
Fortnight Ended
Amount Outstanding (₹
Billion)
During the Fortnight
Amount Issued (₹ Billion)
Rate of Interest (Per cent)
Amount issued as a % of Amount Outstanding
1 2 3 4
Apr. 30, 2018 4,476.90 567.70 6.35 - 12.31 12.7% May 15, 2018 4,777.00 874.40 6.61 - 9.55 18.3% May 31, 2018 4,668.90 850.20 6.89 - 9.84 18.2% Jun. 15, 2018 5,076.10 1,341.60 6.25 - 15.86 26.4% Jun. 30, 2018 4,918.30 1,267.30 6.16 - 11.19 25.8% July 15, 2018 5,630.90 995.5 6.03 - 10.71 17.7% July 31, 2018 6,395.30 1,677.10 6.19 - 12.47 26.2% August 15, 2018 5,978.40 1,478.50 6.53 - 15.79 24.7% August 31, 2018 6,323.00 1,561.20 6.44 - 10.40 24.7% September 15, 2018 6,408.10 1,112.60 6.56 - 15.79 17.4% September 30, 2018 5,562.00 1,125.20 6.84 - 11.18 20.2% October 15, 2018 5,944.90 799.1 6.72 - 17.49 13.4% October 31, 2018 5,876.90 949.3 6.87 - 10.38 16.2% November 15, 2018 5,847.20 1,066.20 6.69 - 11.73 18.2%
Source: Created by authors, compiled from Reserve Bank of India Weekly Supplement, available on the
internet at, https://m.rbi.org.in/scripts/WSSView.aspx?Id=22288, accessed on 01 December 2018.
We observe in Table No. 5 that the issuances as a percentage of the total outstanding witnessed
a decline in mid-October with a simultaneous increase in the upper bound of the interest rate i.e.
17.49%. This suggests that there was a slight pressure in the commercial paper market for a brief
while and gradually this pressure eased with interest rates coming to previous month levels. The
roll-over rates for the subsequent months have resumed to 68 – 78%.
To off-set the dilemma of the thinning commercial paper market, the NBFCs have actively
considered other options such as retail bonds78. However, this option does not come for free. This
78 LiveMint, 09 November 2018, 50 NBFCs need Rs70,000 crore in November to redeem commercial papers: CRISIL, available on the internet at, https://www.livemint.com/Industry/uMYryUnPrtw9vocd00kh8L/50-top-NBFCs-need-70000-crore-in-November-to-redeem-commer.html, accessed on 01 December 2018

58
option brings along with it a higher interest rate element. NBFCs have raised INR. 270 billion
between April and September 2018. However, this was not sufficient to offset the slow- down in
the commercial paper market. Keeping in mind the growing concerns over the IL&FS default and
thinning liquidity in the market. The RBI provided funds through a special window for banks with
Open Market Operations purchase worth INR. 360 billion in October and INR. 400 billion in
November, which has brought some level of liquidity in the financial system. However, this special
window was not provided to NBFCs.
During the period 20 September to 23 November 2018, the RBI undertook OMO purchases worth
INR. 880.02 billion to introduce liquidity into the financial system (See: Appendix, Exhibit No. G).
However, these liquidity infusion steps cannot help rectify the Asset Liability mismatch for the
NBFCs in the near term. To resolve this situation, the RBI introduced in early October the
suggestion to revise the NBFC ALM norms so that the risk of constant roll-overs of loans and debt
instruments is reduced79.
To gain an insight into the NBFC ALM maturity, Table No. 6 on the next page provides the ALM for
select five leading NBFCs in India.
79 Business Standard, 06 October 2018, RBI to revise NBFC Asset-Liability norms over borrowing, lending mismatch, available on the internet at, https://www.business-standard.com/article/economy-policy/rbi-to-revise-nbfc-asset-liability-norms-over-borrowing-lending-mismatch-118100501175_1.html, accessed on 01 December 2018

59
Table No. 6: Select NBFC Asset Liability maturity
NBFC Name Upto 1 year 1-3 year 3-5 year Over 5 year Asset Liability Asset Liability Asset Liability Asset Liability
PNB Housing Finance (INR bn) Jun 2018
191.41 242.18 183.63 234.64 110.45 95.67 220.19 133.19
DHFL (US$ bn)
5.1 3.1 4.4 4.3 4.4 2.8 2.4 5.2
Indiabulls Housing Finance (INR. bn)
389 343 646 632 379 438
HDFC (INR. bn)
870 757 2118 2360 - - 1029 900
Bajaj Finance (INR. Crore) – Mar 2018
49136 25035 24738 29355 6205 8630 8322 25381
Source: Created by authors
We observe in Table No. 6 that the NBFCs such as PNB Housing Finance, HDFC and Bajaj Finance
have a ALM mismatch in the period 1-3 years. However, the NBFCs such as DHFL, Bajaj Finance
and India-bulls have a ALM mismatch over the 5 year period. This again reinforces that these
NBFCs reliance of funding composition is higher on the short-term compared to the long-term
borrowings. This introduces a roll-over risk which can destabilize the financial market.
A major investor in the NBFC issued commercial paper are mutual funds that have an exposure of
around 60% of these NBFC CPs. As discussed earlier, eleven of the 42 AMCs are bank sponsored
and have an exposure to the NBFC CPs, this makes banks face a twin exposure to a particular NBFC
through:
60
1) Direct exposure: Loans and investments on their bank balance sheet
2) Indirect exposure: Portfolio investment in debentures and commercial paper of a
NBFC through the bank run mutual fund arm.
However, the indirect exposure through the bank run AMC to the same NBFC is not fully
accounted for in the banking system. RBI sets limits on the exposure taken by banks80 and AMCs81
independently to NBFCs. However, the RBI doesn’t provide any guidelines that cover joint
exposure to a particular NBFC undertaken by a bank and the same bank run AMC.
Although Basel III disclosure considers the bank risk at the consolidated level for both the parent
bank and the bank-run AMC. However, the business norms for NBFC lending are divergent from
banks, where a bank reports a non-performing asset (NPA) after 90 days and a NBFC reports it
after 180 days. Hence, a bank may register the NBFC loan as NPA earlier than a NBFC may report
it. In such a scenario, the bank may provide for the NBFC loan default, however at the AMC level
that subscribes to the NBFC commercial paper and debentures. There may be limited reflection
on their asset quality. In this setup, the banks overall systemic risk would tend to increase
manifold. The direct and indirect exposure to a particular NBFC may be well within the RBI
prescribed individual limits for a bank and AMC. However, the risk generated through this total
exposure (direct and indirect) may be well beyond the banks’ capacity to sustain the impact of
default on the part of an NBFC. Authorities may wish to consider both direct and indirect exposure
to a particular NBFC and what impact it might probably have on the parent bank using various
80 Banks have a direct exposure limit for the NBFC lending activities and investment activities capped at 10% to 15% (of the banks’ capital funds as per the last audited financial statements) for a single NBFC/NBFC Asset Financing Company/ NBFC Infrastructure Finance Company. RBI exposure limit to a single NBFC, available on the internet at, https://www.rbi.org.in/scripts/BS_ViewMasCirculardetails.aspx?id=9875, accessed on 19 Jan 2018. 81 AMCs have an exposure limit of 25-30% to the NBFC sector and a single issuer limit of 10-15% of the net asset value (NAV). Live Mint, SEBI relaxes debt fund exposure limit for housing finance companies, 11 Aug 2016, available on the internet at, http://www.livemint.com/Money/kJdEWM3z3hecPWSwKMvZtK/Sebi-relaxes-debt-fund-exposure-limit-for-housing-finance-co.html, accessed on 23 Jan 2018.

61
stress testing scenarios. With this background we arrive at our first proposition for this research
and we sequentially develop the remainder two propositions based on the positive outcome from
proposition I.

62
Diagram No. 6: Sequential development of propositions and testing
Source: Created by authors
Systemic risk in financial system
Yes
P II: Do AMCs undertake liquidity Transformation?
Liquidity Transformation No
P I: Does Joint exposure of bank and bank
sponsored AMC to NBFC exist?
No Joint exposure
Yes
P III: Does financial interdependency exist among
banks, bank sponsored AMCs and NBFCs?
No Financial Interdependency
Increase in Systemic risk in financial system
Yes

63
Proposition I: Does joint exposure exist for a bank and its bank run AMC to NBFC/s?
• To test whether a bank has direct and indirect exposure to a particular NBFC or multiple
NBFCs.
• To test whether the indirect exposure is near RBI limits or below RBI limits of 10-15%
of NAV.
One of the reasons behind considering this line of argument is that parent banks own a majority
stake in their sponsored AMCs. These parent banks also hold a majority stake in other NBFCs to
which these bank sponsored AMCs may hold an exposure. (For details please refer to Table No.
11 ). Typically, a bank has to meet the lending restriction norms laid out by the central bank i.e.
not to extend a loan to a particular NBFC beyond 10 – 15% of their net demand and time liabilities
(NDTL). However, through their AMC they may extend short-term loans or long-term loans to
NBFCs by subscribing to their commercial paper and debentures. Typically, an AMC is expected to
function as a pass through that serves as a platform between an investor and a borrower; where
an investor is enabled to withdraw his/her invested funds at any point in time. However, an AMC
may indulge in the function of liquidity transformation where the fund manager may hold cash in
excess of their requirements (investment and redemption) as the NBFC issued commercial papers
and debentures that the AMC holds in its portfolio may be more illiquid than expected. This
implies that AMCs might undertake liquidity transformation on behalf of the parent bank. This
may lead to AMCs functioning as shadow banks.
Although Acharya et. al., (2013) has considered NBFCs as shadow banks he has not addressed that
asset management companies (AMCs) might undertake liquidity transformation especially in an
open-ended scheme.

64
5. B. Joint exposure of AMC to banks and NBFCs
At the first level, we try to establish if an indirect exposure exists to a particular NBFC or multiple
NBFCs. We observe in Table No. 8 that the bank run AMCs have a direct exposure to NBFC or
multiple NBFCs. Table No. 11 suggests that banks have cross-holdings in these mutual funds and
hence tend to have an indirect exposure to NBFCs and other financial institutions. A glance at the
individual bank or NBFC exposure as a percentage of AuM suggests that these mutual funds have
remained in the limits set under RBI guidelines – 10-15%.
Of these 42 banks, we have eleven bank sponsored AMCs that contribute to 47% of the total
assets under management (equity and debt schemes). Of these eleven AMCs, private sector bank
sponsored AMCs form 35% of the total AUM in the mutual fund industry and public – sector bank
sponsored AMCs form the remainder 12% (See Appendix: Exhibit No. C for list of Asset
Management Companies included in this study). Among the public sector bank sponsored AMCs,
Principal bought out the entire stake of Punjab National Bank in Principal PNB Asset Management
Company (AMC)82. So, from August 2018, there are 10 bank sponsored AMCs. The study period
considered is from Jan 2012 to Jan 2018 extended to May 2018 wherever data is available.
The three cases of mutual fund portfolios serve as an example to present the point that joint
exposure exists between bank run mutual fund houses, banks and NBFCs. This is for a month
whereas joint exposure has evolved over a period of time. Portfolio was compiled for ICICI, Axis
and HDFC for the month of March 2018. This presents the aggregate of all the schemes offered
under debt to an investor – liquid fund, money market fund, income funds, hybrid funds,
corporate debt fund, short-term to medium term income funds and fixed maturity plans83. We
82 MoneyControl, 29 August 2018, Principal buys out entire stake of PNB in Principal PnB Asset Management Company (AMC), available on the internet at, https://www.moneycontrol.com/news/business/mutual-funds/principal-buys-out-entire-stake-of-pnb-in-principal-pnb-asset-management-company-2893791.html, accessed on 03 October 2018. 83 ICICI Prudential AMC, Types of Debt Funds, available on the internet at, https://www.icicipruamc.com/InvestCorrectly/Basics-of-Mutual-Funds/Understanding-Debt-Mutal-Funds/Different-types-of-Debt-Funds.aspx, accessed on 25 July 2018

65
have excluded the treasury securities under the portfolio and the AuM has been adjusted to
reflect only cash, CBLO and other debt securities. It indicates how much exposure to each fund
house have in terms of debt (commercial paper, debentures, zero-coupon bonds, certificate of
deposits, pass through certificates) to a particular bank, non-banking finance company (NBFC) and
small finance banks. We have included Housing Finance Companies (HFC) as well under the NBFC
for the presentation of the table.

66
5. C. Results for Proposition I:
Sector-wise debt allocation for the entire mutual fund industry
The sector-wise portfolio allocation of the debt schemes (aggregate level) is presented in Table
no. 7 on the next page. We observe in the table that allocation to the NBFC sector issued
commercial paper has gradually to INR. 1,061.61 billion in March 2019 from INR. 475.16 billion in
March 2015, a 22 percent compounded annual growth rate over the past five years. For the
corporate debt, again the same story continues where investments in NBFC issued corporate
debentures increased to INR. 1,104.77 billion in March 2019 from INR. 530.59 billion in March
2015, a 20 percent compounded annual growth rate over the past five years. This suggests that
the dependency of NBFCs to borrow from the AMCs through instruments such as commercial
paper and debentures is growing in double digits. However, this creates an issue when the NBFC
depends on short-term CPs for funding compared to medium to long-term borrowing through
debentures. The NBFCs indulge in funding their long term loans via short-term issued CPs. This
may generate a liquidity risk at the NBFC in case the roll-over of the CP is not possible.

67
Table No. 7: Sector–wise (NBFC, Real Estate and others) allocation of debt schemes from
March 2015 to March 2019
Sector March 2015 March 2016 March 2017 March 2018 March 2019
Government
Securities 13.14% 13.98% 10.6% 6.78% 3.98%
Money Market
Instruments 47.68% 41.92% 38.67% 41.21% 44.74%
Commercial Paper 16.35% 20.55% 22.94% 24.12% 23.68%
Real Estate 0.17% 0.27% 0.20% 0.26% 0.06%
NBFC 6.6% 5.96% 6.94% 8.28% 8.13%
Others 9.58% 14.32% 15.80% 15.58% 15.49%
Bank Certificates 27.41% 18.21% 8.06% 11.79% 15.49%
Treasury Bills 0.46% 0.55% 1.23% 0.51% 0.83%
CBLO/Tri-Partite
Agreement 3% 1.81% 4.02% 3.55% 3.59%
Others MMI 0.46% 0.8% 2.42% 1.24% 1.15%
Corporate Debt 27.98% 30.76% 36.67% 38.07% 33.28%
Real Estate 0.62% 0.36% 0.45% 0.51% 0.51%
NBFC 7.37% 8.55% 8.92% 9.34% 8.46%
Others 19.99% 21.85% 27.30% 28.22% 24.31%
PSU Bond Debt 7.51% 10.28% 11.74% 11.03% 11.85%
Securitised Debt 0.01% 0.01% 0.25% 0.19% 1.06%
Bank Fixed Deposit 4.86% 3.77% 2.17% 3.27% 1.78%
Others -1.19% -0.72% 0.45% -0.55% -0.17%
Assets Under
Management (INR.
Billion)
7199.39 8283.53 12590.90 12692.24 13058.78
Source: Deployment of debt
Going further, we attempt to establish the joint exposure at the bank-run scheme levels for top
3 mutual fund houses ICICI, HDFC and Axis. We have not considered the longitudinal exposure of
the AMCs to these NBFC floated debt instruments for the joint exposure hypothesis since the
broad trend of security holdings across the years has been more or less similar.

68
With this background we arrive at our first proposition for this research and we sequentially develop the remainder two propositions based on testing and after ascertaining a positive outcome from hypothesis I.
Hypothesis I: To determine joint exposure between banks, NBFCs and other financial institutions
Null Hypothesis (Ho): Banks and Financial Institutions do not have a joint exposure
i) Parent bank sponsored AMCs do not have exposure to a Parent bank – sponsored NBFC
ii) Parent bank sponsored AMCs do not have exposure to other Banks iii) Parent bank sponsored AMCs do not have exposure to other Bank sponsored NBFC iv) The AMC does not have exposure to individual banks and NBFCs within RBI limits
Alternate Hypothesis (Ha): Banks and Financial Institutions have a joint exposure
i) Parent bank sponsored AMCs have exposure to a Parent bank – sponsored NBFC ii) Parent bank sponsored AMCs have exposure to other Banks iii) Parent bank sponsored AMCs have exposure to other Bank sponsored NBFC iv) The AMC has exposure to individual banks and NBFCs within RBI limits
After we fail to accept the null hypothesis I, we proceed to formulating hypothesis II (mentioned in detail on Page No. 92),

69
Bank run debt mutual funds and their exposure to other banks and NBFCs (Non-Banking
Finance Companies)
In March 2018, ICICI Prudential debt (open – ended) schemes had Assets under Management
(AuM) of INR. 1,187.76 billion.
ICICI debt mutual funds:
On the whole banking and NBFC sector (including exposure to ICICI Bank and ICICI Home Finance)
forms 60% of the debt schemes exposure. The ICICI debt (open-ended) schemes have other bank
exposure of 27% to the total AuM as on March 2018. Other NBFCs form 33% of the total exposure
of these debt schemes. Single entity exposure is within the regulatory norms of RBI i.e. 10% of the
total AuM. The scheme portfolio includes public sector banks such as Union Bank, UCO bank, Bank
of Baroda, Allahabad bank that have received a downgrade in their credit rating over the past one
year due to the ongoing non-performing assets (NPA) dilemma.
On the private sector banks front, the scheme has the highest exposure to Axis bank that has been
on the RBI radar for divergence reporting and increasing NPAs.
On the NBFC front, the ICICI debt mutual fund schemes have highest exposure to a bank affiliated
institution i.e. HDFC.
Axis mutual fund
In March 2018, Axis Mutual fund has a debt exposure worth INR.366.6 billion of which, 68% forms
exposure to (Public and Private sector) banks, Small Finance Banks (SFBs) and NBFCs. The overall
banking sector forms 19.24% of the total debt AuM. Axis bank along with its owned subsidiaries
form 1.56% of the exposure. Other private sector banks form 13.2% exposure. Public sector banks
form 4.22% exposure. There is an overlap in the Banks across both ICICI and Axis schemes. Among

70
NBFCs, apart from EXIM, NABARD and SIDBI, the rest form 44.63% of the total debt AuM. Among
NBFCs as well, there is an overlap between both Axis and ICICI mutual fund exposure to the same
NBFCs. HDFC, PFC, Indiabulls and LIC Housing form the top exposure in these schemes. The
schemes under Axis cover the debt under open-ended and close ended in addition to equity
schemes that invest a portion in debt securities. Among ICICI and Axis debt mutual funds, the
exposure to the banking sector is at a par levels.
HDFC Mutual Fund
HDFC mutual fund has AuM worth INR.1268.42 billion in March 2018. Of this amount around
8.48% exposure lies with HDFC, HDFC bank and its subsidiaries that are also NBFCs. HDFC has a
presence in the housing industry in terms of lending. The HDFC mutual fund has an exposure of
44.04% of the total debt AuM to NBFCs. The highest exposure is to HDFC its own parent company,
followed by Power Finance, LIC Housing, Indiabulls, Mahindra and Mahindra Financial Services
and Aditya Birla Finance. The mutual fund has an exposure to 22.86% of the banks (both Public
and Private sector banks).
Across bank sponsored mutual fund schemes, the top NBFC exposure remains with HDFC, Power
Finance Corporation, Indiabulls Housing Finance, LIC Housing Finance.

71
Table No. 8: Joint exposure of Parent bank through NBFC – mutual fund arm to other banks
and NBFCs
Sector Percentage (% of total Debt AuM)
Total Amount
(INR. Billion)
Percentage (% of total Debt
AuM)
Total Amount
(INR. Billion)
Percentage (% of total Debt AuM)
Total Amount
(INR. Billion)
Fund wise ICICI Axis HDFC Parent Bank and its NBFC subsidiaries
1.8% 21.90 1.56% 5.73 8.48% 107.56
Other Banks (PSB + Pvt SB – Parent Bank and its subsidiaries)
18% 216.31 17.68% 64.80 20.73% 262.92
Other Private Sector Banks 14% 171.69 13.2% 48.39 8.32% 123.81
Top 5 bank exposure Axis Bank 5.1% 60.91 2.32% 29.43 Indusind Bank 2.3% 26.76 NA NA 0.69% 8.78 IDFC Bank 2.2% 26.18 3.41% 12.48 NA NA HDFC Bank 1.8% 21.17 1.36% 5.00 South Indian Bank 1% 9.24 1.53% 5.59 0.57% 7.24 ICICI Bank 1.43% 5.24 3.07% 38.93 RBL NA NA 2.55% 9.36 NA NA Kotak Bank NA NA NA NA 0.43% 5.48 Other Public Sector Banks 4% 44.61 4.22% 15.47 11.96% 151.67
Top 5 bank exposure Bank of Baroda 1.6% 18.5 0.21% 0.75 1.69% 21.41 Union Bank of India 0.8% 9.89 0.6% 2.23 1.29% 16.40
Vijaya Bank 0.5% 6.01 2.78% 10.19 SBI 0.3% 3.64 0.19% 0.69 2.17% 27.47 UCO Bank 0.27% 3.17 Punjab National Bank NA NA 0.20% 0.74 1.37% 17.37 Andhra Bank NA NA NA NA 1.85% 23.47 Other Small Finance Banks (SFB)
0.78% 9.21 0.26% 0.93 0.45% 5.70
Ujjivan SFB 0.3% 3.95 0.24% 0.88 NA NA Equitas SFB 0.2% 2.76 0.01% 0.05 NA NA AU SFB 0.2% 2.49 NA NA 0.45% 5.7 NABARD 5.3% 62.65 3.34% 12.25 5.26% 66.71 SIDBI 0.5% 5.32 0.92% 3.37 1.92% 24.32 EXIM 0.4% 4.84 0.75% 2.75 1.93% 24.53 Other NBFC 33% 397.13 44.63% 163.61 28.58% 362.42
Top 5 NBFCs HDFC 5.5% 65.22 5.05% 18.49 Power Finance Corporation 2.9% 35.05 5.10% 18.67 4.27% 54.10
Indiabulls Housing Finance 2.6% 30.46 4.83% 17.70 3.18% 40.27
LIC Housing Finance 2.2% 25.64 2.30% 8.43 2.83% 35.91
India Infoline Finance Ltd 1.5% 17.91 NA NA NA NA
Aditya Birla Finance 1.2% 13.77 NA NA 1.78% 22.59
Dewan Housing Finance Ltd NA NA 4.49% 16.44 NA NA
Edelweiss Commodities NA NA 2.30% 8.43 NA NA
Mahindra & Mahindra Financial Services
NA NA NA NA 2.21% 28.06
L&T Finance NA NA NA NA 1.72% 21.87 Source: Compiled by authors from monthly portfolio disclosure of mutual fund schemes for March 2018.

72
6. Financial institutions interdependency
Dwelling further on the joint/dual exposure we consider the interdependency between these financial
institutions. Further in this section, Table No. 9 displays the net exposure of Banks, AMCs and
Insurance companies to NBFCs. These NBFCs also include Housing Finance Companies (HFCs). One can
observe that the net exposure of banks has increased annually 21.67% over the period 2012 to 2018.
However, a striking observation is the phenomenal (~ 89%) annual increase in the net exposure of
AMCs to NBFCs during the same period. This increased exposure was attributed to higher NBFC
floated commercial paper (CP) and bond issuances during the period 2012 to 2018. Increased demand
from AMCs side for the NBFC floated securities (debentures and commercial paper) has gradually
shifted their portfolio composition exposure in their liquid and debt funds’ portfolio from bank
certificate of deposits. Earlier, AMCs portfolio composition for money market and liquid funds
included more than 50% bank issued certificate of deposits84. In late 2008, the bank run mutual funds
were faced with redemptions to the scale of INR. 540 billion in the money market mutual funds. To
enable the bank run mutual funds to honor their redemption claim commitments, the RBI provided a
repo-facility to the parent banks worth INR. 600 billion for a fortnight.85
Around late 2009, SEBI abolished the entry load or upfront commission for mutual fund distributors.
Majority of the mutual fund distributors were banks. Distributors, who earned a commission from
asset management companies for selling mutual funds to investors, no longer had an incentive to do
so. Second, RBI was concerned that there could be regulatory arbitrage in the form that mutual funds
could be lending to companies that banks could not directly lend to86. A look at Diagram No. 7 that
presents the investment composition of scheduled commercial banks (SCB) to the total other
84 ACE Mutual Fund database, Analysis of Top 5 money market funds and liquid funds’ portfolio composition 85 Mutual Funds and Market Development in India, 07 Jul 2011, available on the internet at, https://www.rbi.org.in/scripts/BS_SpeechesView.aspx?id=584, accessed on 23 Jan 2018. 86 LiveMint, Banks close liquidity tap for mutual funds, 18 May 2010, available on the internet at, https://www.livemint.com/Home-Page/tP7lQImEp7HDp7kzN2vojO/Banks-close-liquidity-tap-for-mutual-funds.html, accessed on 14 July 2018

73
investments. Typically, the investment of scheduled commercial banks comprises of Statutory
Liquidity Reserves (SLR), commercial paper, shares and bonds or debentures issued by (PSUs, Private
corporate and others), instruments issued by mutual funds and financial institutions. The SLR typically
forms 80% of the banks’ investment and the remainder 20% is invested in other securities such as
commercial paper, shares, bonds, mutual funds and financial institutions. From 2003 onwards, SCB
investment exposure to mutual fund instruments was on the rise and from Sep 2009 to Dec 2009. The
SCBs investment in mutual funds was an average 40 – 50% of the total other investments figure INR.
3,018 billion (average of other investments between September to December 2009).
Diagram No. 7: Scheduled commercial banks investment in mutual funds during the period 2003
to 2018
The diagram presents mutual fund investments as a percentage of other bank investments.
Source: RBI Bulletin, Scheduled Commercial banks Investments, period March 2003 to May 2018
0.00%
10.00%
20.00%
30.00%
40.00%
50.00%
60.00%
Mar
-03
25-S
ep-0
929
-Jan-
1004
-Jun-
1008
-Oct
-10
11-F
eb-1
117
-Jun-
1121
-Oct
-11
24-D
ec-1
229
-Jun-
1230
-Nov
-12
17-M
ay-1
320
-Sep
-13
07-F
eb-1
427
-Jun-
1428
-Nov
-14
03-A
pr-1
521
-Aug
-15
08-Ja
n-16
27-M
ay-1
614
-Oct
-16
17-F
eb-1
721
-Jul-1
708
-Dec
-17
27-A
pr-1
8

74
To curb this interdependency among banks and mutual funds RBI imposed a limit on bank investment
in debt oriented mutual funds at 10% of the banks’ net worth in May 201187. Post this, the SCB
investment in mutual funds continued to reduce. A look at the investment percentage of the total
other investments shows a declining trend. We conducted a structural break test to see whether the
data series witnessed a break point when an event occurred. Post the regulation that imposed limit
on bank investment, a structural break occurred in December 2011 (Using Bai-Perron). Again in Jan
2017, the banks’ investment in mutual fund schemes witnessed a structural break. This may be
attributed to the effect of demonetization in November 2016.
Owing to banks sitting on liquidity due to demonetization, banks converting funds raised via special
dollar swap window and overseas borrowing in Indian rupees. RBI in its press statement suggested
that swap windows for Foreign Currency Non-resident (Banks) – FCNR88 and banks overseas
borrowings had mobilized USD 34 billion. Increased liquidity in terms of cash balances at the banks
reduced the banks’ need to borrow in the money market through certificate of deposits (CDs). Banks
were trying to be conservative in terms of extending new loans to borrowers as the NPAs were
gradually on the rise and the restructured asset recognition window was closing. Bank issued
certificate of deposits (CD) outstanding have more than halved to INR. 1,286.2 billion (October 2017)
from INR. 3,410.54 billion (Mar 201089). Typically, AMCs used to invest 50% - 70% of their portfolio
under the liquid and money market fund schemes in bank issued certificate of deposits90. During the
transition period, the mutual funds to fill up the lacuna created from the receding CD issuances started
87 RBI Speeches, Mutual Funds and Market Development in India, Jul 2011, available on the internet at, https://www.rbi.org.in/scripts/BS_SpeechesView.aspx?id=584, accessed on 24 Jan 2018 88 Business-Standard, 04, December 2013, Fund houses resort to deploying in CBLO, available on the internet at, https://www.business-standard.com/article/markets/funds-houses-resort-to-deploying-in-cblo-113120400826_1.html, accessed on 25 July 2018 89 RBI Bulletin, Issue of Certificate of Deposits by Scheduled Commercial Banks, Feb 2011, available on the internet at, https://www.rbi.org.in/Scripts/BS_ViewBulletin.aspx?Id=11959, accessed on 23 Jan 2018. 90 ACE Mutual Fund database, Average portfolio composition of top 5 liquid and MMMF schemes from 2011 to 2017

75
investing heavily in CBLOs91. This gave them access to CBLO – a money market instrument where
mutual funds could lend their excess money for short periods on in lieu of a collateral such as Treasury
bills, central government securities etc. with a maturity left of six months. Non-banks were not
allowed participation in this market and this market operated through the Clearing Corporation of
India Limited (CCIL).
Around June and July 2011, the CBLO trade value increased 28.36% and 34.29% year on year
respectively to INR. 10,741 billion and INR. 10,661 billion respectively. The increase in CBLO was due
to the excess supply from mutual funds as short-term liquid funds matured92. Again between August
2012 to March 2014, the CBLO trade value witnessed a steady year on year increase due to inflows
from mutual fund houses into the money market system and the Foreign Currency Non-Resident
(FCNR) swaps93. In September 2015, Amtek Autos’ debt instruments rating status was downgraded to
default as it was unable to make a payment on its coupons. During the year FY 2015-16, the debt
instruments of Jaiprakash Associates, Monnet Ispat, Punj Lloyd, Electrosteel Steels, Shree Rama
Newsprint, Uttam Sugar Mills, Hindustan Construction, Mukesh Steels, Sanghvi Forging and Yash
Papers were downgraded to default rating94. In all 100 companies (20 listed and 76 unlisted) have
been assigned the downgraded status. Around early 2017, the CBLO segment witnessed a
phenomenal increase (i.e. average 53.23% year- on – year) to average INR. 22,536 billion during the
period Jan 2017 to Apr 2017. A part of the increase in the CBLO activity was attributed to mutual funds
91 Business Standard, 4 December 2013, Funds houses resort to deploying in CBLO, available on the internet at, https://www.business-standard.com/article/markets/funds-houses-resort-to-deploying-in-cblo-113120400826_1.html , accessed on 14 July 2018 92 NDTV, 23 Nov 2011, CBLO falls as mutual funds flush with cash on liquid plans maturity, available on the internet at, https://www.ndtv.com/business/cblo-falls-as-mutual-funds-flush-with-cash-on-liquid-plans-maturity-13361, accessed on 25 July 2018. 93 Times of India, 30 September 2013, FCNR swap deal: What it means for NRIs, available on the internet at, http://timesofindia.indiatimes.com/articleshow/23309748.cms?utm_source=contentofinterest&utm_medium=text&utm_campaign=cppst, accessed on 03 May 2019 94 Financial Express, A hundred firms downgraded to ‘default’ status since April, available on the internet at, https://www.financialexpress.com/industry/a-hundred-firms-downgraded-to-default-status-since-april/142973/, accessed on 14 July 2018.

76
parking INR. 1,146.70 billion in CBLO due to a downgrade in the company Ballarpur Industries Limited
(BILT) rating to default.
We also conducted the Bai-Perron multiple breakpoint95 test on the CBLO trade growth data from the
period dated 2010 to May 2018 and found that multiple breaks were found at August 2012, April
2014, November 2014, Feb and August 2016 and April 2017. These breaks were consistent with the
events that occurred during the period as enumerated above in the paragraph.
Diagram No. 8: CBLO trade value growth (y-o-y) during period Apr 2010 to May 2018
Source: CCIL website Rakshitra Archives, available on the internet at,
https://www.ccilindia.com/Research/CCILPublications/Pages/RakshitraArchive.aspx, accessed on 14 July 2018
95 Bai Perron Multiple breakpoint, available on the internet at, http://www.eviews.com/help/helpintro.html#page/content%2Fmultibreak-Working_with_Breakpoint_Equations.html%23, accessed on 25 July 2018
-60.00%
-40.00%
-20.00%
0.00%
20.00%
40.00%
60.00%
80.00%
Apr-
10
Sep-
10
Feb-
11
Jul-1
1
Dec-
11
May
-12
Oct
-12
Mar
-13
Aug-
13
Jan-
14
Jun-
14
Nov-
14
Apr-
15
Sep-
15
Feb-
16
Jul-1
6
Dec-
16
May
-17
Oct
-17
Mar
-18
Short-term liquid fund maturity
Fund Inflows and FCNR swaps
Amtek Auto default
Ballarpur default

77
From Diagram No. 8, we understand that when there is a stress event there is an increase in the CBLO
activity. However, when the stress event subsides the CBLO activity reverses to the normal96. In
continuation with the stress event, mutual fund exposure to CBLO increases during the period of a
stress event. For example, when in early 2017 Ballarpur Industries debt instruments received a
downgrade to ‘D’. Mutual fund houses increased their exposure to more CBLO to keep a buffer in case
investors redeemed their units.
Diagram No. 9: MF CBLO exposure from Jan 2012 to May 2018
Source: SEBI website, deployment of funds by all mutual funds – debt funds, available on the internet at,
https://www.sebi.gov.in/statistics/mutual-fund/deployment-of-funds-by-all-mutual-funds.html, accessed on
14 July 2018
During the same period the CBLO exposure of mutual funds as a percentage of AuM was as high as
10% in Jul 2013 and Aug 2013 i.e. INR. 584 billion to INR. 587 billion. Around Feb 2014, the exposure
96 Stress is defined as a prolonged decline in the real market growth. Duprey, Klaus and Peltonen (2016), use markov switching models to ascertain periods of financial stress. The short summary is available on the internet at, https://voxeu.org/article/dating-financial-stress-events-new-approach, accessed on 25 July 2018
0.00%
2.00%
4.00%
6.00%
8.00%
10.00%
Jan-
12
May
-12
Sep-
12
Jan-
13
May
-13
Sep-
13
Jan-
14
May
-14
Sep-
14
Jan-
15
May
-15
Sep-
15
Jan-
16
May
-16
Sep-
16
Jan-
17
May
-17
Sep-
17
Jan-
18
May
-18
MF CBLO as a % of AuM MF CBLO as a % of total CBLO value
Fund Inflows and FCNR swaps
Restrictions on debt oriented
funds

78
of MFs to AuM was 7.74% i.e. INR. 547.28 billion and 5% of total CBLO market value of INR. 11,653.44
billion. In Feb 2017, this percentage was very high i.e. 5.7% of the total CBLO value and the reason
behind it was the rising defaults in the company issued debt instruments and mutual funds trying to
maintain a cushion to meet the investor redemptions and being cautious while fund allocation.
Gradually, AMCs’ shifted their portfolio composition from certificate of deposits to commercial paper
in the debt oriented funds such as liquid and money market funds. Commercial paper used to form
roughly ~30% of Net asset value (NAV) of a AMCs portfolio composition in 2011 that has increased to
70-80% of NAV in 2018. Similarly, the percentage holdings of bank issued certificate of deposits has
decreased from 50-70% to roughly ~10% or less of the Net Asset Value (NAV) of a scheme. Increased
investment in commercial paper led to a more than six times increase in commercial paper issuances
to INR. 4,668.90 billion (May 2018) from INR. 760.56 billion (March 2010)97. A major portion of this
commercial paper that these AMC floated liquid and money market funds invest into belongs to
NBFCs.
97 RBI Bulletin, Issue of Commercial Paper by Companies, 2011, available on the internet at, https://www.rbi.org.in/Scripts/BS_ViewBulletin.aspx?Id=11960, accessed on 23 Jan 2018.

79
A similar trend was also observed in, bond issuances with a major participation from NBFC companies.
Table No. 9: Direct net exposure of Banks, AMCs and Insurance Companies to NBFCs
INR. Billion March
2012
March
2013
March
2014
September
2014
March
2015
March
2016
March
2017
March
2018
Banks (Net) 1513 1453 2919 1495 1595 2029 3739 4909
AMCs (Net) 83 624 756 312 1008 1489 3208 3818
Insurance
Companies
(Net)
780 880 965 1023 1760 1038 1898 2917
Source: Created by authors, Reserve Bank of India, Financial Stability Report, 2013, 2014, 2015, 2016, 2017,
2018, available on the internet at, https://rbi.org.in/Scripts/FsReports.aspx, accessed on 15 July 2018
We observe in Table No. 9 that the net exposure of AMCs to NBFCs has increased manifold to INR.
3,818 billion i.e. 46 times over the past six years whereas the bank exposure to NBFCs has increased
3.2 times over the six year period. The gap between bank and AMC exposure to NBFCs is narrowing
down. This suggests that the AMCs are undertaking lending at a par to banks when it comes to NBFCs.
Thereby indicating that they may be exposed to higher risks given they don’t have a capital cushion
like banks.
In Table No. 10, we present a few select banks’ exposure to NBFCs as an example to indicate the
percentage of exposure they have in terms of their fund base. Data for Top three private banks and
the largest state owned bank - SBI is presented. These four banks form a 40% of the total advances in
the banking system. ICICI exposure to NBFC has increased marginally from 6.54% in June 2015 to
7.40% in March 2018. Whereas, the bank and financial institution exposure has increased from 6.17%

80
of the total fund based exposure to 9.06%. HDFC has witnessed a reverse situation in the exposure to
banks i.e. fund based exposure has reduced to 3.91%. This may also be attributed to the uncertainty
in the banking sector due to the bad loans problem. However, aggregate NBFC and HFC exposure has
increased during the same period from 6.07% to 7.32% in March 2018. Axis bank fund based exposure
to Banks and Financial Institutions has remained more or less stable in the range of 7-8%. However,
NBFC exposure has increased to 1.51% from 0.94% in June 2015. State Bank of India (SBI) fund based
exposure to NBFC is on the higher side because these NBFCs many a times lend to priority sectors
such as agriculture and allied activities, micro and small enterprises, housing, education, and other
low income segments. As a public sector bank (PSB) the onus of priority sector lending largely lies on
PSBs. Private sector banks have a presence in housing segment, however, they keep away from
segments which might have social costs compared to profit generation options. Till 2011, banks were
allowed to achieve the PSL targets98 through NBFC refinancing. However, post 201199 the bank lending
was treated as PSL only if the NBFCs lending rate was not more than 8% of the banks’ rate. This
demotivated a number of banks from engaging in lending to NBFCs.
98 Reserve Bank of India, 18 April 2018, Priority Sector Lending –Targets and Classifications, available on the internet at, https://rbi.org.in/scripts/FAQView.aspx?Id=87, accessed on 25 July 2018 99 Business Today, 24 February 2015, Review Priority sector lending norms open refinance window for NBFCs, says Equitas Holdings MD, available on the internet at, https://www.businesstoday.in/union-budget-2015-16/executive-wish-list/union-budget-2015-16-p-n-vasudevan-equitas-holdings-nbfcs/story/215836.html, accessed on 25 July 2018

81
Table No 10: Select banks’ exposure to NBFCs
Bank name Jun
2015
Sep
2015
Dec
2015
Mar
2016
Jun
2016
Sep
2016
Dec
2016
Mar
2017
Jun
2017
Sep
2017
Dec
2017
Mar
2018
ICICI NBFC 6.54% 6.79% 6.72% 6.48% 6.56% 6.70% 6.92% 6.95% 7.09% 6.80% 7.49% 7.40%
ICICI Bk
and FI 6.17% 5.75% 6.57% 8.08% 5.98% 7.14% 5.91% 6.82% 6.34% 7.19% 7.18% 9.06%
ICICI 12.71% 12.54% 13.30% 14.56% 12.53% 13.84% 12.83% 13.77% 13.43% 14.00% 14.67% 16.45%
HDFC
NBFC 4.12% 3.81% 3.97% 4.22% 3.96% 4.13% 4.98% 5.35% 2.80% 5.10% 4.42% 5.22%
HDFC HFC 1.95% 1.94% 2.07% 1.99% 2.20% 2.19% 1.96% 2.20% 2.19% 2.32% 2.27% 2.10%
HDFC
Banking 6.16% 5.42% 4.66% 4.47% 4.50% 4.31% 3.28% 3.82% 4.90% 3.47% 2.78% 3.91%
HDFC 12.23% 11.16% 10.70% 10.69% 10.66% 10.63% 10.22% 11.36% 9.90% 10.89% 9.47% 11.24%
Axis NBFC 0.94% 0.95% 1.03% 1.13% 1.09% 1.37% 1.09% 1.51% 1.88% 1.81% 1.80% 1.51%
Axis Bk and
FI 8.53% 8.21% 8.86% 6.76% 6.03% 9.04% 6.03% 8.51% 7.79% 7.35% 8.24% 8.55%
Axis 9.47% 9.16% 9.89% 7.90% 7.13% 10.41% 7.13% 10.01% 9.67% 9.16% 10.05% 10.06%
SBI NBFC 11.05% 9.54% 10.52% 10.71% 10.64% 9.86% 12.03% 10.39% 10.11% 11.56% 12.76% 12.51%
Source: Created by authors, Banks Pillar 3 disclosure norms, SBI data is available from 2015
onwards. Hence, the other banks data is presented from the SBI date till latest March 2018.
RBI has laid out norms that curtail their exposure at 10-15% of the banks net owned funds to a single
NBFC100. Earlier we discussed about how a parent bank may have exposure to a particular NBFC and
its AMC may also have an exposure to that NBFC. This amounts to dual exposure. For example, ICICI
bank, HDFC bank and Axis bank have a fund based exposure to Indiabulls Housing Finance. Similarly,
Axis bank, ICICI bank and HDFC bank also have a fund based exposure to Dewan Housing Finance
Limited (DHFL).
100 RBI, 01 July 2013, Master Circular- Bank finance to NBFCs, available on the internet at, https://rbi.org.in/scripts/BS_ViewMasCirculardetails.aspx?id=8115#2, accessed on 14 July 2018

82
Existing banks, corporate houses and financial institutions (other than banks) may set up NBFCs. The
NBFCs in our proposal are institutions that lend to retail and corporate clients. Now we discuss how a
parent bank and its AMC that have exposure to another bank run NBFC or a corporate run NBFC may
create a further web of interdependency in case of bank-run NBFCs. A bank-run AMC may invest in
the securities floated by another bank-run NBFC or a corporate run NBFC. For example, Axis liquid
fund may have an exposure to Aditya Birla Housing Finance and HDB Financial Services floated
commercial paper or debentures. This situation adds to the interdependency among financial
institutions such as banks, AMCs and NBFCs among each other. In case of a corporate-run NBFC, the
same may have an exposure to multiple banks in terms of bank borrowing and multiple AMC
exposure. If a parent bank and its AMC has exposure to such a corporate run NBFC and this NBFC faces
issues. This situation will not only impact the parent bank, but also its AMC, the other banks that have
lent to the NBFC and other bank run AMCs that have exposure to this particular AMC.
For example, Bank “A” has exposure to corporate run NBFC “I”; Bank “A” also has a AMC “M”. This
AMC “M” has also exposure to NBFC “I”. The exposure of Bank “A” and AMC “M” to NBFC “I” account
for the joint exposure. Now this NBFC “I” may also have exposure to other bank “B” which may also
have its AMC “N”. This makes the joint exposure of bank “B” and AMC “N” to NBFC “I” in the system.
In case NBFC “I” witnesses a default in its loans. The Bank “A”, AMC “M”, Bank “B” and AMC “N” may
end up having a joint exposure to NBFC “I”. Although the exposure limits of Bank “A” and Bank “B”
and AMC “M” and “N” may be within the individual RBI limits. On the whole, it may create a systemic
risk for the whole financial system.
This is only one form of interdependency that is explained here. The other form of interdependency
may be created when a bank and its AMC have an exposure to another bank run NBFC. This adds
manifold to the systemic risk of the financial eco-system. For example, Axis Liquid Fund may have an
exposure to ICICI Home Finance. In case ICICI promoted ICICI Home Finance faces NPA, this will not

83
only impact the ICICI Home Finance Promoter, other AMCs that may have an exposure to it, Axis Liquid
Fund that may have an exposure to ICICI Home Finance and the parent bank Axis Bank. Hence, the
interdependency in case of bank-run NBFCs the systemic risk increases slightly more than a corporate
run NBFC. Diagram No. 10 presents how financial interdependency exists between financial
institutions. In this diagram no. 10, Bank A, Bank B, Bank A run NBFC and Bank B run NBFC have an
on-balance sheet loan exposure to Client X. Now, Bank A has a loan exposure to Bank B run NBFC and
Bank A run AMC also has investment exposure to Bank B run NBFC. Similarly, Bank B has a loan
exposure to Bank A run NBFC and Bank B run AMC also has investment exposure to Bank A run NBFC.
In case the client “X” defaults it affects Bank A, Bank A run NBFC, Bank B, Bank B run NBFC, Bank A
run AMC and Bank B run AMC directly. This is indicative of the interconnectedness that exists among
financial institutions. The level of interconnectedness becomes more complex in reality.
Diagram No. 10: Financial Interdependency among financial institutions and banks
Source: Created by authors
Client X
Bank A
Bank A run NBFC Bank A run AMC Indirect Exposure
Direct
Exposure
Indirect Exposure
Dire
ct
Expo
sure
Direct
Exposure
Direct
Exposure
Bank B
Bank B run NBFC Bank B run AMC
84
6. A. Scenarios:
§ Scenario A and B presented on the subsequent pages are a graphical representation of:
§ Transmission of funds between banks and financial institutions to a borrower:
§ Fund flow from:
§ Bank 1 to NBFI
§ Bank 1 mutual fund arm to NBFI
§ Bank 1 , Bank 1 mutual fund arm and NBFI may have an exposure to
a common client
§ Bank 2 and Bank 2 mutual fund arm has exposure to Client
§ Bank 1 sponsored mutual fund arm has exposure to Bank 2
§ Bank 2 sponsored mutual fund arm has exposure to Bank 1
§ “Risk” origination and how it will impact Bank 1 and Bank 2 and their mutual fund arm:
§ Client defaults
§ NBFI is affected – Direct exposure to client
§ Bank 1 and Bank 1 mutual fund arm is affected – Direct exposure
and Indirect exposure (Portfolio investment in NBFI) to client
§ Bank 2 and Bank 2 mutual fund arm is affected – Direct exposure to
client
§ Bank 1 mutual fund arm is also exposed to Bank 2 – Indirect
exposure to client
§ Difference between Scenario A and B:
§ Scenario A: Transmission of funds (without bank guarantee)
§ Scenario B: Transmission of funds (with bank guarantee)

85
Diagram No. 11: Scenario A - Transmission of funds (without bank guarantee)
Source: Created by authors
Non-banking Finance exposure, Bank 1 exposure to a) Borrower default, b) Bank 1 sponsored
Mutual Fund exposure to borrower default, c) other banks floated debt or equity, d) NBFC and e)
Bank 1 mutual fund exposure to NBFC floated debt or equity
• Bank 1 has exposure to Borrower through loans/debenture private placement
• Bank 1 sponsored Mutual fund has exposure to debenture/commercial paper issued by borrower
• Bank 2 has exposure to Borrower through loans/debenture private placement
• Bank 2 sponsored mutual fund has exposure to debenture/commercial paper issued by borrower
Loan/Debenture private placement
Debenture/Certificate of Deposits/Equity
Debenture/Commercial paper Loan/Debenture private placement
Debenture/Commercial paper Loan/Debenture private placement
Debenture/Certificate of Deposits/Equity
Bank 1
Bank 1 sponsored Mutual Fund
Client/Borrower default
Bank 2 Bank 2 sponsored Mutual Fund
NBFI Debenture/Commercial Paper/Equity
86
• Bank 1 sponsored mutual fund arm has exposure to Bank 2 issued debentures/ Certificate of
Deposits/Equity
• Bank 1 has exposure to NBFC that undertakes direct lending to borrower
• Bank 1 sponsored mutual fund has exposure to NBFC that invests in borrower
debentures/commercial paper/equity
Total exposure of Bank 1 to the borrower default = Direct lending exposure to borrower + Bank 1
sponsored Mutual fund exposure + Indirect Exposure through investment in Bank 2 + Investment in
Bank 2 sponsored mutual fund + Indirect exposure of Bank 1 sponsored mutual fund arm to Bank 2 +
Bank 1 direct lending exposure to NBFC which lends to borrower + Bank 1 sponsored mutual fund has
exposure to borrower debentures/commercial paper/equity.

87
Diagram No. 12: Scenario B - Transmission of funds (with bank guarantee)
Source: Created by authors
Non-banking Finance exposure, Bank 1 exposure to a) Borrower default, b) Bank 1 sponsored
Mutual Fund exposure to borrower default, c) other banks floated debt or equity, d) NBFC, e)
Bank 1 mutual fund exposure to NBFC floated debt or equity and f) bank guarantee
• Bank 1 has exposure to Borrower through loans/debenture private placement
• Bank 1 sponsored Mutual fund has exposure to debenture/commercial paper issued by borrower
• Bank 1 exposure to bank guarantees issued on behalf of borrower
• Bank 2 has exposure to Borrower through loans/debenture private placement
• Bank 2 sponsored mutual fund has exposure to debenture/commercial paper issued by borrower
Bank
Gua
rant
ee
Loan/Debenture private placement
Debenture/Certificate of Deposits/Equity
Debenture/Commercial paper Loan/Debenture private placement
Debenture/Commercial paper Loan/Debenture private placement
Debenture/Certificate of Deposits/Equity
Bank 1
Bank 1 sponsored Mutual Fund
Client/Borrower default
Bank 2
Bank 2 sponsored Mutual Fund
NBFI Debenture/Commercial Paper/Equity

88
• Bank 1 sponsored mutual fund arm has exposure to Bank 2 issued debentures/ Certificate of
Deposits/Equity
• Bank 1 has exposure to NBFC that undertakes direct lending to borrower
• Bank 1 sponsored mutual fund has exposure to NBFC that invests in borrower
debentures/commercial paper/equity
Total exposure of Bank 1 to the borrower default = Direct lending exposure to borrower + Bank 1
sponsored Mutual fund exposure + Bank guarantee issued to Bank 2 on behalf of borrower + Indirect
Exposure through investment in Bank 2 + Investment in Bank 2 sponsored mutual fund + Indirect
exposure of Bank 1 sponsored mutual fund arm to Bank 2 + Bank 1 direct lending exposure to NBFC
which lends to borrower + Bank 1 sponsored mutual fund has exposure to borrower
debentures/commercial paper/equity.
This leads to a fundamental question, whether AMCs play the role of liquidity transformation in
addition to the banks and NBFCs in India. The banks and NBFCs undertake the business of direct
lending, whereas AMCs of these banks may be involved in an indirect route of lending through
subscription of NBFC commercial papers and debentures. Although Acharya et.al, (2013) has only
considered NBFCs as shadow banks and has not addressed asset management companies (AMCs)
that might undertake liquidity transformation especially in an open-ended scheme. Here, the
AMC may not function as a pass-through but may indulge in the function of liquidity
transformation where the scheme may tend to hold cash in excess of their redemption
requirements. This may lead to AMCs functioning as shadow banks.

89
6. B. Parent banks’ exposure to its own subsidiary NBFCs: Indian banking system connectedness
with other Financial Institutions
The Indian banking system is interlinked with a majority stake in a number of financial institutions.
These subsidiaries are in the form of other non-banking financial institutions such as housing
finance companies, asset management companies, securities arm, life and general insurance
institutions. As we observe in the Table no. 11 that present financial institutions and their
subsidiaries have cross-holdings in each other. This interlinking creates a possibility of systemic
risk that may not only affect the individual institutions but also the holding institution. Another
issue is that most of these Financial institutions are not listed which does curtail the risk on the
front of the public but does generate a tremendous risk at the front of the investor in the company
at the holding company level. A look at HDFC subsidiaries suggests that out of seven institutions
only three are listed on the stock exchange. Under the ICICI wing, two out of five are listed on the
exchange. With ICICI securities it was recently brought to notice via SEBI that to float the Initial
Public Offering (IPO) it mutual fund arm subscribed under the institutional subscription. SEBI has
ordered ICICI mutual fund to return INR. 2.4 billion invested in ICICI securities IPO101.
101 Economictimes, 03 July 2018, SEBI orders ICICI MF to return INR.2.4 billion invested in I sec IPO, available on the internet at, https://economictimes.indiatimes.com/markets/stocks/news/i-sec-ipo-sebi-asks-icici-pru-mf-to-return-rs-240-cr-of-investors-money-to-schemes/articleshow/64832383.cms, accessed on 13 July 2018
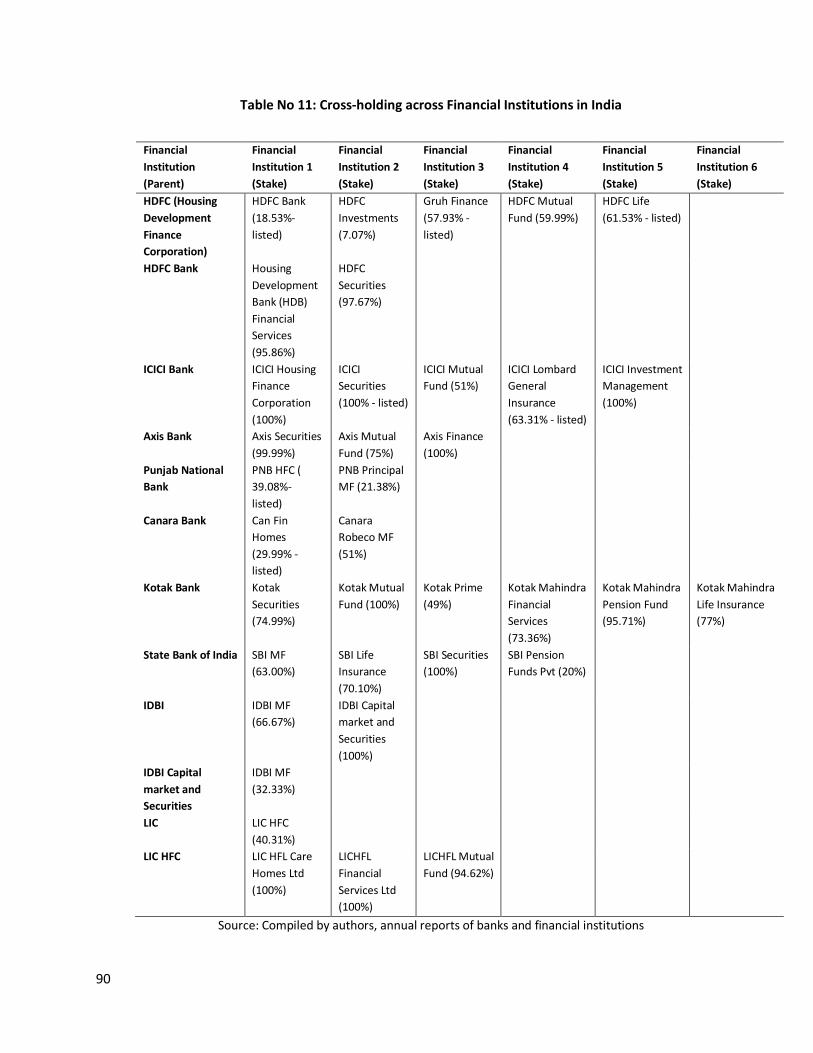
90
Table No 11: Cross-holding across Financial Institutions in India
Financial Institution (Parent)
Financial Institution 1 (Stake)
Financial Institution 2 (Stake)
Financial Institution 3 (Stake)
Financial Institution 4 (Stake)
Financial Institution 5 (Stake)
Financial Institution 6 (Stake)
HDFC (Housing Development Finance Corporation)
HDFC Bank (18.53%- listed)
HDFC Investments (7.07%)
Gruh Finance (57.93% - listed)
HDFC Mutual Fund (59.99%)
HDFC Life (61.53% - listed)
HDFC Bank Housing Development Bank (HDB) Financial Services (95.86%)
HDFC Securities (97.67%)
ICICI Bank ICICI Housing Finance Corporation (100%)
ICICI Securities (100% - listed)
ICICI Mutual Fund (51%)
ICICI Lombard General Insurance (63.31% - listed)
ICICI Investment Management (100%)
Axis Bank Axis Securities (99.99%)
Axis Mutual Fund (75%)
Axis Finance (100%)
Punjab National Bank
PNB HFC ( 39.08%- listed)
PNB Principal MF (21.38%)
Canara Bank Can Fin Homes (29.99% - listed)
Canara Robeco MF (51%)
Kotak Bank Kotak Securities (74.99%)
Kotak Mutual Fund (100%)
Kotak Prime (49%)
Kotak Mahindra Financial Services (73.36%)
Kotak Mahindra Pension Fund (95.71%)
Kotak Mahindra Life Insurance (77%)
State Bank of India SBI MF (63.00%)
SBI Life Insurance (70.10%)
SBI Securities (100%)
SBI Pension Funds Pvt (20%)
IDBI IDBI MF (66.67%)
IDBI Capital market and Securities (100%)
IDBI Capital market and Securities
IDBI MF (32.33%)
LIC LIC HFC (40.31%)
LIC HFC LIC HFL Care Homes Ltd (100%)
LICHFL Financial Services Ltd (100%)
LICHFL Mutual Fund (94.62%)
Source: Compiled by authors, annual reports of banks and financial institutions

91
For Axis, Kotak, SBI and IDBI the subsidiaries are not listed in the financial system. These
institutions have an interdependence amongst each other. Not only does the interdependence
occur at the institution level but also to other institutions as well. These institutions form the
largest share in the banking as well as in the asset management companies and insurance
segment.
Proposition II: Do bank run mutual fund arms undertake liquidity transformation through
indirect exposure of Non-Banking Financial Companies floated instruments?
• To test whether AMCs undertake liquidity transformation
• A positive relation between a AMCs scheme cash holdings and portfolio composition
suggests liquidity transformation. (Sunderam and Cherenko, 2016)
• Liquidity transformation may cause financial stability problems (Goldstein et al
(2015), Hanounaet al (2015), SEC (2015), FSOC (2014), Feroliet al (2014), Chen et al
(2010))
This leads to a fundamental question that does the systemic risk increase due to the joint exposure
of the bank and its AMC to corporate run and bank run NBFCs. As shown in Diagram No.6, 7 and
8 there may be a possibility that the same client may have an exposure to multiple banks and
NBFCs and these banks and NBFCs in turn may have an exposure to their AMCs. This will probably
lead to a manifold increase the systemic risk faced in the financial system. This interdependency
leads us to our final proposition

92
6.C. Results for Proposition II and Hypothesis II:
Proposition II leads us to formulate the Hypothesis II: To determine whether bank sponsored or financial institutions sponsored asset management companies undertake liquidity transformation
Null Hypothesis (Ho): Asset management companies do not undertake liquidity transformation
i) A positive relation does not exist between a AMCs scheme cash holdings and portfolio composition suggests no liquidity transformation. (Sunderam and Cherenko, 2016)
Alternate Hypothesis (Ha): Asset management companies undertake liquidity transformation
ii) A positive relation exists between a AMCs scheme cash holdings and portfolio composition suggests no liquidity transformation. (Sunderam and Cherenko, 2016)
After we fail to reject the alternate hypothesis II we proceed to test the hypothesis III
In this study we attempted to test whether mutual fund arms undertook liquidity transformation
i.e. in debt oriented schemes. These debt schemes include money market mutual funds, liquid
funds, GILT funds and debt schemes. Together these form 52% of the total AuM worth INR.21.26
trillion102 on 31 Dec 2017. Liquid and Money market funds form 13%, Gilt forms 1% and debt
oriented schemes form 38% of the total AuM. Bank sponsored mutual funds form around 50% or
more of the total AuM in the mutual fund industry as on 31 Jan 2018 with ICICI prudential and
HDFC mutual fund leading the market with 13% and 12.9% share followed by State Bank of India
(SBI) Kotak Mahindra mutual fund and Axis mutual fund at 9.2%, 5.3% and 3.3% respectively.
This study covered: a) overall debt oriented schemes and b) liquid fund of ICICI mutual fund. The
reason for considering debt schemes is that these debt schemes subscribe to the NBFC floated
102 Association of Mutual Funds India (AMFI) AUM – Category /Age wise and folio data, available on the internet at, https://www.amfiindia.com/research-information/aum-data/age-wise-folio-data, accessed on 16 Mar 2018.

93
debentures and commercial paper which forms 44% of the total AuM on 31 Dec 2017 thereby
supporting the NBFCs credit requirement.
Diagram No. 13: NBFC exposure to Debt schemes January 2012 – January 2018
This diagram presents the NBFC exposure that debt mutual fund schemes have on an aggregate
level from January 2012 to May 2018. NBFC exposure is calculated as Total amount invested in
NBFC floated instruments divided by total AuM.
Source: Securities Exchange Board of India (SEBI), Deployment of Debt funds reports
In Table No. 7, Page No. 67 we have provided a further break-up of the investments undertaken
across debt schemes in various debt asset categories and the exposure to NBFC floated
commercial paper and debentures over a period of March 2015 to March 2019.
10%
11%
12%
13%
14%
15%
16%
17%
18%
19%
Jan-
12
May
-12
Sep-
12
Jan-
13
May
-13
Sep-
13
Jan-
14
May
-14
Sep-
14
Jan-
15
May
-15
Sep-
15
Jan-
16
May
-16
Sep-
16
Jan-
17
May
-17
Sep-
17
Jan-
18
May
-18
NBFC as a percentage of Debt AuM

94
Under SEBI guidelines the single sector exposure of mutual funds is capped at 30% of the net asset
value (NAV) of a scheme i.e. NBFCs (this includes the housing finance companies)103.
Under the liquid fund and money market mutual fund schemes, the NBFC floated securities form
nearly 30% or more of their total AuMs. Although these are investment grade BBB and typically A
and above rated. The reason for worry is that even top rated securities default. Ratings are
opinions and recent occurrences of default at the hands of Amtek Auto, JSPL and others have left
a mark on these mutual funds as they are exposed to these securities. Although, the example
belongs to corporate floated securities, one can extend this example to NBFCs as well in two
different ways.
A) Scenario A and B from Diagram No. 11 and 12, where a borrower defaults to whom both
banks, NBFCs and the mutual fund arm may have an exposure.
B) The NBFC may default on its securities i.e. commercial paper, debentures and others.
The reason for this stems from the fact that the sectoral deployment of the credit is focused on
industry. In 2017, industry formed 59.6% of the total credit deployed by NBFCs.
103 IndiaInfoline, The single sector exposure limit stipulated by SEBI for mutual funds is 30% of the net asset value of a scheme for NBFCs, available on the internet at, https://www.indiainfoline.com/article/capital-market-mutual-funds-reports/the-single-sector-exposure-limit-stipulated-by-sebi-for-mutual-funds-is-30-of-the-net-asset-value-of-a-scheme-for-nbfcs-116011200589_1.html, accessed on 16 March 2018

95
Diagram No. 14: Sectoral deployment of credit by NBFCs
This diagram presents the retail and industry credit deployment as a percentage of the total credit
deployment of NBFCs. The left y-axis represents the industry percentages and the right y-axis
represents the retail percentages. The x-axis presents the period from 2012 to 2017.
Source: RBI Bulletin October 2017
One observes that the sectoral deployment of the NBFCs like the scheduled commercial banking
sector is tilted towards industry. However, since 2015 there is a sudden increase in the lending to
the retail segment. With finite industry and retail participants, the possibility of both banks and
these NBFCs having an exposure to the same borrower are extremely likely.
For testing whether liquidity transformation is undertaken by AMCs, we first consider the overall
debt schemes portfolio composition. Here we look at the cash holding i.e. Collateralized Lending
and Borrowing Obligations (CBLO) and T Bills and how they are related to the portfolio of
securities held in the mutual fund scheme. Thereafter, we have checked for the second hypothesis
as mentioned below.
57.00%
58.00%
59.00%
60.00%
61.00%
62.00%
63.00%
64.00%
0.00%
5.00%
10.00%
15.00%
20.00%
2012 2013 2014 2015 2016 2017
Retail Industry

96
Ha: A positive relation between portfolio securities and cash holding will suggest liquidity
transformation undertaken
Ho: A negative relation between portfolio securities and cash holding will suggest no liquidity
transformation undertaken
We have identified three propositions and have tested them using the methodology employed in
the methodology section. To examine the propositions there are instances where the observed
variables are not directly available, hence we have used proxy variables to represent the point
that we are examining. Going forward we present the results under each of these three
propositions.
Under the first proposition, we tested whether:
a) Parent bank sponsored AMCs have exposure to a Parent bank – sponsored NBFC
b) Parent bank sponsored AMCs have exposure to other Banks
c) Parent bank sponsored AMCs have exposure to other Bank sponsored NBFC
d) The AMC has exposure to individual banks and NBFCs within RBI limits
Joint exposure of AMC to banks and NBFCs
At the first level, we try to examine if an exposure exists to a particular bank, NBFC or multiple NBFCs. We
observe in Table No. 8 that the parent bank sponsored AMCs has a direct exposure to a particular bank,
NBFC or multiple NBFCs. A glance at the individual bank or NBFC exposure as a percentage of AUM
suggests that these mutual funds have remained in the limits set under RBI guidelines i.e. within 10 – 15%
of the total AUM. On the front of sector level exposure, the AMCs are within limits of 25 – 30% of total
AUM.

97
Since, we have examined and have found evidence that joint exposure exists across these financial
institutions. We proceed to test the second proposition.
Proposition II: Do bank sponsored AMCs undertake liquidity transformation?
• To test whether AMCs undertake liquidity transformation
• A positive relation between a AMCs scheme cash holdings and portfolio composition suggests
liquidity transformation. (Sunderam and Cherenko, 2016)
• Liquidity transformation may cause financial stability problems (Goldstein et. al. (2015), Hanouna
et. al. (2015), SEC (2015), FSOC (2014), Feroli et. al. (2014), Chen et. al. (2010))
We examined whether mutual fund arms undertake liquidity transformation i.e. in debt – oriented
schemes. These debt schemes include money market mutual funds, liquid funds, GILT funds and debt
schemes. Together, they form 52% of the total AUM worth INR. 21.26 trillion104 on December 31, 2017.
Liquid and Money market funds form 13%, Gilt forms 1% and debt – oriented schemes form 38% of the
total AUM. Bank sponsored mutual funds form around 50% or more of the total AUM in the mutual fund
industry as on January 31, 2018 with ICICI prudential and HDFC mutual fund leading the market with 13%
and 12.9% share followed by State Bank of India (SBI) Kotak Mahindra mutual fund and Axis mutual fund
at 9.2%, 5.3% and 3.3% respectively.
This study covers:
a) Overall debt – oriented schemes,
b) Liquid fund of ICICI mutual fund as an example
104 Association of Mutual Funds India (AMFI) AUM – Category /Age wise and folio data, available on the internet at, https://www.amfiindia.com/research-information/AUM-data/age-wise-folio-data, accessed on 16 Mar 2018.

98
The reason for considering debt schemes is that these debt schemes subscribe to the NBFC floated
debentures and commercial paper which forms 44% of the total AUM on December 31, 2017 thereby
supporting the NBFCs credit requirement.
We first consider the overall debt schemes portfolio composition. Here we look at the cash holding i.e.
Collateralized Lending and Borrowing Obligations (CBLO) and T Bills and how they are related to the
portfolio of securities held in the mutual fund scheme.
We have tested for liquidity transformation through a proxy – the proxy being the relationship between
cash holding and portfolio securities. If this relationship is positive it indicates liquidity transformation is
undertaken in the system and vice-versa
Results for Proposition II (Continued)
We have employed a break-point model that employs Bai Perron L+1 Vs L sequentially determined breaks.
The data for the period January 2012 to January 2018 is considered in this study.
Table No. 12: Result for breakpoint regression
Dependent variable CBLO + T Bills
Period 1 Period 2 Period 3
Date Jan 12 – Nov 12 Dec 12 - Mar 17 Apr 17 – Jan 18
C 0.36 0.98*** 0.28
Bank Certificate of Deposit 1.19 -0.94*** -0.09
Bank FD -9.82** -1.15*** -2.51***
Government Securities 0.70 -0.96*** -0.04
NBFC securities -1.91*** -1.21*** 1.18**
Real Estate 1.86** -1.23** 9.10
Others 0.53 -0.81*** -0.57*
PSU Bond debt -1.92*** -1.27*** -2.25**
***, **, * significant at level 1%, 5% and 10% respectively, Created by authors

99
This table is an indication of the relation between the portfolio and the cash holding of the debt mutual
fund schemes. The period is split based on the Bai Perron measure to identify break points. Under this
Table No. 12 data suggests that there exists a positive relation between cash holdings and NBFC securities
and Real estate securities held in the portfolio. For every INR. 1 increase in the NBFC security the scheme
has to hold INR. 1.18 extra. On a similar level, the scheme will hold INR. 9.1 for INR. 1 increase in real
estate holding.
However, this doesn’t account for the debt fund managers maintaining cash balances based on the
previous years’ trend of redemptions or the past few months redemption patterns or their holding cash
till suitable investment opportunities arise or increased returns on the schemes. For the relation between
cash holding (i.e. CBLO) and redemptions in the present year and over the past year refer to Appendix:
Exhibit No. F.
All these factors have to be controlled for an unbiased result of the relation between cash holdings and
portfolio securities.

100
Table No. 13: Result for least square regression with control for redemption (t-1)
Dependent variable CBLO + Treasury Bills
Date Jan 2012 – Jan 2018
C -0.001
Bank Certificate of
Deposit
0.03
Bank FD -0.15
Government Securities 0.37**
NBFC securities 0.29
Real Estate -0.38
Others -0.13
PSU Bond debt 0.79**
R-square 70.6%
Adjusted R 67.3%
Source: Created by authors, ***, **, * significant at level 1%, 5% and 10% respectively
In Table No. 13, we have considered CBLO + Treasury (Cash holdings) as the dependent variable
and the type of security offering as an independent variable. The results for the relation
between suggest that government securities and PSU bonds display a significant positive
relation with the cash holdings and is statistically significant at 5% levels of significance. NBFC
floated securities and cash holdings also suggests a positive relation with each other. However,
the relation is not statistically significant.

101
Table No. 14: Result for breakpoint regression with control for redemption (t-1)
Dependent variable CBLO + T Bills (t)
Period 1 Period 2 Period 3 Period 4
Jan 12 – Jul 13 Aug 13 – Feb 15 Mar 15 – Jun 16 Jul 16 – Jan 18
C 0.00 0.00 0.00 0.00
Bank Certificate of
Deposit
0.03 -0.36** -0.48*** 0.56
Bank FD -2.94*** 0.35 0.63 -3.50
Government Securities -1.24** -0.34 0.02 1.06***
NBFC securities 1.30** 3.2** 0.22 0.04
Real Estate 59.96*** -13.16 9.67*** -0.63
Others 0.001 -0.96*** -0.20 0.11
PSU Bond debt -0.07 1.97 1.09** -0.47***
R-square 90%
Adjusted R 83.6%
Source: Created by authors, ***, **, * significant at level 1%, 5% and 10% respectively
Results presented in Table No. 14 suggest that there exists a positive relation between cash holdings and
NBFC securities across the periods. However, Real estate securities held in the portfolio show a positive
and negative relation with cash holdings intermittently. For every INR. 1 increase in the NBFC security the
scheme has to hold INR. 1.30, 3.2, 0.22 or 0.04 extra. On a similar level, the scheme will hold INR. 59.6
and 9.67 for a INR. 1 increase in real estate holding. Another aspect is the positive relation displayed with
Public Sector Units (PSU) bonds, bank Fixed Deposit and Government securities. This may indicate that
these are not as liquid as they may appear. However, this needs to be further evaluated based on the
credit spreads of PSU bonds and government securities during the periods when the relation between
these turns positive. This may suggest that there may exist pressure on the liquidity of these securities.

102
The reasons behind a loss incurred at an AMC debt scheme may be a) The debt instrument that the
scheme has subscribed to defaults on principal and interest repayment105 b) the interest rate cycle is
unfavourable with respect to the portfolio duration106 c) the debt instrument is highly illiquid and the fund
manager disposes it off at a discount to the purchase price.
Dwelling further on the joint/dual exposure we consider the interdependency between these financial
institutions. As discussed earlier while developing the proposition III, we have developed three scenarios
under which the AMC and parent bank may come under pressure due to client default. In these three
scenarios we consider NBFCs as the client that can default. The reason for choosing an NBFC client is that
NBFCs also undertake liquidity, maturity and credit transformation. Hence, the trigger for a default on the
part of the NBFC will occur only when a large scale NBFC client defaults or multiple clients default. These
scenarios A and B have been developed in Diagram No. 11 and 12.
• Scenario A: Transmission of funds (without bank guarantees)
• Scenario B Transmission of funds (with bank guarantees)
• Scenario C: Transmission of funds (with bank guarantees and stand by letter of credit)
105 In case of a corporate debt security such as a commercial paper and debenture. This scenario is possible. However, when the fund holds more of treasury securities. The default is not highly likely. 106 The interest rate risk is inherent in every debt security and one can control the effect of this risk to a small extent.

103
Diagram No. 15: Scenario C - Transmission of funds (with bank guarantee and stand by letter of credit)
Source: Created by authors
This scenario C is an increment to the scenario B. Here, we add an arrow from Bank 1 to Client. Bank 1
also issues a stand by letter of credit (SBLC) on behalf of the client who issues commercial paper in the
money market to raise working capital or short-term finance. This client may be a corporate house or a
NBFC A SBLC is a lenders guarantee of payment to an interested third party in the event a client defaults
on an agreement.
Bank
G
uara
ntee
Loan/Debenture private placement
Debenture/Certificate of Deposits/Equity
Debenture/Commercial paper Loan/Debenture private placement
Debenture/Commercial paper Loan/Debenture private placement
Debenture/Certificate of Deposits/Equity
Bank 1
Bank 1 sponsored Mutual Fund
Client/Borrower default
Bank 2 Bank 2 sponsored Mutual Fund
NBFC Debenture/Commercial Paper/Equity
Stand By Letter of Credit (Commercial Paper issued by client)
Stand By Letter of Credit (Commercial Paper issued by client)

104
Example, recently Reliance Infrastructures’ commercial paper worth INR 5 billion was to mature during
the period May 2018 to October 2018. This commercial paper is backed by an SBLC issued by ICICI bank –
this SBLC is irrevocable, unconditional and a non-transferable letter of credit107.
This commercial paper is held at mutual fund houses such as Kotak, Franklin and Reliance. Schemes such
as Kotak Money Market schemes, four franklin schemes and Reliance Nippons’ debt schemes have an
exposure of INR 4.6 billion to Reliance Infrastructure108. In case of Reliance Infrastructures’ default on the
commercial paper, ICICI bank will be liable to pay the mutual fund houses an amount of INR 5 billion. The
Reliance Infrastructure issued debentures have already been downgraded to “D” whereas the commercial
paper still carries an “A1+ SO” rating since it is backed by ICICI bank109. Franklin India Corporate
Opportunities Fund INR 398.6 million (Commercial Paper), Franklin Income Opportunities Fund INR. 550.2
million (Commercial Paper), Franklin Indian Low Duration Fund INR. 99.6 million, Franklin India Income
Builder Account INR. 398.99 million, Franklin India Dynamic Accrual Fund INR. 248.4 million as on March
2018110.
These SBLCs form a part of the off-balance sheet exposure and would be invoked only when a client
defaults. This is typically a non – fund based exposure and hence doesn’t feature in the regular risk
mechanism system. This is one of the ways in which a bank can undertake shadow banking activities.
107 Money Life, Will Reliance Infrastructure CP default have a domino effect on ICICI Bank?, available on the internet at, https://www.moneylife.in/article/will-reliance-infrastructure-cp-default-have-a-domino-effect-on-icici-bank/54872.html, accessed on 01 August 2018 108 Business Standard, MFs with exposure to RInfra stare at losses on downgrade of debt paper, 02 August 2018, available on the internet at, https://www.business-standard.com/article/markets/mfs-with-exposure-to-rinfra-stare-at-losses-on-downgrade-of-debt-paper-118080201554_1.html, accessed on 03 August 2018 109 Brickwork Ratings, 01 August 2018, Rating Rationale, available on the internet at, https://www.brickworkratings.com/Admin/PressRelease/Reliance-Infrastructure-NCD-1Aug2018.pdf, accessed on 25 July 2018 110 Franklin Templeton, Half report Portfolio statement disclosure, available on the internet at, https://www.franklintempletonindia.com/downloadsServlet?docid=jg9o5g0w, accessed on 25 July 2018

105
These scenarios lead us to answer our third proposition whether systemic risk increases due to inter
dependence between parent banks and AMCs to clients such as NBFCs (Discussed later in this report).
Recently a IMF ((International Monetary Fund) and World Bank FSAP (Financial Sector Assessment
Program) report111 and news reports112 have been stressing on how debt mutual fund schemes exposure
to NBFCs is posing a systemic risk for the financial system. Most of the scheme exposure lies in the liquid
fund category which subscribe to highly rated commercial paper and debentures of these companies.
However, the credit ratings are just opinions and may not reflect the true financial picture of the NBFCs
in question. The Securities Exchange Board of India (SEBI)113 through its debt funds deployment report in
September 2017 indicates that 3.78% of the total debt AUM exposure (INR 9508.3 billion) is to NBFCs
commercial paper and 7.19% to NBFC floated bonds and debentures.
A typical look at the short-term mutual fund offerings suggest that top 18 money market fund schemes
contribute 74% of the total AuM in that category (See: Table No. 15 on next page). In June 2017, the total
AuM in Money Market Mutual Fund category was INR. 3449.235 billion, of which bank sponsored AMCs
formed 55%. ICICI Prudential contributed 21% AuM, HDFC Mutual Fund 11%, SBI 8% and Axis 5%.
Government run and financial institutions run contributed 45% of the total AuM. UTI – 15.11% followed
by DSP – 3.5% and LIC – 3.2%
111 The Dalal Street Investment Journal, FSAP raises concerns over rising MF exposure to NBFC bonds, 28 Dec 2017, available on the internet at, http://www.dsij.in/DSIJArticleDetail/ArtMID/10163/ArticleID/32/FSAP-raises-concerns-over-rising-MF-exposure-to-NBFC-bonds, accessed on 29 Jan 2018. 112 The Economic Times, Debt MFs gorging on NBFC paper pose systemic risk, 27 Dec 2017, available on the internet at, https://economictimes.indiatimes.com/markets/stocks/news/debt-mfs-gorging-on-nbfc-paper-pose-systemic-risk/articleshow/62262958.cms, accessed on 29 Jan 2018. 113 SEBI Deployment of Debt Funds Monthly Report September 2017, available on the internet at, https://www.sebi.gov.in/statistics/mutual-fund/deployment/2017/debtsep17.html, accessed on 29 Jan 2018.

106
Table No. 15: Top 18 MMFs contribute 74% AuM under MMMF category
Scheme Name Launch AuM
(INR.billion) Market share
ICICI Prudential Liquid Plan 2005 308.47 8.9%
HDFC Liquid Fund 2000 226.02 6.6%
SBI Premier Liquid Fund 2007 215.36 6.2%
UTI Liquid Cash Plan 2003 205.18 5.9%
ICICI Prudential Flexible Income Plan
2002 198.60 5.8%
Axis Liquid Fund 2009 166.08 4.8%
HDFC Floating Rate Income Fund - Short Term
2007 144.43 4.2%
HDFC Cash Management
Fund - Treasury 1999 138.18 4.0%
UTI Treasury Advantage
Fund 2003 127.65 3.7%
DSP BlackRock Liquidity Fund
2005 122.48 3.6%
UTI Money Market Fund 2009 121.37 3.5%
ICICI Prudential Money
Market Fund 2006 117.70 3.4%
LIC MF Liquid Fund 2002 112.31 3.3%
ICICI Prudential Savings
Fund 2005 97.31 2.8%
IDFC Cash Fund 2004 97.19 2.8%
SBI Magnum InstaCash 1999 69.61 2.0%
UTI Floating Rate Fund -
STP 2003 69.12 2.0%
DHFL Pramerica Insta Cash Plus Fund
2007 63.23 1.8%
Source: Created by authors

107
We run a sample for a bank sponsored mutual to evaluate the relationship between cash holdings and
the individual securities based on the largest AuM scheme such as ICICI Prudential liquid scheme.
Table No. 16: ICICI Liquid Fund cash relationship with individual securities
Variable 2008 Jan-
2010 Apr
2010 May-
2012 Apr
2010 May-2013
Sep
2013 Oct -
2015 Mar
2015 Apr-
2016 Oct
C 0.34*** 0.19*** 0.34*** 0.42*** 0.39***
Corporate run
NBFC* RD
-10.17*** -0.68 1.92** 2.39*** -0.08
Corporation*RD 0.01 17.00* -1.96 -3.63 14.4**
FI & Other Bank
run Sec
-1.00** 1.19 -1.79 -0.71 4.26***
FI run NBFC -1.92 0.13 -1.91** -0.69** -1.09***
Other Bank run
NBFC*RD
-2.58 -9.8* -5.18 8.01 -4.67***
Other Banks*RD 0.58* 0.11* -0.25 -1.03*** -0.23
NAVdummy 0.03 -0.10** -0.01 -0.16*** -0.05
Govt & Govt run FI -2.09*** 26.48*** 7.48 -15.11*** -0.95*
Govt run NBFC -2.42** -0.56 0.95 -0.74 -2.14***
Source: Created by authors
We observe in the above Table that the relationship between the cash holding and the corporate offered
debt securities is positive. In addition to this, the FI and other bank offered debt securities also hold a
positive relation with the cash holdings at the mutual fund level. This suggests that these securities are
more illiquid compared to the other securities held in the mutual fund portfolio.

108
However, it would be in-appropriate to conclude that only bank sponsored AMCs display this liquidity
transformation behavior. A look at the recent events where Principal AMC had an exposure to IL&FS debt
securities suggested that cash holdings and the NBFC holdings display a positive relation. However, the
relation and the magnitude of the coefficient depends on the level of illiquid securities held in their
portfolio. The only issue why we are highlighting bank sponsored AMCs is because these AMCs tend to
have an interdependency not only at one level but also at multi-layer level. We also argue that these bank
run AMCs tend to provide funding to the existing borrowers who already have exposure on the parent
bank on and off-balance sheet.
AMCs have been previously examined with respect to commission motivated brokers that steer
consumers towards inappropriate offerings (Anagol et al., 2017 and Sane and Halan, 2017). Anagol et al.
(2017) suggested that commission motivation is more prevalent among private banks where
a) employees suggest products that help them earn higher commission as commission is directly related to sales of financial products
b) the employee appraisal is related to the income generated from sale of financial products for the parent bank.
However, in the process of suggesting financial products (especially mutual funds), the employee may end
up suggesting a product that may earn higher commission for the bank and the bank employee may
overlook the interest of the depositor cum customer. To confirm this we follow the literature thread
where Anagol et al. (2017) suggested that parent banks especially private banks sell inappropriate
products to its customer to generate income for the bank and promote their own offerings. To investigate
the same further, we collected and compared return data for the scheme-wise returns and the benchmark
returns for ICICI, HDFC and Axis all private bank sponsored mutual funds. These three mutual fund arms
contribute 31% to the total Indian mutual fund Assets under Management (AuM as on December 2018).

109
We compared scheme-wise since-launch return performance with similar period benchmark return
performance over 13 quarterly periods between March 2013 and September 2018. In the table below, we
find that more than 50% of the schemes reported at these three bank sponsored mutual fund arms
underperform the benchmark returns under the since launch return categories. Underperformance is
defined in this study as when the scheme returns are less than the benchmark returns. The difference
between scheme returns and benchmark returns are negative.

110
Table No. 17: Percentage of Schemes Underperforming the benchmark from March 2013 to September 2018
This table presents the number of schemes underperforming the benchmark from March 2013 to
September 2018. The compounded annualised yield returns considered are since launch for the scheme
and the benchmark. In October 2017, SEBI had issued an order to mutual fund houses to categorise and
rationalise the mutual fund schemes. Hence, equity schemes were classified into 10 categories, debt into
16 categories, Hybrid into six categories, solution oriented into two and other schemes into two. For more
details visit the SEBI website link: https://www.sebi.gov.in/legal/circulars/oct-2017/categorization-and-
rationalization-of-mutual-fund-schemes_36199.html. For reporting the outperformance or
underperformance, this table does not consider the survivorship bias (for schemes) for this study.
Quarter Axis Bank MF (Since
Launch)
ICICI Bank MF (Since
Launch)
Kotak Bank MF
(Since Launch)
Sep-18 50% 41% 18%
Mar-18 57% 54% 29%
Sep-17 68% 67% 65%
Mar-17 73% 68% 64%
Sep-16 71% 70% 67%
Mar-16 69% 64% 38%
Sep-15 65% 60% 62%
Mar-15 44% 58% 69%
Sep-14 43% 1% 10%
Mar-14 27% 30% 32%
Sep-13 47% 17% 21%
Mar-13 63% 18% NA
No of schemes Reporting returns in September 2018
62.00 279.00 95.00
Quarters Reported
12 12 11
No of Quarters where Returns are below Benchmark
7 7 5
Source: Compiled from Statutory Half yearly financial performance disclosure for mutual funds

111
These underperforming schemes form 40% of the total AuM held at each of these fund arms. A cursory
glance at the annual commission earned at the fund arm, indicates that more than 50% of the total
commission earned is generated by the parent banks in the case of ICICI and Axis. (We haven’t considered
the survivorship bias element in this report as it was not a part of this report and we have considered debt
and equity schemes together.)
70-80% of these underperforming schemes tend to charge higher commission than the average mutual
fund commission and fees charged ~ 1% of the total assets under management. For debt funds, the
commission charged is on the lower side, however, the underperformance still exists at the same level as
equity schemes. We also, checked whether the security in an underperforming mutual fund scheme and
the parent bank had a loan exposure to the same security. For example, ICICI mutual fund and its parent
bank had exposure to three Non-Banking Financial Companies (NBFC). Axis mutual fund and Axis bank
had an exposure to five NBFCs. HDFC mutual fund and HDFC bank had an exposure to three NBFCs. (See
Table No. 18 for Common Exposure of the same NBFC at both mutual fund portfolio and Parent Bank loan
level).

112
Table No. 18: Common Exposure of NBFC at both mutual fund portfolio and Parent Bank loan level
This table displays the exposure of three parent bank sponsored mutual funds to the top ten NBFC
holdings in their debt portfolios. The highlighted figures reported suggest that there exists a dual exposure
to NBFC a) loan exposure at parent bank level on its balance sheet and b) Parent banks’ mutual fund
portfolio exposure. For example, Axis Bank has a loan exposure to Indiabulls Housing Finance and also
subscribes to the commercial paper and debt instruments of Indiabulls through its mutual fund portfolio.
Similarly, other exposures dual exposures of Axis are to HDFC, LIC Housing Finance (LICHFC), Dewan
Housing Finance Limited (DHFL) and Edelweiss Commodities.
Sector Percentage (% of total Debt AUM)
Total Amount (INR Billion)
Percentage (% of total Debt AUM)
Total Amount (INR Billion)
Percentage (% of total Debt AUM)
Total Amount (INR Billion)
Mutual Fund House
ICICI Axis HDFC
HDFC 5.5% 65.22 5.05% 18.49 5.18% 65.68 Power Finance Corporation
2.9% 35.05 5.10% 18.67 4.27% 54.10
Indiabulls Housing Finance
2.6% 30.46 4.83% 17.70 3.18% 40.27
LIC Housing Finance
2.2% 25.64 2.30% 8.43 2.83% 35.91
India Infoline Finance Ltd
1.5% 17.91 NA NA NA NA
Aditya Birla Finance
1.2% 13.77 NA NA 1.78% 22.59
Dewan Housing Finance Ltd
NA NA 4.49% 16.44 NA NA
Edelweiss Commodities
NA NA 2.30% 8.43 NA NA
Mahindra & Mahindra Financial Services
NA NA NA NA 2.21% 28.06
L&T Finance NA NA NA NA 1.72% 21.87 Source: Compiled from Portfolio Monthly Disclosure of Parent Bank sponsored Mutual Fund. The bank
loan is a balance sheet based exposure in the form of working capital loans, secured or unsecured cash-credit, over-draft, secured or unsecured term-loans.

113
A bank employee assists the parent bank in cross-selling114 underperforming mutual fund schemes which
generate higher incentives for the employee and the bank through sale of the product. However, does
the bank employee knowingly assist the parent bank circumvent the bank regulatory capital requirement
with respect to loan exposure to single/ group entities. Bank employees are not directly involved in the
security selection of the mutual fund portfolio. However, commission charged on the scheme is
determined between the mutual fund house and the distributors subject to the regulatory ceilings115.
The parent banks’ of mutual funds contribute the highest portion of the commission generated through
sale and hence become a very important part while deciding the commission structure for the schemes.
Although mutual fund fee income forms a minor part of the total parent bank fee income, but given the
total exposure, the total quantum of fee may not be too small and be a cause of risk. This regulatory
capital requirements circumvention allows the bank to indulge in lending to an entity without risking their
own funds. The parent bank may be signalling to its fund house through this commission structure to
invest in securities that may create common exposure to a particular entity (Corporate/NBFC) both at the
bank level (through loans, investment and off-balance sheet exposures) and through its mutual fund arm
(portfolio securities).
Bank employees can help to circumvent the regulatory norms and the parent bank may be accountable
for the circumvention of the entity exposure regulatory capital requirement. The parent bank in India has
regulatory capital requirements such as they cannot hold a loan exposure (both on Balance Sheet and off-
114 Cross-selling - Invite customers to buy related or complimentary products
115 What are the mutual fund commission regulatory caps? From October 2018, Mutual funds cannot use their profits to pay commissions to distributors and boost sales. Commissions will be paid out of the mutual fund scheme only. Upfront commission for one-time investments banned and for systematic investment plans reduced to 1% . TER for equity schemes to range between 2.25% for INR0-500 crore fund to 1.5% for INR.5,000-10,000 crore fund. For other schemes TER was to range between 2.0% for INR0-500 crore fund to 1.25% for INR.5,000-10,000 crore fund. LiveMint, 08 October 2018, available on the internet at, https://www.livemint.com/Money/xzU7kjz82eyYaVsenYim6J/Opinion--MFs-will-now-be-cheaper-and-less-cheatable.html, accessed on 26 March 2019
114
Balance Sheet) of more than 15% of their capital funds for single entities and 40% for group entities. When
this limit is exhausted what would be the next best option to pursue. The parent bank through its influence
over the mutual fund arm may extend its exposure to a single/group entity through the mutual fund
investments. This may generate an overlap between the parent banks’ loan exposure and its mutual fund
arms portfolio exposure to the same single entity/ group entity.. The parent banks and the mutual fund
arm have a common management and this generates an agent duality issue (Davis et al., 2007) where the
parent banks management may influence the motivations and decisions of fund managers. This situation
creates an interconnectedness between the mutual fund sponsors loan portfolio, investments portfolio
and off-balance sheet exposures which may lead to a systemic risk. The interconnectedness is quite
prevalent in the Indian context which leads to a potentially high systemic risk.
This gives rise to a situation of high systemic risk which leads us to proposition III.
Proposition III: Does consolidated bank systemic risk increase using joint exposure to a particular NBFC
(bank sponsored or corporate sponsored) through direct bank exposure and indirect bank exposure
(through the bank sponsored AMC or through SBLC issued to them for the commercial paper and
debentures issued) to corporate and bank sponsored NBFCs.
• To test whether banks stress testing results will alter significantly when the joint exposure is
considered.
• Should regulators such as RBI actively monitor the joint exposure undertaken by banks’ and their
mutual fund arm to the same corporate and bank run NBFC? At present, the regulators have laid
out norms to curb exposure to NBFCs for banks and mutual funds schemes at an individual level.
However, they have not considered the joint exposure to the same NBFC through both the bank
and its mutual fund arm.

115
Hypothesis III: To determine whether the joint exposure among financial institutions and banks and
liquidity transformation at the asset management company creates a financial instability in the
financial system due to an event.
Null Hypothesis (Ho): Banks and Financial Institutions do not display interdependency
i) Inward and Outward spillover does not exist among Public sector banks and Private sector
banks
ii) Inward and Outward spillover does not exist among banks (Public and Private) and
Housing Finance Companies
iii) Inward and Outward spillover does not exist within Public sector banks
iv) Inward and Outward spillover does not exist within Private sector banks
v) Inward and Outward spillover does not exist within Housing Finance Companies
Alternate Hypothesis (Ha): Banks and Financial Institutions display interdependency
i) Inward and Outward spillover exists among Public sector banks and Private sector banks
ii) Inward and Outward spillover exists among banks (Public and Private) and Housing
Finance Companies
iii) Inward and Outward spillover exists within Public sector banks
iv) Inward and Outward spillover exists within Private sector banks
v) Inward and Outward spillover exists within Housing Finance Companies

116
6.D. Results for Proposition III and Hypothesis III:
For the interconnectedness results, we have considered a sample of top 5 players from each of the three
categories: public sector banks, private sector banks and housing finance firms. We have considered the
spillovers over the last 150 days and considered these fifteen firms as a closed end system.
In terms of the spill-overs, we note that (diagram 3) HFCs have the lowest inward and outward spill-overs
amongst the three categories. This is in-line with our priors given the relatively specialized and
idiosyncratic nature of housing finance companies. On the other hand, public sector and private sector
banks have similar inward and outward spillovers, on an average, as per the latest data points.
Considering the intertemporal nature of these spillovers, we note that 1) the interconnectedness across
sectors peaked out in 2016 indicating that bank specific factors have started playing a much more
important role in explaining the variance of returns. 2) Inward spillovers have historically been similar
between public and private sector banks. However, the relationship broke from 2016-2018 beginning
reflecting the severe asset quality pressures on PSUs. And 3) Spillovers from (as well as to) Housing Finance
companies have increased rather sharply in the last few months (yellow line), with the HFC index now
approaching that of public and private sectors. This is also indicative of the severe pressure on housing
finance companies in the last few weeks, and reflects the building financial stress in the system and the
potential spillovers to the rest of the system.
Panels 3 and 4 of Diagram No. 16 reflect the average inward and outward spillover for our sample firms
(as per the latest data point). Within our selected sample of firms, we can see that the spillovers are the
highest from the largest banks, namely SBI, ICICI, Bank of Baroda and Axis Bank. On the other hand, Gruh

117
finance has the least inward and outward spillovers. The result of the outward spillovers is in line with our
priors and consistent with the size of the respective banks.
Diagram No. 16: Spill over between Private sector and Public sector banks and NBFCs - HFCs
Panel 1: Public sector banks have the highest
inward spill overs, followed by Private sector
banks, however spillovers to HFCs have increased
sharply as well
Panel 2: Public sector banks have the highest
outward spill overs, followed by Private sector
banks to other FIs; however the metric has
converged
Panel 3: Inward Spillovers: SBI, ICICI, BoB, Axis and
PNB are the most connected on this measure
(Average of the last 90 days)
Panel 4: Outward Spillovers: SBI, ICICI, BoB, Axis
and GICHF are the most connected on this
measure (Average of the last 90 days)
Source: Created by authors

118
Looking at the pairwise indicator of outward spill overs in Matrix 1 (See: Matrix 1 on Page 122). There
are a few interesting takeaways, we note that most of the groups have very high spillovers within the
same group of banks. The matrix decomposes the variation of the equity returns for the banks on the y-
axis, and how much of it is explained by banks on the x-axis. Public and private banks do have high spill-
overs into each other, but there is not much spill-over to the housing finance sector. This also indicates
the idiosyncratic nature of the housing finance sector.
While on an average, the interconnectedness of the HFC sector is relatively low, it is important to test
whether interconnectedness exists between the bank and the bank sponsored NBFC. For these purposes,
we highlight two results: a) the latest pairwise interconnectedness between each pair (Matrix 1: indicates
the proportion of variance in returns of a column bank explained by that to a row bank); and 2) analyse
the temporal relationship between HDFC and HDFC bank, and Canara Fin and Canara Bank. As we can see
through the off-diagonal elements of Matrix 1, we do find a strong pairwise relationship between HDFC
Bank and HDFC HFC (dark red at the two ends of the off-diagonals). Furthermore, as we can see through
Diagram No.17, this interconnectedness has strengthened significantly over the last few months. On the
other hand, the trend between Canara Bank and its HFC has followed an opposite trend with a sharp
decline in their pairwise spill-overs. A possible reason for the decline may be attributed to the non-core
asset sale of its eight domestic subsidiaries116 such as Canbank Financial Services Ltd, Canbank Factors Ltd,
Canara Robeco Asset Management Co. Ltd, Canara HSBC Oriental Bank of Commerce Life Insurance Ltd,
Canara Finance Homes etc undertaken by Canara Bank to raise capital for its Basel 3 requirements. Among
these subsidiaries, Canara Robeco AMC is a bank sponsored AMC with Canara Bank holding a 51% majority
stake. The bank had already sold off 13.45% stake in in a non-core asset - Can Finance Homes, the banks’
116 LiveMint, 24 October 2017, Canara Bank to hire investment bankers for sale of non-core assets, available on the internet at, https://www.livemint.com/Industry/lVEekzyYO0lbvoHJhsaBII/Canara-Bank-to-hire-investment-bankers-for-sale-of-noncore.html, accessed on 02 October 2018.

119
Housing Finance Company (HFC) and also expressed plans to sell off a part of the remainder 30% stake. In
March 2017, Canara bank sold off 13.45% stake in Can Finance Homes to Singapore based GIC affiliated
arm - Caladium Investment Pvt Limited for INR. 7.53 billion and brought its stake down to 30%117. In
December 2017, Canara Bank changed its plans to sell stake in its AMC and in March 2018, Canara bank
changed118 its plans to sell 4% of the 30% stake in Canara Finance Homes119 since it did not receive decent
valuations for the sale120. In the above case, the parent bank was intending to sell off its stake in the non-
core assets such as AMC and its Housing Finance Company (HFC) to raise funds to meet the Basel 3 capital
requirement. A possible weakening in the spill-over effect between Canara Bank and its non-core asset –
Canara Finance Homes may be attributed to Canara Banks’ decision to sell-off its AMC and other non-
core asset - Can Finance Homes. The stake sale may have motivated the parent bank to not pursue its
route to finance its HFC through the AMC or through the parent bank. However, the bank may resume its
non-core assets sale to when they receive the right valuations.
117 The Hindu Business Line, Canara Bank sells 13.45% in CanFin Homes to GIC arm, 10 March 2017, available on the internet at, https://www.thehindubusinessline.com/money-and-banking/canara-bank-sells-1345-in-canfin-homes-to-gic-arm/article9579233.ece, accessed on 03 October 2018. 118 LiveMint, 29 December 2017, Canara Bank not to sell stake in AMC business, available on the internet at, https://www.livemint.com/Industry/Fy0YNo72gkO6q5mdvAD2eO/Canara-Bank-not-to-sell-stake-in-AMC-business.html, accessed on 03 October 2018 119 EconomicTimes, 31 March 2018, Canara Bank calls off divestment plan in Can Fin Homes, available on the internet at, https://economictimes.indiatimes.com/markets/stocks/news/canara-bank-calls-off-divestment-plan-in-can-fin-homes/articleshow/63556544.cms, accessed on 03 October 2018. 120 Canara Bank Press Release, 10 January 2018, Monetization of Non-core assets: Stake Sale in M/s Can Fin Homes, available on the internet at, https://canarabank.com/media/6538/monetizationofnoncoreassets.pdf, accessed on 03 October 2018.

120
Matrix No. 1: Spill over between Private sector and Public – sector banks and NBFCs – HFCs
(Percentage terms)
Source: Created by authors
Diagram No. 17: Pairwise spill over between Parent Bank and its NBFC
Source: Created by authors
HDFCB Kotak ICICI Axis Indusind Canara SBI BoB PNB IDBI LICHF Gruh CanaraFin GICHF HDFCHDFCB 7% 1% 0% 0% 8% 0% 0% 0% 0% 3% 2% 1% 2% 15%Kotak 7% 1% 0% 1% 11% 0% 0% 0% 0% 2% 4% 1% 1% 7%ICICI 1% 0% 12% 7% 0% 16% 12% 9% 2% 3% 1% 3% 3% 2%Axis 0% 0% 13% 10% 0% 11% 11% 8% 3% 4% 1% 4% 3% 2%Indusind 0% 1% 10% 14% 1% 7% 6% 4% 2% 4% 2% 4% 1% 3%Canara 7% 9% 1% 1% 1% 1% 0% 0% 0% 5% 4% 3% 5% 10%SBI 0% 0% 15% 9% 4% 0% 14% 12% 2% 4% 1% 5% 5% 2%BoB 0% 0% 13% 11% 4% 0% 16% 12% 3% 3% 0% 3% 4% 1%PNB 0% 0% 10% 8% 3% 0% 14% 12% 4% 4% 0% 7% 6% 1%IDBI 0% 0% 5% 6% 2% 0% 4% 5% 8% 2% 0% 5% 2% 1%LICHF 2% 1% 4% 5% 4% 4% 6% 5% 6% 1% 2% 7% 6% 4%Gruh 2% 3% 2% 2% 3% 5% 3% 0% 1% 0% 2% 6% 7% 6%CanaraFin 1% 0% 4% 4% 4% 2% 7% 4% 8% 3% 6% 4% 14% 5%GICHF 1% 0% 4% 4% 1% 3% 9% 6% 8% 2% 5% 4% 14% 4%HDFC 11% 5% 4% 2% 3% 8% 3% 1% 1% 0% 4% 4% 6% 4%
HFCs
Private Public HFCs
Private
Public

121
Pairwise relationship between Private, Public and HFCs
While outward spill-overs and inward spill-overs at an aggregate level help analyse the
interconnectedness of the respective entities, we are also interested in understanding the extent to which
the concentration risk is increasing. Diagram No. 18 plots the spill overs within the segments. Variance is
increasingly being explained by within the same sector. Another way to put this is that spill overs within
the HFCs / private / public banks are displaying rising concentration risk. That said, there is a sharp shift
in the spillovers within the HFC segment in 2018, implying that there are increasing spillovers to the other
groups. This result is in-line with the trend which we have seen in the previous diagrams. These results
are in line with the Scenario C, where the SBLC is an off-balance sheet exposure of banks to clients and in
case the client defaults on commercial paper. The bank would be liable to pay for the amount due. This is
bound to increase the risk faced at the bank level. Second, the mutual funds might face a temporary
adverse effect on the Net Asset values (NAVs) due to the downgrade of the client issued debentures. The
reliance infrastructure default is an example of this and it will put a dent in ICICI banks pockets to the tune
of INR 5 billion.
Diagram No. 18: Pairwise spill over between Private, Public sector banks and HFCs
Source: Created by authors

122
A look at the NAVs of two of the four Franklin schemes during this period of downgrade indicate that the
NAV value of the scheme didn’t witness a drastic fall as the commercial paper that these schemes were
subscribed to were backed by the respective ICICI bank.
Diagram No. 19: NAV day on day growth of Franklin India Corporate Debt Fund (July 2, 2018 to August
2, 2018) i.e. erstwhile Franklin Corporate Income Builder Fund and Franklin India Credit Risk Fund i.e.
erstwhile Franklin Corporate debt opportunities Fund
Franklin India Corporate Debt Fund
(d-o-d growth)
Franklin India Credit Risk Fund (d-o-d growth)
Source: Created by authors
Another event that occurred in early September was the rating downgrade of IL&FS debt securities. On 8
September 2018, ICRA revised its short-term rating for IL&FS and IFIN commercial paper to ICRA A4 from
ICRA A1+. Subsequently on 17 September 2018, ICRA further downgraded IL&FS Financial Services
commercial paper to “D” from A4. Corporate bonds and long-term loans were downgraded from AA+ to
BB i.e. moderate risk of default.
-0.03%-0.01%0.01%0.03%0.05%0.07%0.09%0.11%0.13%
02-Jul-1
8
09-Jul-1
8
16-Jul-1
8
23-Jul-1
8
30-Jul-1
8
-0.03%
-0.01%
0.01%
0.03%
0.05%
0.07%
0.09%
0.11%
02-Jul-1
8
09-Jul-1
8
16-Jul-1
8
23-Jul-1
8
30-Jul-1
8

123
18 open-ended mutual fund schemes had an exposure to IL&FS debt securities121. Top 8 schemes that had
the highest percentage exposure to IL&FS debt securities are presented in Table No. 19 below.
Table No. 19: Select Open-ended debt funds exposure to IL&FS debt securities
Debt Funds 31 Aug 2018 to 28 Sep
2018 NAV on 28 Sep 2018
Exposure to IL&FS debt
securities as a pecentage
of total AuM
AuM as on 31 Aug 2018
(Billion)
Motilal Oswal Ultra Short
Term Fund -6.14% 13.30 9.87 0.98
Principal Cash
Management Fund -8.24% 1607.28 9.81 10.40
Principal Ultra Short
Term Fund -5.15% 1947.90 8.96 1.19
Invesco India Credit Risk
Fund -2.04% 1409.34 7.73 0.31
DSP Credit Risk Fund -2.55% 29.29 6.47 4.45
BOI AXA Credit Risk Fund -1.63% 13.58 6.13 16.89
Tata Corporate Bond
Fund -2.30% 2367.53 4.60 0.25
Union Liquid Fund -2.92% 1787.80 3.99 0.99
Source: Created by authors
We observe in Table No.19 that owing to the IL&FS rating downgrade the NAV of the schemes that had
exposure to it have decreased in the range of 1.63% to 8.24%. This kind of NAV fluctuation is very
uncommon among these category of debt funds. According to DSP mutual Fund President – Kalpen
Parekh, IL&FS debt securities are near illiquid and mutual fund houses in order to maintain liquidity and
to meet the advance tax requirements of September quarter resorted to selling off the liquid debt
121 EconomicTimes, How the IL&FS Fiasco wiped out an entire years’ gain in liquid funds, available on the internet at, https://economictimes.indiatimes.com/markets/stocks/news/how-the-ilfs-fiasco-wiped-out-an-entire-years-gains-in-liquid-funds/articleshow/66027283.cms, accessed on 02 October 2018.

124
securities at a discount in the market122. To meet investor redemption demands for advance tax
requirement, DSP mutual fund partly sold off their exposure to Dewan Housing Finance Limited (DHFL) at
a discount as IL&FS debt securities were not liquid and saleable. On a separate note, mutual fund houses
resorted to borrowing heavily in the CBLO market to the tune of INR. 1,175 billion in the week ended 28
September 2018, up 275% from 7 September 2018.
Diagram No. 20 displays the daily NAV growth (decline) for a few select schemes over the month of
September 2018 - that had the largest exposure to IL&FS debt securities. We observe that DSP, Invesco,
BOI and Principal witnessed a decline in their NAV when IL&FS received a rating downgrade to “D”. The
second dip occurred around 21st September 2018 when DHFL was rumoured to have liquidity problems.
This rumour was later on dispelled by DHFL and SEBI demanded all mutual fund houses to disclose their
exposure to DHFL as a precautionary measure. During the 21st September week, Principal and Motilal
witnessed the steepest decline in the daily NAVs. Principal Cash Management Fund and Principal Ultra
Short Term Fund NAV dipped 5.89% and 3.51% to INR. 1606.1381 and INR. 1945.6866 respectively as on
24 Sep 2018; on 26 Sep 2018 – Motilal Oswal Ultra Short Term Fund NAV dipped by 4.61% to INR. 13.2896.
122 Nivesh Manthan, Interview with Kalpen Parekh of DSP Mutual Fund on their exposure in IL&FS and Dewan Housing, 01 October 2018, available on the internet at, https://www.youtube.com/watch?v=hGdRFm0vRtM, accessed on 02 October 2018.

125
Diagram No. 20: NAV day on day growth of Select Open-Ended Debt Mutual Funds (August 31, 2018 to
October 2, 2018) [i.e. erstwhile Principal PNB Asset Management now Principal Mutual Fund] that had
exposure to IL&FS debt securities
Principal Cash Management Fund
(d-o-d growth)
Principal Ultra Short Term Fund (d-o-d growth)
DSP Credit Risk Fund (d-o-d growth) Invesco India Credit Risk Fund (d-o-d growth)
BOI AXA Credit Risk Fund (d-o-d growth) Motilal Oswal Ultra Short Term Fund (d-o-d growth)
-7.00%-6.00%-5.00%-4.00%-3.00%-2.00%-1.00%0.00%1.00%2.00%
02-Sep-18
09-Sep-18
16-Sep-18
23-Sep-18
30-Sep-18
-4.00%
-3.00%
-2.00%
-1.00%
0.00%
1.00%
03-S
ep-1
805
-Sep
-18
07-S
ep-1
809
-Sep
-18
11-S
ep-1
813
-Sep
-18
15-S
ep-1
817
-Sep
-18
19-S
ep-1
821
-Sep
-18
23-S
ep-1
825
-Sep
-18
27-S
ep-1
8
-1.2%-1.0%-0.8%-0.6%-0.4%-0.2%0.0%0.2%
03-S
ep-1
805
-Sep
-18
07-S
ep-1
809
-Sep
-18
11-S
ep-1
813
-Sep
-18
15-S
ep-1
817
-Sep
-18
19-S
ep-1
821
-Sep
-18
23-S
ep-1
825
-Sep
-18
27-S
ep-1
829
-Sep
-18
-1.4%-1.2%-1.0%-0.8%-0.6%-0.4%-0.2%0.0%0.2%0.4%
03-S
ep-1
804
-Sep
-18
05-S
ep-1
806
-Sep
-18
07-S
ep-1
810
-Sep
-18
11-S
ep-1
812
-Sep
-18
14-S
ep-1
817
-Sep
-18
18-S
ep-1
819
-Sep
-18
21-S
ep-1
824
-Sep
-18
25-S
ep-1
826
-Sep
-18
27-S
ep-1
828
-Sep
-18

126
Source: Created by authors
Volatility Spill overs
In the analysis till now, we have focused on the variance of the returns to understand the extent to which
there are spill-overs to and from institutions. The same metric is also calculated to measure the volatility
interconnectedness, as shown in Diagram No. 21. We note that while the overall ranking amongst Public
and private groups remain the same, there is an increasing divergence between the volatility
interconnectedness of HFCs with those of the other groups.
Diagram No. 21: Spill over in other segments
Source: Created by authors
-2.00%
-1.50%
-1.00%
-0.50%
0.00%
0.50%
03-S
ep-1
8
05-S
ep-1
8
07-S
ep-1
8
09-S
ep-1
8
11-S
ep-1
8
13-S
ep-1
8
15-S
ep-1
8
17-S
ep-1
8
19-S
ep-1
8
21-S
ep-1
8
23-S
ep-1
8
25-S
ep-1
8
27-S
ep-1
8
-5.00%
-4.00%
-3.00%
-2.00%
-1.00%
0.00%
1.00%
03-S
ep-1
8
05-S
ep-1
8
07-S
ep-1
8
09-S
ep-1
8
11-S
ep-1
8
13-S
ep-1
8
15-S
ep-1
8
17-S
ep-1
8
19-S
ep-1
8
21-S
ep-1
8
23-S
ep-1
8
25-S
ep-1
8
27-S
ep-1
8

127
The system as a whole is relatively safer because of less spill overs, but it might be a challenge for the
investors where the idiosyncratic risks are amplified and less benefits of diversification. Rising relationship
between HDFC / HDFC Bank is also potentially disruptive mostly because of their size – but does not say
much about the systemic-ness. HDFC and HDFC Bank are systematically important institutions and in case
of failure there might be an adverse effect on the whole financial system.
Recently a IMF ((International Monetary Fund) and World Bank FSAP (Financial Sector Assessment
Program) report123 and news reports124 have been stressing on how debt mutual fund schemes exposure
to NBFCs is posing a systemic risk for the financial system. Most of the scheme exposure lies in the liquid
fund category which subscribe to highly rated commercial paper and debentures of these companies.
However, the credit ratings are just opinions and may not reflect the true financial picture of the NBFCs
in question. The Securities Exchange Board of India (SEBI)125 through its debt funds deployment report in
September 2017 indicates that 3.78% of the total debt AUM exposure (INR. 9,508.3 billion) is to NBFCs
commercial paper and 7.19% to NBFC floated bonds and debentures.
123 The Dalal Street Investment Journal, FSAP raises concerns over rising MF exposure to NBFC bonds, 28 Dec 2017, available on the internet at, http://www.dsij.in/DSIJArticleDetail/ArtMID/10163/ArticleID/32/FSAP-raises-concerns-over-rising-MF-exposure-to-NBFC-bonds, accessed on 29 Jan 2018. 124 The Economic Times, Debt MFs gorging on NBFC paper pose systemic risk, 27 Dec 2017, available on the internet at, https://economictimes.indiatimes.com/markets/stocks/news/debt-mfs-gorging-on-nbfc-paper-pose-systemic-risk/articleshow/62262958.cms, accessed on 29 Jan 2018. 125 SEBI Deployment of Debt Funds Monthly Report September 2017, available on the internet at, https://www.sebi.gov.in/statistics/mutual-fund/deployment/2017/debtsep17.html, accessed on 29 Jan 2018.

128
7. Data Sources and Methodology
For hypothesis I, we haven’t employed any tests since it was not an exercise to establish the
significance of the exposure to the parent bank to other financial institutions. The first hypothesis was
set up with the aim to test whether there existed a parent banks exposure to the same entity on its
balance sheet and through its asset management company arm.
For testing hypothesis II, the methodology employed in this study is the General Method of Moments
(GMM) Technique and Least Squares with Bai Perron (1998) tests identified L+1 sequentially
determined break model. These tests preclude the presence of trending regressors. This test is helpful
in the changes present and also it endogenously determines the points of break with no prior
knowledge. More details about the model are available on the Eviews help guide.126
For determining the structural breaks we have used the Breakpoint least squares model where we
have employed the base variable and lag one of the same variable. Using the Eviews software we find
break dates and have used the HAC consistent covariance estimators (Newey-West) with errors
changing over distributions (For more details please refer to the Eviews website127).
This work reports the results regarding the liquidity transformation aspect of the research proposition
using Bai-Perron (1998) tests identified L+1 sequentially determined break model where we find
evidence of liquidity transformation being undertaken by bank run AMCs through their liquid
schemes.
126 Eviews help guide, Estimating Least Squares With Breakpoints in eviews, available on the internet at, http://www.eviews.com/help/helpintro.html#page/content/multibreak-Estimating_Least_Squares_with_Breakpoints_in_EVi.html, accessed on 29 Jun 2018. 127 Eviews website, Robust standard errors, available on the internet at, http://www.eviews.com/help/helpintro.html#page/content/Regress2-Robust_Standard_Errors.html, accessed on 25 July 2018

129
7.a. Bai Perron – Least Squares model
We have employed the Least Squares with Bai Perron tests identified L+1 sequentially determined
break model (Bai & Perron (1998)) to determine the relationship between the mutual funds cash
holdings and its portfolio composition.
We begin by considering the following linear regression with m breaks (m+1) regime.
𝑦" = 𝑥"𝛽 + 𝑧"𝛿* + 𝜇",𝑡 = 𝑇*/0, ……𝑇
for (𝑗 = 1,… .𝑚 + 1, 𝑇6 = 0𝑎𝑛𝑑𝑇;<0 = 𝑇
where,
• 𝑦" − 𝑖𝑠𝑡ℎ𝑒𝑜𝑏𝑠𝑒𝑟𝑣𝑒𝑑𝑑𝑒𝑝𝑒𝑛𝑑𝑒𝑛𝑡𝑣𝑎𝑟𝑖𝑎𝑏𝑙𝑒(𝐶𝑎𝑠ℎℎ𝑜𝑙𝑑𝑖𝑛𝑔𝑠)
• 𝑥" ∈ ℜN𝑎𝑛𝑑𝑧" ∈ ℜO𝑎𝑟𝑒𝑣𝑒𝑐𝑡𝑜𝑟𝑠𝑜𝑓𝑐𝑜𝑣𝑎𝑟𝑖𝑎𝑡𝑒𝑠(Portfolio composition – NBFC, Bank certificate of
deposit, government securities, bank FD, Real estate, Public sector bond debt (PSU) and others)
• Period under consideration (t) = Jan 2012 to Jan 2018
• 𝛽𝑎𝑛𝑑𝛿*𝑎𝑟𝑒𝑡ℎ𝑒𝑐𝑜𝑟𝑟𝑒𝑠𝑝𝑜𝑛𝑑𝑖𝑛𝑔𝑣𝑒𝑐𝑡𝑜𝑟𝑠𝑜𝑓𝑐𝑜 − 𝑒𝑓𝑓𝑖𝑐𝑖𝑒𝑛𝑡𝑠𝑤𝑖𝑡ℎ𝛿S ≠ 𝛿S<0(1 ≤ 𝑖 ≤ 𝑚)
• 𝜇",𝑖𝑠𝑡ℎ𝑒𝑒𝑟𝑟𝑜𝑟𝑡𝑒𝑟𝑚𝑎𝑡𝑡𝑖𝑚𝑒(𝑡)
• The break dates (𝑇0,… . . 𝑇;) are explicitly regarded as unknown
This is a partial structure change model such that 𝛽 does not shift and is effectively estimated over
the entire sample period. The purpose is to estimate the unknown regression co-efficients and the
break dates, that is to say (𝛽, 𝛿0,… . , 𝛿;<0, 𝑇0, … . . , 𝑇;), when T observations on (𝑦", 𝑥"𝑎𝑛𝑑𝑧") are
available.

130
Bai and Perron (1998) estimates were based on the least square principle. For an m – partition
(𝑇0,… . . , 𝑇;) denoted {𝑇*}, the associated least square estimator of 𝛿S is obtained by minimizing the
sum of squared residuals ∑ ∑ [𝑦 − 𝑥"𝛽 + 𝑧"𝛿*][\]"^\]/0
;<0S^0 under the constraint 𝛿S ≠ 𝛿S<0(1 ≤ 𝑖 ≤
𝑚). Let 𝛿_(`𝑇*a) be the resulting estimate. Substituting it in the objective function and denoting the
resulting sum of squared residuals as 𝑆\(𝑇0, …… . , 𝑇;) the estimated break dates (𝑇0c ,… . . , 𝑇;c ) are
such that
(𝑇0c ,… . . , 𝑇;c = arg𝑚𝑖𝑛\g…….\; 𝑆\(𝑇1, … . . 𝑇𝑚)
Where the minimization is taken over all partitions (𝑇0, … . . 𝑇;) such as 𝑇S − 𝑇S/0 ≥ [𝜀𝑇]. The term
𝜀𝑇 is interpreted as the minimal number of observations in each segment. Thus, the breakpoint
estimators are global estimators are global minimizers of the objective function. Finally, the regression
parameter estimates are obtained using the associate least-squares estimates at the estimated m-
partition, {𝑇j}c 𝑖, 𝑒. 𝛿_ = 𝛿_({𝑇*})
In this study we have employed a sequential test of l versus l+1 structural change.
sup𝐹\ o𝑙 +1𝑙p = q𝑆\r𝑇0s , … . , 𝑇tsu − 𝑚𝑖𝑛0vtvt<0𝑖𝑛𝑓w∈∧],y𝑆\r𝑇z0, … , 𝜏, . . 𝑇zS/0,…… . . , … .. . 𝑇ztu| /𝜎�
[
Where,
∧S,�= {𝜏, 𝑇zt/0 + r𝑇zt − 𝑇zt/0u𝜂 ≤ 𝜏 ≤ 𝑇zt + r𝑇zt − 𝑇zt/0u𝜂}
𝑆\(𝑇0, … . , 𝑇S/0, 𝜏, 𝑇S … . . . 𝑇t)

131
is the sum of squared residuals resulting from the least squares estimation from each m-partition
(𝑇0, … . , 𝑇;) and 𝜎�[ is a consistent estimator of 𝜎[ under the null hypothesis. The asymptotic
distributions of these tests are derived in Bai and Perron (1998) and the asymptotic critical values are
tabulated in Bai and Perron (1998, 2003) for ε = 0.05 (M=9), 0.10 (M=8), 0.15(M =5), 0.20(M=3), and
0.25 (M=2).
Such a measure appeals for several reasons:
a. The relationship between the portfolio composition and cash holdings is assumed to change over
the period. A simple least square might be unable to capture this dynamic relationship.
b. The portfolio composition has evolved over a period of time due to the regulations imposed in
the industry. Hence, a simple least square method is unable to justify the relationship.
In the third hypothesis we employed Diebolds’ model to test for interdependency through measuring
interconnectedness using network connectivity.

132
7.b. Diebolds’ model for joint exposure (Network Connectivity):
In the third and final hypothesis, we have attempted to test the interconnectedness among the
financial institutions in particular Private Sector Banks, Public sector Banks and Housings Finance
Companies. It was important to ascertain the interconnectedness in order to analyse the extent to
which financial stress in one sector can spill-over to the other financial institutions and sectors, thus
indicating possible contagion channels. Literature has used three popular techniques to assess the
interconnectedness and stress test various financial stress scenarios. These three tests are a) Sole and
Espinosa-Vega (2010)128, b) Diebold and Yilmaz (2009)129 and c) Simple moving correlations between
asset prices. Sole and Espinosa-Vega (2010) use the various entity level exposures and calculate the
estimated loss to bank capital from credit and funding shocks. A key benefit includes its ability to
incorporate multiple rounds of capital losses (failure of bank X can lead to a failure in bank Y, which
can in turn lead to a capital loss in bank Z), as well as analyse multiple sources of shocks. This
methodology requires bank to bank exposure which is not publicly available and is generally
supervisory information only
Owing to data availability constraint, we proceed to employ the Diebold and Yilmaz (2009)130: model
which involves the process to calculate both return and volatility spill-overs based on vector auto-
regression (VAR) models from Engle et. al. (1988). This has been used extensively in the literature
(Diebold and Yilmaz 2009, 2012) as well as for stress testing analysis (IMF 2018, IMF 2017, FSB 2017).
This requires the daily stock price returns / volatility of the relevant listed financial entities. A key
benefit of this methodology includes its ability to estimate both inward as well as outward spill-overs
enabling us to measure both systemically important entities, as well as the most vulnerable ones. It
128 Juan Sole & Marco A Espinosa-Vega, 2010. "Cross-Border Financial Surveillance; A Network Perspective," IMF Working Papers 10/105, International Monetary Fund. 129 Francis Diebold & Kamil Yilmaz, 2009. " Measuring Financial Asset Return and Volatility Spillovers, with Application to Global Equity Markets” 130 Francis Diebold & Kamil Yilmaz, 2009. " Measuring Financial Asset Return and Volatility Spillovers, with Application to Global Equity Markets”

133
also enables us to measure, understand and analyse the directional spill-overs over various time
intervals and on a relatively higher frequency basis (as compared to bank entity exposures which are
relatively slow moving in nature). We are more interested in understanding the extent of spill-overs,
rather than analysing the origin of the shock.
This vector auto-regressions, with network connectedness measures based on variance
decompositions (Diebold and Yilmaz (2009), Diebold and Yilmaz (2012), and Diebold and Yilmaz
(2014)). First, it makes intuitive sense, answering a key question, which at the most granular pairwise
level is “How much of bank “a” s future uncertainty (at horizon h) is due to shocks arising not with
bank “a”, but rather with bank “b” or NBFI “x”. Second, connectedness measures based on variance
decompositions allow connectedness to differ across horizons, facilitating examination of a variety of
horizons and selection of a preferred horizon if desired. This is important because, for example, 1-day
connectedness may be very different from 10 or 30 – day connectedness. Third, Diebold and Yilmaz
(2014) show that connectedness measures based on variance decompositions are closely linked to
modern network theory, in particular the degree distribution and mean degree, and that they are also
closely linked to recently-proposed measures of systemic risk, such as marginal expected shortfall
(Acharya et. al. (2010)) and CoVaR (Adrian and Brunnermeier (2008)). This methodology is more
evolved than simple moving correlations.
The data has been sourced from the Reserve Bank of India database warehouse for NBFCs, Scheduled
Commercial banks, RBI Bulletin, Financial Stability reports, Micro Finance Institutions Network (MFIN)
publications, NBFC annual and quarterly report, SEBI deployment of debt funds monthly reports, news
articles, Thomson Reuters database, Bloomberg, Association of Mutual Funds in India (AMFI), Asset

134
Management Companies Monthly Portfolio Disclosure, monthly CBLO131 data from Clearing
Corporation of India Limited (CCIL), company shelf prospectus, Ministry of Corporate Affairs (MCA)
index of charge and ACE Mutual Fund Database (Courtesy Indian Institute of Management,
Bangalore). Monthly portfolio data was considered and the relation between cash holdings and the
portfolio composition was studied during the period 2012 till January 2018. In some cases of data
presentation - the data considered is till early May 2018 and March 2019
131 CBLO - Clearing Corporation of India Ltd. (CCIL) and Reserve Bank of India (RBI) operate Collateralized borrowing and lending obligations (CBLOs). This is a money market segment where financial institutions can obtain short-term loans to cover their transactions. Financial institution must provide eligible securities (such as Central Government securities, such as Treasury Bills, with at least six months left to the maturity date ) as collateral to gain access to these funds. More details about CCIL and CBLO are available on the internet at, https://www.ccilindia.com/CBLO/Pages/Introduction.aspx, accessed on 11 August 2018.

135
8. Concluding remarks and recommendations:
We undertook the study of joint exposure, financial interdependency and liquidity transformation
among bank sponsored mutual funds. We found evidence that banks and their bank run mutual funds
have exposure not only to their own NBFCs but also to other private banks and other NBFCs (See:
Table No. 8). Second, the parent banks tend to have an exposure to the same entity both at the bank
balance sheet level and also the AMC level (See: Table No. 18). The results for joint exposure are
presented for the one month in Jan 2018. The three fund houses ICICI, HDFC and Axis have been
considered as an example as they form a major share (nearly 31%) in the mutual fund business.
On the liquidity transformation front, evidence suggests that CBLO i.e. Cash holdings and mutual fund
portfolio display a positive relation with NBFC floated paper (See: Table No. 14) at the overall debt
assets under management. The same positive relation between NBFC floated paper and cash holdings
is witnessed at ICICI Liquid fund even after adjusting for redemptions and NAV.
On the financial interdependency front, we have observed that HDFC and HDFC bank indicate a risk
spillover (See: Diagram No. 17). The spillover among private sector banks has increased. The same has
occurred in public sector banks and NBFCs. This indicates that the concentration risk has increased.
There is an increasing divergence between the volatility interconnectedness of HFCs with those of the
other groups.
With the recent events in the market, the Reserve Bank has undertaken a slew of measures such as
open market operations and a cut in the FALLCR to inject liquidity in the system. The RBI has also
allowed NBFCs with loans of over five year maturities to sell their loan pools or securitise them on
easier terms for the next six months. This has brought down the minimum holding period for loans to

136
be eligible for securitisation to six months from one year132. This guideline will primarily benefit
housing finance companies as their eligible portfolio available for securitisation would now increase.
RBI is taking the following corrective steps:
a) Streamlining the Asset Liability Mismatch guidelines for the NBFCs to ensure that over
dependence on the short-term funding is reduced so that NBFCs don’t have vast asset liability
mismatches.
b) Providing longer securitization windows
Our recommendations:
a) RBI should conduct a Asset Quality Review for NBFCs similar to banks to avoid any
restructuring problems like the banks
b) The securitization window should be closely monitored as NBFCs such as Jana Financial had
witnessed default in its structured obligations around early 2018, indicating stress in the asset
quality of the NBFC. Instead of providing a blanket securitization approach the central bank
should adopt a case to case basis. This will avoid hiding bad loans through window dressing.
c) The central bank should also set up mechanisms to monitor if the NBFC client loan has been
rolled over or multiple loans are given to repay the original loan.
d) The central bank should undertake measures to strengthen the Asset Liability Management
(ALM) guidelines for NBFCs which is already underway.
e) The central bank should set up mechanisms to monitor the dual exposure undertaken by the
parent bank and the AMC to the same entity or NBFC.
132 The Economic Times, 29 November 2018, RBI eases rules to improve cash flows of housing finance companies available on the internet at, //economictimes.indiatimes.com/articleshow/66866968.cms?utm_source=contentofinterest&utm_medium=text&utm_campaign=cppst, accessed on 01 December 2018
137
f) Risks and functions at these NBFCs and AMCs should be supervised similarly to banks in order
to minimize scope for regulatory arbitrage. (The RBI has already instructed the NBFCs to have
a Chief Risk Officer (CRO).
We hope to further extend the work in the following areas in the future:
a. While there is evidence to support the fact that banks and their bank run mutual funds have
exposure not only to their own NBFCs but also to other private banks and other NBFCs; the
analysis and results presented are at a given point in time. We hope to extend the same study to
check for the joint exposure for the three fund houses considered (as they cover the major share
of the market) over a longitudinal period.
b. We will also try to study the top debt schemes such as liquid funds, money market funds, other
debt schemes and their relation with CBLO and NBFC in each of these categories. This will,
hopefully, help us provide evidence where maximum liquidity transformation occurs.
c. Finally, we hope that the study can be extended to establishing a measure to test the
interdependency between the mutual fund arms and the bank. At this stage, the mutual funds
are not listed entities and hence, the Diebold Yilmaz model for return spillover cannot be used.

138
9. About the Research Investigators:
Principal Investigator
Jaslene Bawa received her Ph.D. in Finance and Accounting from Indian Institute of Management
(IIM), Raipur. She has over five years of research experience in equity markets in India. Prior to
joining FLAME University, she was associated for a brief while with Sadhu Vaswani Institute of
Management Studies, Pune. Her areas of expertise are valuation, banking and building models
that capture complex market and banking relationships.
Her primary research involves around Efficient Market Hypothesis, Adaptive Market Hypothesis
and bank credit risk. She has been a reviewer for IIM B Review Journal. Jaslene has presented
papers in international and nation conferences such as 2nd Applied Financial Modeling
Conference and IIT Management Doctoral Colloquium. She has published four papers in referred
journals such as Financial Research Letters, Physica A, Applied Economic Letters and IIM B
Management Review. She is the first FPM student to graduate from IIM Raipur in 2017. (See:
http://www.flame.edu.in/flame-faculty/bawa-jaslene)
Co-investigators
Sankarshan Basu is currently a Professor of Finance at the Indian Institute of Management
Bangalore. His areas of interest in terms of research are in Capital Markets, Derivatives, Financial
Products, Financial Calculus, Applications of Quantitative Techniques to Finance, Insurance,
Reinsurance and Risk Management. He has presented his work at various international
conferences across the globe and has, to his credit, a number of papers in reputed peer reviewed
international journals of repute like Insurance: Mathematics and Economics, European Journal of

139
Operations Research, Journal of Emerging Market Finance, International Journal of Revenue
Management and the Journal of Statistical Planning and Inference. He has served as the President
of the Asia-Pacific Risk and Insurance Association (APRIA) between 2014 – 2015 and is currently
the Secretary of the Indian Finance Association (IFA).
(See: http://www.iimb.ac.in/user/102/sankarshan-basu)
Dr. Asish Saha received his Ph. D. from the University of Calcutta as University Research Scholar.
He did his Master’s in Business Management (MBM) with specialization in Finance and was the
topper of the pioneering batch of students in the MBM program of the University.
He joined the National Institute of Bank Management (NIBM) as Research Associate in 1982 and
rose to the position of Professor, Finance in the year 1994. He was selected as the youngest
Director, NIBM in August 2001 and served in the said position for over ten years. During his tenure,
he transformed the institution as one of the centers of advanced learning in banking and finance
in India. He is the architect of first ever Post Graduate Program in Banking and Finance in India at
NIBM which has become one of the key identities of the institution. He has fostered academic
collaborations of NIBM with the Kellogg School of Management, Chicago, Stanford Graduate
School of Business, USA and The Federal Reserve Bank of New York, USA. The collaborative
Leadership Development for Corporate Excellence Program instituted by him at NIBM with the
Kellogg School of Management has groomed many CEOs and Executive Directors of Indian banks.
Prior to joining FLAME University, he served as the Visiting Professor, Banking and Risk
Management Department, in the AACSB accredited School of Economics, Finance and Banking, in
the Universiti Utara Malaysia for a five-year period from October 2011 to 2016. He is the Chief
Editor of the ERA listed International Journal of Banking and Finance (www.ijbf.uum.edu.my) of
the university. (See: http://www.flame.edu.in/flame-faculty/saha-asish)

140
10. References:
1. Acharya, V., Engle, R., & Richardson, M. (2012). Capital shortfall: A new approach to ranking and
regulating systemic risks. American Economic Review, 102(3), 59-64.
2. Acharya, V. V., Khandwala, H., & Öncü, T. S. (2013). The growth of a shadow banking system in
emerging markets: Evidence from India. Journal of International Money and Finance, 39, 207-230.
3. Acharya, V., Qian, J., & Yang, Z. (2016). In the shadow of banks: Wealth management products
and issuing banks’ risk in China. Work. Pap., NY Univ. Article Locations: Article Location Article
Location Article Location.
4. Acharya, V. V., Pedersen, L. H., Philippon, T., & Richardson, M. (2017). Measuring systemic risk.
The Review of Financial Studies, 30(1), 2-47.
5. Adrian, T., & Shin, H. S. (2010). Financial intermediaries and monetary economics. In Handbook of
monetary economics (Vol. 3, pp. 601-650). Elsevier
6. Adrian, T., & Brunnermeier, M. K. (2016). CoVaR. American Economic Review, 106(7), 1705-41.
7. Anagol, S., Marisetty, V., Sane, R., & Venugopal, B. (2017). On the impact of regulating
commissions: evidence from the Indian mutual funds market. The World Bank Economic Review,
31(1), 241-270.
8. Sane, R., & Halan, M. (2017). Misled and mis-sold: Financial misbehaviour in retail banks?. Journal
of Comparative Economics, 45(3), 429-444.
9. Bai, J., & Perron, P. (1998). Estimating and testing linear models with multiple structural changes.
Econometrica, 47-78.
10. Bai, J., & Perron, P. (2003). Critical values for multiple structural change tests. The Econometrics
Journal, 6(1), 72-78.
11. Bengtsson, E. (2013). Shadow banking and financial stability: European money market funds in
the global financial crisis. Journal of International Money and Finance, 32, 579-594.
12. Billio, M., Getmansky, M., Lo, A. W., & Pelizzon, L. (2012). Econometric measures of
connectedness and systemic risk in the finance and insurance sectors. Journal of financial
economics, 104(3), 535-559.
13. Chen, Q., Goldstein, I., & Jiang, W. (2010). Payoff complementarities and financial fragility:
Evidence from mutual fund outflows. Journal of Financial Economics, 97(2), 239-262.
14. Chernenko, S., & Sunderam, A. (2014). Frictions in shadow banking: Evidence from the lending
behavior of money market mutual funds. The Review of Financial Studies, 27(6), 1717-1750.

141
15. Chernenko, S., & Sunderam, A. (2016). Liquidity transformation in asset management: Evidence
from the cash holdings of mutual funds (No. w22391). National Bureau of Economic Research.
16. De Bandt, O., & Hartmann, P. (2000). Systemic risk: a survey.
17. Diamond, D. W., & Dybvig, P. H. (1983). Bank runs, deposit insurance, and liquidity. Journal of
political economy, 91(3), 401-419.
18. Diebold, F. X., & Yilmaz, K. (2009). Measuring financial asset return and volatility spillovers, with
application to global equity markets. The Economic Journal, 119(534), 158-171.
19. Diebold, F. X., & Yilmaz, K. (2012). Better to give than to receive: Predictive directional
measurement of volatility spillovers. International Journal of Forecasting, 28(1), 57-66.
20. Diebold, F. X., & Yılmaz, K. (2014). On the network topology of variance decompositions:
Measuring the connectedness of financial firms. Journal of Econometrics, 182(1), 119-134.
21. Duygan - Bump, B., Parkinson, P., Rosengren, E., Suarez, G. A., & Willen, P. (2013). How Effective
Were the Federal Reserve Emergency Liquidity Facilities? Evidence from the Asset-Backed
Commercial Paper Money Market Mutual Fund Liquidity Facility. The Journal of Finance, 68(2),
715-737.
22. Engle, R. F., Ito, T., & Lin, W. L. (1988). Meteor showers or heat waves? Heteroskedastic intra-daily
volatility in the foreign exchange market. Econometrica, 1990, vol. 58, issue 3, 525-42
23. Feroli, M., Kashyap, A., Schoenholtz, K., & Shin, H. (2014). Market tantrums and monetary policy.
Paper prepared for the 2014 US Monetary Policy Forum. New York, 28 February. Chicago Booth
Research Paper 14 – 09.
24. Ghosh, S., Gonzalez del Mazo, I., & Ötker-Robe, İ. (2012). Chasing the shadows: How significant is
shadow banking in emerging markets?. World Bank-Economic Premise, (88), 1-7.
25. Goldstein, I. (2017). Comment on “Redemption risk and cash hoarding by asset managers” by
Morris, Shim, and Shin. Journal of Monetary Economics.
26. Hanouna, P., Novak, J., Riley, T., & Stahel, C. (2015). Liquidity and flows of US mutual funds.
Division of Economic and Risk Analysis White Paper, US Securities and Exchange Commission.
27. IDC, 2015, Open-End Fund Liquidity Risk Management Programs, Swing Pricing; Re-opening of
Comment Period for Investment Company Reporting Modernization, available on the internet at,
https://www.ici.org/pdf/16_idc_sec_lrm_comment.pdf, accessed 11 Aug 2018.
28. IMF (International Monetary Fund)., (2004a). Compilation Guide on Financial Soundness
Indicators. Washington, DC: International Monetary Fund. Available at
http://www.imf.org/external/np/sta/fsi/eng/2004/guide/index.htm
142
29. Jiang, H., Li, D., & Wang, A. (2017). Dynamic liquidity management by corporate bond mutual
funds.
30. Morris, S., Shim, I., & Shin, H. S. (2017). Redemption risk and cash hoarding by asset managers.
Journal of Monetary Economics, 89, 71-87.
31. Shek, J., Shim, I., & Shin, H. S. (2017). Investor redemptions and fund manager sales of emerging
market bonds: how are they related? Review of Finance, 22(1), 207-241.
32. Song, Z., Xiong, W., (2018). Risks in China’s Financial System, NBER Working Paper no. 24230, doi:
10.3386/w242301

143
11. Appendix
Exhibit No. A: Correlation between NBFC and Scheduled Commercial bank loan growth
The rolling correlation between NBFC loan growth and scheduled commercial bank loan growth is
presented for the quarter ended March 2013 to September 2017. This rolling correlation is calculated for
the period beginning March 2013 to March 2014. Subsequently, the next quarter is added to the
correlation calculation. June 2014 correlation estimate considers March 2013- June 2014 growth figures.
Diagram 1. A: Rolling correlation between NBFC loan growth and Scheduled Commercial Bank loan
growth
Source: Created by authors
-9%
14%
35%
25%
11%
2%4%
18%20%
22%
17%
-20%
-10%
0%
10%
20%
30%
40%
Mar-14
Jun-14
Sep-14
Dec-14
Mar-15
Jun-15
Sep-15
Dec-15
Mar-16
Jun-16
Sep-16
Dec-16
Mar-17
Jun-17
Sep-17

144
Diagram 1.A presents the rolling correlation between NBFC quarterly loan growth (y-oy) and Bank credit
quarterly growth (y-o-y). The correlation is weak positive across the period March 2014 to Sep 2017. This
indicates that the existing banking sector and the NBFCs serve as complements to each other. However,
there are periods when they tend to serve as substitutes for lending but these periods are short lived.

145
Exhibit No. B: List of Public and Private Sector Banks
Public sector banks Loan (INR Bn) Private sector banks Loan (INR Bn) ALLAHABAD BANK 1508 AXIS BANK LIMITED 3731
ANDHRA BANK 1368 BANDHAN BANK LIMITED 168 *BANK OF BARODA 3833 CATHOLIC SYRIAN BANK LTD 81
BANK OF INDIA 3665 CITY UNION BANK LIMITED 238 BANK OF MAHARASHTRA 955 DCB BANK LIMITED 158
#BHARATIYA MAHILA BANK LTD. 6 FEDERAL BANK LTD 733 CANARA BANK 3420 HDFC BANK LTD. 5546
CENTRAL BANK OF INDIA 1394 ICICI BANK LIMITED 4642 CORPORATION BANK 1404 IDFC BANK LIMITED 494
*DENA BANK 726 INDUSIND BANK LTD 1131 ^IDBI BANK LIMITED 1908 JAMMU & KASHMIR BANK LTD 498
INDIAN BANK 1277 KARNATAKA BANK LTD 370 INDIAN OVERSEAS BANK 1405 KARUR VYSYA BANK LTD 409
ORIENTAL BANK OF COMMERCE 1577 KOTAK MAHINDRA BANK LTD. 1361 PUNJAB AND SIND BANK 583 LAKSHMI VILAS BANK LTD 237 PUNJAB NATIONAL BANK 4195 NAINITAL BANK LTD 32
SYNDICATE BANK 1997 RBL BANK LIMITED 294 UCO BANK 1197 SOUTH INDIAN BANK LTD 464
UNION BANK OF INDIA 2865 TAMILNAD MERCANTILE BANK
LTD 220 UNITED BANK OF INDIA 661 THE DHANALAKSHMI BANK LTD 64
*VIJAYA BANK 945 YES BANK LTD. 1323 State Bank of India 18684 Total Private Sector banks 22196
Small Finance Banks
CAPITAL SMALL FINANCE BANK
LIMITED 14
EQUITAS SMALL FINANCE BANK
LIMITED 57 Total Public Sector banks 55572 Total Small Finance banks 71
Source: Compiled by authors, RBI Statistical Tables Relating to Banks; * Bank of Baroda, Vijaya Bank and Dena Bank
will be merged into one entity; ^Life Insurance Corporation will acquire 51% stake in IDBI Bank; # Bhartiya Mahila
Bank was merged with State Bank of India on 01 April 2017

146
Exhibit No. C: Assets Under Management (AUM)
Public Bank sponsored AUM (INR bn) Private Bank sponsored AUM (INR bn)
Baroda Pioneer Mutual Fund 122.40 Axis Mutual Fund 792.52
BOI AXA Mutual Fund 56.92 HDFC Mutual Fund 3070.82
Canara Robeco Mutual Fund 133.75 ICICI Prudential Mutual Fund 3105.61
IDBI Mutual Fund 105.74 Kotak Mahindra Mutual Fund 1278.30
*PRINCIPAL Mutual Fund 74.18
SBI Mutual Fund 2334.74
Union Mutual Fund 44.33
Total Public bank sponsored
AUM as a percentage of Total
Industry AUM (Jun 2018)
12.25%
Total Private bank sponsored
AUM as a percentage of Total
Industry AUM
35.18%
Source: Compiled by authors, Association of Mutual Fund of India (AMFI) Average AUM, * Principal acquired the
entire 21.38% stake that PNB held in the Principal PNB Assets Management Company (AMC) in August 2018.

147
Exhibit No. D: Parent banks’ exposure to its own subsidiary NBFCs: Indian banking system
connectedness with other Financial Institutions
The Indian banking system is interlinked with a majority stake in a number of financial institutions. These
subsidiaries are in the form of other non-banking financial institutions such as housing finance companies,
asset management companies, securities arm, life and general insurance institutions. As we observe in
the Table no. 1.D that present financial institutions and their subsidiaries have cross-holdings in each
other. This interlinking creates a possibility of systemic risk that may not only affect the individual
institutions but also the holding institution. Another issue is that most of these Financial institutions are
not listed which does curtail the risk on the front of the public but does generate a tremendous risk at the
front of the investor in the company at the holding company level. A look at HDFC subsidiaries suggests
that out of seven institutions only three are listed on the stock exchange. Under the ICICI wing, two out
of five are listed on the exchange. With ICICI securities it was recently brought to notice via SEBI that to
float the Initial Public Offering (IPO) it mutual fund arm subscribed under the institutional subscription.
SEBI has ordered ICICI mutual fund to return INR 2.4 billion invested in the ICICI securities IPO133.
133 Economic Times, 03 July 2018, SEBI orders ICICI MF to return INR 2.4 billion invested in I sec IPO, available on the internet at, https://economictimes.indiatimes.com/markets/stocks/news/i-sec-ipo-sebi-asks-icici-pru-mf-to-return-rs-240-cr-of-investors-money-to-schemes/articleshow/64832383.cms, accessed on 13 July 2018

148
Table No 1.D: Cross-holding across Financial Institutions in India
Financial Institution (Parent)
Financial Institution 1
(Stake)
Financial Institution 2
(Stake)
Financial Institution 3
(Stake)
Financial Institution 4
(Stake)
Financial Institution 5
(Stake)
Financial Institution 6
(Stake) HDFC (Housing Development
Finance Corporation)
HDFC Bank (18.53%- listed)
HDFC Investments
(7.07%)
Gruh Finance (57.93% - listed)
HDFC Mutual Fund (59.99%)
HDFC Life (61.53% - listed)
HDFC Bank Housing Development
Bank (HDB) Financial Services (95.86%)
HDFC Securities (97.67%)
ICICI Bank ICICI Housing Finance
Corporation (100%)
ICICI Securities (100% - listed)
ICICI Mutual Fund (51%)
ICICI Lombard General Insurance (63.31% - listed)
ICICI Investment Management
(100%)
Axis Bank Axis Securities (99.99%)
Axis Mutual Fund (75%)
Axis Finance (100%)
Punjab National Bank PNB HFC ( 39.08%- listed)
PNB Principal MF (21.38%)
Canara Bank Can Fin Homes (29.99% - listed)
Canara Robeco MF (51%)
Kotak Bank Kotak Securities (74.99%)
Kotak Mutual Fund (100%)
Kotak Prime (49%)
Kotak Mahindra Financial Services
(73.36%)
Kotak Mahindra Pension Fund
(95.71%)
Kotak Mahindra Life Insurance
(77%) State Bank of India SBI MF (63.00%) SBI Life
Insurance (70.10%)
SBI Securities (100%)
SBI Pension Funds Pvt (20%)
IDBI IDBI MF (66.67%)
IDBI Capital market and Securities
(100%)
IDBI Capital market and Securities
IDBI MF (32.33%)
LIC LIC HFC (40.31%)
LIC HFC LIC HFL Care Homes Ltd
(100%)
LICHFL Financial Services Ltd
(100%)
LICHFL Mutual Fund (94.62%)
Source: Compiled by authors, annual reports of banks and financial institutions
For Axis, Kotak, SBI and IDBI the subsidiaries are not listed in the financial system. These institutions have
an interdependence amongst each other. Not only does the interdependence occur at the institution level
but also to other institutions as well. These institutions form the largest share in the banking as well as in
the asset management companies and insurance segment.

149
Exhibit No. E: Bank Vs AMC business model
One would argue that banks and mutual funds are fundamentally different in terms of their structure and
investment agenda.
A traditional banks function is to accept deposits (which entails a fixed return in the form of deposit
interest rate) that are guaranteed by deposit insurance to the extent of INR 100,000. The banks lend these
deposits after maintaining suitable cash and Statutory Liquidity Ratio reserves. The risk management of a
bank involves keeping sufficient capital buffers and cash buffers to take care of loss incurred due to loan
default and in case a bank faces a run. The downside for the bank is loan default and depositor run on
banks. The downside for the bank customer is to lose funds in case of a bank goes bankrupt i.e. technically
if a bank customer holds 100,000 he would receive that any amount in excess of that will be foregone.
The lending for a bank is in the form of short-term loans and long-term loans. Other ways a bank earns
income is through cross-selling of insurance, mutual funds and pension products.
For a mutual fund, the function is to serve as a platform to connect both investors and investments. The
downside for a mutual fund is when the debt or equity of a fund cannot be liquidated it impacts the fund
house liquidity system. The investor has the motivation to invest for returns based on his risk appetite.
So, the downside for an investor is that in certain cases the investor can lose the entire amount invested.
Now, the fundamental difference between a mutual fund and a bank is that the bank typically provides
credit, liquidity and maturity transformation where a mix of short-term and long term deposits are
matched with suitable short-term and long-term loans. However, deposits are withdraw able on demand
and hence a bank has to keep a certain reserve aside to meet the withdrawal demands of depositors.
Similar to a bank, mutual funds especially open-ended funds also face withdrawal by investors at any point
in time. To meet these investor withdrawal requirements mutual fund houses have to maintain a certain

150
cash balance in the form of cash and CBLO balances. But cash balance maintenance is not mandated by
any regulatory requirement. Fund managers maintain this cash balance keeping in mind the redemption
requirements faced in the previous months.
Majority of the investments that the mutual fund houses subscribe to in the equity securities market are
highly liquid. But in case of debt mutual funds the investment in debt securities are not as liquid as the
equity securities. Hence, the fund managers indulge in a certain form of liquidity transformation where
they accept investor money to invest in illiquid securities. For debt securities it may be argued that fund
managers shift the portfolio between different instruments bearing in mind the interest rate
cycles. However, the security issuer composition does not tend to change drastically.
It can be argued that investors invest in mutual funds bearing in mind the risk associated with the
investments and a returns target. However, parent banks tend to promote the schemes floated by their
sponsored AMCs. This helps the parent banks in two ways, 1) it provides an easy fund flow from their bank
depositors into the mutual fund offerings of the bank sponsored AMC 2) it helps the bank earn a
commission income from the bank sponsored AMC as these AMCs are majority owned subsidiaries134.
Supposedly, parent banks and AMC fund managers maintain a Chinese wall when conducting a portfolio
selection. However, the recent case of ICICI Prudential where the fund managers subscribed to the ICICI
134 A number of these mutual fund houses are bank sponsored i.e. banks hold a majority stake in these fund houses. Banks also sell their mutual funds (bank sponsored) schemes to investors through the bank branches. Eg: Bank A also sells Bank A sponsored mutual fund schemes to bank depositors through its branches. This implies that banks are promoting their own sponsored mutual fund schemes. Eg: The commission paid by the AMCs to their sponsor banks increased by Rs.3.62 billion or 83% in the FY 2016-17. SBI Mutual Fund paid Rs.1.75 billion to SBI as against Rs.61 crore in FY 2015-16 i.e. a growth of 190%. SBI bank has received gross commission of Rs.1.79 billion in FY 2016-17. This indicates that the bank has received almost 98% of its total commission from its subsidiary fund house. HDFC Mutual Fund, the largest fund house in terms of equity AUM, paid Rs.1.68 billion or 23% of its overall commission paid to its sponsor HDFC Bank. In FY 2015-16, the fund house paid Rs.910 million to HDFC bank. HDFC Bank is the second largest distributor in the country and earned a gross commission of Rs.3.97 billion from all AMCs. It received 42% of its total earnings from HDFC Mutual Fund. IDBI bank has witnessed the highest increase in commission received from its subsidiary fund house. The fund house paid Rs.140 million to its sponsor last fiscal compared to Rs.50 million in FY 2015-16, an increase of 208%. IDBI Bank received a total of Rs.210 million as commission. Surprisingly, Canara Bank received almost 100% of its gross commission (INR 166.5 million) from Canara Robeco Mutual Fund. Cafe Mutual, 29 July 2017, Bank Sponsored fund houses paid INR 8 billion to their sponsor banks, available on the internet at, http://cafemutual.com/news/industry/9314-bank-sponsored-fund-houses-paid-rs800-crore-to-their-sponsor-banks, accessed on 11 Aug 2018

151
Securities Initial Public Offering (IPO) and invested INR 6.4 billion. ICICI Securities is a subsidiary of ICICI
Bank and this IPO was launched to divest 24% stake that ICICI Bank held in the ICICI Securities135. This IPO
would not have been able to achieve subscription in the Qualified Investor Participation (QIP) category in
case ICICI Prudential had not stepped in to subscribe to the shares in the IPO. The share of ICICI Securities
listed and then began trading at a discount to the listed price. This led to a probe through the Securities
Exchange Board of India (SEBI) for misuse of investor money on the part of ICICI Prudential AMC. Citing
this example, one cannot deny that these mutual fund houses uphold the spirit of the Chinese wall
between the parent bank and bank sponsored AMC. This suggests that they indulge in some form of
maturity and liquidity transformation in the system. This inter-dependence between parent banks and
bank sponsored AMCs may lead to generation of systemic risk.
135 Business Standard, 11 July 2018, SEBI launches proceedings against ICICI Prudential MF, to probe officials, available on the internet at, https://www.business-standard.com/article/markets/sebi-launches-proceedings-against-icici-prudential-mf-to-probe-officials-118071001326_1.html, accessed on 11 Aug 2018.

152
Exhibit No. F: Least Square regression with Redemption lagged regressors
Table No. 1.F presents the results of a least squares regression with lagged regressors of the variable
redemption (t) as a percentage of total AUM (t).
Table No. 1.F: results of a least squares regression with lagged regressors - Redemption (t)
Dependent variable CBLO (t)
C 0.04*** C 0.04***
Redemption (t-1) -0.04 ∑ Redemption (t-12) from (t-24) 0.09*
Redemption (t-2) 0.05 ∑ Redemption (t-13) from (t-25) 0.02
Redemption (t-3) 0.11** ∑ Redemption (t-14) from (t-26) -0.06
Redemption (t-4) 0.08* ∑ Redemption (t-15) from (t-27) 0.03
Redemption (t-5) -0.04 ∑ Redemption (t-16) from (t-28) -0.04
Redemption (t-6) -0.03 ∑ Redemption (t-17) from (t-29) -0.06
∑ Redemption (t-18) from (t-30) -0.01
R square 19.3% 21.8%
Adjusted R square 11.1% 12.4%
Source: Created by authors
The table indicates that the CBLO (i.e. representative cash holding) has a positive significant relation with
redemptions (t-3) and (t-4). Hence, this suggests that a fund manager tends to hold more cash when there
are higher cash flows. This is consistent with the understanding that when cash inflows increase in the
debt – oriented schemes the cash holdings increase. The level of cash held is dependent on the previous
cash flows. On the right side of the table in column 3 and 4, we find the relation between the redemptions
for the year i.e. from (t-24) to (t-12) also display a positive significant relation with CBLO.
The average CBLO held in these debt – oriented schemes were 4.41% from the period January 2012 to
January 2018. Of the 72 observations, 28 times the cash holding was above the average held ~ 4.41%. The
cash holdings were increased when there was a redemption outflow was higher either during the month

153
(t) or (t-1) or (t-2). Hence, this suggests that a fund manager undertook to maintain more cash balances
when there were large outflows in the previous months.
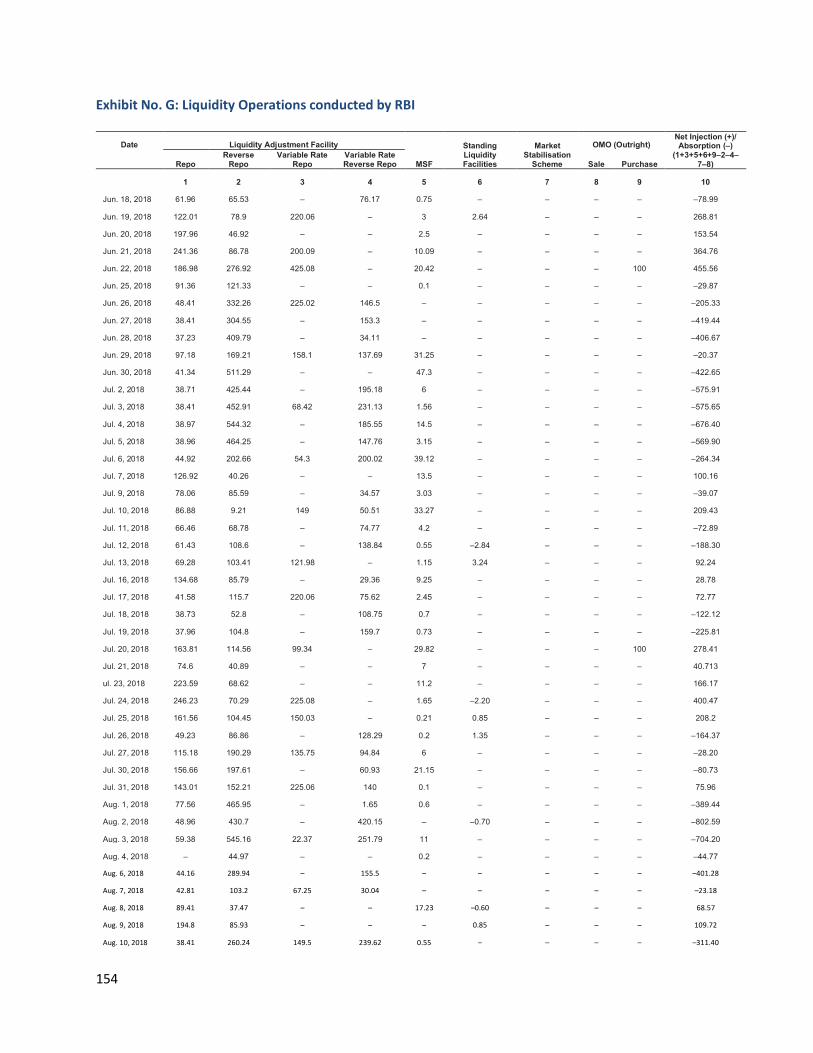
154
Exhibit No. G: Liquidity Operations conducted by RBI
Date Liquidity Adjustment Facility
MSF
Standing Liquidity Facilities
Market Stabilisation
Scheme
OMO (Outright) Net Injection (+)/ Absorption (–)
(1+3+5+6+9–2–4–7–8)
Repo Reverse
Repo Variable Rate
Repo Variable Rate Reverse Repo Sale Purchase
1 2 3 4 5 6 7 8 9 10
Jun. 18, 2018 61.96 65.53 – 76.17 0.75 – – – – –78.99
Jun. 19, 2018 122.01 78.9 220.06 – 3 2.64 – – – 268.81
Jun. 20, 2018 197.96 46.92 – – 2.5 – – – – 153.54
Jun. 21, 2018 241.36 86.78 200.09 – 10.09 – – – – 364.76
Jun. 22, 2018 186.98 276.92 425.08 – 20.42 – – – 100 455.56
Jun. 25, 2018 91.36 121.33 – – 0.1 – – – – –29.87
Jun. 26, 2018 48.41 332.26 225.02 146.5 – – – – – –205.33
Jun. 27, 2018 38.41 304.55 – 153.3 – – – – – –419.44
Jun. 28, 2018 37.23 409.79 – 34.11 – – – – – –406.67
Jun. 29, 2018 97.18 169.21 158.1 137.69 31.25 – – – – –20.37
Jun. 30, 2018 41.34 511.29 – – 47.3 – – – – –422.65
Jul. 2, 2018 38.71 425.44 – 195.18 6 – – – – –575.91
Jul. 3, 2018 38.41 452.91 68.42 231.13 1.56 – – – – –575.65
Jul. 4, 2018 38.97 544.32 – 185.55 14.5 – – – – –676.40
Jul. 5, 2018 38.96 464.25 – 147.76 3.15 – – – – –569.90
Jul. 6, 2018 44.92 202.66 54.3 200.02 39.12 – – – – –264.34
Jul. 7, 2018 126.92 40.26 – – 13.5 – – – – 100.16
Jul. 9, 2018 78.06 85.59 – 34.57 3.03 – – – – –39.07
Jul. 10, 2018 86.88 9.21 149 50.51 33.27 – – – – 209.43
Jul. 11, 2018 66.46 68.78 – 74.77 4.2 – – – – –72.89
Jul. 12, 2018 61.43 108.6 – 138.84 0.55 –2.84 – – – –188.30
Jul. 13, 2018 69.28 103.41 121.98 – 1.15 3.24 – – – 92.24
Jul. 16, 2018 134.68 85.79 – 29.36 9.25 – – – – 28.78
Jul. 17, 2018 41.58 115.7 220.06 75.62 2.45 – – – – 72.77
Jul. 18, 2018 38.73 52.8 – 108.75 0.7 – – – – –122.12
Jul. 19, 2018 37.96 104.8 – 159.7 0.73 – – – – –225.81
Jul. 20, 2018 163.81 114.56 99.34 – 29.82 – – – 100 278.41
Jul. 21, 2018 74.6 40.89 – – 7 – – – – 40.713
ul. 23, 2018 223.59 68.62 – – 11.2 – – – – 166.17
Jul. 24, 2018 246.23 70.29 225.08 – 1.65 –2.20 – – – 400.47
Jul. 25, 2018 161.56 104.45 150.03 – 0.21 0.85 – – – 208.2
Jul. 26, 2018 49.23 86.86 – 128.29 0.2 1.35 – – – –164.37
Jul. 27, 2018 115.18 190.29 135.75 94.84 6 – – – – –28.20
Jul. 30, 2018 156.66 197.61 – 60.93 21.15 – – – – –80.73
Jul. 31, 2018 143.01 152.21 225.06 140 0.1 – – – – 75.96
Aug. 1, 2018 77.56 465.95 – 1.65 0.6 – – – – –389.44
Aug. 2, 2018 48.96 430.7 – 420.15 – –0.70 – – – –802.59
Aug. 3, 2018 59.38 545.16 22.37 251.79 11 – – – – –704.20
Aug. 4, 2018 – 44.97 – – 0.2 – – – – –44.77
Aug. 6, 2018 44.16 289.94 – 155.5 – – – – – –401.28
Aug. 7, 2018 42.81 103.2 67.25 30.04 – – – – – –23.18
Aug. 8, 2018 89.41 37.47 – – 17.23 –0.60 – – – 68.57
Aug. 9, 2018 194.8 85.93 – – – 0.85 – – – 109.72
Aug. 10, 2018 38.41 260.24 149.5 239.62 0.55 – – – – –311.40

155
Aug. 13, 2018 35.46 102.81 – 193.89 14.6 – – – – –246.64
Aug. 14, 2018 125.5 115.75 174.75 21.85 – – – – – 162.65
Aug. 16, 2018 52.21 313.8 215.67 87.68 1.85 – – – – –131.75
Aug. 18, 2018 – – – – – – – – – –
Aug. 20, 2018 39.21 85.85 – 154.92 28.7 – – – – –172.86
Aug. 21, 2018 112.26 85.16 129.39 53.49 8.02 –1.70 – – – 109.32
Aug. 23, 2018 156.56 156.19 – 17.5 1.7 –4.87 – – – –20.30
Aug. 24, 2018 76.49 296.34 197.67 – 0.3 6.57 – – – –15.31
Aug. 27, 2018 39.48 225.94 – 155.73 2.02 –1.48 – – – –341.65
Aug. 28, 2018 51.51 209.42 117.75 69.5 14.3 1.48 – – – –93.88
Aug. 29, 2018 36.66 227.9 – 84.22 2 – – – – –273.46
Aug. 30, 2018 35.16 287.77 – 67.06 – –1.91 – – – –321.58
Aug. 31, 2018 53.01 501.07 155.5 47.05 1.25 1.91 – – – –336.45
Sep. 1, 2018 29.24 54.89 – – 0.01 – – – – –25.64
Sep. 3, 2018 39.21 411.59 40.92 274.24 11 –4.15 – – – –598.85
Sep. 4, 2018 34.71 314.92 – 151.45 – –3.24 – – – –434.90
Sep. 5, 2018 35.91 272.96 – 177.23 0.3 – – – – –413.98
Sep. 6, 2018 38.46 312.69 – 133.09 – –2.64 – – – –409.96
Sep. 7, 2018 39.56 132 51.24 107.85 1.2 – – – – –147.85
Sep. 10, 2018 246.84 76.59 – – 61.1 – – – – 231.35
Sep. 11, 2018 155.79 293 475.04 – 1.01 2.42 – – – 341.26
Sep. 12, 2018 36.96 122.55 – 275.09 0.84 – – – – –359.84
Sep. 13, 2018 – 216.12 – – 9.6 – – – – –206.52
Sep. 14, 2018 39.56 593.2 235.03 – 3 2.18 – – 0.1 –313.33
Sep. 17, 2018 202.56 99.3 300.04 – 26 – – – – 429.3
Sep. 18, 2018 86.6 56.26 230.01 – 1.5 – – – – 261.85
Sep. 19, 2018 49.95 46.71 – – 3.4 – – – – 6.64
Sep. 20, 2018 – 49.42 – – 37.15 – – – – –12.27
Sep. 21, 2018 40.06 151.68 230.07 – 3 – – – 100 221.45
Sep. 24, 2018 106.51 297.15 158 – 0.01 –1.20 – – – –33.83
Sep. 25, 2018 39.36 785.95 480.05 – 2.35 1.2 – – – –262.99
Sep. 26, 2018 37.46 1,205.15 – – – – – – – –1,167.69
Sep. 27, 2018 39.21 984.36 – 481.05 0.81 –0.75 – – – –1,426.14
Sep. 28, 2018 47.41 949.01 97.77 – 42 1.3 – – 100 –660.53
Sep. 29, 2018 41.26 453.35 – – 70.9 – – – – –341.19
Oct. 1, 2018 37.93 638.73 230.02 747.9 16.4 – – – – –1,102.28
Oct. 3, 2018 41.16 687.25 – 678.48 – – – – – –1,324.57
Oct. 4, 2018 34.01 910.71 – 62.26 – – – – – –938.96
Oct. 5, 2018 36.46 387.68 230.04 1000.06 0.5 –2.42 – – – –1,123.16
Oct. 6, 2018 61.95 165.08 – – 7 – – – – –96.13
Oct. 8, 2018 31.16 364.25 – 885.26 0.04 1.7 – – – –1,216.61
Oct. 9, 2018 29.28 223.07 134 171.35 0.01 – – – – –231.13
Oct. 10, 2018 37.98 80.28 – 84.43 4.57 –0.21 – – – –122.37
Oct. 11, 2018 39.09 155.59 – – 3.5 – – – – –113.00
Oct. 12, 2018 71.28 389.12 230.62 76.44 12.15 – – – 120 –31.51
Oct. 15, 2018 197.22 112.36 – – 60.35 – – – – 145.21
Oct. 16, 2018 70.47 114.36 535 – 32.4 –1.80 – – – 521.71
Oct. 17, 2018 167.08 128.29 – – – 2.7 – – – 41.49
Oct. 18, 2018 – 103.75 – – 1.9 – – – – –101.85

156
Oct. 19, 2018 39.94 156.9 373.42 – – 1.15 – – 120 377.61
Oct. 20, 2018 1.06 58.29 – – 2.96 – – – – –54.27
Oct. 22, 2018 187.68 89.53 – – 0.3 – – – – 98.45
Oct. 23, 2018 65.46 155.6 235.02 – – – – – – 144.88
Oct. 24, 2018 38.96 99.2 – – – 0.2 – – – –60.04
Oct. 25, 2018 192.01 369.27 – – 1 – – – – –176.26
Oct. 26, 2018 124.46 467.59 235.04 – – – – – 120 11.91
Oct. 29, 2018 57.46 138.59 – – 0.04 – – – – –81.09
Oct. 30, 2018 38.76 139.18 235 – – – – – – 134.58
Oct. 31, 2018 39.76 291.42 – – 4.05 – – – – –247.61
Nov. 1, 2018 38.71 286.16 – 250.04 1.03 – – – – –496.46
Nov. 2, 2018 38.46 151.82 235.02 300.1 0.15 –0.75 – – 100.02 –79.02
Nov. 3, 2018 3 297.8 – – – – – – – –294.80
Nov. 5, 2018 41.73 258.42 – 506.67 8.06 1.63 – – – –713.67
Nov. 6, 2018 132 205.79 230.03 – – – – – – 156.24
Nov. 7, 2018 – 20.75 – – – – – – – –20.75
Nov. 8, 2018 – 154.78 – – 4.75 – – – – –150.03
Nov. 9, 2018 157.43 227.07 235.04 – 12.61 – – – 100 278.01
Nov. 12, 2018 63.43 138.39 – – 7.45 – – – – –67.51
Nov. 13, 2018 38.56 336.74 635.05 – – – – – – 336.87
Nov. 14, 2018 37.56 282.81 – – 0.2 – – – – –245.05
Nov. 15, 2018 37.46 504.41 – – 0.3 – – – – –466.65
Nov. 16, 2018 38.61 304.4 235 400.07 – – – – 120 –310.86
Nov. 17, 2018 21.23 165.65 – – – – – – – –144.42
Nov. 19, 2018 38.61 293.13 – 250.07 0.26 –3.11 – – – –507.44
Nov. 20, 2018 74.11 136.21 230.01 – 10.6 –0.07 – – – 178.44
Nov. 21, 2018 – 121.7 – – 17 – – – – –104.70
Nov. 22, 2018 141.58 241.59 235.01 – – 3.18 – – – 138.18
Nov. 23, 2018 – 288.75 – – 7.53 – – – – –281.22 Source: Created by authors