macphee, lauren m. (2009) an investigation of the ... · an investigation of the identification of...
TRANSCRIPT

Glasgow Theses Service http://theses.gla.ac.uk/
Macphee, Lauren M. (2009) An investigation of the identification of subjective and objective daytime cognitive failures in people with psychophysiological insomnia and good sleeper controls. D Clin Psy thesis. http://theses.gla.ac.uk/1658/ Copyright and moral rights for this thesis are retained by the author A copy can be downloaded for personal non-commercial research or study, without prior permission or charge This thesis cannot be reproduced or quoted extensively from without first obtaining permission in writing from the Author The content must not be changed in any way or sold commercially in any format or medium without the formal permission of the Author When referring to this work, full bibliographic details including the author, title, awarding institution and date of the thesis must be given

An Investigation Of The Identification Of Subjective And Objective
Daytime Cognitive Failures In People With Psychophysiological
Insomnia And Good Sleeper Controls.
and
Clinical Research Portfolio
VOLUME I
(Volume II bound separately)
Lauren Margaret Macphee
Submitted in part fulfillment of the requirements for the
Degree of Doctorate in Clinical Psychology

ii
Faculty of Medicine
Declaration of Originality Form This form must be completed and signed and submitted with all assignments. Please complete the information below (using BLOCK CAPITALS). Name LAUREN M. MACPHEE........................................................................................... Student Number 9904524 ..................................................................................................... Course Name DOCTORATE IN CLINICAL PSYCHOLOGY ............................................ Assignment Number/Name CLINICAL RESEARCH PORTFOLIO.....................................
An extract from the University’s Statement on Plagiarism is provided overleaf. Please read carefully THEN read and sign the declaration below.
I confirm that this assignment is my own work and that I have: Read and understood the guidance on plagiarism in the Undergraduate Handbook, including the University of Glasgow Statement on Plagiarism
Clearly referenced, in both the text and the bibliography or references, all sources used in the work
Fully referenced (including page numbers) and used inverted commas for all text quoted from books, journals, web etc. (Please check the section on referencing in the ‘Guide to Writing Essays & Reports’ appendix of the Graduate School Research Training Programme handbook.)
Provided the sources for all tables, figures, data etc. that are not my own work Not made use of the work of any other student(s) past or present without acknowledgement. This includes any of my own work, that has been previously, or concurrently, submitted for assessment, either at this or any other educational institution, including school (see overleaf at 31.2)
Not sought or used the services of any professional agencies to produce this work
In addition, I understand that any false claim in respect of this work will result in disciplinary action in accordance with University regulations
DECLARATION: I am aware of and understand the University’s policy on plagiarism and I certify that this assignment is my own work, except where indicated by referencing, and that I have followed the good academic practices noted above Signed .....................................................................................................................................

iii
ACKNOWLEDGEMENTS
Firstly I’d like to thank Professor Colin Espie. Your expertise, enthusiasm and charisma
have been a blessing to me over the last three (actually 8!!) years. Thank you for all your
guidance and patience in helping me develop into the researcher and clinician I am
today.
Secondly, thank you to all at the University of Glasgow Sleep Centre. I definitely know I
have made life long friends. We are all hilarious!!!
I’d also like to thank my classmates for making training so much more fun!
Thank you to all of my clinical and academic supervisors over the last three years for
guiding me through my journey from incompetence to competence. Also, thank you to
my parents, who allowed me to take over my old bedroom at home in order to get this
thesis written (thank you mum for looking after me and feeding me chocolate). Thank
you to my sister Kirsten, her husband Colin, and my best friend Fiona, just because.
And thank you to Joel. You brought meaning back to my life, and I love you beyond
words. This thesis is as much yours as it is mine. Let life truly begin.
for J.A.R.

iv
Volume 1
Table of Contents
Declaration of Originality………………………………………………………………..ii
Acknowledgements……………………………………………………………………...iii
Table of Contents………………………………………………………………………...iv
List of Tables…………………………………………………………………………….vi
List of Figures……………………………………………………………………………vi
Chapter One: Systematic Review
A systematic review of attention bias effects in Primary insomnia, with a comparative
meta-analysis of attention bias effects in Primary insomnia versus Generalised
Anxiety Disorder. ……………………………………………………………………….1
Abstract…………………………………………………………………………………..2
Introduction………………………………………………………………………………3
Method.…………………………………………………………………………………..9
Attention Bias and PI …………………………………………………………………...15
Attention Bias and GAD………………………………………………………………...26
Comparison Between PI and GAD Studies……………………………………………..28
Overall Conclusions……………………………………………………………………..33
References……………………………………………………………………………….37
Tables……………………………………………………………………………………44
Chapter Two: Major Research Proposal
An investigation of the existence of subjective and objective daytime cognitive failures
in people with Psychophysiological Insomnia and Good Sleeper controls. ………….48
Abstract………………………………………………………………………………….49
Introduction……………………………………………………………………………...50
Aims and Hypotheses…………………………………………………………………...61
Method.…………………………………………………………………………………62
Results…………………………………………………………………………………..73

v
Volume 1
Table of Contents (Cont.)
Discussion……………………………………………………………………………….79
References……………………………………………………………………………….90
Tables and Figures………………………………………………………………………99
Chapter Three: Advanced Clinical Practice I Reflective Critical Account
A reflective account highlighting the transition within training towards a consultancy
model. ……...........……………………………………………………………………104
Abstract………………………………………………………………………………..105
Chapter Four: Advanced Clinical Practice II Reflective Critical Account
A reflective account highlighting the anxieties experienced when engaging in the
training of other professionals in psychological skills, knowledge and practice.…..106
Abstract………………………………………………………………………………..107
Appendices……………………………………………………………………………108
Systematic Review
Appendix 1.1…………………………………………………………….See appendix 2.1
Major Research Project Paper
Appendix 2.1: Author guidelines for submission to Behaviour Research and
Therapy...........................................................................................................................109
Appendix 2.2: UGSC Telephone Screening Interview………………………………...114
Appendix 2.3: Sleep Diary…………………………………………………………….117
Appendix 2.4: Ethical Approval Letter………………………………………………..118
Appendix 2.5: ANCOVA……………………………………………………………...119
MRP proposal
Appendix 3.1: Proposal………………………………………………………………..121
Appendix 3.2: Participant Information Sheet………………………………………….130

vi
LIST OF TABLES
Chapter One: Systematic review
Table 1: Individual criterion scores and total quality-rating scores (QRS) for each
individual paper................................................................................................................44
Table 2: Methodological details, QRS, attention bias reported and calculated effect
size (PI vs. GS) for PI studies…………………………………………………………...45
Table 3: Methodological details, QRS, attention bias reported and calculated effect
size (GAD vs. Controls) for GAD studies………………………………........................46
Table 4: Comparison of mean values for PI and GAD………………………………….47
Chapter Two: Major Research Project
Table 1: Overview of measures included in the current study………………………….99
Table 2: Mean and standard deviation demographic data for PI and GS……………...100
Table 3: Mean, Standard Deviation and significance screening and clinical
measure scores for PI and GS………………………………………………………….101
Table 4: Mean, standard deviation and significance scores for each experimental
measure………………………………………………………………………………...102
LIST OF FIGURES
Chapter Two
Figure 1: The Switching Attention Task Complex Version (SATcomplex)……………103
1
CHAPTER ONE: SYSTEMATIC REVIEW
A Comparative Meta-Analysis of Attention Bias Effects in Primary Insomnia
Versus Generalised Anxiety Disorder.
Authors: Lauren M. Macphee1, Colin A. Espie1*
* Corresponding Author
Affiliation: 1Section of Psychological Medicine Division of Community Based Sciences University of Glasgow Gartnavel Hospital 1055 Great Western Road GLASGOW G12 0XH
E-mail: [email protected]
Prepared in accordance with submission guidelines for Behaviour, Research and
Therapy (See Appendix 2.1)

2
Abstract
Cognitive models of primary insomnia (PI) suggest attention bias as a maintaining factor
of the disorder and within the last ten years experimental cognitive psychology
methodologies have been applied to test the hypothesis that attention bias to sleep-
related stimuli is exhibited by individuals with PI. This article reviews, systematically,
studies of attention bias in PI, with the aim of providing conclusions relating to 1) the
stability of the attention bias phenomenon in individuals with PI and 2) the most
effective methodologies utilized when assessing for attention bias in PI groups. In
addition, similarities in the meta-cognitive architecture, e.g. worry, rumination and
negative appraisal of body sensations between PI and GAD, another psychopathological
condition, is discussed and subsequently comparisons between the attention bias data of
these two groups is reported. Following electronic database searching and hand
searching of relevant journal titles, thirteen articles were reviewed (seven PI, six GAD).
Generally, the quality of the articles is high, as denoted by the Quality Rating Score
(QRS). The stability of the attention bias effect within PI populations was relatively
high, with an effect size average of d = 0.585. Pictorial stimuli differentiated large effect
sizes from moderate/small within the PI studies. Attention bias effects within the PI
studies appear largely comparable to those of GAD, however effect sizes within the PI
studies were larger. The stability of the phenomenon across both populations is similar,
however, GAD studies had significantly more data relating to subliminal attention.
Future research in PI should aim to track longitudinally, with clinical populations,
supraliminal and subliminal attention bias.

3
INTRODUCTION
Insomnia is likely to be the most commonly reported health complaint in general
practice after pain, with up to 33% of the general population reporting sleep problems at
any given time (Ohayon, 2002). Primary Insomnia (PI) is defined as difficulty initiating
or maintaining sleep or non-restorative sleep, associated with significant distress or
daytime impairment and not due to other medical, psychiatric or sleep disorders (DSM-
IV; APA, 1994), and affects approximately 3% of the population in industrialised
countries (Ohayon, 2002). Insomnia can be acute or chronic, the differentiation being the
period of time the individual has persistently experienced the above symptoms. The
available nomenclatures purport that insomnia experienced for 6 months (ICSD2) or 1
month (DSM-IV-TR) be classified as chronic PI. More specifically, however, both
recognise that there is a cognitive basis to the development and maintenance of the
disorder (ICSD2; American Academy of Sleep Medicine, 2005, DSM-IV-TR; American
Psychiatric Association, 2000).
Cognitive Models of Insomnia
The attention-intention-effort pathway (Espie et al., 2006) highlights this cognitive basis
of PI and proposes a pathway through which the disorder develops and persists. The
model has its origins in the psychobiological inhibition model (Espie, 2002), which
considers what it takes to upset the course of normal good sleep, and to prevent (inhibit)
it’s recovery. The model attributes the disruption to the sleep-wake automaticity in PI to
three distinct processes; selectively attending to sleep, explicitly intending to sleep, and
an exaggerated exerted effort into the sleep engagement process. The first of these three

4
processes, selectively attending to sleep, which encompasses a hyper-vigilance to all
things sleep-related, including the negative consequences that are appraised to be as a
result of poor sleep, captures a purely cognitive element of the disorder, and has been
commonly discussed within the insomnia literature. Indeed, authors have consistently
reported the association between cognitive arousal and subjective sleep disruption.
Harvey (2002) reported that the cognitions of people with insomnia were focused on
worry about not getting to sleep, general worries, solving problems, the time, and noise
in the house. Wicklow and Espie (2000) obtained voice activated audiotape recordings
of spontaneous thoughts and sleep actigraph data from 21 poor sleepers over three
consecutive nights. Regression models indicated that thinking about sleep and the
anticipated consequences of poor sleep, along with general problem solving, were the
strongest predictors of objective sleep latency. Lundh and Broman (2000) presented a
theoretical model which posited that psychological vulnerability factors may predispose
the person with insomnia to 1) respond with sleep-interfering processes to stressful life
events i.e. with cognitive over arousal at bedtime, excessive worry etc, and 2) to engage
in dysfunctional sleep-interpreting processes, such as sleep-related beliefs, attitudes, and
perfectionist standards. The neuro-cognitive model (Perlis, 1997) supports the former of
these two predispositions. More specifically, cortical arousal, measured through EEG
activity, was found to be elevated in patients in patients with insomnia as compared to
good sleepers. Perlis (1997) suggests that, as one develops chronic insomnia, there is an
increase in high frequency EEG activity at or around sleep onset. In transient (acute)
insomnia such activity may occur in association with stress induced worry and/or
rumination, however, over time this becomes a classically conditioned response i.e.

5
elevated EEG is elicited in response to the visual and/or temporal cues usually associated
with sleepiness and sleep, which occurs in the absence of situational stressors (Perlis et
al., 1997).
The Cognitive Model of Insomnia (Harvey et al., 2002) extends the thinking about the
associations between cognitive arousal and PI, into more definable contexts. Harvey
highlighted the association between PI and the monitoring of sleep-related threat. In the
recently reported ‘real world’ experiments, Harvey and colleagues manipulated attention
processes in order to demonstrate the causal role in increasing and decreasing insomnia
symptoms. Within one such study (Neitzert-Semler and Harvey, 2006), two groups of
individuals with PI were assigned to either a focused attention group, in which they were
instructed to monitor for internal reactions to their poor sleep, or the distraction group,
who were distracted from internal monitoring by engaging in external activities. Both
groups were subsequently compared to a healthy control group of good sleepers (GS).
As predicted, the focused attention group reported higher negative thoughts and daytime
sleepiness and exhibited more safety behaviours than controls. In another series of
experiments, Tang et al. (2007) considered the importance of clock monitoring in
insomnia as previously, in the cognitive model of insomnia, Harvey had proposed that
people experiencing insomnia have a greater tendency to monitor the bedroom
environment for evidence of wakefulness, and that this, in turn, results in an increase in
negative thinking and worry about the consequences of poor sleep. In a preliminary
experiment, Tang and colleagues instructed both GS and PI sufferers to monitor the
clock and subsequently demonstrated that both groups reported higher worry ratings and
6
longer sleep onset latencies (SOL) than controls. In a second experiment, which
controlled for the actual act of monitoring the clock, the control group were instructed to
monitor a digital display which mimicked a digital clock but displayed meaningless
information. Again, as predicted, the digital display group reported less worry and
shorter SOL than the group monitoring the real clock, and thus supported the idea that
attention bias, in the form of clock watching, aided in the sleep interfering process.
Attention and Insomnia
The ‘real world’ experiments have been of great value in understanding the implications
of attention focus within the PI disorder. However, the most influential research to date,
evidencing attention processing in PI populations, comes from the recent burst of
research utilizing experimental cognitive psychology methods to demonstrate attention
biases in people with PI. More specifically, recent research has used computerised
experimental protocols to measure information-processing speed to salient (sleep-
related) and neutral (non sleep-related) stimuli. The principle behind these ‘attention
paradigms’ relates to the notion that reaction time (RT) responses to stimuli, that are
relevant to the individual (whether positively or negatively relevant), will be different to
those of stimuli that have little relevance to the individual.
To date there have been seven reported studies within the insomnia literature that have
executed this experimental protocol in an attempt to evidence attention bias in people
with PI. Although the methodologies between these studies differ, the fundamental
principle of ‘differentiation through reaction time’ is consistent. This current paper aims

7
to systematically review these available studies and provide conclusions relating to 1)
the stability of the attention bias phenomenon in individuals with PI and 2) the most
effective methodologies utilized when assessing for attention bias in PI groups.
Attention and Generalised Anxiety Disorder
This current paper will also consider other available literature that evidence attention
bias effects in another psychopathological disorder. Indeed, this experimental
methodology, i.e. computerised attention paradigms, in detecting attention bias in
psychopathological conditions has a long-standing history. Indeed attention bias toward
salient, relevant, stimuli has been demonstrated in panic disorders, post traumatic stress
disorder, obsessional disorders, generalized anxiety disorder (see Mogg and Bradley,
1998, Mathews and MacLeod, 1994 for reviews). Most of these identified attention bias
effects have been attributed to perceived threat (Matthews et al., 1995, Matthews et al.,
1998, Matthews et al., 2000, Fox et al., 2001). Indeed, in both in psychological
disorders and substance abuse/dependence, attention biases have helped explain why
disorders and dependencies are self-maintaining and why relapse so frequently occurs
after apparently successful treatment (Jones et al., 2003). For example, if threatening
stimuli are more readily noticed by those exhibiting clinical anxiety, anxiety responses
will be generated more than others and the disorder maintained (Mogg et al., 1990).
In recent years cognitive models of anxiety have underpinned radical new developments
in the treatment of anxiety disorders, and generalized anxiety disorder (GAD) has
featured heavily within this literature. More specifically, as evidence has accumulated in
support of the cognitive processes that develop and maintain the disorder, e.g. negative
8
automatic thoughts, inaccurate appraisal of situations, attention bias toward threatening
information etc, detailed cognitive intervention strategies, aimed at reducing these
cognitive distortions, have appeared within the literature. Indeed, Beck introduced his
cognitive model and treatment for anxiety (Beck and Emery, 1985), the latter of which is
now established to be effective for GAD (Butler et al., 1991).
Similar to GAD, it has recently been suggested that individuals with PI are characterized
by higher levels of meta-cognitive beliefs and plans for processing which predispose
them to appraise thoughts, experiences and body sensations negatively (Espie at al.,
2006). Thus, similarly to individuals suffering GAD who frequently worry and ruminate
about possible negative outcomes, this cognitive architecture in the individual with PI
promotes worry, rumination and attention bias in the pre-sleep period. The consequence
of which is disruption of the sleep onset and maintenance process.
When these similarities between the GAD and PI are highlighted, it seems plausible to
assume that the attention processes observed within one population would exist within
the other. Mores specifically, as there is an abundance of research identifying attention
bias through the use of computerised methodologies in populations with GAD (see
Mogg and Bradley, 2005 for review), one could hypothesize that the magnitude of
effects observed within this population would be largely comparable to those observed
within the PI population. If this is indeed the case, this outcome would highlight the
importance of the cognitive components within the non- pharmaclogical treatment-of-
choice for insomnia i.e. Cognitive Behavioural Therapy (CBT), and would support the
9
suggestion that such cognitive processes, that characterise insomnia, may reduce the
response to largely behavioural psychological treatments. Furthermore, as recent reports
have evidenced a reduction in attention bias effects in GAD following CBT intervention
(fox et al., 2005), one could predict that the administration of CBT for insomnia would
similarly reduce the effect within the primary insomnia population. Thus, the final aim
of this current paper is to compare the attention bias effects of individuals with PI to
those reported for individuals with GAD.
METHOD
Search strategy
The following databases were searched electronically using the terms insomnia, primary
insomnia, generalized anxiety disorder, anxiety, attention bias, information processing
bias and selective attention from the start of indexing until April 2009: PsychINFO and
MEDLINE. Behaviour research and therapy, British Journal of Clinical psychology,
Cognition and Emotion and the Journal of Abnormal Psychology were hand searched to
identify studies that were not electronically indexed. Citation lists of relevant studies
were also examined for other relevant trials.
Types of Studies
All attention bias studies assessing attention bias scores in adults (18years to 60 years)
with primary insomnia (PI), secondary insomnia (SI), poor sleep or generalized anxiety
disorder (GAD), relative to healthy controls, through the utilization of computerised,
Emotional Stroop, Dot Probe, Inducing Change Blindness Flicker or Modified Posner

10
paradigms were included within this review. There were two reasons for excluding
studies that utilized non-computerised tasks. First, reaction times to these tests have been
shown to be significantly slower as compared to the computerised versions (Mogg et al.,
1998). Second, as all the PI studies to date have utilized computerised paradigms, it was
thought that fair comparison between PI and GAD studies would be optimally achieved
by restricting the inclusion of GAD studies to those utilizing the same paradigm
methodology.
Although the papers relating to attention bias in sleep disturbance are reviewed in full,
information relating to the GAD papers is summarised in table form. This is because a
full review of attention bias in the GAD population has recently been published (see
Mogg and Bradley, 2005). Within this current review, relevant information from the
GAD studies, that enable comparisons between PI and GAD data, will be detracted from
relevant papers, reported and discussed. Exceptions to this however relate to any studies
that have appeared within the literature after the publication of the Mogg and Bradley
(2005) review, and these will be reviewed in full.
Types of Participants
Inclusion criteria: 18 years to 60 years (inclusive); primary diagnosis of PI, secondary
diagnosis of PI, poor sleep or GAD.
Exclusion criteria: < 18 years old or > 60 years old; circadian cause of sleep difficulty
i.e. Delayed/Advanced Sleep Phase Syndrome. Any anxiety disorder other than GAD.

11
Results of Literature Search
Electronic database searching under the search terms above initially retrieved a total of
34 studies. Limiting the search results to adults (=> 18 years and <= 65 years) reduced
this to 28 studies. Further, limiting studies to those that utilized computerised paradigm
methodologies (as opposed to manual paradigm methodologies) reduced the total to
thirteen (seven sleep studies and six GAD studies). In order to avoid the ‘splitting’ of
data (i.e. where RT scores reported in more than one experiment are generated from the
same experimental population, but are reported in reviews as representing distinct
experimental populations) all studies reporting more than one experiment, with the same
population, were considered to represent one study. Despite this procedural
consideration, the total number of studies being included for review remained thirteen,
with seven relating to studies assessing individuals with PI, and six relating to studies
assessing individuals with GAD.
Quality Rating Scores (QRS)
A limited list of criteria was established from which each paper was ‘quality’ rated,
Table 1. This list was determined and agreed by the principle author of this current
review and a senior colleague specialising in behavioural sleep medicine. For each
individual paper, one point was assigned for every criterion met. The maximum score for
any given paper was therefore six points. The criterion list related to 1) whether the
study was age matched and 2) gender matched, 3) whether a clinical population was
recruited, 4) whether a standardised diagnostic system was reported for group allocation,
5) whether a standardized paradigm was utilized, and finally, 6) whether means and
12
standard deviations were reported (thus enabling effect size calculation; small = 0.2,
medium = 0.5, large = 0.8). Two independent raters evaluated each study. These
independent raters yielded both identical total QRS for each individual paper, and
identical ratings for each individual criterion given to each paper. The aim of this rating
system was not to further eliminate papers from the current review but alternatively to
validate the interpretation of comparisons later made.
Paradigm Overview
i. Emotional Stroop
The Emotional Stroop task is the most classic of all the attention bias tasks. In this task,
participants are shown words written in different coloured ink and are required to ignore
the meaning of the word and, instead, name the ink colour that it is written in.
Participants are asked to do this as quickly as possible. Colour-naming latency has been
interpreted as reflecting the extent to which processing resources are allocated to the
word content. Typically, words that are emotionally salient to the individual have larger
RT latencies to colour identification than non-salient words. Within the Stroop
paradigm, as with the Dot-Probe and Posner paradigm, the stimulus presentation time
can be manipulated to assess supraliminal (i.e. conscious) and subliminal (unconscious)
attention. Typically, stimulus presentations <100 assess subliminal attention, and > 100
supraliminal attention.

13
ii. Inducing change Blindness Flicker Paradigm
The ICB Flicker paradigm is the most recent attention bias paradigm to be developed
(Rensink, 1997; Simons, 1997). Within this paradigm, a visual scene is presented,
comprising of both salient and non-salient stimuli (e.g. sleep and non-sleep objects). The
scene ‘flickers’ back and forth between an original scene (OS) and a changed scene
(CS), which are always separated by a brief mask screen (screen of X’s). The CS has one
of the stimuli removed or in a different position from the OS). The participant’s
instruction is to detect this subtle change within the scene. The cycle of OS, mask, CS,
mask, OS, represents one complete cycle within the paradigm. The paradigm continues
to cycle until the participant detects and signals the correct change. Typically objects
that are changed within the scene that are salient to the participant are detected quickly,
whereas changes made to non-salient stimuli take longer to identify. Authors have
suggested that this reflects an attentional preference towards the salient stimuli within
the scene.
__________________________
INSERT TABLE 1 HERE
__________________________
iii. Visual Probe Paradigm
a) Dot-Probe Paradigm
The Dot Probe paradigm was adapted from experimental cognitive psychology
paradigms, which indicated that the deployment of visio-spatial attention can be assessed

14
from manual response times (RTs) to visual probes (e.g. Posner et al., 1980). That is,
individuals respond faster to a probe stimulus (e.g. a small dot), which is presented in an
attended rather than unattended region of a display. In a typical version of a dot probe
task assessing attentional biases from emotional stimuli, a series of word pairs or picture
pairs are presented on a computer screen, with one member of the word pair above the
other. On critical trials, one word of each pair is emotion-related and the other neutral. In
a typical dot-probe paradigm, each pair is presented fairly briefly (e.g. 500-1000ms), and
when the words disappear, a probe (e.g. a dot or arrow) appears in the location just
occupied by one of the words. Participants are required to respond as quickly as possible
to the probe. Typically, individuals with anxiety have been found to respond faster to
probes replacing emotionally negative words than neutral words, compared with non-
anxious controls, which is consistent with attention bias for threat in anxiety.
b) Modified Posner Paradigm
The Modified Posner paradigm has led the way in the differentiation of attentional bias
data. More specifically, the Posner paradigm has allowed for both engagement and
disengagement components of attention to be assessed. Within this computer task,
participants are required to categorise a target (e.g. respond appropriately to it’s
orientation) that may appear on the left or the right of a fixation point. On 75% of the
trials, a cue highlights the area in which the target will appear (valid). However, one
25% of the trials the cue will appear in the opposite location of the following target
(invalid). The typical paradigm effects reveal that valid trials are detected quicker than
invalid trials, as the exogenous cue induces a covert orienting of attention to the cued
15
location leading to faster RTs on valid trials and slower RTs on invalid trials. This effect
is more commonly known as the cue validity effect. Analyses of valid RT’s provide
evidence for a speeded engagement to salient stimuli, and analyses of invalid RT’s
provides evidence for a delayed disengagement away from salient stimuli. Typically,
anxious individuals have been shown to have a delayed disengagement away from
threatening stimuli as compared to healthy controls.
iv. Mixed Modality
The Mixed Modality paradigm is a relatively new attention bias paradigm, and features
rarely in the broader attention bias literature. With this paradigm the participant is
required to respond differentially to two different sounds, whilst pictorial or semantic
stimuli are presented as distracters. Reponses are given by the left and right index finger
depending on the tone of the sound. Typically, RTs to sounds that are distracted by
salient stimuli are larger than RTs to sounds that are distracted by non-salient stimuli.
ATTENTION BIAS AND PRIMARY INSOMNIA
Details of the seven PI papers that met criteria for inclusion are shown in Table 2. Of
these papers two utilized a modified Stroop paradigm, two and Inducing Change
Blindness Flicker paradigm, one a modified Posner paradigm, and one a Mixed Modality
and Modified Stroop paradigm. The total number of participants was one hundred and
thirteen PI, thirty-three SI, thirty-two poor sleepers and one hundred and forty-four GS.
Total QRS across studies ranged from four to five out of a possible six. All studies
recruited from non-clinical populations, with a further three failing to report PI

16
identification through the administration of a recognised diagnostic system (see Table 1).
Although Taylor et al., 2003 recruited a clinical sample of cancer patients, clinical status
in relation to the insomnia symptoms was not reported, thus this criterion was not met.
Although four of the seven studies recruited additional groups (see table 2), comparisons
of interest only relate to those depicted in the ‘comparison of interest’ column in table 2.
The decision to focus solely on these comparisons was to aid in the subsequent
comparison of PI and GAD data. Effect size (d) was calculated using an online effect
size calculator (http://web.uccs.edu/lbecker/Psy590/escalc3.htm) and was based on the
equation, M1 – M2/ S pooled. Effect sizes differentiation followed Cohen’s effect size;
large = 0.8, medium = 0.5, and small = 0.2.
i. Primary insomnia and the Emotional Stroop
The first study to translate the emotional Stroop task into the field of insomnia was that
of Lundh et al. (1997). Lundh and colleagues reported that people with primary insomnia
had prolonged response latency for sleep-related words. However this effect was also
evident for the control population of good sleepers, and there was no group difference on
the Stroop interference index; a result inconsistent with the attention bias hypothesis.
The authors suggested that sleep-related words might have an emotional valence for
people that may or may not be directly related to sleep problems. However, the extensive
literature on the Stroop task would not predict experimental effects in normal control
groups (Espie et al., 2006). This study, however, does not report details of the
inclusion/exclusion procedure with respect to group allocation, and does not provide
information regarding the diagnostic tools or standardized measures used for group

17
allocation and therefore it is impossible to make further predictions regarding the
direction of the results with respect to group characteristics. In addition, no measure of
affective state (which is known to influence Stroop findings) was reported. The authors
also do not provide information about stimulus presentation timing and therefore no
conclusions can be drawn with respect to whether supraliminal/subliminal attention was
being assessed. However, despite these limitations and somewhat equivocal findings
Lundh et al.’s pioneering work brought computerized attention paradigms into the field
of insomnia research.
The second emotional Stroop experiment to appear within the insomnia literature tested
the hypothesis that individuals suffering chronic insomnia (i.e. insomnia symptoms for
12–18 months) would demonstrate attention bias effects toward sleep-related words as
compared to individuals suffering acute insomnia (i.e. insomnia symptoms for 0-3
months) (Taylor et al. 2003). All participants within this study had a diagnosis of cancer
prior to the onset of their insomnia symptoms and thus the insomnia symptoms were
viewed to be the secondary complaint. Both groups completed the computerised Stroop
task comprising cancer-related, sleep-related and neutral word cues. Both groups
demonstrated attention bias for cancer-related words but only the persistent insomnia
group demonstrated attention bias for sleep-related words. The fact that interference
effects for sleep words were absent at 0-3 months but were evident at 12-18 months,
suggests that selective attention bias towards sleep may play a role in the transition from
adjustment insomnia to chronic primary insomnia. Indeed, this is an important finding as
it directly demonstrates that the cognitive processes of primary insomnia are not present
at the onset of the sleep disruption, but rather develop over the course of the ‘experience’
18
of insomnia. Thus, it seems appropriate to assume that cognitive therapeutic
interventions would correct these errors in cognitive processing to return the individual
to their original state.
__________________________
INSERT TABLE 2 HERE
__________________________
The authors acknowledge however, that a limitation of the study relates to the fact that it
employed a cross-sectional rather than longitudinal design and did not include a control
group of good sleepers without medical problems. Additionally, the paradigm employed
presented the word stimuli for the standard supraliminal 500ms duration, thus it was not
possible to determine to what extent the bias was pre-attentive/automatic i.e. occurred
involuntary without intention or conscious control. The results, therefore, need to be
interpreted with some caution.
Spiegelhalder et al. (2008) reported the most recent emotional Stroop experiment within
the insomnia literature. This study recruited twenty PI identified through the DSM IV
criteria for insomnia. Twenty good sleeper controls and twenty sleep experts were also
recruited as controls. The inclusion of the expert group served the purpose of controlling
for the effects of ‘high frequency of concept usage’, which relates to the notion that
experts are likely to be emotionally affected by expertise-related stimuli (Williams et al.,
1996), and therefore may respond in a similar way to the PI group. The results revealed

19
that the PI group showed significantly higher attention bias scores towards sleep-related
words than the expert group, but other differences were observed for other group
comparisons. The authors conclude that the significance of sleep-related attention bias at
this stage should to be considered carefully as both this study and the previous work of
Lundh et al. (1997) reported no group differences between people with PI and GS
controls. In addition, however, the authors also acknowledge that the relatively small
sample size may have been insufficient. The authors also reported a second data set
generated from this population, however, this will be discussed later within the Mixed
Modality task section.
ii. Primary insomnia and the ICB Flicker Paradigm
Two experiments have appeared within the insomnia literature that report attention bias
effects in PI through the utilization of the ICB Flicker paradigm. The rationale behind
these experiments and the use of this specific paradigm relates to the long-established
interest in the control that sleep-related objects might have over sleep behaviour. Indeed,
within a conditioning framework, bedroom environment objects might become more
discriminative stimuli for sleep (Jones at al 2006), but when the bedroom sleep
contingencies are broken, they might become discriminative stimulus for wakefulness.
In the first ICB study (Jones et al. 2006), one hundred and ninety-two participants were
selected for a totally between subjects experiment. Participants first completed the
computerised task and subsequently were assessed for sleep quality. Participants were
allocated to either a poor, moderate or good sleep group, depending on their score on the

20
Pittsburgh Sleep Quality Index (>5, 4-5 inclusive, 0-2 inclusive, respectively) (PSQI,
Buysee et al. 1989). Importantly, therefore, retrospective group assignment was blind to
the dependent variable of the analyses, change detection latency. The stimuli included
within this study were selected using a comprehensive process designed to identify
objects associated with ‘going to bed to sleep’. The authors note that none of the objects
were intrinsically threatening or emotive.
Results revealed significant differences in change detection latencies between poor
moderate and good sleepers for the sleep-related change. Only the poor sleepers, who
detected the sleep-related change quicker than the neutral change, demonstrated attention
bias for sleep salient stimuli. Moderate sleepers showed a trend in the same direction. By
contrast, GS detected the change with the neutral objects significantly quicker.
Hierarchical regression was then applied to test the relationship between change
detection latency and a continuous representation of the global PSQI score. This
evidenced a systematically changing effect of sleep quality upon attention bias,
independent of age, gender and depressive symptom level. The authors conclude by
suggesting that when in competition for attentional resources with matched neutral
stimuli poor sleepers appear to prioritise sleep-related stimuli. With respect to the GS
finding, the authors suggest that the direction of results may be explained by differences
in physical saliencies of all the stimuli in the scene. That is the neutral half of the scene
may have been more salient in general, or may have included a highly salient single
item, as well as relative positional and configurational aspects. Because all the sleep
quality groups were presented with the same complex scene, the authors suggest that an

21
attentional force that is greater than the existing physical saliencies is likely to have
driven the response of poor sleepers.
The second ICB experiment aimed to replicate and extend the above work (Marchetti et
al. 2006). Within the study the diagnostic methods were improved, which involved a
clinical interview, based around the DSM-IV and ICSD-R nomenclatures, and
actigraphy. The primary analysis was also strengthened by the inclusion of an additional
control group. This comprised of individuals suffering from delayed sleep phase
syndrome (DSPS). DSPS is a circadian rhythm disorder in which the alignment of the
biological clock is essentially delayed with respect to the 24-hour clock. Individuals with
DSPS report symptoms similar to PI, e.g. large sleep onset latencies, but the origin of
their complaint is innately different. Indeed, the authors reported that due to this
circadian origin, they did not expect the DSPS group to exhibit cognitive arousal as an
explanatory mechanism for their continued wakefulness, thus, those with DSPS were not
predicted to show a cognitive processing bias to sleep-related stimuli. Furthermore, the
authors reported that often DSPS dilute PI samples, as DSPS is often not screened out of
PI research. Thus, their screening and inclusion within this current study was novel to
the PI literature.
This experiment used the same stimuli as the former, however a different stimuli was
chosen to under-go the change in the cycle, to rule out the possibility of idiosyncratic
effects to previously used stimuli. Group allocation was again not fully known to the
experimenter until after the computerised task was completed. As the authors predicted,
22
the stimulus change/sleep quality interaction was significant with PI detecting the sleep-
related change significantly quicker than the sleep-neutral change. No such differences
were observed for the control groups. Post hoc testing also revealed that, for the sleep-
related change, responses of PI were significantly quicker than GS and DSPS. By
comparison, for the neutral change, responses of GS and DSPS were significantly
quicker than PI.
The results of this experiment provide further evidence of attention bias to sleep-related
stimuli in insomnia. Furthermore, the effect sizes calculated from the two ICB studies,
for the PI/GS comparisons are medium to large d= -0.470 and d=-0.828 respectively,
thus suggesting that this method of assessing attention bias in PI is highly sensitive to the
phenomenon. The authors suggest that using pictorial stimuli may evoke more real life
responses to emotionally salient stimuli than their semantic representations, and
therefore future experimentation should aim to incorporate pictorial stimuli.
iii. Primary Insomnia and the Dot Probe Paradigm
MacMahon et al. (2006) reported attention bias in PI towards sleep-related words using
the dot-probe paradigm. This is the only reported dot probe paradigm with the insomnia
literature. Within this study sixty-three young adults across three experimental groups
(PI, DSPS and GS) participated. PI and DSPS participants met ICSD-R criteria for their
respective disorders following an extensive assessment comprising clinical interviews,
the use of self-report scales, and sleep diary and actigraphy monitoring. As with the ICB
study the DSPS was recruited as a clinical control sample for the same principle.
23
Following the author’s predictions, and in support of the previous ICB data, the PI group
showed a significantly greater processing bias toward sleep-related words (in
comparison to neutral words) when compared to GS and DSPS groups. The effect size,
d=0.32, for the PI versus GS comparison, denotes a medium effect size and thus
provides support for utilizing this methodology with this population in the future.
However, the stimulus presentation time within this experiment was 500ms, and
therefore is assumed to be assessing supraliminal attention, and therefore, similar to
Taylor et al’s (2003) study, we cannot fully determine to what extent the bias was pre-
attentive/automatic. The authors suggest that future experiment should aim to manipulate
the stimulus presentation time in order to assess this further.
iv. Primary Insomnia and the Mixed Modality Task
Spiegelhalder et al. (2008) reported the only Mixed Modality Task within the insomnia
literature, and reported no attention bias effect in PI towards sleep-related stimuli. This
study used the same group of participant as reported for their emotional Stroop
experiment previously discussed. This study again compared individuals with PI to a
group of sleep experts and good sleepers. Analyses revealed no significant group
differences and Pearson correlation between PSQI and attention bias scores was not
significant [r = -0.14, P = 0.29]. The authors also investigated the relationship between
attention bias scores and picture exposure durations, however linear regression analyses
between estimated attention bias scores and picture exposure times revealed that the lack
of attention bias could not be due to the varying exposure durations in any of the three
groups.

24
v. Primary Insomnia and the Modified Posner paradigm
Woods et al. (2009) utilized the Modified Posner Paradigm in attempt to extend the
interpretation of attention bias data, in PI, by revealing the components of attention, i.e.
engagement/disengagement, driving attention bias effects. Previously reported studies
utilizing this methodology with anxiety patients had revealed that attention bias effects
were observed through a delayed disengagement away form emotionally salient stimuli,
as opposed to a speeded engagement towards emotionally salient stimuli (Fox et al.
2001). The authors attempted to test this hypothesis in relation to PI. Twenty-two PI,
who met DSM-IV and ICSD-R criteria for PI, and twenty-two good sleepers were
recruited. The PI group was also assessed through the use of actigraphy. In line with the
previous anxiety literature, PI was significantly slower to respond to targets on invalid
trials (when the target was on the opposite location to the stimulus) than the controls,
thus suggesting a delayed disengagement from the clock cue. The authors report that this
provides further support for the existence of attention bias in PI and also provides further
objective evidence for the role of clock monitoring in triggering cognitive arousal in PI,
as previously discussed by Harvey (2002). The significant result generated by this
paradigm and the large effect size d = 0.8672 for the PI/GS comparison on invalid trials,
suggests that the modified Posner paradigm may be a useful tool in assessing attention
bias of PI to other sleep-related stimuli in the future. Furthermore, although the
presentation times within this experiment (250ms) assessed supraliminal attention, the
modified Posner paradigm would enable future studies to manipulate this presentation
time in attempt to assess subliminal attention profiles in PI. Indeed, this would follow in

25
the footsteps of the anxiety literature, within which subliminal attention biases are
already reported.
Conclusions
The reviewed literature provides significant evidence in favour of attention bias towards
sleep-related stimuli in PI, as five of the seven studies reviewed reported this
phenomenon. Thus, attention bias within the PI population appears to be relatively stable
phenomenon. This supports the prediction that due to their predisposition to appraise
thoughts, experiences and body sensations negatively, the cognitive architecture in the
individual with PI promotes worry, rumination and attention bias to sleep-related or
sleeplessness related stimuli.
When considering the methodologies of the studies collectively and relating this to study
findings and effect sizes, the biggest predictor of a significant result was stimulus type,
with pictorial stimuli producing the three highest, and large, effect sizes; Woods et al.
2009, d = 0.8672, Marchetti et al. (2006), d = -0.828, Jones et al. (2005), d = -0.470.
QRS was also largely predictive of outcome within the PI studies as two of the large
effect size studies (Woods et al. 2009, Marchetti et al. 2006) had a QRS of five (the
highest score achieved by of the studies). MacMahon et al’s (2006) study which was also
awarded a QRS of five, and also reported a significant effect, generated a moderate
effect size, d = 0.317. Interestingly, Taylor et al’s study, which reported attention bias in
chronic versus acute insomnia sufferers secondary to cancer reported a moderate to large
effect size despite the smaller QRS (QRS = 4). This experiment provides further support

26
in favour of the suggestion that insomnia, in secondary insomnia populations, exists
though similar processes as in primary populations, without a co-morbid presentation,
and thus should be treated with the same intervention. Indeed recently, Fleming and
Espie (2008) demonstrated that CBTi, delivered to patient suffering co-morbidly from
insomnia and cancer, was significantly effective in reducing SOL and total sleep time
compared to the treatment as usual (TAU) control group.
ATTENTION BIAS AND GENERALIZED ANXIETY DISORDER
Details of the six papers that met criteria for inclusion are shown in Table 3. All of these
papers were included in the review of Mogg and Bradley (2005) and therefore will not
be discussed in full within this text. The purpose of extracting, and reporting, the data
from these studies is to permit comparisons between the previously discussed PI data,
and thus satisfy the final aim of this current review.
Overview of GAD Studies
Of the six papers that met criteria, two utilized a modified Stroop paradigm, three a Dot-
Probe paradigm and one a modified Posner paradigm. The total number of participants
was one hundred and nine individuals with GAD and one hundred and twenty-four
healthy controls. The inconsistent ratio of GAD to healthy controls was observed within
five out of the six studies. Both Stroop experiments (Mogg et al., 1993, Bradley et al.,
1995) reported comparisons between people with GAD relative to healthy controls and
both reported evidence in favour of attention bias in GAD in the supraliminal and
subliminal experimental condition. Only one of the three Dot-probe paradigm
experiments (Mogg et al., 1995) reported comparisons between people with GAD and
27
healthy controls at both supraliminal and subliminal experimental conditions and
reported attention bias in GAD in both. Bradley et al (1999), reported attention bias in
GAD in the shorter of their two subliminal conditions. The third dot-probe experiment
(Matthews et al., 1996) reported a subliminal condition, in which no attention bias
effects were observed in the experimental population of people with GAD and panic
disorder (+/- agrophobia) relative to controls. Within the experiment utilizing the
modified Posner paradigm (Mogg et al. 2000), both valid and invalid analyses were
reported, however neither yielded a significant effect of group on RT data.
__________________________
INSERT TABLE 3 HERE
__________________________
Total QRS across studies ranged from five to six out of a possible six. Only one study,
Mogg et al. (1995) failed to report mean and standard deviation values, resulting in an
absence of effect size in table 3. All studies recruited clinical patients to represent the
GAD group, all utilized standardised attention paradigms and all reported standardised
diagnostic systems to qualify group allocation (table 1). Effect sizes from the
experiments that yielded a significant difference between groups on attention bias scores
were small, ranging from d = 0.165 to d = 0.230.
28
COMPARISONS BETWEEN PI AND GAD STUDIES
The percentage of studies that yielded a significant attention bias group effect for PI and
GAD relative to their control populations was largely comparable, 71% and 66%
respectively. Of these studies, effect size comparisons between PI and GAD revealed
that the mean effect size of GAD studies was, on average, smaller than the effect size of
PI studies, r = 0.168 and r = 0.585 respectively. In order to prevent the ‘splitting’ of
data, effect sizes for the GAD supraliminal and subliminal data was averaged before
being included into the mean effect size calculation. PI mean effect size fell within the
large effect size category, and GAD mean effect size fell within the small effect size
category.
Explanation for this difference in effect size between PI and GAD can be drawn form a
number of sources. First, the largest effect-sizes within the PI literature relate to
experiments that incorporated pictorial stimuli that represent objects that are related to
sleep and sleeplessness. The GAD literature has yet to incorporate pictorial stimuli, other
than happy, sad and neutral faces, into the paradigms, and thus at present it is unknown
as to whether effects size would increase if this methodology was employed.
In addition, individuals suffering GAD may have differences in the extent to which they
feel anxiety symptoms in relation any given stimulus. More specifically, self- reports
from individuals suffering from GAD highlight that although there is meta-worry
relating to many aspects of the individual’s life, there is significant variation in the
specific aspects of life that promote significant worry and distress for each individual. It

29
may be possible that the paradigms utilized within the available literature have failed to
capture such specifically threatening aspects, and therefore have generated smaller
differences between conditions. In comparison, the stimuli incorporated into the PI
experiments represent concrete sleep/sleeplessness related stimuli (as rated by the
general population) and thus would be more likely to represent emotionally salient
objects.
Secondly, people with PI commonly report being highly vigilant at bedtime. More
specifically, PI report that they become more awake and alert, in relation to both external
and internal monitoring, as opposed to becoming increasingly tired and sleepy. One
could predict that this hyper-vigilance, and environmental monitoring, may promote
higher sensitivity on attention bias paradigms when responding to sleep/sleeplessness
related stimuli, as opposed to neutral stimuli, thus generating larger differences with
controls and subsequent effect size, within experiments.
Interestingly, all of the experimentation within the available PI studies was conducted
during the day, when sleep-related bias would be less likely. However, measures of
daytime sleepiness, as measured by the Stanford Sleepiness Scale (Hoddes et al., 1973),
in populations of people with PI, have revealed significantly more sleepiness ratings and
thus more desire to attain sleep than good sleeper controls. Thus, although the testing on
the attention bias paradigms has occurred during the daytime, the consequences of poor
sleep e.g. daytime sleepiness, is still largely present. Indeed, this symptom of sleepiness
30
may act as a primer for PI in identifying sleep-related stimuli more readily, as the desire
for sleep is strong.
This suggestion alludes to the notion that ‘craving’ for sleep, or an intense motivation to
achieve sleep, may be driving the attention bias effects in PI. Indeed, attention biases
have been reported in clinical populations with drug dependence (Lusher et al., 2004),
where attention bias is driven through a craving for the addictive stimulus. The A-I-E
pathway suggest that the person with PI experiences sleep disruption, sleep loss and
perceived sleep inadequacy and so becomes atypically motivated by sleep, which is
increasingly incentivised in proportion to the preoccupation associated with it (Espie et
al., 2006). Thus, the A-I-E pathway, acknowledges the possibility that attention bias in
PI towards sleep relevant stimuli may be representing a motivation towards attaining
sleep, and the symptom reductions associated with good sleep e.g. reduced feelings of
daytime sleepiness. Indeed this thinking could be a possible explanation for the effect
size difference observed between the PI and GAD studies as attention bias in GAD
would follow an attention bias towards ‘threat’ hypothesis and not an attention bias
towards ‘craving’ hypothesis. Furthermore, attention bias is PI may exist through both
threat and craving processes, as the person with insomnia both desires the good sleep
experience but also suffers from the poor sleep consequences. If both threat and craving
are contributing to the maintenance of insomnia it seems plausible that the attention bias
effect would be larger.
31
Future experimentation should consider this threat/craving hypothesis when assessing
attention bias effects in PI following successful CBTi intervention. Indeed, often people
successful in improving sleep quality following CBTi report that they have ongoing
concerns about returning to their previous poor sleep status, although presently they are
satisfied with, and refreshed by, their sleep quality. This could be taken as evidence that
the craving component of attaining good sleep has been lost, as good sleep has been
achieved, but the threat posed by possible poor sleep returning is still present.
Assessment of the effect sizes generated within this group of PI would provide further
insight into the possibility that craving plays a significant role in driving the observed
attention bias effect in the PI population.
The average QRS for GAD was higher than the average QRS for PI, M = 5.6 and M =
4.5 respectively. The main criterion that differentiated the groups on QRS scores was the
inclusion of a clinical sample, as all GAD studies recruited clinical samples whereas all
PI studies did not. In addition, all GAD studies reported standarised diagnostic systems
to qualify group status whereas three studies within the PI papers did not. Despite these
methodological advantages, higher QRS was not predictive of larger effect sizes,
between, or indeed, within groups. This is not surprising however, as although the QRS
provided a general rating for the quality of each study, it is important to acknowledge
that other factors that were not included in the limited list of criteria may have been
contributing to study outcome and thus over all effects. Sample sizes within the PI
studies were, on average, higher than sample sizes within the GAD studies, N= 38 (PI),
32
N = 22 (GS), N = 18 (GAD), N = 20 (control), respectively. Table 4 summarises these
average comparisons for PI and GAD.
__________________________
INSERT TABLE 4 HERE
__________________________
A further methodological advantage, for all GAD studies, in comparison to the PI
studies, relates to the manipulation of stimulus presentation time within the paradigm.
As previously reported within the PI section, all of the available studies only
incorporated stimulus presentation times that would allow for the assessment of
supraliminal attention, and therefore, all findings must be interpreted with some caution.
More specifically, it is uncertain at present whether attention bias effects in PI would
extend to the subliminal condition, and therefore firm conclusions regarding the specific
origins, and processes, through which attention bias in PI exist are still largely unknown.
However due to the comparable nature of the supraliminal attention bias effects for each
disorder, one could predict that the subliminal attention bias effects would also be
comparable. The testing of this hypothesis would be easily achieved, as the
methodologies of the previous studies would remain largely the same, with the subtle
difference being a change to the stimulus presentation time. Indeed, future research

33
within the PI and attention bias literature should attempt to isolate this subliminal
phenomenon.
OVERALL CONCLUSIONS
At the outset of this current review three specific aims were identified 1) to provide
conclusions relating to the stability of the attention bias effect in PI, 2) to highlight the
most effective methodologies utilized when assessing for attention bias in PI, and 3) to
identify whether attention bias effects in individuals with PI are comparable to attention
bias effects in those with GAD.
This review has highlighted more information than is encapsulated by these aims,
however answers relating to the specific aims will be highlighted below. First, attention
bias effects in PI populations appear to be a relatively stable phenomenon, with over
three quarters of studies reporting evidence in favour of the existence of the
phenomenon. The stability of this finding, and the notion that it offers an objective
index of sleep-related cognitive arousal, suggests that attention bias could potentially
serve as a ‘cognitive marker’ of the PI disorder, and could potentially play a role within
diagnosis (Espie et al., 2006). However, in order to clarify its’ stability within clinical
samples, future research should focus on recruiting large clinical samples, as, to date,
only non-clinical populations have been assessed. Indeed, the lack of data relating to
clinical samples within PI experimentation is a common limitation of the PI literature. It
is essential that future studies should assess samples of clinical patients in order to
reduce the high presence of disorder co-morbidity that is often seen within insomnia
34
groups. Through doing this, sleep researchers will be better placed to argue that the
attention bias effects observed within the PI population are truly reflective of the sleep
disorder per se rather that as a consequence of an underlying disorder.
In addition, Taylor et al. (2003) reported the absence of attention bias in acute secondary
insomnia relative to chronic secondary insomnia, which suggests that the attention bias
phenomenon develops over the prolonged experience of insomnia symptoms. With this
in mind, future studies should aim to address the question of whether psychological
treatment impact upon the cognitive profile of chronic insomnia, specifically, reducing
the attention bias effect. Indeed, attention bias effects reduce following CBT therapy for
generalized anxiety disorder (Mathews et al., 1995, Mogg et al. 1995). Demonstrating
that established psychological treatments such as CBTi impact on attention bias in PI
would add further strength to the argument that such biases play a critical role in the
development and maintenance of the chronic disorder.
Secondly, although all the paradigms within this current review assessing attention bias
in PI, with exception of the Mixed Modality, generated significant effects, the single
criterion that differentiated large effect sizes from small and medium effect sizes was
‘stimulus type’. More specifically, pictures, as opposed to words, produced the large
effects sizes (Woods et al. 2009, Marchetti et al. 2006). This finding is supported by the
previous suggestion that pictorial stimuli can evoke responses that are more likely to
mimic those in real life situations as compared to semantic representations of the same
stimuli. Townshend et al., (2001) demonstrated that pictorial and semantic versions of a

35
Dot-probe task, given to the same experimental population, resulted in inconsistent data.
More specifically, attention bias for alcohol-related stimuli were revealed in heavy social
drinkers when using a pictorial version of the dot-probe, a result that was not replicated
when using the written word version. The authors suggested that this maybe due to the
fact that pictures, which in this case represented concrete rather than abstract alcohol-
related representations, are more salient to the individual, and thus, more sensitive in
generating attention bias (Townshend et al, 2001). Thus, a common limitation of the
GAD studies relates to the fact that little research has attempted to incorporate varying
stimulus presentation types into the attention paradigms. If the use of pictorial stimuli
can be used within GAD attention paradigm one could predict that an increase in effect
sizes may be observed.
However, in addition, future experimentation should aim to differentiate people with PI
from good sleepers through the use of a standardised diagnostic system, as at present
three out of seven available studies failed to report such a procedure. Indeed, within the
GAD literature all experimentation utilized the same two standardised diagnostic
systems for group allocation. This standard approach to group allocation should be an
aim of all future insomnia research.
It is important to acknowledge however that although effect size differences have been
discussed in relation to QRS, a limitation of this current paper relates to the notion that
other factors, which were not included in the limited list of QRS criteria, may have been
contributing to the effect size generated from each study.
36
Finally, this review has highlighted that attention bias effects are observed within both
PI and GAD populations when utilizing computerised attention paradigms. The stability
of the phenomenon across both populations is similar, in that both have produced
attention bias effects in 71% (PI) and 66% (GAD) of experiments. More specifically
however, effect sizes from the PI studies are, on average, larger than those of GAD
studies. However, GAD has significantly more data relating to both supraliminal and
subliminal attention processes and thus future research within the PI literature should
aim to extend the supraliminal effects into the subliminal domain.
The attention bias phenomenon within PI populations appears to represent a stable,
objective, cognitive marker of the complaint. However, at present there is still much
room for additional experimentation to help clarify the full nature and progression of this
effect. With respect to the findings within this current review, future research concerned
with attention bias in PI should aim to longitudinally track, within clinical populations,
supraliminal and subliminal attention bias profiles, as well as it’s response to CBTi
treatment. This would serve to advance understanding about the development and
maintenance of attention bias mechanisms within the PI population.

37
References
American Academy of Sleep Medicine. International classification of
sleep disorders: diagnostic and coding manual. 2nd ed. Westchester, IL: AASM;
2005.
American Psychiatric Association. Diagnostic and statistical manual of
mental disorders. 4th ed. Text revised. Washington, DC: APA; 2000.
Beck, A.T. & Emery, G. (1985) Anxiety disorders and phobias: a cognitive perspective.
New York: Basic Books.
Bradley, B.P. & Mogg, K. (1999) Attentional bias for emotional faces in generalized
anxiety disorder. British Journal of Clinical Psychology, 38, 267-278.
Bradley, B.P., Mogg, K., White, J. & Millar, N. (1995) Selective Processing of Negative
Information: Effects of Clinical Anxiety, concurrent Depression, and awareness. Journal
of Abnormal Psychology, 104 (3), 532-536.
Butler, G., Fennell, M., Robson, J. & Gelder, M. (1991) Comparison of behaviour
therapy and cognitive behaviour therapy in the treatment of generalized anxiety disorder.
Journal of Consulting and Clinical Psychology, 59, 167-175.
Effect size calculator, (http://web.uccs.edu/lbecker/Psy590/escalc3.htm
38
Espie, C. A., Broomfield, N.M., Macmahon, K.M., Macphee, L.M. & Taylor, L.M.
(2006) The attention-intention-effort pathway in the development of psychophysiologic
insomnia: an invited theoretical review. Sleep Medicine Reviews, 10, 215-245.
Fox, E., Russo, R., Bowles, R. & Dutton, K. (2001) Do threatening stimuli draw or hold
attention in sub clinical anxiety? Journal of Experimental Psychology (General), 130,
681-700.
Harvey, A.G. (2002) A cognitive model of insomnia. Behaviour Research and Therapy,
40, 869-893.
Hoddes, E. (1973) Quantification of sleepiness: Anew approach. Psychophysiology, 10,
431-439.
Jones, B.T., Jones, B.C., Smith, H. & Copely, N. (2003) A flicker paradigm for inducing
change blindness reveals alcohol and cannabis information processing biases in social
users. Addiction, 98, 235-244.
Jones, B.T., Macphee, L.M., Broomfield, N.M., Jones, B.C. & Espie, C.A. (2006) Sleep-
related attentional bias in good, moderate and poor (primary insomnia) sleepers. Journal
of Abnormal Psychology, 114, 249-258.
Lundh, L.G. & Broman, J.E. (2000) Insomnia as an interaction between sleep initiation
and sleep interpreting processes. Journal of Psychosomatic Research, 49 (5), 299-310.

39
Lundh, L.G., Froding, A., Gyllenhammar, L., Broman, J.E. & Hetta, J. (1997) Cognitive
bias and memory performance in patients with persistent insomnia. Scandinavian
Journal of Behaviour Therapy, 26, 27-35.
Lusher, J., Chandler, C. & Ball, D. (2004) Alcohol dependence and the alcohol Stroop
paradigm: evidence and issues. Drug Alcohol Dependance, 75, 225-231.
Macmahon, K.M.A., Broomfield, N.M., Macphee, L.M. & Espie, C.A. (2006) Attention
bias for sleep-related stimuli in primary insomnia and delayed sleep phase syndrome.
Sleep, 29 (11), 1420-1427.
Marchetti, L.M., Biello, S.M., Broomfield, N.M., Macmahon, K.A. & Espie, C. (2006)
Who is pre-occupied with sleep? A comparison of attention bias in people with
psychophysiological insomnia, delayed sleep phase syndrome and good sleepers using
the induced change blindness flicker paradigm. Journal of Sleep Research, 15, 212-221
Mathews, A. & Macleod, C. (1994) Cognitive approaches to emotion and emotional
disorders. Annual Review of Psychology, 45, 25-50.
Matthews, A. & Mackintosh, B. (1998) A cognitive model of selective processing in
anxiety. Behaviour, Research and Therapy, 22, 539-560.
Matthews, A. & Mackintosh, B. (2000) Indiced emotional interpretation bias and
anxiety. Journal of Abnormal Psychology. 109 (4), 602-615.
40
Matthews, A., Mogg, K., Kentish, J. & Eysenck, M. (1995) Effects of psychological
treatment on cognitive bias in generalised anxiety disorder. Behaviour, Research and
therapy, 33, 293-303.
Mathews, A., Ridgeway, V. & Williamson, D.A. (1996) Evidence for Attention To
Threatening Stimuli in Depression. Behaviour, Research and Therapy, 34 (9), 695-705.
Mogg, K., & Bradley, B.P. (1998) A cognitive-motivational analysis of anxiety.
Behaviour, Research and Therapy, 36, 809-848.
Mogg, K. & Bradley, B.P. (2005) Attentional Bias in Generalized Anxiety Disorder and
Depressive Disorder. Cognitive Therapy and Research, 29 (1), 29-45
Mogg, K., Bradley, B. & Williams, R. (1995) Attentional bias in anxiety and depression:
The role of awareness. British Journal of Clinical Psychology, 34, 17-36.
Mogg, K., Bradley, B., Williams, R. & Mathews, A. (1993) Subliminal Processing of
Emotional Information in Anxiety and Depression. Journal of Abnormal Psychology,
102, (2), 304-311.
Mogg, K., Mathews, A., Bird, C. & Macgregor-Morris, R. (1990) Effects of stress and
anxiety on the processing of threat stimuli. Journal of Personality and Social
Psychology, 59, 1230-1237.

41
Mogg, K., Millar, N. & Bradley, B. (2000) Biases in Eye Movements to Threatening
Facial Expressions in Generalized Anxiety Disorder and Depressive Disorder. Journal of
Abnormal Psychology, 4, 695-704
Neitzert-Semler, C. & Harvey, A.G. (2005) Daytime functioning in primary insomnia:
does attentional focus contribute to real or perceived impairment? Behavioural Sleep
Medicine, 42 (12), 1403-1420.
Ohayon, M.M., Lemoine, P., Arnaud-Briant, V. & Dreyfus, M. (2002) Prevalence and
consequences of sleep disorders in a shift worker population. Journal of Psychosomatic
Research, 53, 577-583.
Perlis, M.L., Mendelson, W.B., Bootzin, R.R. & Wyatt, J.K. (1997) Psychophysiological
insomnia: the behavioural model and a neurocognitive perspective. Journal of Sleep
Research, 6, 179-188.
Posner, M.I. (1980) Orienting of attention. Experimental Psychology, 32, 3-25.
Rensink, R.A. (1997) Change detection. Annual Review of Psychology, 53, 245-
277.
Simons, D.J. (1997) Change blindness. Trends in Cognitive Sciences, 1, 261-267.

42
Spiegelhalder, K., Espie, C., Nissen, C. & Piemann, D. (2008) Sleep-related attentional
bias in patients with primary insomnia compared with sleep experts and healthy controls.
Journal of Sleep Research, 17, 191-196.
Tang, N.K.Y. & Harvey, A.,G. (2004) Correcting distorted perception of sleep in
insomnia: a novel behavioural experiment. Behaviour Research and Therapy, 42, 40-55.
Taylor, L., Espie, C.A. & White, C.A. (2003) Attentional Bias in People With Acute
Versus Persistent Insomnia Secondary to Cancer. Behavioral Sleep Medicine, 1, 200-
212.
Townshend, J.M. (2001) Attentional bias associated with alcohol cues: differences
between heavy and occasional social drinkers. Psychopharmachology, 157, 67-74.
Wicklow, A. & Espie, C. A. (2000) Intrusive thoughts and their relaonship to
actigraphic measurement of sleep: Towards a cognitive model of insomnia. Behaviour,
Research and Therapy. 38 (7), 679-693.
Williams, J.M., Mathews, A. & Macleod, C. (1996) The emotional Stroop task and
psychopathology. Psychological Bulletin, 120, 2-24

43
Woods, H., Marchetti, L.M., Biello, S.M. & Espie, C.A. (2009) The clock as a focus of
selective attention in those with primary insomnia: An experimental study using a
modified Posner paradigm. Behaviour Research and Therapy, 47, (3), 231-236.
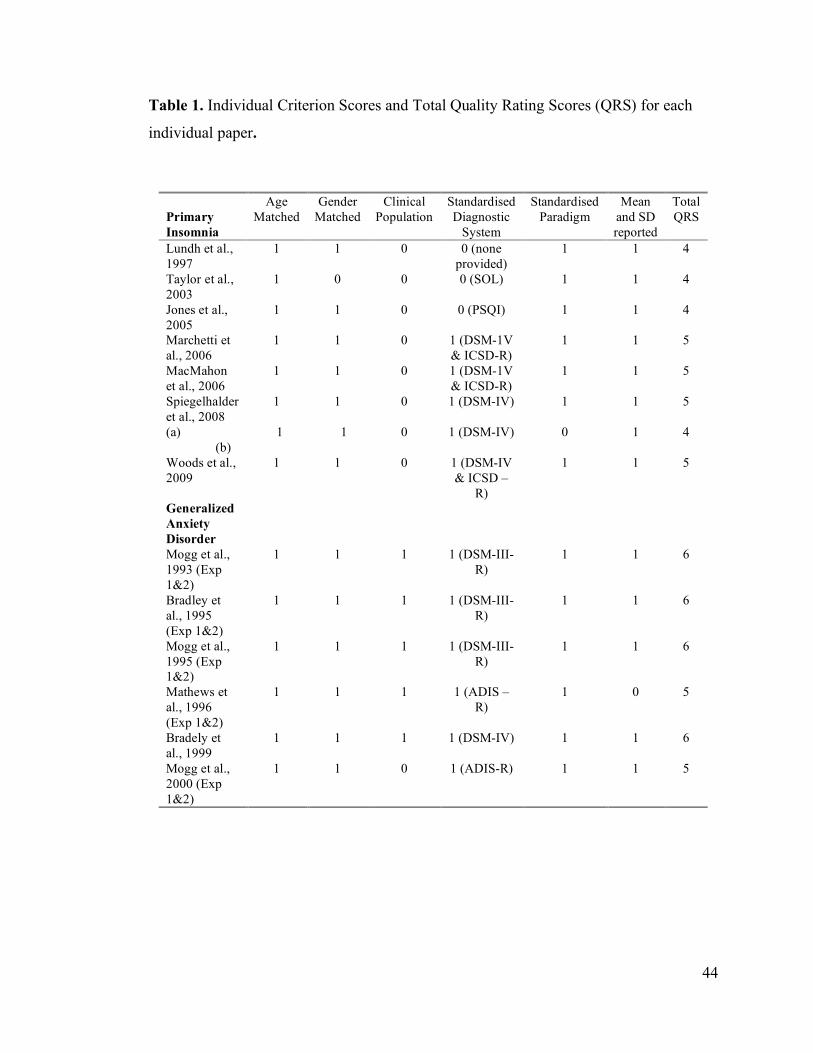
44
Table 1. Individual Criterion Scores and Total Quality Rating Scores (QRS) for each
individual paper.
Primary Insomnia
Age Matched
Gender Matched
Clinical Population
Standardised Diagnostic
System
Standardised Paradigm
Mean and SD reported
Total QRS
Lundh et al., 1997
1 1 0 0 (none provided)
1 1 4
Taylor et al., 2003
1 0 0 0 (SOL) 1 1 4
Jones et al., 2005
1 1 0 0 (PSQI) 1 1 4
Marchetti et al., 2006
1 1 0 1 (DSM-1V & ICSD-R)
1 1 5
MacMahon et al., 2006
1 1 0 1 (DSM-1V & ICSD-R)
1 1 5
Spiegelhalder et al., 2008 (a) (b)
1
1
1
1
0
0
1 (DSM-IV)
1 (DSM-IV)
1
0
1
1
5
4
Woods et al., 2009
1 1 0 1 (DSM-IV & ICSD –
R)
1 1 5
Generalized Anxiety Disorder
Mogg et al., 1993 (Exp 1&2)
1 1 1 1 (DSM-III-R)
1 1 6
Bradley et al., 1995 (Exp 1&2)
1 1 1 1 (DSM-III-R)
1 1 6
Mogg et al., 1995 (Exp 1&2)
1 1 1 1 (DSM-III-R)
1 1 6
Mathews et al., 1996 (Exp 1&2)
1 1 1 1 (ADIS – R)
1 0 5
Bradely et al., 1999
1 1 1 1 (DSM-IV) 1 1 6
Mogg et al., 2000 (Exp 1&2)
1 1 0 1 (ADIS-R) 1 1 5

45
Table 2. Methodological details, QRS, attention bias reported and calculated effect size
(PI vs. GS) for PI studies.
Study QRS Paradigm Utilized
Stimulus Type
Presentation Time
Comparison of interest
N (per
group)
Other groups
reported
Attention bias
effect reported
Effect Size
d
Lundh et al., 1997
4 Stroop Words
Information not provided
PI vs. GS PI=20 GS=20
N/A No** N/A
Taylor et al., 2003
4 Stroop Words
500ms Acute vs. Chronic insomnia
secondary to cancer
A=18 C=15
N/A Yes -0.445
Jones et al., 2005
4 ICB Flicker
Pictures OS (250ms) Mask (80ms CS (250ms)
poor vs. good
sleepers
PS=32 GS=32
Moderate Sleepers
Yes -0.470
Marchetti et al., 2006
5 ICB Flicker
Pictures OS (250ms) Mask (80ms CS (250ms)
PI vs. GS PI=30 GS=30
DSPS Yes -0.828
MacMahon et al., 2006
5 Dot Probe Words 500ms PI vs. GS PI=21 GS-20
DSPS Yes 0.3176
Spiegelhalder et al., 2008
5 Mixed Modality
Stroop
Pictures
Words
500-2500ms (M=1500)
500ms
PI vs. GS
PI vs. GS
PI=20 GS=20
Sleep-Expert Group
No
No***
N/A
N/A
Woods et al., 2009
5 Modified Posner
Pictures 250ms PI vs. GS PI=22 GS=22
N/A Yes 0.8672
* For Taylor et al., 2003 effect size reported relates to acute vs. chronic insomnia comparison. ** Although no between group effect, attention bias was reported for PI and GS towards sleep words. *** Although attention bias effect was significant between PI and Sleep Expert group it was non significant in PI and GS comparison.
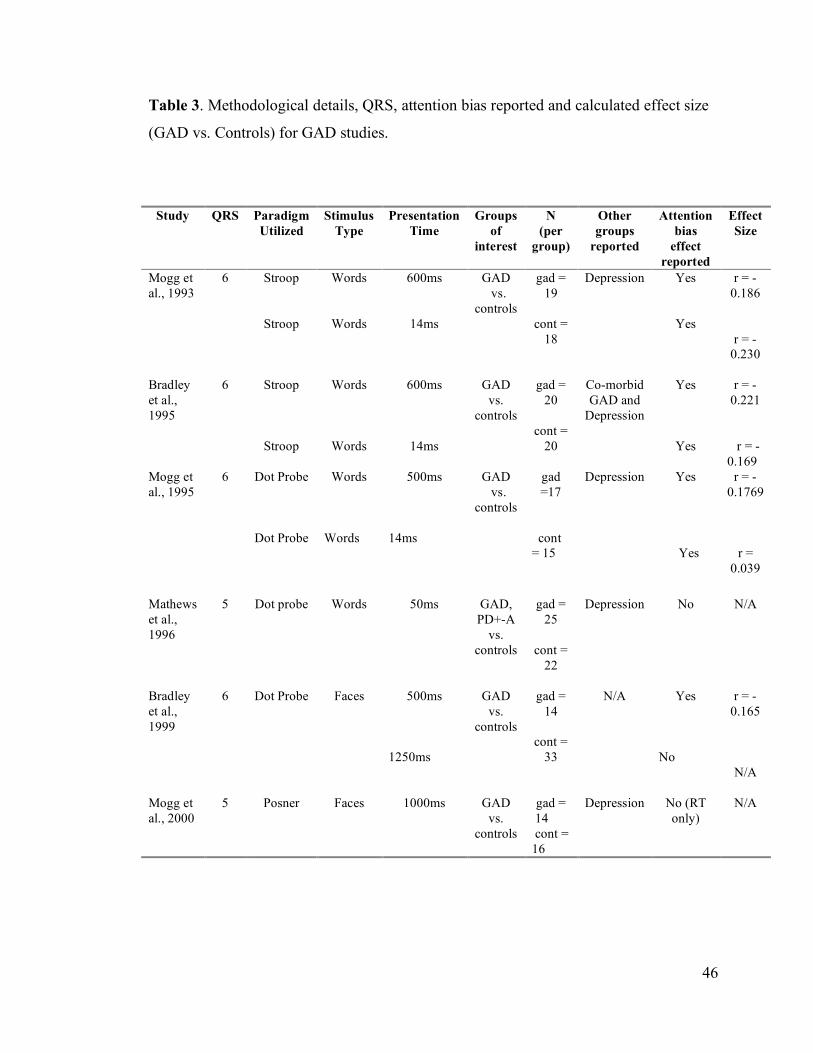
46
Table 3. Methodological details, QRS, attention bias reported and calculated effect size
(GAD vs. Controls) for GAD studies.
Study QRS Paradigm Utilized
Stimulus Type
Presentation Time
Groups of
interest
N (per
group)
Other groups
reported
Attention bias
effect reported
Effect Size
Mogg et al., 1993
6 Stroop
Stroop
Words
Words
600ms
14ms
GAD vs. controls
gad = 19
cont =
18
Depression Yes
Yes
r = -0.186
r = -0.230
Bradley et al., 1995
6 Stroop
Stroop
Words
Words
600ms
14ms
GAD vs.
controls
gad = 20
cont =
20
Co-morbid GAD and
Depression
Yes
Yes
r = -0.221
r = - 0.169
Mogg et al., 1995
6 Dot Probe
Dot Probe
Words
Words
500ms
14ms
GAD vs. controls
gad =17
cont = 15
Depression Yes
Yes
r = -0.1769
r = 0.039
Mathews et al., 1996
5 Dot probe
Words 50ms GAD, PD+-A
vs. controls
gad = 25
cont =
22
Depression No N/A
Bradley et al., 1999
6 Dot Probe
Faces 500ms
1250ms
GAD vs.
controls
gad = 14
cont =
33
N/A Yes
No
r = -0.165
N/A
Mogg et al., 2000
5 Posner
Faces
1000ms
GAD vs.
controls
gad = 14 cont = 16
Depression No (RT only)
N/A

47
Table 4. Comparison of mean values for PI and GAD.
% Attention Bias
Reported Mean Effect
Size (d)
Median Effect Size
(d)
Effect Size
range
Mean QRS
Mean N
PI 71% 0.585
0.47 0.55 3.57 PI = 38 GS = 22
GAD 66% 0.168
0.18 0.191 4.44 GAD = 18 Cont. = 20

48
CHAPTER TWO: MAJOR RESEARCH PROJECT
Investigating the Identification of Daytime Cognitive Deficits in People with
Psychophysiological Insomnia Relative to Good Sleeper Controls, Using the
Cognitive Failures Questionnaire and the Switching Attention Task.
Authors: Lauren M. Macphee1, Colin A. Espie1*
* Corresponding Author
Affiliation: 1Section of Psychological Medicine Division of Community Based Sciences University of Glasgow Gartnavel Hospital 1055 Great Western Road GLASGOW G12 0XH
E-mail: [email protected]
Prepared in accordance with submission guidelines for Behaviour, Research and
Therapy (See Appendix 2.1)
49
Abstract
Individuals suffering from psychophysiological insomnia (PI) commonly report the
experience of daytime cognitive deficits, such as poor concentration and an inability to
complete daily tasks. The published nomenclature is consistent and reflective of these
subjective accounts. However, to date there is little, or idiosyncratic, evidence of both
subjective and objective daytime deficits in people with PI. This current study aims to
assess whether daytime deficits can be detected in a PI population, through the inclusion
of The Cognitive Failures Questionnaire (CFQ), a novel subjective report measure
assessing everyday cognitive slips in functioning, and the Switching Attention Task
(SAT), an objective psychomotor assessment. This current study has demonstrated that
both the CFQ and the SATcomplex differentiate a group of PI from good sleeper
controls (GS). The study concludes that the CFQ is a useful inclusion to PI research and
provides more detailed evidence relating to the occurrence of daytime cognitive deficits
in PI, however a measure with a stable multifactor may be more beneficial in future
research. In addition, the significantly poorer performance of PI on the SATcomplex is
discussed in relation to high cognitive load rather than gross cognitive deficit, and results
from a SATsimple task and Digit Span Task aid this discussion and support the
conclusion that deficits in PI are observed in relation to tasks that require the
simultaneous activation of multiple cognitive resources.

50
1. Introduction
1.1 Background
Individuals suffering from Psychophysiological Insomnia (PI) commonly report the
experience of daytime cognitive deficits, such as poor concentration, poor memory, and
decreased ability to accomplish daily tasks (Roth et al., 2003, Grunstein et al., 2002).
Recent mass screening telephone surveys evidence that many people with untreated
insomnia report being too tired to do things (78%), having trouble remembering things
(59%), and report the experience of confused thinking and/or judgement (43%) (Ohayon
et al., 2004, Carney et al., 2006). The published nomenclature (International
Classification of Sleep Disorders - ICSD-2) is consistent and reflective of these
subjective accounts from people suffering the PI disorder, and include these
phenomenon in its description of insomnia as a disorder; the sleep complaint must occur
in association with adequate opportunity for sleep and the complaint of impaired
daytime function (e.g., difficulties with attention, and memory, and/or diminished
vocational functioning)( American Academy of Sleep Medicine, 2005).
Research examining these deficits in daytime functioning, in individuals with PI, has
increased significantly within the last ten to fifteen years. Indeed, both researchers and
clinicians have acknowledged that people with PI commonly report that the negative
impact to quality of life, associated with the daytime deficits, often out ways the night-
time frustrations associated with sleep initiation and maintenance difficulties (Fichten et
al., 1995, Morin, 1993, Rombaut et al., 1990). Indeed, in a recent review paper, Riedel
and Lichstein (2000) reported that due to the frequency and intensity of the daytime

51
deficits reported by PI, insomnia treatments, that at present are evaluated at outcome
through nocturnal sleep data, should also be evaluated at outcome by their effect on
daytime functioning. However, this outcome measure, at present, is rarely considered in
treatment efficacy studies.
Despite the consistency of patient self-report, and despite many authors utilizing both
subjective and objective measures to isolate the daytime deficits in PI populations,
studies have repeatedly reported inconsistent evidence for their detection. Indeed, studies
have considered, various, domains of daytime functioning in attempts to capture the
reported phenomenon i.e. daytime sleepiness, fatigue, physiological arousal,
psychopathology, general functioning and most recently cognitive and psychomotor
tasks. A brief outline of relevant literature focusing on these domains is provided below.
1.2. Daytime Sleepiness
Many studies have considered daytime sleepiness as an indicator of daytime deficit in PI
populations, and within this literature the Multiple Sleep Latency Test (MSLT) has
become the gold standard by which sleepiness is measured. In the MSLT, participants
are given the opportunity to nap for 20minutes on four or five occasions during the
daytime, and are instructed to attempt to fall asleep at each nap opportunity. The faster
the participant falls asleep, the greater the sleepiness inferred. However, within the PI
literature, many studies utilizing this measure have found no significant difference
between PI and controls (Edinger et al., 1997, Lichstein et al., 1994, Mendelson et al.,
1984, Pedrosi et al., 1995, Seidel et al., 1984, Stepanski et al., 1984, Sugerman et al.,
52
1985, Gass et al., 2001, Guilleminault et al., 2004), thus failing to confirm the predicted
hypothesis that daytime sleepiness would reliably differentiate PI from control groups.
Subjective daytime sleepiness has also been examined using the Stanford Sleepiness
Scale (SSS), which measures state sleepiness on a 7-point scale, and the Epworth
Sleepiness Scale (ESS), which asks respondents to rate the likelihood of falling asleep in
eight situations. In over half of the studies, utilizing the SSS, PI report greater subjective
sleepiness as compared to controls (Fichten et al., 1995, Hauri et al., 1997, Lichstein et
al., 1992, Lichstein et al., 1996, Mendelson et al., 1984, Schneider-Helmert, 1987,
Zammit et al., 1999, Danker-Hopfe et al., 2001, Alapin et al., 2000, Ohayon et al., 2002,
Belenky et al., 2003,). However, these studies recruited older adult populations and
college populations, and therefore researchers have argued that the direction of results
may be more suggestive of differences in lifestyle factors i.e. daytime napping, which is
commonly reported in these populations, than concrete evidence of daytime sleepiness.
Interestingly, in a study of middle-aged working adults assessed on daytime sleepiness
by the ESS, no PI/GS group difference was observed (Seidel et al., 1984), whereas in
two studies of college- aged adults, assessed also by the ESS, greater subjective
sleepiness within the PI population was observed (Lichstein et al., 1992, Alapin et al.,
2002). Taken together, these data sets would support the prediction that lifestyle factors
in populations that have greater opportunity to nap during the daytime may interfere with
the reporting of daytime sleepiness, and thus cannot be used as a reliable indicator of
real daytime deficit.

53
Furthermore, the experience and subsequent measurement of daytime sleepiness in
people suffering from PI does not provide scope for identifying the specific areas of
daytime functioning that PI experience deficits or the frequency of which they occur.
The general concept of sleepiness is useful in interpreting the overall feeling experienced
by PI throughout the day as a consequence of poor sleep, but it does not provide detailed
information about areas of functioning within which PI experience cognitive failures, or
the frequency with which they occur.
1.3. Fatigue
The experience of fatigue, commonly reported by individuals with PI, provides slightly
more robust findings in relation to group differences between people with PI and
controls. Investigators have used a variety of scales to measure fatigue in PI populations,
including the Fatigue Severity Scale (FSS, Krupp et al., 1989), the Fatigue Scale of the
Profile Mood States (POMS, McNair et al., 1981) and a rating scale measuring how
many days per week fatigue is experienced because of a lack of sleep (Fichten et al.,
1995). Over half of the studies comparing people with PI relative to controls have found
that people with PI reported significantly more fatigue (Hauri et al., 1986, Lichstein et
al., 1997, Means et al., 2000, Fichten et al., 1995, Dodd et al., 2004), with other studies
showing trends in the same direction but without reaching significance (Bonnet et al.,
1995, Seidel et al 1984, Stewart, et al., 2006). Indeed, a significant fatigue difference is a
more consistent finding than subjective sleepiness scores. However, it is premature to
conclude that daytime fatigue is consistently more associated with insomnia, as the only
three studies that included both subjective fatigue and sleepiness measures found higher

54
levels of fatigue and sleepiness in people with PI (Fichten et al., 1995, Means et al.,
2000) or no significant difference between PI and GS groups on both measures (Seidel et
al., 1984). Therefore, when subjective fatigue and sleepiness are measured within the
same sample of people with PI, similar results are found for each measure. In addition,
as previously discussed in relation to measurements of sleepiness, although the
measurement of fatigue is helpful in understanding the general physical and mental
feelings experienced by PI during the day, no detail with regards to the physical and
mental consequences of this fatigue is provided.
1.4. Measures of Psychopathology
Numerous studies have utilized measures of psychopathology in attempts to provide
possible explanations for the daytime complaints reported in PI. Such studies have
yielded inconsistent results. The Minnesota Multiphasic Personality Inventory (MMPI,
Hathaway and McKinley, 1967) has been used most commonly to compare depression
and anxiety symptoms in individuals with PI and controls. This literature includes
various studies that report significantly higher depression and anxiety in populations of
PI (Kales et al 1983, Levin et al., 1984, Levin et al., 1984, Coursey et al., 1975,
Schneider-Helmert, 1997, Maurizio, 2004, Stewart et al., 2006, Chellappa et al., 2007).
However, many other studies fail to report significant differences between the groups
(Bonnet et al., 1995, Seidel et al.,1984, Bonnet, 1995., Jones et al., 2006). Taken
together, however, with results from other psychopathology scales used within the PI
literature, namely the Beck Depression Inventory (BDI), the Profile of Mood States
(POMS), and that trait portion of the State-Trait Anxiety Inventory (STAI-T), data sets

55
suggest that mildly elevated depression and anxiety levels exist in people with PI relative
to controls. However, as a large proportion of the literature does not reliably differentiate
groups one must be cautious to conclude that elevated psychopathology is wholly
responsible for the daytime deficits reported by PI populations. Furthermore, often co-
morbid psychopathology is absent in PI populations, but daytime deficits are still
reported. This provides further evidence that psychopathology cannot account for all
daytime deficits experienced in PI populations.
1.5. Physiological Arousal
Studies considering physiological arousal as a proxy for differentiating people with PI
and controls have executed, pupillometry comparisons, metabolic rate comparisons,
temperature comparisons and pulse rate comparisons. Each comparison has reported
largely inconsistent results. Indeed, measures used to compare physiological arousal
between groups have found a mixture of increased arousal in PI (e.g. Lichstein et al.,
1992, Ellen, 2007), decreased arousal in PI (e.g Bonnet et al., 1995, Cirelli, 2006), and
no between group differences (e.g. Adam et al., 1986, Kraemer et al., 2001). Thus,
authors conclude that physiological arousal is unlikely to account for the daytime
deficits reported by individuals with PI.
1.6. Psychomotor and Neuropsychological Tasks
Several studies have utilised cognitive psychomotor and neuropsychological tasks to
examine daytime functioning in people with PI ( e.g. Bonnet et al., 1995, Church et al.,
1979, Edinger et al., 1997, Hauri, 1997, Mendelson et al., 1984, Pedrosi et al., 1995,

56
Schneider-Helmert, 1987, Seidel et al., 1984, Sugerman, 1985, Vignola et al., 2000,
Edinger et al., 2003, Schneider et al., 2004, Orff et al., 2007, Edingder et al., 2008).
These tests extend the measurement of daytime deficits in PI to the objective domain.
Typically, these studies have used a number of cognitive measures to compare groups
following a night of polysomnography (PSG); i.e. digit symbol substitution, pegboard
test, card sorting, addition, logical reasoning, divided attention, visual vigilance, line
tracing, long term memory, short term memory, simple reaction time tasks, complex
reaction time tasks, continuous performance task, and auditory vigilance. Mixed data
sets have been reported for short term memory (Church et al., 1979, Mendelson et al.,
1984, Hauri, 1997,), long term memory (Mendelson et al., 1984), simple reaction time
(Mendelson et al., 1984, Edinger et al., 1997, Hauri, 1997, Scheider et al., 2005),
complex reaction time (Pedrosi et al., 1995, Hauri, 1997, Edinger et al., 2003),
continuous performance task (Mendelson et al., 1984, Edinger et al., 1997, Edinger et
al., 2003, Varkevisser, et al., 2005), auditory vigilance (Schneider-Helmert, 1987,
Sugerman et al., 1985, Hauri, 1997, Vignola et al., 2000). However, variations in the
methodological procedures utilized within these studies, is largely variable. In addition,
no significant group differences have been reported for any other measure.
In one of the most recent studies (Orff et al., 2007), Orff and colleagues investigated
both subjective and neuropsychological measures of daytime impairment in people with
PI and good sleepers (GS), with the aim to assess whether the groups differ on both
measures, and the extent to which subjective and objective measures provide discordant
information. Overall, the PI group reported worse sleep, diminished activity levels, and a

57
greater number and severity of daytime complaints. However, the PI group did not show
deficits on neuropsychological measures (i.e. motor speed, attention, verbal fluency,
verbal learning and memory), and these neuropsychological measures were not
associated with severity of daytime complaints. Additionally, PSG data did not
significantly differ between PI and GS and thus the authors report this lack of objective
group differentiation as a clear limitation to the study. However, the authors also
acknowledge that even if the experimental groups had been objectively validated, the
neuropsychological tests selected may not have been sensitive enough to pick up group
differences. When considering this point in further detail, it seems appropriate to
hypothesis that within a PI population one would not expect gross cognitive deficits but
rather mild deficits which would require employment of sensitive neuropsychological
assessment measures capable of capturing subtle but significant group differences. From
the neuropsychological perspective there is therefore a lack of adequate characterisation
of the cognitive deficits shown by PI, due in part, arguably, to inadequate measures
applied.
The most recent study assessing deficits in neuropsychological assessment performance
in people with PI also highlight the limitations of previous methodologies, mainly
discussing the employment of a limited range of neuropsychological tests, as well as
commenting on small and poorly characterised samples (Edinger et al., 2008). Within
this study, a large well-characterised PI group represented the experimental population,
and predictions were made that this group would perform significantly worse than GS
group on neuropsychological performance measures with group differences being most
58
obvious on more complex tasks. Thus, this study took into account the suggestion that
sensitive neuropsychological assessment may be required to observe daytime deficit in
PI populations. The neuropsychological assessment battery included a simple reaction
time test, a continuous performance test (sustained attention) and two switching attention
tests (SAT), with the view that these represent a hierarchy of complexity, with the latter
of the two SAT being the most complex. Additionally, it was predicted that measures of
daytime sleepiness, as measured by the MSLT and SSS, would also differentiate the PI
group from the GS group, with PI being significantly sleepier than GS. The authors
concluded that group differences were only observed on the most complex
neuropsychological task (SAT). The authors suggest that because this complex SAT
involved concentration, attention, response inhibition and decision-making processes,
thus generating a high cognitive load, this collection of abilities may closely
approximate the deficits PI sufferers present clinically when they complain of an
inability to concentrate and a general lack of mental sharpness. In addition, the authors
suggest that tests like the SAT, that engage a number of cognitive resources, may be
required to identify performance deficits in PI sufferers (Edinger et al., 2008). This
observed performance deficit in PI in response to a complex SAT assessment is a useful
finding, as it highlights the possibility that PI experience daytime deficits when
numerous cognitive functions are drawn upon simultaneously. Indeed, previous failure
to capture deficits in PI using more global measures of cognitive functioning e.g.
memory, is not surprising, because if gross cognitive failures were the consequence of
poor sleep, then obvious slips in daytime functioning would be readily observed across
the PI population. However, the authors also acknowledge that future experimentation
59
should aim to replicate this novel finding with other PI populations before firm
conclusion can be drawn.
Subjective assessment of daytime sleepiness was inconsistent within this study. More
specifically, PI scored as being more alert in the MSLT than the GS controls, a finding
contradictive to the hypothesis. However, the PI group did report significantly greater
sleepiness ratings than GS, as measured by the SSS. Edinger and colleagues suggest that
the direction of the MSLT and SSS data reflects the hyper-aroused nature of the PI
population, and their inability to de-arouse during the sleep initiation process despite
higher levels of sleepiness. However, inconsistencies between objective and subjective
measures of daytime deficits in PI are not overly surprising. Indeed, if we are to consider
the nature of the objective and subjective assessment measures for daytime deficits in PI
i.e. highly specific (objective) versus general concept (subjective questionnaire), it is not
surprising that they fail to associate with each other. Indeed often in clinical practice
objective and subjective accounts fail to correlate with one another. Furthermore, often
subjective measures of complaint produce higher effect sizes between groups than
objective measures, and this reflects the ability for subjective questionnaires to capture
the more general concept of the complaint as opposed to it’s specific features. The SSS
and MSLT also have limitations with respect to the nature and specificity of the
information they capture. More specifically, although both provide general measures of
experienced sleepiness, neither measure produce detailed information relating to the
specific daytime situations within which deficits occur, or the frequency within which PI
experience cognitive deficits. Indeed, inclusion of a more detailed subjective measure,
60
which is sensitive to capture commonly experienced daytime failures across clinical
populations, would be a useful and novel inclusion to PI research.
Thus, the inconsistency of the available literature utilizing cognitive neuropsychological
tasks adds value to the administration of a standardised complex neuropsychological task
in attempts to objectively evidence daytime cognitive deficits in people with PI relative
to good sleeper controls (GS). Indeed, administration of computerised
neuropsychological tasks that have been standardised across various populations is novel
within the PI literature. As the previous literature suggests that complex
neuropsychological tasks, that engage multiple cognitive resources simultaneously, are
sensitive enough too differentiate PI from GS, a complex SAT will be examined within
this current study. Furthermore, as previous research assessing cognitive
neuropsychological performance in PI have only included indices that capture the
subjective reporting of daytime sleepiness, the inclusion of a structured self-report
measure that adequately captures everyday cognitive failures would be advantageous.
Indeed, with respect to the previously mentioned nomenclature, which highlights the
failures in vocational functioning that are experienced daily in PI populations, it seems
that the inclusion of a validated and reliable subjective self-report measure, specifically
assessing failures in everyday daytime functioning, would be an appropriate and novel
inclusion to PI research, and would be sensitive in differentiating PI from GS.
61
2. AIMS AND HYPOTHESES
2.1 Aims
This current research aims to profile, evaluate and compare self-reports of everyday
cognitive performance and objective psychometric neurocognitive performance in
people with PI relative to GS controls.
2.2 Hypotheses
1) PI and GS will significantly differ on subjective measure of daytime deficit, with PI
reporting significantly more cognitive failures relative to GS.
2) PI and GS will significantly differ on objective measure of daytime deficit, with the PI
performance being significantly poorer relative to GS.
A secondary question within this current study will explore whether standardised relative
effect size between PI and GS on the self-report measure will be larger than the
standardised relative effect size for the objective measure. (Cohen’s effect size; large =
0.8, medium = 0.5, small = 0.2).
A final question within this current study will explore the extent to which there is a
relationship between the highly specialist assessment of cognitive deficit (i.e. objective
assessment) and the more general concept of cognitive failures (subjective assessment).

62
3. METHOD
3.1 Design
This study is a cross-sectional between groups experimental research design. The initial
analysis will assess between group differences on subjective and objective measures of
daytime deficit, i.e. a 2x2 entirely between group comparisons with covariates entered if
appropriate to control for e.g. age. The relationship between the subjective and objective
measures will be examined using a correlation analysis. Scores on the subjective and
objective measures will act as the dependent variable.
3.2 Inclusion and exclusion Criteria
3.2.1 Selection Criteria for All Participants
All subjects were required to be medically healthy and free from substance abuse
problems, psychiatric disorders and sleep disorders (other than PI), as assessed by the
screening interview.
3.2.2 Selection Criteria for Psychophysiological Insomnia
Participants were required to meet combined DSM-IV-TR and ICSD-R criteria for
primary insomnia of the PI type, and were required to score > 6 on the Pittsburgh Sleep
Quality Index (PSQI) with a self confessed sleep disruption of greater than 6 months.
The PSQI and is a standard measure, and was recently endorsed at an NIH-sponsored
Consensus Meeting to establish a ‘core’ assessment battery for use in insomnia research
studies (Buysse et al., 2006).

63
3.2.3 Selection Criteria for Good Sleepers
Good sleepers were required meet Research Diagnostic Criteria (RDC) for good sleep.
GS were required to score < 5 on the PSQI, and report themselves as being ‘good’
sleepers. In brief, they were required to have no history or symptoms of sleep disorder
and report that they obtain enough restorative sleep. GS exclusion criteria also included
good sleep quality as a result of active psychological or drug intervention.
3.3 Sample Size Estimation
Research to date examining subjective and objective cognitive functioning in
populations with PI has varied greatly from 15 ( Krupp et al. 1989) to 98 ( Seidel et al.
1984). To date, the relationship between the CFQ and PI has not been specifically
examined; therefore a conservative estimate of a medium effect size was adopted
(d=0.5). Using the G * Power 3 (Faul et al., 2007) software programme, with a medium
effect size of r=0.5, β =0.80 and α= 0.05, a total sample size of N=149. Given the strict
exclusion and inclusion criteria and resulting homogeneity of the participant group, as
well as the adequate reliability and validity of the primary measures being utilised, it was
expected that this sample size would be sufficient to detect differences if they exist.
3.4 Participants
Twenty-six PI and 26 gender and education level matched GS were included in analysis.
All had English as their first language. Recruitment of the PI participants followed the
University of Glasgow Sleep Centre (UGSC) core generic approach to recruitment,
which included recruitment from 1) the local sleep disorder services 2) via
64
advertisements in local news papers, television broadcasts and radio interviews and 3)
directly from 20 local primary care practices through coordinator SPPIRe (Scottish
Practices and Professionals Involved in Research). The UGSC laboratory based
screening of the PI participants also followed a generic protocol. One hundred and
twelve interested participants were called by the primary investigator for telephone
screening. Of these one hundred and twelve PI participants thirty-nine were recruited to
the current study. Exclusion of participants at this stage resulted from 1) sleep disorders
other than PI, 2) disinterest in entering the current study, 3) co-morbid physical or
mental illness and 4) travelling costs. Of the thirty-nine recruited to the current study,
nine failed to attend the subsequent testing appointment at the UGSC and four
participants were excluded from analysis due to the PSQI score being <5.
The good sleeper (GS) group within this current study represented a convenience
sample. This group consisted of the partners of people with PI who enrolled into the
current study, as well as members of staff at the Sackler Institute of Psychobiological
Sciences at the Southern General Hospital in Glasgow.
3.5 Measures and Materials
An overview of all measures, including measures used for diagnostic ascertainment of
sleep quality, is presented in Table 1.

65
__________________________
INSERT TABLE 1 HERE
__________________________
3.5.1 Demographic
Demographic information include age, gender, and number of years in education.
3.5.2 Diagnostic Ascertainment of Sleep Quality.
The UGSC laboratory based screening of the PI participants follows a generic protocol.
Participants interested in taking part in research at the UGSC are instructed to call the
UGSC recruitment telephone number. This number diverts to a voicemail facility, which
instructs participants to provide their name and telephone number in order for the
primary investigator to return their call and administer a telephone-screening interview
(Appendix 2.2). During the period of recruitment for this current study, over one
thousand calls were made to the recruitment telephone-number. One hundred and twelve
interested participants were called by the primary investigator for telephone screening.
Each participant was interviewed with the telephone-screening interview to evaluate his/
her typical sleeping pattern. The telephone-screening interview consists of a
comprehensive assessment of sleep quality, physical health and psychiatric health. The
interview is constructed around the DSM-IV-TR and ICSD-R standardised diagnostic
systems for insomnia, and asks questions in relation to the inclusion/exclusion criteria
for the current study (See section 3.2 for inclusion/exclusion criteria). Completion of the
interview took, on average, approximately twenty-five minutes. Upon completion of this
66
interview, the primary investigator either invited the participant to take part in the
current experiment, or thanked the participant for their time but informed them that they
did not meet criteria for the current experiment. Those who did not meet inclusion
criteria were given the option of having their details stored on a generic database in order
for possible enrolment in future studies at the UGSC. Additionally, the Pittsburgh Sleep
Quality Index (PSQI; (Buysse et al., 1989) was used to confirm group allocation.
Participants also completed a standard sleep diary (Espie, 1991) for seven nights prior to
the experiment, again to aid in confirmation of group assignment (Appendix 2.3). The
sleep diary is a short questionnaire that is completed upon wakening. This questionnaire
provides important information about the participant’s personal subjective account of
their previous nights sleep. The sleep diary provides information to the experimenter
about the participants subjective Sleep Onset Latency (SOL – how long it takes
participants, in minutes, to fall asleep at night), Total Sleep Time (TST – How long, in
hours, did the participant sleep in total during the night) and Wake Time After Sleep
Onset (WASO – How long the was the participant awake for during the night, in total).
3.5.3 Additional Sleep Measures
Each participant also completed the Stanford Sleepiness Scale (SSS). The SSS is a self-
report rating of state sleepiness i.e. how sleepy the participant feels at the current time.
This was recorded immediately prior to the onset of the neuropsychological assessment
battery to establish the patients perceived sleepiness at time of assessment.
67
3.5.4 Assessment of Psychopathology
Psychopathology was evaluated using the telephone-screening interview, the Quick
Inventory of Depressive Symptoms and the Spielberg State-Trait Anxiety Inventory.
The Quick Inventory of Depressive Symptoms (QIDS, Rush et al. 2003) is a 16-item
questionnaire designed to assess the severity of depressive symptoms. The QIDS is
available in the clinician (QIDS-C16) and self-rated versions (QIDS-SR16). The latter
was employed in this current study. The QIDS assess all the criterion symptom domains
designated by the American Psychiatry Association Diagnostic and Statistical Manual of
Mental Disorders - 4th edition (DSM-IV) (APA 1994) to diagnose a major depressive
episode. This assessment can be used to screen for depression, although they have been
used predominantly as measures of symptom severity.
The Spielberg State-Trait Anxiety Inventory is a reliable and valid scale of both state
and trait anxiety. This measure is not used as a diagnostic tool, but rather to aid in
capturing symptom severity. Alpha coefficients (STAI-S α =. 93 & STAI-T α = .90)
reflect strong internal consistency and construct, concurrent, divergent and convergent
validity have also been demonstrated (Spielberger, 1983).
3.5.5 Subjective Daytime Deficit Measure
In order to assess everyday cognitive performance problems, a measure was sought that
would be valid for this purpose. The Cognitive Failures Questionnaire (CFQ, Broadbent
et al., 1982) was selected because it was specifically developed to measure self-reports
68
of real life problems of this type. The CFQ has been reported to have good discriminant
validity as it has demonstrated to differentiate the frequency of cognitive failures, as
compared to healthy controls, in depression (Wagle et al., 1999), the elderly (Knight et
al., 2004), multiple sclerosis (Phillips et al., 2009) and individuals who are suffering
from stress (Broadbent et al., 1982). It was predicted that the CFQ would be sensitive in
detecting differences between PI and GS groups. The CFQ is typically used as a unitary
scale, and support for this comes from Broadbent et al., (1982), who conducted a number
of factor analytic studies and concluded that there was good evidence for a general
factor, but that the multifactor structure was unstable. The response format uses a 5-point
likert-type scale (0=never, 4=always). Scores for the CFQ can range from 0 to 100 with
higher scores signifying a greater number of cognitive failures. Assessment of the CFQ
with the general (healthy) population suggests that scores between 25 and 35 are typical
(Wagle et al., 1999). All items on the CFQ are positively correlated with each other and
the CFQ has good concurrent validity and been correlated with several other measures:
Short Inventory of Memory Experiences (r=.74; Martin, 1983), Absentmindedness in
Shops Questionnaire (r=.46; Reason & Lucas, 1984), and Cognitive Interference
Questionnaire (r=.34; Yates et al., 1985). The CFQ has been demonstrated to have high
internal consistency, α = .90, which further supports its use as a single construct measure
(Broadbent et al., 1982).
3.5.6 Objective daytime Deficit Measures
Several factors were taken into consideration in selecting measures in this domain. First
it was important to select a task that would represent the complex cognitive challenge

69
that has proven to discriminate PI in previous studies. The switching attention task
(SATcomplex) was chosen as it has recently been reported to differentiate PI from GS
controls (Edinger et al., 2008). The SATcomplex was employed because it involves
sensory-motor, attention, concentration and executive functioning, a range of cognitive
processes that generate a high cognitive load. As it is assumed that PI experience
daytime failures in tasks that rely on a high cognitive load, it is assumed that the
performance of PI will be significantly poorer relative to GS. In the SATcomplex,
alternating numbers and letters must be connected in chronological sequence on a touch
screen (Figure 1).
__________________________
INSERT FIGURE 1 HERE
__________________________
Second, it was important to have a comparator task, within the same domain, to establish
whether or not it was complexity as such that was responsible for any observed effect.
Thus, the SATsimple was also completed. In the simple version, numbers appear on the
touch-screen and the participants must connect the numbers sequentially in
chronological order. The inclusion of the SATsimple task was to aid in the interpretation
of the SATcomplex results. More specifically, as the SATsimple is the closest task
control to the SATcomplex, however the SATsimple requires fewer cognitive functions
70
therefore it is not expected to differentiate PI from GS, thus supporting the argument that
high cognitive load leads to observable deficits in PI populations.
Finally, having considered the importance of attentional measures, it was important to
control for the possibility of any general cognitive differences being responsible for
effects. A standard memory task was thought to be appropriate here. Thus, participants
also completed a Digit Span Task. Within this task, participants are required to
remember a list of numbers that are presented on the screen. The list of numbers is
presented for a few seconds before disappearing from view. Participants are required to
type on a keypad on the touch screen the list of numbers that had previously appeared.
The list of numbers increases by one number on every second trial. This task has a
‘forward’ version within which the participant has to type the numbers in the sequence
they appeared on the screen, and a ‘backward’ version, within which the participant is
required to type the numbers in reverse sequence to how they appeared on the screen.
This task is a test of working memory, which represents a gross cognitive function.
Inclusion of a digit span task is again to aid in the interpretation of the SATcomplex
results. More specifically, its inclusion is a further manipulation check to assess
cognitive functioning across domains of measurement, and support the prediction that
that daytime deficits in PI are observed when there is a high cognitive load, rather than a
gross deficit in cognitive functioning. Thus it is predicted that the Digit Span Task will
not differentiate PI and GS groups.
71
The SATcomplex, SATsimple and Digit Span Task are part of a full neuropsychological
assessment system called Integ-Neuro. This system was chosen because it is automated
standardised neuropsychological assessment package that is currently recognised and
utilized by more than one hundred and thirty laboratories worldwide1. The Integ-Neuro
system provides behavioural measures of the five core general cognitive domains;
sensory-motor, attention, memory, language, executive function and social cognition.
One advantage of the Integ-Neuro assessment battery relates to it’s standard procedure
for test administration. It escapes the limitation of clinician error in delivering the tests.
All data generated from the Integ-Neuro is automatically uploaded to a central database.
Researchers can request data sets and carry out clinical comparison. Within this current
study, only the data generated from the PI and GS recruited for the study purpose were
requested for analysis. The battery consists of sixteen different tasks, however this
current study was concerned with only the SATcomplex, SATsimple and Digit Span
Task.
Participants recruited to the study completed the objective assessment under controlled
conditions in the same quiet isolated ‘bedroom’ laboratory with the UGSC. Testing
sessions occurred between the hours of 09:00 and 16:00 at a time convenient to the
participant. Research has shown that circadian phase has no effect of daytime cognitive
performance in PI compared to GS and thus timing of testing was not deemed to be a
necessary control (Varkevisser et al., 2005).
1 The INTEG NEURO system follows a standard procedure. This manual for the procedure can be found in Brain Resource Cognitive Setup Guide (accessed via www.brainresource.com)
72
3.6 Procedure
Participants who where invited to take part in the current study following the telephone
screening interview, arranged, with the principle investigator, a suitable time to attend
the UGSC for testing. Additionally at this time, a participant information sheet, a
participant consent form, a PSQI and a sleep diary were posted to the participant’s
address. Participants were requested to complete this documentation and bring it with
them on the scheduled day of testing.
Upon arrival at the UGSC participants were greeted by the principle investigator and
taken to a quiet ‘bedroom’ laboratory where the Integ-Neuro system was assembled.
Before sitting at the Integ-Neuro touch-screen, participants were asked to return the
documentation that had been posted to them and were given the opportunity to ask any
questions. Following this, the participant was asked to complete the Stanford Sleepiness
Scale. Subsequently the participants were asked to complete the Integ-Neuro assessment
battery. At the end of the assessment battery, participants were offered a brief rest before
being asked to complete the CFQ, QIDS, and STAI. After completion of the named
questionnaires each participant was instructed that this was the end of the experiment.
Each participant was then provided with an hour therapy session, within which the
principle investigator discussed strategies that aim to improve sleep quality and duration.
This session was based around Cognitive Behaviour Therapy for Insomnia. The whole
procedure at the USGS took approximately two and a half hours.

73
3.7 Ethical Approval
Ethical approval for the project was granted from the Greater Glasgow and Clyde
Primary Care Community & Mental Health Research Ethics Committee (See Appendix
2.4 for a copy of the approval letter).
4. RESULTS
4.1 Participant Characteristics
The mean age across all participants was 39.9 years with a total of 20 males and 32
females. Pearsons Chi-Square analysis indicated that the number of males and females
was not different across groups (χ2= .325, p = .57). Table 2 shows the demographic
characteristics by group. The PI group was 12.4 years older than the GS group, a
difference that was statistically significant, (t = 3.28, p < 0.01). It has previously been
reported that age affects cognitive performance, thus it was predicted that within the
current sample age would correlate to SATcomplex RT performance. A correlation
analysis between age and RT scores on the SATcomplex was performed revealed a
significant positive association between age and RT on the SATcomplex, (Pearson’s r =
.648, p< 0.01), with increasing age associated with a slowed RT. Thus, subsequent
analyses of group difference were performed utilising an analysis of covariance
(ANCOVA), with age as a covariate.
There was no difference between groups on education levels (as measured by total years
in education), (t = .92, p = .36) although PI had a slightly larger mean number of years
than GS. However, due to the fact that at the level of the individual there may be as
74
association between education level and cognitive performance, a conservative decision
was made to control for education in the following ANCOVA analyses.
__________________________
INSERT TABLE 2 HERE
__________________________
4.2 Screening and Clinical Measures
The mean scores, standard deviations and group difference data for each screening and
clinical measure are presented in Table 3. As expected, those in the PI group scored
significantly higher on the PSQI than the GS group (F(1, 50) = 64.5, p<0.0001). On the
sleep diary, Total Sleep Time (TST) was significantly lower in the PI group than the GS
group (F(1, 50) = 22.7, p<0.0001). Wake Time After Sleep Onset (WASO) (F(1, 50) =
14.6, p<0.0001) was significantly higher in the PI group than the GS group, as was Sleep
Onset Latency (SOL) (F(1, 50) = 7.4, p<0.0001). Thus, all diary data provided
descriptive confirmatory support for group allocation. Scores from the sleep diary for the
total number of hours slept on the night prior to testing revealed that PI slept
significantly less than GS (F(1, 50) = 21.8, p<0.0001).
Scores on the QIDS, STAI-S and STAI-T were also in the expected direction with no
significant differences observed between groups on either measure, (p = .052; p = .415;
p = .750, respectively), therefore confirming good application of the exclusion criteria.
75
No significant differences were observed between the PI and GS groups in SSS score (p
= .232).
__________________________
INSERT TABLE 3 HERE
__________________________
4.3 Experimental Data
Hypothesis;
1) PI and GS will significantly differ on the subjective measure of daytime cognitive
deficit, with PI reporting significantly more cognitive failures relative to GS.
The Cognitive Failures Questionnaire was employed as a subjective account of daytime
deficit. The ANCOVA produced a significant model (F (3, 50) = 2.739, p = .054).
Neither covariate (age or education) contributed significantly (Appendix 2.5) As
predicted the group main effect was significant, with the PI group reporting significantly
more daytime cognitive failures than the GS group, (F(1, 50) = 8.0, p<0.05) (Table 3).
The mean value of the GS control group is in line with previous data that report CFQ
mean scores in the general, healthy, population lie between 25 and 35 (Wagle et al.,
1999).
Assessment of internal consistency for the CFQ was also conducted. Cronbach’s alpha
of .95 indicate high internal consistency. When repeating this analysis for each item
76
deleted, alpha ranged between .947 and .951, this is in line with previous research
(Broadbent et al., 1982)
2) PI and GS will significantly differ on the objective measure of daytime deficits with
the PI performance being significantly poorer relative to GS.
i) SATcomplex
The ANCOVA produced a highly significant model (F(3, 50) = 10.783, p < 0.0001),
with age contributing considerably (p = 0.001). However, there was still an effect of
group (F(1, 50) = 5.5, p<0.05). Looking at the results descriptively, this group main
effect reflects a mean difference of approximately 1 SD, with PI being significantly
slower than GS as hypothesised (Table 4), (Appendix 2.5). Additionally, PI made
significantly more errors than GS, (F(1,50) = 5.8, p<0.05). The calculated effect size for
this comparison is d = 1.3.
ii) SATsimple
The prediction that PI, in comparison to GS, would be reliably impaired on the
SATcomplex was based on the assumption that, when simultaneously engaging
numerous cognitive functions, PI experience more deficits. To assess this prediction
further an ANCOVA was also performed for a SATsimple, as the SATsimple is the most
closely related control to the SATcomplex, however the SAT simple engages fewer
cognitive functions. This secondary hypothesis predicted that no group differences
would be observed.

77
The ANCOVA produced a significant model (F(3, 50) = 3.369, p = .026) with age as a
significant contributory factor to explanatory variance in the equation (p = .026).
However, in line with the hypothesis, there was no significant difference between the PI
and GS groups (p = .35) (Appendix 2.5). Additionally, there was no significant group
difference in error rates (p = .243) (Table 4). The calculated effect size for this
comparison is d = 0.4.
iii) Working Memory
A final manipulation analysis of the experimental data was also carried out. This relates
to the previous discussion that gross deficits in cognitive function are not predicted in
the PI population, as it is postulated that deficits in PI performance will only relate to
situations that simultaneously engage multiple cognitive resources. To assess this
prediction, data relating to an assessment of memory, specifically working memory, was
also analysed. It was hypothesised that no group differences would be observed.
The ANCOVA produced a non-significant model (F (3, 50) = .407, p = .748), (F(3, 50) =
3.32, p = .802), forwards and backwards version, respectively. Neither covariate
contributed significantly for both versions (Appendix 2.5). Thus, as predicted, the results
from the ANCOVA, controlling for age and years of education, revealed no significant
differences between the PI and GS groups on digit span forwards, (p = .40), and digit
span backwards, (p = . 93) (Table 4) (Appendix 2.5). The calculated effect size for this
comparison is d = 0.2.

78
__________________________
INSERT TABLE 4 HERE
__________________________
3) The standardised relative effect size between PI and GS on the self-report measure
will be larger than standardised relative effect size for the objective measure. (Cohen’s
effect size; large = 0.8, medium = 0.5, small = 0.3).
Effect sizes were calculated using the equation; d = M1 – M2/s and the online effect size
calculator http://web.uccs.edu/lbecker/Psy590/escalc3.htm was used to complete the
calculations. As predicted, effect on the variable for PI relative to GS was d =.48 for
CFQ and d =.36 for SATcomplex. Therefore, the direction of the effect sizes between
the two measures of daytime deficit is therefore in the expected direction with the CFQ
producing a larger effect size than the SAT. In addition, effects on the variable for PI
relative to GS was d = .28 for SATsimple and d =.21 for Digit Span Task.
Secondary Analyses
It was previously discussed that subjective measures of daytime deficits rarely associate
to objective measures of daytime deficit. Thus, assessment of the relationship between
subjective and objective measures of cognitive deficit was conducted.
A Pearson’s correlation analysis was used to examine the relationship between the CFQ
and SATcomplex, controlling for age and years of education. No significant association
was observed (Pearson’s r = .234, (r2 = 5.5%), p = .271). Thus, the SATcomplex
explains only about 5.5% of the variance in the CFQ. Analysis assessing the relationship
79
between each of the 25 items of the CFQ with the SATcomplex was also conducted. No
significant correlations were observed.
5. DISCUSSION
This study aimed to assess the subjective reporting of daytime cognitive deficits and the
objective performance on a standardised cognitive neuropsychological task in people
with PI relative to GS controls. Three primary hypotheses were assessed, all of which
were confirmed.
Firstly, in relation to the fact that previous neuropsychological research has only
reported subjective accounts of daytime sleepiness, thus failing to provide any detailed
information regarding the frequency of daytime deficits experienced by PI as a
consequence of poor sleep, the inclusion of the CFQ to this current study was used to aid
in the understanding of this daytime experience. Indeed, it was predicted that the CFQ
measure would be sensitive enough to differentiating PI from GS as it enabled PI
participants to individually rate twenty-five statements of everyday occurrences with
respect to how commonly they make mistakes in each. The CFQ provided scope for
capturing a more meaningful and detailed representation of the real life daytime
consequences of insomnia. As predicted, the PI group reported significantly higher
levels of daytime cognitive failures than the GS group, reporting overall a moderate
level of cognitive failures.
80
Assessment of other clinical populations with the CFQ has previously been reported and
comparisons with the findings from this current study can be made. Sullivan et al.,
(2007) reported scores on the CFQ for ninety-eight individuals with major depressive
disorder. The mean score of fifty from this depressed clinical population is largely
comparable with the mean score of forty-eight from the PI population within this current
experiment, although the number of participant within this current study is significantly
less than that reported in the Sullivan et al., study. The presence of depression within PI
populations is high, and recent research has demonstrated that PI is often a precursor to
depression (Chang et al., 1997), in that if the insomnia is left untreated depression is
likely to develop. This suggestion leads to the consideration that the higher scores
generated by the PI group within this current study might relate to the presence of
depression within this population. However, no significant differences were observed
between PI and GS on the QIDS, and neither the PI or GS groups scored within the
moderate, severe, or very severe depression level, thus neither met clinical criteria for
depression. In addition, screening on the telephone interview asked specific questions in
relation to affective state, and inclusion to the study was dependant on both groups of
individuals being free from clinical diagnosis of depression and anxiety and free from
actively taking medication for associated psychopathology. Taken together, the absence
of depressive symptomatology in the PI and GS groups, that would rate them above
clinical threshold for diagnosis, suggests that the daytime deficits observed within the PI
group are reflective of their poor sleep quality, rather than effects of underlying
depressive psychopathology.
81
It is important to note that the depression measure employed within this current
experiment incorporates questions relating to sleep symptomatology. On reflection, such
a measure may skew results from PI groups as they are likely to score higher on these
sleep questions that the GS control. This would result in the PI group appearing more
depressed than the GS group, when in reality they are merely reporting the experience of
sleep disruption, not sleep disruption as a consequence of depression.
It is also worth noting that in comparison to a clinical population with significant brain
atrophy, e.g. individuals with multiple sclerosis who would unarguably have
significantly more daytime cognitive failures than PI, the PI group within this current
study reported significantly less daytime cognitive failures on the CFQ than this
population (M=48, M=65, respectively), (Phillips at al., 2008). Thus it seems plausible
that the self-reports of the PI group within this current study were reflective of their real
life experience, rather than an over-reporting of symptoms, which is occasionally
observed within PI populations. Taken together, the findings of Sullivan and colleagues
reporting CFQ in another disorder of psychopathology and the findings of Phillips and
colleagues reporting CFQ in a brain damaged population, suggest that the level of the
CFQ scores from the PI sufferers in this current study are within a likely range.
The CFQ is often used as a unitary scale, as factor analytic studies have concluded good
evidence for the general factor and evidence suggesting an unstable multifactor structure
(Broadbent et al., 1982), thus analysis at the level of each individual factor was not
recommended. However, future research may wish to devise a measure similar to the
82
CFQ, and suitable to PI research, which does have stable multifactor structure. Indeed,
this would permit the assessment of individual responses to each scale item, which
would aid in the examination of the specific situations, where deficits are reported,
which are general across PI populations. If a specific item(s) is rated highly by a
significant majority of PI respondents, future experimentation could consider the
cognitive functions that are required for successful completion of that task or event
represented by the item, and subsequent objective assessment of the same cognitive
functions could be conducted. Indeed this would provide more isolated comparisons of
the cognitive function deficits specifically reported by PI populations with objective
assessment of the same cognitive functions. Indeed when considering the previous point
that subjective and objective measurements often fail to associate due the highly specific
nature of the objective measure and the generalised nature of subjective measures,
assessment of subjective measures at item level could prove useful in the narrowing of
it’s general nature.
An interesting point within this current data set relates to the lack of group difference in
SSS data. Indeed PI did not rate themselves as being more sleepy at time of testing than
the GS control group. The lack of a significant difference here in comparison with the
significant group difference on CFQ scores strengthens the argument for the inclusion of
a more detailed self-report measure. Indeed, the disparity between the SSS and CFQ data
within this current study highlights that the SSS is not an appropriate indicator of
daytime cognitive deficit in PI. Furthermore, the fact that the PI did not report being
83
significantly more sleepy than GS suggests that a general sleepiness does not fully
account for the daytime deficits that PI commonly report.
The second hypothesis within this current study predicted that people with PI would
perform significantly poorer on the SATcomplex task than GS controls. This hypothesis
was upheld as PI reaction time (RT) to task completion was significantly longer than the
GS control group. Furthermore, PI made significantly more errors than GS. This
outcome supports the findings of Edinger et al., (2008) who demonstrated that a large
well defined sample of PI had longer RT latencies in the completion of a complex SAT
assessment compared to GS controls. However, the Edinger et al. study did not provide
information relating to the number of errors elicited by each group, so the identification
of a higher error rate within the current study is novel to the PI literature. Inclusion of
the assessment of error rates is important when interpreting the overall RT data. Indeed,
when an error is made within the SAT tests, the participant must correct the response
before being allowed to continue with the task. Thus, as the number of errors increase,
RT time to completion would also increase. Therefore, without the information relating
to error rate one might conclude that overall performance time is generally slowed in a
PI population relative to controls, however, in reality, the overall performance time may
be similar to the control but hindered by an increased number of errors. Furthermore,
when considering other neuropsychological evaluation systems in relation to assessing
cognitive deficits e.g. the Welschler Adult Intelligence Scale (WAIS IV) or Behavioural
Assessment of the Dysexecutive Syndrome (BADS), both RT and error rate are often
recorded. Indeed in both these named assessments, subtests targeting the performance of

84
attention, executive functioning and/or motor speed all require RT and error rate scores,
as cognitive deficit is not identified by slowed performance per se but by a combination
of slowed performance and increased error rate. In conclusion, the inclusion of both RT
data and error rate data within this current study aid in the interpretation of the PI
performance overall and highlights that error rates, which significantly impact on RT,
are significantly higher in the PI population relative to controls. Indeed, this fits with the
subjective accounts from PI populations who report that errors and mistakes in daytime
tasks, as opposed to a general slowing of performance, is often reported as a major cause
of concern and distress.
Inclusion of the SATsimple and Digit Span Task were to aid in the interpretation of the
SATcomplex. More specifically, the SATsimple is the most closely related control to the
SATcomplex, however the SAT simple engages fewer cognitive functions. If the
prediction is correct, that PI perform significantly poorer on the SATcomplex due to the
multiple cognitive resources utilized simultaneously, then it was assumed that
performance on the SATsimple would not differ between groups. Put simply, the deficit
in PI was not predicted to be in relation to switching attention per se, but rather in
relation to the high cognitive load that only the SATcomplex requires. Results from the
SATsimple test were in the expected direction, with no significant between group
differences on both RT and error rate.
The Digit Span Task was included to represent the neuropsychological assessment of a
more gross cognitive functioning i.e. working memory. Previous research assessing such

85
cognitive functioning in PI populations has failed to demonstrate differences from
controls (Orff et al., 2007), indeed, it is unlikely that people with PI would develop gross
deficits in one area of cognitive functioning as a result of poor sleep quality, as obvious
slips in cognitive functioning would be widely observed within the population. The
inclusion of the Digit Span Task within this current study was to confirm this prediction
in the current PI sample, and subsequently provide further support for deficits in PI
being associated with multiple cognitive resource activity. Indeed when considering the
everyday situations in which PI report slips in daytime functioning e.g. taking a wrong
turn when driving etc, multiple cognitive functions are required for this task, therefore it
is somewhat unsurprising that objective deficit is only observed when multiple cognitive
resources are drawn upon simultaneously. Results from the Digit Span Task test were
also in the expected direction with no significant between group differences on both the
forward and backwards subtests.
Predictions were also made in relation the effect size generated by both the subjective
and objective measures of daytime deficit. As predicted, the effects size comparison was
in the expected direction with the subjective comparison producing a larger effect size
than the objective comparison. This is consistent with the majority of data across many
clinical populations comparing subjective and objective assessment. However, the
subjective effect size, d = 4.8 (medium), was smaller than might have been predicted.
Indeed people with PI often subjectively over-report their sleep complaint, thus it could
have been assumed that PI may have over-reported their daytime deficits within the
CFQ. However, this smaller effect size observed between the PI group and GS group on
86
the CFQ, and the comparisons with other clinical populations previously discussed,
suggests that the PI group may not have been significantly over reporting daytime
cognitive complaints, and that the data relating to CFQ is reflective of their real life
experience.
The secondary question posed by this current study related to the common finding that
subjective and objective measures of daytime cognitive failures in PI often fail to
correlate with one another. This is most likely due to the fact that subjective measures
often tap into the general concepts of the complaint, whereas objective measures often
tap into the highly specific elements of the complaint. It was hypothesised that no
relationship would be observed between the objective and subjective measures within
this current study. As predicted, there was no significant relationship between measures.
This finding is unsurprising as the nature of the measures within this current study, are
reflective of the general/specific nature of subjective and objective measures previously
described. However, if future research does assess responses at the item level, within a
questionnaire with multifactor stability, there may be more scope for identifying a
relationship between the subjective item(s) measure and the objective measure. As a
manipulation check within this current study, each individual item from the CFQ was
assessed for a correlation with the SATcomplex. No significant correlations were
observed.
There are a number of important limitations to the present study that must be considered.
First, although this current study confirmed the predicted hypothesis it is important to
87
note that the number of participants included in analysis was significantly less than the
number generated by the a priori power calculation. This has implications for both the
comparisons of interest as well as subsequent comparisons. More specifically, if this
study had adequately reached the recommended power significant effects may have been
observed within the SATsimple and Digit span task. Future experimentation should aim
to recruit a much larger sample size in order to test out this possibility and conclude that
significant effects are confined to the comparison of interest i.e. SATcomplex.
Secondly, although detailed inclusion and exclusion criteria were established and PI
scored significantly higher than GS on the PSQI, and group allocation was
retrospectively confirmed by sleep diary data, sleep quality was not objectively
validated. Future studies should aim to differentiate PI from GS controls through the use
of an objective measure of sleep assessment i.e. actigraphy or polysomnography. Indeed
due to the previously mentioned findings that PI occasionally over-report sleep
disruption, objective sleep assessment would have served as a valuable manipulation
check for accurate group allocation. In addition, another potential criticism of the present
study is that telephone screening that resulted in the group allocation was not
additionally assessed by an independent rater. Thus inter-rater reliability could not be
provided for the group allocation within this present study.
A final limitation of this current study relates to the fact that the GS group consisted of a
convenience sample. Although often sleep research struggles to recruit good sleeper into
sleep related studies more attempts should have been made to recruit a randomised
88
control sample. Indeed, the inclusion of a random sample of GS would have
strengthened the overall methodology and subsequent group comparisons.
Conclusions
This study aimed to assess whether scores on the Cognitive Failures Questionnaire
(CFQ), and the SATcomplex would differentiate people with PI from GS controls. All
hypotheses were confirmed. First the CFQ, which is a novel inclusion to PI research
revealed that PI report significantly more cognitive failures than GS. Furthermore the
reported level of cognitive failures in this PI group is largely comparable to that of
another disorder of psychopathology i.e. depression, but largely incomparable to a
clinical population with known brain atrophy i.e. multiple sclerosis. The SATcomplex,
which requires sensory-motor, attention and executive functioning resources also
effectively differentiated groups, with PI having an overall slower RT to task completion
and a significantly greater number of errors than GS. This direction of results, and the
absence of group differences on the SATsimple and Digit Span task, suggests that PI
performance is significantly diminished when numerous cognitive resources are
simultaneously required, and not due to more gross cognitive deficit. As predicted no
relationship was observed between the subjective and objective measures, however
future research could attempt to assess subjective accounts at item level within the
indices. Nevertheless, the possibility that subjective and objective measures of daytime
deficit may continue to appear unrelated remains highly possible. Indeed, if objective
deficits are only observed during assessments that require multiple cognitive resources,
it may prove too difficult to accurately capture multiple examples within a questionnaire
89
and self-report format. In conclusion, the results of this current study have important
implications for future research and clinical practice. It is important that the PI patient’s
daytime experience is experimentally recognised and understood because, as highlighted
at the beginning of this study, daytime deficits as a result of poor sleep are often reported
to cause more distress and anxiety than the night-time experience of wakefulness.
90
References
Adam, K., Tomeny, M. & Oswald, I. (1986) Physiological and psychological differences
between good and poor sleepers. Journal of Psychiatric Research, 20, 301–316.
Alapin, I, Fichten, S, Libman, E., Creti, L., Bailes, S. & Wright, J. (2000) How is poor
sleep in older adults and college students related to daytime sleepiness, fatigue and
ability to concentrate. Journal of Psychosomatic Research, 49, 381-390.
American Academy of Sleep Medicine. International classification of
sleep disorders: diagnostic and coding manual. 2nd ed. Westchester, IL: AASM;
2005.
American Psychiatric Association. Diagnostic and statistical manual of
mental disorders. 4th ed. Washington, DC: APA; 1994.
Arcia, E. & Otto, D. (1992) Reliability of Selected Tests from the Neurobehavioral
Evaluation System. Neurotoxicology and Teratology, 14, 103-110.
Belenky, G., Wesensten, N.J., Thorn, D.R., Thomas, M., Sing, H., Redmond, D.P.,
Russo, M.B. & Balkin, T.J. (2003) Patterns of performance degradation and restoration
during sleep restriction and subsequent recovery: a sleep dose response study. Journal of
Sleep Research, 12, 1-12.
Bonnet M.H. (1985) Recovery of performance during sleep following sleep deprivation
in older normal and insomniac adult males. Perception and Motor Skills, 60, 323–334.
Bonnet, M.H. & Arand, D.L. (1995) 24-hour metabolic rate in insomniacs and matched
normal sleepers. Sleep, 18, 581–588.
91
Broadbent, D.E., Cooper, P.F., FitzGerald, P. & Parkes, K. R. (1982) The Cognitive
Failures Questionnaire (CFQ) and its correlates. British Journal of Clinical Psycholog,
21, 1-16.
Buysee, D.J., Ancoli-Israel, S., Edinger, J.D., Lichstein, K.L. & Morin, C.M. (2006)
Recommendations for a standard research assessment in insomnia. Sleep, 29 (9), 1155-
1173.
Buysse, D.J., Reynolds, C.F., Monk, T.H., Berman, S.R. & Kupfer, D.J. (1989) The
pittsburgh sleep quality index: a new instrument for psychiatric practice and research.
Psychiatry Research, 28, 193-213.
Carney, C.E. & Edinger, J.D. (2006) Identifying critical dysfunctional beliefs about
sleep in primary insomnia. Sleep, 29, 325-333.
Chang, P.P., Ford, D.E., Mead, L.A., Cooper-Patrick, L. Klag, M.J. (1997) Insomnia in
young men and subsequent depression. Journal of Epidemiology. 146 (2) 105-114.
Chellappa, S.L. & Araujo, J.F. (2007) Subjective sleep quality in patients with
depressive disorder. Estudos de Psicologia, 12 (3), 269-274.
Cirelli, C. Cellular consequences of sleep deprivation in the brain. Sleep Medicine, 10
(5), 307-321.
Church, M.W. & Johnson, L.C. (1979) Mood and performance of poor sleepers during
repeated use of flurazepam. Psychopharmacology, 61, 309–316.
Coursey, R.D., Buchsbaum, M.S. & Murphy, D.L. (1975) Biogenetic amines and
depression: Biochemical and Pharmacological separation of two types of depression.
Archives of General Psychiatry. 32, 1357-1366

92
Danker-Hopfe, H., Kraemer, S., Dorn, H. & Schmidt, A. (2001) Time of day variations
in different measures of sleepiness (MSLT, pupillography, and SSS) and their
interrelations. Psychophysiology, 38 (5), 828-835.
Dodd, M.J., Miaskowski, C. & Lee, K.A. (2004) Occurrence of Symptom Clusters.
Journal of National Cancer Institutes Monographs. 32, 76-78.
Edinger, J.D., Fins, A.I. & Sullivan, R.J. (1997) Do our methods lead to insomniacs’
madness?: Daytime testing after laboratory and home-based polysomnographic studies.
Sleep, 20, 1127–1134.
Edinger, J.D., Glenn, D.M. & Bastian, L.A. (2003) Daytime testing after laboratory or
home based polosomnography: comparisons of middle aged insomnia sufferers and
normal sleepers. Journal of Sleep Research, 12, 43-54.
Edinger, J.D., Means, M.K., Carney, C.E. & Krystal, A.D. (2008) Psychomotor
Performance Deficits and Their Relation to Prior Nights’ Sleep Among Individuals with
Primary Insomnia. Sleep, 31(5), 591-592.
Ellen, J.M. (2007) The state of sleep deprivation. Sleep Medicine Reviews, 11, 303-305.
Espie, C.A., Inglis, S.J. & Harvey, L. (2001) The clinical effectiveness of cognitive
behaviour therapy for chronic insomnia: implementation and evaluation of a sleep clinic
in general medicicl practice. Behaviour Research and Therapy, 39, 45-60.
Faul, F., Erdfelder, E., Lang, A.G. & Buchner, A. (2007) G*Power 3: A flexible
statistical power analysis program for the social, behavioral, and biomedical sciences.
Behavior Research Methods, 39, 175-191.

93
Fichten, C.S., Creti, L. & Amsel, R. (1995) Poor sleepers who do not complain of
insomnia: Myths and realities about psychological and lifestyle characteristics of older
good and poor sleepers. Journal of Behaviour Medicine, 18, 189–223.
Gass, M.L.S. & Taylor, M.B. (2001) Alternatives for women through menopause.
American Journal of Obstetrics and Gynecology, 185 (2), S47-S56.
Grunstein, G.R., Ho, K.Y. & Sullivan, C.E. (2002) Sleep Apnea in Acromegaly. Annals
of Internal Medicine. 115(7), 527-532.
Guilleminault, C., Lin, C., Concalves, M. & Ramos, E. (2004) A prospective study of
nocturia and the quality of life of elderly patients with sleep apnea or sleep onset
insomnia. Journal of psychosomatic Research, 56 (5), 511-515.
Hathaway, S.R. & McKinley, J.C. (1967) The Minnesota Multiphasic Personality
Inventory manual. New York: Psychological Corporation.
Hauri, P. & Fisher, J. (1986) Persistent psychophysiologic (learned) insomnia. Sleep 9,
38–53.
Hauri, P. J. Cognitive deficits in insomnia patients. (1997) Acta Neurologica Belgira 97,
113–117.
Hoddes, E. Zarcone, V. & Smythe, H. (1973) Quantification of sleepiness: A new
approach. Psychophysiology, 10, 431–436.
Kales, A., Caldwell, A.B. & Soldatos, C.R. (1983) Biopsychobehavioral correlates of
insomnia II. Pattern specificity and consistency with the Minnesota Multiphasic
Personality Inventory. Psychosomatic Medicine, 45, 341–356.

94
Knight, R.G., McMahon, J., Green, T. & Murray, S.C. (2004) Some normative and
psychometric data for the geriatric depression scale and the cognitive failures
questionnaire from a sample of healthy older persons. New Zealand Journal of
Psychology. 20, 345-360.
Krupp, L.B., La Rocca, N.G. & Muir-Nash, J. (1989) The Fatigue Severity Scale:
Application to patients with multiple sclerosis and systemic lupus erythematosus.
Archives of Neurology, 46, 1121–1123.
Levin, D., Bertelson, A.D & Lacks, P. (1984) MMPI differences among mild and severe
insomniacs and good sleepers. Journal of Personality Research, 48, 126–129.
Lichstein, K.L., Wilson, N.M. & Noe, S.L. (1994) Daytime sleepiness in insomnia:
Behavioral, biological and subjective indices. Sleep, 17, 693–702.
Lichstein, K.L., Johnson, R.S. & Sen Gupta, S. (1992) Are insomniacs sleepy during the
day?: A pupillometric assessment. Behaviour Research & Therapy 30, 283–292.
Lichstein, K.L. & Johnson, R.S. (1996) The utility of pupillometric assessment in older
adults with insomnia. Journal of Clinical Geropsychology, 2, 337–352.
Lichstein, K.L., Means, M.K. & Noe, S.L.(1997) Fatigue and sleep disorders. Behaviour
Research and Therapy 35, 733–740.
Mahoney, F., Moore, P., Baker, E. & Letz, R. (1988) Experimental Nitrous Oxide
Exposure as a Model System for Evaluating Neurobehavioural Tests. Toxicology, 49,
449-457
Martin, M. (1983) Cognitive failure: everyday and laboratory performance. Bulletin of
Psychonomic Society, 21, 97-100.

95
Maurizio, F. (2004) Daytime sleepiness and insomnia as correlates of depression.
Journal of Clinica; Psychology, 65 (16), 49-55.
McNair, D.M., Lorr, M. & Droppleman, L.F. (1981) Manual for the Profile of Mood
States. San Diego: Education and Industrial Testing Service.
Means, M.K., Lichstein, K.L. & Epperson, M.T. (2000) Relaxation therapy for
insomnia: Nighttime and daytime effects. Behaviour Research and Therapy, 38 665-678.
Mendelson, W.B., Garnett, D. & Gillin, J.C. (1984) The experience of insomnia and
daytime and night-time functioning. Psychiatry Research 12, 235–250.
Mendelson W.B., Garnett, D. & Linnoila, M. (1984) Do insomniacs have impaired
daytime functioning? Biological Psychiatry, 19, 1261–1264.
Morin, C.M. & Espie, C.A. (2003) Insomnia: A clinical guide to assessment and
treatment. New York: Kluwer Academic/Plenum.
Morin, C.M., Stone, J. & Trinkle, D.(1993) Dysfunctional beliefs and attitudes about
sleep among older adults with and without insomnia complaints. Psychology and Aging,
8, 463–467.
Norris, G. & Tait, R.L. (2000) The behavioural assessment of the dysecutive syndrome
(BADS): ecological, concurrent and construct validity. Neuropsychological
Rehabilitation, 10 (1), 33-45.
Ohayon M.M. (2004) Epidemiology of insomnia: what we know and what we still need
to learn. Sleep Medicine Reviews, 6, 97-111.
Ohayon, M.M. & Vecchierini, M.F. (2002) Daytime sleepiness and cognitive
impairment in the elderly popultion. Archives of International Medicine, 162, 201-208.

96
Orff, H.J., Drummond, S.P.A., Nowakowski, S. & Perlis, M.L. (2007) Discrepancy
between Subjective Symptomatology and Objective Neuropsychological Performance in
Insomnia. Sleep, 30, 1191-1197.
Pedrosi, B., Roehrs, T.A. & Rosenthal, L. (1995) Daytime function and benzodiazepine
effects in insomniacs compared to normals. Sleep Research, 24, 36.
Phillips, L.H., Saldias, A., McCarrey, A., Henry, J.D., Scott, C., Summers, F. & Whyte,
M. (2009) Attentional lapses, emotional regulation and quality of life in multiple
sclerosis. British Journal of Clinical Psychology, 48 (1), 101-106
Reason, J.T. & Lucas, D. (1984) Absent-mindedness in shops: it’s incidence, correlates
and consequence. British journal of Clinical Psychology, 23, 121-131.
Riedel, B.W. & Lichstein, K.L. (2000) Insomnia and daytime functioning. Sleep
Medicine Reviews, 4, 277-298.
Riedel, B.W., Lichstein, K.L. & Dwyer, W.O. (1995) Sleep compression and sleep
education for older insomniacs: Self-help versus therapist guidance. Psychology and
Aging, 10, 54–63.
Rombaut N., Maillard F. & Kelly, F. (1990) The quality of life of insomniacs
questionnaire (QOLI). Medical Science Research, 18, 845–847.
Roth T, Ancoli-Israel S. Daytime consequences and correlates of insomnia in the United
States: Results from the 1991 National Sleep Foundation Survey. II. Sleep 2003; 22
(Suppl. 2): S354–S358.
Rush, A.J., Trivedi, M.H., Ibrahim, H.M., Carmody, T.J., Arnow, B., Klein, D.N.,
Markowitz, J.C., Ninan, P.T., Kornstein, S., Manber, R., Thase, M.E., Kocsis, J.H. &
Keller, M.B. (2003) The 16-item Quick Inventory of Depressive Symptomatology

97
(QIDS) Clinician Rating (QIDS-C) and Self-Report (QIDS-SR): A psychometric
evaluation in patients with chronic major depression. Biological Psychiatry, 54:573-583.
Schneider-Helmert, D. (1987). Twenty-four-hour sleep-wake function and personality
patterns in chronic insomniacs and healthy controls. Sleep, 10, 452–462.
Schneider, C., Fulds, S. & Schulz, H. (2004) Daytime varaiation in performance and
tiredness/sleepiness ratings in patients with insomnia, narcolepsy, sleep apnea and
normal controls. Journal of Sleep Research, 13, 373-383.
Seidel, W.F., Ball, S. & Cohen, S. (1984) Daytime alertness in relation to mood,
performance, and nocturnal sleep in chronic insomniacs and non-complaining sleepers.
Sleep, 7, 230–238.
Seidel, W.F. & Dement, W.C. (1982) Sleepiness in insomnia: Evaluation and treatment.
Sleep, 5, S182–S190.
Spielberger, C.D., Gorsuch, R.L., Lushene, R., Vagg, P.R. & Jacobs, G.A. (1983) State-
Trait Anxiety Inventory for Adults: Manual, Test and Scoring Key. Menlo Park, CA.
Stepanski, E., Lamphere, J. & Badia, P. (1984) Sleep fragmentation and daytime
sleepiness. Sleep, 7, 18–26.
Stewart, R., Besset, A., Bebbington, P., Brugha, T., Lindesay, J., Jenkins, R., Singuton,
N. & Meltzer, H. (2006) Insomnia comorbidity and impact and hypnotic use by age
group in a national survey opoulation age 16 to 74 years. Sleep, 29, 1391-1397.
Sugerman, J.L., Stern, J.A. & Walsh, J.K. (1985) Daytime alertness in subjective and
objective insomnia: Some preliminary findings. Biological Psychiatry, 20, 741–750.
98
Sullivan, B.B.A. & Payne, T.W. (2007) Affective disorders and cognitive failures: A
comparison of seasonal and nonseasonal depression. American Journal of Psychiatry,
164, 1663-1667.
Varkevisser, M. & Kerkhof, G.A. (2005) Chronic Insomnia and Performance in a 24-h
Constant Routine Study. Journal of Sleep Research, 14, 49-59.
Vignola, A., Lamoureux, C., Bastein, C.H. & Morin, C.M. (2005) Effects of chronic
insomnia and use of benzodiazepines on daytime performance in older adults. Journal of
Gerontology: British Psychological Sciences and Social Sciences, 55, 54-62.
Wagle, A.C., Berrios, G.E. & Ho, L. (1999) The cognitive failures questionnaire in
psychiatry. Comprehensive Psychiatry, 40, 478-484.
Wechsler, D. (2008) Wechsler Adult Intelligence Scale. 4th Edition. San Antonio, TX:
Psychological Corporation.
Yates, G.C.R., Hannell, G. & Lippett, R.M. (1985) Cognitive slippage, test anxiety, and
responses in group testing situations. British Journal of Educational Psychology, 55, 28-
33.
Zammit, G. K., Weiner, J. & Damato, N. (1999) Quality of life in people with insomnia.
Sleep, 22 (Suppl. 2): S379–S385.

99
Table 1. Overview of measures included in the current study.
Demographic Sleep Psychopathology Subjective Daytime Deficit
Objective Daytime deficit
Age (in years)
Screening interview: DSM-IV-TR & ICSD- R
Screening interview: current depression or anxiety, any medication for psychopathology
CFQ: daytime cognitive failures
SATcomplex: assessment of sensory-motor, attention, concentration and executive functioning
Gender PSQI: <5 = GS, >5 = PI
QIDS: depression symptoms
SATsimple: assessment of sensory motor attention and concentration
Education level (years in education) .
Sleep diary: TST, WASO, SOL
STAI: anxiety symptoms
Digit Span: assessment of working memory
SSS: sleepiness rating immediately prior to testing

100
Table 2. Mean and Standard Deviation Demographic Data for PI and GS.
Group Male:Female Ratio
M
Age
M SD
Years in Education
M SD
PI
9:17
46.17 12.88
16.40 3.87
GS
11.15
33.72 14.44
15.34 4.29

101
Table 3. Mean, Standard Deviation and Significance Screening and Clinical Measure
scores for PI and GS.
Measure PI
M SD
GS
M SD
df F Between group Differences
PSQI
11.96 4.28
3.56 3.18
1
64.5
p<0.0001
TST
294.3 92.6
413.8 87.8
1
22.7
p<0.0001
WASO
84.1 79.1
16.9 42.1
1
14.5
p<0.0001
SOL
37.2 38.7
13.88 20.2
1
7.4
p<0.0001
TST night prior
305.1 35.7
416.5 45.8
1
9.5
p<0.0001
SSS
2.9 1.1
2.5 0.9
1
1.5
p = .232
QUIDS
9.6 4.7
7.8 5.3
1
4.0
p = .052
STAI-S
39.6 13.1
38.4 12.9
1
0.43
p = .150
STAI-T
45.9 12.6
47.2 11.7
1
0.10
p = .124
PSQI: Pittsburgh Sleep Quality Index TST: Total Sleep Time WASO: Wake Time After Sleep Onset SOL: Sleep Onset Latency SSS: Stanford Sleepiness Scale QUIDS: Quick Inventory of Depressive symptoms – Self Report STAI: Speilberger State Trait Anxiety Inventory

102
Table 4. Mean, Standard deviation and Significance Scores for Each experimental
Measure. Measure PI
M SD
GS
M SD
d F Between group Differences
CFQ
47.9 19.5
34.6 15.1
1
8.0
p<0.05
SATcomplex RT in seconds
53.6 13.4
39.2 12.8
1
5.5
p<0.05
SATcomplex Errors
1.4 1.2
0.65 0.94
1
5.8
p<0.05
SATsimple RT in seconds
23.9 7.9
19.9 5.5
1
0.9
p = 0.35
SATsimple Errors
0.85 1.3
0.50 0.71
1
1.4
p = 0.24
Digit Span Forwards
6.6 1.4
7.0 0.4
1
0.7
p = 0.40
Digit Span Backwards
5.9 1.2
5.9 0.94
1
0.01
p = 0.93

103
Figure 1 SAT complex
A
C
B
D
E
1
5
43
2
J
H
I
G
F
9
8
7
610
104
CHAPTER FOUR:
ADVANCED CLINICAL PRACTICE II REFLECTIVE CRITICAL ACCOUNT
Reflecting on the anxieties experienced when engaging in the training of other
professionals in psychological skills, knowledge and practice.
Lauren M. Macphee1
Trainee Clinical Psychologist
February 2009
Affiliation: 1Section of Psychological Medicine Division of Community Based Sciences University of Glasgow Gartnavel Hospital 1055 Great Western Road GLASGOW G12 0XH
E-mail: [email protected]
105
Abstract
The ability to train others in the application of psychological skills, knowledge, practices
and procedures is a key competence of a clinical psychologist and is highlighted with the
National Occupational Standards for Psychology. This current reflective account
discusses my personal experience of training other professionals within a specific area of
health psychology. I attempt to reflect on this situation by following Gibbs (1988) model
of reflection. I discuss the anxieties I felt in relation to the professional group to whom I
was delivering the training session, and the concerns I had about ensuring I presented
accurate and informative information. My evaluation and analysis of the situation has
allowed me to recognise the discrepancies in my thinking in relation to the group’s
expertise and my belief that I was under qualified to present to such a group. I also
discuss my gradual awareness about my own personal negative thinking in relation to
possible negative outcomes of the situation and discuss my feelings in relation to this. I
conclude by discussing my plans for action with regards to my own professional
development and highlight that it is important to consistently monitor my own personal
well being when taking on an additional workload.

106
CHAPTER FOUR:
ADVANCED CLINICAL PRACTICE II REFLECTIVE CRITICAL ACCOUNT
Reflecting on the anxieties experienced when engaging in the training of other
professionals in psychological skills, knowledge and practice.
Lauren M. Macphee1
Trainee Clinical Psychologist
June 2009
Affiliation: 1Section of Psychological Medicine Division of Community Based Sciences University of Glasgow Gartnavel Hospital 1055 Great Western Road GLASGOW G12 0XH
E-mail: [email protected]

107
Abstract
The ability to train others in the application of psychological skills, knowledge, practices
and procedures is a key competence of a clinical psychologist and is highlighted with the
National Occupational Standards for Psychology. This current reflective account
discusses my personal experience of training other professionals within a specific area of
health psychology. I attempt to reflect on this situation by following Gibbs (1988) model
of reflection. I discuss the anxieties I felt in relation to the professional group to whom I
was delivering the training session, and the concerns I had about ensuring I presented
accurate and informative information. My evaluation and analysis of the situation has
allowed me to recognise the discrepancies in my thinking in relation to the group’s
expertise and my belief that I was under qualified to present to such a group. I also
discuss my gradual awareness about my own personal negative thinking in relation to
possible negative outcomes of the situation and discuss my feelings in relation to this. I
conclude by discussing my plans for action with regards to my own professional
development and highlight that it is important to consistently monitor my own personal
well being when taking on an additional workload.

108
APPENDICES

109
Guide for Authors Appendix 2.1 An International Multi-Disciplinary Journal For full instructions, please visit http://ees.elsevier.com/brat Aims and Scope Behaviour Research and Therapy encompasses all of what is commonly referred to as cognitive behaviour therapy (CBT). The major focus is on the following: experimental analyses of psychopathological processes linked to prevention and treatment; the development and evaluation of empirically-supported interventions; predictors, moderators and mechanisms of behaviour change; and dissemination of evidence-based treatments to general clinical practice. In addition to traditional clinical disorders, the scope of the journal also includes behavioural medicine. The journal will not consider manuscripts dealing primarily with measurement, psychometric analyses, and personality assessment. The Editor and Associate Editors will make an initial determination of whether or not submissions fall within the scope of the journal and are of sufficient merit and importance to warrant full review. Submission to the journal prior to acceptance Authors should submit their articles electronically via
the Elsevier Editorial System (EES) page of this journal http://ees.elsevier.com/brat. The system automatically converts source files to a single Adobe Acrobat PDF version of the article, which is used in the peer-review process. Please note that even though manuscript source files are converted to PDF at submission for the review process, these source files are needed for further processing after acceptance. All correspondence, including notification of the Editor's decision and requests for revision, takes place by e-mail and via the Author's homepage, removing the need for a hard-copy paper trail. Any questions regarding your submission should be addressed to the Editor in Chief, Professor G. T. Wilson, Psychological Clinic at Gordon Road, Rutgers, The State University of New Jersey, 41C Gordon Road, Piscataway, New Jersey, 08854-8067, USA. Email: [email protected]. Submission of an article implies that the work described has not been published previously (except in the form of an abstract or as part of a published lecture or academic thesis), that it is not under consideration for publication elsewhere, that its publication is approved by all authors and tacitly or explicitly by the responsible authorities where the work was carried out, and that, if accepted, it will not be published elsewhere in the same form, in English or in any other language, without the written consent of the Publisher. Presentation of manuscript Please write your text in good English (American or British usage is accepted, but not a mixture of these). Italics are not to be used for expressions of Latin origin, for example, in vivo, et al., per se. Use decimal points (not commas); use a space for thousands (10 000 and above). Print the entire manuscript on one side of the paper only, using double spacing and wide (3 cm) margins. (Avoid full justification, i.e., do not use a constant right-hand margin.) Ensure that each new paragraph is clearly indicated. Present tables and figure legends on separate pages at the end of the manuscript. If possible, consult a recent issue of the journal to become familiar with layout and conventions. Number all pages consecutively. Provide the following data on the title page (in the order given). Title. Concise and informative. Titles are often used in information-retrieval systems. Avoid abbreviations and formulae where possible. Author names and affiliations. Where the family name may be ambiguous (e.g., a double name), please indicate this clearly. Present the authors' affiliation addresses (where the actual work was done) below the names. Indicate all affiliations with a lower-case superscript letter immediately after the author's name and in front of the appropriate address. Provide the full postal address of
110
each affiliation, including the country name, and, if available, the e-mail address of each author. Corresponding author. Clearly indicate who is willing to handle correspondence at all stages of refereeing and publication, also post-publication. Ensure that telephone and fax numbers (with country and area code) are provided in addition to the e-mail address and the complete postal address. Present/permanent address. If an author has moved since the work described in the article was done, or was visiting at the time, a 'Present address' (or 'Permanent address') may be indicated as a footnote to that author's name. The address at which the author actually did the work must be retained as the main, affiliation address. Superscript Arabic numerals are used for such footnotes. Abstract. A concise and factual abstract is required (maximum length 200 words). The abstract should state briefly the purpose of the research, the principal results and major conclusions. An abstract is often presented separate from the article, so it must be able to stand alone. References should therefore be avoided, but if essential, they must be cited in full, without reference to the reference list. Keywords. Immediately after the abstract, provide a maximum of 6 keywords, to be chosen from the APA list of index descriptors. These keywords will be used for indexing purposes. Abbreviations. Define abbreviations that are not standard in this field at their first occurrence in the article: in the abstract but also in the main text after it. Ensure consistency of abbreviations throughout the article. N.B. Acknowledgements. Collate acknowledgements in a separate section at the end of the article and do not, therefore, include them on the title page, as a footnote to the title or otherwise. Shorter Communications This option is designed to allow publication of research reports that are not suitable for publication as regular articles. Shorter Communications are appropriate for articles with a specialized focus or of particular didactic value. Manuscripts should be between 3000 - 5000 words, and must not exceed the upper word limit. This limit includes the abstract, text, and references, but not the title pages, tables and figures. Arrangement of the article Divide your article into clearly defined sections with the use of headings (non-numbered). Any subsection may be given a brief heading. Each heading should appear on its own separate line. Use these headings for internal cross-referencing: do not just refer to 'the text'. Appendices. If there is more than one appendix, they should be identified as A, B, etc. Formulae and equations in appendices should be given separate numbering: (Eq. A.1), (Eq. A.2), etc.; in a subsequent appendix, (Eq. B.1) and so forth. Acknowledgements. Place acknowledgements, including information on grants received, before the references, in a separate section, and not as a footnote on the title page. Figure legends, tables, figures, schemes. Present these, in this order, at the end of the article. They are described in more detail below. High-resolution graphics files must always be provided separate from the main text file (see Preparation of illustrations). Specific remarks Tables. Number tables consecutively in accordance with their appearance in the text. Place footnotes to tables below the table body and indicate them with superscript lowercase letters. Avoid vertical rules. Be sparing in the use of tables and ensure that the data presented in tables do not duplicate results described elsewhere in the article. Preparation of supplementary data. Elsevier accepts supplementary material to support and enhance your scientific research. Supplementary files offer the author additional possibilities to publish supporting applications, movies, animation sequences, high-resolution images, background datasets, sound clips and more. Supplementary files supplied will be published online alongside the electronic version of your article in Elsevier Web products, including ScienceDirect:

111
http://www.sciencedirect.com. In order to ensure that your submitted material is directly usable, please ensure that data is provided in one of our recommended file formats. Authors should submit the material in electronic format together with the article and supply a concise and descriptive caption for each file. For more detailed instructions please visit our artwork instruction pages at http://www.elsevier.com/artworkinstructions. References Responsibility for the accuracy of bibliographic citations lies entirely with the authors Citations in the text: Please ensure that every reference cited in the text is also present in the reference list (and vice versa). Any references cited in the abstract must be given in full. Unpublished results and personal communications should not be in the reference list, but may be mentioned in the text. Citation of a reference as 'in press' implies that the item has been accepted for publication. Citing and listing of web references. As a minimum, the full URL should be given. Any further information, if known (author names, dates, reference to a source publication, etc.), should also be given. Web references can be listed separately (e.g., after the reference list) under a different heading if desired, or can be included in the reference list. Text: Citations in the text should follow the referencing style used by the American Psychological Association. You are referred to the Publication Manual of the American Psychological Association, Fifth Edition, ISBN 1-55798-790-4, copies of which may be ordered from http://www.apa.org/books/4200061.html or APA Order Dept., P.O.B. 2710, Hyattsville, MD 20784, USA or APA, 3 Henrietta Street, London, WC3E 8LU, UK. Details concerning this referencing style can also be found at http://humanities.byu.edu/linguistics/Henrichsen/APA/APA01.html. List: References should be arranged first alphabetically and then further sorted chronologically if necessary. More than one reference from the same author(s) in the same year must be identified by the letters "a", "b", "c", etc., placed after the year of publication. Examples: Reference to a journal publication: Van der Geer, J., Hanraads, J. A. J., & Lupton R. A. (2000). The art of writing a scientific article. Journal of Scientific Communications, 163, 51-59. Reference to a book: Strunk, W., Jr., & White, E. B. (1979). The elements of style. (3rd ed.). New York: Macmillan, (Chapter 4). Reference to a chapter in an edited book: Mettam, G. R., & Adams, L. B. (1994). How to prepare an electronic version of your article. In B. S. Jones, & R. Z. Smith (Eds.), Introduction to the electronic age (pp. 281-304). New York: E-Publishing Inc. Note that journal names are not to be abbreviated. Preparation of illustrations Submitting your artwork in an electronic format helps us to produce your work to the best possible standards, ensuring accuracy, clarity and a high level of detail. General points • Always supply high-quality printouts of your artwork, in case conversion of the electronic artwork is problematic. • Make sure you use uniform lettering and sizing of your original artwork. • Save text in illustrations as "graphics" or enclose the font. • Only use the following fonts in your illustrations: Arial, Courier, Helvetica, Times, Symbol. • Number the illustrations according to their sequence in the text. • Use a logical naming convention for your artwork files, and supply a separate listing of the files and the software used. • Provide all illustrations as separate files and as hardcopy printouts on separate sheets. • Provide captions to illustrations separately. • Produce images near to the desired size of the printed version.
112
For more detailed instructions please visit our artwork instruction pages at http://www.elsevier.com/artworkinstructions. You are urged to visit this site; some excerpts Formats Regardless of the application used, when your electronic artwork is finalised, pleas "save as" or convert the images to one of the following formats (Note the resolution requirements for line drawings, halftones, and line/halftone combinations given below.): EPS: Vector drawings. Embed the font or save the text as "graphics". TIFF: Colour or greyscale photographs (halftones): always use a minimum of 300 dpi. TIFF: Bitmapped line drawings: use a minimum of 1000 dpi. TIFF: Combinations bitmapped line/half-tone (colour or greyscale): a minimum of 500 dpi is required. DOC, XLS or PPT: If your electronic artwork is created in any of these Microsoft Office applications please supply "as is". Line drawings Supply high-quality printouts on white paper produced with black ink. The lettering and symbols, as well as other details, should have proportionate dimensions, so as not to become illegible or unclear after possible reduction; in general, the figures should be designed for a reduction factor of two to three. The degree of reduction will be determined by the Publisher. Illustrations will not be enlarged. Consider the page format of the journal when designing the illustrations. Photocopies are not suitable for reproduction. Do not use any type of shading on computer-generated illustrations. Photographs (halftones) Please supply original photographs for reproduction, printed on glossy paper, very sharp and with good contrast. Remove non-essential areas of a photograph. Do not mount photographs unless they form part of a composite figure. Where necessary, insert a scale bar in the illustration (not below it), as opposed to giving a magnification factor in the legend. Note that photocopies of photographs are not acceptable. Copyright Upon acceptance of an article, authors will be asked to sign a ?Journal Publishing Agreement?? (for more information on this and copyright see http://www.elsevier.com/copyright). Acceptance of the agreement will ensure the widest possible dissemination of information. An e-mail (or letter) will be sent to the corresponding author confirming receipt of the manuscript together with a `Journal Publishing Agreement? form or a link to the online version of this agreement. If excerpts from other copyrighted works are included, the author(s) must obtain written permission from the copyright owners and credit the source(s) in the article. Elsevier has preprinted forms for use by authors in these cases: contact Elsevier?s Rights Department, Oxford, UK: phone (+44) 1865 843830, fax (+44) 1865 853333, e-mail [email protected]. Requests may also be completed online via the Elsevier homepage ( http://www.elsevier.com/locate/permissions). Proofs When your manuscript is received by the Publisher it is considered to be in its final form. Proofs are not to be regarded as 'drafts'. One set of page proofs will be sent to the corresponding author, to be checked for typesetting/editing. No changes in, or additions to, the accepted (and subsequently edited) manuscript will be allowed at this stage. Proofreading is solely your responsibility. The Publisher reserves the right to proceed with publication if corrections are not communicated. Return corrections within 3 days of receipt of the proofs. Should there be no corrections, please confirm this. Offprints Twenty-five offprints will be supplied free of charge. Additional offprints and copies of the issue can be ordered at a specially reduced rate using the order form sent to the corresponding author after the manuscript has been accepted. Orders for reprints (produced after publication of an article) will incur a 50% surcharge. Elsevier NIH Policy Statement As a service to our authors, Elsevier will deposit to PubMed Central (PMC) author manuscripts on behalf of Elsevier authors reporting NIH funded research. This service is a continuation of Elsevier's 2005 agreement with the NIH when the NIH introduced their voluntary 'Public Access Policy'. Please see the full details at:
113
http://www.elsevier.com/wps/find/authorsview.authors/nihauthorrequest (this site also includes details on all other funding body agreements). Elsevier facilitates author response to the NIH voluntary posting request (referred to as the NIH "Public Access Policy", see http://www.nih.gov/about/publicaccess/index.htm) by posting the peer-reviewed author's manuscript directly to PubMed Central on request from the author, 12 months after formal publication. Upon notification from Elsevier of acceptance, we will ask you to confirm via e-mail (by e-mailing us at [email protected]) that your work has received NIH funding and that you intend to respond to the NIH policy request, along with your NIH award number to facilitate processing. Upon such confirmation, Elsevier will submit to PubMed Central on your behalf a version of your manuscript that will include peer-review comments, for posting 12 months after formal publication. This will ensure that you will have responded fully to the NIH request policy. There will be no need for you to post your manuscript directly with PubMed Central, and any such posting is prohibited.

114
Appendix 2.2 Source How did you find out about the University of Glasgow Sleep Centre?
Why have you contacted us?
Personal Full Name:
Date of Birth: Age:
Telephone:
Alternative Telephone:
When is a good time to call?
Address:
Sleep Do you have difficulty sleeping at the moment? (Y/N)
Have you always been a poor sleeper? (Y/N)
How long have you had a sleep problem?(yr)
Do you have difficulty falling asleep? (Y/N)
How many nights per week do you have difficulty falling asleep? (out of 7)
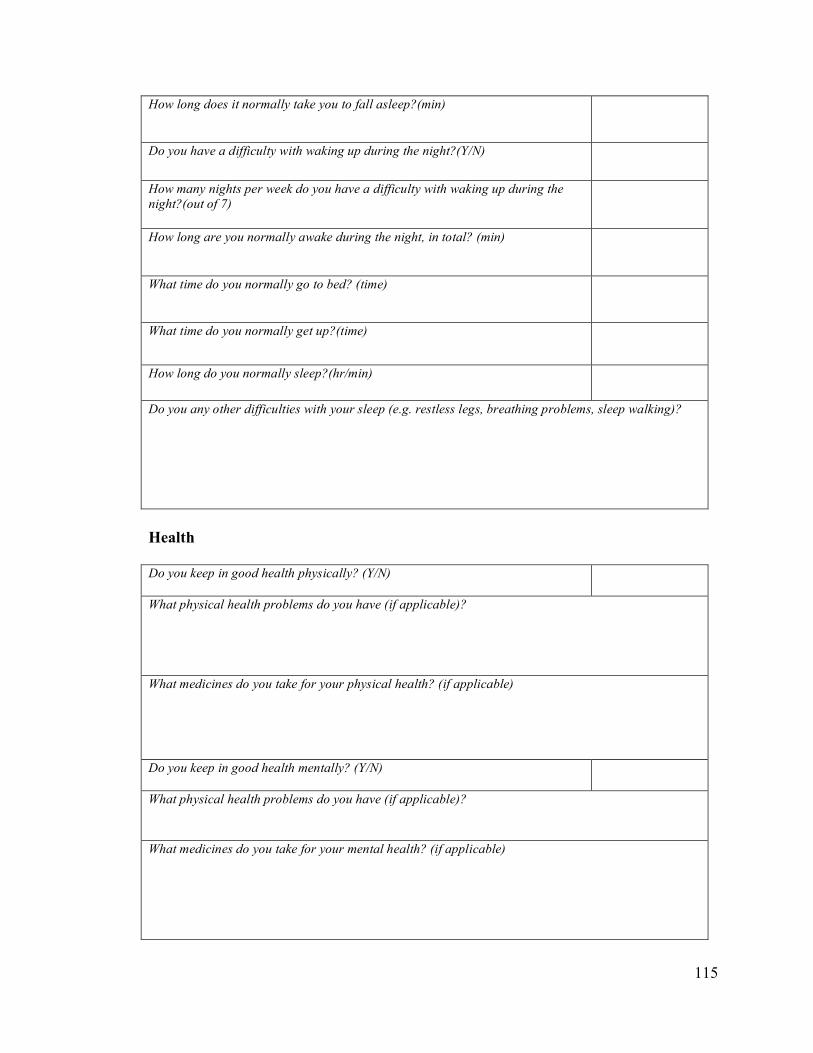
115
How long does it normally take you to fall asleep?(min)
Do you have a difficulty with waking up during the night?(Y/N)
How many nights per week do you have a difficulty with waking up during the night?(out of 7)
How long are you normally awake during the night, in total? (min)
What time do you normally go to bed? (time)
What time do you normally get up?(time)
How long do you normally sleep?(hr/min)
Do you any other difficulties with your sleep (e.g. restless legs, breathing problems, sleep walking)?
Health Do you keep in good health physically? (Y/N)
What physical health problems do you have (if applicable)?
What medicines do you take for your physical health? (if applicable)
Do you keep in good health mentally? (Y/N)
What physical health problems do you have (if applicable)? What medicines do you take for your mental health? (if applicable)
116
Notes
For Office Use Enquiry taken by: At (time): On (date): Information sent: ! [study name] ! [study name] ! [study name] ! [study name] ! [study name] ! [study name] ! [study name] ! [study name] ! [study name] ! [study name] ! [study name] ! [study name] On (date):

117
Appendix 2.3 Name_______________________________________ Week Beginning______________________________
MEASURING THE PATTERN OF YOUR SLEEP Day
1 Day 2
Day 3
Day 4
Day 5
Day 6
Day 7
1. What time did you wake this morning?
2. At what time did you rise from bed?
3. At what time did you go to bed last night?
4. Lights Out:- At what time did you put the light out to go to sleep?
5. How long did it take you to fall asleep (minutes)? (After Lights Out)
6. How many times did you wake up during the night?
7. How long were you awake during the night (in total)?
8. About how long did you sleep altogether (hours/mins)?
9. Did you take sleeping pills to help you sleep? (please describe)
10.Did you take alcohol before going to bed? (please describe)
11.Did you take painkillers last evening or night? (please describe)
12.Did you take pills for depression or anxiety? (please describe)
MEASURING THE QUALITY OF YOUR SLEEP
1. How well do you feel this morning?
0 1 2 3 4 not at all moderately very
2. How enjoyable was your sleep last night?
0 1 2 3 4 not at all moderately very
3. How mentally alert were you in bed last night?
0 1 2 3 4 not at all moderately very

118
Appendix 2.4

119
Appendix 2.5 ANCOVA CFQ
Source Type III Sum of Squares df Mean Square F Sig.
Corrected Model 2559.659(a) 3 853.220 2.739 .054 Intercept 4337.908 1 4337.908 13.923 .001 Education 45.594 1 45.594 .146 .704 Age 259.746 1 259.746 .834 .366 Group 2502.317 1 2502.317 8.032 .007 Error 14955.014 48 311.563 Total 105831.000 52 Corrected Total 17514.673 51
a R Squared = .146 (Adjusted R Squared ANCOVA SATcomplex
Source Type III Sum of Squares df Mean Square F Sig.
Corrected Model 4553151284.099(a) 3 1517717094.7
00 10.783 .000
Intercept 1171298583.499 1 1171298583.4
99 8.322 .006
Education 7283006.861 1 7283006.861 .052 .821 Age 1804933363.
666 1 1804933363.666 12.824 .001
Group 776774413.905 1 776774413.90
5 5.519 .023
Error 6755894483.202 48 140747801.73
3
Total 123433806092.688 52
Corrected Total 11309045767.302 51
a R Squared = .403 (Adjusted R Squared = .365)

120
ANCOVA SATsimple
Source Type III Sum of Squares df Mean Square F Sig.
Corrected Model 435113530.519(a) 3 145037843.50
6 3.369 .026
Intercept 349017709.636 1 349017709.63
6 8.107 .006
Education 2022653.755 1 2022653.755 .047 .829 Age 226154380.9
31 1 226154380.931 5.253 .026
Group 38412864.676 1 38412864.676 .892 .350
Error 2066510088.308 48 43052293.506
Total 27369519605.000 52
Corrected Total 2501623618.827 51
a R Squared = .174 (Adjusted R Squared = .122) ANCOVA Digit Span Forwards
Source Type III Sum of Squares df Mean Square F Sig.
Corrected Model 2.309(a) 3 .770 .407 .748 Intercept 129.618 1 129.618 68.617 .000 AGE 1.095 1 1.095 .579 .450 EDUCATION .675 1 .675 .357 .553 group 1.346 1 1.346 .712 .403 Error 90.672 48 1.889 Total 2627.000 52 Corrected Total 92.981 51
a R Squared = .025 (Adjusted R Squared = -.036) ANCOVA Digit Span Backwards
Source Type III Sum of Squares df Mean Square F Sig.
Corrected Model 3.321(a) 3 1.107 .332 .802 Intercept 81.353 1 81.353 24.387 .000 AGE .026 1 .026 .008 .931 EDUCATION 3.253 1 3.253 .975 .328 group .023 1 .023 .007 .934 Error 160.122 48 3.336 Total 1555.000 52 Corrected Total 163.442 51
a R Squared = .020 (Adjusted R Squared = -.041 yielded mixed results. Two recent studies have investigated daytime deficits in people with PI through the
121
Appendix 3.1
An investigation of relationship between the Cognitive Failures Questionnaire and the Switching Attention Task in psychophysiological insomnia and good sleep
Abstract Background: People with psychophysiologic insomnia (PI) report the experience of daytime cognitive deficits; however attempts to capture such deficits, both subjectively and objectively, have yielded mixed results. Two recent studies have investigated daytime deficits in people with PI through the use of both psychomotor tasks and subjective indices. Although one of these studies has demonstrated that a specific psychomotor test, i.e. the switching attention task (SAT), significantly differentiates people with PI from good sleeper controls (GS), both studies failed to demonstrate any significant relationship between psychomotor test performance and subjective reports of daytime deficit. Aims: The present study aims to determine 1) whether the Cognitive Failures Questionnaire (CFQ), a standardised measure used to assess specific cognitive failures in everyday life and novel to PI literature, and the SAT can effectively differentiate PI from GS, and 2) whether there is a significant relationship between the CFQ and the SAT. Methods: People with PI and good sleeper control volunteers will be recruited. A series of questionnaires relating to sleep pattern, the CFQ and the switching attention task will be completed. Applications: Identification of the specific cognitive failures experienced by people with PI in everyday living, and their relationship with objective tests of cognitive function, will aid in our understanding of specific daytime consequences of poor sleep. 1. Introduction Clinical reports from individuals with Psychophysiological Insomnia (PI) include the
experience of daytime cognitive deficits such as poor concentration, poor memory, and
decreased ability to accomplish daily tasks (Roth et al., 2003, Grunstein et al., 2002).
The published nomenclature (International Classification of Sleep Disorders - ICSD-2)
is reflective of these subjective accounts and include these phenomenon in its description
of insomnia as a disorder; the sleep complaint must occur in association with adequate
opportunity for sleep and the complaint of impaired daytime function (e.g., difficulties
with attention, and memory, and/or diminished vocational functioning) (American
Academy of Sleep Medicine, 2005).
In a review of the relevant literature Riedel and Lichstein (2000) found that many
researchers have attempted to capture, through both subjective and objective measures,
the daytime cognitive deficits reported by people with PI. Studies developed to capture
such deficits have considered various ‘domains of daytime functioning’ which include;

122
daytime sleepiness, fatigue, physiological arousal, cognitive and psychomotor tasks,
psychopathology, and general functioning. The vast majority of the data relating to these
domains provide little evidence of deficits in daytime functioning in people with PI
relative to individuals without PI (Edinger et al., 1997, Lichstein et al., 1994, Fichten et
al., 1995, Means et al., 2000, Kales et al 1983, Levin et al., 1984, Orff et al., 2007,
Edinger et al., 2008).
Recent developments in the investigation of daytime deficits in people with PI involve
the use of psychomotor tests (PMT), typically incorporating a variety of tests e.g. card
sorting, addition, logical reasoning, divided attention, complex reaction time tasks etc.
The results of such studies comparing people with PI and controls have been mixed and
inconsistent. In a recent study, Orff and colleagues investigated both subjective and
neuropsychological measures of daytime impairment in people with PI and good
sleepers (GS), with the aim of assessing whether people with PI differ from GS on both
measures, and the extent to which subjective and objective measures provide discordant
information (Orff et al., 2007). Overall, people with PI subjectively reported worse
sleep, diminished activity levels, and a greater number and severity of daytime
complaints, however, they did not show deficits on the objective PMT. Indeed, there was
no relationship between subjective and objective outcome measures.
The most recent study comparing PMT performance in people with PI against GS
controls reports a significant group difference (Edinger et al., 2008). Within this study, a
large well-characterised group of people with PI represented the experimental population
and predictions were made that this group would perform significantly worse than GS on
performance measures, and that group differences would be most obvious on more
complex tasks. The PMT assessment battery included a simple reaction time test, a
sustained attention test and a switching attention test, representing a hierarchy of
complexity. Group differences were only observed on the most complex task (i.e.
switching attention task (SAT)) where there was a high cognitive load. These authors
employed the Stanford Sleepiness Scale (SSS) to measure subjective daytime complaints
and although PI reported significantly greater sleepiness ratings than GS, one arguable

123
weakness is that the measure did not provide any information on specific areas of
cognitive failures subjectively reported.
As previously mentioned, the definition of insomnia in part includes the reporting of
daytime cognitive difficulties such as attention and memory. However, in attempting to
measure the subjective reporting of daytime sleepiness, all studies thus far have arguably
failed to use measures that adequately capture the nature and severity of cognitive
deficits subjectively reported. The inclusion of a standardised subjective measure that
specifically assesses deficits in daily cognitive functioning would, by definition of
insomnia, appear essential. The use of such a measure may allow for the phenotypical
features of a PI population to be discerned more accurately, thus enhancing studies
examining the differences between people with PI and GS, as well as those exploring the
relationship between subjective and objective measures of cognitive impairment.
2. Aims and Hypotheses
2.1 Aims
This current research aims to advance our understanding of the relationship between
subjective reporting of daytime cognitive deficits and objective impairment on PMT in
people with PI through the inclusion of ; i) The Cognitive Failures Questionnaire (CFQ)
and ii) The switching attention task (SAT) shown to differentiate PI from GS in the most
recent study i.e. (Edinger et al., 2008)
This study primarily aims to determine;
1) whether the CFQ and the SAT can effectively differentiate PI from GS, and
2) whether there is any relationship between the CFQ and the SAT outcome data.
2.2 Hypotheses
1. People with PI and GS controls will significantly differ on the CFQ, with the
PI group reporting significantly more cognitive failures relative to GS.
124
The novel use of the CFQ within the PI literature seems appropriate as it allows for the
assessment of subjective reporting of cognitive failures in everyday life. The measure has
the potential to tap into the everyday experience of insomnia, capturing the more
phenotypical components of the disorder. Since self-report measures from people with
PI consistently include reports of day-time deficits, it is predicted that the PI group will
relate to significantly more everyday cognitive failures than GS.
2. People with PI and GS controls will significantly differ on the SAT, with the
PI group performing significantly poorer relative to GS.
Edinger et al. (2008) report a significant difference in psychomotor performance when
tested on a switching attention task. This present hypothesis aims to replicate this
finding.
3. There will be no significant relationship between the CFQ and the SAT
outcome data.
3. Plan of Investigation
3.1 Participants
Two groups of volunteers will be used within this study: people with
psychophysiological insomnia and good sleeper controls. They will be age, gender and
education level matched.
3.2 Recruitment
The University of Glasgow Sleep Centre (UGSC) has a core generic approach to
recruiting participants to the lab which includes recruitment from the local sleep disorder
services, via advertisements in local news papers and directly from 20 local primary care
practices through the coordinator SPPIRe (Scottish Practices and Professionals Involved
in Research). Participants within this current study will be recruited in this way.

125
3.3 Inclusion and Exclusion Criteria
The UGSC has a generic protocol for screening people with PI and GS controls to
laboratory based studies. This current study will adhere to this protocol.
3.4 Procedure for Diagnostic Ascertainment
i. Assessment of Sleep
Each participant will be interviewed to evaluate his/ her typical sleeping patterns. The
interview will propose questions relating to the DSM-IV and ICSD-R criteria for PI and
DSPS, following the UGSC structured interview format (Espie, 2000; Morin and Espie,
2003). Additionally, the Pittsburgh Sleep Quality Index (PSQI), the Insomnia Severity
Index (ISI) and the Stanford Sleepiness Scale (SSS) will be completed. Participants will
also complete a standard sleep diary (Espie, 1991) for seven nights prior to the
experiment.
ii. Assessment of Psychopathology
Psychopathology will be evaluated using, the Quick Inventory of Depressive Symptoms
and the Spielberg State-Trait Anxiety Inventory.
All the above measures have published data on their validity and reliabilityand are
referenced in section 3.5.
3.5 Measures/Materials
i. Demographic
Demographic information will include age, gender, ethnicity and number of years in
education.
ii. Sleep Measures
i) Pittsburgh Sleep Quality Index (Buysse et al., 1989) ).
iii) Sleep Diary (Espie, 1991)
iv) Stanford Sleepiness Scale (Hoddes et al., 1973)

126
iii. Psychopathology Measures
ii) Quick Inventory of Depressive Symptoms (Rush et al. 2003).
iii) Spielberg State-Trait Anxiety Inventory (Spielberger, 1970).
iv. Subjective Daytime Deficit Measure (See Appendix B)
i) Cognitive Failures Questionnaire ( Broadbent et al., 1982)).
v. Objective daytime Deficit Measures (See Appendix B)
i)The Switching Attention Task (SAT)- taken from the NeuroBehavioural Evaluation
System (NES)
ii) INTEG NEURO system – Participants will complete a standardised
neuropsychological assessment battery designed to assess all cognitive domains. None of
these tasks will be treated as dependant variables and will not relate to the analyses
within this current study.
3.6 Design
The study design is an independent samples design, with an experimental group of
participants with PI, and a control group of GS. Scores on the CFQ and SAT will act as
the dependant variables.
3.7 Procedure
Recruited participants will be contacted, via email or telephone, and asked if they would
like to take part in the current study. An appointment will be agreed with them to attend
the UGSC. They will be emailed/posted an information pack regarding the UGSC as
well as a sleep diary which they will be instructed to complete and bring with them to
the appointment.
On arrival at the UGSC participants will be provided with an information sheet
explaining that they will be required to complete six short questionnaires and a series of
psychomotor tasks and that if they are happy to proceed to provide written consent.
Participants will then be asked to complete the computerised tasks followed by the seven

127
questionnaires and then the clinical sleep interview. At the end of the interview
participants will be thanked and thoroughly debriefed as to the purpose of the
experiment and any questions they have will be answered.
3.8 Justification of Sample Size
The most recent study (Edinger et al., 2008) to have examined psychomotor task
performance in people with PI relative to good sleeper controls obtained an effect size of
0.85. In agreement with Cohen’s (1988) effects size conventions for means (d) such a
figure correspond to a large effect. The current investigation’s primary hypotheses
relates to between group differences. Based on the effect sizes demonstrated in the above
investigation, a suggested medium to large effect size of 0.6, related to effect size
conventions appropriate for a t-test on means (d), would therefore seem reasonable for
the proposed investigation. A series of power calculations were conducted using G *
Power 3 software program (Faul et al., 1997). Such calculations revealed an estimated
28 participants per group will be required to detect significant differences at an alpha
level of 0.05, with power of 0.8 (one tailed). Given that it is intended to use
demographically well matched samples and strictly differentiated PI and GS groups, it is
proposed that this sample size will be more than sufficient to detect differences if they
exist.
3.9 Settings and Equipment
i. Settings
Participants will be tested in the UGSC at the Sacker Institute of Psychobiological
Research at the Southern General Hospital, Glasgow.
ii. Equipment
The PMTs will be implemented using a standard laptop or desktop computer. Software
will be required to allow the investigator to programme and run these tasks.

128
3.10 Data Analysis
Data analysis will be conducted using SPSS. Data on all trials with errors will be
omitted. Initial descriptive statistics and visual inspections of all data will be performed
to examine statistical distributions and to check for assumptions of normality. Baseline
demographic and clinical characteristics of each group will be presented. If differences
appear to exist between groups these will be examined using independent t-tests or chi-
squared analyses.
Assuming data is parametric, comparison between the PI and GS group on the CFQ will
be made using an independent samples t-test. The SAT is made up of four sections, each
being treated as a dependent variable. As such, the comparison between groups on the
SAT will require calculations using a MANOVA. The nature and strength of the
relationship between scores on the CFQ and SAT, if indeed there is a relationship, will
be obtained using a correlation analysis.
4. Health and Safety Issues
i. Researcher Safety Issues
No issues regarding researcher safety are envisaged. Participants will be met within NHS
establishments and contact details of the principal investigator given to participants will
be created solely for the purpose of the study.
ii. Participant Safety Issues
No issues regarding participant safety are envisaged.
5. Ethical Issues
Ethical approval has already been granted for the participants recruited for the on going
study at the UGSC. Amendments will be made to the submitted protocol for the purpose
of this current study and will be resubmitted for ethical approval to recruit new
participants. Any participants identified as experiencing psychological distress or
physical illness will be provided with information booklets and signposted to services.

129
6. Financial Issues
i. Equipment Costs
The department possesses the required equipment and materials thus no financial costs
will be incurred.
ii. Travel
Participants’ travel costs and travel expenses of the principle investigator incurred for
the purpose the research project will be claimed from NHS Ayrshire and Arran.
7. Timetable
Ethical approval submission: August 2008
Recruitment and data collection: September 2008 - April 2009
Analysis and write up: May 2009 - July 2009
8. Practical Applications
Identification of the specific cognitive failures experienced by people with PI in
everyday living, and their relationship with objective tests of cognitive function, will aid
in our understanding of specific daytime consequences of poor sleep.

130
Appendix 3.2 Appendix 3.2
PARTICIPANT INFORMATION SHEET
COGNITION AND MOOD FACTORS IN THE ETIOLOGY OF PRIMARY AND SECONDARY INSOMNIA
INTRODUCTION You are invited to take part in a research study that is being carried out by the University of Glasgow. Before you decide, it is important for you to understand why the research is being carried out and what is involved. Please take some time to read the following carefully and discuss it with friends and relatives if you wish. Please ask if you would like more information or if there is anything that is not clear. WHAT IS THE PURPOSE OF THE STUDY? The purpose of this study is to explore the differences between primary insomnia and good sleepers The purpose is also to learn which of these types of assessments may demonstrate unique results for particular group of people. The person in charge of this study is Dr. Lauren Macphee, Trainee clinical Psychologist. WHY HAVE I BEEN CHOSEN? You are being asked to participate in this research study because you have: 1. no trouble sleeping at night (good sleeper) 2. persistent trouble sleeping at night (insomnia) with no current or prior symptoms of depression . DO I HAVE TO TAKE PART? It is entirely up to you whether you take part or not. If you decide to take part you will be given this information sheet to keep and asked to sign a consent form. If you decide to take part you are still free to withdraw at any time without giving a reason. A decision to withdraw at any time, or a decision not to take part will not affect the standard of care you receive. This form describes the known possible risks and benefits of the study. You are completely free to choose whether or not to participate in this study HOW LONG WUILL THE STUDY LAST?

131
This study will last about 3 hours and will involve 1 visit within that time frame. These visits will be to the University of Glasgow Sleep Centre at the Southern General Hospital. WHAT WILL HAPPEN IF I TAKE PART? Initial Evaluation-VISIT 1. At the start we need to check with you that you are likely to meet our requirements for the study. We call this an initial ‘screening’. Normally you will attend visit the Sleep centre for this, but we may also be able to make arrangements to complete some of this by telephone if that is more convenient for you. Screening will take about 45 minutes of your time. Full Evaluation-VISIT 2. At this visit you will complete some questionnaires about your attitudes, thoughts and feelings. You will also have an interview that will include questions about your psychiatric, medical and sleep history. These data will be used to establish in greater detail that you are eligible to participate in this study and as background information. If you are eligible, you will continue and have a physical examination. This examination will include obtaining blood samples (about 15 ml. which is about 3 teaspoons) and urine samples, which are used to make sure that you are in good health and assess for toxicology (look for illegal substances or alcohol), pregnancy, and abnormal blood chemistries. You will be screened for substances of abuse including alcohol. The exam will also include heart monitoring (a cardiograph). If you continue to qualify you will be shown some tasks to complete on a computer. These are simple to follow instructions and you will have the chance to practice with help from one of our staff. These tasks measure aspects of your attention and memory. This whole visit will last about 3 hours. After this visit you will be asked to complete two weeks worth of sleep diaries. 3. Sleep Diaries. If you qualify for the study and wish to continue with your participation, you will be asked to undergo a two-week evaluation period during which you will fill out daily sleep diaries. The sleep diaries are paper and pencil measures that you will complete immediately prior to going to bed and immediately upon awakening each day. The diaries require no more than 10 minutes per day to complete. At the end of the two weeks you will be asked to mail in the sleep diaries to the sleep centre using the provided stamped envelopes. 4. Screening Sleep Lab Study (polysomnography) - VISIT 3. If, following the diary assessment of your sleep, you continue to be eligible for the study, you will be scheduled for your first overnight polysomnographic study (PSG) at the sleep centre. You will be asked to arrive at the sleep lab by 7 PM. Upon arrival, to ensure accurate measurements, you will again be screened with a urine test. The procedure for a PSG requires that you have a set of sensors placed on your face, scalp, and body by a technician. All the sensors are attached with surgical

132
tape, paste and glue. The sensors on your face are attached on your left and right temple and check bone and under your nose. The sensors on the temple and check bone measure eye movements associated with falling asleep and dreaming. The sensors under your nose measure airflow through your mouth and nose. The sensors on your scalp measure brain waves during sleep. The sensors on the body are placed above the collarbones and over the calf muscles. The sensors over the collarbones measure heart muscle activity. The sensors over the calf muscles measure muscle activity from the legs. After you are ready for bed, you will be allowed to read or watch television until “lights out.” You will be expected to spend a total of 8 hours in bed (except for bathroom breaks). In the morning you will be awakened by the technician, fill out a set of brief questionnaires, be unhooked from the equipment, and then allowed to shower, dress, and eat breakfast that is provided for you before leaving to go about your day. 4. Sleep Lab Study - VISIT 4. After study staff have reviewed your screening PSG recordings, and it is determined that you continue to qualify for the study, you will come in for visit 4. This visit will occur the night following your screening PSG. Questionnaires relating to seep, general health, mental health and cognitive failures. 3 computer-administered tasks. This is expected to take up to 60 minutes. Once this is finished your participation with the study will end and you will be free to go about your day. WHAT WILL THE RESEARCHERS DO WITH THE INFORMATION? All of the information (data) from your assessments will help us in our research to find out more about mental factors and mood relate to sleep. We will keep most of the data in anonymised form. That is transferred to numbers and stored safely in a computer system that does not have your name on it. We do need to keep some personal information about you in written form, such as your address and contact details. This kind of information will be held in a locked cabinet in a locked room (like a medical file), and only the research team will have access to it. WHO WILL KNOW THAT I AM TAKING PART IN THE STUDY? We will treat your participation with strict confidence. We will however seek your
permission to let your GP know that you are participating, and if you have a mental
health professional working with you we would let him or her know also. This is in your
best interests. For example, although it may be unlikely, it is possible that a result from
one of your assessments has implications for your health or well-being. This could be to
133
do with your mental or physical health and we would let your GP know. Should such
concerns arise, we will make every effort to talk with you first, prior to reporting.
WHAT ARE THE RISK OF PARTICIPATION? Risks associated with the questionnaires. Answering some of the questions may make
you feel uncomfortable. You don’t have to answer any questions you don’t want to.
Well-trained staff conduct the interviews and are capable of dealing with such issues
should they arise.
ARE THERE ANY BENEFITS OF PARTICIPATION? There is no direct benefit to you expected from participating in this study; however, you will receive an extensive evaluation of your sleep/sleep disorder at no cost to you. We hope the information learned from this study will benefit patients experiencing insomnia. We also plan to provide those with insomnia who participate with a brief, non-drug treatment at the end of the study. This uses a treatment known as cognitive behaviour therapy (CBT)
ARE THERE ANY COSTS?
There is no cost to you to participate in this research study.
WHAT ARE THE CIRCUMSTANCES FOR LEAVING THE STUDY?
As we have said, you may discontinue participation from the study at any time if you decide you do not wish to take part any longer.
WHO IS FUNDING BTHIS RESEARCH?
The University of Glasgow Sleep Centre is being funded by the National Institute of
Mental Health (in the USA) to conduct this study. The study is sponsored by NHS
Greater Glasgow and Clyde.
WHO ARE MY BEST CONTACTS?
For more information concerning this research study or for questions regarding
research-related risks or injuries as well as any side effects you might experience

134
from participation in this study, you may contact Professor Colin Espie, Director
of the University of Glasgow Sleep Centre, or Dr Lauren Macphee (0141-232-
7696).
If you wish to speak with an impartial staff member to discuss your concerns about participation, you may contact r the responsible NHS Research Manager, Mr. Brian Rae (0141-232-9523). Their role with this project is strictly to be available as impartial contacts.
The full address of the sleep centre is: University of Glasgow Sleep Centre,
Sackler Institute of Psychobiological Research, Southern General Hospital,
Glasgow G51 4TF